Article

Modeling and Research on the Defects of Pressed Rigging in a Geomagnetic Field Based on Finite Element Simulation

1
State Key Laboratory of Metal Material for Marine Equipment and Application, Anshan 114051, China
2
School of Materials and Metallurgy, University of Science and Technology Liaoning, Anshan 114051, China
3
School of Mechanical, Materials, Mechatronic and Biomedical Engineering, University of Wollongong, Wollongong, NSW 2522, Australia
*
Authors to whom correspondence should be addressed.
Metals 2024, 14(7), 811; https://doi.org/10.3390/met14070811
Submission received: 5 June 2024 / Revised: 3 July 2024 / Accepted: 8 July 2024 / Published: 12 July 2024
(This article belongs to the Special Issue Modeling Thermodynamic Systems and Optimizing Metallurgical Processes)

Abstract

:
It is very important to carry out effective safety inspections on suppression rigging because of the bad service environment of suppression rigging: marine environments. In this paper, the multi-parameter simulation method in ANSYS and ANSYS Electronics Suite simulation software is used to simulate the effect of geomagnetic fields on the magnetic induction intensity of defective pressed rigging under the variable stress in marine environments. The results of the ANSYS simulation and geomagnetic flaw detection equipment are verified. The simulation results show that, according to the multi-parameter simulation results of ANSYS and ANSYS Electronics Suite simulation software, it can be found that, under the action of transverse force, the internal stress of the pressed rigging will affect the magnetic field around pressed rigging with defects. With an increase in internal stress in the range of 0~20 MPa, the magnetic induction intensity increases to 0.55 A/m, and with an increase in internal stress in the range of 20~150 MPa, the magnetic induction intensity decreases to 0.06 A/m. From the use of a force magnetic coupling analysis method, it can be obtained, under the lateral force of the defects in suppressing rigging, that magnetic flux leakage signals decrease with an increase in the rigging’s radial distance. The experiment results show that the difference between the peak and trough of the magnetic induction intensity at the pressed rigging defect calculated by the ANSYS simulation is very consistent with the results measured by the geomagnetic flaw detection equipment.

1. Introduction

The main pressed riggings used in marine engineering include mooring wire ropes, pipelay vessel wire ropes, lifting operation wire ropes, riser tensioner wire ropes, and drilling wire ropes. These pressed riggings must withstand various challenges in the marine environment, including temperature fluctuations, high pressure, high humidity, corrosion from chlorides and microorganisms, and external forces such as sea wind, waves, and currents. These environmental factors cause the pressed rigging to endure constantly changing stresses, leading to fatigue, while repeated winding under heavy loads accelerates wear [1]. Additionally, pressed rigging often exhibits phenomena such as broken wires, broken strands, rust, and fatigue, which reduce its service life, thereby decreasing its load-bearing capacity and reliability, increasing safety risks. Therefore, detecting defects in pressed rigging and making timely repairs before damage occurs can reduce the likelihood of accidental damage. Thus, conducting effective safety inspections on pressed rigging is crucial.
Currently, the methods for detecting defects in pressed rigging include solid acoustic testing, optical methods, electromagnetic testing, X-ray methods, magnetostrictive testing, eddy current testing, current methods, and vibration testing [2]. Among these, electromagnetic testing is the most commonly used method for wire rope inspection, as it is suitable for detecting wire ropes under various complex environmental conditions and capable of rapid detection over a large range. Specific electromagnetic testing methods include magnetic flux leakage testing [3], the magnetic bridge method [4], multi-loop excitation testing, and the principal magnetic flux method [5].
When the transverse force and the geomagnetic field act together, the internal magnetic domain structure of compacted rigging will clearly change in its stressed and fractured region [6,7]. Magnetic domains are small regions in a material that are spontaneously magnetized. Under the combined action of external forces and a geomagnetic field, these magnetic domains will be rearranged, resulting in changes in the leakage magnetic field in the stress concentration area. When the compression rigging is subjected to a transverse force, the magnetic domain in the stress concentration area will change locally. Since the domain reorientation in these regions is irreversible, the alignment of these domains remains unchanged even after the working load is eliminated. This irreversible magnetic domain change causes the stress concentration area to exhibit different magnetic properties from the surrounding material in the external magnetic field, resulting in a leakage magnetic field. Therefore, compression rigging can be measured and analyzed using its leakage magnetic field [8,9].
Magnetic flux leakage (MFL) detection technology is based on this principle. By measuring the leakage magnetic field on the surface of pressed rigging, defects and stress concentration areas inside the material can be effectively identified. When the magnetic detection device moves on the surface of pressed rigging, the sensor in the device can capture the change in the leakage magnetic field signal [10,11]. Because the magnetic domain reorientation at the defect leads to an abnormal leakage magnetic field, these abnormal signals can be recorded and analyzed to accurately locate the defect.
In recent years, significant progress has been made in the research on electromagnetic testing methods for pressed riggings. For example, G.Y Li et al., based on the basic principles of electromagnetic testing, conducted in-depth studies on cross-sectional area damage detection methods and found that the width of the air gap is an important factor affecting the accuracy of electromagnetic testing [12]. Y.F Ding et al. magnetized wire ropes with different defects to a saturated state, simulating the relationship of magnetic induction intensity changes in wire ropes with different defects, and found that the greater the distance of the broken wires, the larger the change in magnetic induction intensity [13]. J.W Zhang et al., based on the principle of magnetic flux leakage testing, developed three-dimensional magnetic flux leakage color imaging technology, significantly improving detection efficiency [14]. Q.H Chen et al. conducted in-depth studies on the magnetic memory signals on the surface of wire ropes under the influence of a weak magnetic field and found that a weak magnetic field has a significant impact on the magnetic memory signals of metal [15]. M. Zhao et al. conducted finite element simulations of the magnetic flux leakage fields of typical defects in wire ropes [16]. Their results indicated that the width of the defects has a minor effect on the peak value of the magnetic flux leakage signal, whereas the deeper the defect, the greater the impact on the peak value of the magnetic flux leakage signal. The above research involves the study of the magnetic induction intensity relationship of steel wire rope using magnetic aggregation devices, but it does not investigate the magnetic induction intensity relationship of defect compression rigging with stress under the action of a geomagnetic field.
W.Z Du et al. established a three-dimensional geometric model of 1 × 7 + IWS wire rope using SolidWorks, conducted a stress analysis on it, and obtained the conclusion that, with the increase in the number of broken wires, the stress of the wire rope increases sharply, and the stress distribution is concentrated on the remaining unbroken wires [17]. Y.P Chen et al. established a three-dimensional finite element model of 1 × 7 steel wire rope using parametric equations and ANSYS and finally concluded that the discontinuous contact line of spiral triangle-stranded wire led to an uneven distribution of stress and significant contact pressure [18]. X.Y Chen et al. established a three-dimensional geometric model of 1 × 7 steel wire rope using differential geometry theory. By simulating the stress and strain conditions of steel wire rope under axial loading, they finally concluded that the friction coefficient μ is one of the main factors affecting the life of steel wire rope [19]. The research of the above scholars is concerned with the simple three-dimensional modeling of 1 × 7 steel wire rope, but it does not explain the detection methods used on steel wire rope and only studies the influence of working load on steel wire ropes.
In this paper, based on a current defect analysis and the detection of pressed rigging, which requires an excitation device to detect that creates a state of magnetization and saturation, ANSYS and ANSYS Electronics Suite simulation software are used to apply the analysis method of geomagnetic detection to simulate pressed rigging in service environments. Under the action of a geomagnetic field, the distribution law of transverse force on the magnetic induction strength of defective rigging is studied. By simulating the relationship between the internal stress and magnetic induction intensity of pressed rigging under the action of a geomagnetic field, we can observe the change in the magnetic leakage signal around pressed rigging with defects.

2. Finite Element Simulation of Force–Magnetic Coupling Based on a Geomagnetic Field

2.1. Software Overview

This study primarily uses the ANSYS Workbench platform from the ANSYS software suite and the Maxwell module from the ANSYS Electronics Suite. The ANSYS Workbench platform is a comprehensive engineering simulation software developed by the American engineering simulation software company ANSYS. This platform utilizes an integrated simulation solution, encompassing the simulation capabilities of various physical fields, including structural, fluid, thermal conduction, and electromagnetic fields. Compared to other simulation software, ANSYS Workbench adopts a modular design, allowing users to select different modules based on the specific needs of their simulation analysis, thereby meeting various application scenarios. Additionally, ANSYS Workbench offers extensive customization and extensibility features, allowing for custom development and expansion to achieve more advanced simulation analyses.
This paper also uses the Maxwell module, which is a key module in the ANSYS electromagnetic field simulation tool suite. A wide range of functions and tools are provided by Maxwell to solve electromagnetic field problems. Consequently, the Maxwell module can be utilized to analyze magnetic field characteristics. Additionally, Maxwell’s ability to couple with other ANSYS modules supports multi-physics coupling simulation analyses.

2.2. Finite Element Simulation Process

The finite element simulation in this study uses SolidWorks for modeling and utilizes the static analysis module in the ANSYS Workbench platform and the Maxwell module in the ANSYS Electronics Suite for simulation. First, three-dimensional modeling is carried out, setting the relevant parameters, including the overall length of the pressed rigging and its diameter, strand pitch, and wire pitch. Then, the model is imported into the Static Structural module, where its material properties are defined and mesh generation is performed. A static analysis is conducted to obtain the equivalent stress of the pressed rigging through solving. The equivalent stress is then input into the relevant relationship equation to calculate its effect on magnetic permeability, yielding the H-σ curve. Finally, the H-σ curve is imported into the material properties, and an air domain and geomagnetic field are established in the Maxwell module. A static magnetic analysis is performed on the pressed rigging to obtain the force–magnetic coupling analysis results [20,21,22]. The specific process is shown in Figure 1.

2.3. Drawing of Three-Dimensional Pressed Rigging Model

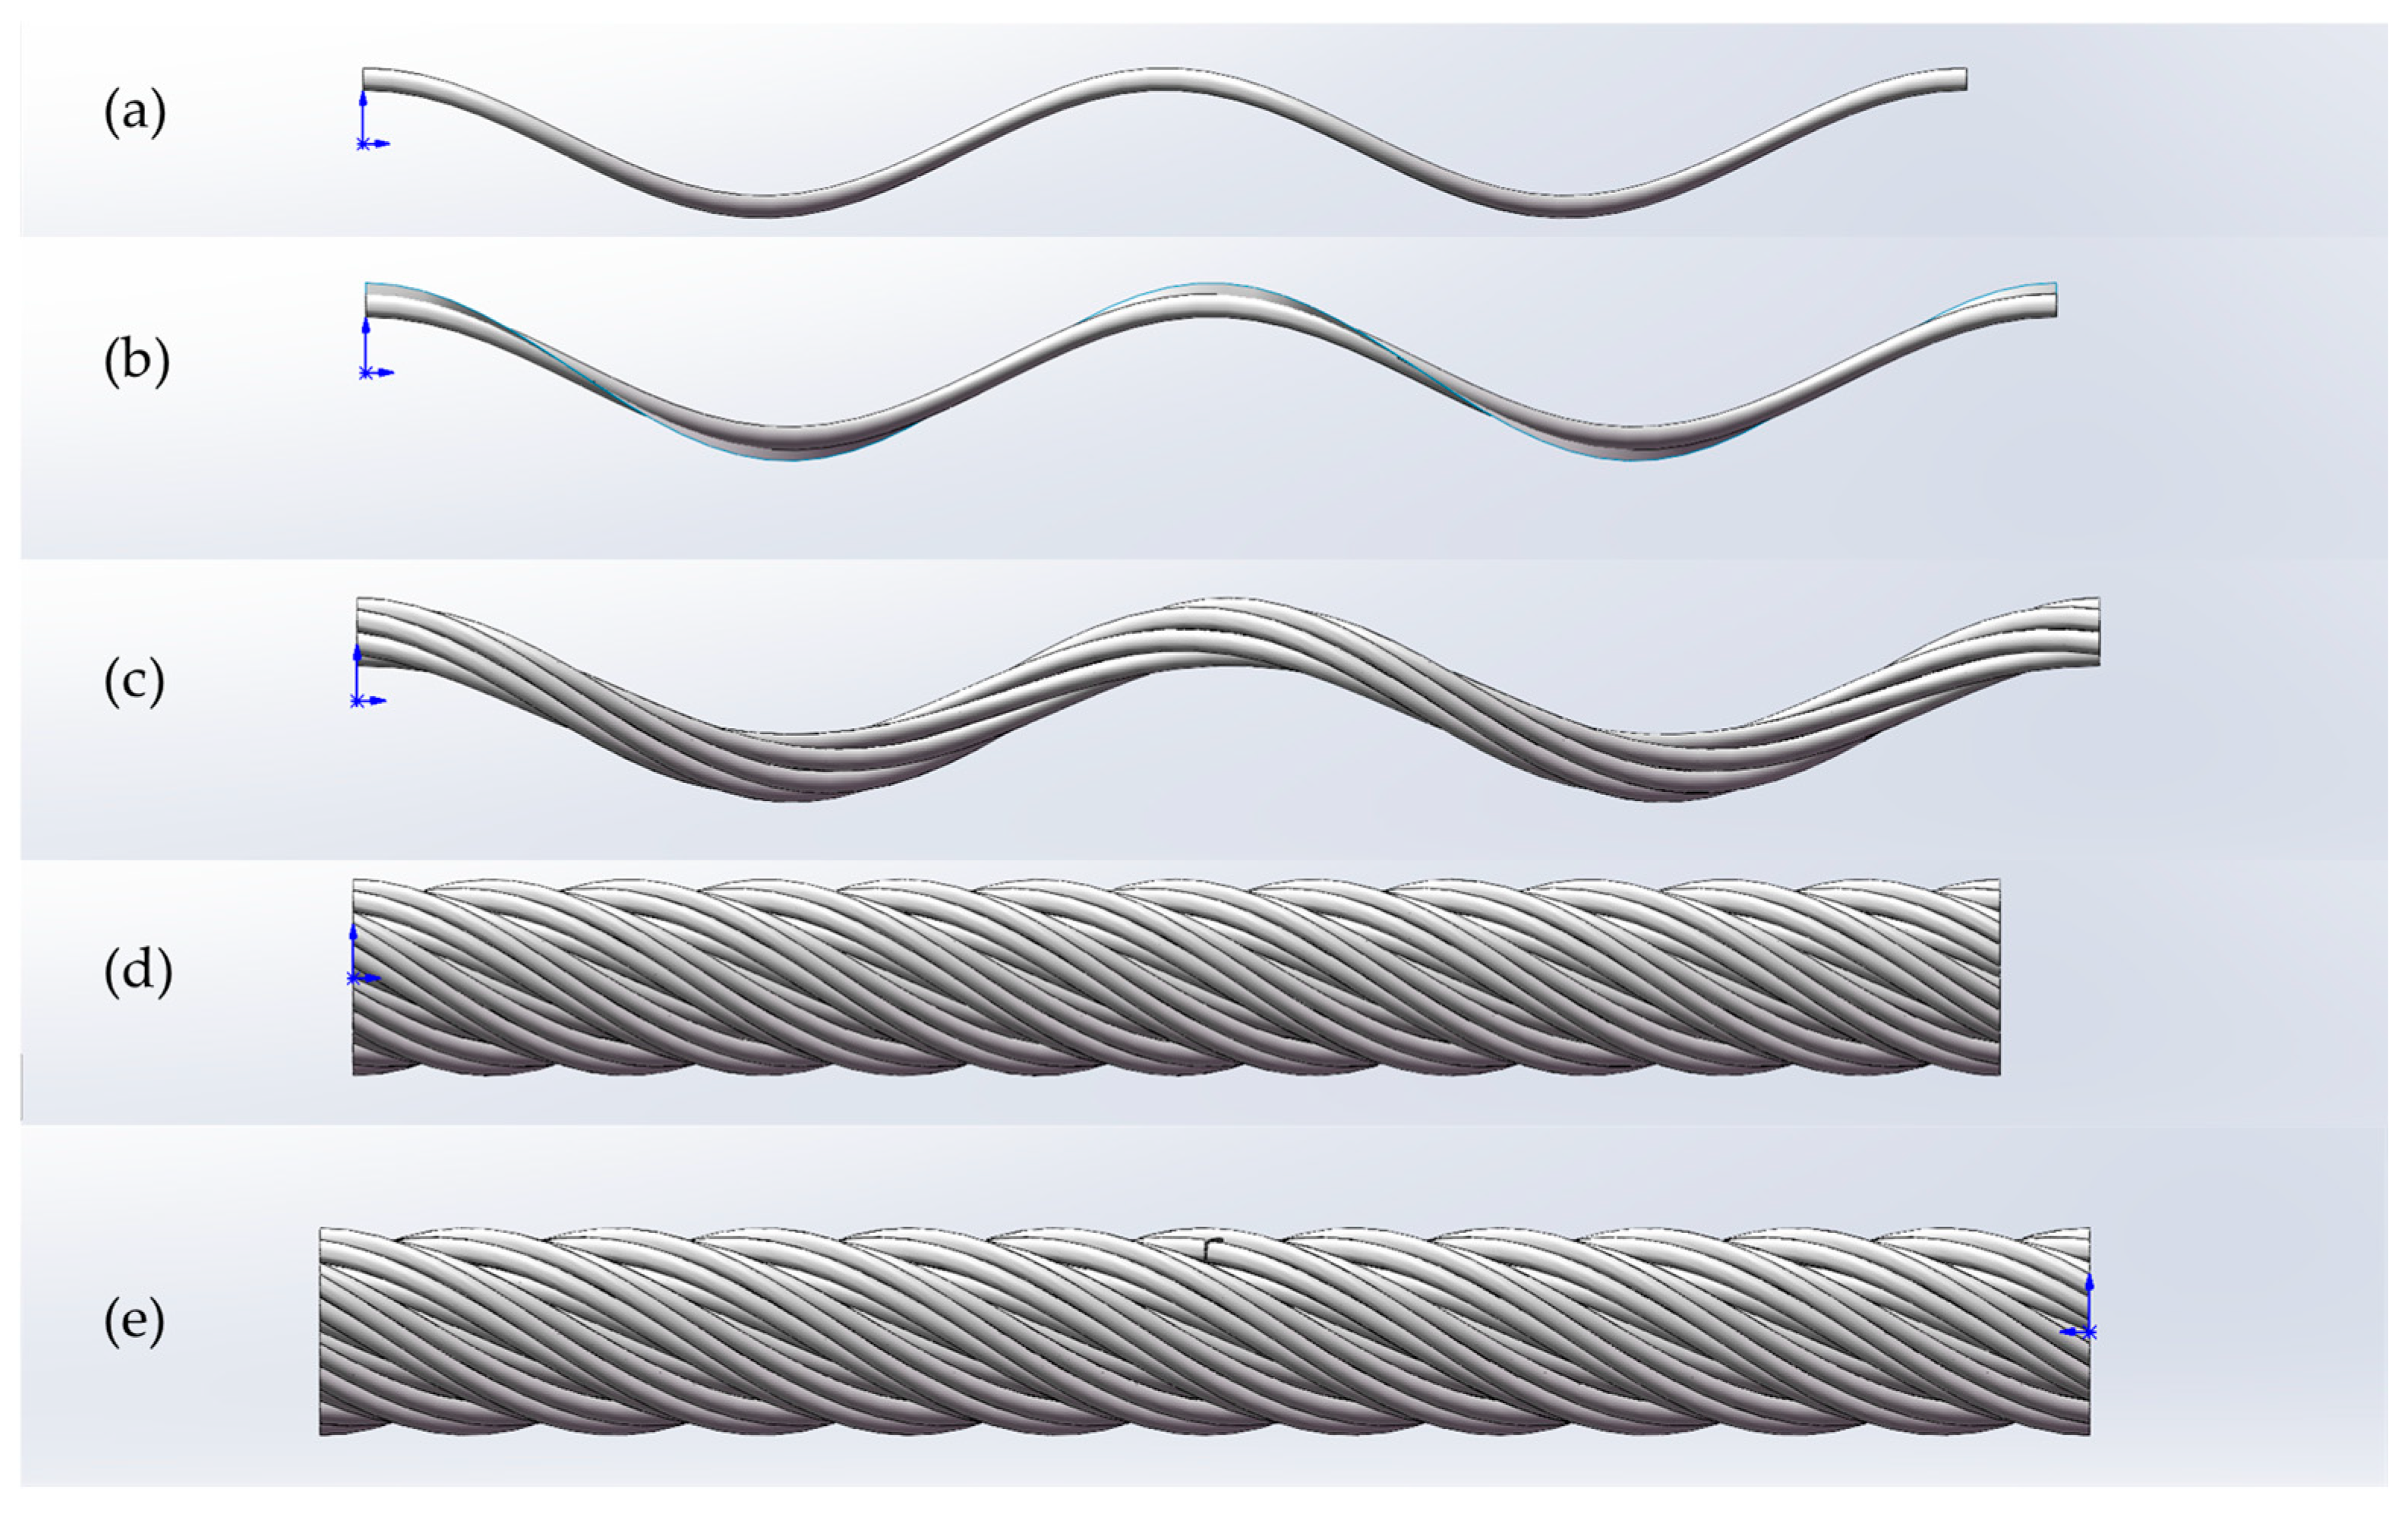
In this simulation, a model of 6 × 34 + FC pressing rigging is adopted. Because this compression rigging is composed of 6 × 34 strands of steel wire rope, each compression rigging is composed of 6 strands of twisted steel wire rope, and each steel wire rope is composed of 34 thinner twisted steel wires. FC is the fiber core, the specific structure of each steel wire rope is composed of 12 thicker steel wire ropes outside, with the middle composed of 22 thinner steel wire ropes. The finite element simulation of this type of pressing rigging is carried out, and the calculation time of the simulation is about 168 h. As this paper simulates the breakage of 1–2 of the 12 strands of the outer steel wire rope, the permeability of the remaining intact steel wire rope does not change, which can be simplified. The 22 strands of fine steel wire rope in the middle are simplified into 1 strand, and the 12 strands of thicker steel wire rope are simplified into 6 strands, of which 1 strand is broken, and thus the final simplified model is 6 × 7 strands of steel wire rope. The calculation time of this simulation is 22 h, so the calculation time of 146 h can be shortened and the calculation efficiency can be improved by using the simplified model. SolidWorks software was used to draw a steel wire rope [23] with a structure of 6 × 7 and a left and same lay method, with a total length of 500 mm, a diameter of 46.5 mm for the pressed rigging, a diameter of 6.5 mm for all the strands, a lay length of 250 mm for the strands, and a lay length of 250 mm for the strands. The drawing step is shown in Figure 2, and the drawing process mainly uses the “scan” command.
Firstly, a helix with a pitch of 250 mm and a diameter of 40 mm is drawn. Then, this helix is swept to create a strand with a diameter of 6.5 mm and a length of 500 mm, as illustrated in Figure 2a. Next, we performed a surface sweep on the strand to achieve a surface width of 6.5 mm, as shown in Figure 2b. We drew a circle with a diameter of 6.5 mm on the other side of the surface and created a circular pattern around the cross-section of the strand, with 6 repetitions. We swept the sketch along the edge of the surface to generate a strand of pressed rigging, as shown in Figure 2c, and hid the sweep surface. Finally, we performed a circular pattern on this strand of pressed rigging to obtain a complete pressed rigging, as shown in Figure 2d. One wire in the middle of the pressed rigging was then selected and cut to create a defect with a surface length of 5 mm in the pressed rigging, as shown in Figure 2e [24].

2.4. Static Structural Analysis

The overall geometric model of the pressed rigging was imported into the Static Structural module in Workbench to conduct a stress analysis on the pressed rigging.

2.4.1. Material Composition and Properties

Q345 steel was used in this simulation [25]. Its specific performance parameters are shown in Table 1 [19,26].
The pressure rigging is affected by its transverse load, lubrication condition, and corrosion during service, and the friction coefficient μ is 0.6 [27].

2.4.2. Division of Element Mesh

The wires of the pressed rigging are meshed using three-dimensional 4-node solid elements (SOLID45). Due to the variation in cross-sectional size along the length direction of the defective pressed rigging, the portion containing the defect is meshed using a free tetrahedral division method for the pressed rigging. Considering the contact between the strands of steel wire, the cell mesh needs to be finely divided to ensure the accuracy of the calculation results [28]. The partitioned finite element model is shown in Figure 3, with a total of 10,652 elements and 39,662 nodes generated for the entire model.

2.4.3. Model Boundary Conditions and Loading Method

During the loading process of the pressed rigging, boundary conditions and load magnitudes are set to constrain all displacement degrees of freedom at both ends of the pressed rigging [29]. The pressed rigging is subjected to various types of loads during its use [30], such as tension, bending, friction, vibration, and impact. These loads result in interaction forces between the wires inside the pressed rigging, thereby causing stress in the pressed rigging. To better simulate the impact force acting on the pressed rigging, a horizontal force perpendicular to the axis of the pressed rigging is applied at the center of the pressed rigging, with the impact force set to 20,000 N. For wires that have fractured, their stress is relatively small, calculated at 10% of the normal operating force, thus the force on them is set to 2000 N.

2.5. Simulation of Geomagnetic Field

2.5.1. Geomagnetic Field Configuration

ANSYS software cannot directly calculate the variation in the magnetic induction intensity of the pressed rigging due to changes in internal stress. Therefore, an indirect coupling method is adopted, where the changes in the physical properties of ferromagnetic materials from static structural simulation results are imported into the static magnetic field for analysis. Firstly, material settings are conducted, the pressed rigging model is imported, its material properties are configured, and the parameters are applied to the material properties. Additionally, material properties are assigned to the broken pressed rigging, the material is duplicated, and the H-σ stress curve is imported, resulting in the completion of the pressed rigging model’s configuration. Next, a uniform magnetic field is employed to simulate the effect of the geomagnetic field, the geomagnetic field is meshed, and the meshing results of the Static Structural modules are imported into Maxwell. The air domain is automatically divided, and the mesh accuracy is adjusted to moderate. Finally, the intensity of the geomagnetic field is configured. Given that the intensity of the geomagnetic field is between 30 and 60 nT, the tangential component is set to 30 nT, with its direction along the x-axis, to simulate the effect of the geomagnetic field and conduct an analysis [31].

2.5.2. Simulation Calculation of Pressed Rigging Force–Magnetic Coupling

According to the Jiles-Atherton theory [32,33,34], the stress–magnetization differential equation under a uniaxial stress state is determined as follows [35]:
d M d H = μ 0 k δ M a n M c 1 c d M a n d H μ 0 k δ M a n M α + 3 σ μ 0 γ 1 0 + γ 1 0 σ + 6 γ 2 0 + γ 2 0 σ M 2 1 1 c
From the point of view of the calculation, H is the external magnetic field strength, M is the magnetization intensity, μ 0 is the vacuum permeability, M a n is the non-hysteretic magnetization when assuming that there is no pinning effect inside the crystal and the magnetic domain wall can move freely in the crystal, c is the irreversible coefficient and is a fixed constant in the model calculations, and σ is the stress on the ferromagnetic material. γ 1 ( 0 ) , γ 1 ( 0 ) , γ 2 ( 0 ) ,   and   γ 2 ( 0 )   are fixed constants.
Considering that, under stress conditions, the pinning coefficient k, shape factor a, and domain wall coupling coefficient α in the ferromagnetic material model will change with the variation of elastic and plastic stress, it is necessary to determine the relevant parameters [36]. Tensile stress reduces pinning density and compressive stress increases pinning density, while dislocations hinder domain wall motion in a pinning manner. Therefore, the relationship between the pinning coefficient k, shape factor a, stress, and dislocation density can be expressed as
k = G 1 + G 2 d 0 ζ d 1 2 k 0 3 2 η 0 λ w s σ
a = G 3 + G 4 d 0 ζ d 1 2 a 0
where G 1 + G 2 / d 0 ξ d 1 / 2 k 0 represents the change in plastic deformation with the pinning coefficient k and 3 / 2 η 0 λ w s σ represents the change in elastic stress with the pinning coefficient k. k 0 is the initial pinning coefficient; G 1 , G 2 , G 3 ,   and   G 4 are fitting constants. Generally, G 1 = G 3   and   G 2 = G 4 are the initial shape coefficients. d 0 is the grain size of the material. As the dislocation density within the material does not change during its elastic phase, the parameters satisfy the relationship shown in Equation (3).
G 1   + G 2 d 0 ζ d 1 2 = 1 G 3 + G 4 d 0 ζ d 1 2 = 1
As the stress–strain alters the shape and size of the magnetic domains, the domain wall coupling coefficient α varies with the increase in stress–strain.
α   = α 0 + q 1 l n q 2 ε r + q 3 + 21 4 E s μ 0 λ w s e x p 1 2 σ σ 0 2 / M s 2
where α is the domain wall coupling coefficient, α 0 is the initial domain wall coupling coefficient, and q 1 l n q 2 ϵ r + q 3 is the change in α due to plastic deformation. 21 4 E s μ 0 λ w s e x p 1 2 σ σ 0 2 / M s 2 indicates that the elastic stress changes to the α , while q 1 , q 2 ,   and   q 3 are fitting constants.
By combining the above theoretical model with Formula (1), an equation describing the variation of the magnetization intensity of a material with elastic stress and plastic strain can be obtained. This equation can be used for detecting weak magnetic signals under uniaxial stress conditions.
The parameters used in the above model are shown in Table 2.
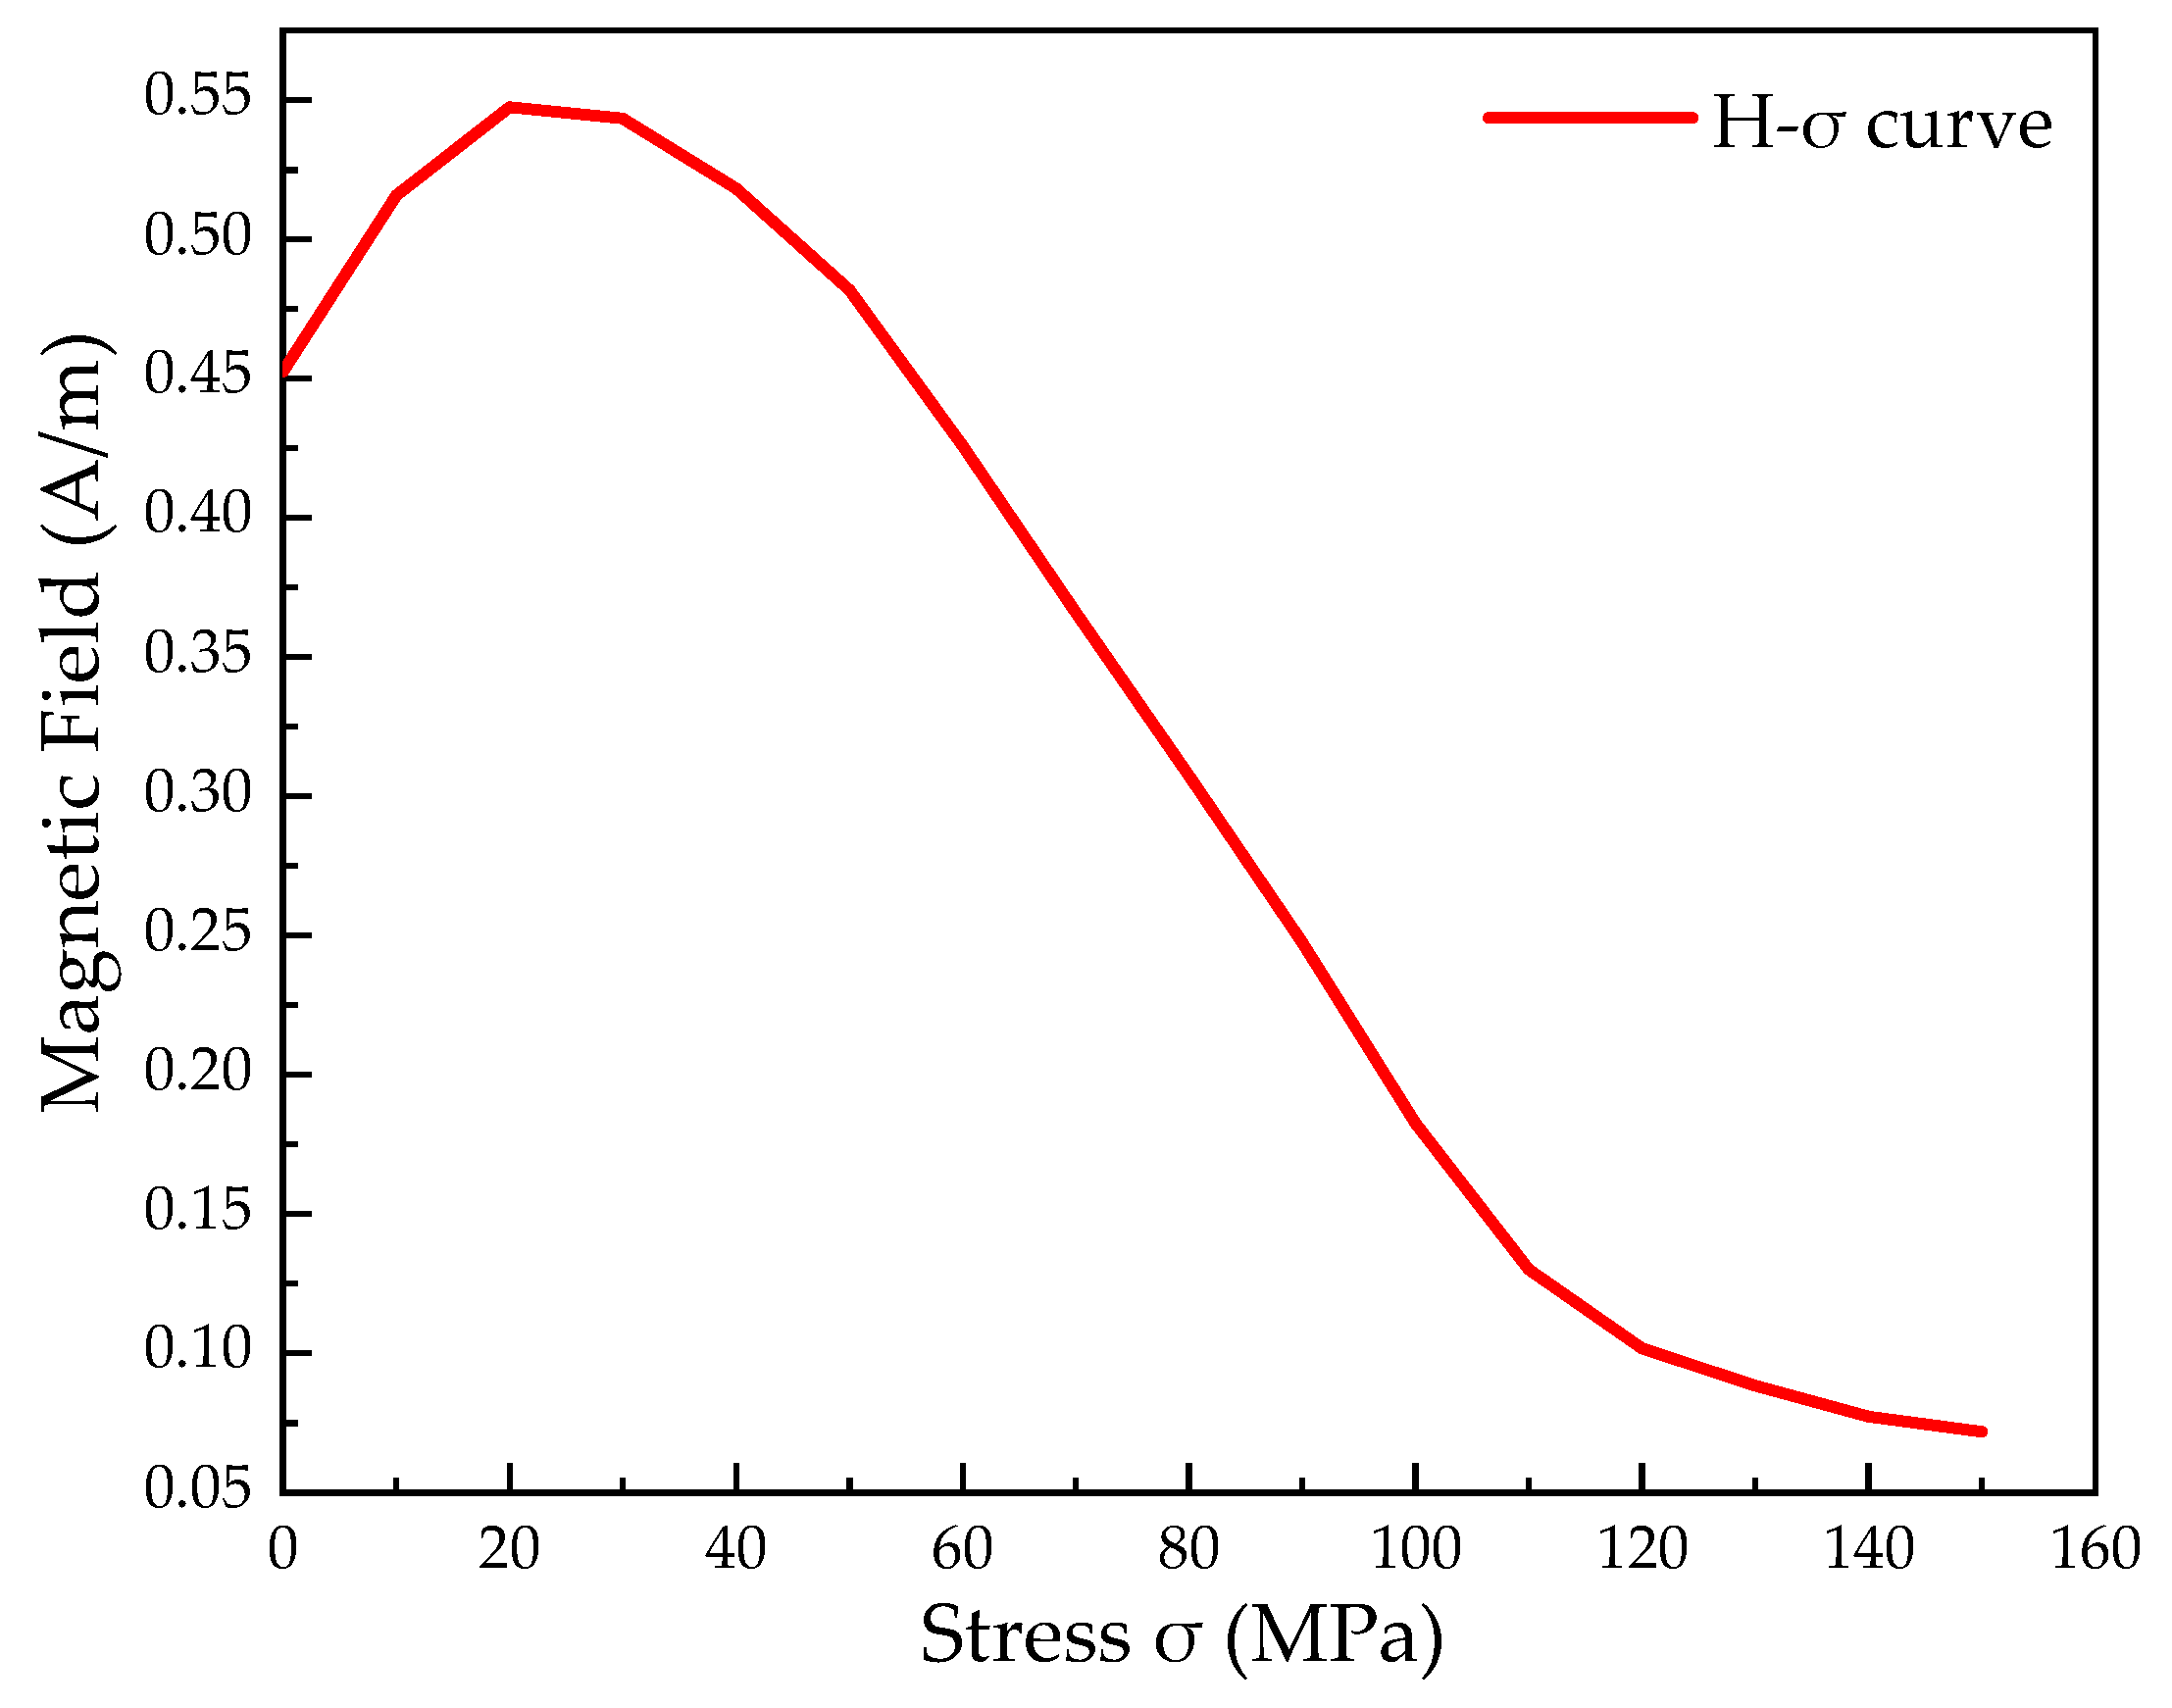
Finally, the H-σ stress curve is drawn. The H-σ stress curve indicates that the stress generated by pressing the rigging under the action of a transverse force will change the magnetic field around the pressing rigging. With the gradual increase in the generated stress, the magnetic field will increase and then decrease, as shown in Figure 4. Under the stress condition of 20 MPa, the magnetic field has the greatest influence and then, with the further increase in stress, the magnetic field will gradually decrease.

3. Finite Element Analysis Results

3.1. Static Analysis Results

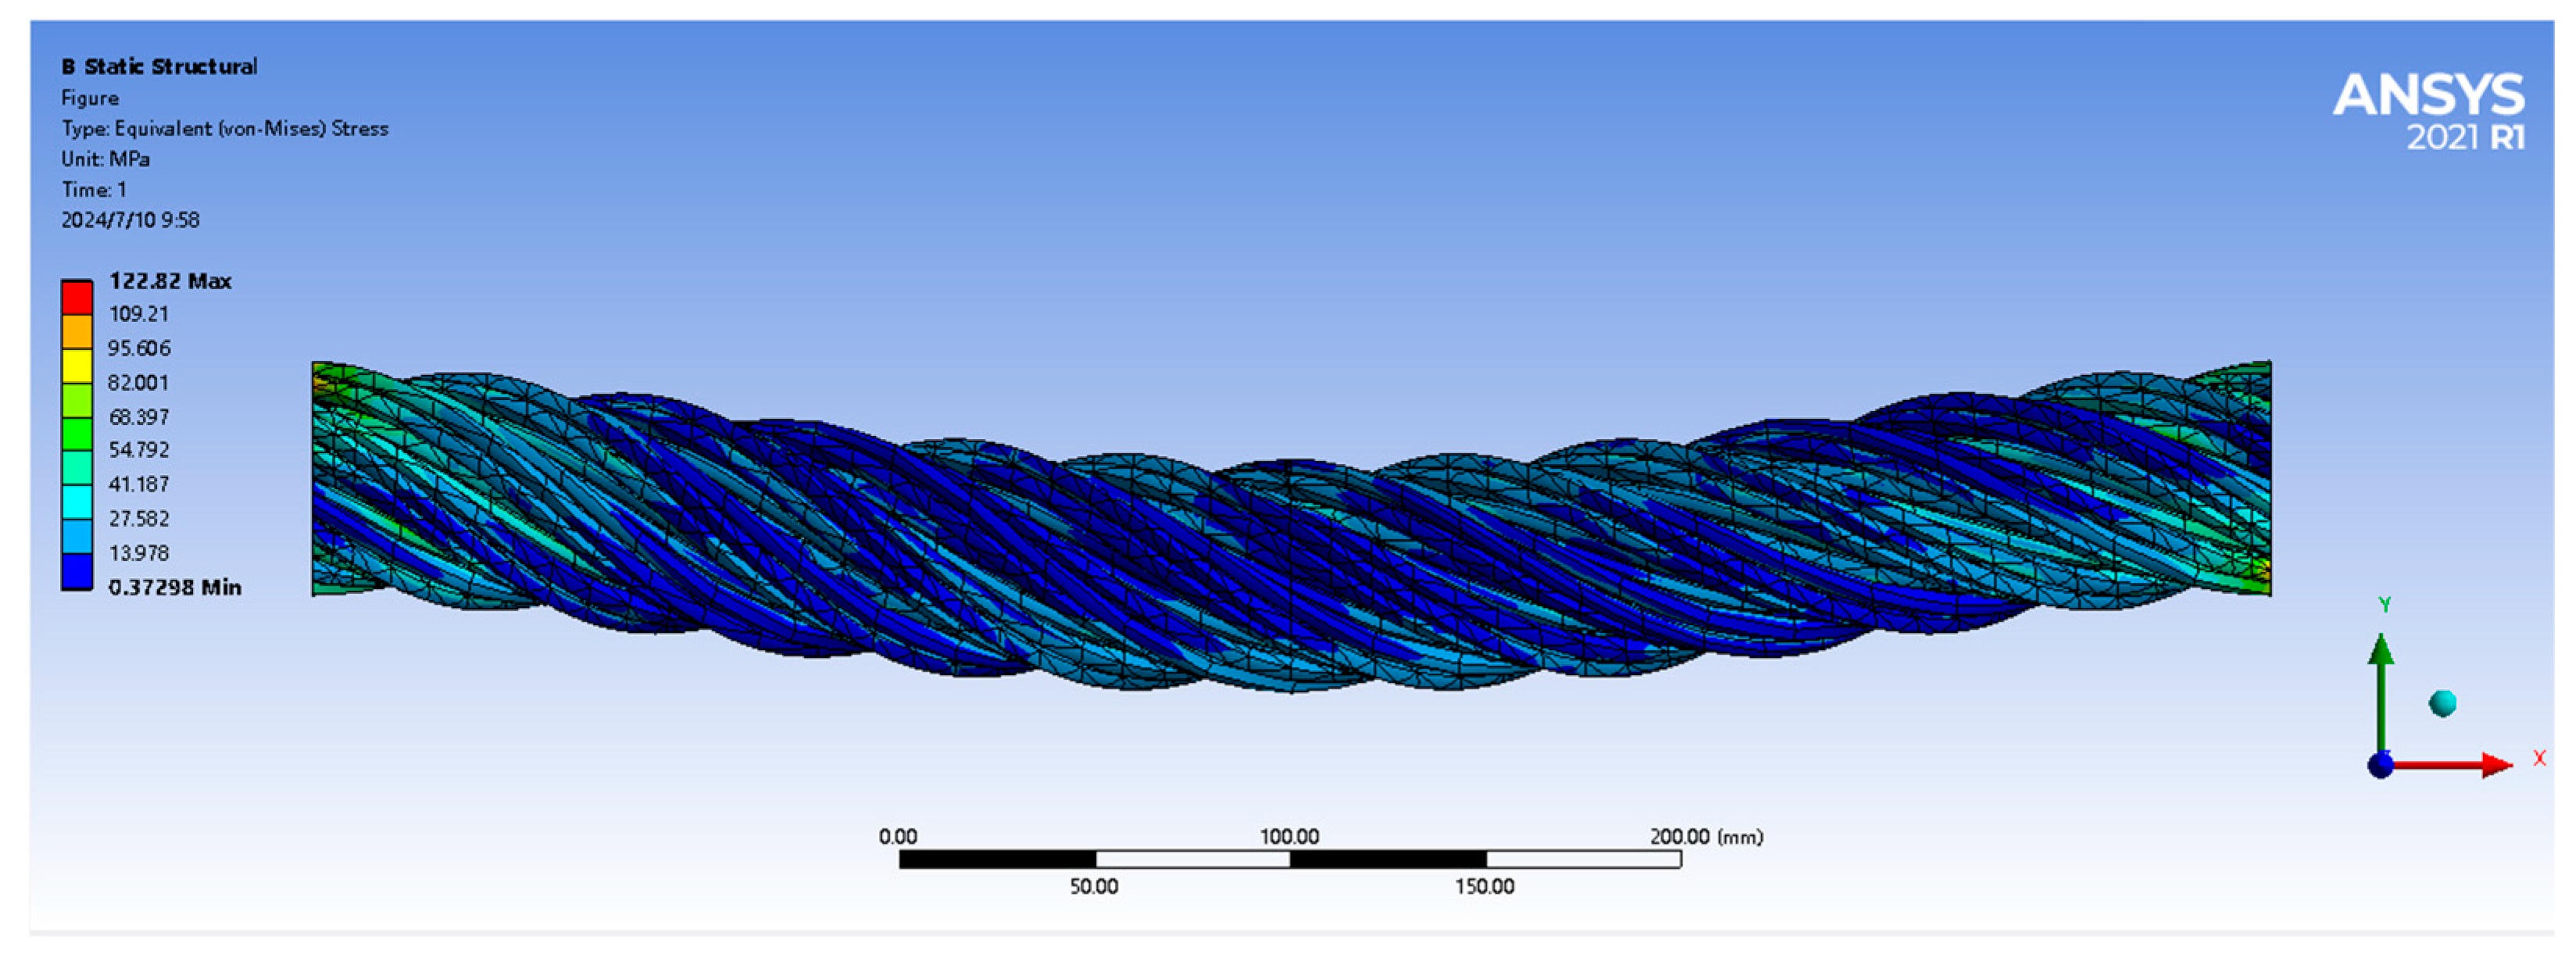
In the static analysis, displacement constraints were applied at both ends of the pressed rigging, and a tensile load of 2000 N was applied in the negative direction, along the y-axis, at the middle. The maximum equivalent stress was calculated to be 122 MPa. The maximum stress amplitude occurs on both sides of the pressed rigging, with the maximum stress region on the left side being greater than that on the right side, and the minimum stress region in the middle, as shown in Figure 5.

3.2. Geomagnetic Simulation Analysis Results

Substituting the peak stress value σ = 122 MPa into the aforementioned H-σ stress curve yields a magnetic field of 0.1 A/m. The magnetic field is then introduced into the geomagnetic field for further analysis.
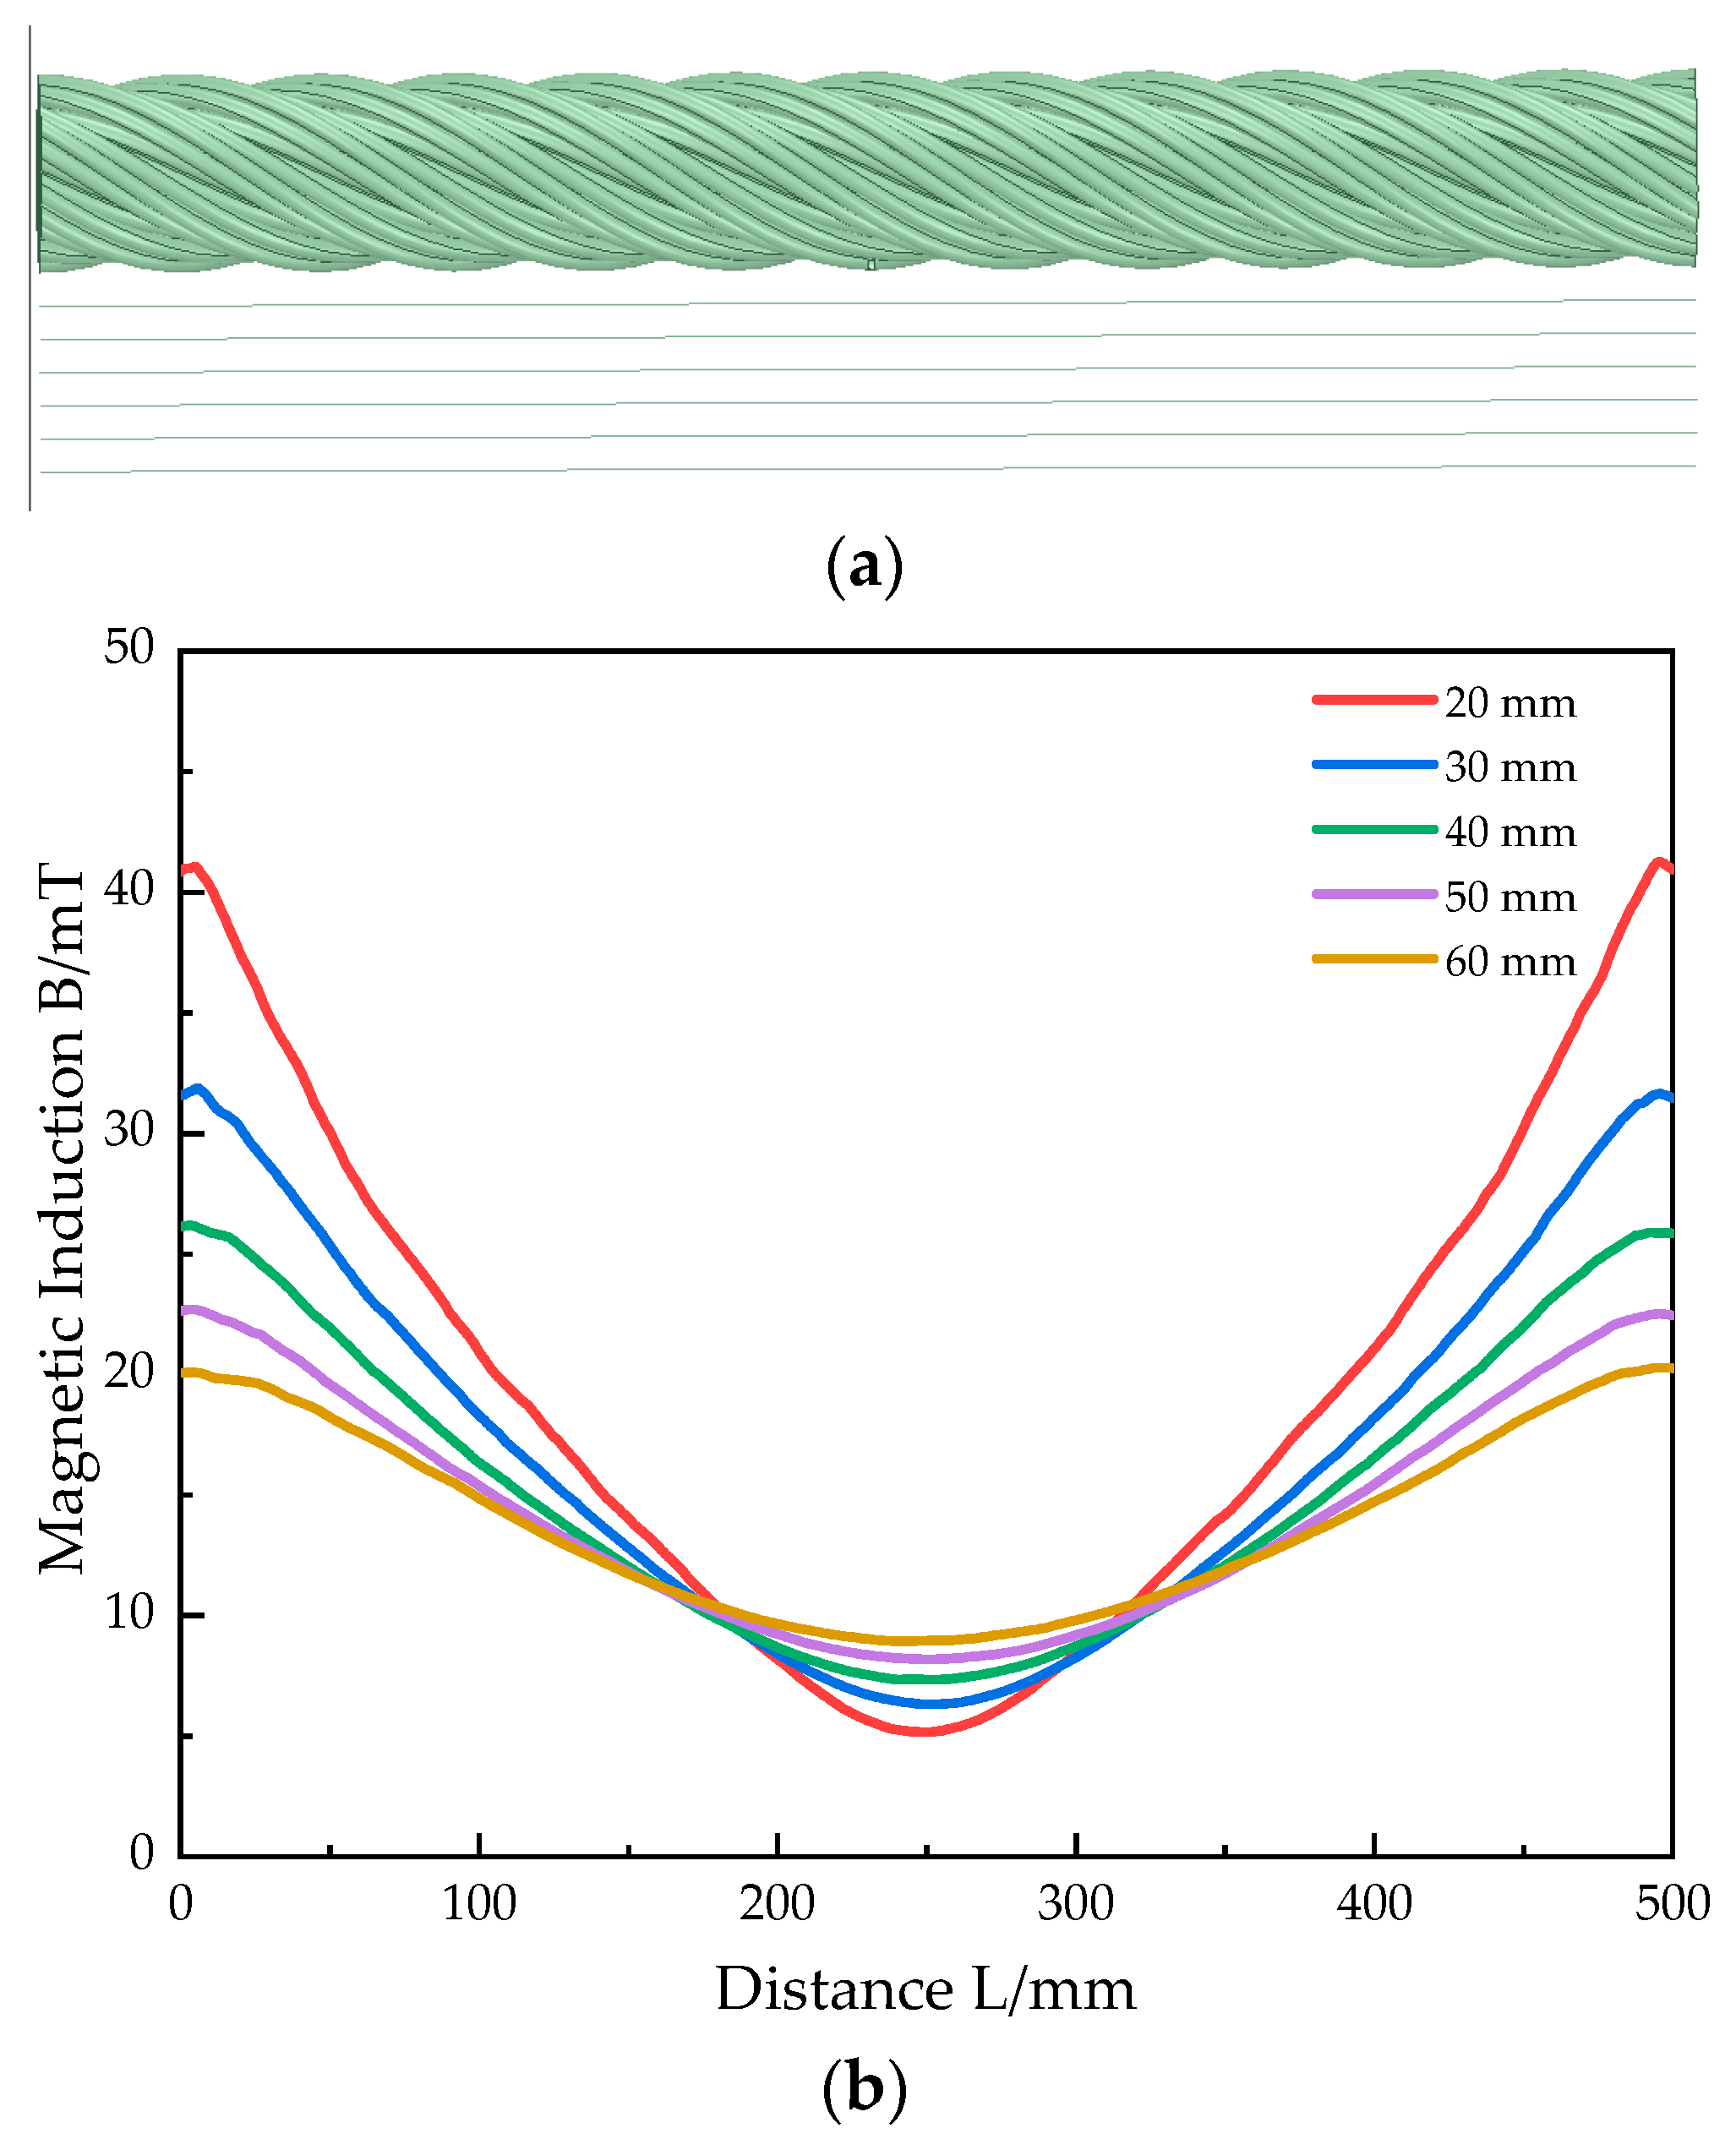
In the simulation, a parallel magnetic field was set up to simulate the geomagnetic field, applying a 2000 N tensile force to the middle of the pressed rigging and extracting magnetic field signals at 20 mm, 30 mm, 40 mm, 50 mm, and 60 mm above the defect, as shown in Figure 6a. The simulation results are shown in Figure 6b. Observing the results, it was found that the closer the distance to the radial direction of the pressed rigging, the greater the influence of the pressed rigging on the magnetic field strength. As the radial distance from the pressed rigging increases, the force’s influence on the magnetic field strength decreases, gradually approaching the strength of the geomagnetic field. This indicates that the simulation results conform to actual patterns, suggesting that shorter radial distances to the pressed rigging can enhance detection accuracy.
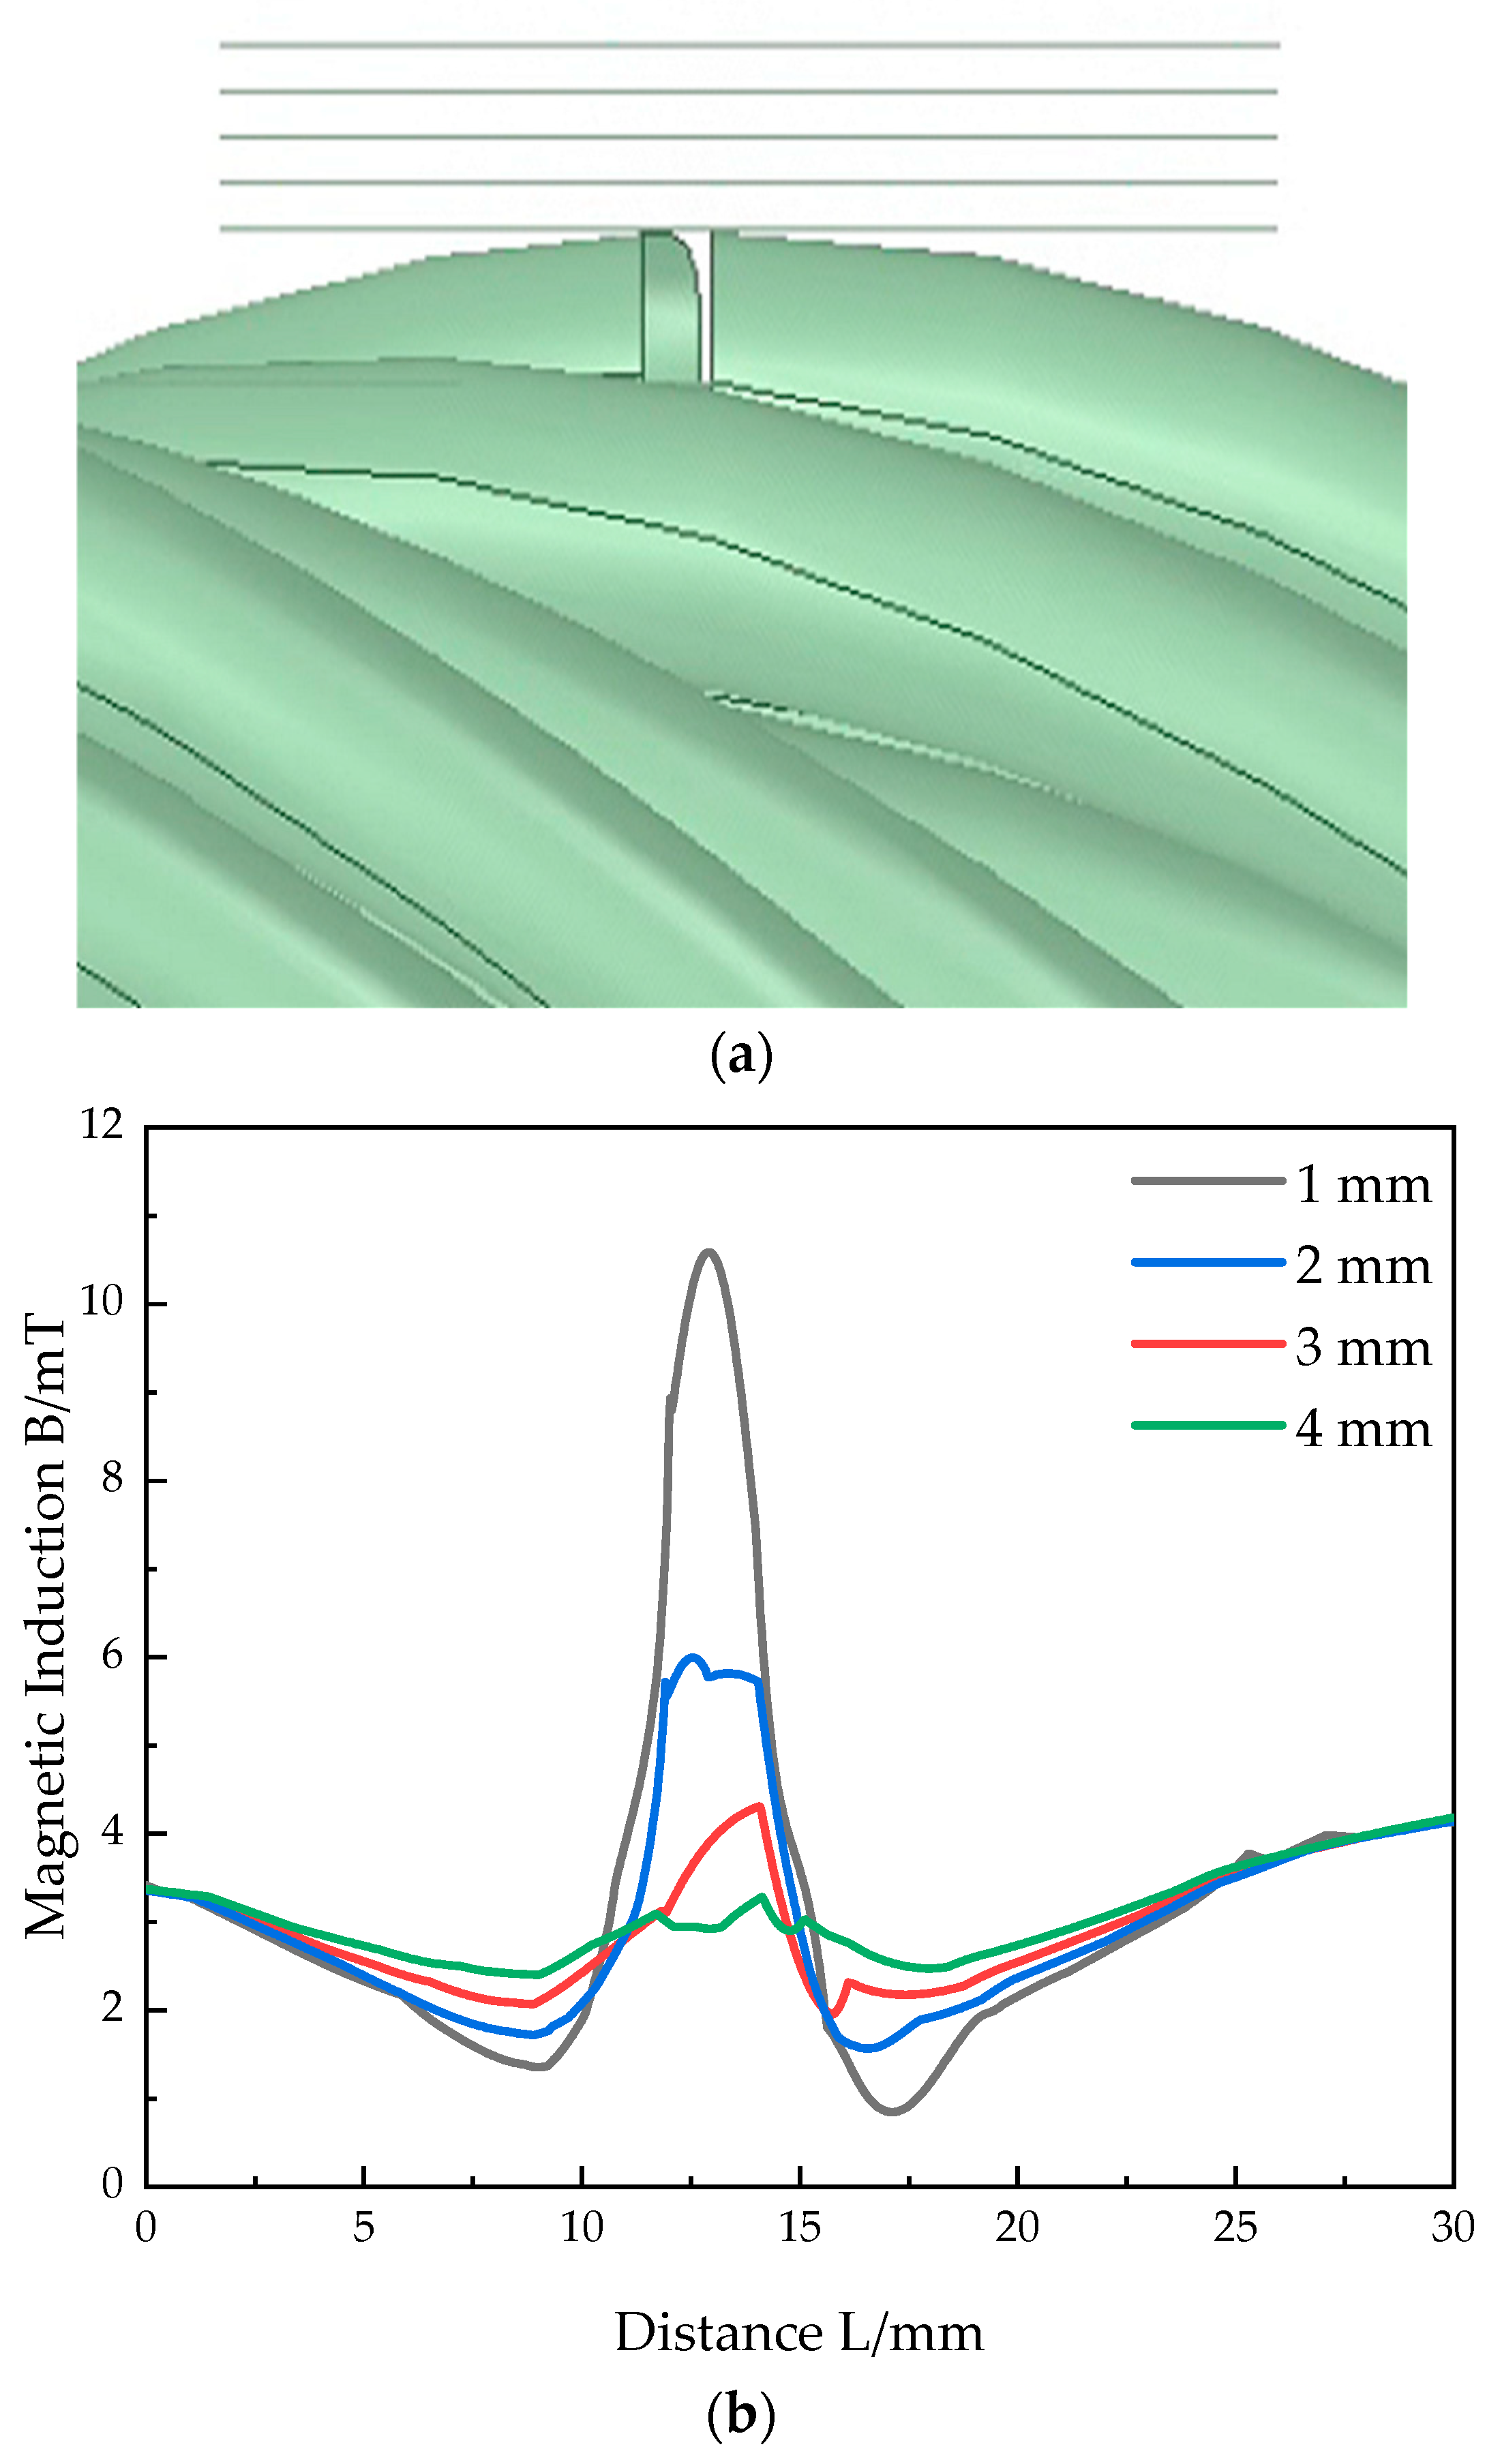
To verify the impact of defects on magnetic induction intensity, the magnetic induction intensity above the defect was determined. The length of the prefabricated broken wire defect is 5 mm, and magnetic field signals were extracted 1 mm, 2 mm, 3 mm, and 4 mm above the defect, as shown in Figure 7a. The simulation results are observed in Figure 7b. The lifting distance has a great influence on the strength of the detection signal of the leakage magnetic field, and the magnetic induction intensity at both ends of the broken wire changes dramatically, resulting in the minimum magnetic induction intensity being near L = 10 mm and 17 mm, the maximum magnetic induction intensity being at L = 13.5 mm, and the obvious enhancement of the magnetic induction intensity at the defect. The closer the radial distance along the pressed rigging, the more drastic the fluctuation of magnetic induction intensity; with the increase in radial distance, the fluctuation of the magnetic induction intensity will slow down, so in the actual detection, the sensor should be close to the compression rigging, as the effect will be more obvious. Therefore, the pressed rigging containing defects is scanned from below to observe fluctuations in the data of the defect’s location in the pressed rigging.

4. Experimental Verification of Finite Element Simulation Results

To verify the accuracy of the simulation results and the impact of pressed rigging stress on the surrounding magnetic field under the influence of a geomagnetic field, weak magnetic flaw detection equipment for marine rigging was used for validation.

4.1. Equipment Model and Verification Materials

The specific model of the verification equipment is CM-801, as shown in Figure 8. The verified pressed rigging has the specific model 6 × 34 + FC and is made of Q345. The specific material composition is 0.20% C, 0.55% Si, 1.7% Mn, 0.30% Cr, 0.035% P, and 0.035% S. In order to be used in the sea, it is galvanized. Its material performance parameters are shown in Table 1.

4.2. Verification Experiment

Pressed rigging with a diameter of 36 mm and a length of 300 mm was selected. Two broken wires, each with a width of 5 mm, were artificially created as defects for the experimental test. In the experiment, a handheld scanning probe equipped with eight detection chips was used to achieve eight-channel detection, thereby improving detection accuracy. The scanning probe was placed vertically on the surface of the pressed rigging to search for defects, and the flaw detection data were recorded. Subsequently, the data from each channel were extracted and analyzed, and algorithms were used to generate a defect cloud map. In the cloud map, red areas indicate locations where the scanning probe detected defects. The detection results are shown in Figure 9a, and the data on the detected defect locations are shown in Figure 9b.
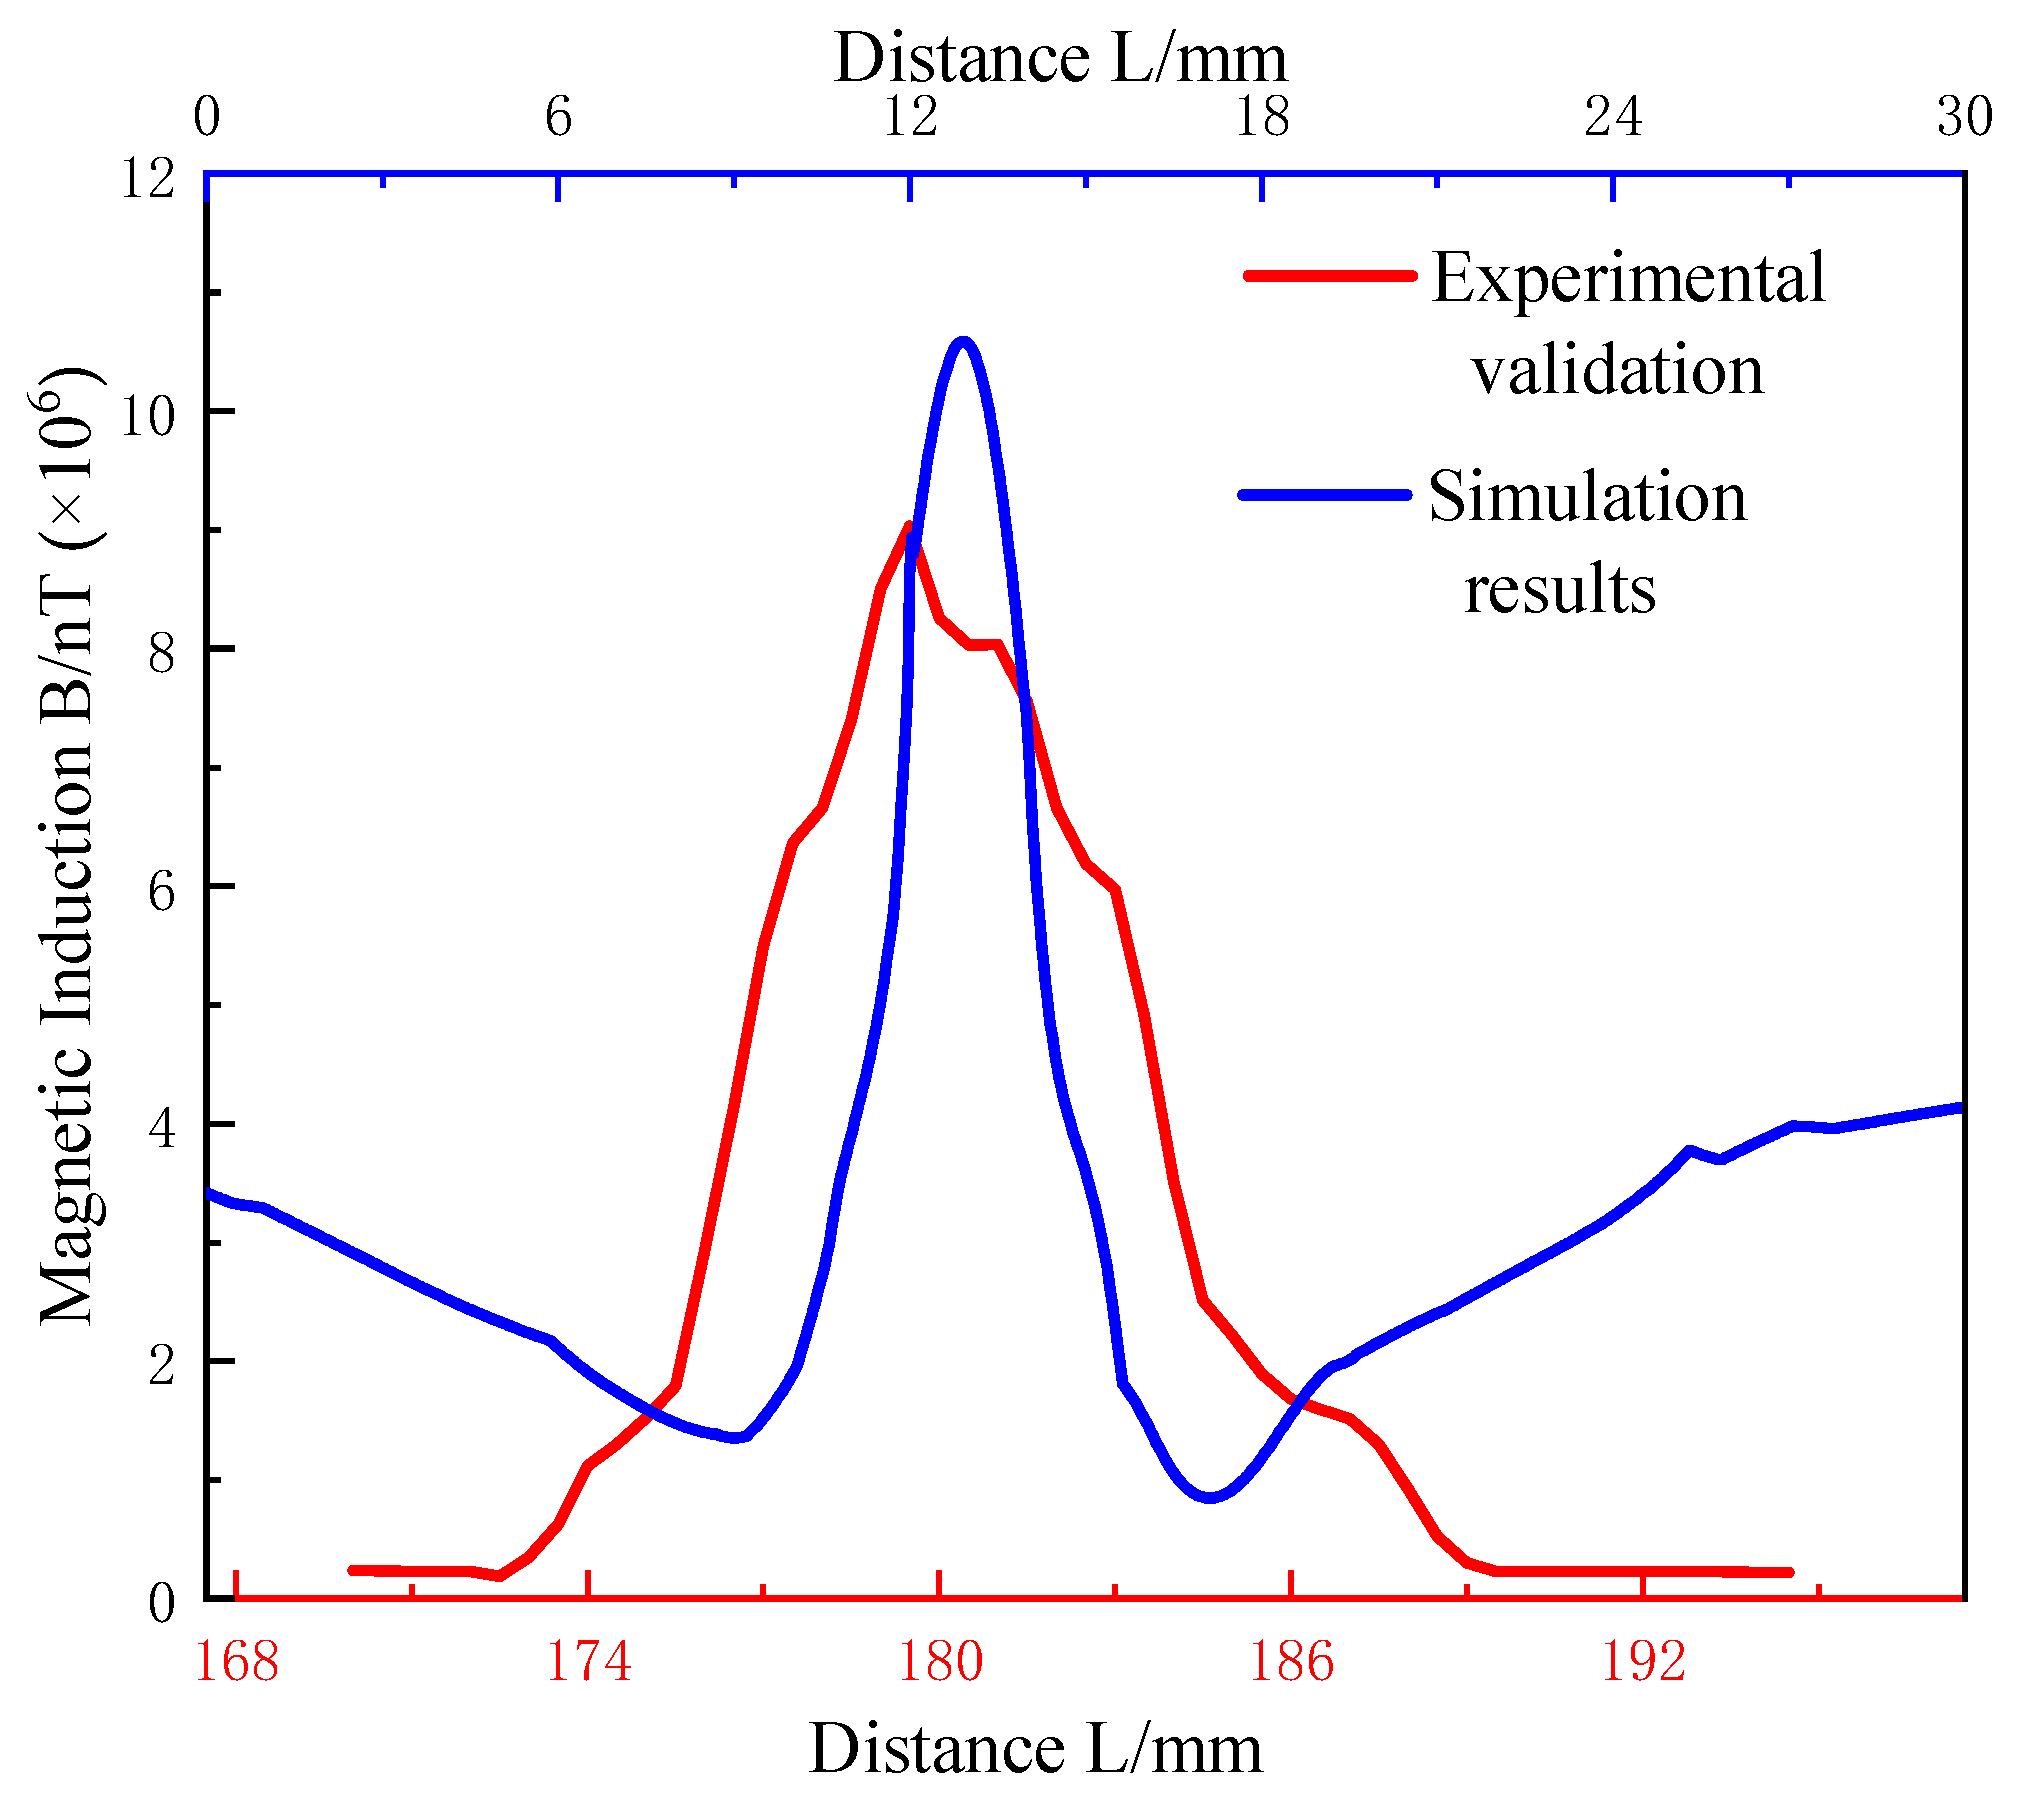
As can be seen from this figure, under the action of the geomagnetic field, the magnetic induction intensity at the defect of the pressed rigging changes greatly. As there is a certain distance between the sensor of the handheld instrument and the surface of the pressed rigging during actual operation, the detected data will be small as a whole. When making the broken wire defect, the error inherent in making the defect will cause the length of the broken wire to be different from the simulated length. In addition, due to the interference of the experiment site, there will be certain errors in the detection of the two ends of the broken wire of the compression rigging, and there will be differences between the simulation results and the experimental results. However, the difference between the peaks and troughs of the simulation and the experiment is consistent, which can provide a theoretical basis for subsequent defect detection, as shown in Figure 10.

5. Discussion

The peak magnetic induction intensity in the broken wire is about 9~10 mT, which shows that the simulation results are in good agreement with the experimental results. However, the simulation results, except the defect location, are more stable than the experimental results, and there are deviations between the experimental results and the simulation results [37]. This is because there are complex contact relationships between wire and wire, friction between the wires and strands, and stress between wires and strands in the pressed rigging. However, in the simulation, only a simplified model of compression rigging was used for analysis, which could not accurately simulate the complex action relationships of actual wire rope. Without considering the influence of manual detection and the model, the distribution law of the defects of pressed rigging under the influence of a geomagnetic field is obtained by a finite element simulation and an actual experiment, and the simulation results agree with the experimental results.
With the deepening of ocean exploration, the suppression rigging used in ocean engineering will be applied to various aspects of ocean exploration. This is a simulation of the defects of in pressed rigging under the action of stress in actual service in the ocean. Finally, it is verified that the simulation results are in good agreement with the experimental results. Therefore, especially under the action of a geomagnetic field, this work has a certain reference significance for the detection of defects in other materials.
Because the aim of this simulation study was to detect the problem of clamping rigging defects during service under the action of a geomagnetic field, the disadvantage of this study is that the detection of the defects of the pressed rigging requires a higher awareness of the environment around the pressed rigging, because the magnetic field is more likely to be disturbed by magnetic objects, which leads to a failure of detection. This is completely different from detection methods that use a magnetic agglomeration device which magnetizes the object to be measured and eliminates the influence of environmental factors. Therefore, when using the geomagnetic detection method to detect, it is necessary to stay away from magnetic objects.

6. Conclusions

ANSYS Workbench and ANSYS Electronics Suite simulation software are utilized in this paper to perform a simulation analysis on a simplified pressed rigging model through force–magnetic coupling. This study investigates the influence of transverse force on the magnetic induction intensity distribution of pressed rigging with defects under a geomagnetic field and the variation of magnetic induction intensity at defect locations. The following conclusions are drawn through a comparative analysis with actual experiments:
  • According to the software model simplification principle of ANSYS and ANSYS Electronics Suite, the 6 × 34 strand wire rope model was simplified to 6 × 7 strand wire rope model, which can not only shorten the calculation time, but also improve the calculation efficiency, under the condition of a small error being created.
  • The simulation calculation with ANSYS simulation software shows that, under the action of a transverse force, the internal stress generated by pressed rigging with defects in a geomagnetic field will change the magnetic field around the pressed rigging. With the gradual increase in the rigging’s internal stress, the magnetic induction intensity will increase and then decrease.
  • Through simulation with ANSYS and ANSYS Electronics Suite, it can be found that the force–magnetic coupling analysis method can accurately calculate that the magnetic induction intensity of defective pressed rigging in a geomagnetic field decreases with the increase in the radial distance of the rigging under the action of a transverse force.
  • The test results of the geomagnetic flaw detection equipment show that when the defect length of the pressed rigging is 5 mm, the difference between the peak and the trough of the magnetic induction intensity at the defect of the pressed rigging is about 9 mT, and, when the defect length of the pressed rigging is the same, the difference between the peak and trough of magnetic induction intensity calculated by ANSYS simulation is consistent with the result measured by the geomagnetic flaw detection equipment.

Author Contributions

Methodology, D.Z. and Z.J.; software, C.H. and Z.Y.; validation, C.H., D.Z. and H.Z.; investigation, G.Z.; resources, G.Z. and Z.Y.; data curation, C.H.; writing—original draft preparation, C.H. and G.Y.; writing—review and editing, H.Z. and G.Z.; supervision, G.Y. and Z.Y.; project administration, Z.J. All authors have read and agreed to the published version of the manuscript.

Funding

This research was funded by the National Natural Science Foundation of China (NSFC, No. 52274338) and a grant from the State Key Laboratory of Metal Material for Marine Equipment and Applications, grant number SKLMEA-K202211.

Data Availability Statement

Data are contained within the article.

Conflicts of Interest

The authors declare that they have no known competing financial interests or personal relationships that could have appeared to influence the work reported in this paper.

References

  1. Hu, D.F.; Zhang, J.M.; Bu, Q.B.; Tian, B.H.; Chen, X.Z.; Wang, K. Technical measures for non-destructive testing of amplitude-varying wire ropes on offshore oil engineering lifting vessels. Chem. Eng. Manag. 2024, 11, 66–68. (In Chinese) [Google Scholar]
  2. Guo, Z.H.; Jia, R.R.; Yang, S.P.; Li, G.H.; Huang, K.J.; Peng, L. Non-destructive testing of wire ropes based on weak magnetic field measurement. Phys. Exp. 2022, 42, 34–39. (In Chinese) [Google Scholar]
  3. Feng, B.; Wu, J.; Tu, H.; Tang, J.; Kang, Y. A review of magnetic flux leakage nondestructive testing. Materials 2022, 15, 7362. [Google Scholar] [CrossRef] [PubMed]
  4. Wang, H.; Jie, T.; Li, X.; Lv, X. Inspection of mine wire rope using magnetic aggregation bridge based on magnetic resistance sensor array. IEEE Trans. Instrum. Meas. 2020, 69, 7437–7448. [Google Scholar] [CrossRef]
  5. Jomdecha, C.; Prateepasen, A. Design of modified electromagnetic main-flux for steel wire rope inspection. NDT E Int. 2009, 42, 77–83. [Google Scholar] [CrossRef]
  6. Sablik, M.J.; Geerts, W.J.; Smith, K.; Gregory, A.; Moore, C.; Palmer, D.; Bandyopadhyay, A.; Landgraf, F.J.G.; de Campos, M.F. Modeling of plastic deformation effects in ferromagnetic thin films. IEEE Trans. Magn. 2010, 46, 491–494. [Google Scholar] [CrossRef]
  7. Jiles, D.C. Theory of the magnetomechanical effect. J. Phys. D Appl. Phys. 1995, 28, 1537. [Google Scholar] [CrossRef]
  8. Yang, S.; Moon, K.W.; Ju, T.S.; Kim, C.; Park, S.; Hwang, C. Universality of stripe domain width change by an in-plane magnetic field. J. Magn. Magn. Mater. 2021, 539, 168381. [Google Scholar] [CrossRef]
  9. Quondam Antonio, S.; Fulginei, F.R.; Lozito, G.M.; Faba, A.; Salvini, A.; Bonaiuto, V.; Sargeni, F. Computing Frequency-Dependent Hysteresis Loops and Dynamic Energy Losses in Soft Magnetic Alloys via Artificial Neural Networks. Mathematics 2022, 10, 2346. [Google Scholar] [CrossRef]
  10. Olabi, A.G.; Grunwald, A. Design and application of magnetostrictive materials. Mater. Des. 2008, 29, 469–483. [Google Scholar] [CrossRef]
  11. Dapino, M.J. On magnetostrictive materials and their use in smart material transducers. Struct. Eng. Mech. J. 2002, 17, 1–28. [Google Scholar]
  12. Li, G.Y. Research on Non-Destructive Testing Technology for Wire Ropes Based on Electromagnetic Method. Master of Thesis, Beijing University of Posts and Telecommunications, Beijing, China, 2014. [Google Scholar]
  13. Ding, Y.F. Research on Wire Rope Detection Based on Electromagnetic Testing Method. Master of Thesis, Beijing University of Posts and Telecommunications, Beijing, China, 2011. [Google Scholar]
  14. Zhang, J.; Peng, F.; Chen, J. Quantitative detection of wire rope based on three-dimensional magnetic flux leakage color imaging technology. IEEE Access 2020, 8, 104165–104174. [Google Scholar] [CrossRef]
  15. Chen, Q.; Zhang, J.; Li, B. Finite element simulation and test of metal magnetic memory detection of wire rope under weak magnetic field. J. Fail. Anal. Prev. 2023, 23, 351–360. [Google Scholar] [CrossRef]
  16. Zhao, M.; Zhang, D.L. Finite element simulation of leakage magnetic field of typical wire rope defects. Nondestruct. Test. 2009, 31, 177–180. (In Chinese) [Google Scholar]
  17. Du, W.; Ma, B.; Xie, Z.; Cao, D.; Wu, P. Finite element analysis on the wire breaking rule of 1×7IWS steel wire rope. EDP Sci. 2017, 108, 01002. [Google Scholar]
  18. Chen, Y.; Meng, F.; Gong, X.S. Parametric modeling and comparative finite element analysis of spiral triangular strand and simple straight strand. Adv. Eng. Softw. 2015, 90, 63–75. [Google Scholar] [CrossRef]
  19. Chen, X.Y.; Zhang, J.; Tang, W.T. Finite element simulation of 1×7+IWS structure wire rope in service. Foundry Technol. 2014, 35, 676–678. (In Chinese) [Google Scholar]
  20. Lian, Z. Research on the Mechanism of Pipeline Stress Detection Based on Strong and Weak Magnetic Coupling Method. Master’s Thesis, Shenyang University of Technology, Shenyang, China, 2022. [Google Scholar]
  21. Zhao, Y.H. Research on Pipeline Stress Detection Method Based on Strong and Weak Magnetic Coupling Technology. Master’s Thesis, Shenyang University of Technology, Shenyang, China, 2022. [Google Scholar]
  22. Zheng, S.M. Research on Magneto Mechanical Relationship Based on Improved J-A Model. Master’s Thesis, Shenyang University of Technology, Shenyang, China, 2022. [Google Scholar]
  23. Kastratović, G.; Vidanović, N. 3D finite element modeling of sling wire rope in lifting and transport processes. Transport 2015, 30, 129–134. [Google Scholar] [CrossRef]
  24. Zhang, D.; Feng, C.; Chen, K.; Wang, D.; Ni, X. Effect of broken wire on bending fatigue characteristics of wire ropes. Int. J. Fatigue 2017, 103, 456–465. [Google Scholar] [CrossRef]
  25. Kastratović, G.; Vidanović, N.; Bakić, V.; Rašuo, B. On finite element analysis of sling wire rope subjected to axial loading. Ocean. Eng. 2014, 88, 480–487. [Google Scholar] [CrossRef]
  26. Delin, S. Mechanical Properties of Metals, 1st ed.; China Machine Press: Beijing, China, 1987; pp. 15–33. [Google Scholar]
  27. Peng, Y.; Huang, K.; Ma, C.; Zhu, Z.; Chang, X.; Lu, H.; Zhang, Q.; Xu, C. Friction and wear of multiple steel wires in a wire rope. Friction 2023, 11, 763–784. [Google Scholar] [CrossRef]
  28. Ai, L.S.J. Research and Analysis of Magnetic Properties of Broken Wire Detection in Wire Ropes Based on Weak Magnetic Field. Master’s Thesis, Wuhan University of Technology, Wuhan, China, 2009. [Google Scholar]
  29. He, J.; Wu, B.; Wu, N.; Chen, L.; Chen, A.; Li, L.; Xiong, Z.; Lin, J. Numerical and Theoretical Investigation on the Load-Carrying Capacity of Bolted Ball-Cylinder Joints with High-Strength Steel at Elevated Temperatures. Metals 2022, 12, 597. [Google Scholar] [CrossRef]
  30. Gerdemeli, I.; Kurt, S.; Anil, A.S. Fatigue life analysis of wire rope strands with finite element method. Key Eng. Mater. 2014, 572, 513–516. [Google Scholar] [CrossRef]
  31. He, Y.; Cheng, T.; Li, Z.; Li, C. Application of electromagnetic method in magnetic memory testing of buried pipelines. China Saf. Sci. J. 2019, 29, 122–127. (In Chinese) [Google Scholar]
  32. Kokornaczyk, E.; Gutowski, M.W. Anhysteretic Functions for the Jiles–Atherton Model. IEEE Trans. Magn. 2015, 51, 7300305. [Google Scholar] [CrossRef]
  33. Hamel, M.; Nait Ouslimane, A.; Hocini, F. A study of Jiles-Atherton and the modified arctangent models for the description of dynamic hysteresis curves. Phys. B Condens. Matter 2022, 638, 413930. [Google Scholar] [CrossRef]
  34. Xue, G.M.; Bai, H.B.; Li, T.; Ren, Z.Y. Numerical Solving Method for Jiles-Atherton Model and Influence Analysis of the Initial Magnetic Field on Hysteresis. Mathematics 2022, 10, 4431. [Google Scholar] [CrossRef]
  35. Hoffmann, K.; Bastos, J.P.A.; Leite, J.V.; Sadowski, N.; Barbosa, F. A vector Jiles–Atherton model for improving the FEM convergence. IEEE Trans. Magn. 2017, 53, 7300304. [Google Scholar] [CrossRef]
  36. Kim, S.; Kim, K.; Choe, K.; JuHyok, U.; Rim, H. A nonlinear magneto-mechanical coupling model for magnetization and magnetostriction of ferromagnetic materials. AIP Adv. 2020, 10, 085304. [Google Scholar] [CrossRef]
  37. Ma, J.; Ge, S.; Zheng, D. Distribution of wire deformation within strands of wire ropes. J. China Univ. Min. Technol. 2008, 18, 475–478. [Google Scholar] [CrossRef]
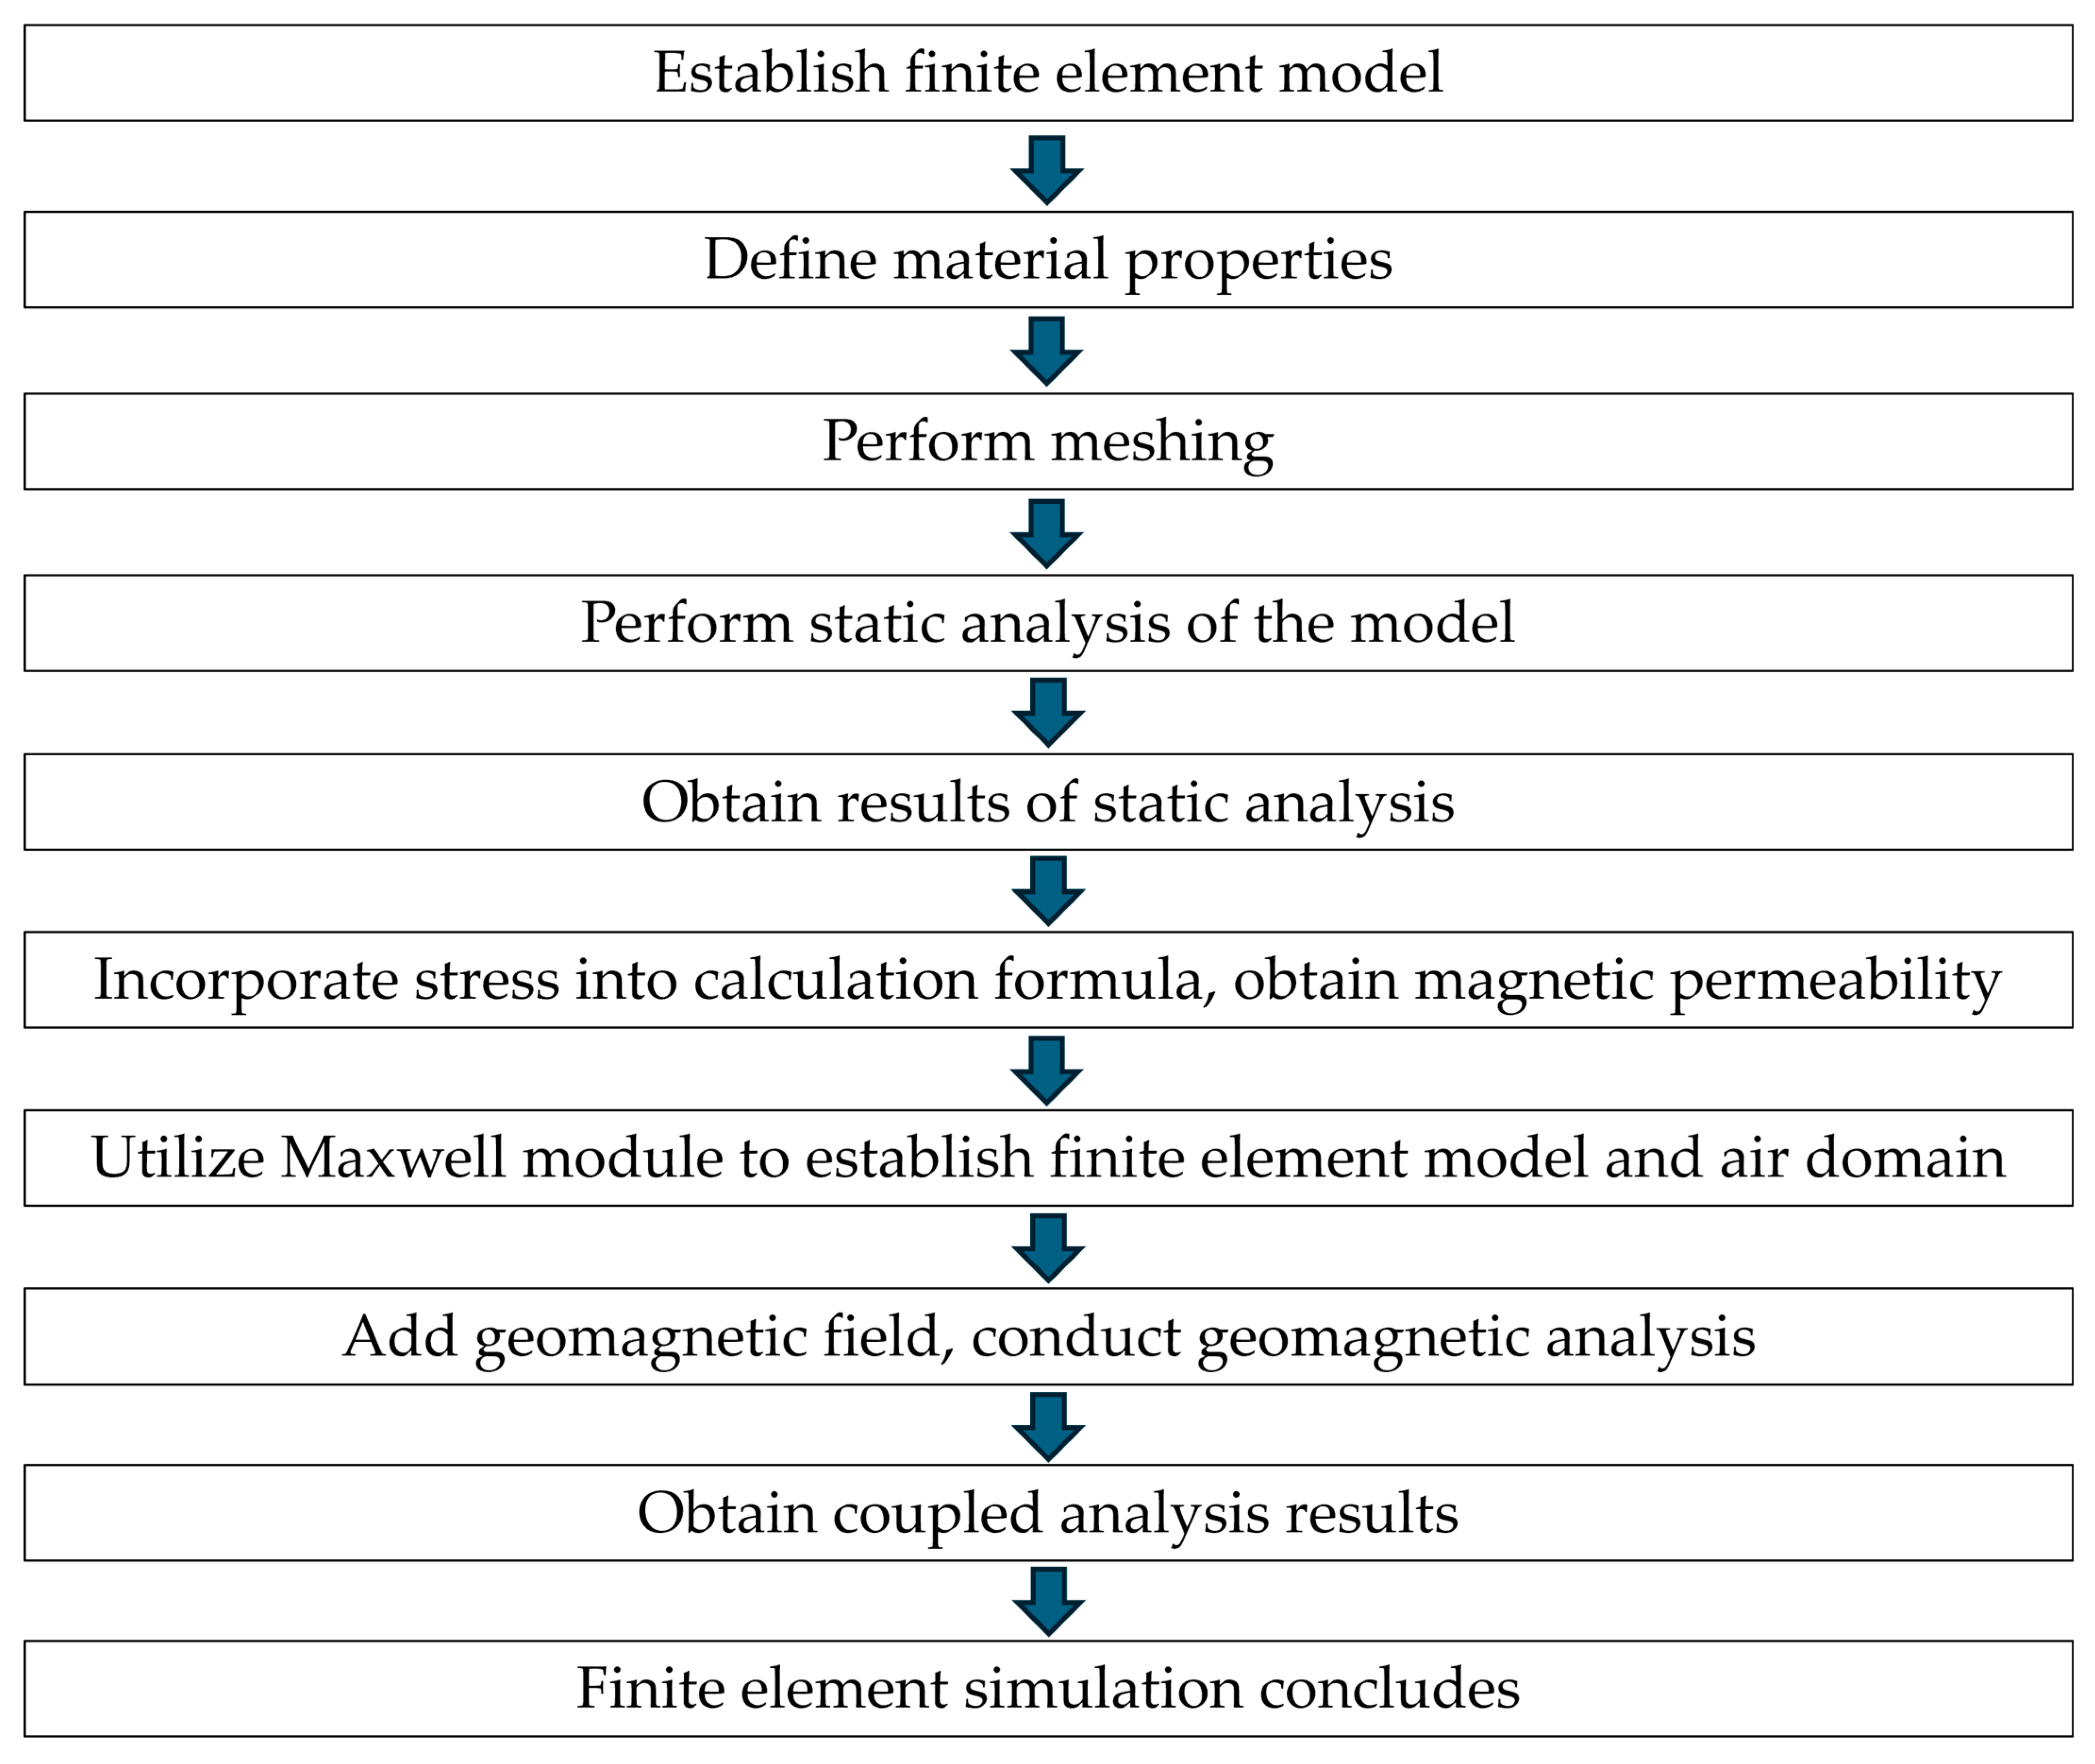
Figure 1. Finite element simulation flowchart.
Metals 14 00811 g001
Figure 2. Sketch drawing steps. (ad) Modeling process diagram of pressed rigging. (e) Model diagram of pressed rigging with defects.
Metals 14 00811 g002
Figure 3. Mesh partitioning of defects.
Metals 14 00811 g003
Figure 4. H-σ stress graph.
Metals 14 00811 g004
Figure 5. Equivalent stress diagram.
Metals 14 00811 g005
Figure 6. Magnetic induction intensity distribution along the entire pressed rigging: (a) magnetic field signal extraction diagram; (b) magnetic induction intensity distribution at different distances.
Metals 14 00811 g006
Figure 7. Magnetic induction intensity distribution at the defect location: (a) magnetic field signal extraction diagram; (b) variation of magnetic induction intensity with radial distance of the pressed rigging.
Metals 14 00811 g007
Figure 8. Weak magnetic flaw detection equipment for marine rigging.
Metals 14 00811 g008
Figure 9. Verification of magnetic induction intensity at the defect location: (a) defect detection results; (b) magnetic induction intensity at defect locations.
Metals 14 00811 g009
Figure 10. Comparison of experiment and simulation.
Metals 14 00811 g010
Table 1. Material performance parameters.
Material PropertyValue
Young’s Modulus E/GPa210
Poisson’s Ratio γ0.27
Standard Tensile Strength σb/MPa345
Yield Strength σs/MPa20
Elastic Modulus E/GPa210
Coefficient of Friction μ0.3~0.6
Density ρ/(kg·m3)7.85 × 103
Table 2. Data parameters.
ParameterNumerical Value
μ 0 ( NA 2 ) 4 π × 10 7
M s ( A / m ) 1.387 × 10 6
k 0 μ 0   ( AM 1 )500
a 0 ( Am 1 )180
α 0 8.44 × 10 6
E s ( MPa )207
λ ws 3.85 × 10 6
σ 0 100 × 10 6
η 0 1.5 × 10 7
γ 1 ( 0 ) ( A 2 · m 2 ) 7 × 10 18
γ 1 ( 0 ) ( A 2 · m 2 · P a 1 ) 1 × 10 25
γ 2 ( 0 ) ( A 4 ) 3.3 × 10 30
γ 2 ( 0 ) ( A 4 · m 4 · P a 1 ) 2.1 × 10 38
Disclaimer/Publisher’s Note: The statements, opinions and data contained in all publications are solely those of the individual author(s) and contributor(s) and not of MDPI and/or the editor(s). MDPI and/or the editor(s) disclaim responsibility for any injury to people or property resulting from any ideas, methods, instructions or products referred to in the content.