Article

Research on Multiscale Numerical Simulation Method for SLM Melting Process

1
School of Traffic & Transportation Engineering, Central South University, Changsha 410083, China
2
School of Intelligent Manufacturing and Mechanical Engineering, Hunan Institute of Technology, Hengyang 421002, China
3
Key Laboratory of Traffic Safety on Track, Ministry of Education, Central South University, Changsha 410083, China
*
Author to whom correspondence should be addressed.
Metals 2024, 14(7), 825; https://doi.org/10.3390/met14070825
Submission received: 16 June 2024 / Revised: 7 July 2024 / Accepted: 14 July 2024 / Published: 18 July 2024
(This article belongs to the Section Additive Manufacturing)

Abstract

:
In the selective-laser-melting process, it is difficult to monitor the evolution of the melt pool in real time via experimental methods due to the complexity and fine scale of laser–powder interaction; numerical simulation has become an important technical way to study the selective-laser-melting process. A coupled thermal–fluid model of the SLM single-layer melt-channel-forming process is constructed based on hydrodynamic theory for AlSi10Mg metallic materials, and the SLM single-layer melt-channel-forming process is investigated by combining parametric experiments and numerical simulation methods. A binarised spatial-random-function pore material model is proposed, and a multiscale finite-element numerical model of the melt-channel-forming process is constructed to compare and verify the first-layer melt-channel-forming process and to analyse the evolution of the melt pool and the change in the temperature field in multi-layer melt channel formation. The results of this study show that the multiscale numerical model of the SLM multilayer melt-channel-forming process has a reliable computational accuracy, with an average error of 6.77% for the melt pool length and 1.69% for the melt pool width; Marangoni convection effects increase the melt pool size, and the presence of pores significantly affects the evolution of the powder bed temperature field. With laser scanning and powder bed stacking, the overall temperature of the powder bed and the peak temperature of the molten pool gradually increased, and the length, width, and height dimensions of the molten pool increased by 44.9%, 21.7%, and 33.8%, respectively.

1. Introduction

Selective-laser melting (SLM) is a typical additive manufacturing method, and in recent years, researchers have conducted numerous experiments using SLM technology on alloys such as Ti6Al4V, AISI316L, Inconel 718, Inconel 625, and AlSi10Mg [1,2,3,4]. The AlSi10Mg alloy is widely used in automotive, aerospace, and other industries due to its good thermal conductivity, high strength, low density, and good weldability [5]. Important printing parameters such as laser power, scanning speed, laser radius, scanning pitch, etc., determine the rate at which the powder layer obtains energy from the laser beam, which directly affects the microstructure and mechanical properties of the SLM-formed structure [6,7]. The combination of inappropriate formation scanning parameters and poor powder melting can lead to poor densification of the formed structure [8]. Buchbinder [9] carried out experiments on SLM formation of AlSi10Mg alloys, using a 200 μm diameter laser source, and found that laser powers greater than 150 W were required to prepare structures with high relative densities. Louvis [10] conducted SLM experiments on aluminium alloys and found that aluminium alloys have a small forming window and that oxidation effects are an important factor affecting the density of aluminium alloys formed. Megahed [11] investigated the microstructural properties of AlSi10Mg alloys prepared by laser-based powder bed melting under non-heat-treated and heat-treated conditions, evaluated their static and dynamic mechanical properties, and investigated the optimum set of heat-treating parameters in terms of increasing the hardness and eliminating anisotropic microstructural features. Mustafa [12] investigated the effect of build anisotropy on the organisation and mechanical properties of selective-laser-melted AlSi10Mg.
The complex heat and material exchange processes inside and outside the melt pool are difficult to be detected in real time by monitoring instruments, while numerical simulation methods, as a supplement and extension of testing, can quantify the effects of forming parameters on the properties of the formed specimens. Macroscale numerical models of SLM usually ignore the effect of pores between powders and the generation of melt pools and simplify and calculate the model by treating the powder bed as a whole continuum, which can efficiently carry out the preliminary process analysis and optimisation, and mainly use the finite-element method, the finite-volume method, and the finite-difference method to carry out the macroscale modelling of the SLM process. Li [13] used the finite-element method to establish a numerical model for the laser-melting process of 316L stainless steel selective zone and carried out a detailed study on the influence of material parameters on the forming process and results in the SLM process and found that the forming process parameters significantly affect the temperature field of the powder bed and the size of the molten pool, and this discovery provides an important reference to optimise the SLM process. Ye [14], in order to reveal the complex physical properties of laser–material interaction, the effects of laser process parameters on the melt pool characteristics in SLM formation of alloys such as Ti-6Al-4V, 316L stainless steel, and Inconel 625 were investigated, which provided an important theoretical basis for optimising the SLM process. Roberts [15] investigated the changes in the distribution of thermal stresses induced by the evolution of the temperature field of a multilayer powder bed based on a three-dimensional finite-element model. Zhao [16] investigated the SLM formation process of the GH4169 alloy, and it pointed out that the SLM process is a dynamic process of rapid melting and solidification and found that there is a large temperature gradient near the turn of the scanning direction and at the overlap of the scanning lines, which produces thermal strain and stress concentration, leading to warpage deformation.
Compared with the macroscopic scale, mesoscopic-scale numerical simulations also need to take into account complex physical phenomena and processes such as surface tension, recoil pressure of molten pool evaporation, gravity, Marangoni convection, etc., in the study of molten pools, which can more accurately predict and control material defects in the process of melting and forming metal powder. Korner [17] used the lattice Boltzmann method to develop a two-dimensional model for the SLM process for metal powders at a mesoscopic scale. The model neglects the interaction between surface tension, the Marangoni effect and recoil pressure from evaporation. Carolin [17] developed a two-dimensional lattice Boltzmann model to study the melting and re-solidification of a randomly filled powder bed during selective melting with a Gaussian laser heat source. Khariallah [18] developed a three-dimensional powder bed heat flow coupling model and found that the Marangoni effect is the main driving force of the melt pool. Sonny [19] observed a molten pool sputtering via a high-speed camera and reproduced the sputtering process using numerical simulation. Qiu [20] investigated the selective-zone melting process of the Ti-6Al-4V alloy under different laser parameters and simulated the melt-splashing behaviour of metallic materials produced during the forming process. It was found that the formation of porosity and the surface roughness of the formed structure were related to the thickness of the powder bed; the thicker the powder layer, the higher the porosity and the lower the surface quality. It was also suggested that the Marangoni force as well as the steam recoil pressure were the reasons for the instability of the melt pool. Panwisawas [21] constructed a powder bed model by numerical simulation and investigated the effects of process parameters such as laser power, scanning speed, and powder thickness on the densities of the final formed structures.
In summary, at present, for the numerical simulation of multilayer melt-channel-forming processes, the macroscopic-scale continuum finite-element model has poor computational accuracy, and the mesoscopic-scale multi-physical heat–fluid coupling high-fidelity numerical model has low computational efficiency, which are not able to show the interlayer relationship between the powder and the structure of the formation characteristics effectively. This paper establishes a high-precision multi-physical-field model of the SLM formation process at the mesoscopic scale and combines the results of mesoscopic numerical simulation to construct and validate a multiscale numerical model of SLM melt-channel formation. The evolution of the temperature field of the molten pool and the flow field of the molten mass during the SLM melt-channel formation was studied, and the change rule of the overall temperature of the powder bed and the size of the metal molten pool was obtained, which provides certain research methods and ideas for the numerical simulation study of SLM.

2. SLM Single-Layer Numerical Modelling and Validation

In this paper, Flow-3D v11.1 software (Flow Science, Santa Fe, NM, USA) is used to simulate the single-layer selective-laser-melting formation process. Referencing to existing studies to simplify the problems involved in the process, the following assumptions are made in this study: (1) the AlSi10Mg alloy powder is assumed to be of regular spherical shape; (2) the melt in the melt pool is assumed to be an incompressible, homogeneous Newtonian fluid; (3) the alloy material under study is considered to be a pure material with valid physical properties.

2.1. Physical Models and Control Equations

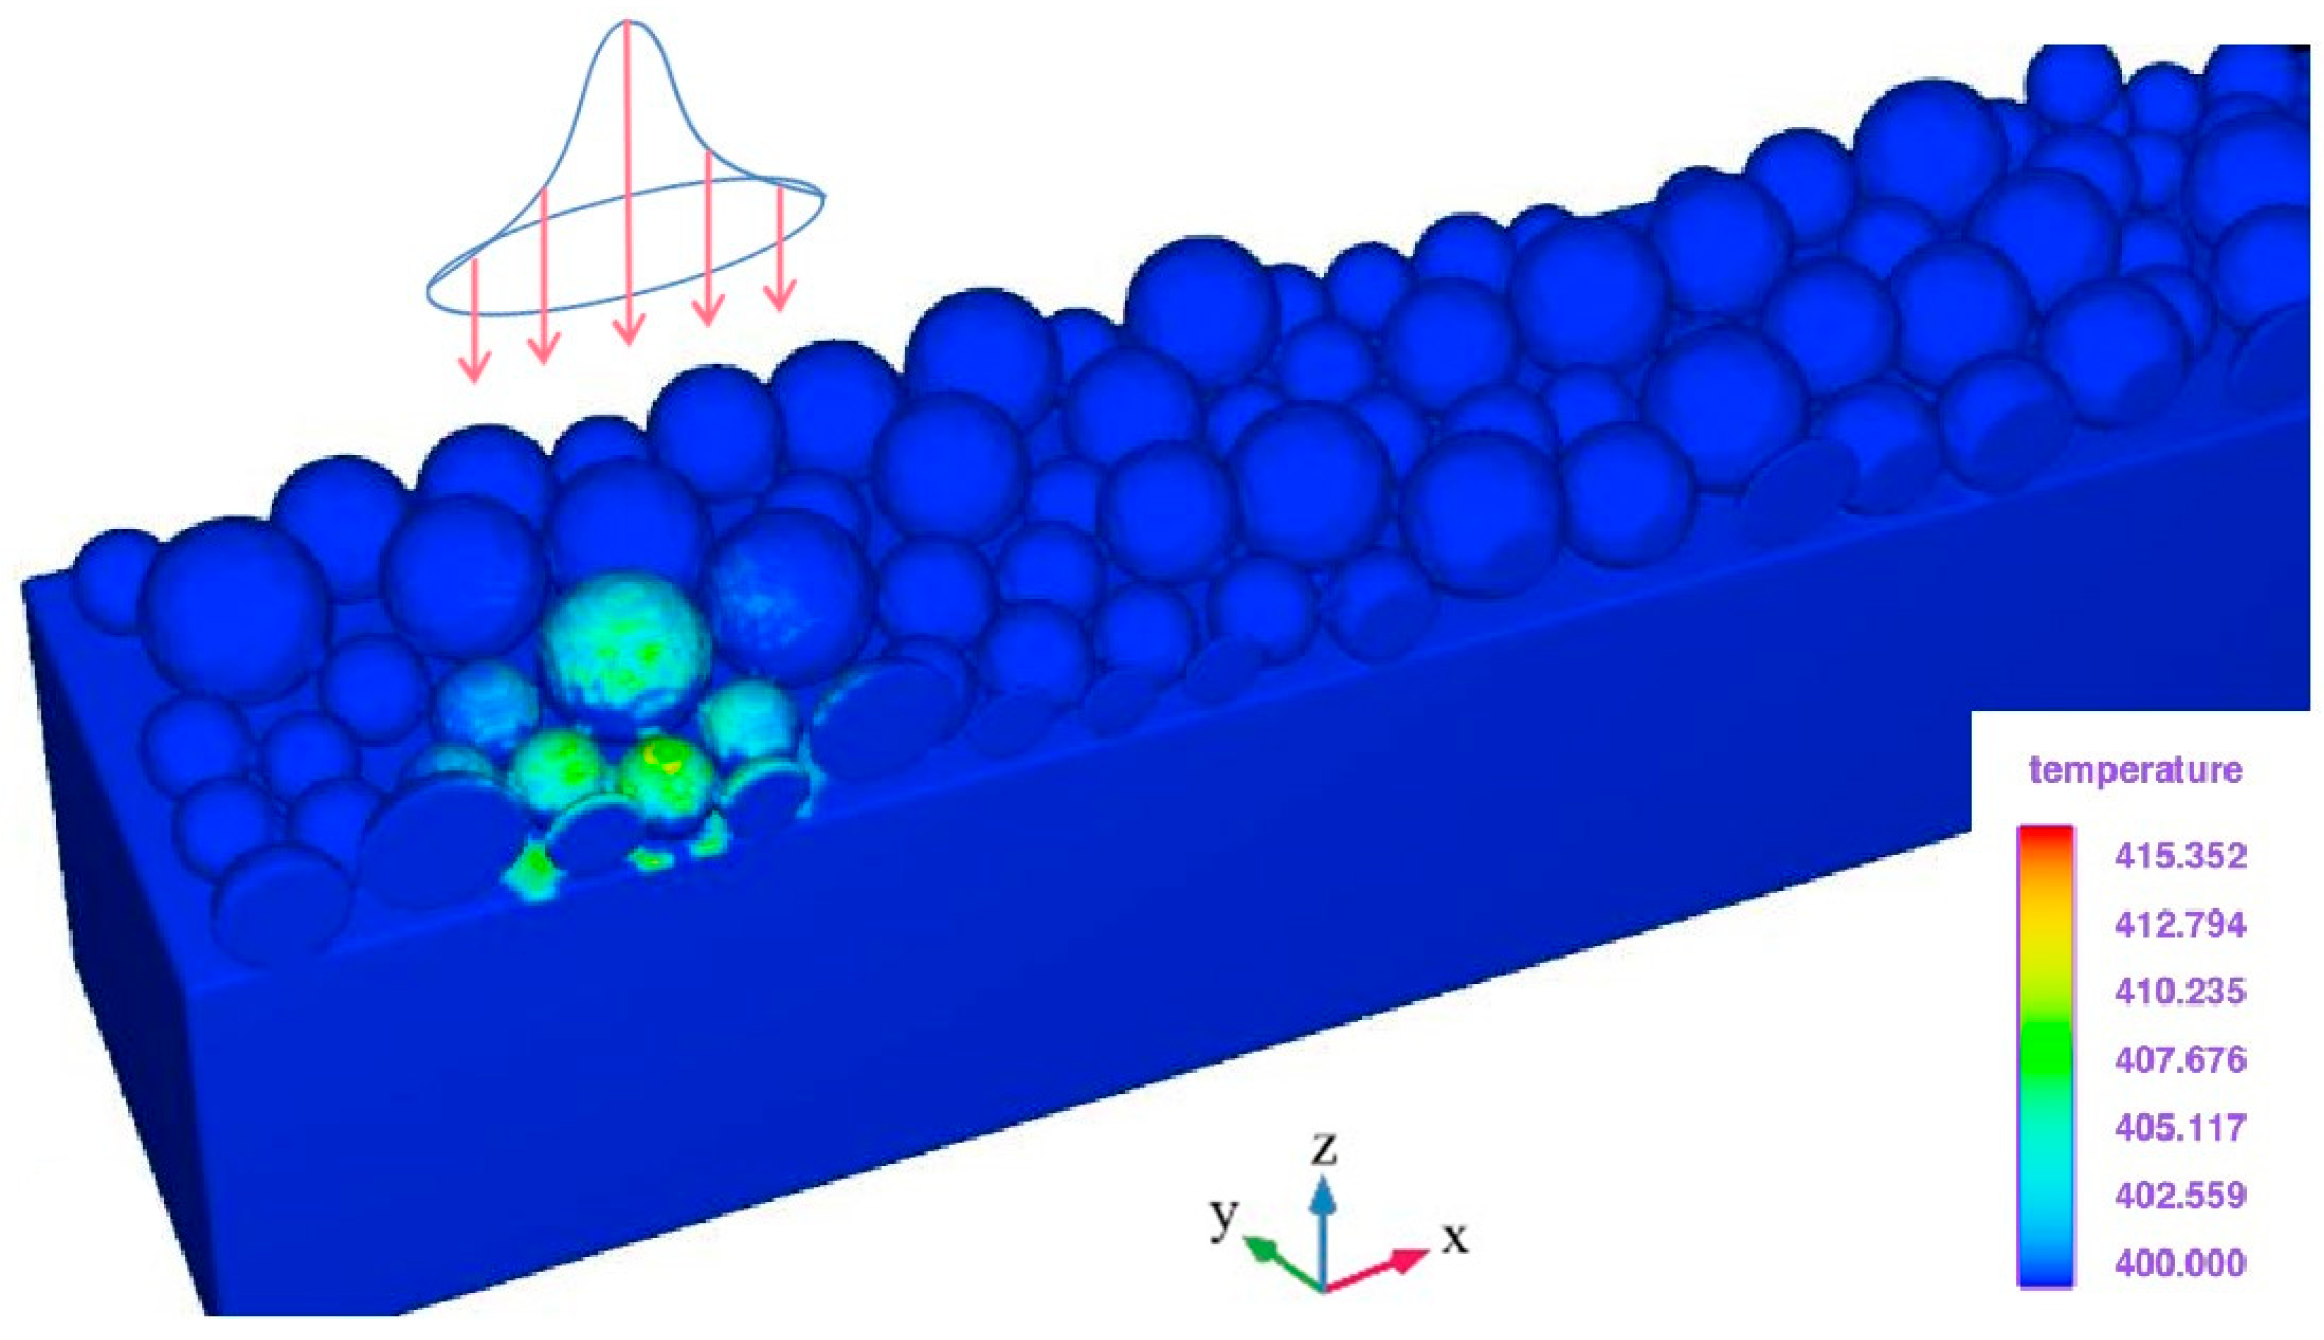
The numerical simulation model takes into account the physical effects and phenomena such as thermal radiation, heat conduction, solid–liquid phase transition, pool evaporation, gravity, surface tension and its resulting Marangoni effect during the SLM process. The physical process of SLM formation is shown in Figure 1, the thickness of the single-layer powder bed is set to be 50 µm, and the influence of the powder bed thickness is not considered. The discrete element method (DEM) is used to simulate the powder bed model formed by the metal powder with the particle size ranging from 20 µm to 50 µm under the action of gravity only, and the average particle size of the powder is set to be 35 µm. The bulk density of the powder is set to be 1.5 g/cm3; the relative density is 55%. The powder aggregation effect due to van der Waals forces was not considered as the powder particle sizes were all larger than 20 µm. The powder bed was laid as a whole onto the top of a planar substrate of the same material, which was a 1.2 mm × 0.5 mm × 0.2 mm rectangle, and can be considered as a processing base or a structural part that has been scanned and formed.
The reflection and absorption penetration between the laser and the powder is simplified as a Gaussian-distributed surface heat source, and there is a certain defocusing dispersion effect in the direction of laser action. The heat source’s heat flux expression is as follows:
q ( x , y , z ) = m A P π r L 2 exp m x 2 + y 2 r L 2
r L = r 0 + a z 0 z
where P is the laser power, and the value of m is taken as two [18]. As can be seen from the integration results, the formula sets the energy power within the laser radius to account for 86.5% of the total laser power, A denotes the absorption rate of the powder to the laser energy, r0 denotes the laser radius, and a denotes the laser divergence angle.
In the scanning process, the high-energy density laser beam acts directly on the surface of the powder, the powder absorbs heat and rapidly warms up and melts, and there is a certain amount of heat loss on the surface of the powder and the melt pool due to radiation and convection; so, the size of the final input heat flux is adjusted [22].
q in = q ( x , y , z ) h c ( T T 0 ) ε σ s ( T 4 T 0 4 ) q ev
where hc is the convective heat transfer coefficient of the protective gas, ε is the radiant emissivity, σs is the Stefan–Boltzmann constant, and T0 is the ambient temperature, the preheating temperature of the substrate. qev expresses the heat absorbed by evaporation from the top of the melt pool.
Figure 2 shows the initial profile of the laser energy acting on the surface of the powder bed; the laser energy acts directly on the spherical powder surface profile and meets the characteristics of laser defocusing and dispersion. The single layer of metal powder reaches the melting point under the radiation of the laser and begins to melt, and with the movement of the laser and the transfer of heat outward, the molten liquid metal is cooled and solidified. The material is heated and cooled cyclically as the laser scans adjacent areas for processing. In the SLM process, the unit heat input is provided by the laser beam, and the heat output is represented by heat conduction, heat radiation, and convection losses.
Assuming that the melted liquid metal is incompressible, the thermal expansion phenomenon is provided by the density as a function of temperature with respect to time, and the governing equations are the mass continuity equation, the momentum conservation equation, and the energy conservation equation [23].
ρ t + · ( ρ v ) = 0
t ( ρ v ) + · ( ρ v v ) = · ( μ v ) p + ρ g + f
t ( ρ T ) + · ( ρ v T ) = · ( k T ) t ( ρ H ) + · ( ρ V H )
where v and g denote velocity and gravitational acceleration, μ denotes the hydrodynamic viscosity, p is the pressure, T denotes the temperature, ρ denotes the density, and H denotes the latent heat of phase change in the melting process.
In the laser scanning process, the metal powder particles absorb the laser energy, and the temperature rises until it melts to form a molten metal pool; the liquid metal surface tension coefficient can be up to 1000 mN/m or more, and the surface tension calculation of the surface in the model is replaced by the equivalent surface pressure. In the process of powder melting and solidification, the temperature at the centre of the melt pool surface is higher compared to the surrounding area, and the Marangoni effect generated by the surface tension gradient due to the temperature effect of the surface tension coefficient affecting the motion of the melt pool fluid, which is characterised by the Marangoni force, which satisfies
F Marangoni = d σ d T [ T n ( n · T ) ]
where σ is the liquid metal surface tension coefficient and n is the unit vector.
With the movement of the laser, the liquid melt pool is rapidly solidified, and gravity acts on the liquid metal in the melt pool for a short period of time, and its driving effect is relatively small compared with the surface tension and Marangoni effect, which can be clearly verified in the numerical model results and in the model without applying the effect of surface tension; the powder cools down and solidifies immediately after the thermal melting without any obvious deformation.
Considering the vaporisation phenomenon resulting from the heating of the molten pool under the action of the laser, in which the evaporation heat absorption effect is considered in the heat source model part, according to the numerical model of the evaporation process proposed by Alexander Klassen [24] et al., the evaporation heat absorption flux can be obtained
q ev = φ Δ H v 2 π M R T p 0 exp Δ H v T T lv R T T lv
where p0 is the ambient pressure, Tlv is the boiling point of the melt pool, φ is the evaporation efficiency, ΔHv is the latent heat of evaporation, M is the molar mass of the metallic material, and R is the ideal gas constant.
When the laser energy density is high, the surface temperature of the melt pool reaches the boiling point, and the alloy vapour produced by the melt pool will generate a large recoil pressure on the melt pool, which is greater than or equal to 0.55P0, where P0 is the saturated vapour pressure of the melt pool, and in numerical simulation is loaded on the surface of the melt pool in an externally acting manner, which can be derived by using the Alexander Klassen equation [24]:
p v ( T ) = 0.55 p 0 exp Δ H v T T lv R T T lv

2.2. Material Parameter Setting

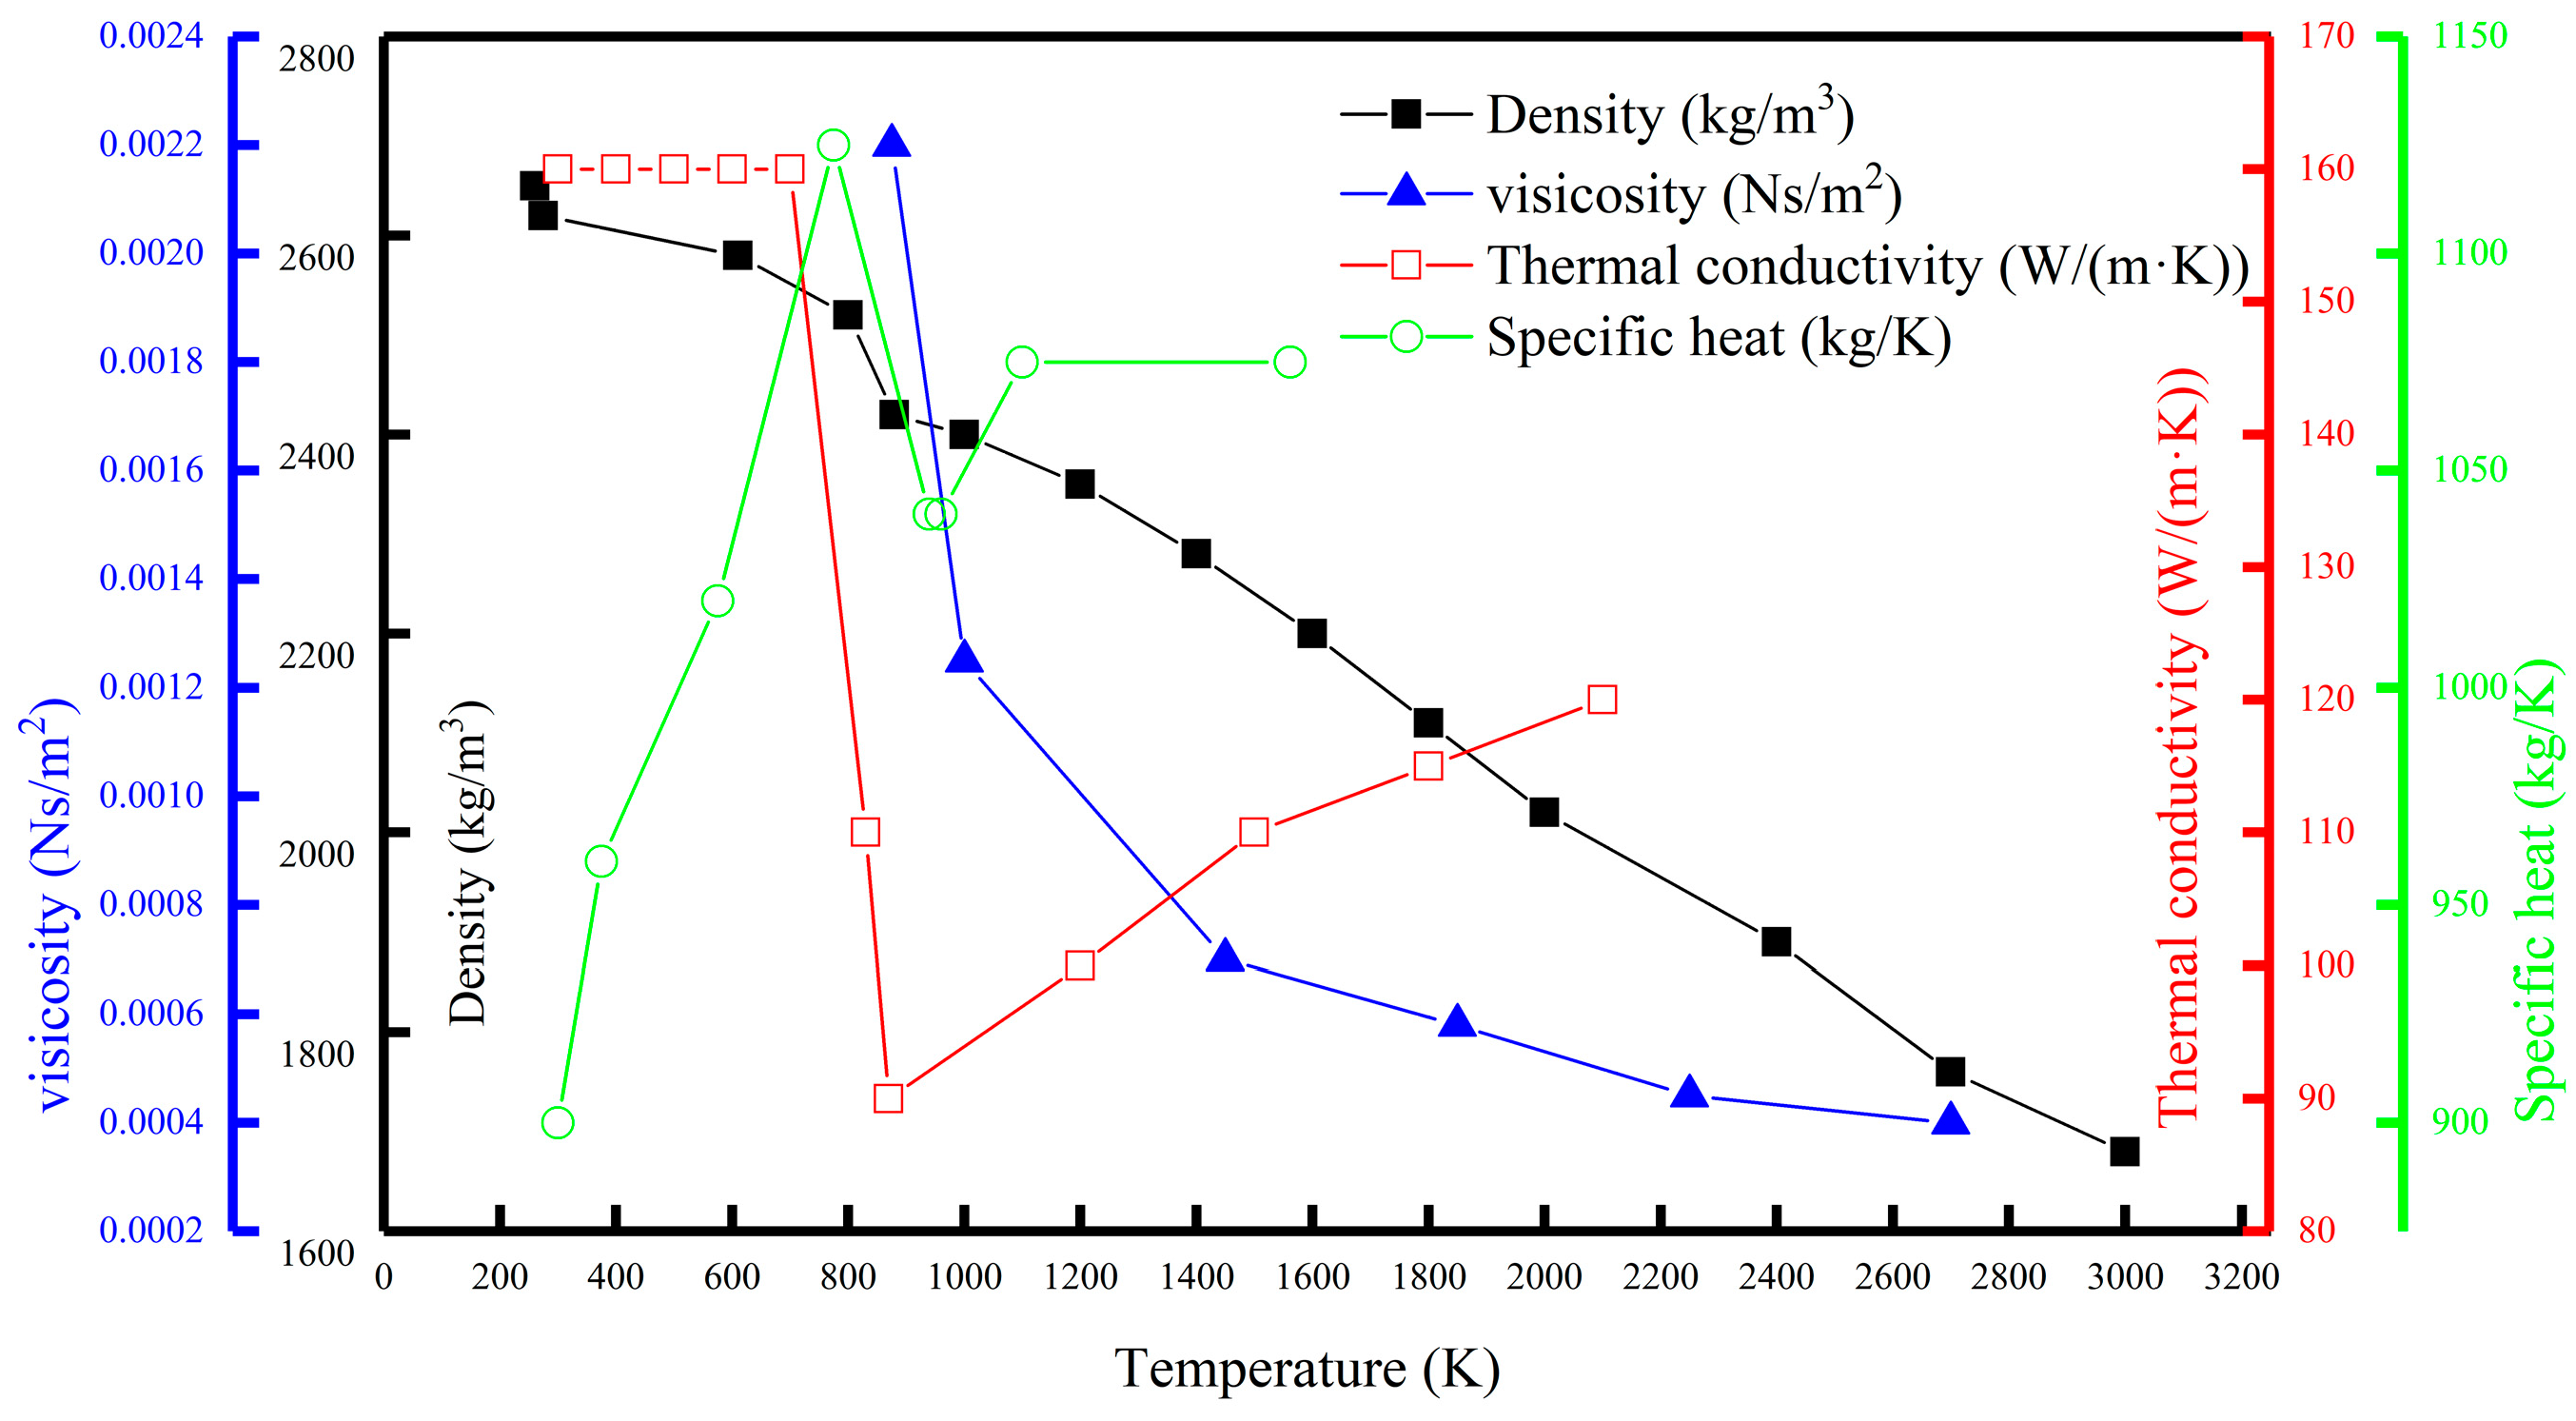
The powder bed and the substrate are set to be the same AlSi10Mg material, and the thermophysical parameters [25] of this material are set as shown in Figure 3 and Table 1.

2.3. Experimental Materials and Forming Equipment

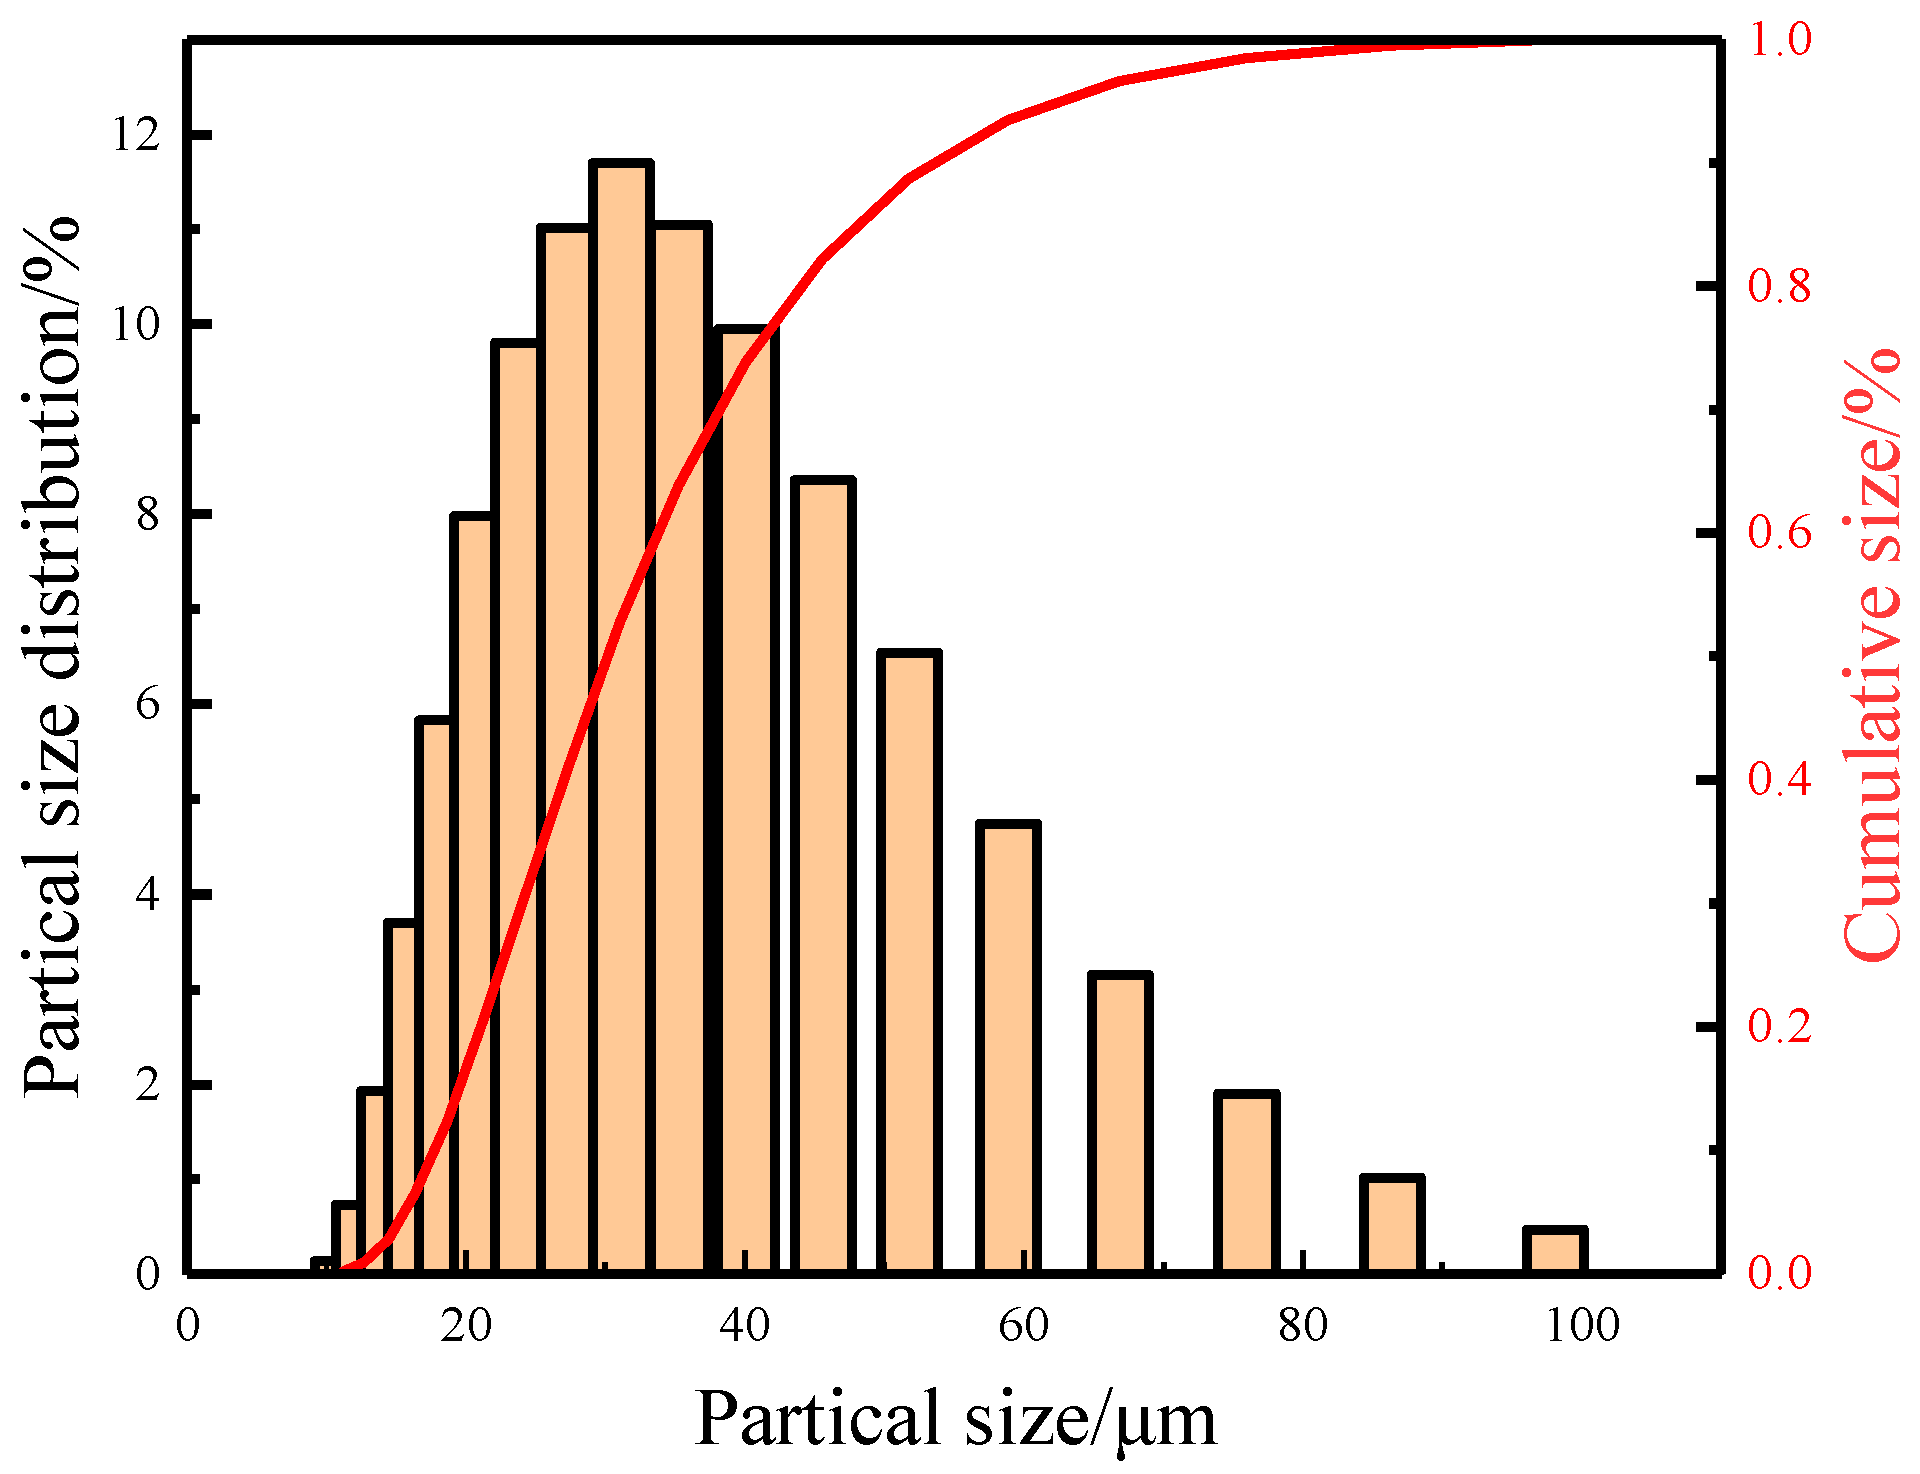
The AlSi10Mg powder used in the experiment was prepared by the State Key Laboratory of Powder Metallurgy, Central South University, Changsha, China, and the chemical composition of the powder is shown in Table 2, and the particle size distribution of the powder is shown in Figure 4, where D(10) = 17.2 μm, D(50) = 30.5 μm, and D(90) = 52.7 μm.
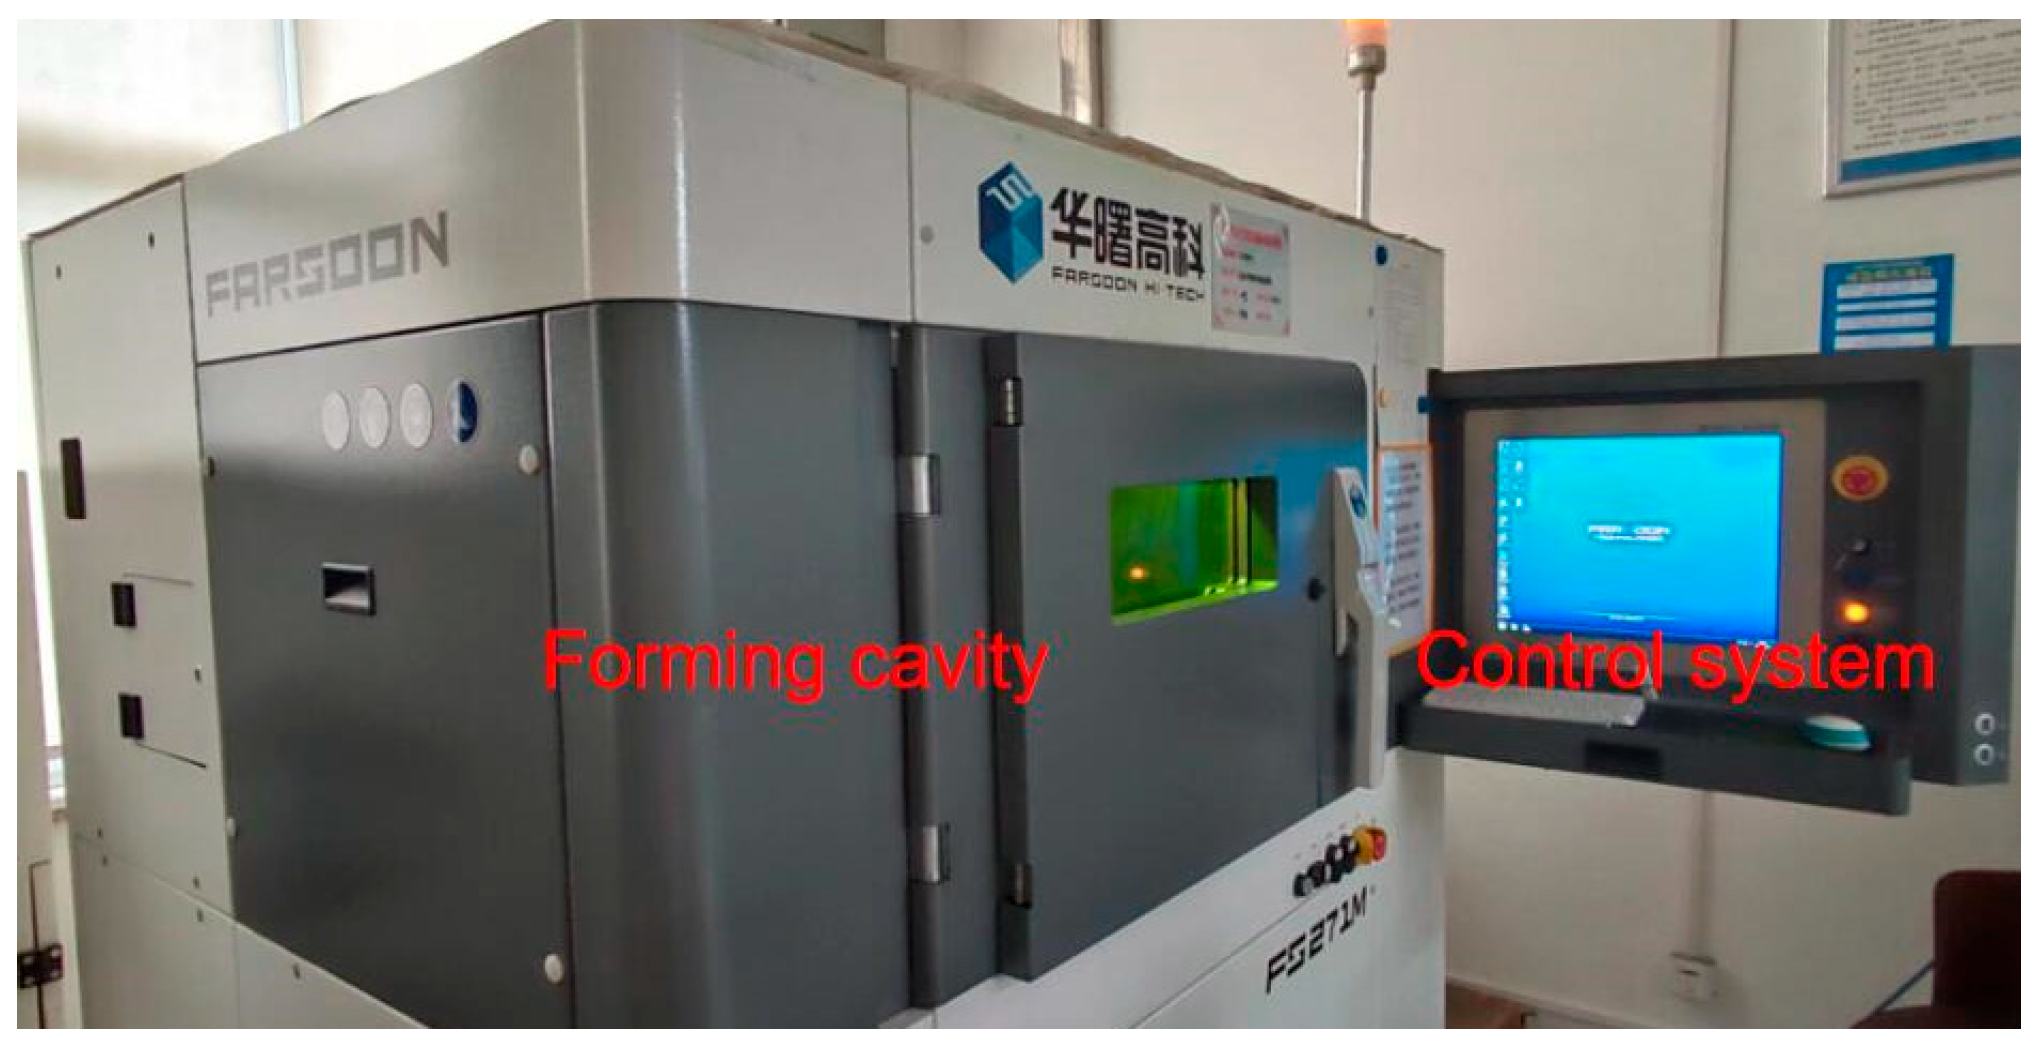
Using Huashu Hi-Tech FS271M (Shenzhen, China) selective-laser-melting equipment as shown in Figure 5 for the SLM formation of metal powder, the size of the forming cylinder of this equipment is 275 mm × 275 mm × 320 mm, equipped with a 500 W fibre laser and high-precision three-axis scanning galvanometer, and the highest scanning speed is up to 15 m/s.
The aluminium substrate was preheated to 130 °C, and the forming cavity was filled with high-purity argon as the protective gas, with the oxygen content below 0.15% by volume. The forming parameters are shown in Table 3. The melt channel length is set to 20 mm. In order to facilitate the subsequent observation, the single melt channel scanning is set to 1 mm spacing. The forming is repeated five times. The powder laying and scanning process is shown in Figure 6.

2.4. Model Validation

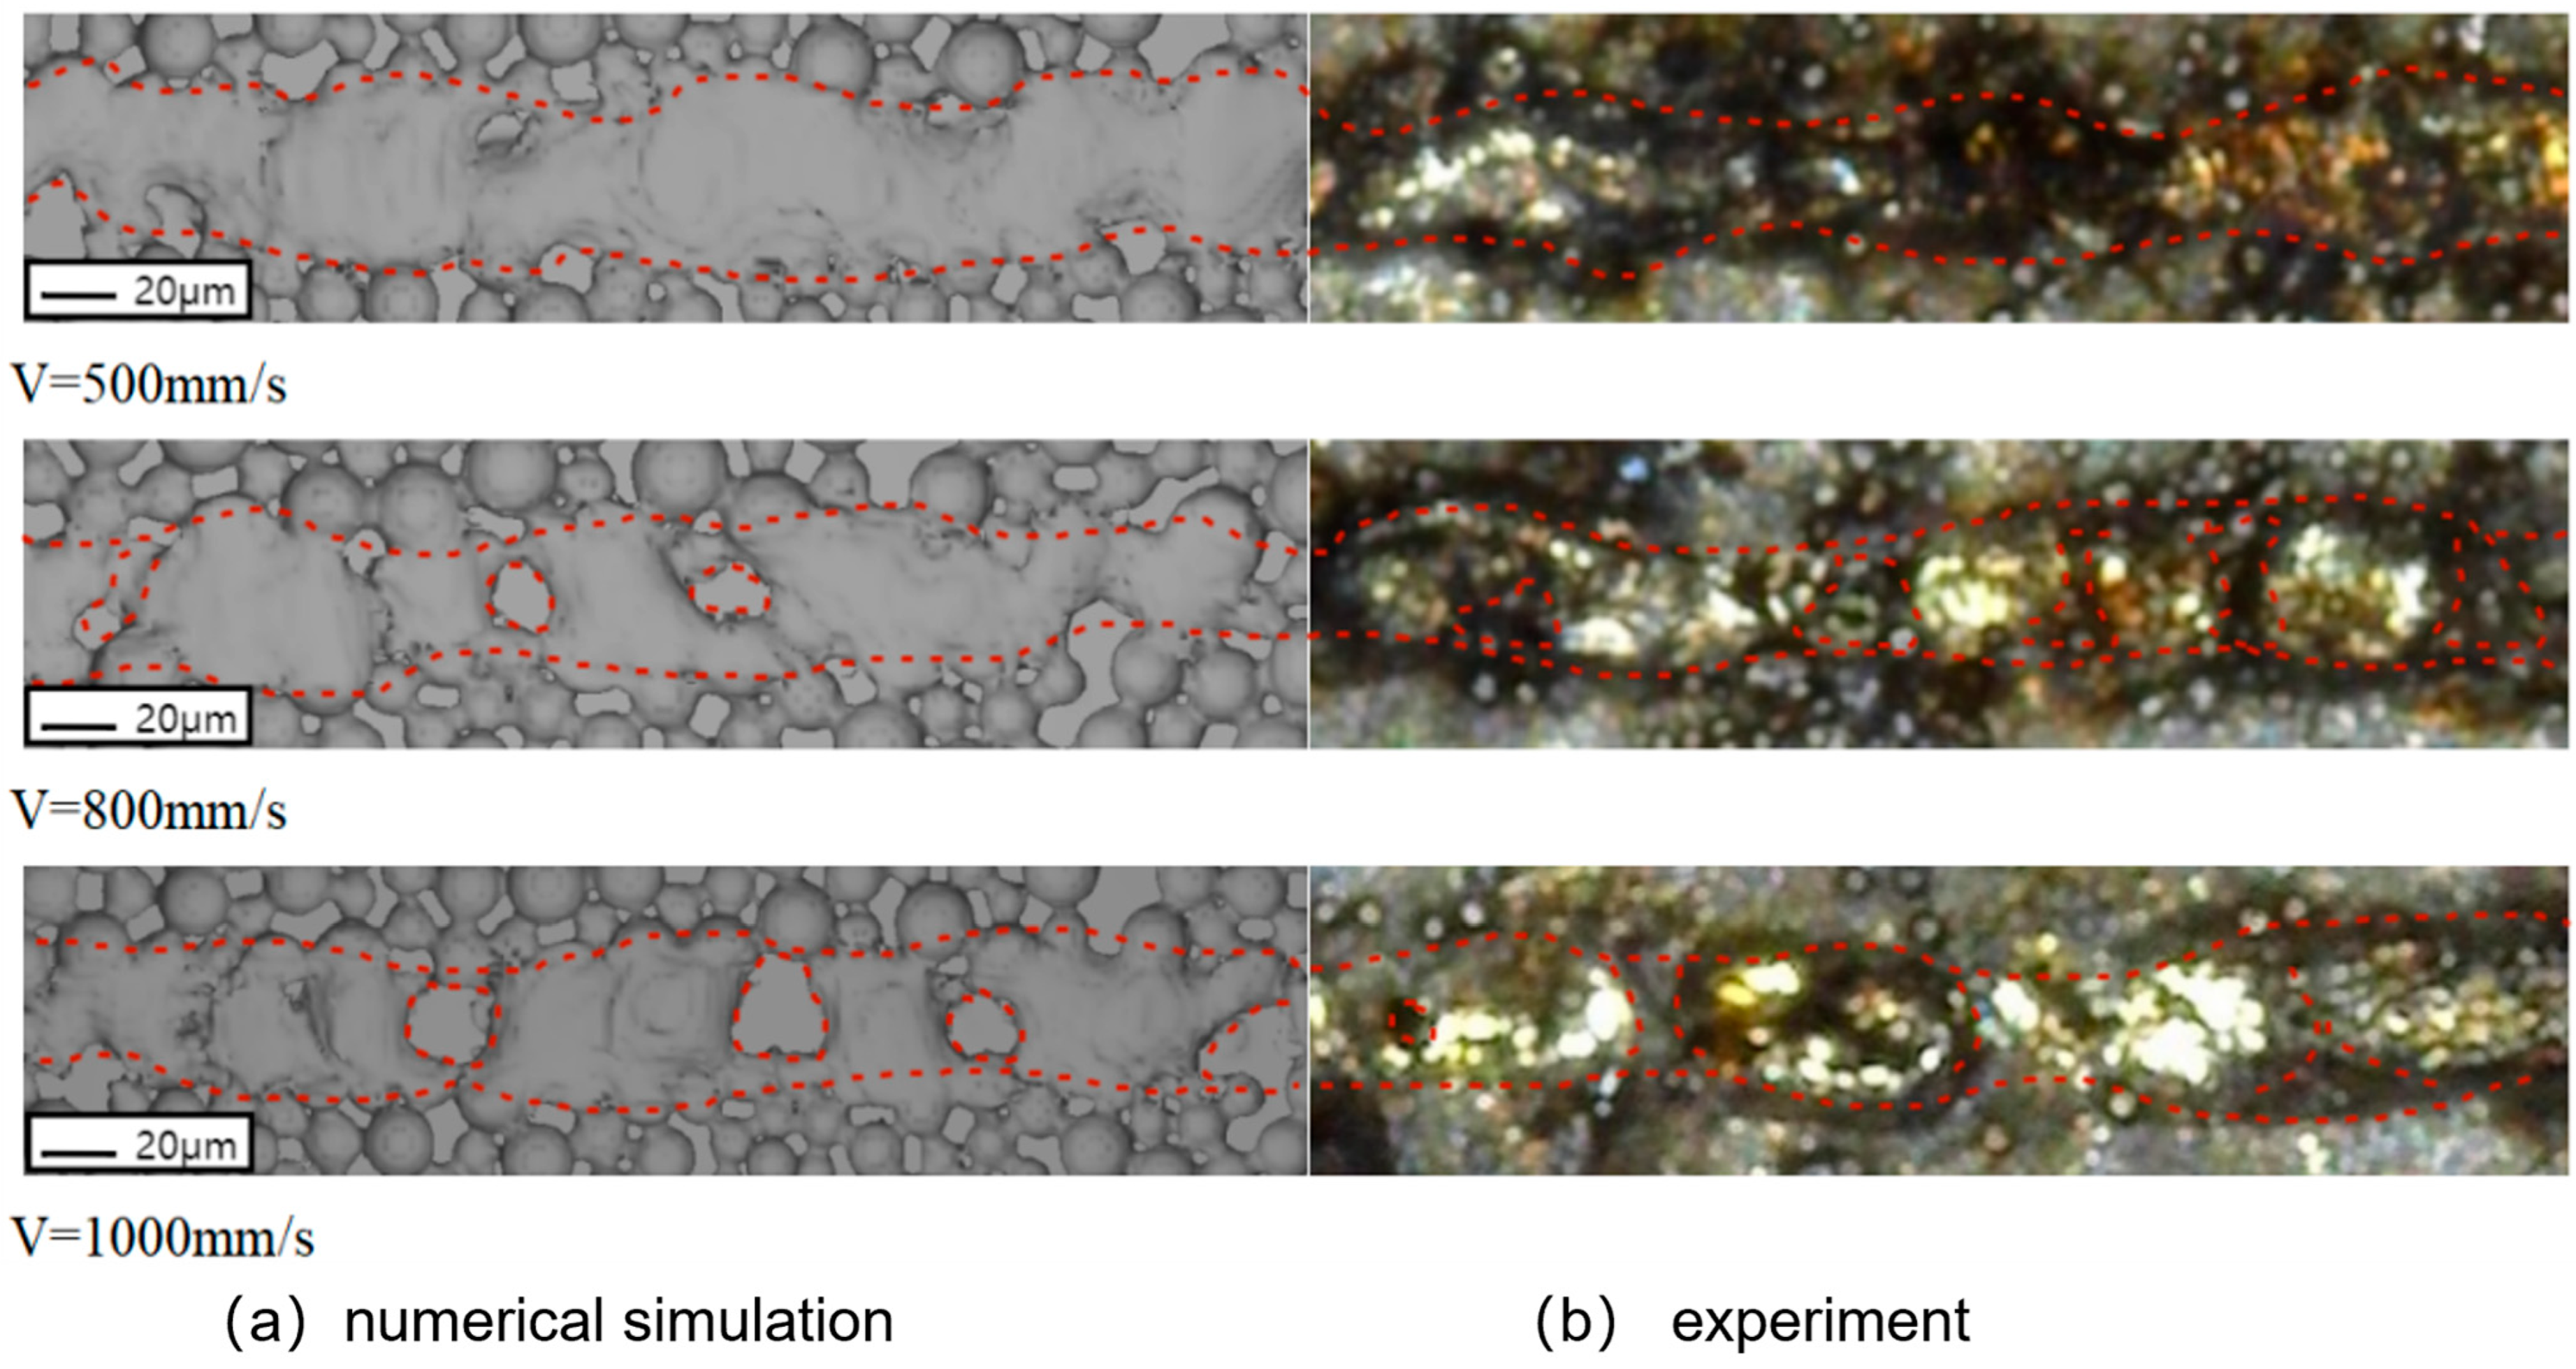
As the laser energy absorption rate of the alloy powder is unknown and in order to improve the accuracy of the numerical simulation results, the numerical simulation results of different energy absorption rates under the single- and double-melt-channel width size. The morphological features and experimental results match the comparison, determining that the energy absorption rate of the AlSi10Mg material in this numerical model is 12% and have a 100 W power single melt-channel-forming morphology, as shown in Figure 7. The numerical simulation and experimental results are in good agreement, indicating that the numerical model is reliable and valid. The left side and the right side, respectively, represent the fuse topography maps obtained by numerical simulation and experiment at different scanning speeds during the moulding process. The basic outline of the fuse is outlined by red dashed lines. The size and continuity of the fuse obtained by numerical simulation are in good agreement with the experimental results, which indicates that the numerical simulation method is reliable and effective.

3. Numerical Modelling of SLM Multiscale Melt Channel Formation

3.1. Metal Material Property Setting

The metallic material is in a metallic powder particle state before laser forming, and after laser irradiation, two solid–liquid cyclic phase transitions occur successively and cool down to a dense solid state. The physical parameter of the metallic material in the powder particle state is determined by the material porosity φ, which is commonly set by Yin [26] and others:
ρ powder ( T ) = ρ bulk ( T ) ( 1 φ ( T ) )
k powder ( T ) = k bulk ( T ) ( 1 φ ( T ) ) 4
where φ(T) is defined as the porosity as a function of temperature.
φ ( T ) = φ 0 , T 0 < T < T s φ 0 T T m T s T m , T s < T < T l 0 , T l < T
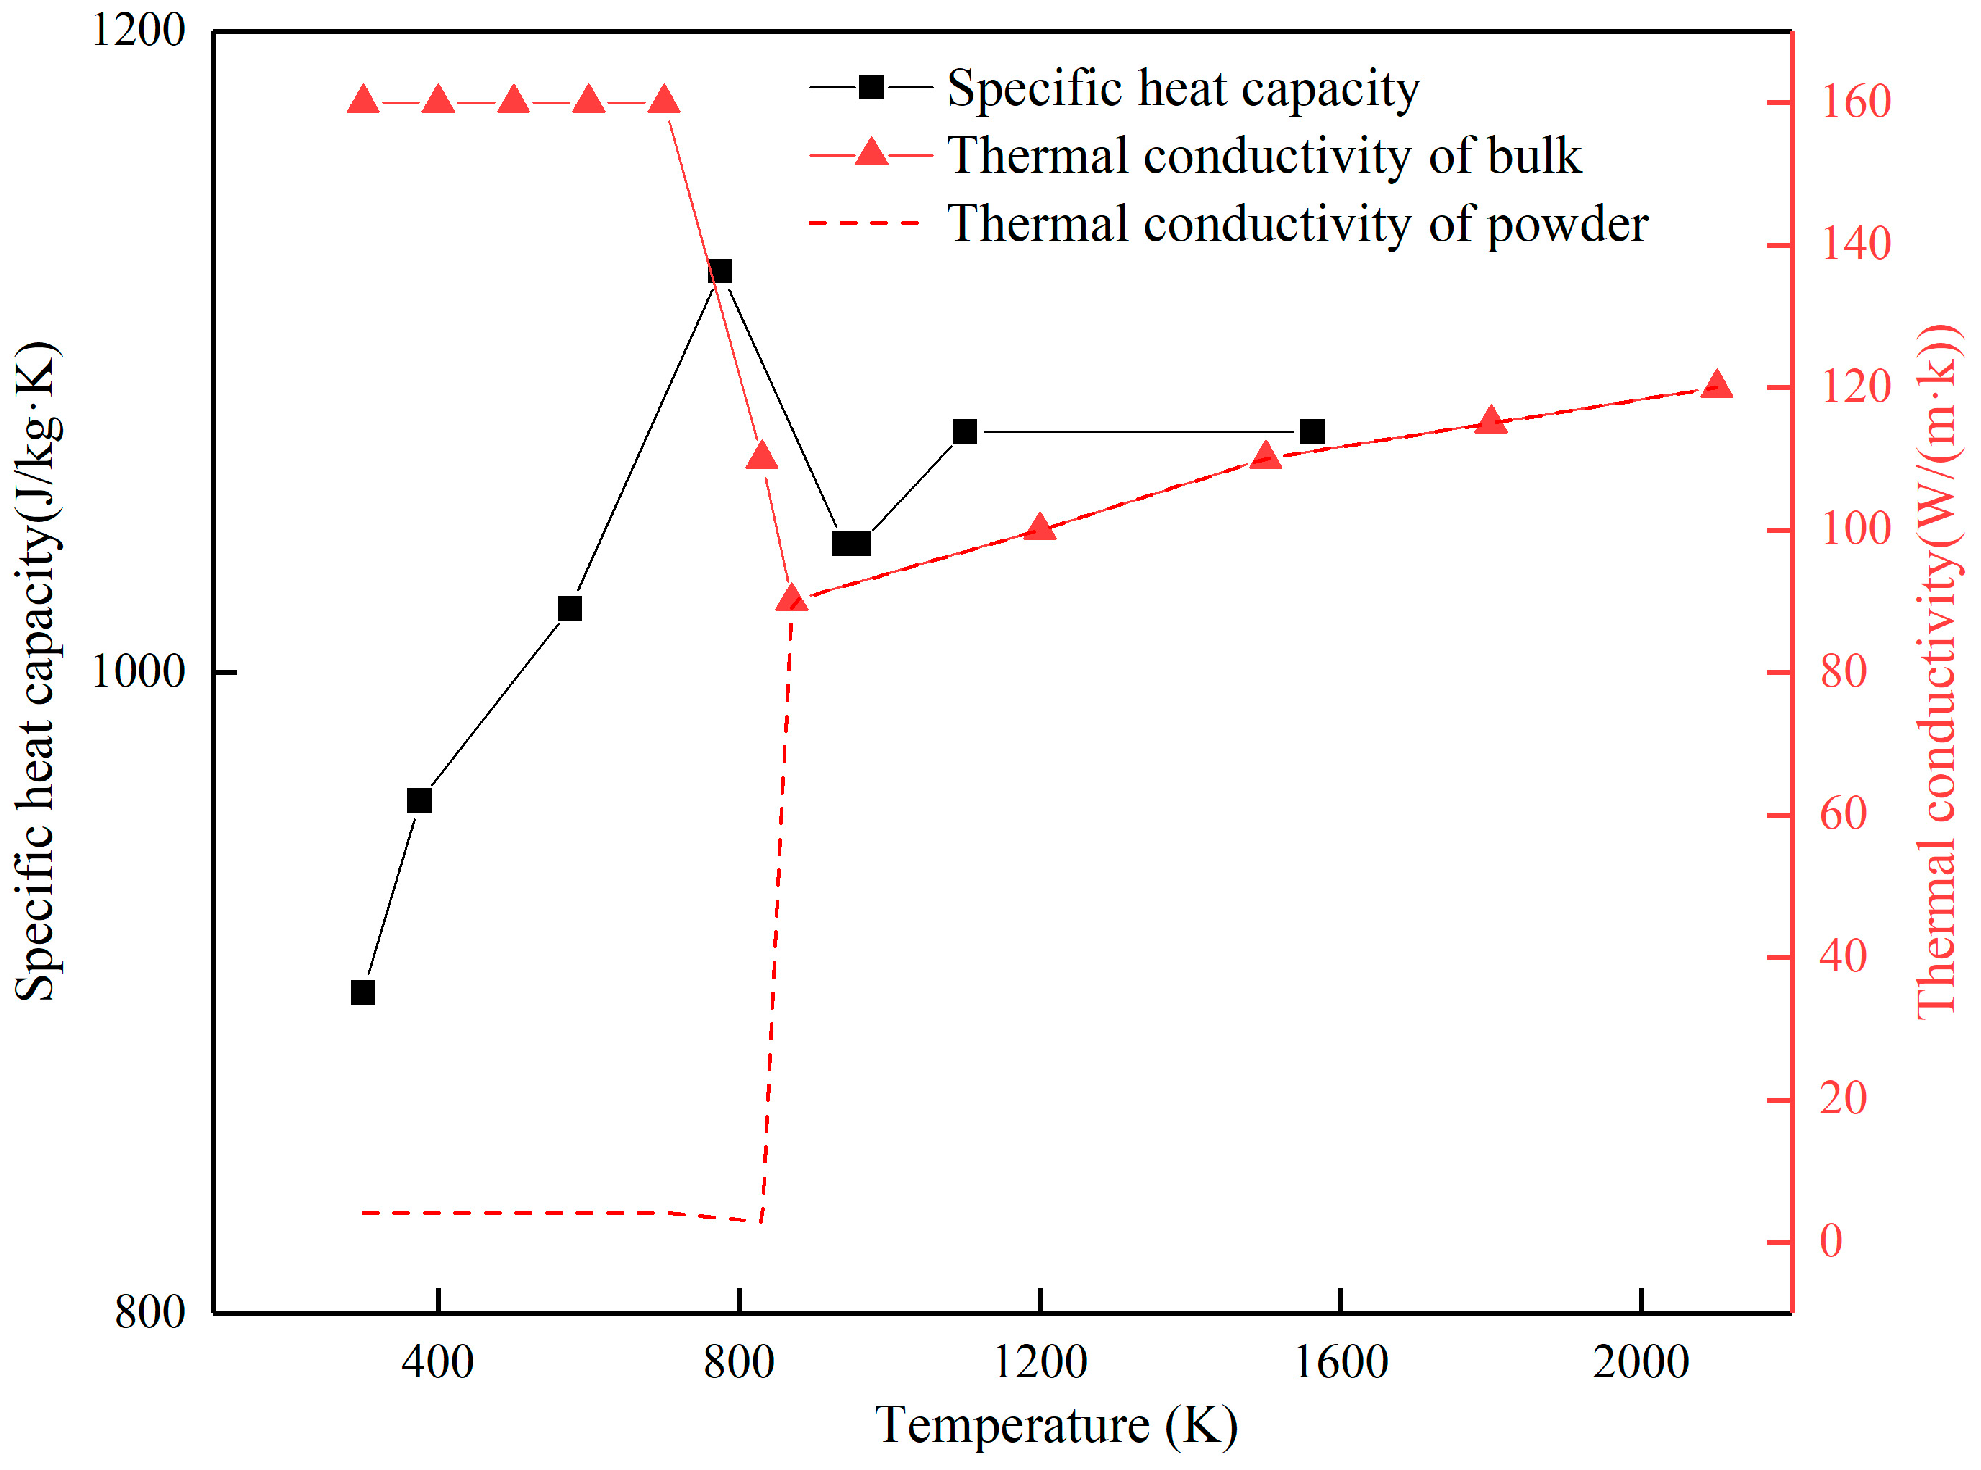
where φ0 is the initial porosity, which is the porosity to reach the solid–liquid phase line temperature point when the change occurs, higher than the melting point of the material takes the value of 0; that is, when the metal powder is completely melted, the physical parameters take the value of the material’s intrinsic value. In this paper, the study of a heat transfer model, ignoring the impact of changes in material density, only the thermal conductivity of the material with its state of change is considered. When solid–liquid phase change occurs, it is regarded as additional latent heat for calculation by changing the specific heat capacity of the material, and the parameters of specific heat capacity and thermal conductivity of the material without considering the latent heat of phase change are set as shown in Figure 8.

3.2. Melt Pool Mobility Equivalent

The surface tension of the molten metal pool and its Marangoni effect can be calculated directly within the high-fidelity fluid model, but the fluid state of the molten pool cannot be obtained and calculated in this finite-element model of heat transfer, and the influence of the Marangoni effect on the heat transfer process needs to be taken into account in order to improve the accuracy of the numerical simulation. In their numerical simulation of the laser-welding process, Lampa [27] et al. first suggested that the effects of the Marangoni effect could be modelled by increasing the thermal conductivity of the metal’s liquid phase, which was experimentally verified, and this method was subsequently applied to the finite-element numerical simulation of laser additive manufacturing technology by Nikam [28,29] et al.
In this study, a correction factor Cm is used to control the thermal conductivity of the material in the liquid phase state to simulate the effect of the Marangoni effect. When the temperature is higher than the liquid phase point, the thermal conductivity of the material becomes Cm times the intrinsic parameter, and the value of the correction factor Cm for the AlSi10Mg material in this study is determined via comparative validation to be 1.8.
In order to estimate the influence of the Marangoni effect on the heat transfer process in the molten pool, which is characterised here using the dimensionless number Ma,
M a = d σ d T w Δ T μ α
where w is the width of the melt pool, ΔT is the difference between the peak temperature of the melt pool and the liquid phase point, μ is the dynamic viscosity, and α is the thermal diffusion coefficient, which is related to the thermal conductivity and specific heat capacity of the material. Larger values of Ma indicate that the Marangoni convection effect is more pronounced compared with free diffusion, and smaller values of Ma indicate that the Marangoni effect has less influence on the heat transfer process in the melt pool.

3.3. Pore Modelling in Sedimentary Regions

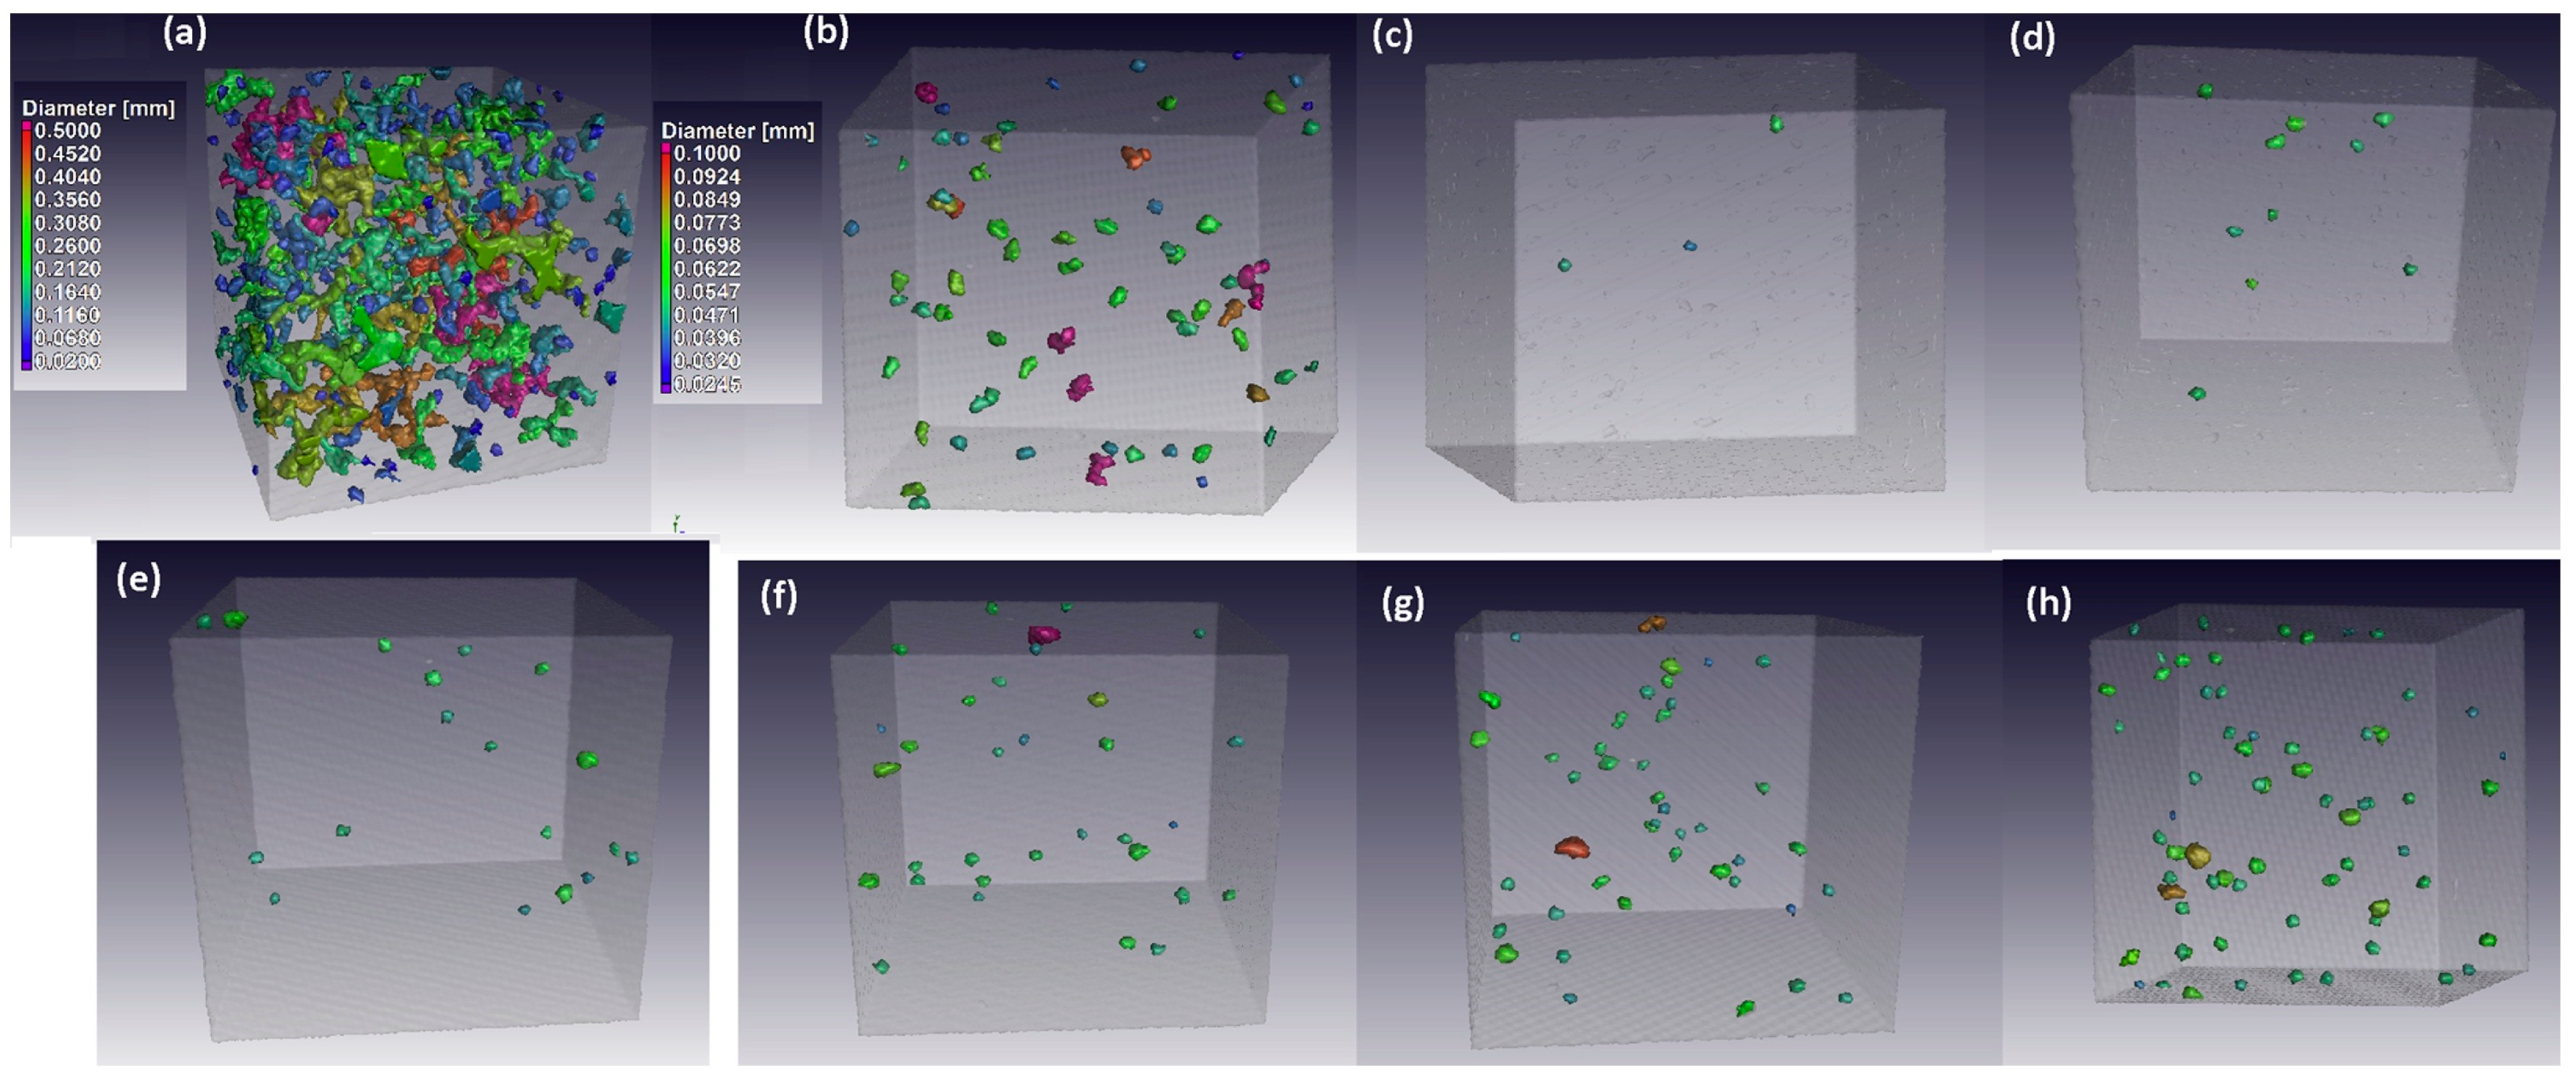
Plessis [30] used X-ray tomography to establish a structural three-dimensional image of the Ti-6Al-4V alloy and carried out a comprehensive experimental study on the pore formation mechanism as shown in Figure 9. It was found that the pore morphology was mainly classified into three kinds of pore forms based on different formation mechanisms, including irregular and long pores formed due to insufficient fusion of the material; spherical pores formed by alloy vapours or protective gases that did not escape in time; and keyholes formed by incomplete filling of molten pool depressions at high-energy densities. In order to reflect the defects and inhomogeneities after laser forming, this study uses random non-uniform material data and interpolates the phase-transformed unitary material, which is used to describe the voids and inhomogeneities randomly appearing in the material structure after laser forming.
A stochastic function is defined in three dimensions by triple summation in three dimensions:
f ( x , y , z ) = k = K K l = L L m = M M a ( k , l , m ) cos ( 2 π ( k x + l y + m z ) + φ ( k , l , m ) )
a ( k , l , m ) = g ( k , l , m ) h ( k , l , m ) = g ( k , l , m ) k 2 + l 2 + m 2 β / 2
where g(k,l,m) is the amplitude coefficient with normal distribution, h(k,l,m) is the amplitude with frequency dependent amplitude, and φ(k,l,m) is the phase angle with a uniform random distribution. K, L, and M are integers corresponding to the maximum frequency in each direction. β is the spectral index, which determines the smoothness of the generated data; the larger its value, the smoother the obtained data.
The function is based on fractal image theory, calculates a random spatial data set, sets the spatial frequency resolution and spectral index according to the demand and calculates to obtain the spatial-random function f(x,y,z), and then adopts Boolean operation to transform the computed random inhomogeneous data into binary data, which are used to simulate air–metal materials after the phase transition, and the parameters are finally defined as:
k * = k intrinsic ( k intrinsic k air ) [ f ( x , y , z ) > p ]
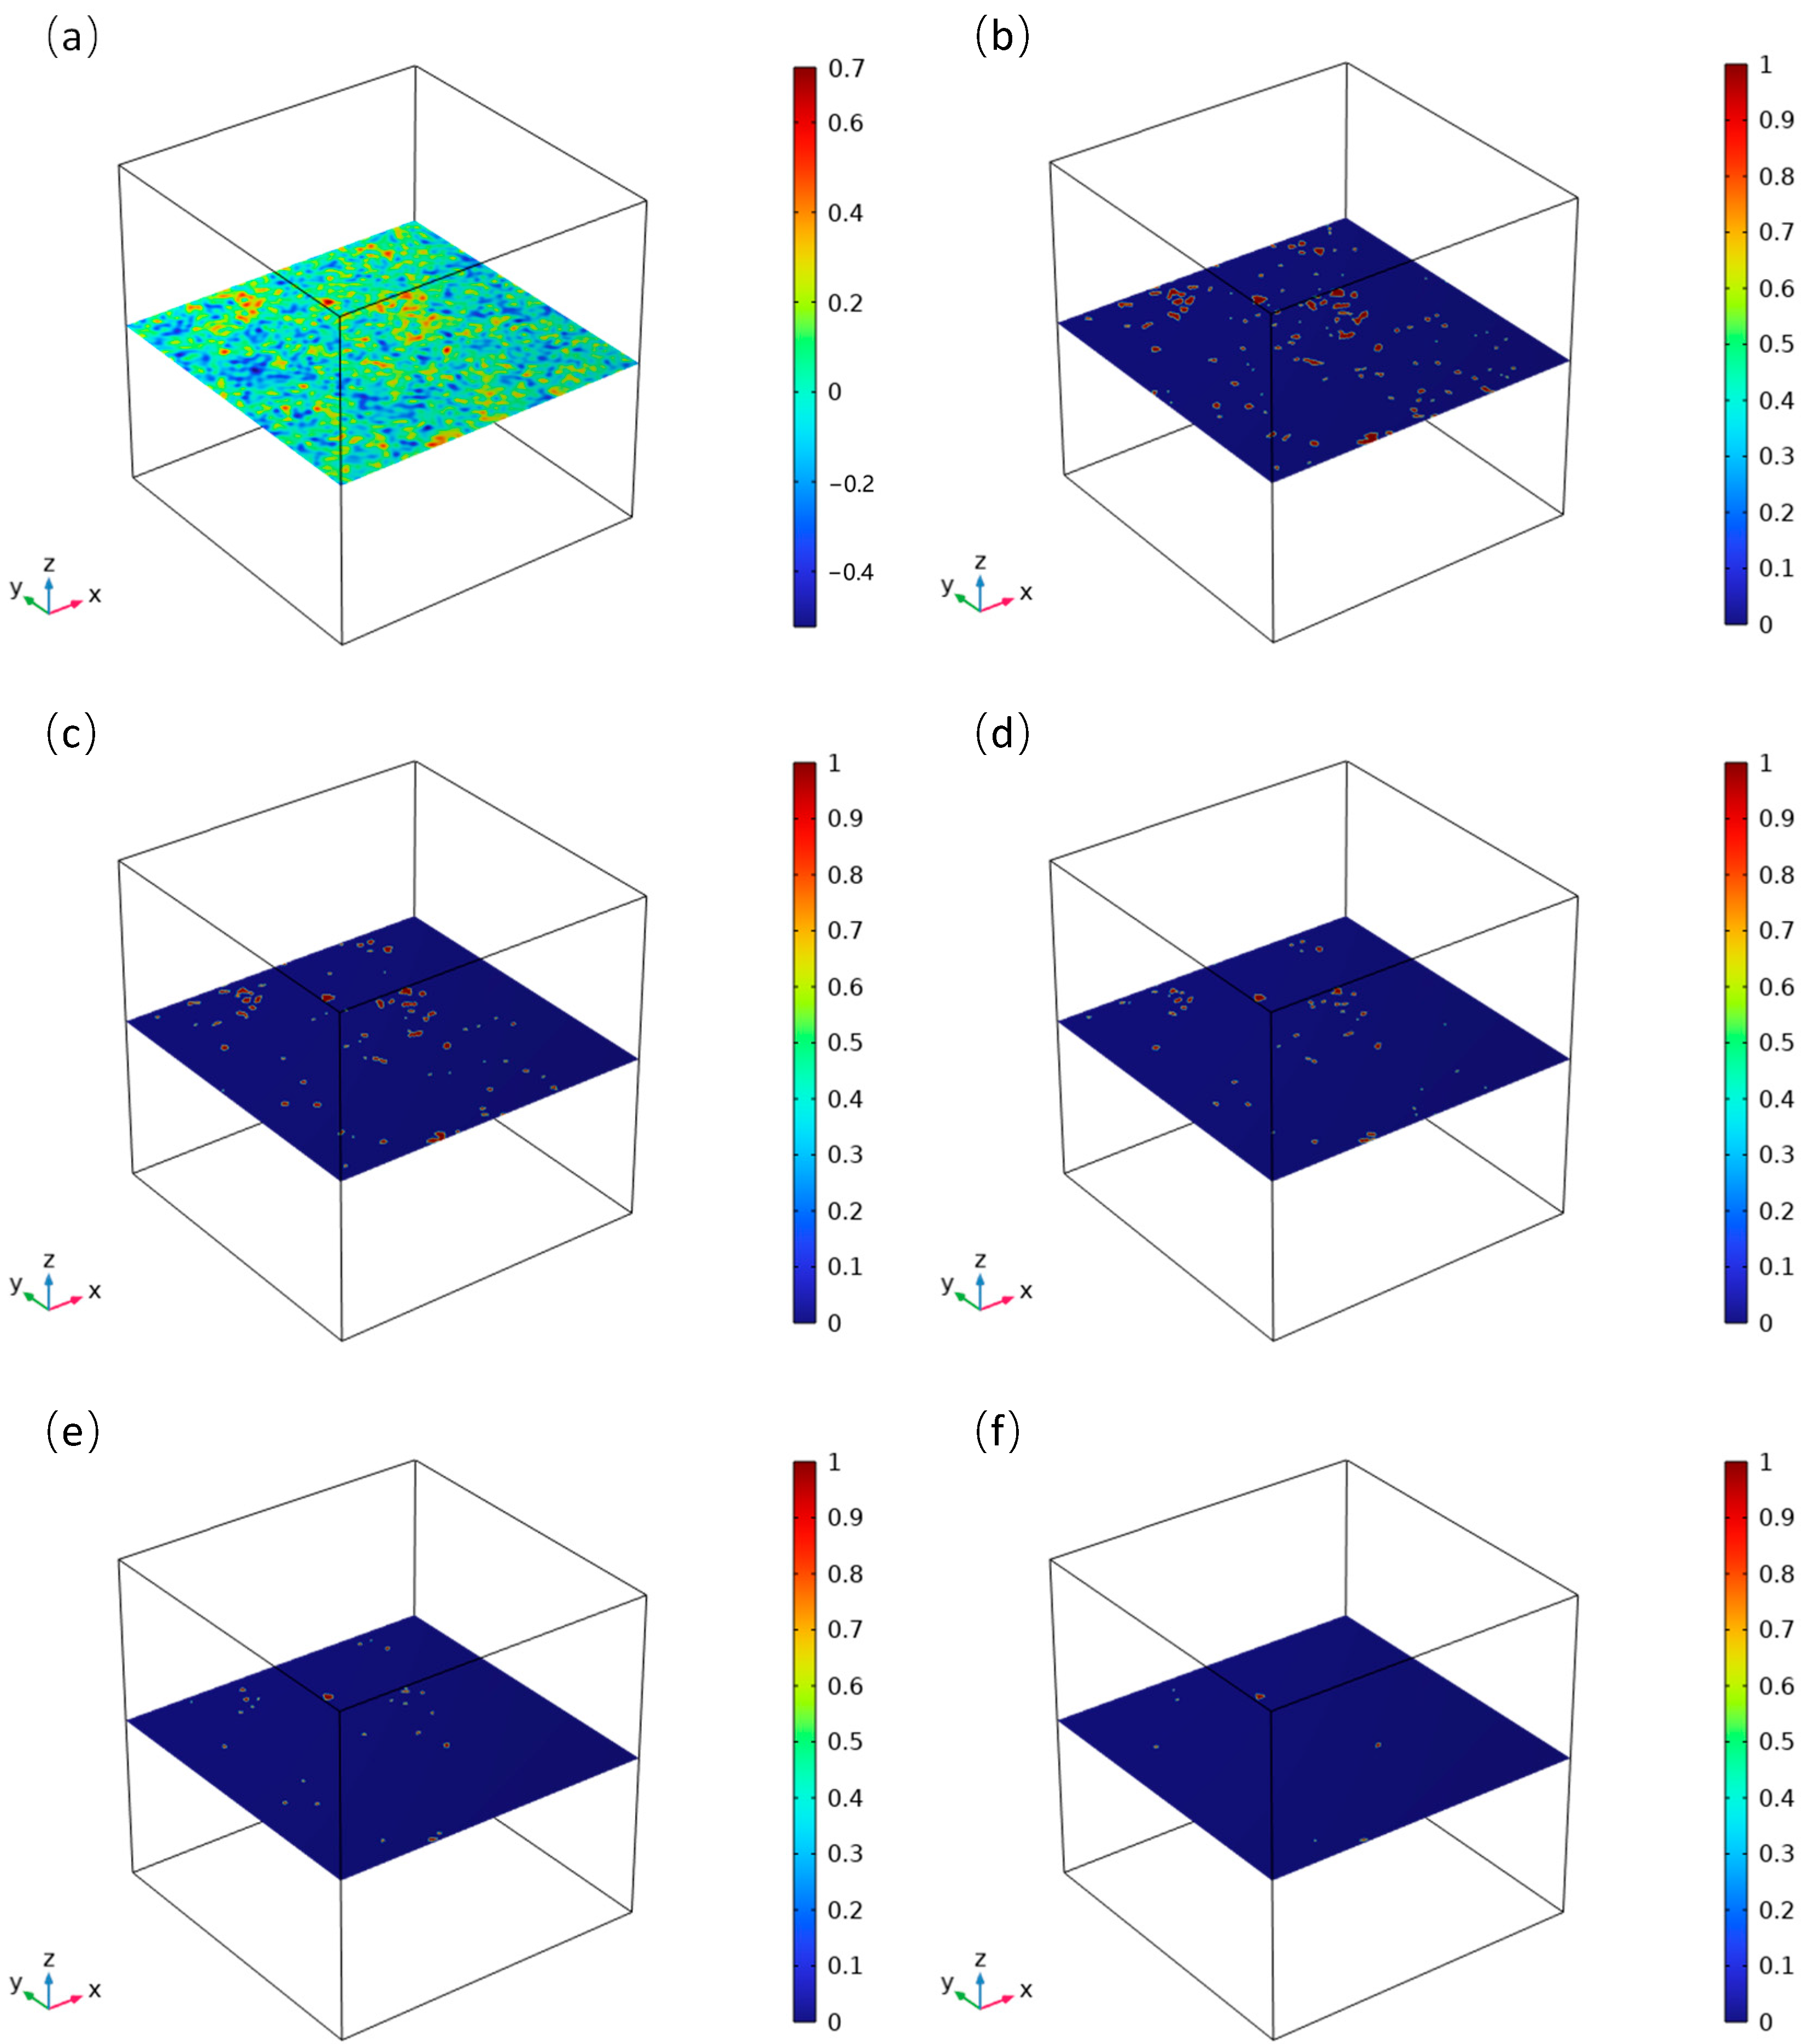
When the value of the stochastic function is greater than the threshold p, the material corresponds to the air parameter, and when the value is less than the threshold p, the material corresponds to the metal intrinsic parameter, and thus, the material porosity can be controlled by adjusting the size of the value of p in Equation (16). Figure 10 shows the results of the random data set slices obtained with a different threshold, p. Different processing results can be selected according to the different porosities of the material-forming structure. The material parameter setting is controlled by the temperature function, and when the cell temperature is greater than the solid–liquid phase transition point of the material and the value of the first-order derivative of the time is greater than 0, the material is transformed from the powder state to the pore model parameter.

3.4. Establishment of SLM Multilayer Melt-Channel-Forming Process

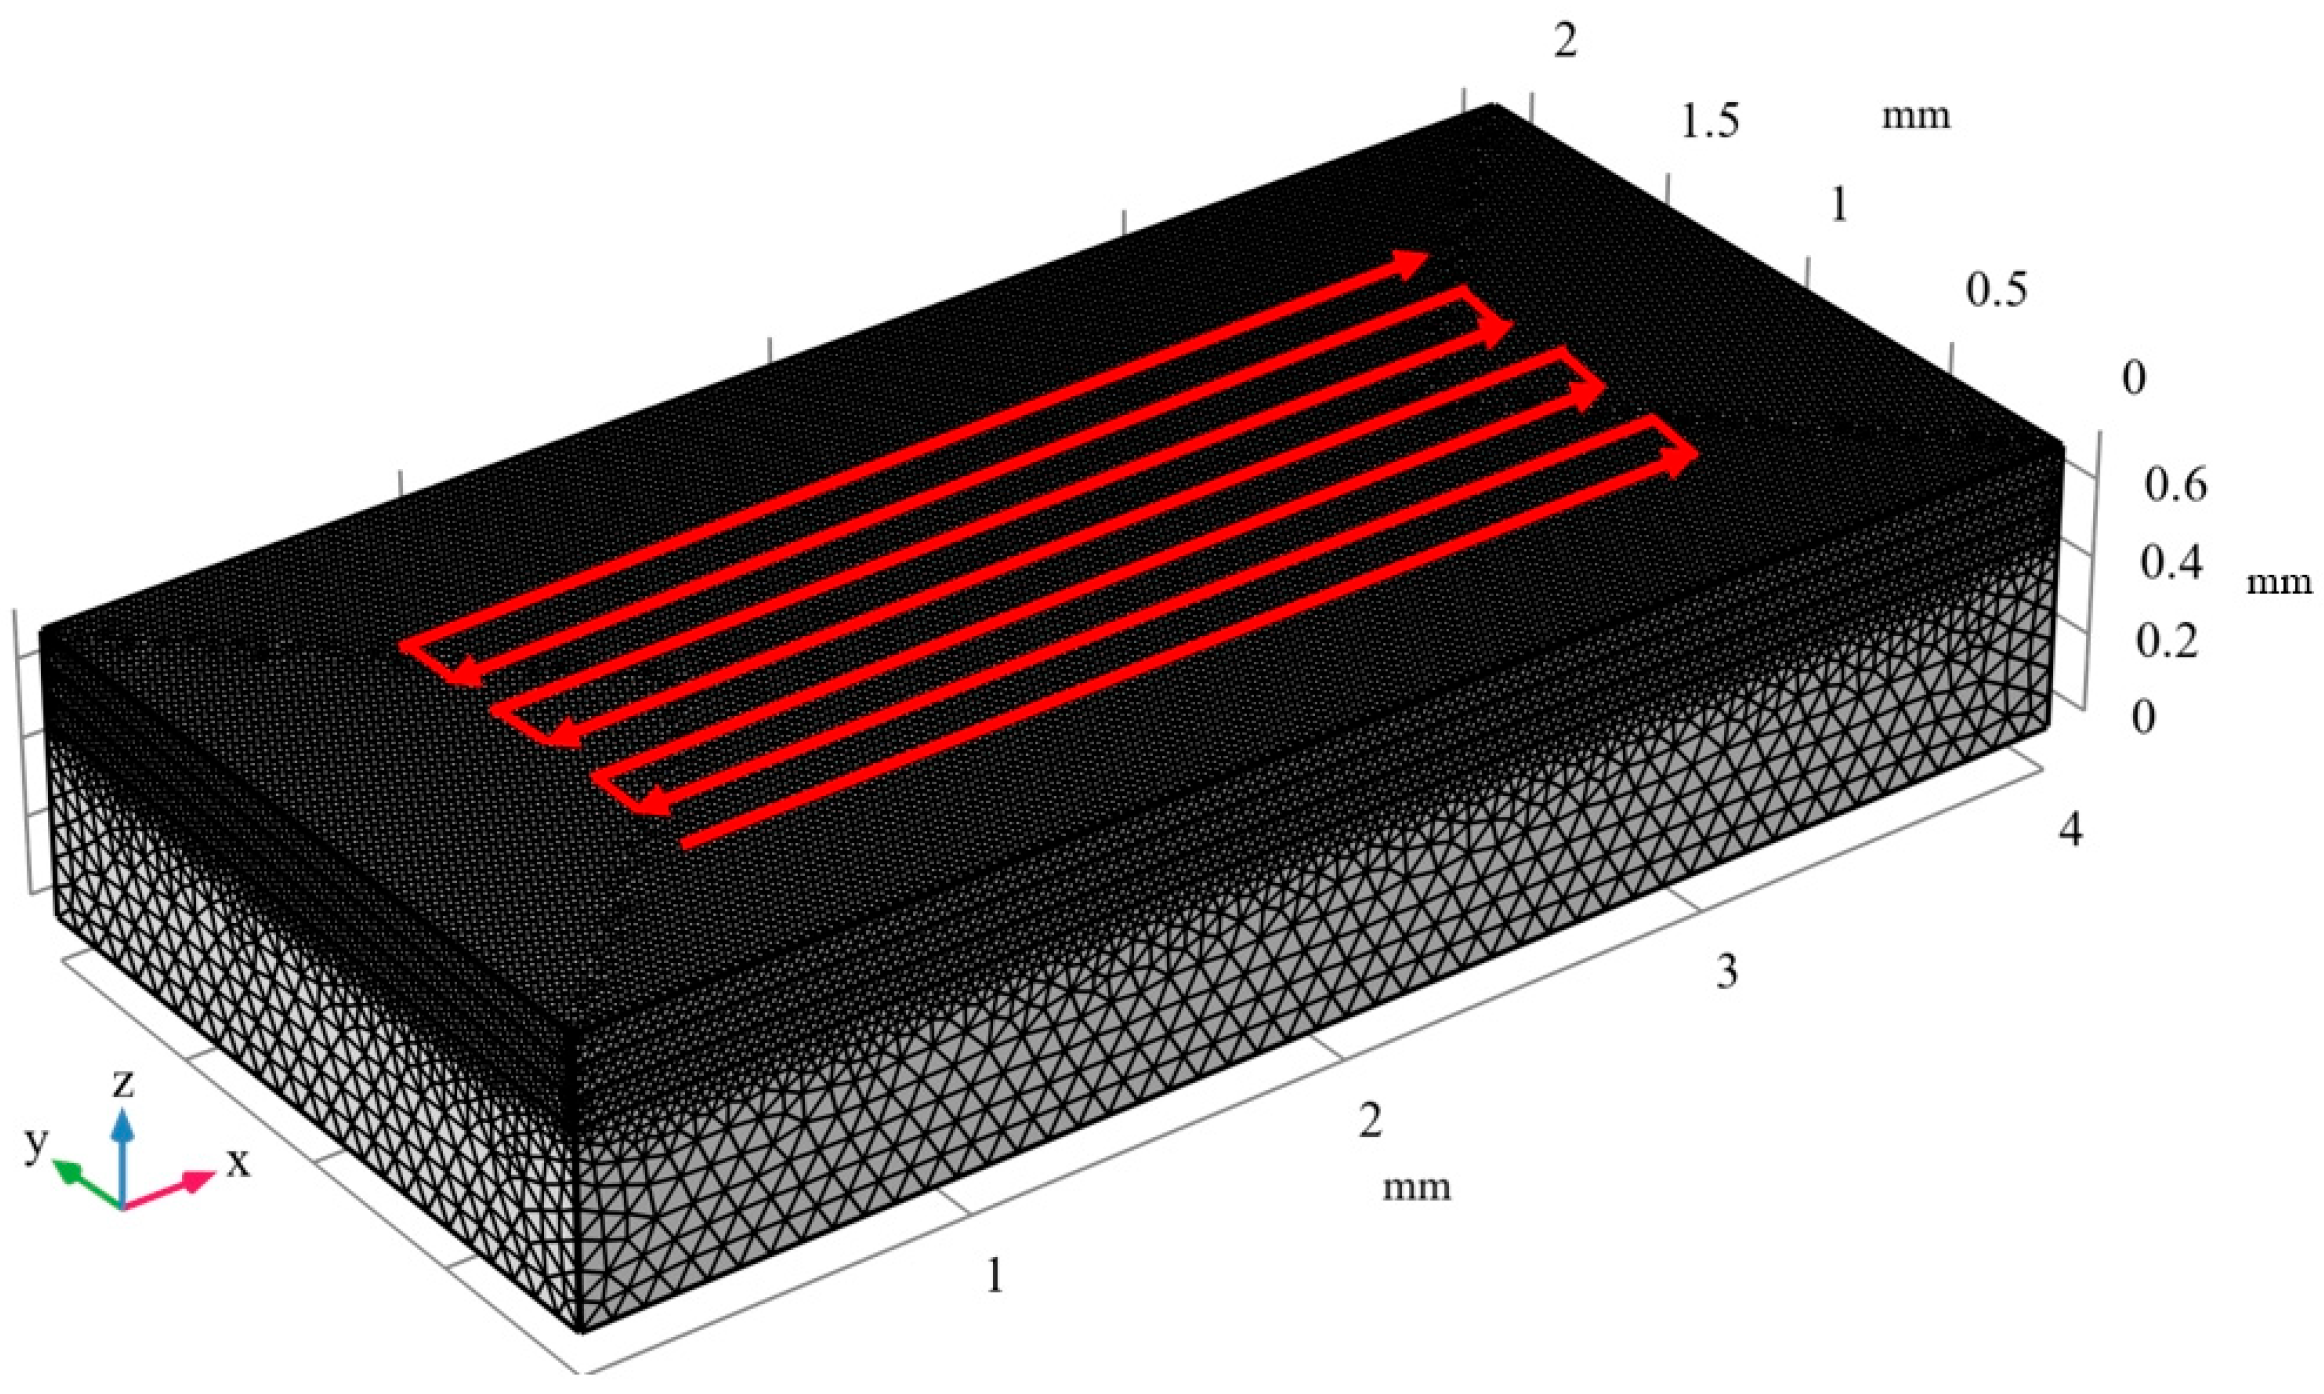
SLM multilayer melt-channel-forming finite-element geometric model includes the substrate and powder bed, the basic dimensions, and mesh division as shown in Figure 11; the substrate and powder bed length and width are 4 mm and 2 mm, respectively, the substrate thickness is 0.5 mm, and the thickness of the powder layer is 0.075 mm. The calculation is set up by scanning four layers, with the use of tetrahedral mesh fast division. After mesh independence analysis, the maximum size of the powder bed mesh was set to 30 μm, and the maximum size of the substrate mesh was set to 80 μm.
The grid division and the path of the laser heat source is shown as the red line in Figure 11, and each layer of the powder bed is set to scan seven adjacent tracks. The track spacing is set to 100 μm, in accordance with the serpentine scanning strategy, in order from the first to the last. The laser energy is loaded on the surface of the powder bed in the manner of the Gaussian heat flux, the centre of the heat source through the in-plane time-domain function of the track and the scanning speed of the laser. The laser is used to scan the surface of the powder bed. The laser power was set to 300 W and the scanning speed to 1500 mm/s. The melt path formed by scanning under this path did not spread over the whole powder bed plane, retaining the powder nature of some materials in its outer rim area.
The bottom of the geometric model substrate adopts constant temperature boundary; the top surface is set with a Gaussian moving heat source input, thermal radiation loss, and evaporation loss; the setting method and parameters are consistent with the previous heat–flow coupling model; the side surface adopts the boundary conditions of radiative and convective heat dissipation; and the convective heat transfer coefficient is set to be equal to the value set in the previous section.
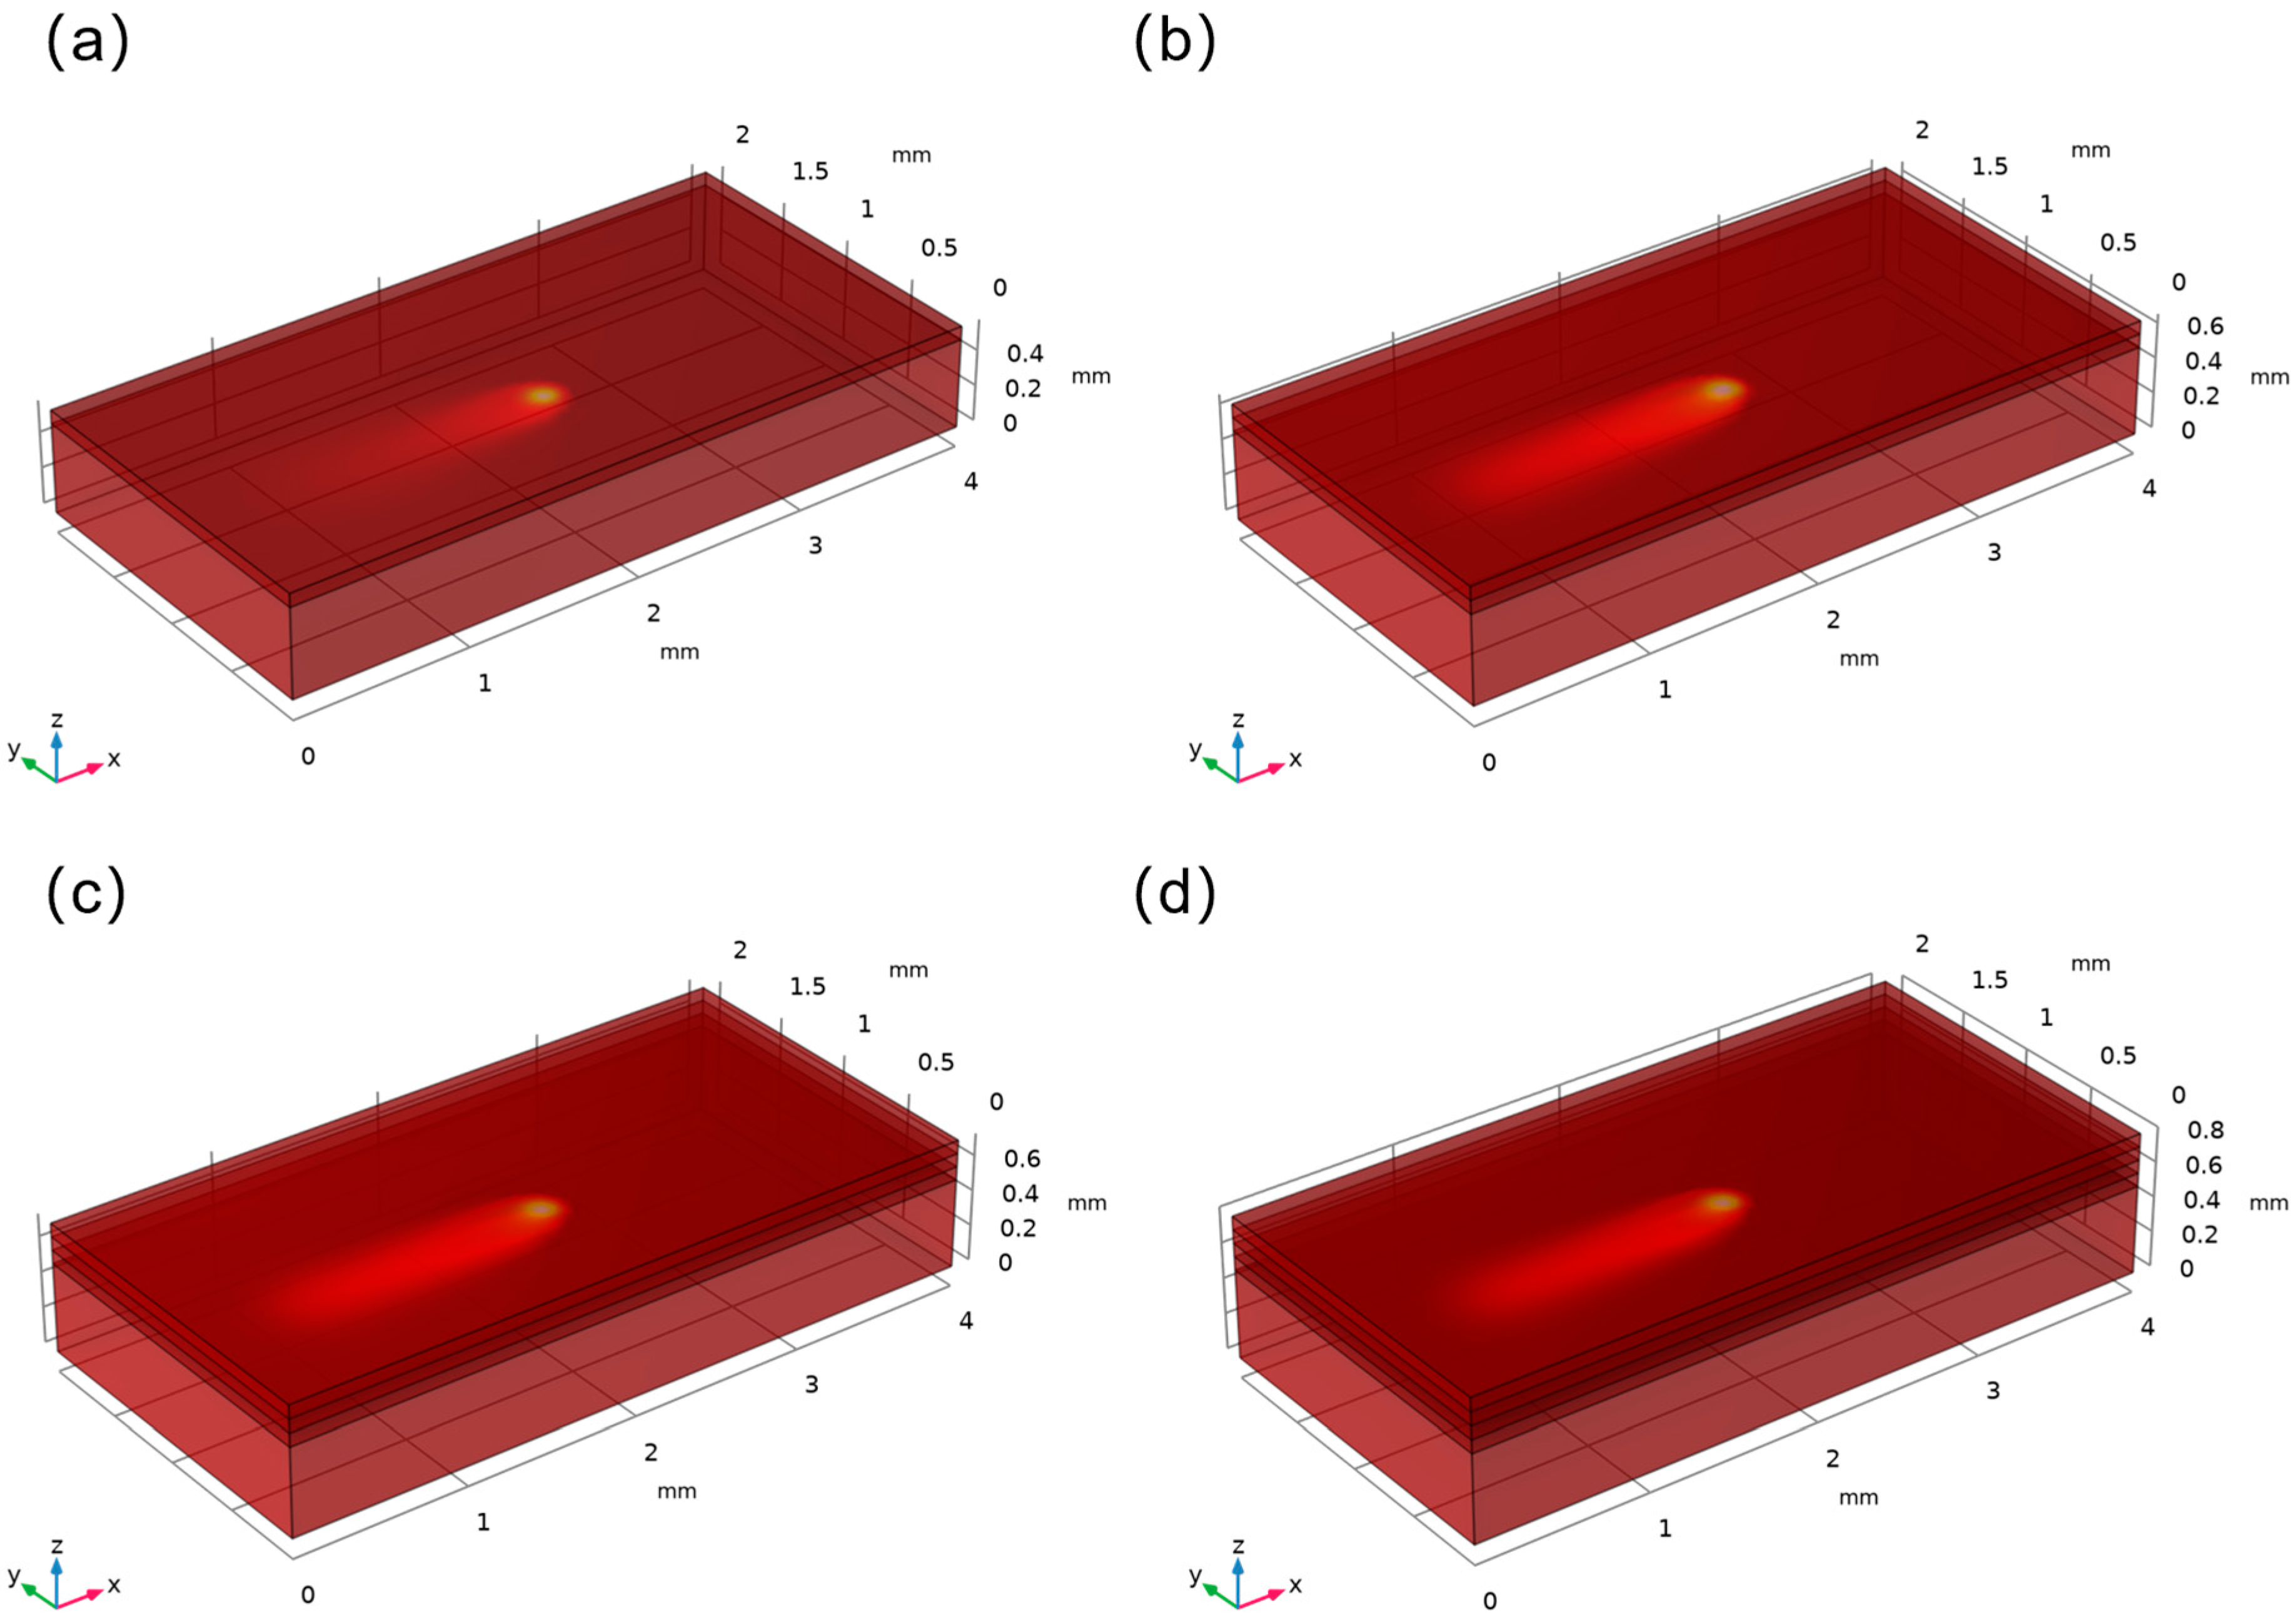
Compared with the use of a high-fidelity heat–fluid coupling model for SLM multilayer scanning process research, the finite-element method for establishing the heat transfer model does not need to consider laser scanning on the powder bed surface’s topographic structure. The advantages of the model can be used in commercial software such as Ansys or Abaqus, using the birth–death cell technology for SLM multilayer melt-channel-forming process model building. In this study, in order to simulate the laying and calculation of a new powder bed, multiple solvers were used to set up different layers of powder in sequence, starting with the calculation from the first layer of powder bed scanning and sequentially using the calculation results of the nth layer after the scanning and shaping of the nth layer as the initial conditions for the n + 1th layer of powder bed scanning, so as to obtain the results of the multilayered fusion channel shaping as shown in Figure 12.

3.5. Validation of Numerical Simulation of SLM Multiscale Melt Channel Formation

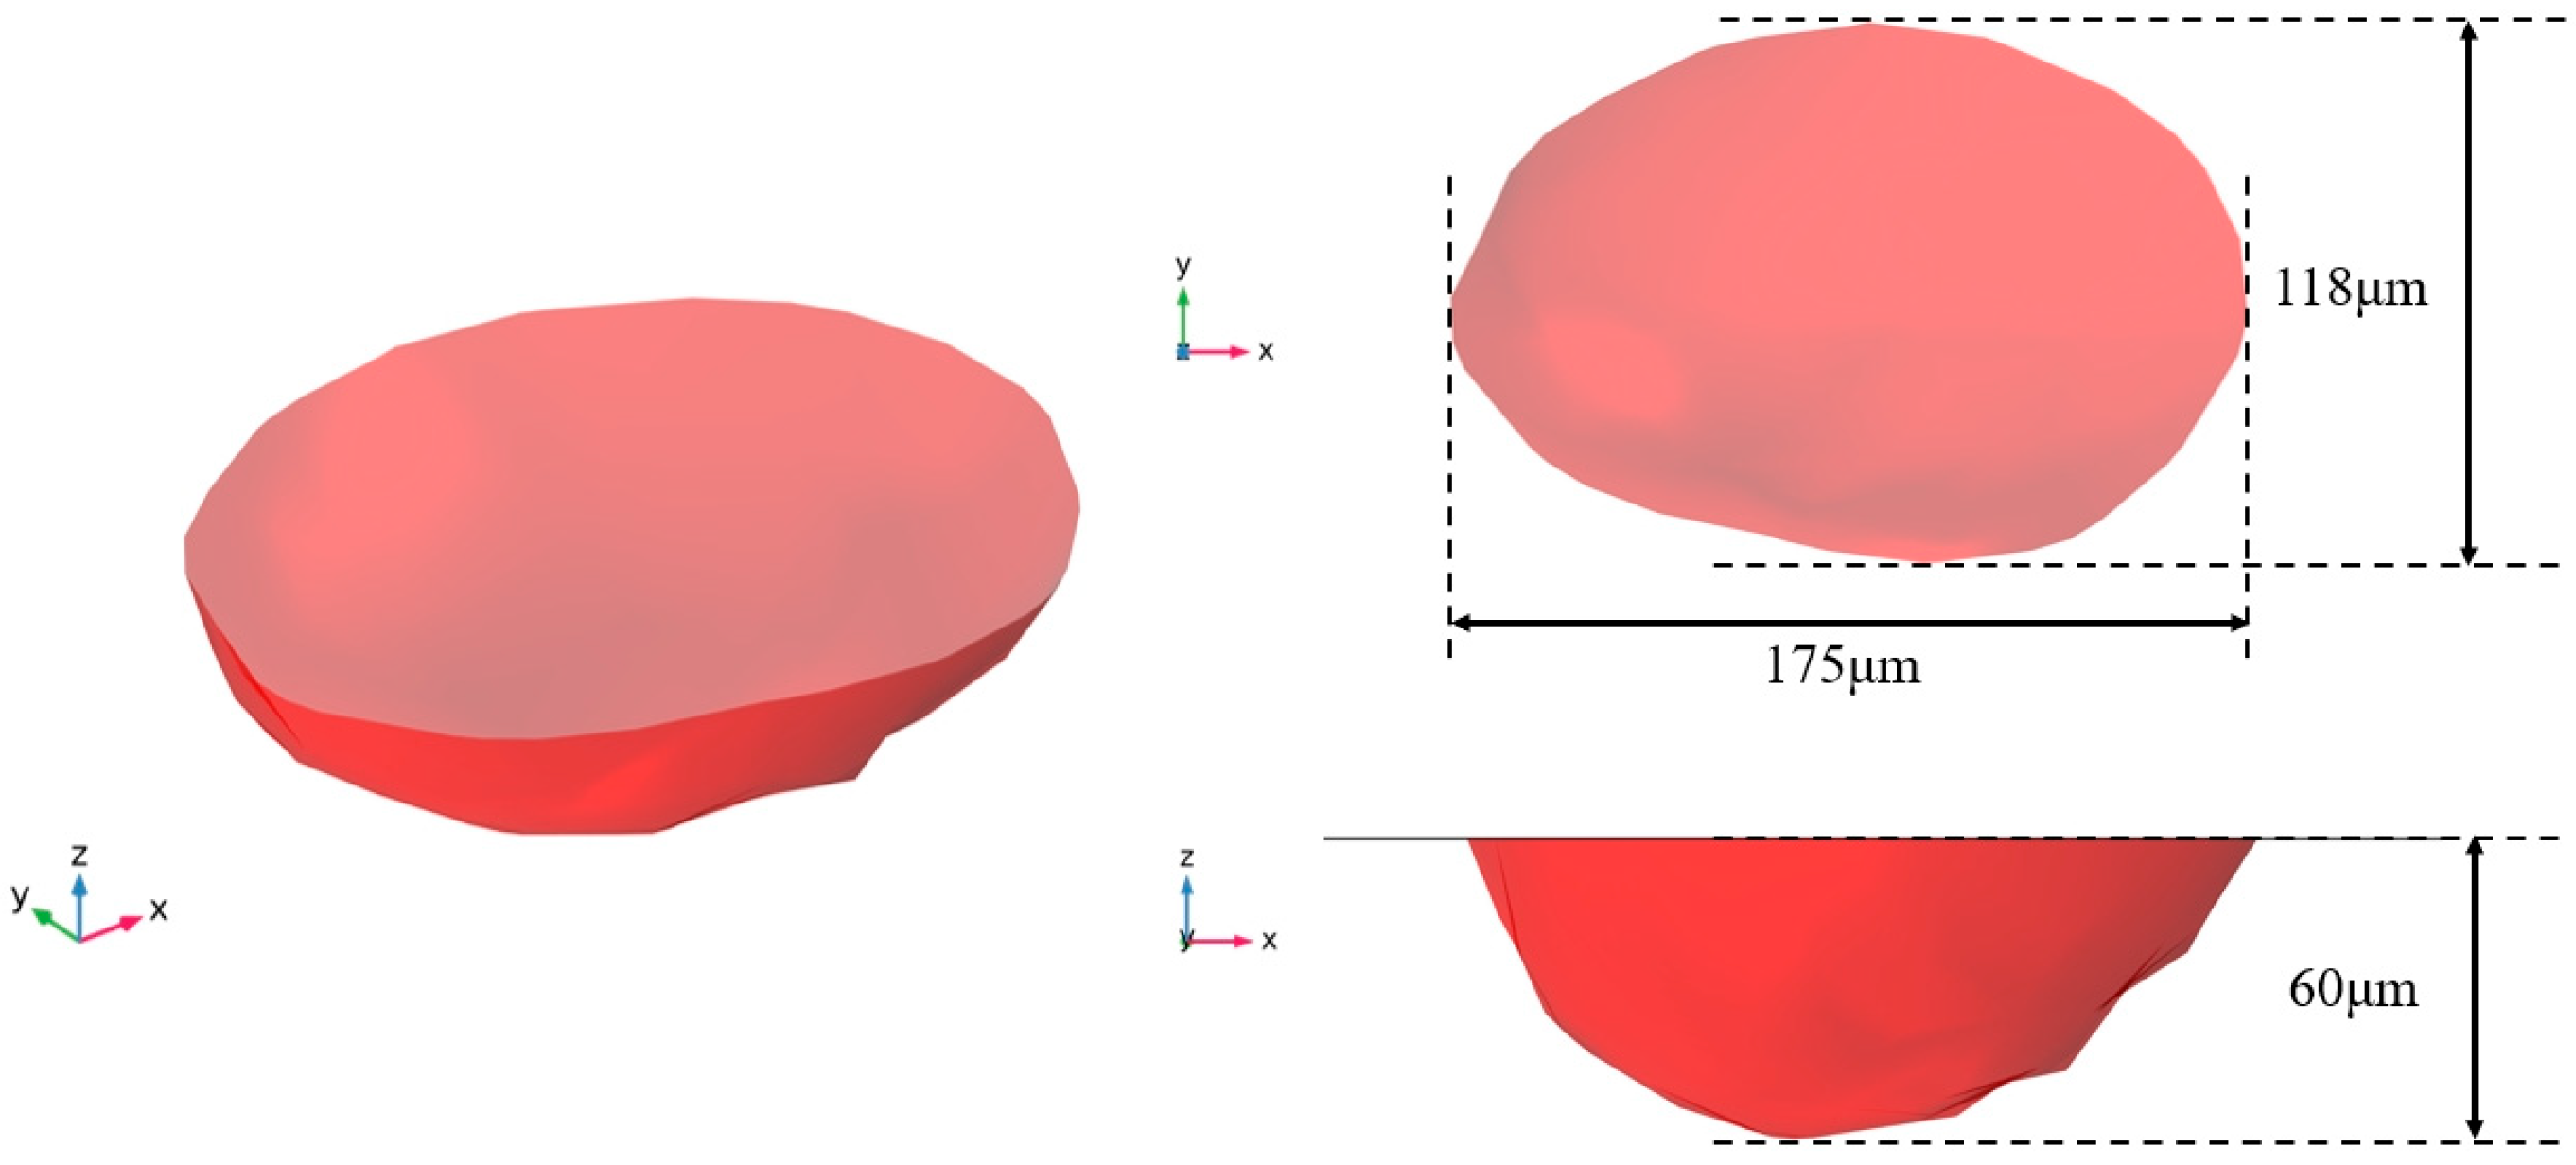
The temperature-equivalent surface is plotted in the calculation results, and the reference temperature is set to be 830 K at the liquid phase point of the material, so that the specific appearance of the melt pool during the scanning process can be obtained. Figure 13 shows the appearance of the melt pool at the moment of the first layer of the powder bed in the multiscale model at the moment of 0.24 ms, with a melt pool length of 118 μm, width of 175 μm, and depth of 60 μm. The upper surface of the melt pool is elliptical, without trailing phenomena.
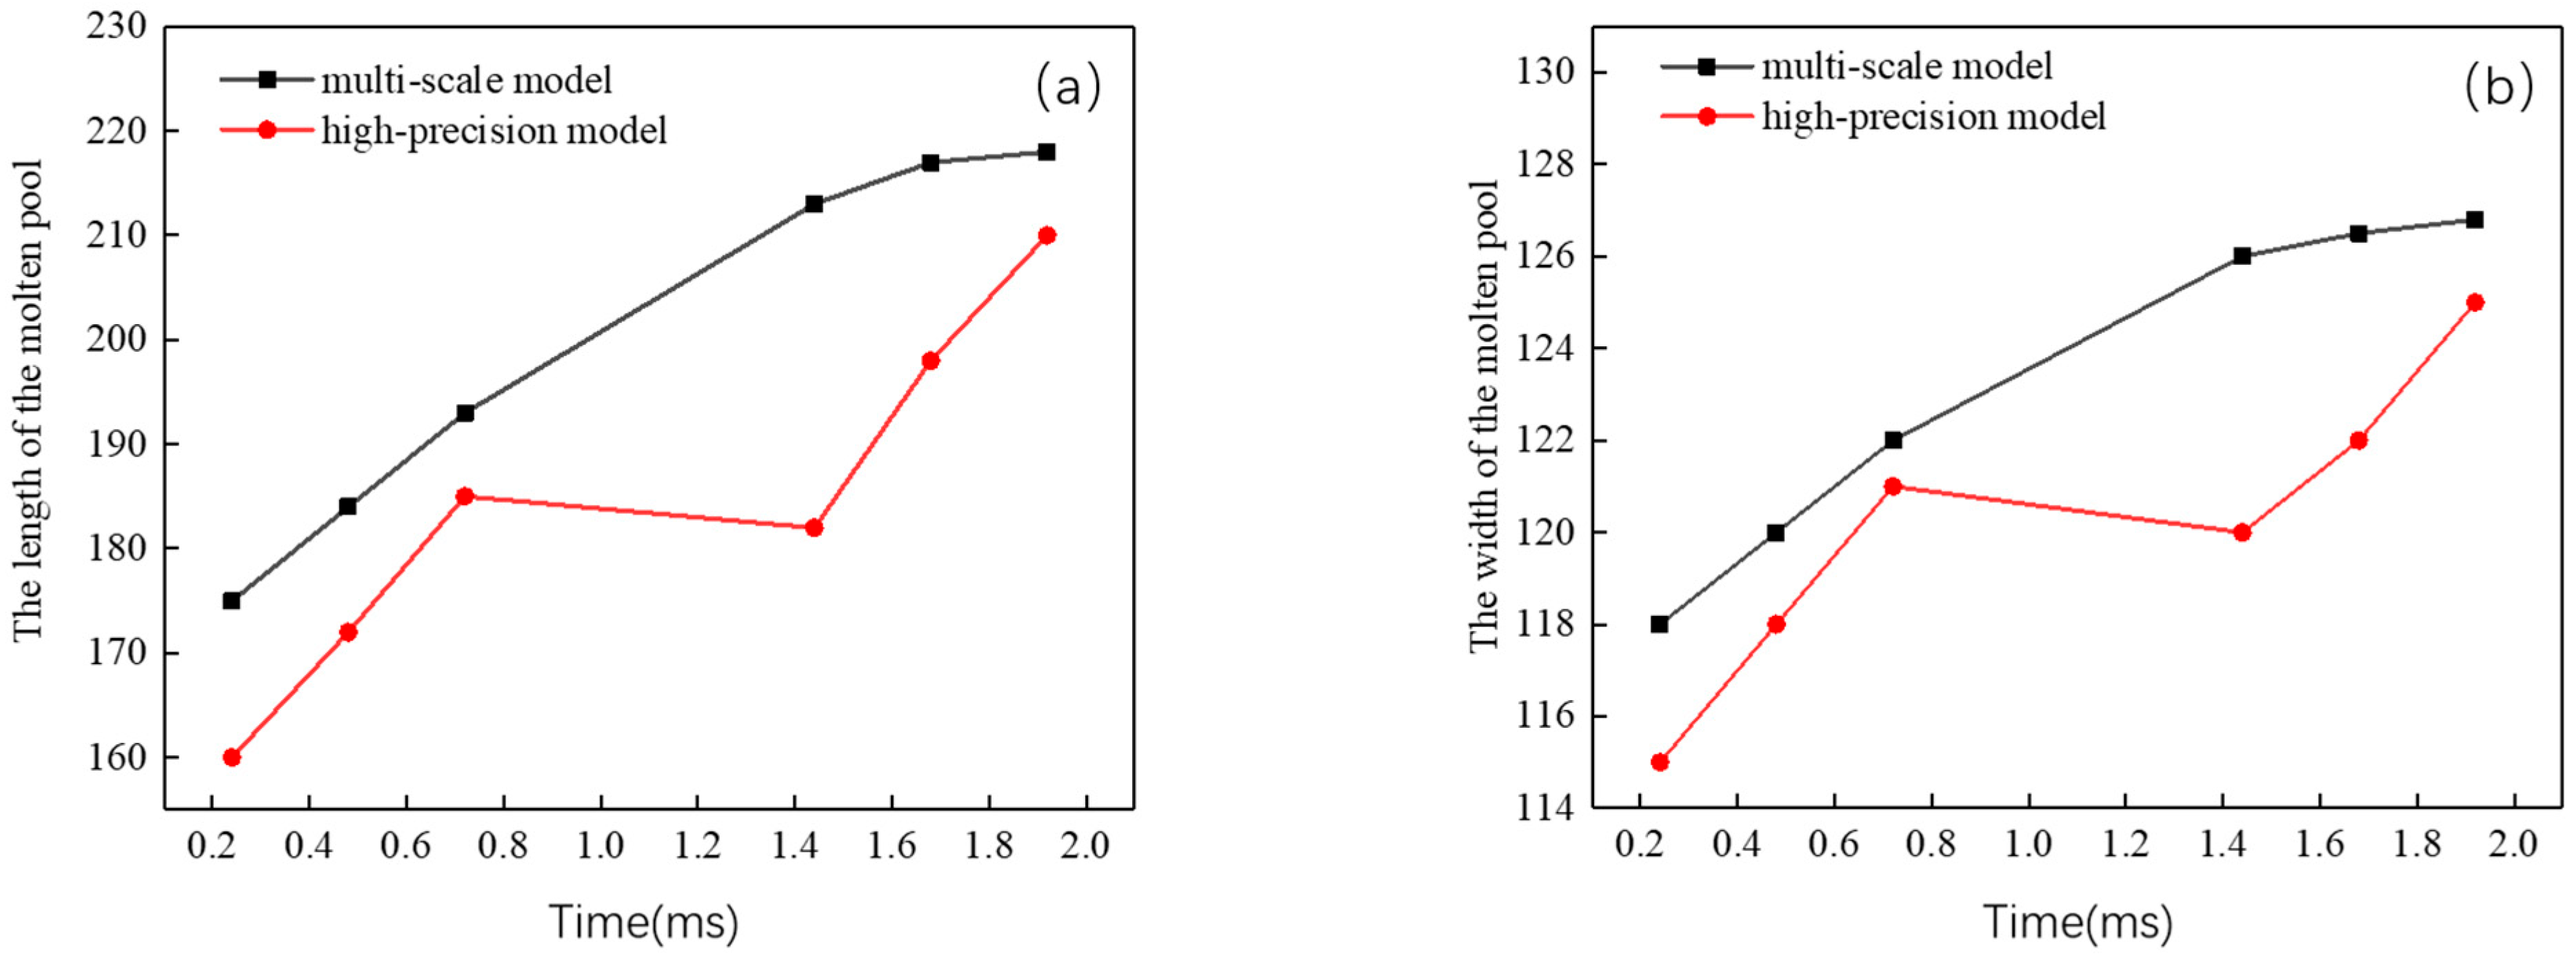
The first 0.72 ms time period in the thermal–fluid coupling model is the single-channel scanning process, and the melt pool size data obtained from this single-channel formation are used as the reference values to analyse the error in the calculation of the melt pool size at the same moment of the multiscale model. From the data in Table 4, it can be seen that the simulation error of the multiscale model in the melt pool size is relatively small, indicating that this model has a certain degree of reliability.
The size of the melt pool at different moments of the first powder bed was measured and recorded and compared with the melt pool length and width data calculated by the coupled thermal–fluid high-precision model in the previous section. The results are shown in Figure 14, where both models indicate that the melt pool size gradually increases with the laser heat source at the beginning of the scanning period. However, because the two melt channels set in the high-precision model have a certain cooling time interval during the scanning process, the melt pool size at 1.44 ms is slightly smaller than that at the 0.72 ms moment but significantly higher than that at the 0.24 ms moment due to the thermal accumulation effect. From the melt pool size trend presented by the multiscale model, it is clear that the melt pool size will tend to stable as the scanning progresses.
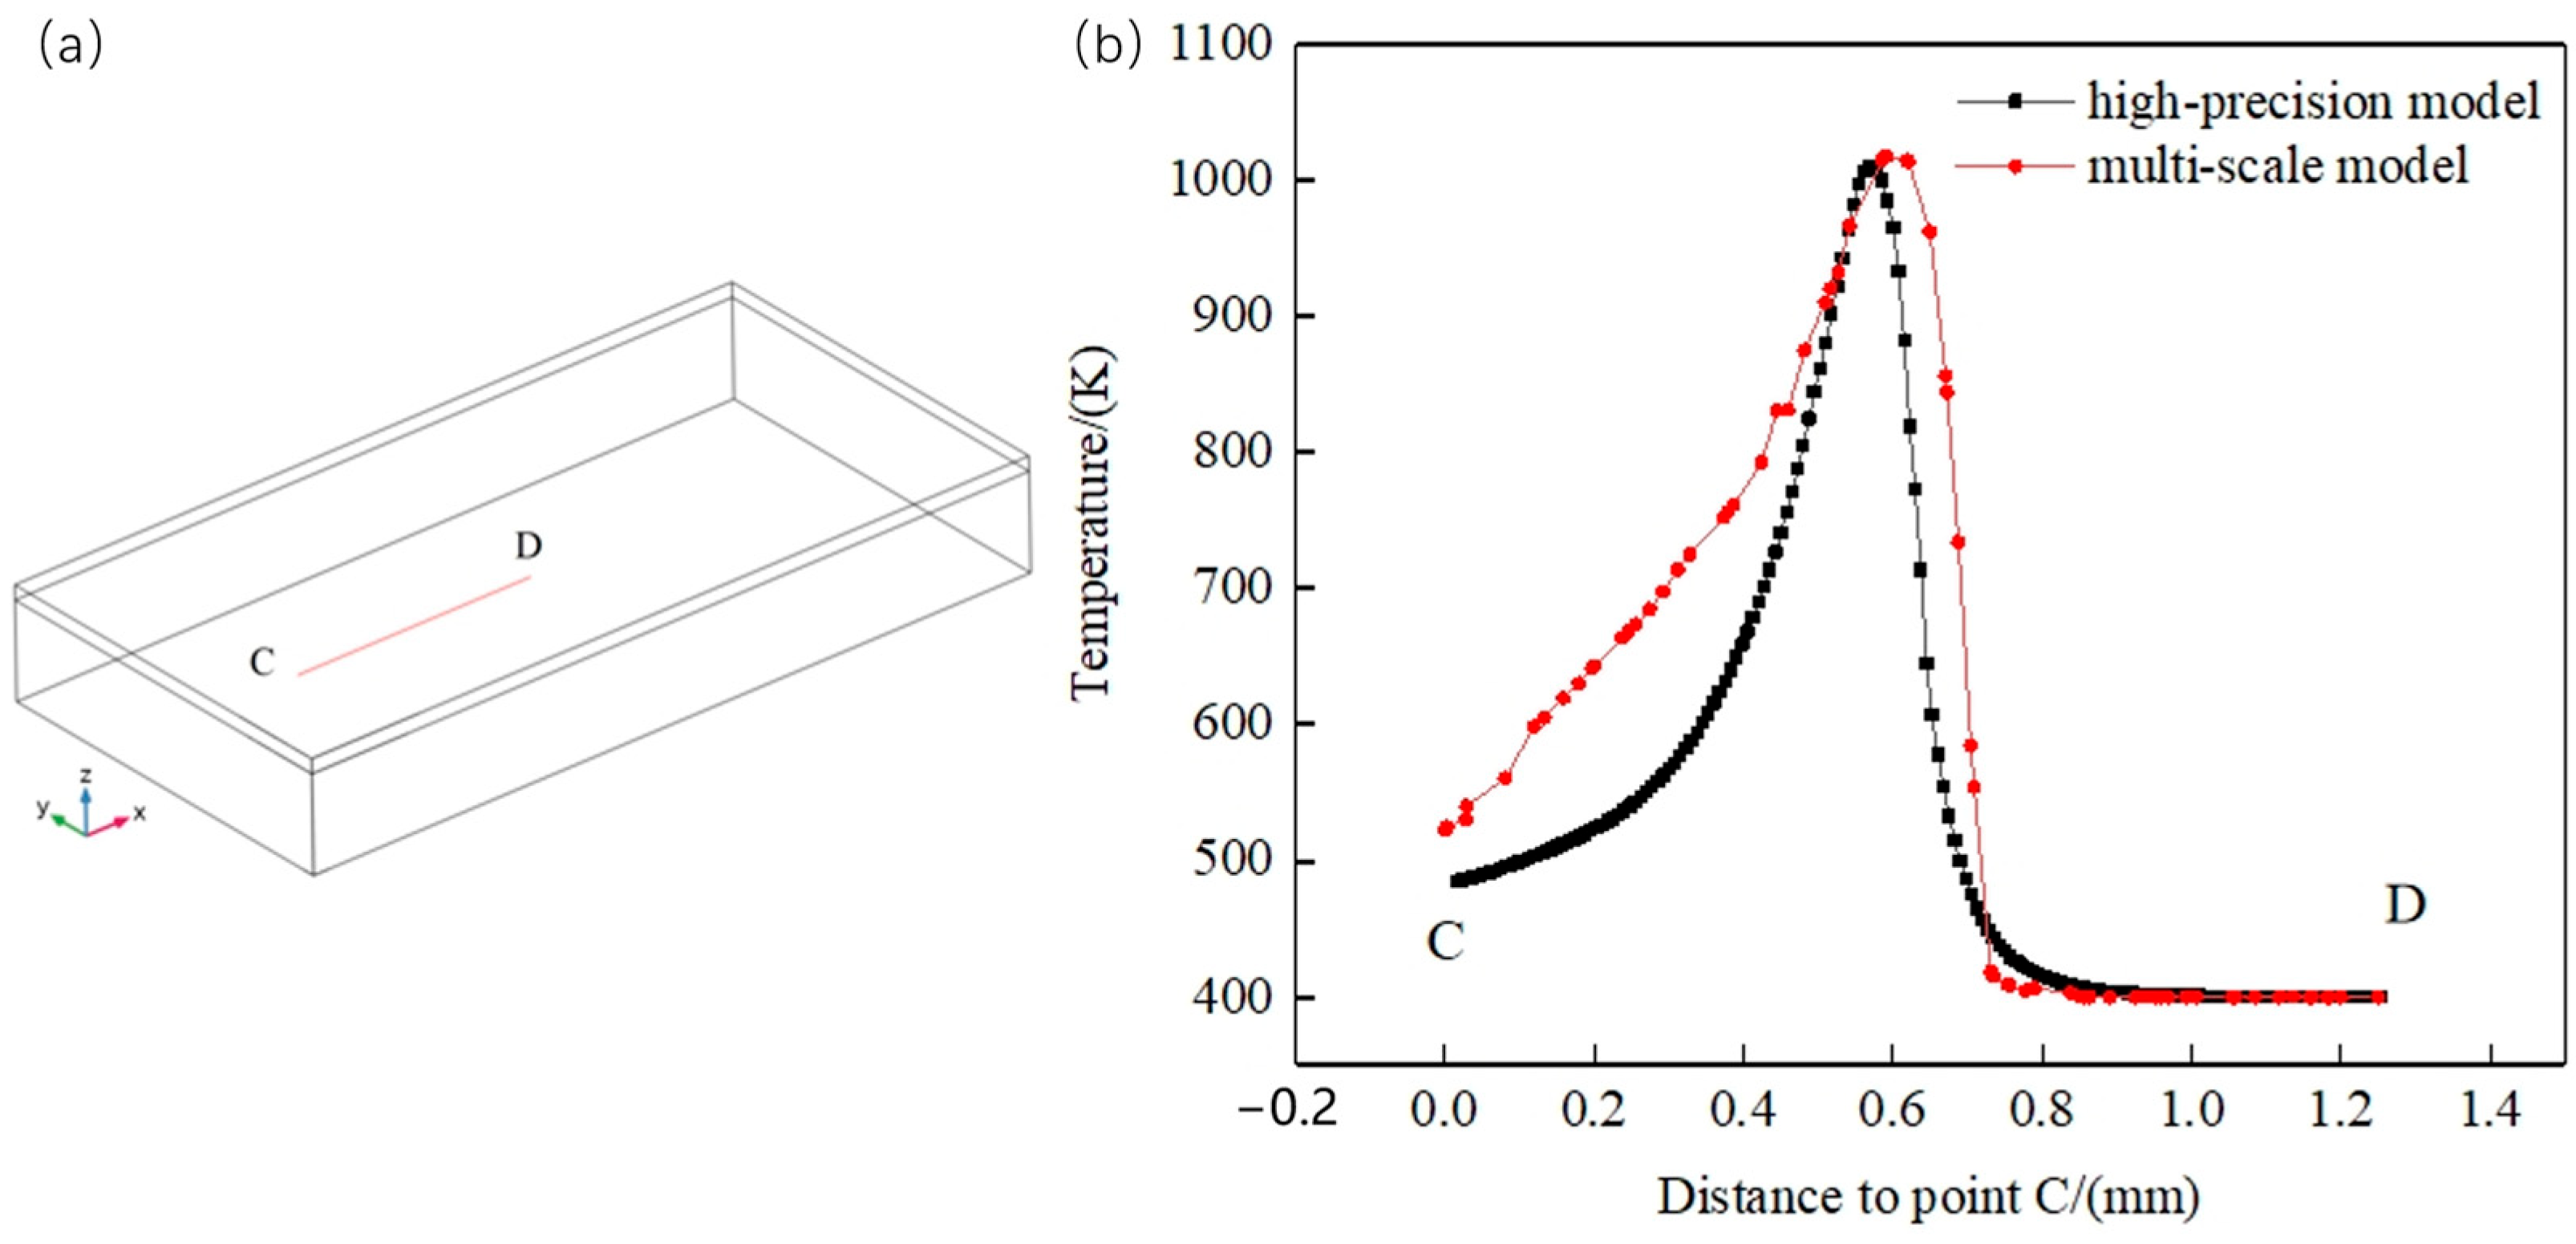
In addition to the dimensional characteristics of the melt pool and verifying the accuracy and reliability of this model, it is also necessary to analyse the temperature field on the surface of the powder bed. In the previous paper, the temperature field analysis was carried out on the intersection line AB between the central plane of the laser scanning and the substrate plane. This section arranges an equal-length probe CD at the starting position of a single-layer melt path to obtain the temperature field data at the same moment. Figure 15 shows the temperature distribution of the high-fidelity model and the multiscale model at the same working condition on the line segment of 50 μm depth position. It can be seen that in the scanned area, the temperature field obtained by the multiscale modelling method is slightly higher than that by the high-fidelity thermal–fluid coupling model, but the trend of the calculation results is more or less the same, and the peak temperatures obtained by the two models and the temperature gradient in the un-scanned area at the front of the melting pool are very close to each other, which indicates that the model is accurate and reliable.

4. Analysis of Heat Transfer Process in SLM Multiscale Melt Channel Formation

4.1. Liquidity Equivalence Characterisation

In this study, a correction factor Cm is used in the modelling to control the thermal conductivity of the material in the liquid phase state, which is used to simulate the influence of the Marangoni effect on the heat transfer process in the molten pool, and a control model is added to the calculations with a value of one for the correction factor Cm, which is used to simulate the evolution of the characteristics of the molten pool in the absence of the Marangoni effect.
In order to reduce the calculation time, the control model which does not consider the flow effect brought by the Marangoni force only simulates and calculates the forming process of the first layer of the powder bed melt channel. From the calculation results of the research model and the control model, the metal melt pools formed at the centre of the first two channels at the moments of 1 ms and 3 ms were selected for comparison to analyse the variability of the calculation results brought about by the mobility equivalence, as shown in Figure 16. It can be seen that when the flow effect brought by the Marangoni force is considered and the correction factor Cm = 1.8 is used for the equivalent setting, there are some differences in the dimensional characteristics of the melt pools obtained under the same working conditions and those obtained without considering the Marangoni flow effect, and the melt pools considering the Marangoni convection effect are relatively wider and deeper, whereas the melt pools without considering the Marangoni convection effect are narrower and longer, with more obvious tail dragging, and the depths of melt pools are slightly smaller. A Marangoni convection is generated by the surface tension gradient caused by the temperature gradient, and its convection direction can significantly affect the morphological characteristics of the metal melt pool. Since the central region of the heat source is the temperature peak, the melt pool is surrounded by the liquid phase point, and the length dimension of the melt pool is larger than the width dimension, the average temperature gradient in the width direction is higher, and the convection effect is more pronounced in the width direction, which results in the increase in the melt pool width. Due to the convection effect in the depth direction of the return flow, the bottom of the melt pool can obtain more heat, so the depth of the melt pool is calculated by taking into account that the Marangoni effect will also be slightly larger.

4.2. Pore Model Characterisation

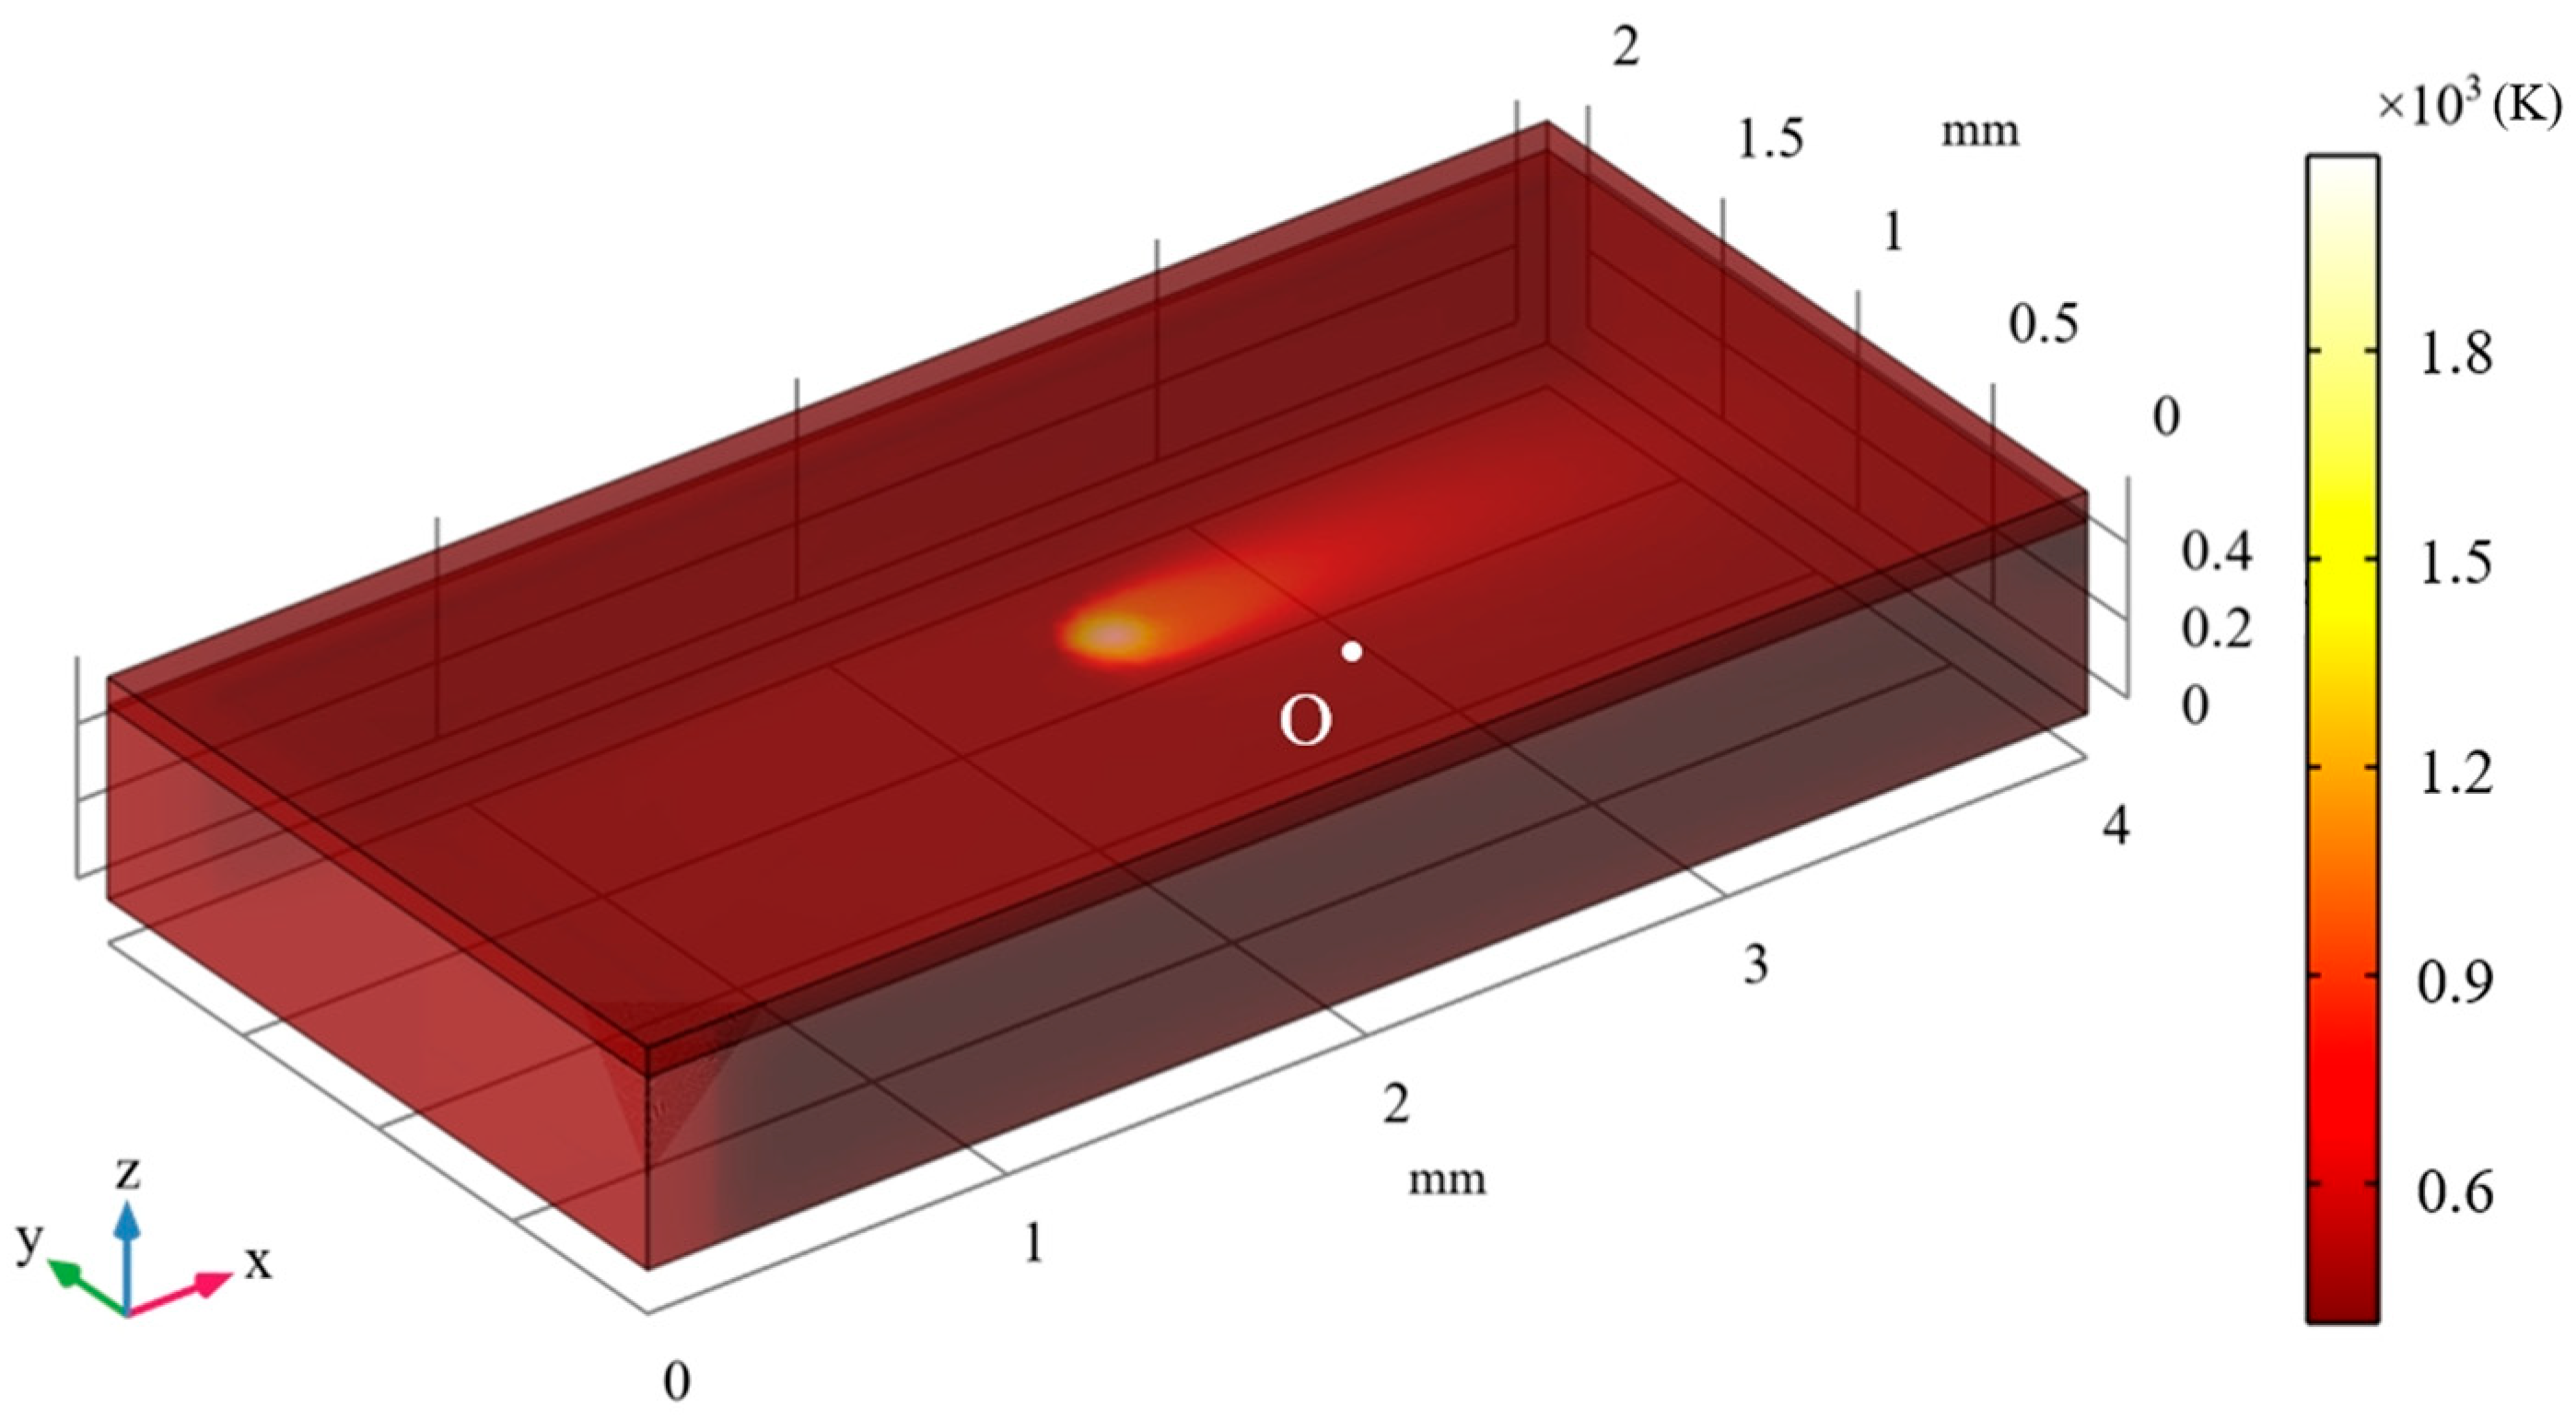
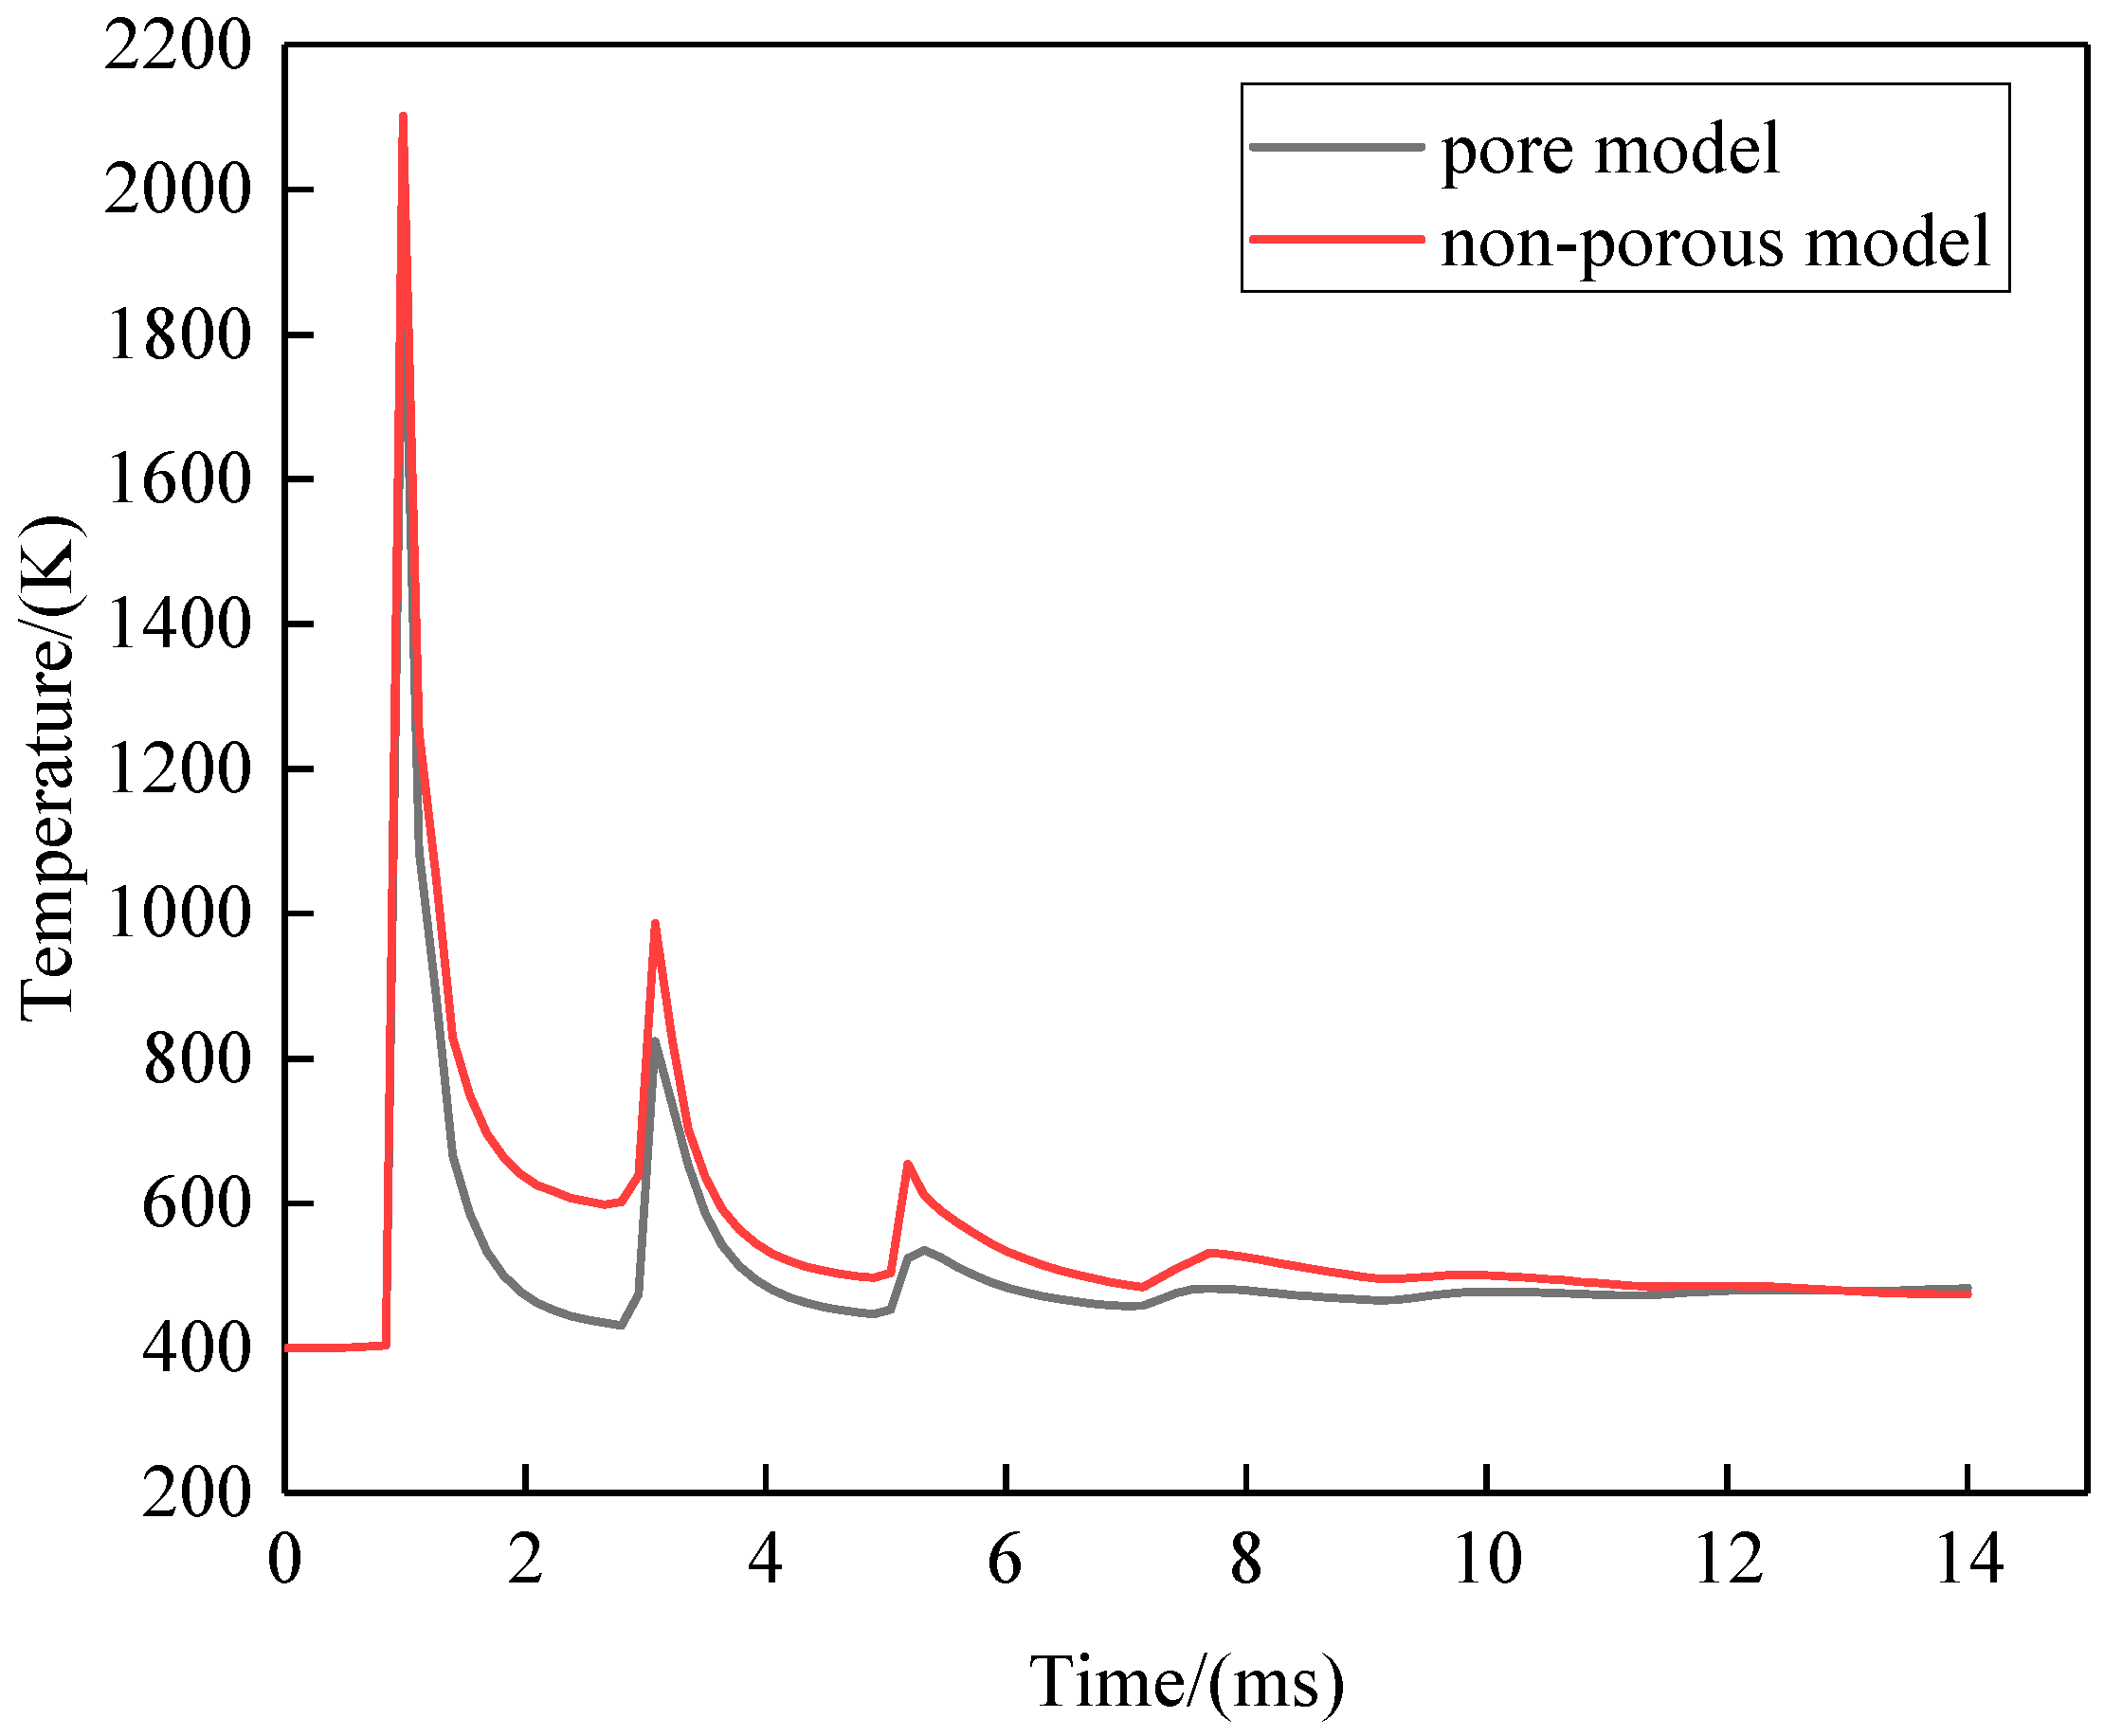
In order to observe the effect of the presence of pores on the heat transfer process in the powder bed, the formation of pores in the deposition region was simulated using binarised random material data to analyse the effect of the presence of a pore model on the temperature field generated, and conventional non-porous and pore models were constructed and calculated to compare the results of the study calculations. Figure 17 shows a schematic diagram of the temperature recording points, with point O being the midpoint of the first melt channel. Figure 18 shows the temperature history of point O on the surface of the first powder bed during the first 14 ms with and without the pore model; the laser passes over the point at t = 1 ms when its temperature reaches its peak, and as the laser moves, the temperature of the point increases when the laser heat source is close to it, and decreases when it is far away from it. From Figure 18, it can be seen that there is a significant difference between the results of the computational models established with or without considering the effect of porosity, in which the peak temperature and the subsequent warming amplitude are lower than those of the model without considering porosity when using the porosity model to control the material parameters in the forming region. The evolution of the material temperature field includes the material heating and cooling rates, which determine the magnitude of thermal stresses, and the material in the pore boundary region is more likely to produce stress concentration effects, for which accurate temperature field prediction and analysis is particularly important.

4.3. Evolution of Temperature Field in Multilayer Melt Channel Formation

During the melting process, the temperature field of the powder bed changes rapidly with time, and the temperature is highest in the laser centre region at the surface of the powder bed and decreases with the distance from the centre of the laser beam with a Gaussian distribution. Figure 19 shows the cloud diagrams of the surface temperature field of the first powder bed and the top powder bed when the laser is moving to the centre position of the powder bed. The highest temperature of the first powder bed is between 1600 K and 2000 K, while the highest temperature of the top powder bed melt pool centre can reach about 2300 K, and the melt pool size is obviously larger than that of the first powder bed melt pool.
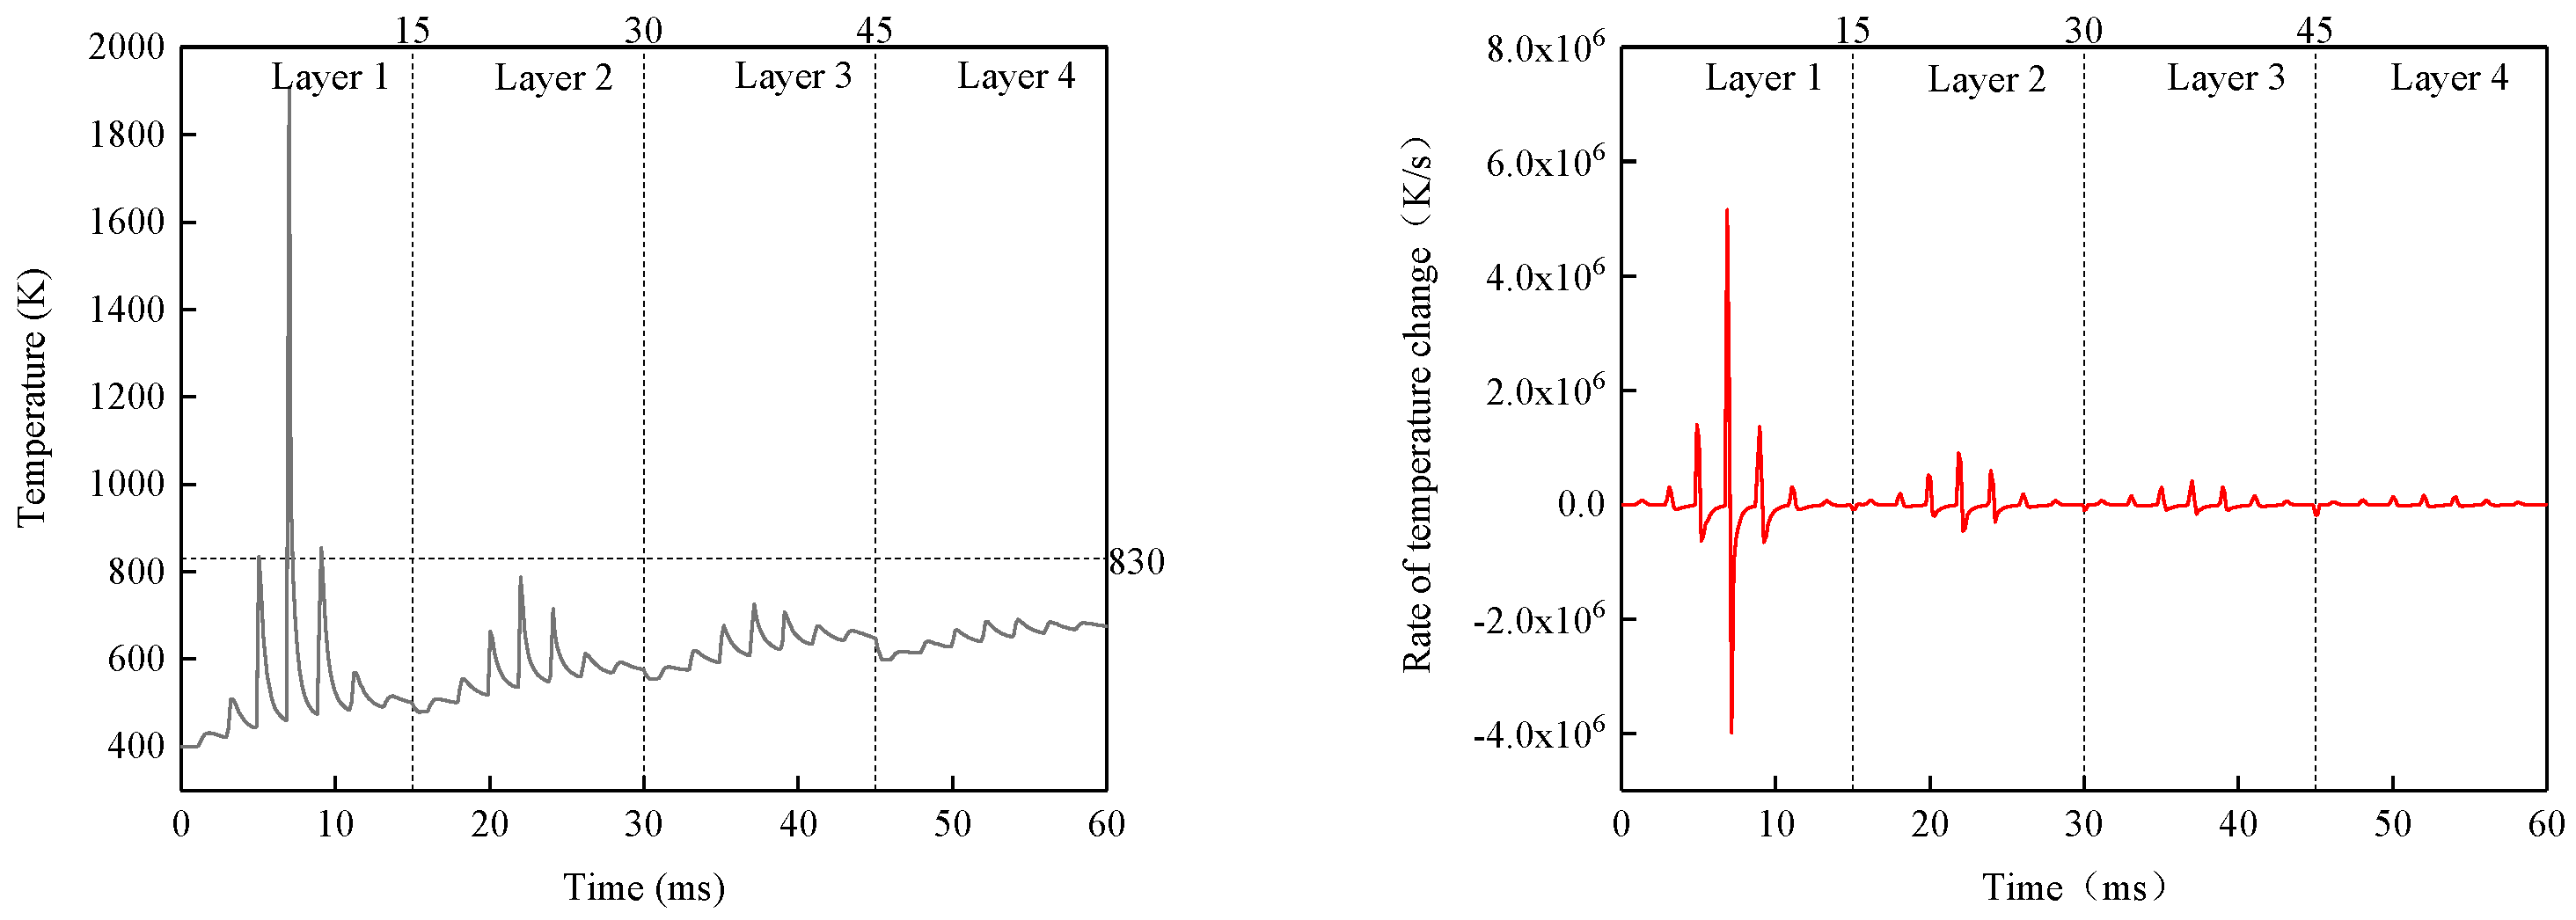
In order to study the temperature change in the powder bed in the process of melt channel formation in a more specific and detailed way and to analyse the influence of the laser energy movement and the stacking of the powder bed on the temperature field of the material, the first layer of the surface of the powder bed is designated as the research object of the centre point A, which is located in the scanning path of the laser, and the specific coordinates of the position is shown in Figure 20. The whole scanning process takes 60 ms in total, and the calculation time for each layer is 15 ms, as shown in Figure 21; the laser centre passes through point A when its temperature reaches a peak value of 1906 K, and the highest temperature of point A is close to its liquid phase point of 830 K in the process of moulding adjacent melting channels in the same layer of the powder bed. In the second layer of powder bed melt moulding process, the laser passes through point A directly above, its temperature reaches the peak at more than 830 K, indicating that the depth of the melt pool exceeds the thickness of the powder bed, and the first layer of the powder bed has been partially remelted for moulding. This is followed by the third and the fourth layer of the powder bed melt moulding process, the temperature of point A with the laser scanning oscillation, and the overall showing an upward trend.
During the SLM moulding process, the metal material is rapidly heated up and cooled down under the action of the laser, and the rate of change in the material temperature over time can reach 106 K/s. The extremely high heating and cooling rates have an impact on the evolution of the thermal and residual stresses in the structure; so, it is extremely important to predict the material temperature gradient and the rate of change. The temperature history of point A is derived from time to obtain the rate of change in point A’s temperature with respect to time, and the results are shown in Figure 21. When the laser energy centre passes through point A before and after, the heating rate and cooling rate reach the maximum value of 5.1 × 10⁶ K/s and 4.0 ×10⁶ K/s, respectively, and the second layer of the powder bed is scanned by the melt channel, which also affects the surface of the first layer of the powder bed, and the heating rate can reach 1.3 × 10⁶ K/s and the cooling rate can reach 8.2 × 10⁵ K/s, respectively.

4.4. Evolution of Melt Pool Characteristics

As the laser scanning proceeds, the overall temperature of the powder bed continues to rise, and the peak temperature of the melt pool formed by the melting of the metal material rises with a correspondingly larger size for a constant laser input energy density. The melting pool formed at the centre of each layer of the powder bed is obtained, the peak temperature data at its centre is recorded, and dimensional measurements are carried out. The peak temperature is shown in Table 5, with the scanning and deposition. The peak temperature of the melting pool at the centre of the powder bed rises gradually from an initial 1643 K to 2310 K of the fourth layer, and the growth rate decreases layer by layer.
The dimensional measurements are shown in Figure 22, in which the melt pool length increases from 198 μm in the first layer to 287 μm in the fourth layer, which is about 44.9%, and the growth rate of each layer is 16.7%, 18.2%, and 5.1%, respectively; and the melt pool width increases from 138 μm in the first layer to 168 μm in the fourth layer, which is a total increase of 21.7%, and the growth rate of each layer is 2.9%, 9.2%, and 8.4%, respectively. The growth rate is small relative to the length dimension; the depth of the melt pool increases from 65 μm in the first layer to 87 μm in the fourth layer, with a total increase of 33.8%, and the growth rate of each layer is 9.2%, 9.9%, and 11.5%, respectively, with the growth rate increasing gradually, and the trend of the depth dimension increase is accelerated. It can be seen that with the laser scanning and the stacking of the powder layers, the size of the melt pool increases layer by layer in all three directions.

5. Conclusions

In this paper, for selective-laser-melting–moulding technology, with the commonly used material AlSi10Mg alloy powder as the research object, and through the numerical simulation method combined with the melting channel moulding experiments, we carried out an in-depth study on the forming mechanism and the intrinsic law of the selective-laser-melting–moulding process of the AlSi10Mg alloy. It includes two major parts: a numerical modelling simulation of a multi-physical-field heat–flow coupling in SLM melt channel formation and a numerical simulation of a heat transfer process in SLM multiscale melt channel formation. The main research results are summarised as follows:
(1)
A numerical model of SLM single-layer melt-channel-forming process is constructed based on hydrodynamic theory for AlSi10Mg metallic materials, and the evolution of melt pool morphology during the SLM formation process of AlSi10Mg materials is investigated, and the validity of the numerical simulation method is verified through the melt-channel-forming experiments.
(2)
A more computationally efficient multiscale numerical model is established for the SLM multilayer melt-channel-forming process, and a binarised spatial stochastic function is used to simulate the formation of pores in the deposition region, and the simulation errors on the melt pool dimensions are small, with an average error on the melt pool length of 6.77% and an average error on the melt pool width of 1.69%.
(3)
The Marangoni convection effect increases the melt pool size, and the presence of pores significantly affects the evolution of the temperature field in the powder bed. With laser scanning and powder bed stacking, the peak melt pool temperature in the centre of the powder bed grows from 1643 K in the first layer to 2310 K in the fourth layer, and the melt pool length, width, and height dimensions increase by 44.9%, 21.7%, and 33.8%, respectively.

Author Contributions

Conceptualization, F.Z.; Methodology, F.Z.; Software, Y.D.; Validation, X.Z.; Formal analysis, L.Y.; Investigation, F.Z.; Resources, Y.D.; Data curation, M.X.; Writing—original draft preparation, F.Z.; Writing—review and editing, S.Y.; Visualization, X.Z.; Supervision, S.Y.; Project administration, D.W.; Funding acquisition, S.Y. and D.W. All authors have read and agreed to the published version of the manuscript.

Funding

This work was supported by the National Key Research and Development Program of China [2021YFB3703801] and Natural Science Foundation of Hunan Province [2023JJ60216].

Data Availability Statement

The original contributions presented in the study are included in the article, further inquiries can be directed to the corresponding author.

Conflicts of Interest

The authors declare no conflict of interest.

References

  1. Glodez, S.; Klemenc, J.; Zupanic, F.; Vesenjak, M. High-cycle fatigue and fracture behaviours of SLM AlSi10Mg alloy. Trans. Nonferrous Met. Soc. China 2020, 30, 2577–2589. [Google Scholar] [CrossRef]
  2. Buchanan, C.; Gardner, L. Metal 3D printing in construction: A review of methods, research, applications, opportunities and challenges. Eng. Struct. 2019, 180, 332–348. [Google Scholar] [CrossRef]
  3. Zhang, J.; Song, B.; Wei, Q.; Bourell, D.; Shi, Y. A review of selective laser melting of aluminum alloys: Processing, microstructure, property and developing trends. J. Mater. Sci. Technol. 2019, 35, 270–284. [Google Scholar] [CrossRef]
  4. Wu, J.; Wang, X.Q.; Wang, W.; Attallah, M.M.; Loretto, M.H. Microstructure and strength of selectively laser melted AlSi10Mg. Acta Mater. 2016, 117, 311–320. [Google Scholar] [CrossRef]
  5. Gatto, A.; Cappelletti, C.; Defanti, S.; Fabbri, F. The Corrosion Behaviour of Additively Manufactured AlSi10Mg Parts Compared to Traditional Al Alloys. Metals 2023, 13, 913. [Google Scholar] [CrossRef]
  6. Li, B.-Q.; Li, Z.; Bai, P.; Liu, B.; Kuai, Z. Research on Surface Roughness of AlSi10Mg Parts Fabricated by Laser Powder Bed Fusion. Metals 2018, 8, 524. [Google Scholar] [CrossRef]
  7. Li, Z.; Kuai, Z.; Bai, P.; Nie, Y.; Fu, G.; Liu, W.; Yang, S. Microstructure and Tensile Properties of AlSi10Mg Alloy Manufactured by Multi-Laser Beam Selective Laser Melting (SLM). Metals 2019, 9, 1337. [Google Scholar] [CrossRef]
  8. Pelevin, I.A.; Ozherelkov, D.Y.; Nalivaiko, A.Y.; Bodyakova, A.I.; Chernyshikhin, S.V.; Zotov, B.O.; Korshunov, A.V.; Gromov, A.A. AlSi10Mg/AlN Interface Grain Structure after Laser Powder Bed Fusion. Metals 2022, 12, 2152. [Google Scholar] [CrossRef]
  9. Buchbinder, D.; Meiners, W.; Pirch, N.; Wissenbach, K.; Schrage, J. Investigation on reducing distortion by preheating during manufacture of aluminum components using selective laser melting. J. Laser Appl. 2014, 26, 012004. [Google Scholar] [CrossRef]
  10. Louvis, E.; Fox, P.; Sutcliffe, C.J. Selective laser melting of aluminium components. J. Mater. Process. Technol. 2011, 211, 275–284. [Google Scholar] [CrossRef]
  11. Megahed, S.; Buehring, J.; Duffe, T.; Bach, A.; Schroeder, K.-U.; Schleifenbaum, J.H. Effect of Heat Treatment on Ductility and Precipitation Size of Additively Manufactured AlSi10Mg. Metals 2022, 12, 1311. [Google Scholar] [CrossRef]
  12. Awd, M.; Stern, F.; Kampmann, A.; Kotzem, D.; Tenkamp, J.; Walther, F. Microstructural Characterization of the Anisotropy and Cyclic Deformation Behavior of Selective Laser Melted AlSi10Mg Structures. Metals 2018, 8, 825. [Google Scholar] [CrossRef]
  13. Li, R.; Shi, Y.; Liu, J.; Yao, H.; Zhang, W. Effects of processing parameters on the temperature field of selective laser melting metal powder. Powder Metall. Met. Ceram. 2009, 48, 186–195. [Google Scholar] [CrossRef]
  14. Ye, J.; Khairallah, S.A.; Rubenchik, A.M.; Crumb, M.F.; Matthews, M.J. Energy Coupling Mechanisms and Scaling Behavior Associated with Laser Powder Bed Fusion Additive Manufacturing. Adv. Eng. Mater. 2019, 21, 1900185. [Google Scholar] [CrossRef]
  15. Roberts, I.A.; Wang, C.J.; Esterlein, R.; Stanford, M.; Mynors, D.J. A three-dimensional finite element analysis of the temperature field during laser melting of metal powders in additive layer manufacturing. Int. J. Mach. Tools Manuf. 2009, 49, 916–923. [Google Scholar] [CrossRef]
  16. Zhanyong, Z.; Liang, L.; Le, T.; Peikang, B.; Jing, L.; Liyun, W.; Haihong, L.; Yahui, C. Simulation of Stress Field during the Selective Laser Melting Process of the Nickel-Based Superalloy, GH4169. Materials 2018, 11, 1525. [Google Scholar] [CrossRef] [PubMed]
  17. Körner, C.; Attar, E.; Heinl, P. Mesoscopic simulation of selective beam melting processes. J. Mater. Process. Technol. 2011, 211, 978–987. [Google Scholar] [CrossRef]
  18. Khairallah, S.A.; Anderson, A. Mesoscopic simulation model of selective laser melting of stainless steel powder. J. Mater. Process. Technol. 2014, 214, 2627–2636. [Google Scholar] [CrossRef]
  19. Ly, S.; Rubenchik, A.M.; Khairallah, S.A.; Guss, G.; Matthews, M.J. Metal vapor micro-jet controls material redistribution in laser powder bed fusion additive manufacturing. Sci. Rep. 2017, 7, 4085. [Google Scholar] [CrossRef]
  20. Qiu, C.; Panwisawas, C.; Ward, M.; Basoalto, H.C.; Brooks, J.W.; Attallah, M.M. On the role of melt flow into the surface structure and porosity development during selective laser melting. Acta Mater. 2015, 96, 72–79. [Google Scholar] [CrossRef]
  21. Panwisawas, C.; Qiu, C.; Anderson, M.J.; Sovani, Y.; Turner, R.P.; Attallah, M.M.; Brooks, J.W.; Basoalto, H.C. Mesoscale modelling of selective laser melting: Thermal fluid dynamics and microstructural evolution. Comput. Mater. Sci. 2017, 126, 479–490. [Google Scholar] [CrossRef]
  22. Shrestha, S.; Chou, K. A build surface study of Powder-Bed Electron Beam Additive Manufacturing by 3D thermo-fluid simulation and white-light interferometry. Int. J. Mach. Tools Manuf. 2017, 121, 37–49. [Google Scholar] [CrossRef]
  23. Tang, C.; Tan, J.L.; Wong, C.H. A numerical investigation on the physical mechanisms of single track defects in selective laser melting. Int. J. Heat Mass Transf. 2018, 126, 957–968. [Google Scholar] [CrossRef]
  24. Klassen, A.; Scharowsky, T.; Koerner, C. Evaporation model for beam based additive manufacturing using free surface lattice Boltzmann methods. J. Phys. D Appl. Phys. 2014, 47, 275303. [Google Scholar] [CrossRef]
  25. Wang, L.; Yan, W. Thermoelectric Magnetohydrodynamic Model for Laser-Based Metal Additive Manufacturing. Phys. Rev. Appl. 2021, 15, 064051. [Google Scholar] [CrossRef]
  26. Yin, J.; Zhu, H.; Ke, L.; Lei, W.; Dai, C.; Zuo, D. Simulation of temperature distribution in single metallic powder layer for laser micro-sintering. Comput. Mater. Sci. 2012, 53, 333–339. [Google Scholar] [CrossRef]
  27. Lampa, C.; Kaplan, A.F.; Powell, J.; Magnusson, C. An analytical thermodynamic model of laser welding. J. Phys. D Appl. Phys. 1997, 30, 1293. [Google Scholar] [CrossRef]
  28. Nikam, S.H.; Jain, N.K. Three-dimensional thermal analysis of multi-layer metallic deposition by microplasma transferred arc process using finite element simulation. J. Mater. Process. Technol. 2017, 249, 264–273. [Google Scholar] [CrossRef]
  29. Nikam, S.H.; Quinn, J.; McFadden, S. A simplified thermal approximation method to include the effects of Marangoni convection in the melt pools of processes that involve moving point heat sources. Numer. Heat Transf. Part A Appl. 2021, 79, 537–552. [Google Scholar] [CrossRef]
  30. du Plessis, A. Effects of process parameters on porosity in laser powder bed fusion revealed by X-ray tomography. Addit. Manuf. 2019, 30, 100871. [Google Scholar] [CrossRef]
Figure 1. (a) SLM moulding physical process; (b) Mesoscopic numerical model of SLM process.
Metals 14 00825 g001
Figure 2. Profile view of laser action.
Metals 14 00825 g002
Figure 3. Relationship between thermal conductivity, specific heat capacity, dynamic viscosity, density, and temperature of AlSi10Mg.
Metals 14 00825 g003
Figure 4. AlSi10Mg alloy powder particle size distribution.
Metals 14 00825 g004
Figure 5. FS271M selective-laser-melting equipment.
Metals 14 00825 g005
Figure 6. (a) Powder bed; (b) Forming channel.
Metals 14 00825 g006
Figure 7. Comparison of moulding appearance of 100 W power single fuses.
Metals 14 00825 g007
Figure 8. Material specific heat capacity and thermal conductivity parameter setting.
Metals 14 00825 g008
Figure 9. Distribution of 160 W-360 W power forming structured 3D pores reprinted with permission from ref. [30]. 2019 Elsevier. (a) 90 W. (b) 120 W. (c) 1600 W (d) 200 W. (e) 240 W. (f) 280 W. (g) 320 W. (h) 360 W.
Metals 14 00825 g009
Figure 10. Random function standard data set slices and their Boolean results (a) data set slices (b) p = 0.3 (c) p = 0.35 (d) p = 0.4 (e) p = 0.45 (f) p = 0.5.
Metals 14 00825 g010
Figure 11. Geometric model meshing and heat centre trajectories.
Metals 14 00825 g011
Figure 12. Multi-layer melt-channel-forming process (a) layer1. (b) layer2. (c) layer3. (d) layer4.
Metals 14 00825 g012
Figure 13. Characteristics of the melt pool size at 0.24 ms moment of the first powder bed.
Metals 14 00825 g013
Figure 14. Comparison of melt pool sizes calculated by the two models. (a) Length. (b) Width.
Metals 14 00825 g014
Figure 15. Weld temperature field analysis. (a) Starting position of the equal-length probe. (b) Comparison of temperature field between the high-fidelity model and the multiscale model.
Metals 14 00825 g015
Figure 16. Comparison of liquidity equivalent characteristics.
Metals 14 00825 g016
Figure 17. Temperature recording point O with coordinates of (2, 0.7, 0.575).
Metals 14 00825 g017
Figure 18. Point O temperature history.
Metals 14 00825 g018
Figure 19. Surface temperature field of the first and top powder beds. (a) First powder bed. (b) Top powder bed.
Metals 14 00825 g019
Figure 20. Temperature recording point A.
Metals 14 00825 g020
Figure 21. Temperature history and rate of temperature change at point A.
Metals 14 00825 g021
Figure 22. Scatter plot of the powder bed’s centre melt pool and its dimensional data.
Metals 14 00825 g022
Table 1. Thermal properties of materials reprinted with permission from ref. [25]. 2021 American Physical Society.
PropertyValue
Solidus temperature (Ts, K)830
Liquidus temperature (Tl, K)870
Boiling temperature (T1v, K)2743
Latent heat of melting (ΔH, J/kg)3.89 × 105
Latent heat of evaporation (ΔHv, J/kg)1.07 × 107
Saturated vapor pressure (Pe, Pa)1.013 × 10⁵ (Tb = 2743 K)
Surface tension coefficient (σ0, N/m)1.02
Temperature sensitivity of surface tension (σT, N/(m·K))−3.1 × 10−4
Convective heat transfer coefficient (hc, W/(m2·K))82
Radiation emissivity (ε)0.4
Table 2. Chemical composition of AlSi10Mg alloy powder.
AlSiMgCuNiVFeMnTiZn
rest10.30.350.20<0.01<0.01<0.01<0.01<0.01<0.01
Table 3. Parameters of selective-laser-melting process.
Laser Power (W)Powder Layer Thickness (μm)Laser Radius
(μm)
Scan Speed (mm/s)Linear Energy Density
(J/m)
Energy Density
(J/mm3)
Melt Gap
(μm)
300504570042985.7130
300100030060130
300150020040130
10020050011180
10050020044.480
10080012527.880
100100010022.280
Table 4. Analysis of the calculation results of the molten pool size.
CharacterisationLength/(μm)Width/(μm)
Juncture/(ms)0.240.480.720.240.480.72
Multiscale modelling of melt pools175184193118120122
High-precision model melting pool160172185115118121
Absolute error/(μm)15128321
Relative error/(%)9.3756.9774.3242.6091.6950.826
Average relative error/(%)6.771.69
Table 5. Peak bath temperatures in the centre of the powder bed.
PositionFirst LayerSecond LayerThird FloorFourth Floor
Peak temperature (K)1643192021272310
Raise temperature (K)277207183
Growth rate (%)16.910.88.6
Disclaimer/Publisher’s Note: The statements, opinions and data contained in all publications are solely those of the individual author(s) and contributor(s) and not of MDPI and/or the editor(s). MDPI and/or the editor(s) disclaim responsibility for any injury to people or property resulting from any ideas, methods, instructions or products referred to in the content.