Article

Mechanical Properties and Wear Resistance of Biodegradable ZnMgY Alloy

1
Department of Materials Science, Faculty of Materials Science and Engineering, “Gheorghe Asachi” Technical University of Iasi, 41 Dimitrie Mangeron Blvd., 700050 Iasi, Romania
2
Faculty of Mechanical Engineering, “Gheorghe Asachi” Technical University of Iasi, 43 Dimitrie Mangeron Blvd., 700050 Iasi, Romania
3
Materials Engineering and Industrial Safety Department, Faculty of Materials Science and Engineering, “Gheorghe Asachi” Technical University of Iasi, 67 Dimitrie Mangeron Blvd., 700050 Iasi, Romania
4
Department of Industrial Engineering and Management, Faculty of Engineering, Lucian Blaga University of Sibiu, 10 Victoriei Blvd., 550024 Sibiu, Romania
5
Academy of Romanian Scientists, Ilfov 3, 050044 Bucharest, Romania
6
Department of Mechanics and Technologies, Faculty of Mechanical Engineering, Automotive and Robotics, Stefan cel Mare University of Suceava, B Building, 13 University Street, 720229 Suceava, Romania
7
Department of Surgical, Faculty of Dental Medicine, “Grigore T. Popa” University of Medicine and Pharmacy, 16 University Street, 700115 Iasi, Romania
*
Authors to whom correspondence should be addressed.
Metals 2024, 14(7), 836; https://doi.org/10.3390/met14070836 (registering DOI)
Submission received: 14 June 2024 / Revised: 15 July 2024 / Accepted: 19 July 2024 / Published: 22 July 2024
(This article belongs to the Section Biobased and Biodegradable Metals)

Abstract

:
Biodegradable metallic materials are gaining attention for medical applications in short-term implants (15–500 days) because of their good mechanical properties, biocompatibility, and generalized corrosion. Most medical applications involve implant wear processes, particularly for bone fractures. Parallelepipedic specimens (dimensions 50 mm × 10 mm × 3 mm) were obtained by cutting the hot-rolled material processed from cast ingots of ZnMgY. To test the tribological performance of these stationary specimens, they were placed at the upper point of the machine’s tribological contact. The rotating lower disk of the AMSLER machine (AMSLER & Co., Schaffhouse, Switzerland) is manufactured from AISI 52100 bearing steel with a 62–65 HRC hardness and a diameter of 59 mm both radially and axially. Frictional torque is the parameter that is measured. Scanning Electron Microscopy (SEM) and Energy Dispersive Spectroscopy (EDS) were used to analyze the worn areas. The material behavior in the normal and wear states upon immersion in simulated body fluid (SBF) was evaluated.

1. Introduction

Biomaterials are classified as special materials designed for medical implants that are intended to be exposed to biological tissues such as blood, cells, and proteins. Their function is to heal tissue with minimal side effects. The term also corresponds to any other material that can be used in endogenous (internal) or exogenous (external) contact with the human body for treatment, shape modification, tissue replacement, and diagnosis or monitoring [1,2]. These advanced materials have been designed and developed as biocompatible interfaces with the human body through medical devices, implants, and prosthetic systems [3,4].
Vojtech et al. [5] was the first to report a Zn-based ternary alloy as biocompatible, i.e., ZnAl-Cu alloy. Studies on other ternary alloys have been conducted in a similar direction, most of them involving the Zn-Mg system. Several reported Zn-Mg-based ternary alloys include Zn-Mg-Fe [6], Zn-Mg-Sr [7,8], Zn-Mg-Ca [7], and Zn-Mg-Mn [9]. The Zn-Mg system is the most frequently addressed in studies of Zn-based ternary alloys, mainly for its expected biocompatibility.
Biodegradable zinc-based alloys exhibit a corrosion rate that lies, in value or range, depending on the electrolyte solution, between those of Mg- and Fe-based alloys, making them suitable for most medical applications involving implants. The main problem with zinc compared with the other two biodegradable alloy systems based on Mg and Fe is its poor mechanical properties, which can be substantially improved by alloying it with other metallic chemical elements. In this case, we chose to improve the mechanical properties of pure Zn by alloying it with Mg and Y.
Studies on Mg addition to binary Zn-Cu [10] and Zn-Al [11] alloys have also been reported. Investigations on ternary alloys not involving the Zn-Mg system have been conducted, including Zn-Ca-Sr [7], Zn-Mn-Cu [12], Zn-Cu-Fe [10], and Zn-Al-Sr [13]. The wear resistance of Zn-based biodegradable alloys can be controlled by various factors, including the alloy composition, microstructure, and surface treatments. Nevertheless, Zn-based alloys are designed primarily for their biodegradability rather than exceptional wear resistance. Zn has a relatively low wear resistance compared with other metals. However, alloying Zn with certain elements can increase its wear resistance. For instance, Al, Mg, and Cu can improve the mechanical properties and wear resistance of Zn-based alloys.
Microstructural factors such as grain size and distribution also contribute to wear resistance. Smaller grain sizes and a more homogeneous microstructure can contribute to wear resistance improvement by reducing the susceptibility to wear mechanisms such as microcrack propagation. Surface treatments, such as coatings, can further enhance the wear resistance of Zn-based alloys. Zinc–aluminum or zinc–nickel coatings can provide a protective layer that reduces friction and wear. Surface treatments, such as laser texturing, can also improve the hardness and wear resistance of the alloy.
Wear resistance represents, in many cases, a compromise when considering biodegradable alloys because the focus is primarily on biocompatibility and controlled degradation rather than high wear resistance. Therefore, Zn-based biodegradable alloys may be preferable for applications with lower wear requirements or those requiring wear to be controlled or reduced through lubrication or protective coatings [14]. While Zn-based biodegradable alloys may not exhibit the same high wear resistance as other materials, their performance can be optimized through alloy design, microstructural control, and surface treatments. Specific application characteristics and expected wear conditions are crucial for determining the use of these alloys in specific wear-related applications. Research has been conducted for different categories of medical applications, from membranes (for bone or cardiovascular regeneration) to plates, posts, screws, or other orthopedic fixation systems (tissue or bone healing, osteoporosis, or bone necrosis) [15].
In the present study, the wear resistance of a ZnMgY alloy, which is a possible biodegradable candidate for medical applications, was compared with that of Zn or ZnMg alloys in the hot-rolled state.

2. Materials and Methods

The chemical compositions of the alloys were established in previous work [16,17]. The ingots were obtained from the following load quantities (grams): Zn: 95.98; Mg: 0.62; and Y: 3.4. The materials were melted for 600 s at 480 °C in a standard induction furnace with protective gas (argon) (~0.75 atm), Induct-Ro, Iasi, Romania. Mg30Y (wt%) pre-alloy, (approx. equal granules of 2 mm2) and pure Mg were introduced in the first phase. Pure Zn pieces were gradually added to the heated crucible, up to 100 g of ZnMgY alloy. Continuous stirring was applied to achieve the best possible chemical homogeneity and control MgY pre-alloy melting by dilution in the molten zinc bath. The loss of Zn through volatilization was avoided by maintaining a low melt bath temperature and gradually increasing the percentage of dissolved elements. We remelted the ingots to ensure the solubilization of all components but without overheating the metal bath to avoid the loss of constituents through oxidation. After cooling, the obtained ingots (cylindrical with a diameter of 10 mm and a length of 100 mm) were processed and subjected to turning, cutting, and grinding for hot-rolled processing by heating at 250 °C for 10 min (3–4 passes with a 5–7% reduction degree). Hot-rolled samples were used for structural, chemical, mechanical, and physical investigations.
Tribological wear resistance tests are performed to evaluate the frictional properties and strength of the materials, lubricants, coatings, and various other surfaces in contact. These tests help researchers and engineers understand the performance and durability of materials under different conditions and are crucial when developing and selecting materials for specific applications [18].
The AMSLER tribometer can be used to test various sample geometries (disk-on-disk, shoe-on-disk, and pad-on-disk). The friction torque is the parameter that is measured. For the friction torque measurement, tensiometric measurements were performed in conjunction with a Vishay P3 tensiometer bridge (manufactured by Vishay, Munich, Germany) [19,20]. A practical case of wear between a rotating steel disk and a stationary roller made from Zn, Zn3Mg, and Zn3Mg1Y was used in the experiments; the schematic is given in Figure 1. The friction between the rollers moves the balancer attached to the lower roller axle. A rod was rigidly fixed at the end of the rocker arm to support the tensiometrically marked plate. The frictional force in the tribosystem causes the deformation of the elastic blade, which presses against a fixed stop attached to the machine frame. The elastic blade was calibrated using standard weights, and the frictional moment equations are given further in this section. The tests were performed in dry conditions.
The plate deformation, proportional to the friction between the test rolls, was monitored using the Vishay P3 tensiometer bridge, which stores data on the variation in plate deformation over time (implicitly the friction in the tribosystem) on a computer (laptop). To determine the frictional moment variation in the tribosystem, the data were further processed in LabVIEW (Version 7.1).
The measuring system was calibrated using tensiometer marks and standard weights. The gravitational force acts on the tensiometer plate, producing the same effect as the friction moment between the two rollers tested on the AMSLER machine (Type A 135, made by Wolpert Werkstoffprüfmaschinen G.mb.H. in Schaffhausen, Switzerland). The bending moment generated by the various standard weights was used to determine the moment–deflection curve of the tensile mark blade during calibration, according to Equation (1).
During the tests, the frictional moment produced by the frictional force between the rollers acts through the kinematic chain and through the fixed stop at the same point on the elastic plate as the resultant force created by the standard weight. The friction force variation during testing can therefore be monitored by the acquisition system. Corresponding to the calibration, a linear variation in the frictional moment with plate deformation and tensile marks is obtained. The empirical relationship between the frictional torque and deformation is presented as follows:
M f = C 1 ε = 2 ε
where the following variables are used:
Mf = friction moment between rollers [N·mm];
ε = deformation of tensile marks on the elastic plate [μm].
The constant C1 is in N and represents the calibration constant, which is different from one elastic plate to another.
The frictional moment Mf, frictional force Ff, and friction coefficient µ were determined using the following Equations (2)–(5):
M f = F f R
F f = M f R
F f = μ Q = μ G cos α
μ = F f G cos α = M f R G cos α
where the following variables are used:
α = the angle between the vertical direction (of the weight force G) and the direction of the normal contact load Q (can be adjusted as desired so that G and Q coincide or not);
R = disk radius, 24.5 [mm];
ω = angular rate [rad/s];
G = applied load [N];
Q = normal contact load [N].
These equations are also found in LabVIEW software for post-processing the results, with statistical parameters indicating the quality of the data acquisition and the corresponding attenuation filtering of the acquired signal.
Each test duration was 30 min. All tests were performed up to a constant lower disk speed, N = 100 rpm. Tests were performed using 20 and 30 N loads. A signal-to-noise ratio (SNR) greater than 2 implies an acceptable quality of friction torque signal acquisition; a reasonable quality of acquisition is defined as SNR = 1.
To determine the wear rate, the samples were weighed before and after the friction test. At a constant speed of 100 rpm, the total sliding distance in each friction test was 556 m. The wear rate was obtained using Archad’s well-known Formula (6):
W = M/(Q·D)
where W is the wear rate, M represents the mass loss during one test, in grams, Q is the applied normal load in Newtons, and D is the sliding distance (556 m).
Five microhardness measurements were taken at and around the wear marks, and the average values were analyzed. The change in mechanical properties was evaluated by Vickers (HV) hardness tests using the HVT-1000 instrument (Laihua, Shandong, China) (test force: 2.942 N-300 gF; time: 10 s; objective: 40× magnification, JVC TK-C92 1EC for the surface image of the indentation trace).
After the tribological wear tests, the samples were immersed in a simulated body fluid (SBF containing NaCl, NaHCO3, KCl, K2HPO4, MgCl2, HCl, CaCl2, Na2SO4) for 7 days to evaluate the characteristics of the surface affected by wear. The material structure and wear traces were investigated with Vega Tescan LMH II SEM, and chemical composition insights were obtained with an EDS Bruker detector (Bruker, Billerica, MA, USA).
During the investigations conducted for this research, occupational health and safety, the use of quality equipment and work tools, and personal protective equipment were thoroughly applied [21].

3. Results and Discussion

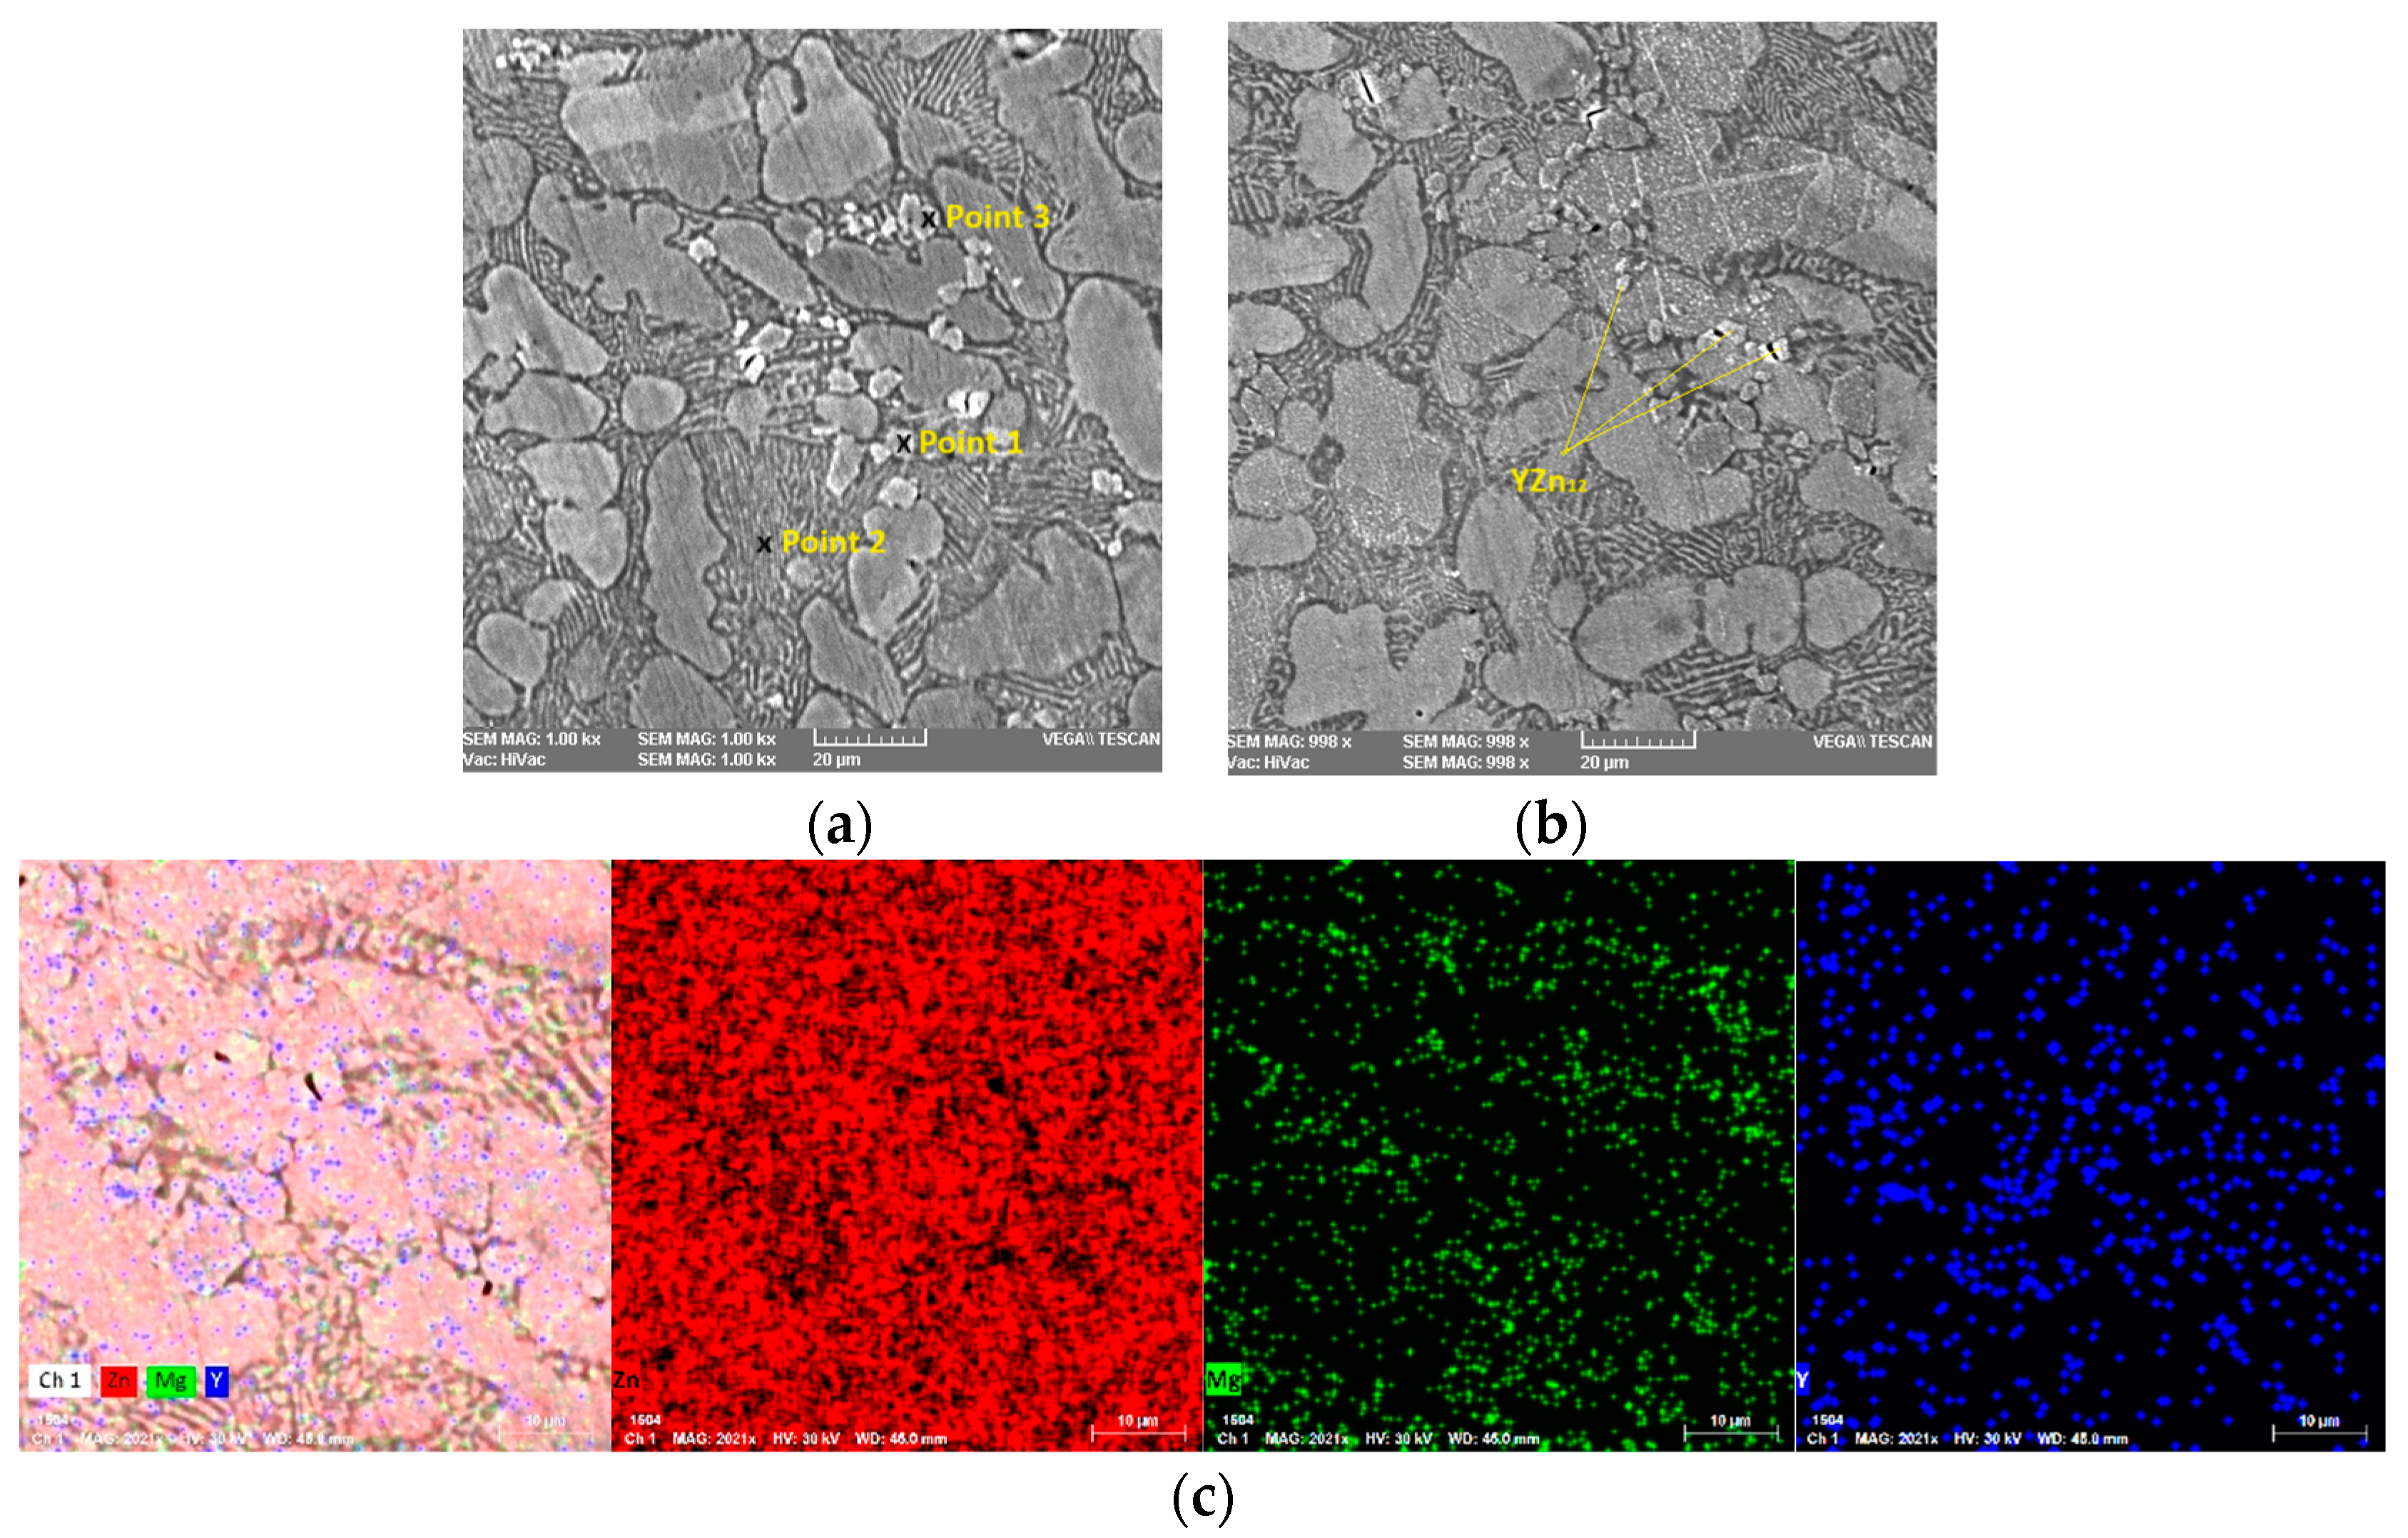
3.1. Structural and Chemical Composition Analysis

With an approximate 3 wt% Mg content, Zn grains are not outlined in the micrographs. The structure is eutectic, containing Zn and intermetallic compounds according to the Zn-Mg, Zn-Y, and Mg-Y phase diagrams [22]. A uniform distribution of compounds is observed at the macroscale, which is usually considered an advantage for the uniform degradation of materials. The induction melting process, due to its whirling currents, mixes the components of the alloy, increasing its chemical and structural homogeneity. Microstructural investigations of the Zn3Mg alloy have shown that its cast state consists of α-Zn grains and a eutectic (α-Zn and the intermetallic phase Mg2Zn11) located along the grain boundaries [16,17] for the ZnMgY alloy with good structural homogeneity without large amounts of inclusions along grain boundaries and a normal distribution of the ZnY and ZnMg compounds [23]. Samples processed by hot rolling through three successive passes and a heating step at 250 °C for 5–10 min for each pass showed different structural characteristics compared with cast materials. A reduction, after rolling, in ZnMg-based and YZn-based compounds by flaking and distribution in the Zn-α matrix is observed compared with the cast sample [17] (Figure 2).
The phase composition of the Zn3Mg1Y alloy (wt%) was composed of Zn dendrites and a eutectic composed of Zn+Mg2Zn11 that was found in the interdendritic zone. This structure is typical of Zn alloys containing 2 wt% Mg. When the alloying percentage was increased to 3%, for the experimental alloy, besides these characteristics, MgZn2 polyhedrons with irregular shapes appeared due to the peritectic reaction L + MgZn2 = Mg2Zn11. Thus, the spaces between the Zn dendrites and the MgZn2 polyhedrons were filled with the mentioned eutectic [24].
Besides the effect of the Mg addition to Zn, which has already been discussed in the literature [25], two main reasons could be identified for the increase in the hardness of Zn-Mg-Y compared to the cast cp-Zn. The first is related to the Y addition, which results in grain refinement with the appearance of eutectic and intermetallic phases at the grain boundaries [22]. Second, with the addition of more than 0.25 wt.% Y, the formation of the YZn12 primary intermetallic compound enhanced the hardening of Zn-Mg-Y alloys.
With the exception of small percentages of oxygen, which are not presented in the table results, the main elements identified in the material were Zn, Mg, and Y, as shown in Figure 2c. The quantitative results of the chemical composition are given in Table 1 (wt% and at%). The average chemical composition (in a 1 mm2 area after five determinations on different surfaces) was 3.03 Mg wt% and 0.9 Y wt%.
To determine the chemical composition of the observed structural elements, four determinations were performed on the marked areas in Figure 2a. The analyzed compound at point 1 is typical YZn12 (formula Zn24Y2) [26]. For point 2, the material matrix consisted of an α-Zn solid solution with dissolved Mg.
After melting the material twice, no structural defects such as pores, cracks, or voids were identified at the microscale. The experimental alloy was chemically homogeneous, with no separation or agglomeration of undissolved elements. The hot-rolling process decreased the compound dimensions (YZn12 and MgZn2) by reducing them at least by half, as shown in Figure 2b compared with Figure 2a—cast-state microstructure.

3.2. Vickers Microhardness Determination of Hot-Rolled Zn3Mg1Y Alloy

Vickers microhardness experiments were performed on the rolled and worn samples. The tests targeted three areas, shown in Figure 3a being selected from the wear trace, point 1, xHV1, from the edge of the wear trace, xHV2, and from the alloy, xHV3, at a minimum distance of 2 mm from the wear trace to avoid a mechanically influenced area. The values obtained are shown in Table 2.
Figure 3c–e show the 3D electron microscopy images of the wear pattern. Since the wear profile is too large for investigation with atomic force equipment, the 3D images were obtained by processing the 2D information taken by the secondary electron detector.
Aspects of the worn surface profiles given in Figure 3 confirm the results obtained above, with a higher friction coefficient for the pure Zn sample and a lower coefficient for the Zn3Mg and Zn3Mg1Y alloys, inversely proportional to the microhardnesses recorded. Table 2 shows a comparative analysis of the microhardness values obtained from the hot-rolled and worn samples. The analyzed areas are specified in Figure 3a. The analysis of the average microhardness values shows that in the wear zone, the highest value is for the Zn3Mg1Y alloy, although pure Zn also has a very high value because of the hardening phenomena occurring on the mechanically stressed surface.
The highest average value was recorded for the Zn3Mg alloy subjected to a force of 3000 g, i.e., 229.8 HV. For the Zn3Mg1Y alloy, the external stress strain increased to 30 N, leading to an increase in the microhardness of the material due to an accentuation of the surface roughening phenomenon which is the opposite for pure Zn. The roughening phenomenon led to the hardening of the externally stressed surface with almost double values compared to the unstressed rolled alloy. Using the OWR-Anova analysis method (performed by Tukey’s test at a significance level of 0.05) on the experimental results for the microhardness values on the same areas of the samples, a significant difference was observed between the values obtained on pure Zn compared to those obtained on Zn alloys. No outlier values were identified compared to those obtained. In the case of implants, especially those for bone fractures, higher hardness can be considered advantageous because it reduces the rate of pitting in wear zones where the stresses between the implanted metal elements, such as the plate and holding screws, are high.

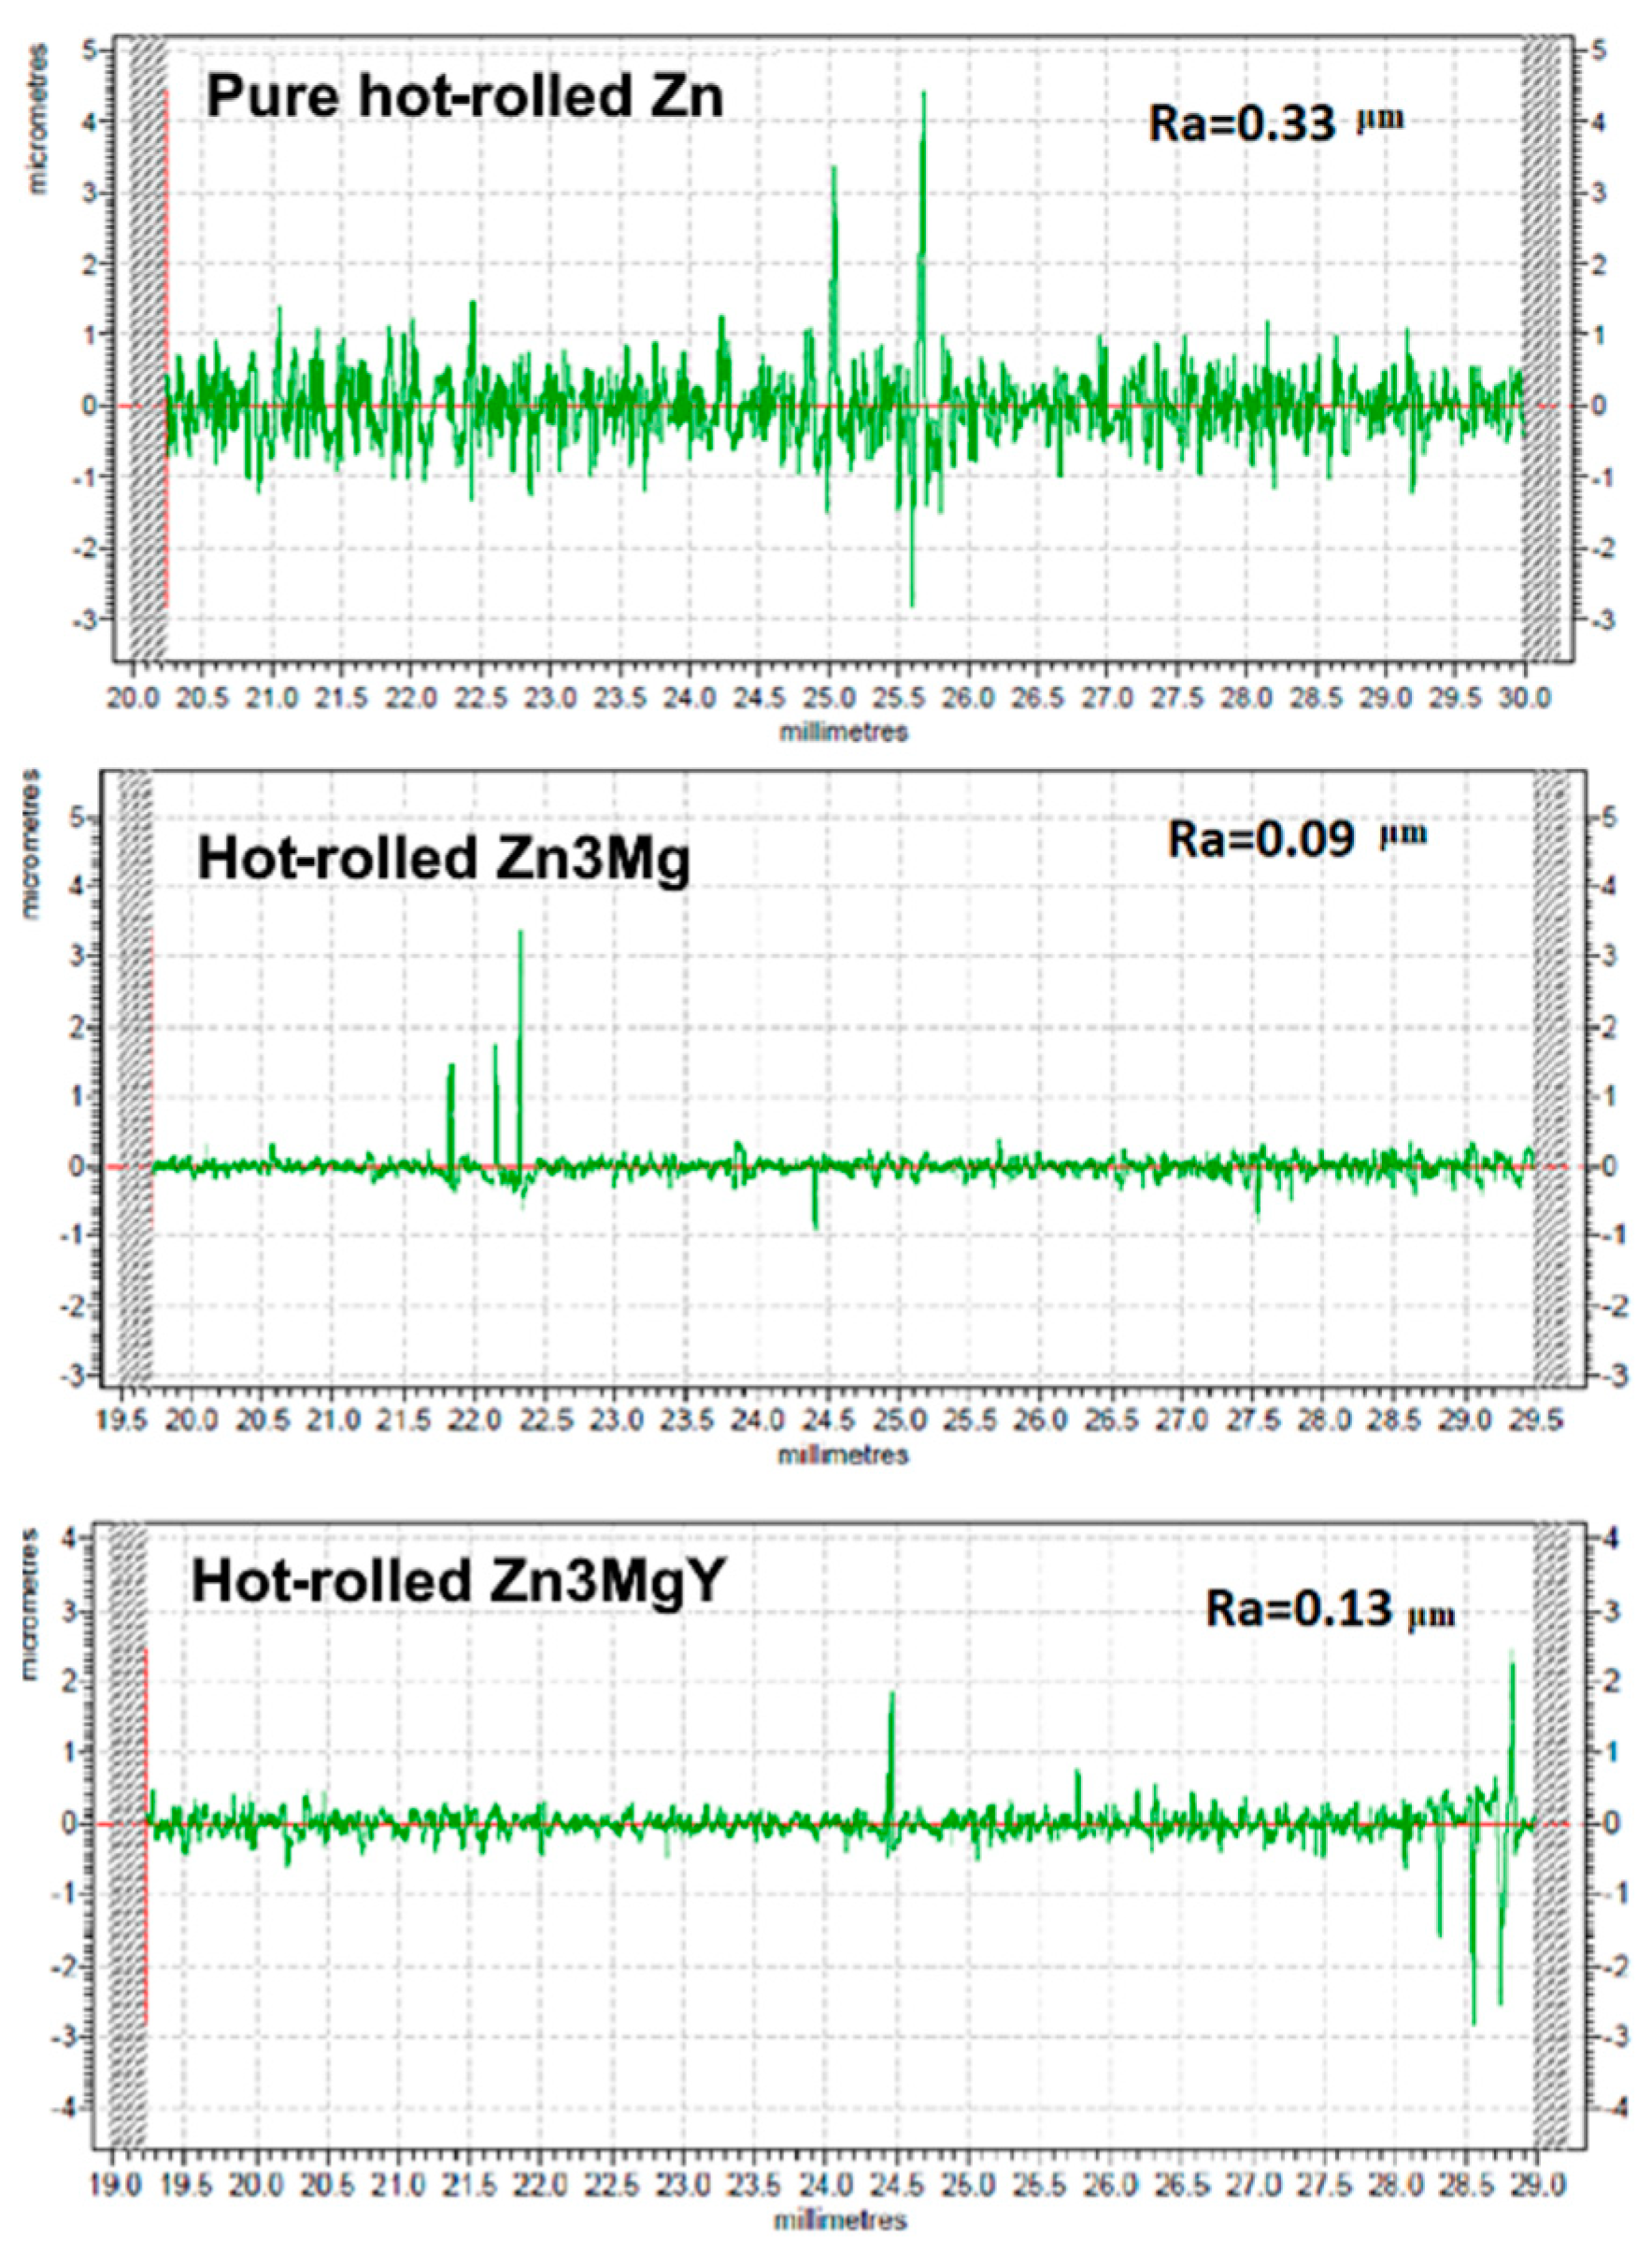
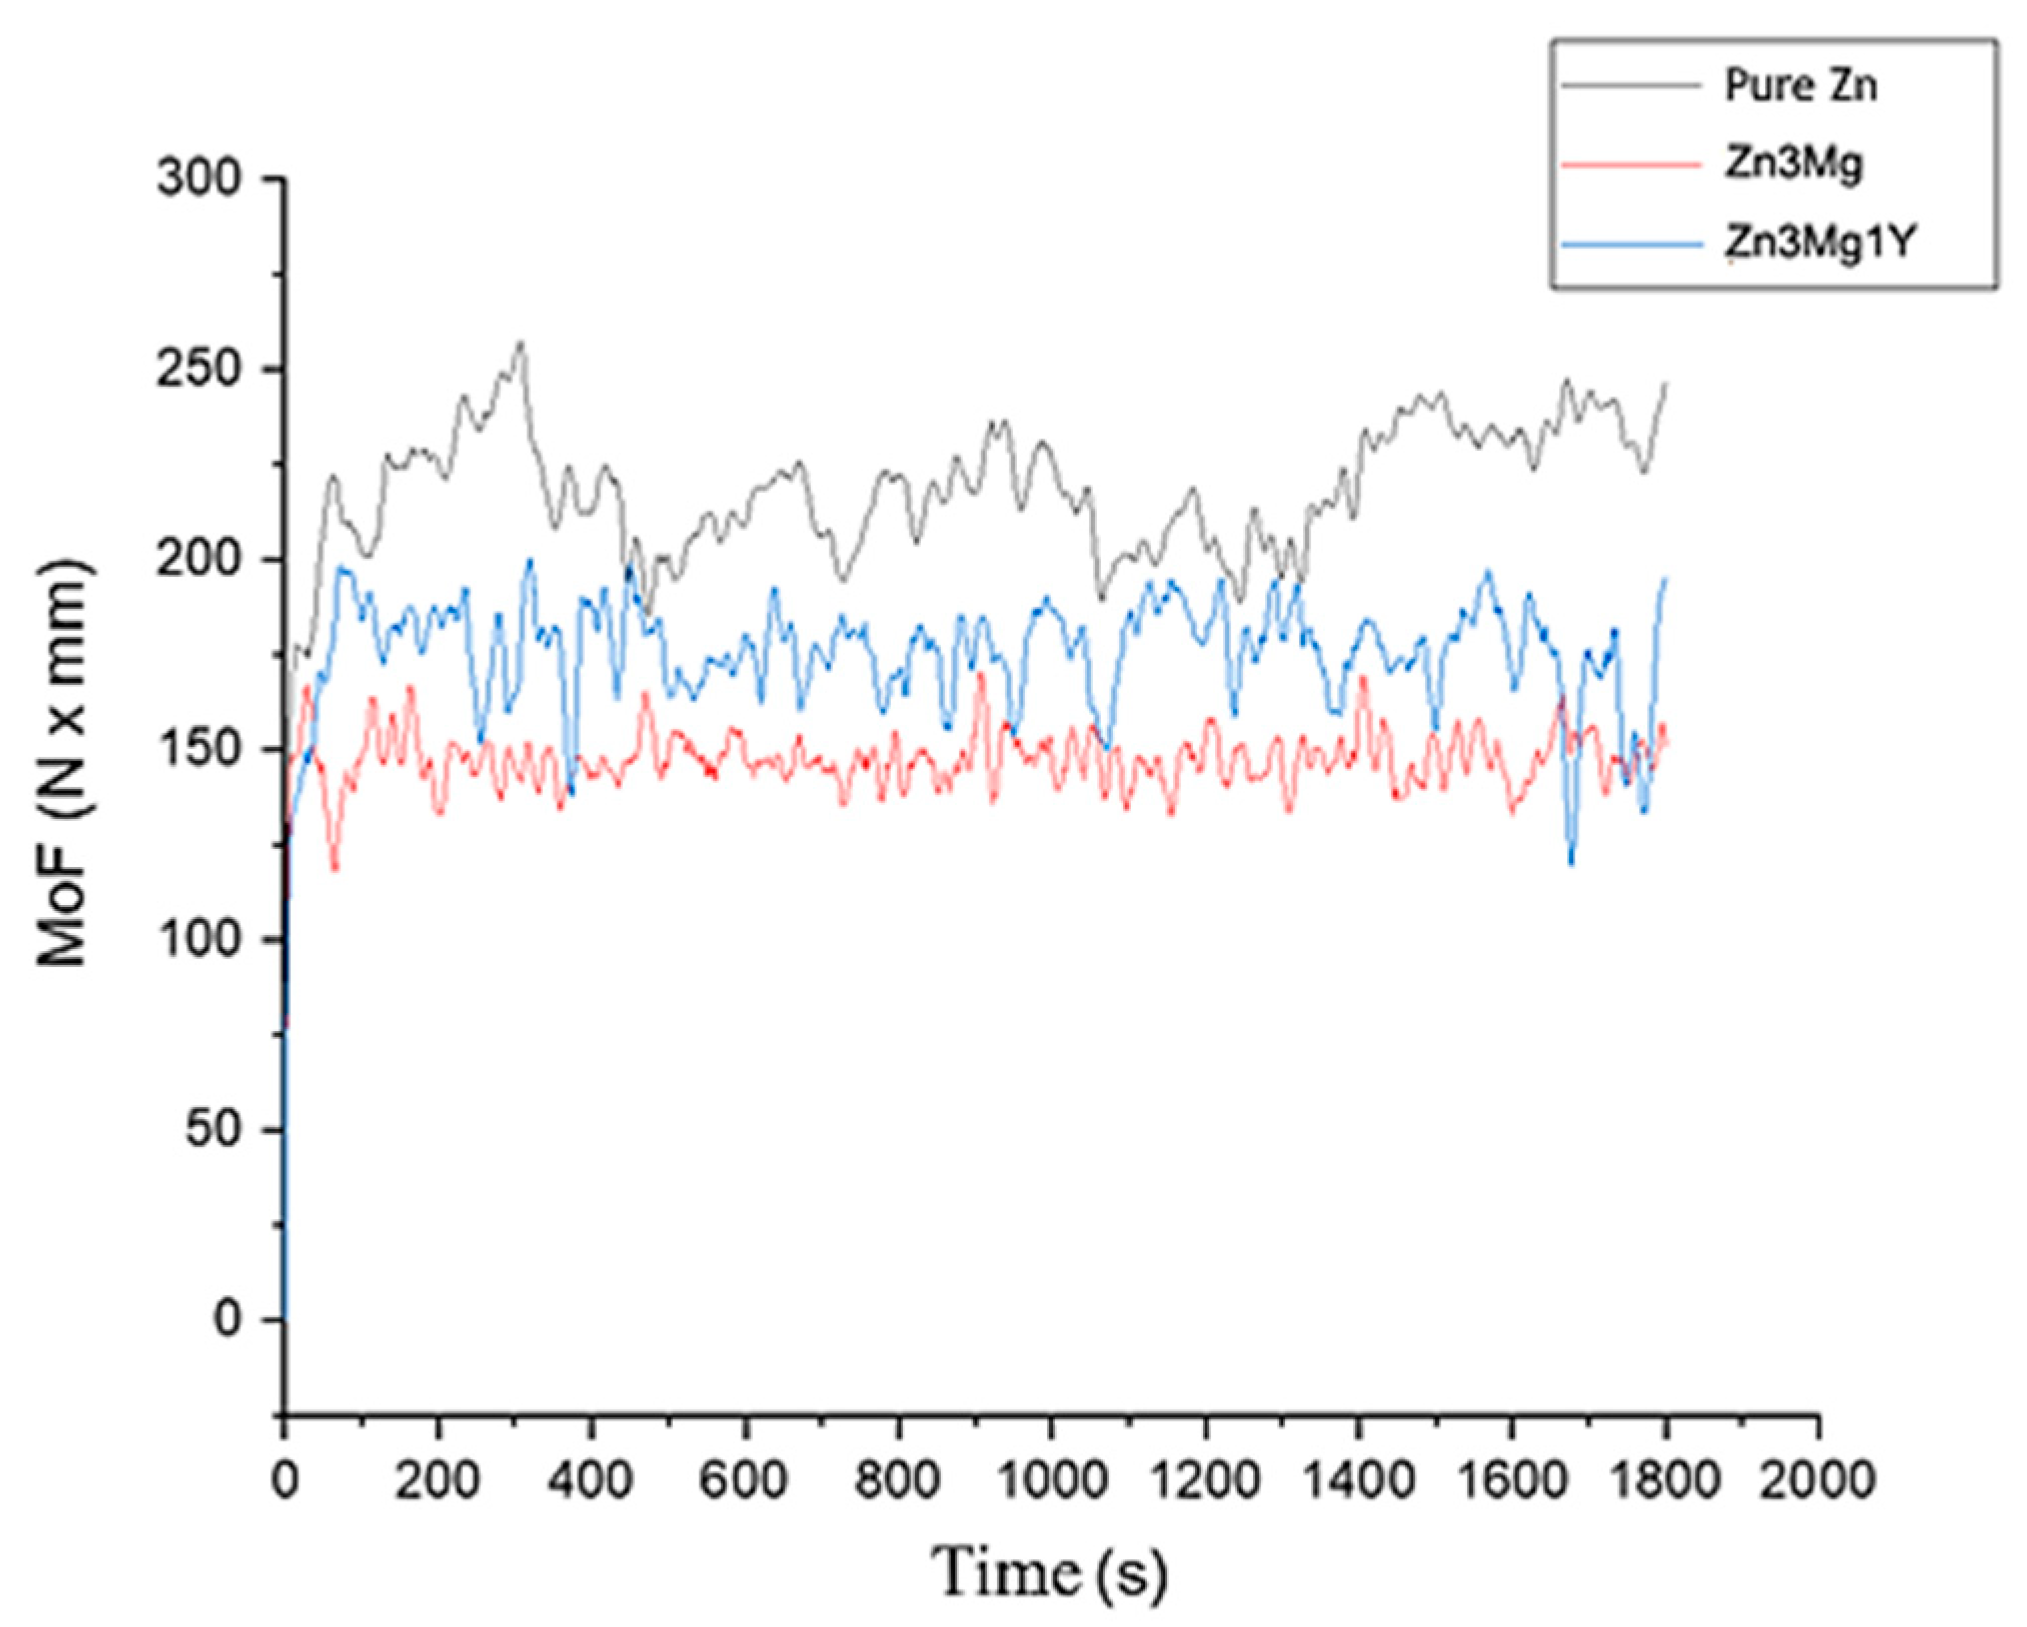
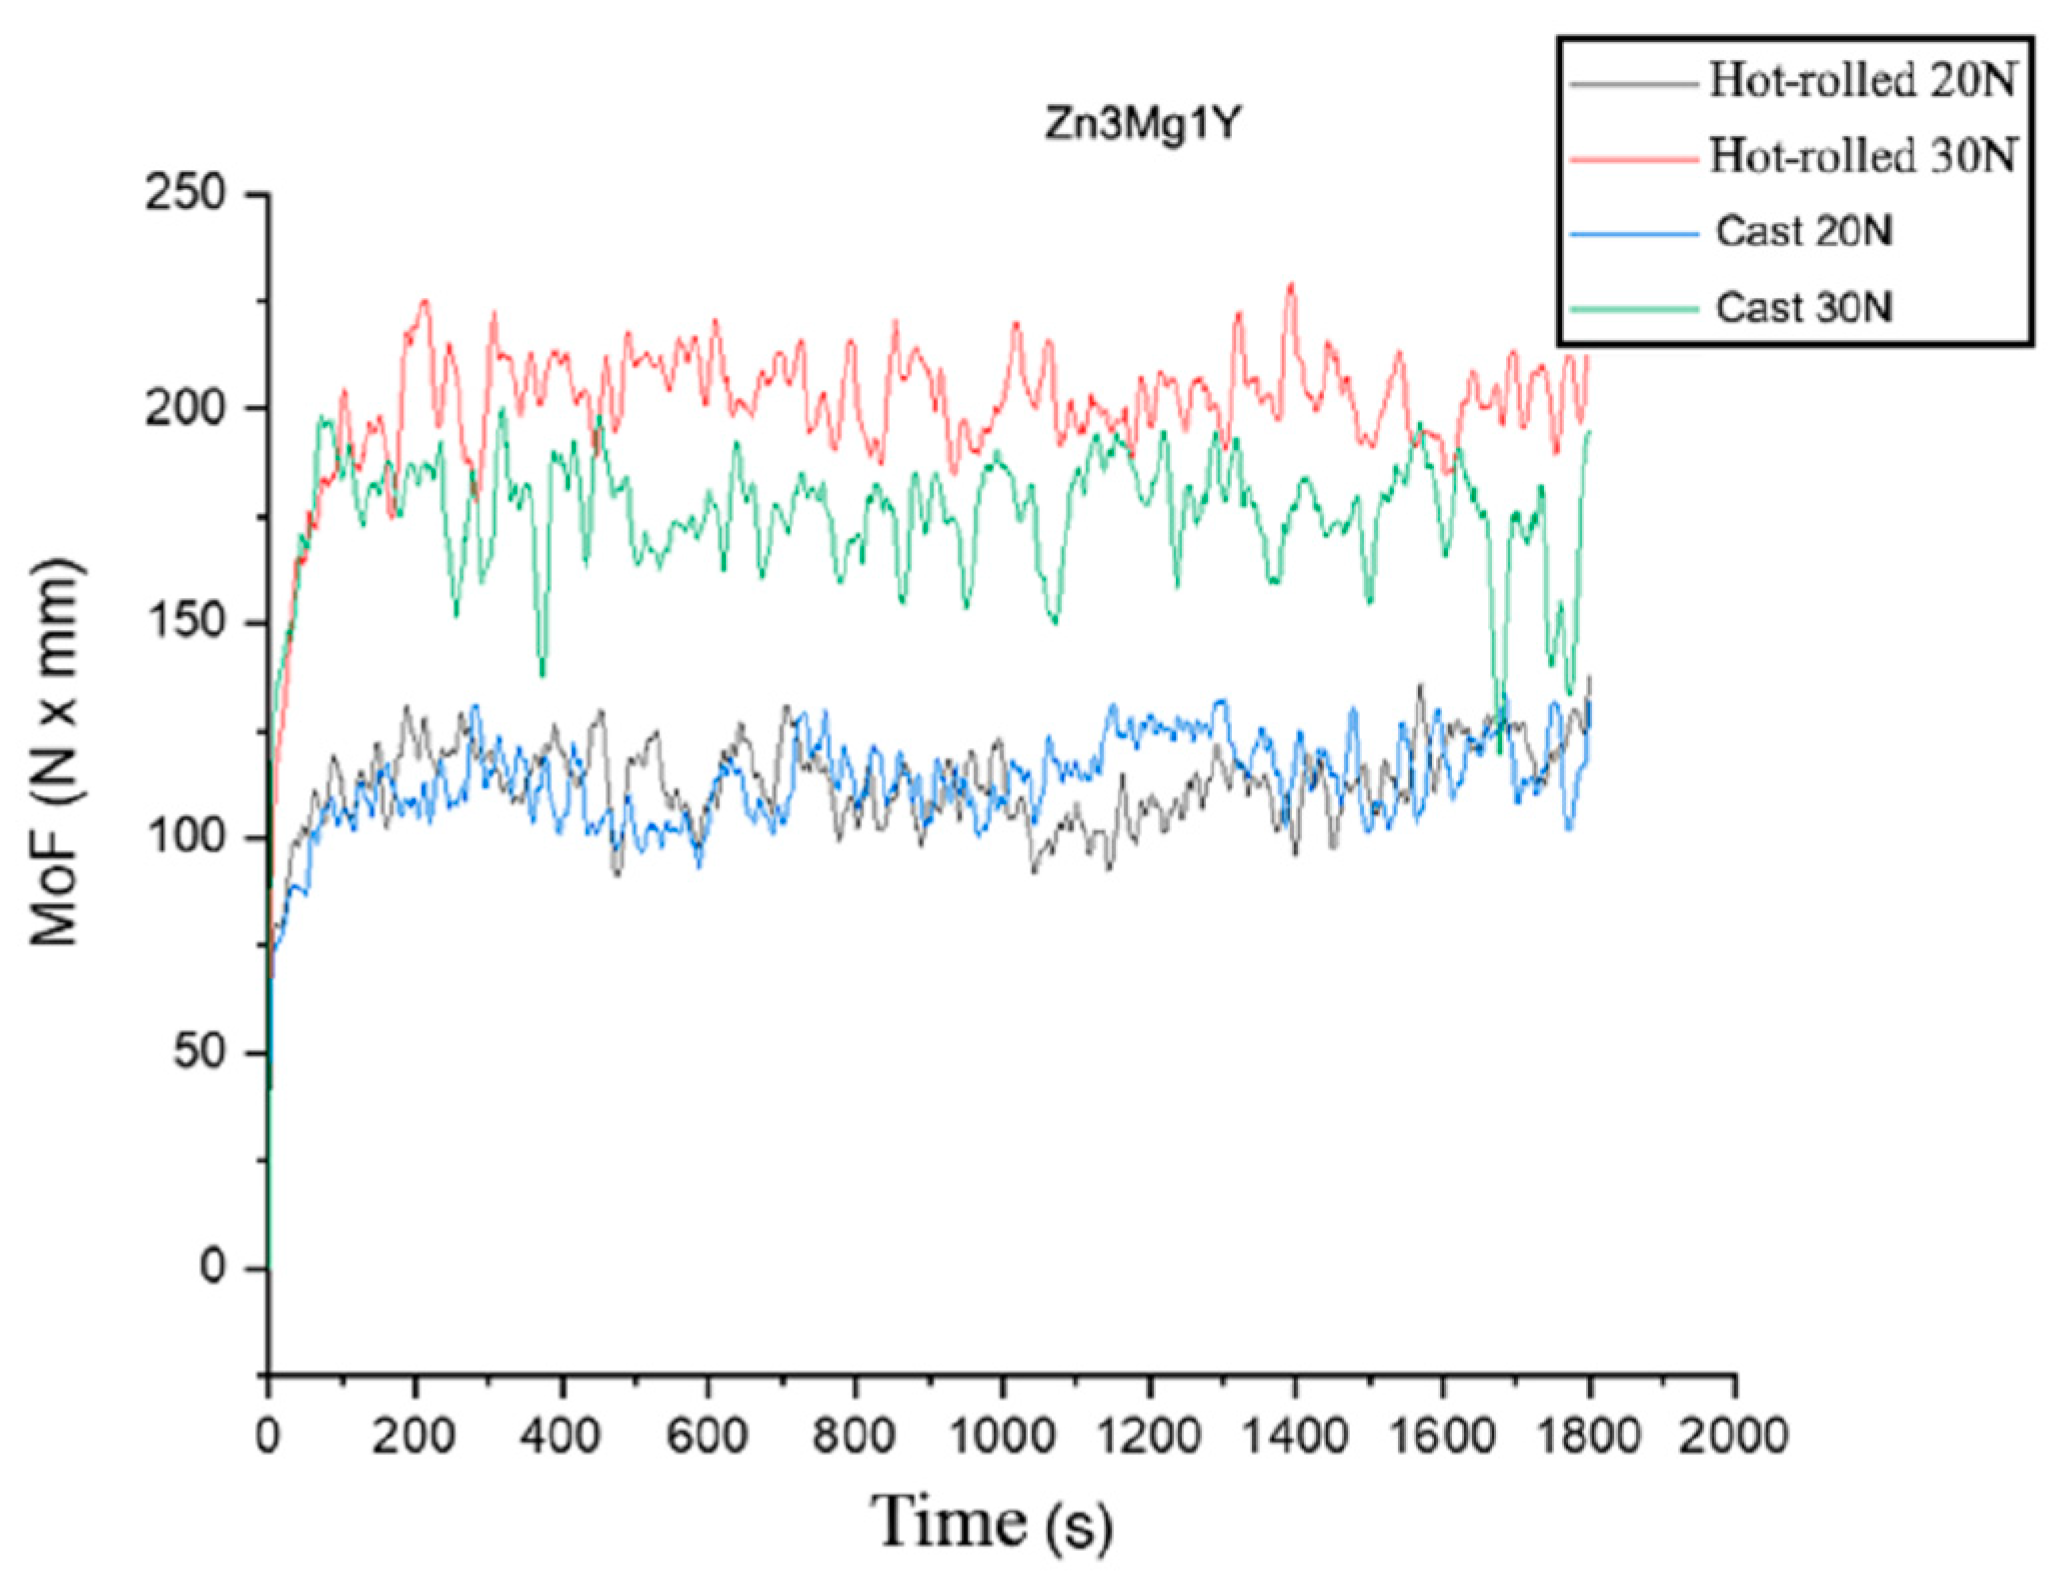
3.3. Wear Resistance Tests of Experimental Hot-Rolled Materials

The wear resistance tests performed on the Amsler equipment were conducted with stress forces of 20 and 30 N. Surface profiles were determined for the surfaces analyzed using a Taylor Hobson laboratory profilometer and are shown in Figure 4. Differences in surface roughness between the three samples resulted from the material characteristics, which were prepared under similar conditions. The surface roughness condition also influences the recorded wear resistance results. Comparatively, between the two alloys, the differences in roughness are smaller, and the surface profile is similar to negligible variations.
The same comparison was made for the hot-rolled samples named in the experiments with pure Zn hot-rolled, Zn3Mg hot-rolled, and Zn3Mg1Y hot-rolled. The results for 20 and 30 N are shown in Figure 5 and Figure 6.
The top sample represents the stationary covered plate under the test. The output data include the average friction torque of the obtained signal, the average friction coefficient, and the statistical characteristics. For Gaussian signals, Kurtosis is 3; a value of K > 3 indicates accurately centered data with little noise.
Analyzing the last two values, the hot-rolled Zn3Mg sample has the best result out of the three, with the MoF values being the lowest compared to all the other results for both loads.
Furthermore, a comparison between the cast and hot-rolled samples of Zn3Mg1Y is shown in Figure 7. The behavior of both samples at a light load of 20 N is similar, but the hot-rolled sample has a lower frictional moment at a higher load (30 N) than the cast sample.
The average values of the coefficient of friction (CoF) were calculated and analyzed for the two stress forces, Q = 20 and 30 N. In the case of the pure hot-rolled Zn sample, high CoF values were obtained both at Q = 20 N and at 30 N (the CoF values were 0.28 (±0.02) and 0.25 (±0.02), respectively) with the mention that the values are also influenced by the high value of the surface roughness (Figure 4). For the hot-rolled sample of Zn3Mg both at the 20 N and 30 N force and taking into account the very low value of the surface roughness, Figure 4, much lower values of the respective CoF friction coefficient of 0.06 (±0.01) for Q = 20 N and of 0.175 (±0.02) for Q = 30 N were obtained when the influence of the roughness value on the CoF value decreased. In the case of the Zn3Mg1Y alloy, a reduction in the CoF value is observed from the cast sample (COF:0.22 (±0.02)) to the hot-rolled one (CoF:0.175 (±0.02)) for the force of 30 N. Along with the reduction in the stress value (to Q = 20 N), a decrease in the value of the coefficient of friction for the cast sample (to 0.2) and a very small reduction in the CoF value for the rolled sample to 0.19 (±0.01) were observed. This behavior of the rolled Zn3Mg1Y alloy can be an advantage in practical cases where the values of external stresses can vary in operation and the response of the material remains relatively the same.
The worn surfaces show macroscopic traces of wear resistance testing with an observable loss of material. The sample masses before and after wear and the mass loss are shown in Table 3. The wear rate can be determined as the mass loss of the worn sample divided by the stress applied during the test (2000 g and 3000 g, respectively) [27]. From the values of wear mass loss and wear degradation rates, it can be seen that they have higher values at the 2000 g load than at the 3000 g load.
All the tested materials showed pronounced wear marks, including material removal through wear, the occurrence of corrosion sites, and the formation of cracks and oxides or other compounds on the surface. At a lower force loading of 2000 g, a higher number of oxides on the surface was observed, and at a higher force loading of 3000 g, considerable surface wear was observed but without significant surface compounds. The average wear rate is in accordance with the friction results and mechanical properties of the materials in the hot-rolled state.
The high friction coefficient of pure zinc caused this sample to undergo the greatest material loss through wear. The harder Zn3Mg and Zn3Mg1Y alloys showed a higher wear rate with increasing applied external stress force.

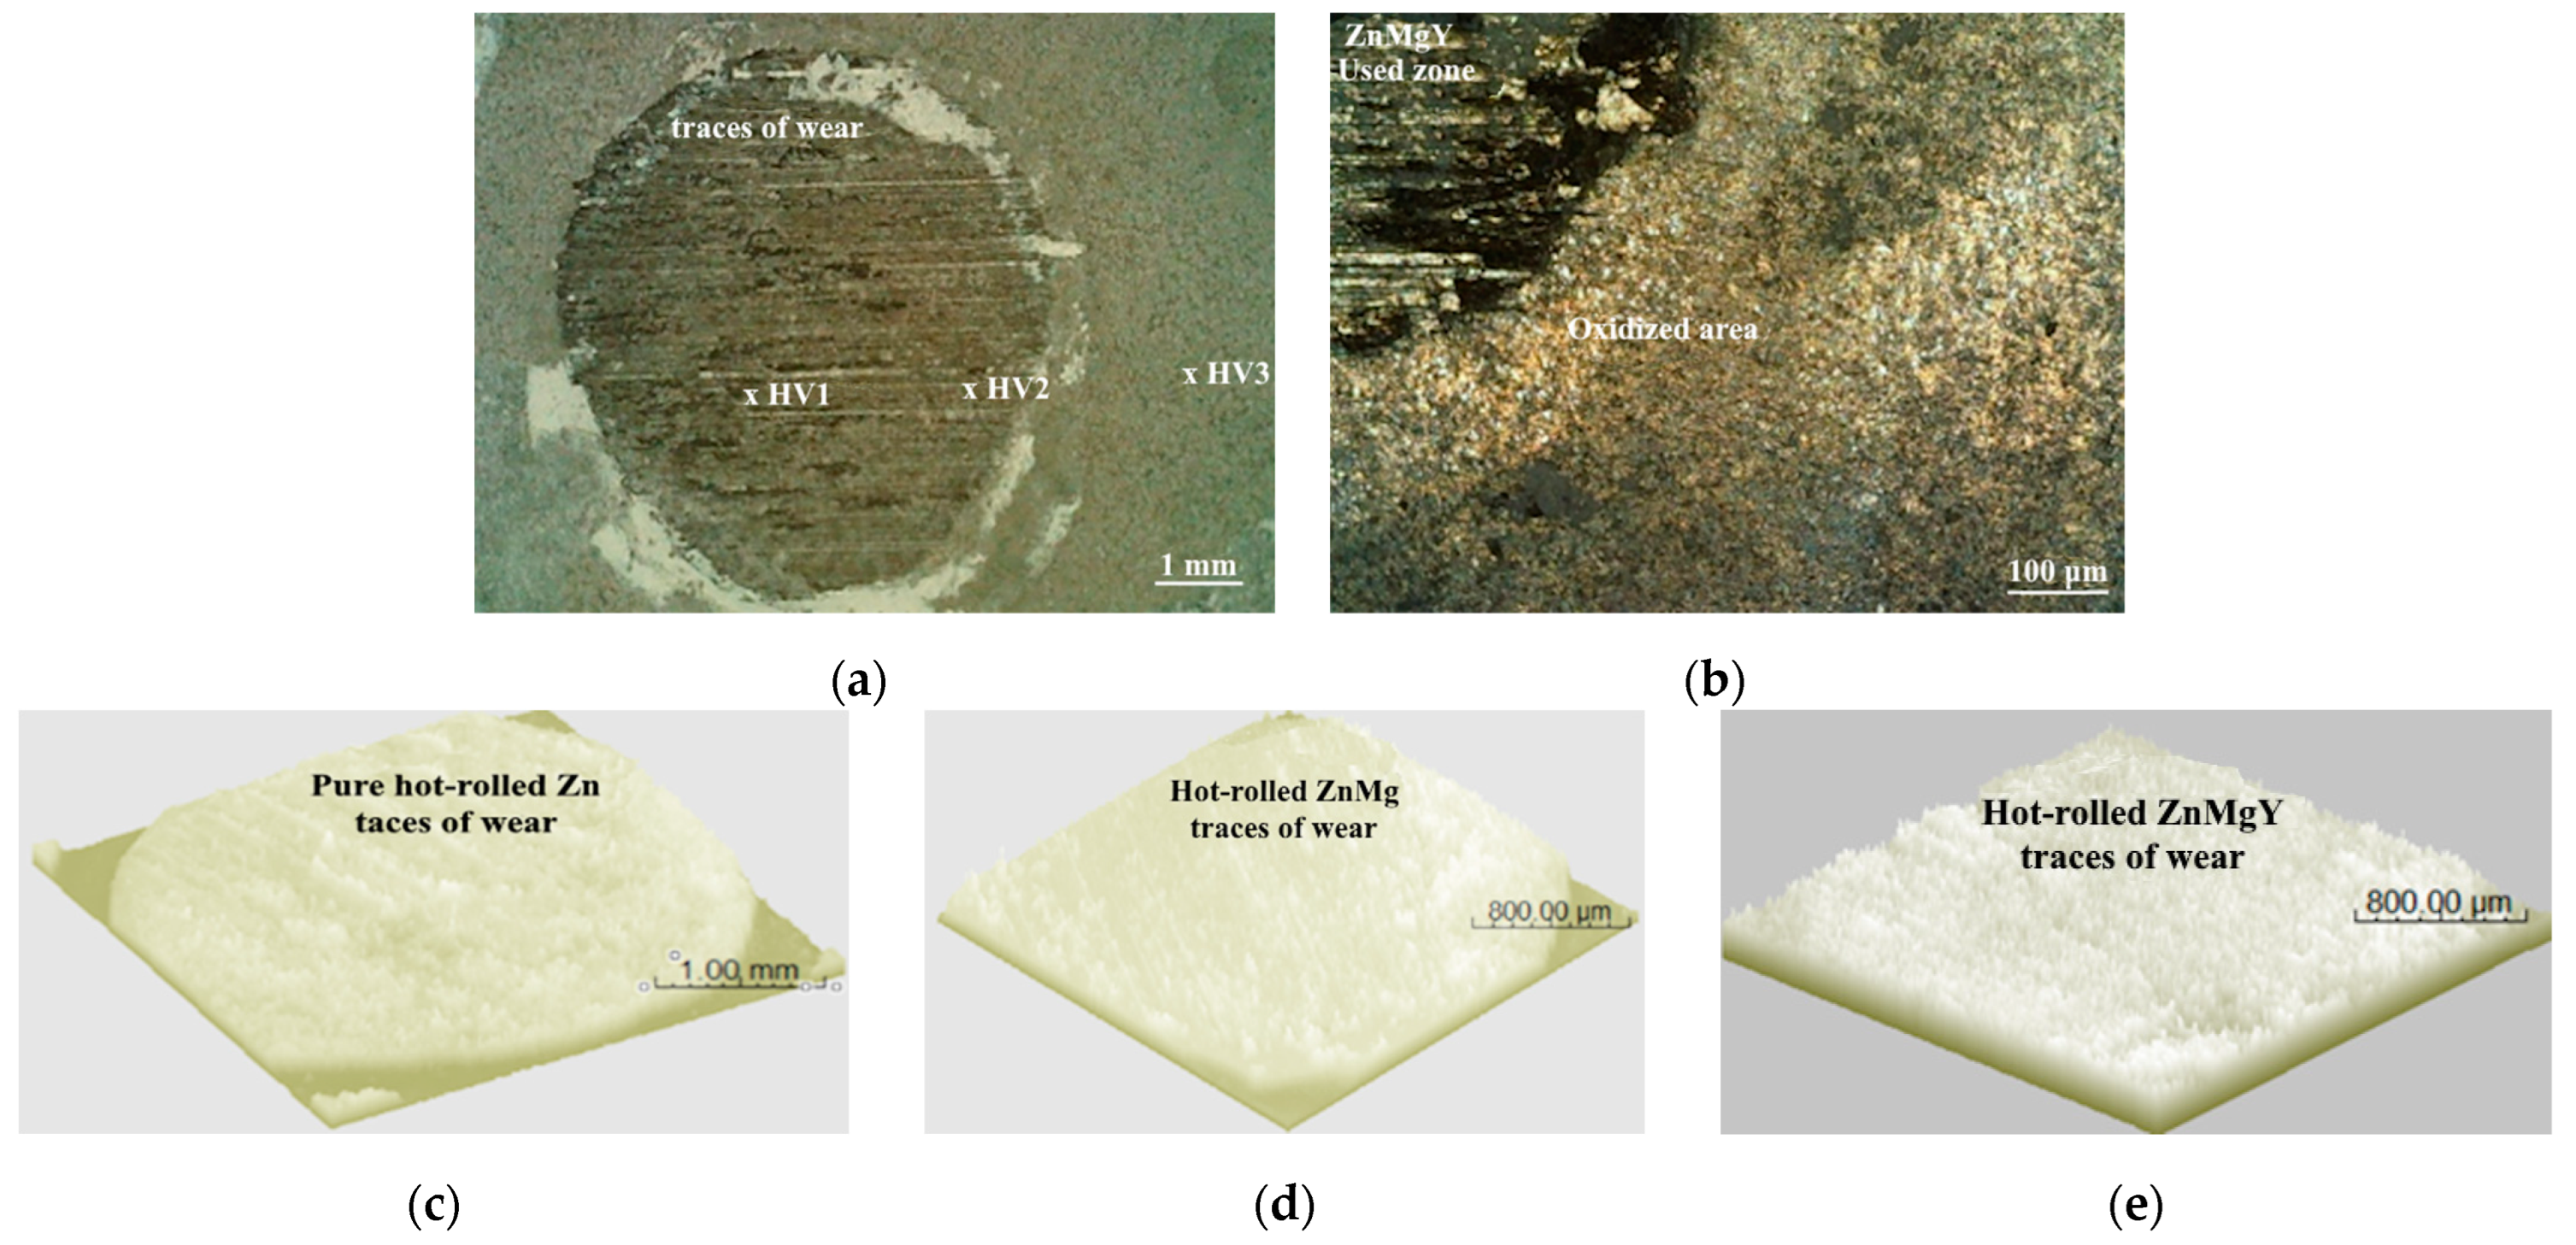
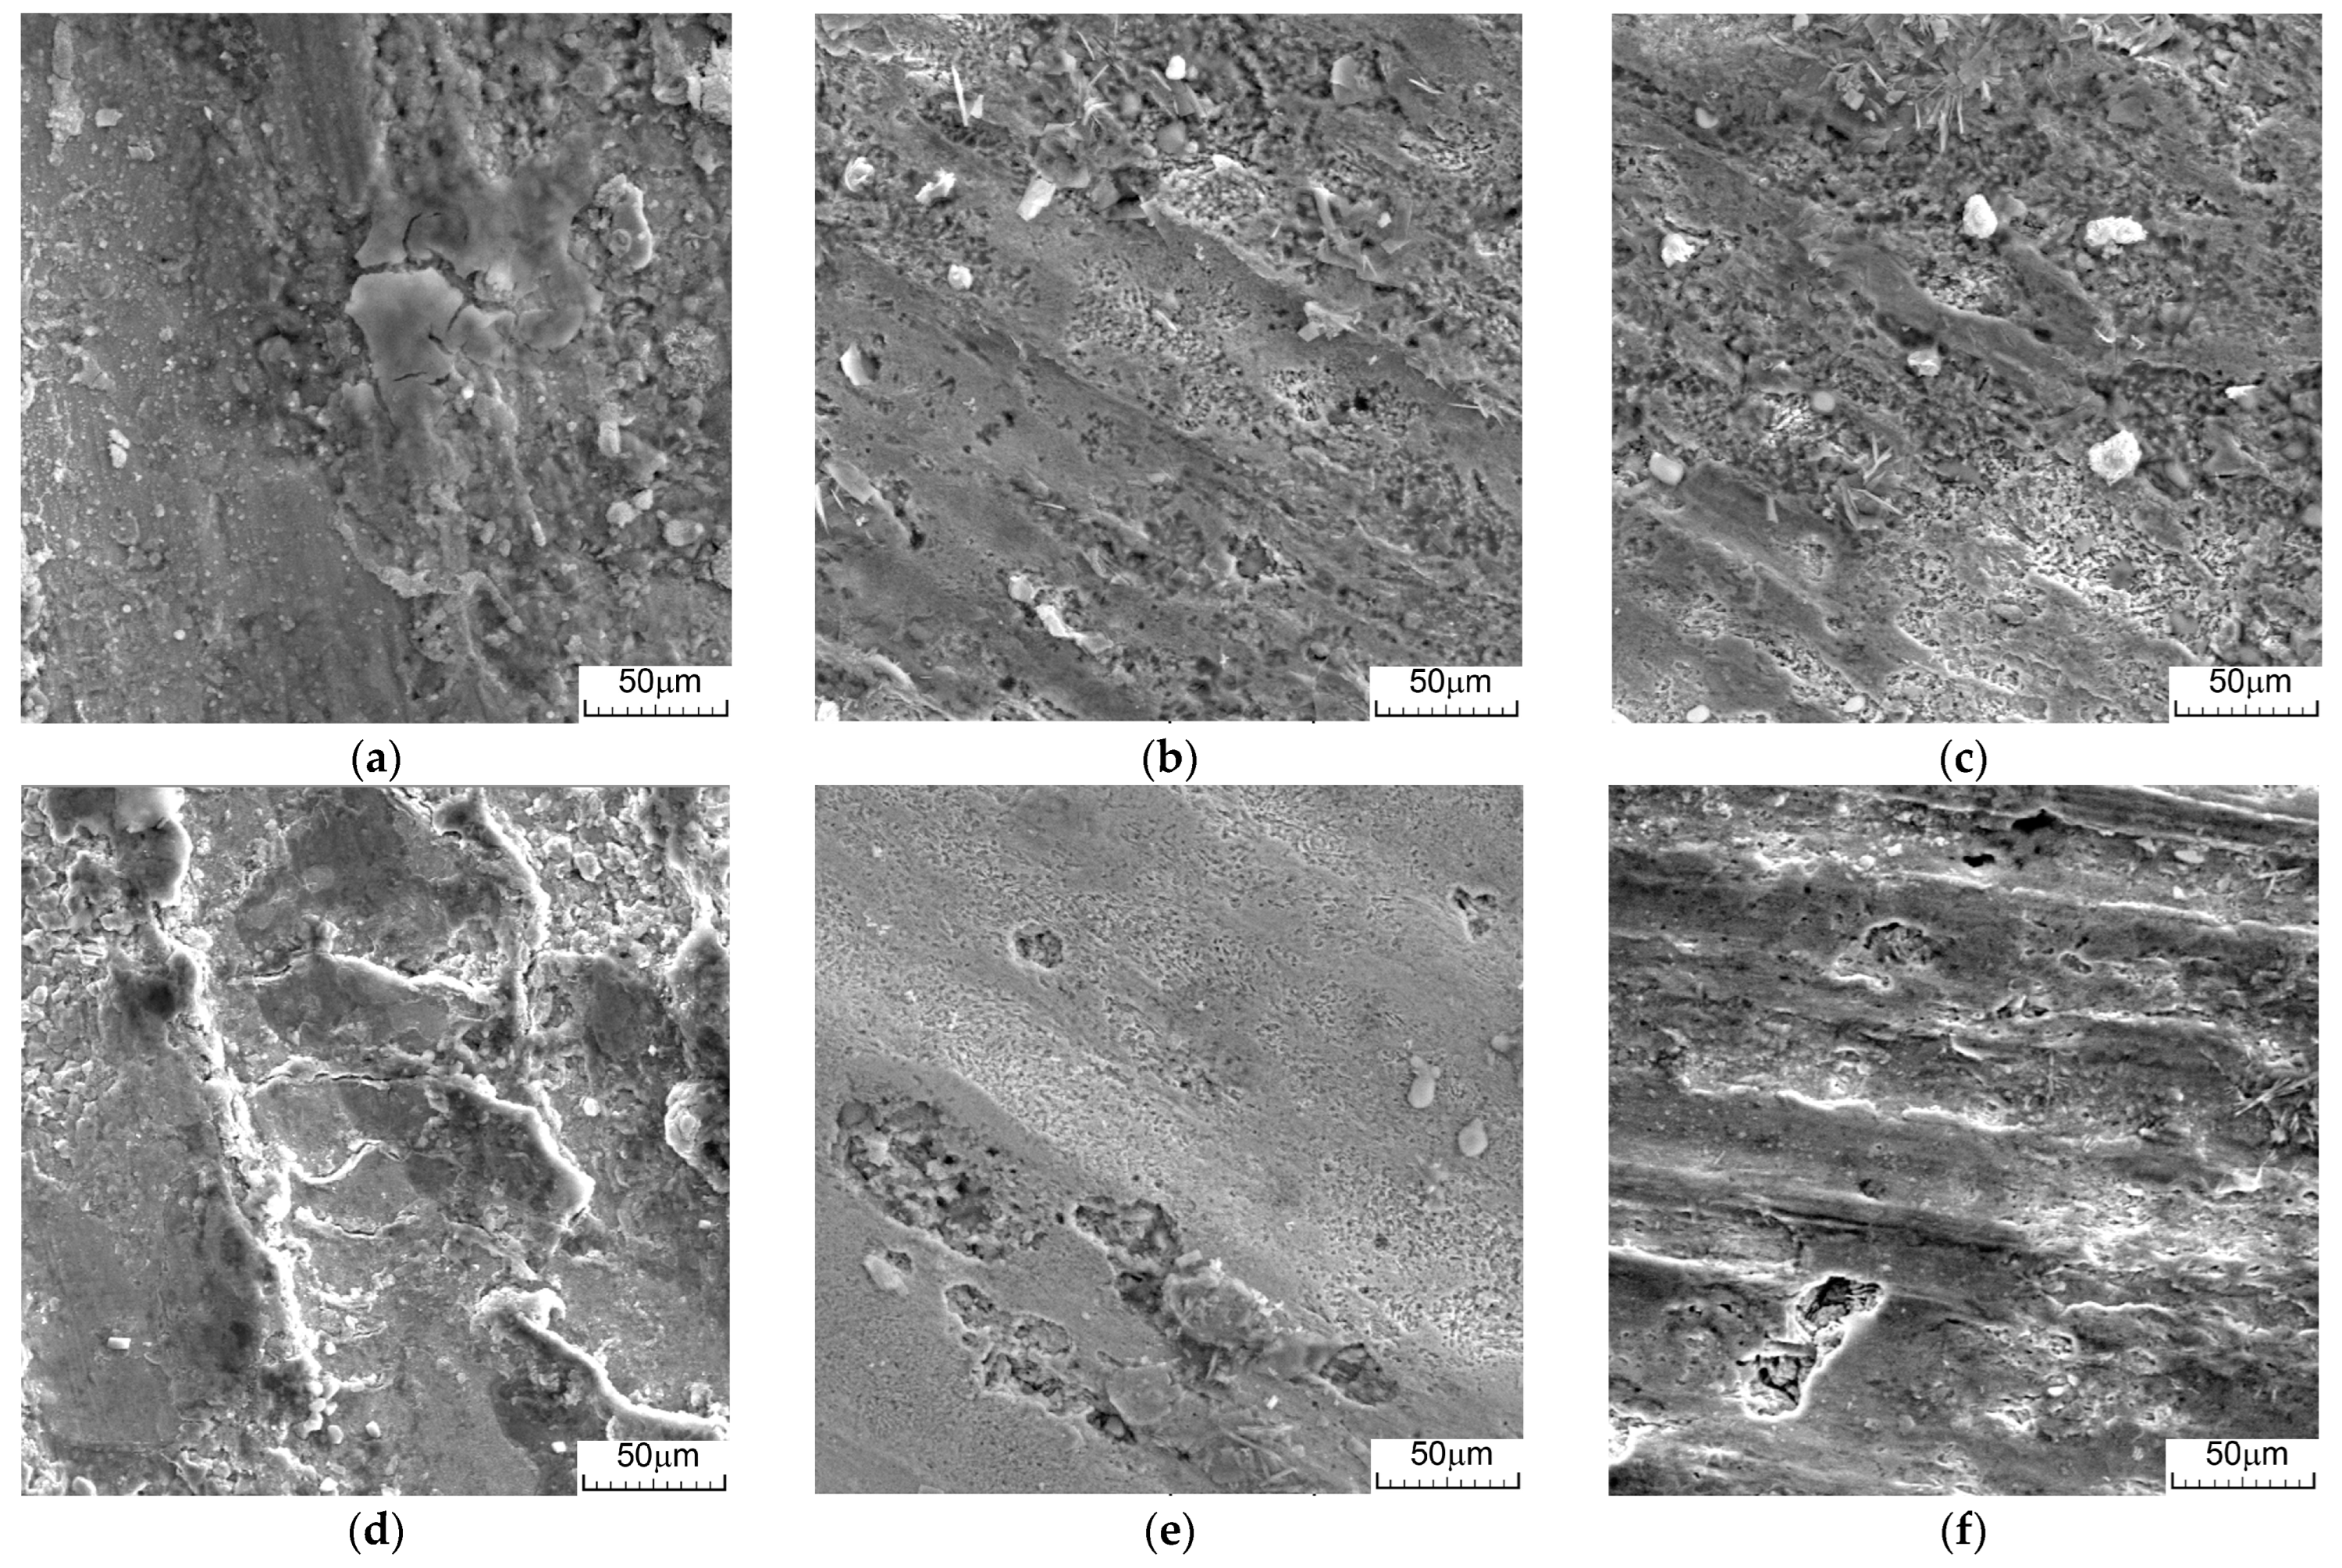
3.4. Microstructural Analysis of Hot-Rolled and Worn Alloys

The results obtained from the friction wear resistance tests are in correlation with the wear intensity results, as a lower friction coefficient does not always mean a lower wear rate, as the wear rate also depends on the sample hardness, with a higher hardness being beneficial to wear resistance. Also, the various oxide and chemical compound formations on the surfaces can reduce the wear rate, and the results should also be correlated with SEM images (Figure 8) and EDS analysis (Figure 9).
From the SEM images of the worn traces in Figure 8, areas of pronounced wear with pieces of material detached from the surface, cracks, and oxides were observed for pure Zn, which is a soft material. For higher wear forces (Figure 8d), a waviness of the material on the surface and a more pronounced deepening of the wear mark were also observed for pure zinc. For the alloyed samples, Zn3Mg and Zn3Mg1Y, no significant differences were observed between the wear marks. Compared to pure Zn, the alloys did not show areas of overlapped or cracked material due to wear nor areas of material packing observed in Zn. They instead featured grooves, deeper scratches, and material gauging.

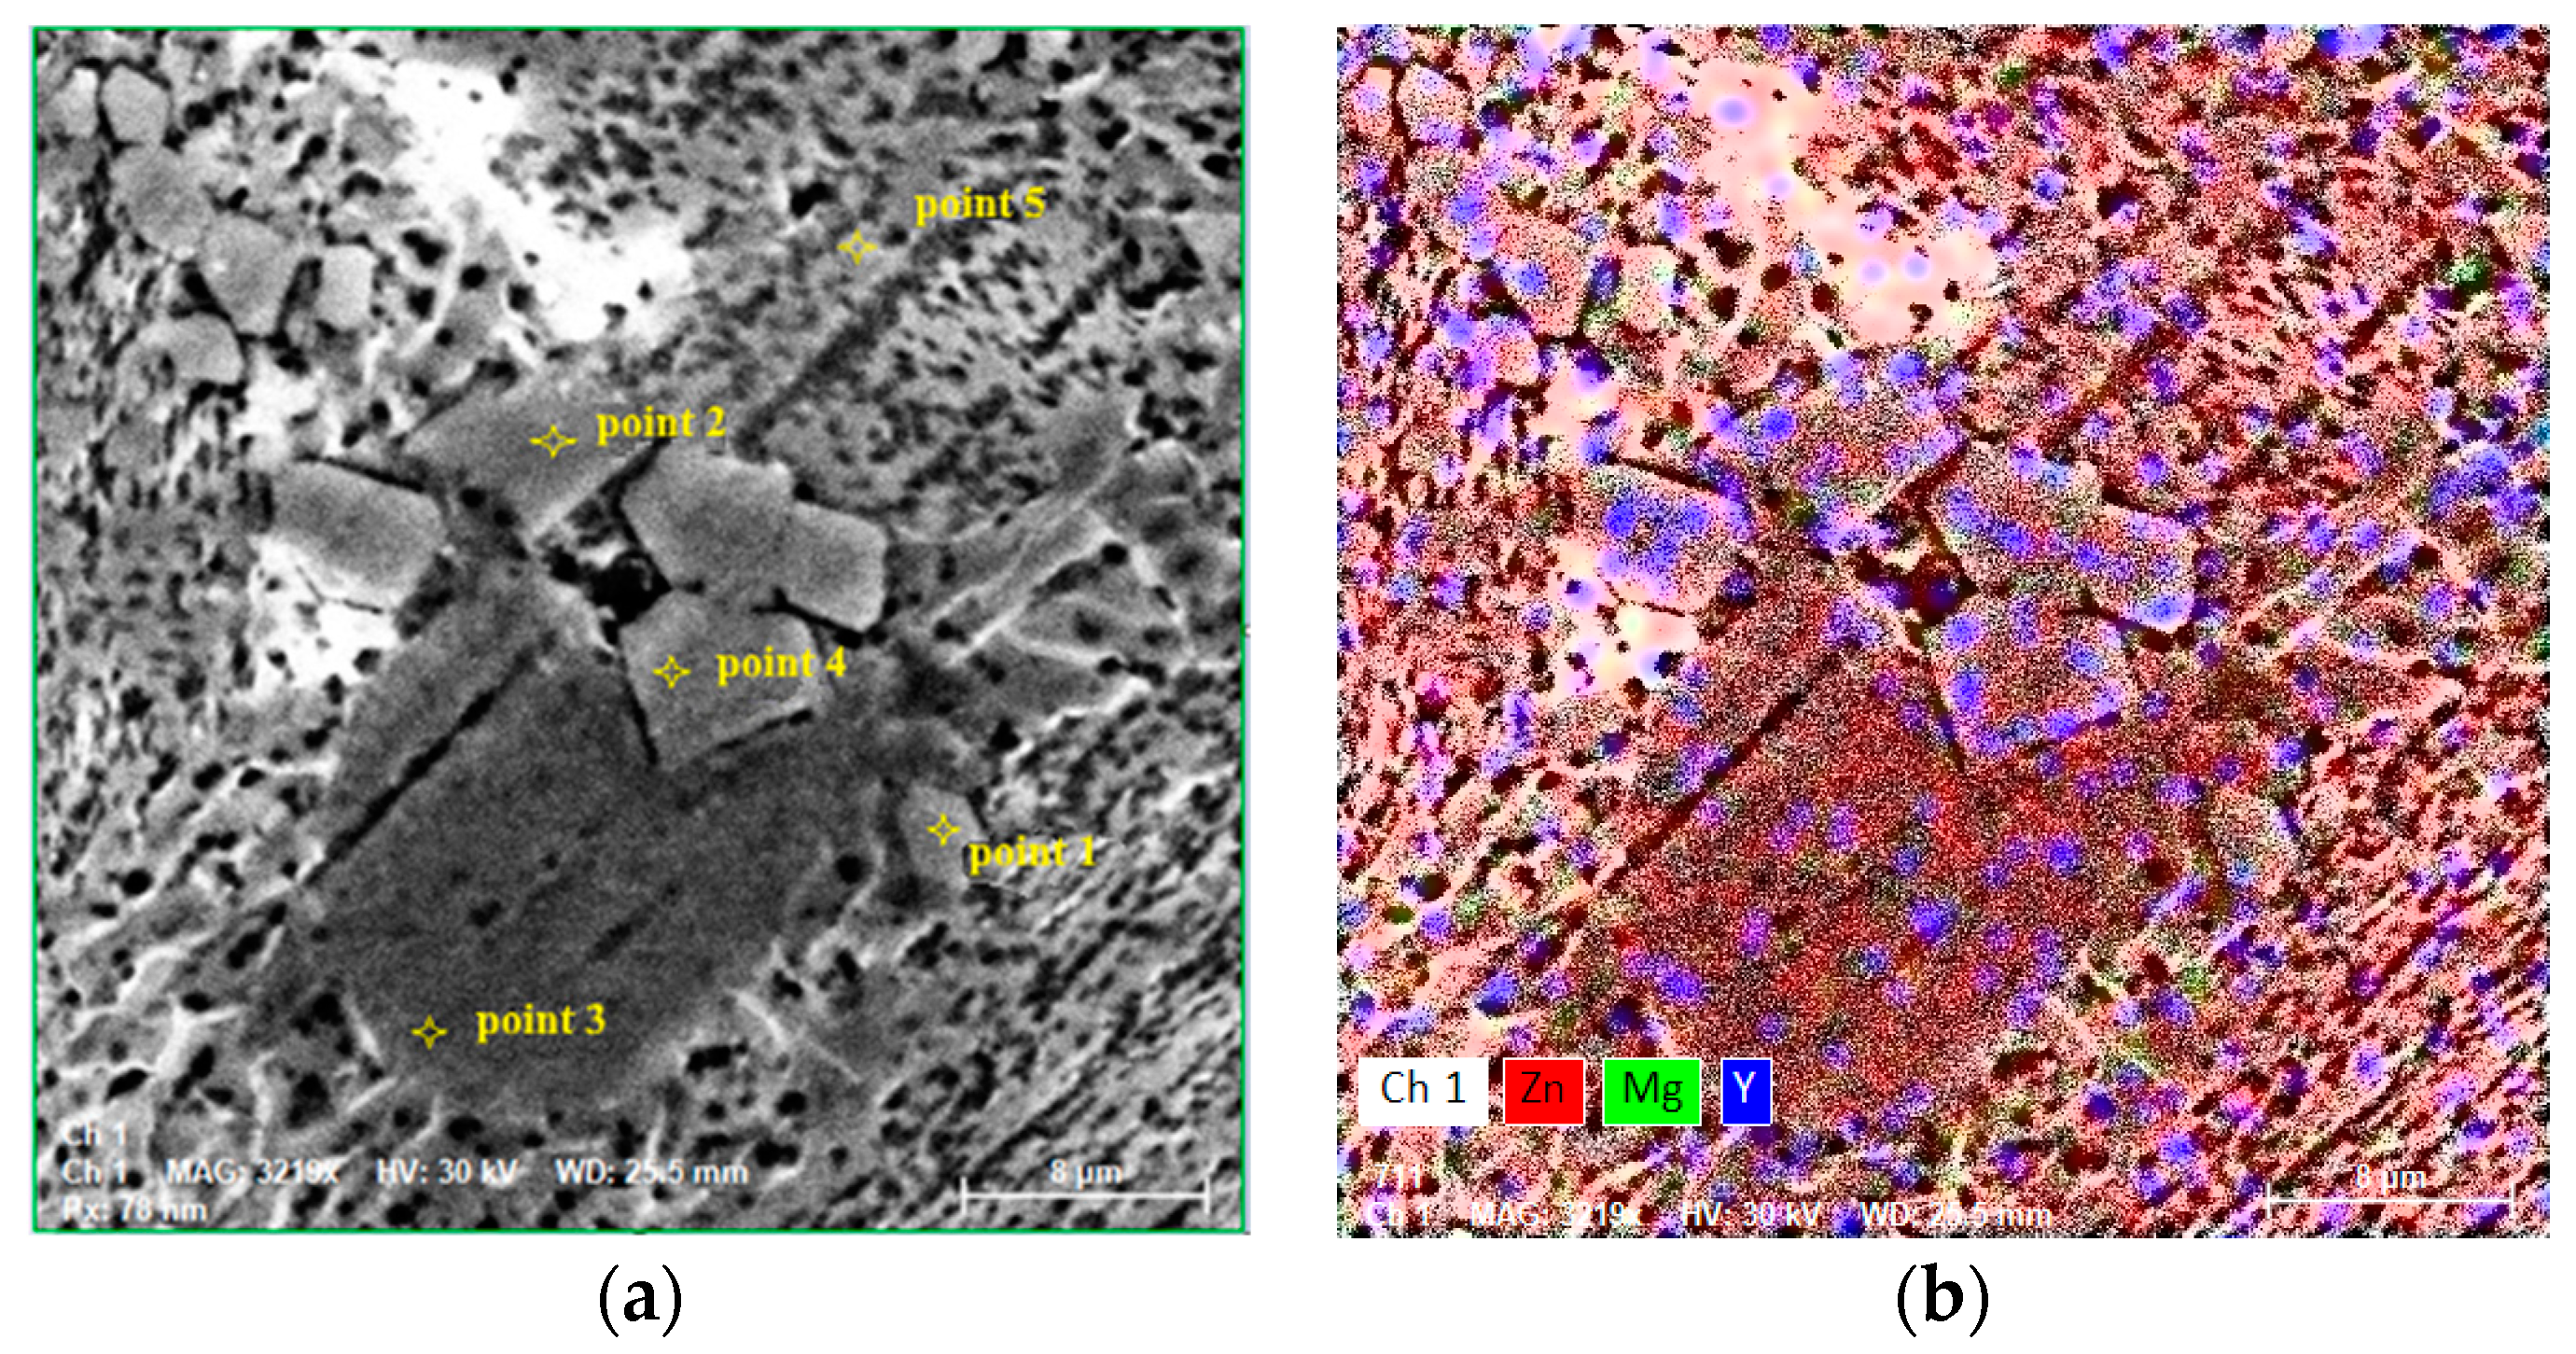
3.5. Chemical Analysis by EDS of Hot-Rolled and Worn Sample Surfaces

Figure 9 shows the details at a small scale of the material surface structure of Zn3Mg1Y after hot rolling in Figure 9a and the areas selected for chemical point analysis (a 90 nm diameter spot) and the distribution of the main component elements, i.e., Zn, Mg, and Y in Figure 9b.
Table 4 shows the chemical composition of the hot-rolled Zn3Mg1Y sample. By spot analysis, the solid α-Zn solution, the chemical composition at point 3, Figure 9a, the YZn12 compound at point 2, also identified in the cast case by X-ray diffraction [28], and the Mg2Zn11 compound (a hard and brittle eutectic phase, which is distributed in the softer matrix of α-Zn) at point 1 were revealed.
The Y2Zn17 compound [29] was also identified at point 4. Structurally, as shown in Figure 9a, the compounds show no visible differences. The low ductility values exhibited by Zn-Mg alloys are considered insufficient for medical implant applications. In combination with the uneven detachment of corrosion products caused by the preferential corrosion of Mg, the use of these alloys is limited so far for medical implants [30]. To improve the ductility of the ZnMg alloy, this system was alloyed with Y, although initially it will lead to the formation of a YZn12 intermetallic compound that will contribute to the dimensional reduction in Mg-based composites with Zn and improve the workability of the experimental alloy.
Point 5 shows a zone where both Mg and Y have been partially solubilized in the α-Zn matrix forming an icosahedron phase [31].
Gong et al. [32] reported that the hot deformation (extrusion) of Zn-based alloys can improve their biodegradation uniformity and mechanical properties (the case studied was Zn-1wt%Mg alloy) (UTS~250 MPa and ε~12%), and the good biocompatibility of the alloy was confirmed by in vitro cytotoxicity tests. Moreover, various studies have reported the improved mechanical properties, corrosion resistance, or cytotoxicity of Zn-1wt% Mg alloys or others with the third element Mn, Ca, or Sr obtained by different techniques [8,33]. Recently, Tong et al. [34] reported that Zn-0.8 wt% Mg extrudate has an acceptable balance of strength (UTS ~ 301 MPa) and ductility (ε ~ 15%), while Mostaed et al. [35] reported good mechanical properties for Zn-0.5 wt% Mg extrudate (UTS-297 MPa and ε-13%) and Zn-0.15 wt% Mg (UTS-250 MPa and ε-22%).
After friction tests, the hot-rolled samples were immersed in SBF electrolyte solution for 7 days. The surface behavior upon immersion on worn and non-worn areas in a biological solution was observed. According to Figure 10, the distribution of elements on the surface shows the formation of compounds on the worn surface in a higher amount, especially for the hot-rolled pure Zn and the Zn3Mg alloy and less for the Zn3Mg1Y alloy (Figure 10c,f), where the removal of the oxide layer by wear and general corrosion is observed regardless of whether it is the worn area or not. This can be considered an advantage if areas of mechanical wear develop within the functioning of the biodegradable alloy and do not degrade at a higher rate compared with unaffected areas [36].
In the wear zone, Cl and Ca agglomerations are observed in the Zn3Mg samples, and the formation of compounds and oxides is stimulated by the local wear-stressed surface. On all surfaces, especially those of pure Zn, salt and oxide formation is observed, especially ZnO (Figure 10a) and MgO (Figure 10b,d,e,f). The wear of the experimental materials leads to the local hardening of the material through hardening and further for the cases in which continuous stress leads to the detachment of small quantities of material, contributing to material degradation.
Detached materials can endanger the health of patients by blocking the blood system and eliminating foreign bodies from living organisms or the main organs near the implant area.
At the same time, the influence of body fluids upon coming into contact with the plated material can contribute to the reduction in the size of the detached material and accelerate the production flux of degradation compounds. More complex wear cases involving implantable elements can also lead to other complications in living organisms, depending on implant size, geometry, and area.

4. Conclusions

Several conclusions can be drawn from the experimental results obtained:
-
Mg and Y addition to pure Zn improves mechanical properties such as microhardness and wear resistance;
-
The hot-rolling process altered the shape and size of the compounds by reducing the YZn12 dimensions and spreading them in the eutectic;
-
Both the hot rolling and Y addition contributed to the improved workability of the Zn3Mg1Y alloy;
-
The analysis of hot-rolled test samples from pure Zn, Zn3Mg, and Zn3Mg1Y showed a significant increase in microhardness due to the Mg and Y additions, as well as an increase in microhardness in the worn zone;
-
The worn surface, in addition to the embrittlement phenomenon characteristic of stressed metallic materials, exhibited more pronounced oxidation compared to the unaffected surface in the electrolytic environment due to the increase in the exposed surface area and the surface stresses caused by wear.
-
Further investigations will include analysis regarding the effect of material wear products on cell survival, cell viability, and adhesion tests, followed by in vivo implantation tests in laboratory mice or rabbits.

Author Contributions

Conceptualization, N.C., C.B. and V.P.; methodology, C.P., A.-M.R., L.-I.C. and M.P.; software, M.A., A.M.C. and S.C.L.; validation, N.C., A.-M.R. and V.P.; formal analysis, A.M.C.; investigation, N.C., M.P. and V.P.; data curation, C.P., M.A., S.C.L. and G.Z.; writing—original draft preparation, N.C., C.B., V.P. and L.-I.C.; writing—review and editing, G.Z., M.A. and A.-M.R.; visualization, C.P.; supervision, C.B.; project administration, L.-I.C. All authors have read and agreed to the published version of the manuscript.

Funding

Project financed by Lucian Blaga University of Sibiu through the research grant LBUS-IRG-2023.

Data Availability Statement

The original contributions presented in this study are included in this article; further inquiries can be directed to the corresponding authors.

Conflicts of Interest

The authors declare no conflicts of interest.

References

  1. Cai, A.Y.; Zhu, Y.J.; Qi, C. Biodegradable inorganic nanostructured biomaterials for drug delivery. Adv. Mater. Interfaces 2020, 7, 2000819. [Google Scholar] [CrossRef]
  2. Khan, A.R.; Grewal, N.S.; Zhou, C.; Yuan, K.; Zhang, H.J.; Jun, Z. Recent advances in biodegradable metals for implant ap-plications: Exploring in vivo and in vitro responses. Results Eng. 2023, 20, 101526. [Google Scholar] [CrossRef]
  3. Prakasam, M.; Locs, J.; Salma-Ancane, K.; Loca, D.; Largeteu, A.; Bezina-Cimdina, L. Biodegradable Materials and Metallic Implants—A Review. Funct. Biomater. 2017, 8, 44. [Google Scholar] [CrossRef] [PubMed]
  4. Yang, H.; Jia, B.; Zhang, Z.; Qu, X.; Li, G.; Lin, W.; Zhu, D.; Dai, K.; Zheng, Y. Alloying design of biodegradable zinc as promising bone implants for load-bearing applications. Nat. Commun. 2020, 11, 401. [Google Scholar] [CrossRef] [PubMed]
  5. Vojtech, D.; Kubasek, J.; Serak, J.; Novak, P. Mechanical and corrosion properties of newly developed biodegradable Zn-based alloys for bone fixation. Acta Biomater. 2011, 7, 3515–3522. [Google Scholar] [CrossRef]
  6. Kaur, K.; Gupta, R.; Saraf, S.A.; Saraf, S.K. Zinc: The metal of life. Compr. Rev. Food Sci. Food Saf. 2014, 13, 358–376. [Google Scholar] [CrossRef]
  7. Li, H.F.; Shi, Z.Z.; Wang, L.N. Opportunities and challenges of biodegradable Zn-based alloys. J. Mater. Sci. Technol. 2020, 46, 136–138. [Google Scholar] [CrossRef]
  8. Liu, X.; Sun, J.; Zhou, F.; Yang, Y.; Chang, R.; Qiu, K.; Pu, Z.; Li, L.; Zheng, Y. Microalloying with Mn in Zn–Mg alloy for future biodegradable metals application. Mater. Des. 2016, 94, 95–104. [Google Scholar] [CrossRef]
  9. Tang, Z.; Niu, J.; Huang, H.; Zhang, H.; Pei, J.; Ou, J.; Yuan, G. Potential biodegradable Zn-Cu binary alloys developed for cardiovascular implant applications. J. Mech. Behav. Biomed. Mater. 2017, 72, 182–191. [Google Scholar] [CrossRef]
  10. Yue, R.; Huang, H.; Ke, G.; Zhang, H.; Pei, J.; Xue, G.; Yuan, G. Microstructure, mechanical properties and in vitro degradation behavior of novel Zn-Cu-Fe alloys. Mater. Charact. 2017, 134, 114–122. [Google Scholar] [CrossRef]
  11. Bowen, P.K.; Seitz, J.-M.; Guillory, R.J.; Braykovich, J.P.; Zhao, S.; Goldman, J.; Drelich, J.W. Evaluation of wrought Zn-Al alloys (1, 3, and 5 wt% Al) through mechanical and in vivo testing for stent applications. J. Biomed. Mater. Res. B Appl. Biomater. 2018, 106, 245–258. [Google Scholar] [CrossRef] [PubMed]
  12. Shi, Z.Z.; Yu, J.; Liu, X.F.; Wang, L.N. Fabrication and characterization of novel biodegradable Zn-Mn-Cu alloys. J. Mater. Sci. Technol. 2018, 34, 1008–1015. [Google Scholar] [CrossRef]
  13. Liu, L.; Meng, Y.; Dong, C.; Yan, Y.; Volinsky, A.A.; Wang, L.N. Initial formation of corrosion products on pure zinc in simulated body fluid. J. Mater. Sci. Technol. 2018, 34, 2271–2282. [Google Scholar] [CrossRef]
  14. Zhang, D.; Peng, F.; Liu, X. Protection of magnesium alloys: From physical barrier coating to smart self-healing coating. J. Alloys Compd. 2021, 853, 157010. [Google Scholar] [CrossRef]
  15. Pesode, P.; Barve, S. Surface Modification of Biodegradable Zinc Alloy for Biomedical Applications. BioNanoScience 2023, 13, 1381–1398. [Google Scholar] [CrossRef]
  16. Panaghie, C.; Cimpoesu, R.; Istrate, B.; Cimpoesu, N.; Bernevig, M.A.; Zegan, G.; Roman, A.M.; Chelariu, R.; Sodor, A. New Zn3Mg-xY Alloys: Characteristics, Microstructural Evolution and Corrosion Behavior. Materials 2021, 14, 2505. [Google Scholar] [CrossRef] [PubMed]
  17. Panaghie, C.; Cimpoeșu, N.; Benchea, M.; Roman, A.M.; Manole, V.; Alexandru, A.; Cimpoesu, R.; Cazacu, M.M.; Wnuk, I.; Zegan, G. “In-vitro” Tests on New Biodegradable Metallic Material Based on ZnMgY. Arch. Metall. Mater. 2022, 67, 587–594. [Google Scholar] [CrossRef]
  18. Chen, K.; Gu, X.; Zheng, Y. Feasibility, challenges and future prospects of biodegradable zinc alloys as orthopedic internal fixation implants. Smart Mater. Manuf. 2024, 2, 100042. [Google Scholar] [CrossRef]
  19. Xu, W.; Yu, A.; Lu, X.; Tamaddon, M.; Ng, L.; Hayat, M.D. Synergistic interactions between wear and corrosion of Ti-16Mo orthopedic alloy. J Mater Res Technol. 2020, 9, 9996–10003. [Google Scholar] [CrossRef]
  20. Savaskan, T.; Azaklı, Z. An investigation of lubricated friction and wear properties of Zn–40Al–2Cu–2Si alloy in comparison with SAE 65 bearing bronze. Wear 2008, 264, 920–928. [Google Scholar] [CrossRef]
  21. Darabont, D.-C.; Moraru, R.I.; Antonov, A.E.; Bejinariu, C. Managing new and emerging risks in the context of ISO 45001 standard. Qual.-Access Success 2017, 18, 11–14. [Google Scholar]
  22. Egami, M.; Ohnuma, I.; Enoki, M.; Ohtani, H.; Abe, E. Thermodynamic origin of solute-enriched stacking-fault in dilute Mg-Zn-Y alloys. Mater. Des. 2020, 188, 108452. [Google Scholar] [CrossRef]
  23. Cha, G.H.; Lee, S.Y.; Nash, P.; Pan, Y.Y.; Nash, A. Binary alloy phase diagrams (Ni-Sb; Ni-Sc; Ni-Se; Ni-Si; Ni-Sm; Ni-Sn). In ASM Handbook. Volume 3. Alloys Phase Diagrams; ASM International: Russell Township, OH, USA, 1991; pp. 317–318. [Google Scholar]
  24. Prosek, T.; Nazarov, A.; Bexell, U.; Thierry, D.; Serak, J. Corrosion mechanism of model zinc–magnesium alloys in atmospheric conditions. Corros. Sci. 2008, 50, 2216–2231. [Google Scholar] [CrossRef]
  25. Ji, C.; Ma, A.; Jiang, J.; Song, D.; Liu, H.; Guo, S. Research status and future prospects of biodegradable Zn-Mg alloys. J. Alloys Compd. 2024, 993, 174669. [Google Scholar] [CrossRef]
  26. Ma, S.-Y.; Liu, L.M.; Wang, S.Q. The microstructure, stability, and elastic properties of 14H long-period stacking-ordered phase in Mg–Zn–Y alloys: A first-principles study. J. Mater. Sci. 2014, 49, 737–748. [Google Scholar] [CrossRef]
  27. Vencl, A.; Bobić, I.; Bobić, B.; Jakimovska, K.; Svoboda, P.; Kandeva, M. Erosive wear properties of ZA-27 alloy-based nanocomposites: Influence of type, amount, and size of nanoparticle reinforcements. Friction 2019, 7, 340–350. [Google Scholar] [CrossRef]
  28. Panaghie, C.; Cimpoesu, R.; Zegan, G.; Roman, A.M.; Ivanescu, M.C.; Aelenei, A.A.; Benchea, M.; Cimpoesu, N.; Ioanid, N. In Vitro Corrosion Behavior of Zn3Mg0.7Y Biodegradable Alloy in Simulated Body Fluid (SBF). Appl. Sci. 2022, 12, 2727. [Google Scholar] [CrossRef]
  29. Panaghie, C.; Zegan, G.; Sodor, A.; Cimpoesu, N.; Lohan, N.-M.; Istrate, B.; Roman, A.M.; Ioanid, N. Analysis of Degradation Products of Biodegradable ZnMgY Alloy. Materials 2023, 16, 3092. [Google Scholar] [CrossRef]
  30. Agarwal, S.; Curtin, J.; Duffy, B.; Jaiswal, S. Biodegradable magnesium alloys for orthopedic applications: A review on corrosion, biocompatibility and surface modifications. Mater. Sci. Eng. C 2016, 68, 948–963. [Google Scholar] [CrossRef] [PubMed]
  31. Shibata, K.; Currat, R.; De Boissieu, M.; Sato, T.J.; Takakura, H.; Tsai, A.P. Dynamics of the ZnMgY icosahedral phase. J. Condens. Matter Phys. 2002, 14, 1847. [Google Scholar] [CrossRef]
  32. Gong, H.; Wang, K.; Strich, R.; Zhou, J.G. In vitro biodegradation behavior, mechanical properties, and cytotoxicity of biodegradable Zn-Mg alloy. J. Biomed. Mater. Res. B. Appl. Biomater. 2015, 103, 1632–1640. [Google Scholar] [CrossRef]
  33. Zhuo, X.; Wu, Y.; Ju, J.; Liu, H.; Jiang, J.; Hu, Z.; Bai, J.; Xue, F. Recent progress of novel biodegradable zinc alloys: From the perspective of strengthening and toughening. J. Mater. Res. Technol. 2022, 17, 244–269. [Google Scholar] [CrossRef]
  34. Tong, X.; Zhang, D.; Zhang, X.; Su, Y.; Shi, Z.; Wang, K.; Lin, J.; Li, Y.; Lin, J.; Wen, C. Microstructure, mechanical properties, biocompatibility, and in vitro corrosion and degradation behavior of a new Zn-5Ge alloy for biodegradable implant materials. Acta Biomater. 2018, 82, 197–204. [Google Scholar] [CrossRef]
  35. Mostaed, E.; Sikora-Jasinska, M.; Drelich, J.W.; Vedani, M. Zinc-based alloys for degradable vascular stent applications. Acta Biomater. 2018, 71, 1–23. [Google Scholar] [CrossRef]
  36. Laurian, T.; Tudor, A.; Antoniac, I.; Miculescu, F. A micro-scale abrasion test to study the influence of counterface roughness on the wear resistance of UHMWPE. J. Optoel. Adv. Mater. 2007, 9, 3383–3388. [Google Scholar]
Figure 1. Tribological contact stationary roller on a rotating disk.
Metals 14 00836 g001
Figure 2. Structural and chemical aspects of Zn3Mg1Y alloy: (a) SEM image at 500×; (b) SEM image at 1000× of the hot-rolled sample’s microstructure; and (c) chemical element distribution on the surface.
Metals 14 00836 g002
Figure 3. Macroscopic optical images of the worn zones on Zn3Mg1Y alloy: (a) distribution of the HV microhardness test zones, (b) detail of the boundary between the worn zone and the alloy surface, and (ce) 3D profiles of the worn surfaces.
Metals 14 00836 g003
Figure 4. Surface profile of the hot-rolled samples: pure Zn, Zn3Mg, and Zn3Mg1Y.
Metals 14 00836 g004
Figure 5. MoF values as a function of time for the samples: pure Zn hot-rolled, Zn3Mg hot-rolled, and Zn3Mg1Y hot-rolled at Q = 20 N.
Metals 14 00836 g005
Figure 6. MoF values as a function of time for samples: pure Zn hot-rolled, Zn3Mg hot-rolled, and Zn3Mg1Y hot-rolled at Q = 30 N.
Metals 14 00836 g006
Figure 7. MoF values as a function of time for samples Zn3Mg1Y cast and Zn3Mg1Y hot-rolled at Q = 20 N and Q = 30 N.
Metals 14 00836 g007
Figure 8. SEM images after the wear tests: pure Zn (a) with 20 N force and (d) with 30 N force; Zn3Mg (b) with 20 N force and (e) with 30 N force; and Zn3Mg0.5Y (c) with 20 N force and (f) with 30 N force.
Metals 14 00836 g008
Figure 9. Hot-rolled sample structure (a) SEM image and (b) element distribution of Zn, Mg, and Y.
Metals 14 00836 g009
Figure 10. Main element distribution identified in the experimental materials after wear at 20 N force (ac) or 30 N force (df) and 7 days immersion in SBF for pure Zn, Zn3Mg, and Zn3Mg1Y hot-rolled samples.
Metals 14 00836 g010aMetals 14 00836 g010b
Table 1. Chemical composition determination for Zn3Mg1Y alloy.
Chemical CompositionZnMgY
wt%at%wt%at%wt%at%
General (1 mm2)96.193.13.06.30.90.7
Point 190.492.5--9.67.5
Point 299.297.40.82.6--
Point 392.894.10.20.775.2
EDS error [%]2.10.90.2
Standard deviation: Zn: ±1; Mg: ±0.1; and Y: ±0.05.
Table 2. Minimum, maximum, and mean microhardness values.
MaterialZn3Mg1Y [HV]Zn3Mg [HV]Zn [HV]
Test ReportMin.Max.MeanMin.Max.MeanMin.Max.Mean
Point 1 (20 N—dry)84.1203.2157.274.2129.0100.3104.2108.7107.2
Point 2 (20 N—dry)116.9138.1126.9102.3129.0115.3107.6160130.0
Point 3 (20 N—dry)74.297.588.290.093.492.253.261.756.2
Point 1 (30 N—dry)206222.3215.3224.6233.3229.8101.299.598.4
Point 2 (30 N—dry)116.0128.0120.2172.2189.4179.4106.4122.2115.3
Point 3 (30 N—dry)90.899.394.755.669.764.731.233.732.8
Table 3. Mass loss after the wear test on the Amsler equipment.
Material
(Hot-Rolled State)
Mass before Wear [g]Mass after Wear [g]Mass Loss [g]Average Wear Rate
×10−2 [mg/g]
Pure Zn (2 kg)7.4987.4930.0052.01
Zn3Mg (2 kg)11.95211.9510.0010.3
Zn3Mg1Y (2 kg)15.74515.7380.0070.23
Pure Zn (3 kg)7.5207.4980.0221.1
Zn3Mg (3 kg)11.96411.9520.0120.6
Zn3Mg1Y (3 kg)15.75915.7450.0140.7
Table 4. Chemical composition of Zn3Mg1Y alloy and structurally identified compounds (5 chemical composition determinations were performed at closely spaced points for averaging).
Zn3Mg0.4Y Hot-RolledZnMgY
wt%at%wt%at%wt%at%
General95.7891.033.248.280.970.68
Point 199.598.70.491.3--
Point 290.492.75--9.67.3
Point 399.999.9----
Point 492.9294.7--7.15.3
Point 599.499.30.130.330.450.33
EDS Error %2.30.10.3
Standard deviation: Zn: ±2; Mg: ±0.1; and Y: ±0.1.
Disclaimer/Publisher’s Note: The statements, opinions and data contained in all publications are solely those of the individual author(s) and contributor(s) and not of MDPI and/or the editor(s). MDPI and/or the editor(s) disclaim responsibility for any injury to people or property resulting from any ideas, methods, instructions or products referred to in the content.

