
Thermodynamic Simulation Model of Copper Side-Blown Smelting Process


Abstract
:1. Introduction
2. Process Mechanism and Mathematical Model Establishment
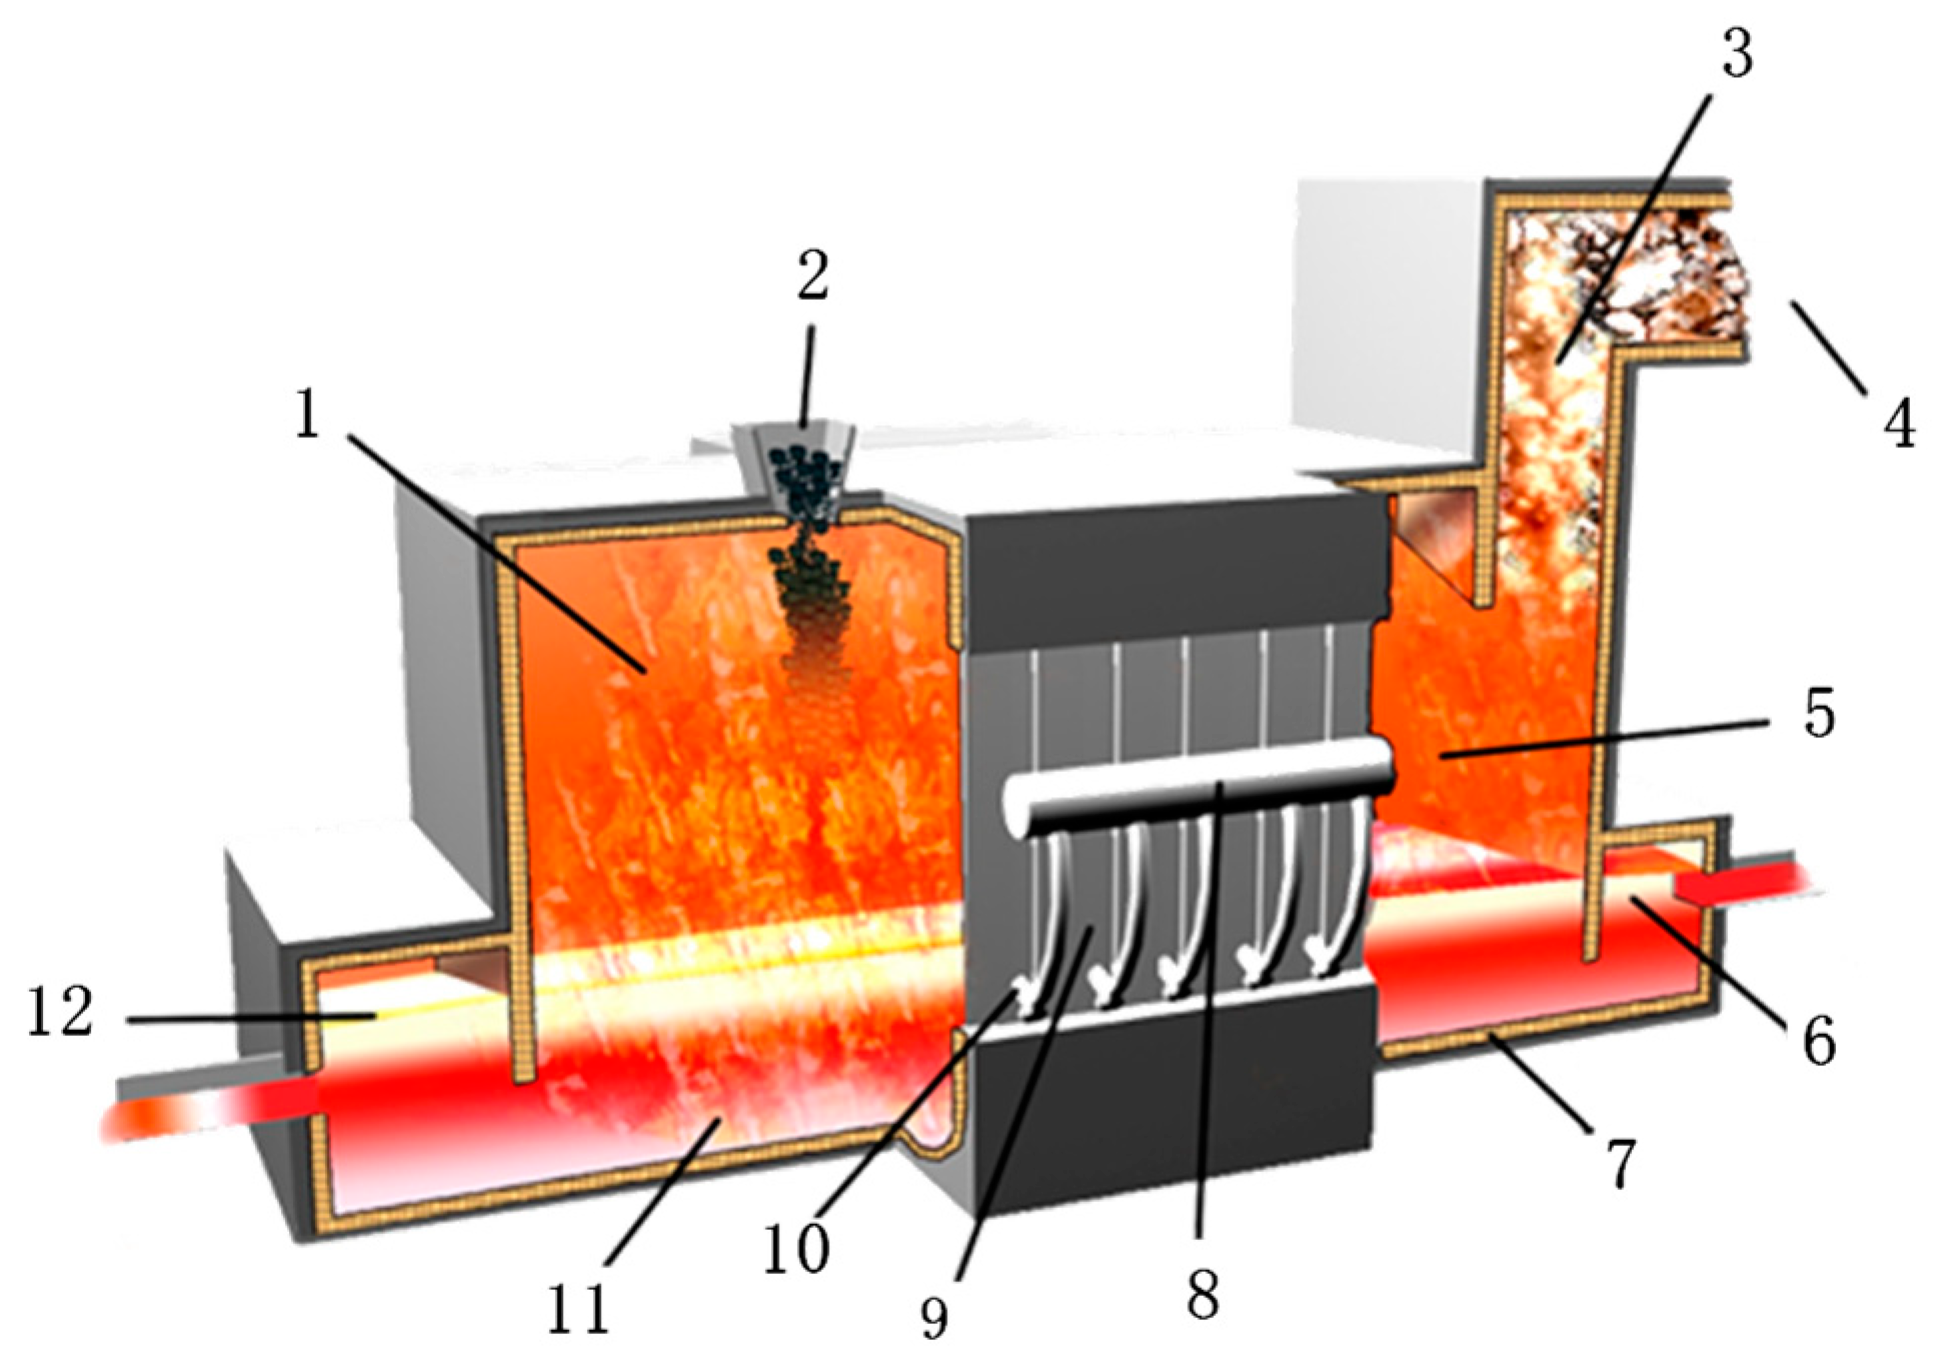
2.1. Process Reaction Mechanism
2.2. Modeling Assumption
2.3. Model Construction
3. Basic Data and Digital–Analog System
3.1. Raw Materials and Their Composition
3.2. Thermodynamic Basic Data
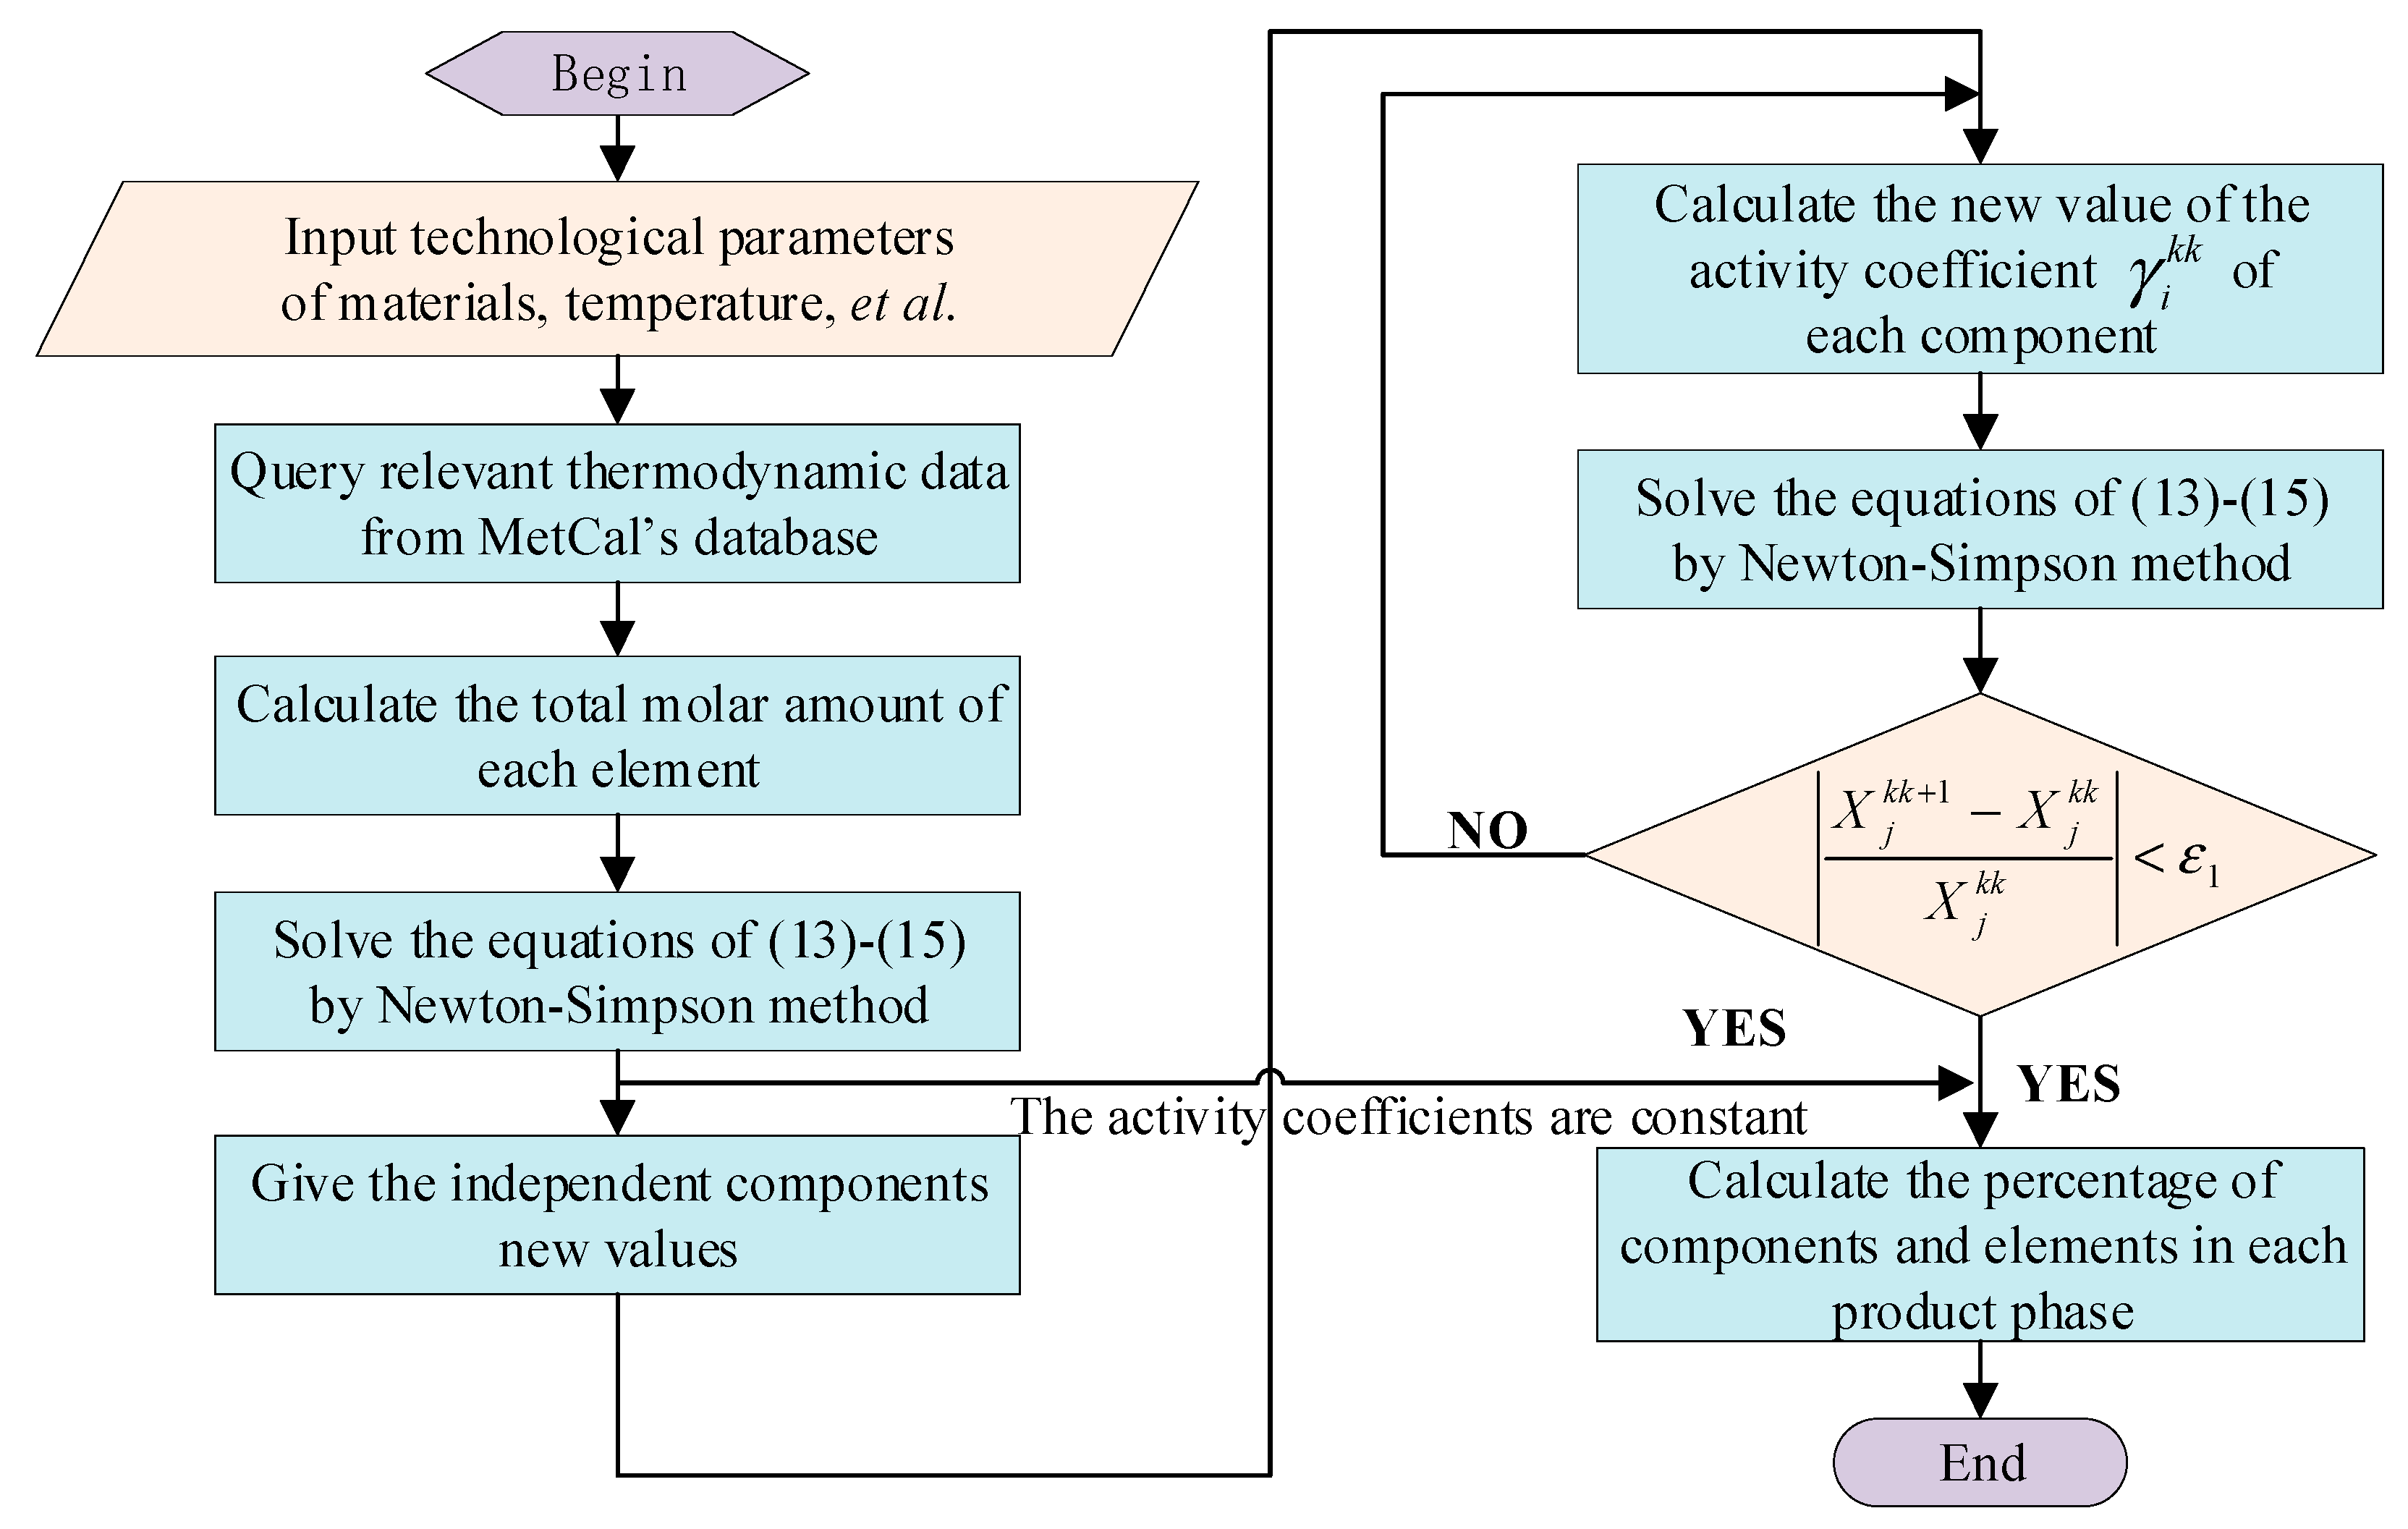
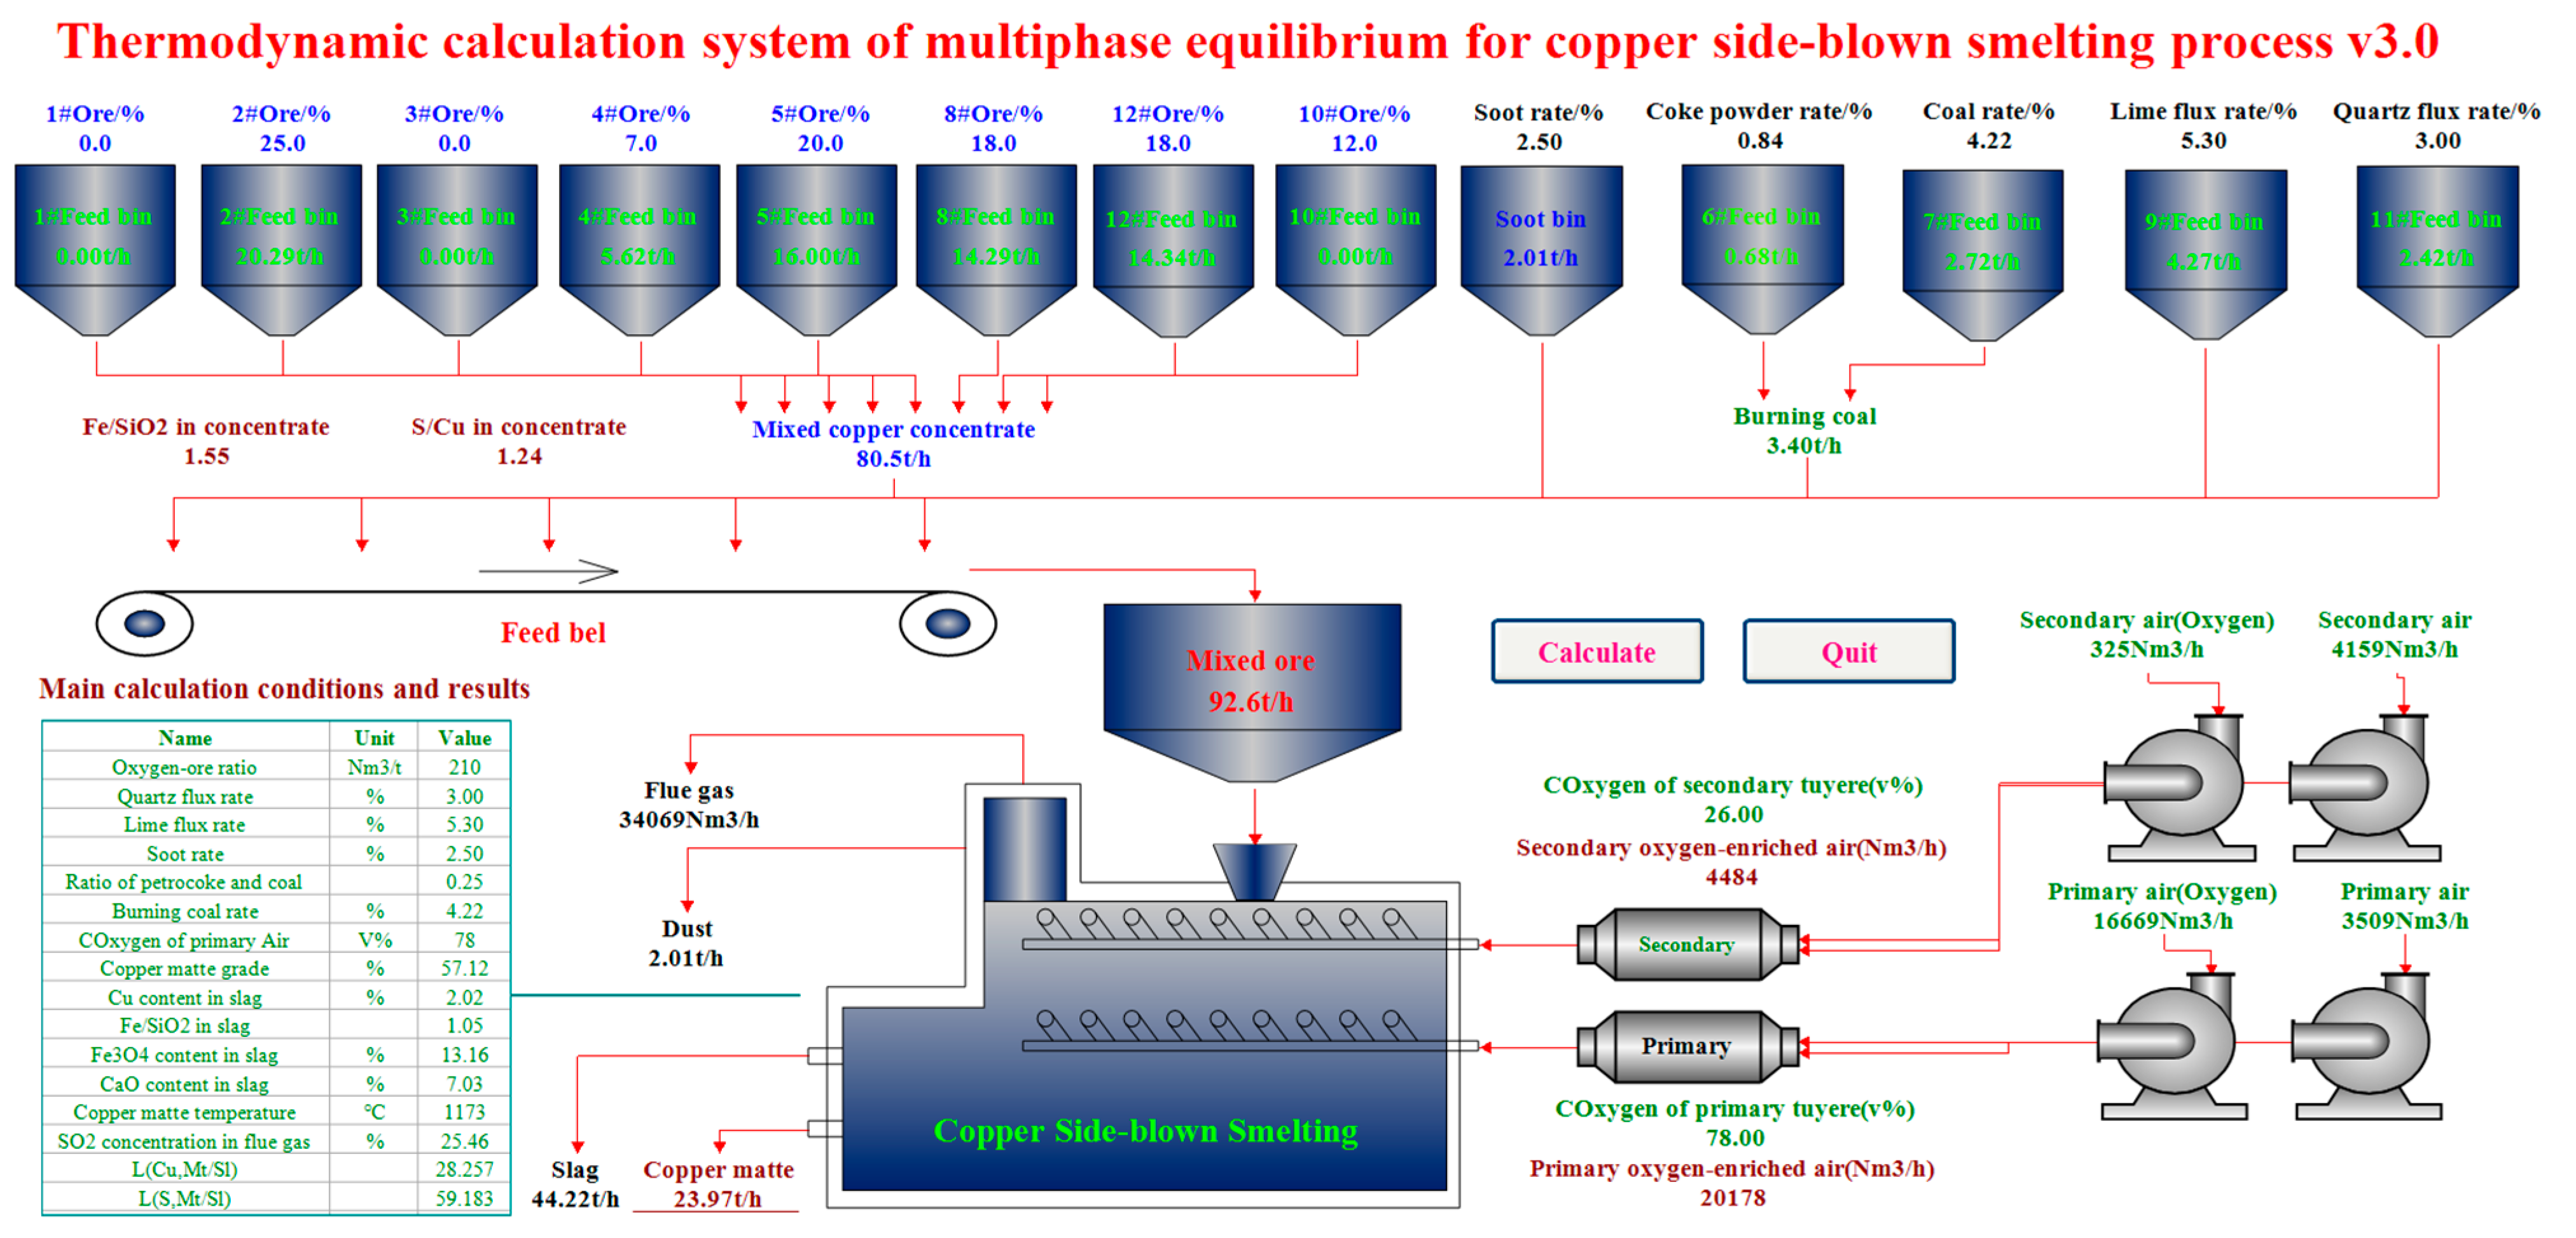
3.3. Digital–Analog Computing System
4. Calculation Examples and Model Verification
4.1. Computational Condition
4.2. Computation
4.3. Model Verification
5. Conclusions
- Based on the reaction mechanism and characteristics of the copper side-blown smelting process, a multiphase equilibrium thermodynamic calculation model was constructed using the method of chemical equilibrium constants. Based on this, a thermodynamic simulation calculation system was developed, providing a software tool for subsequent thermodynamic simulation analysis of the process;
- Using the constructed model and calculation system, an example validation of the model was conducted based on the typical operating conditions of the copper side-blown smelting process in a domestic enterprise. The calculated results of the products basically matched the production practice, indicating that the model can basically reflect the reaction characteristics of the copper side-blown process and has the potential to predict the refining production process accurately;
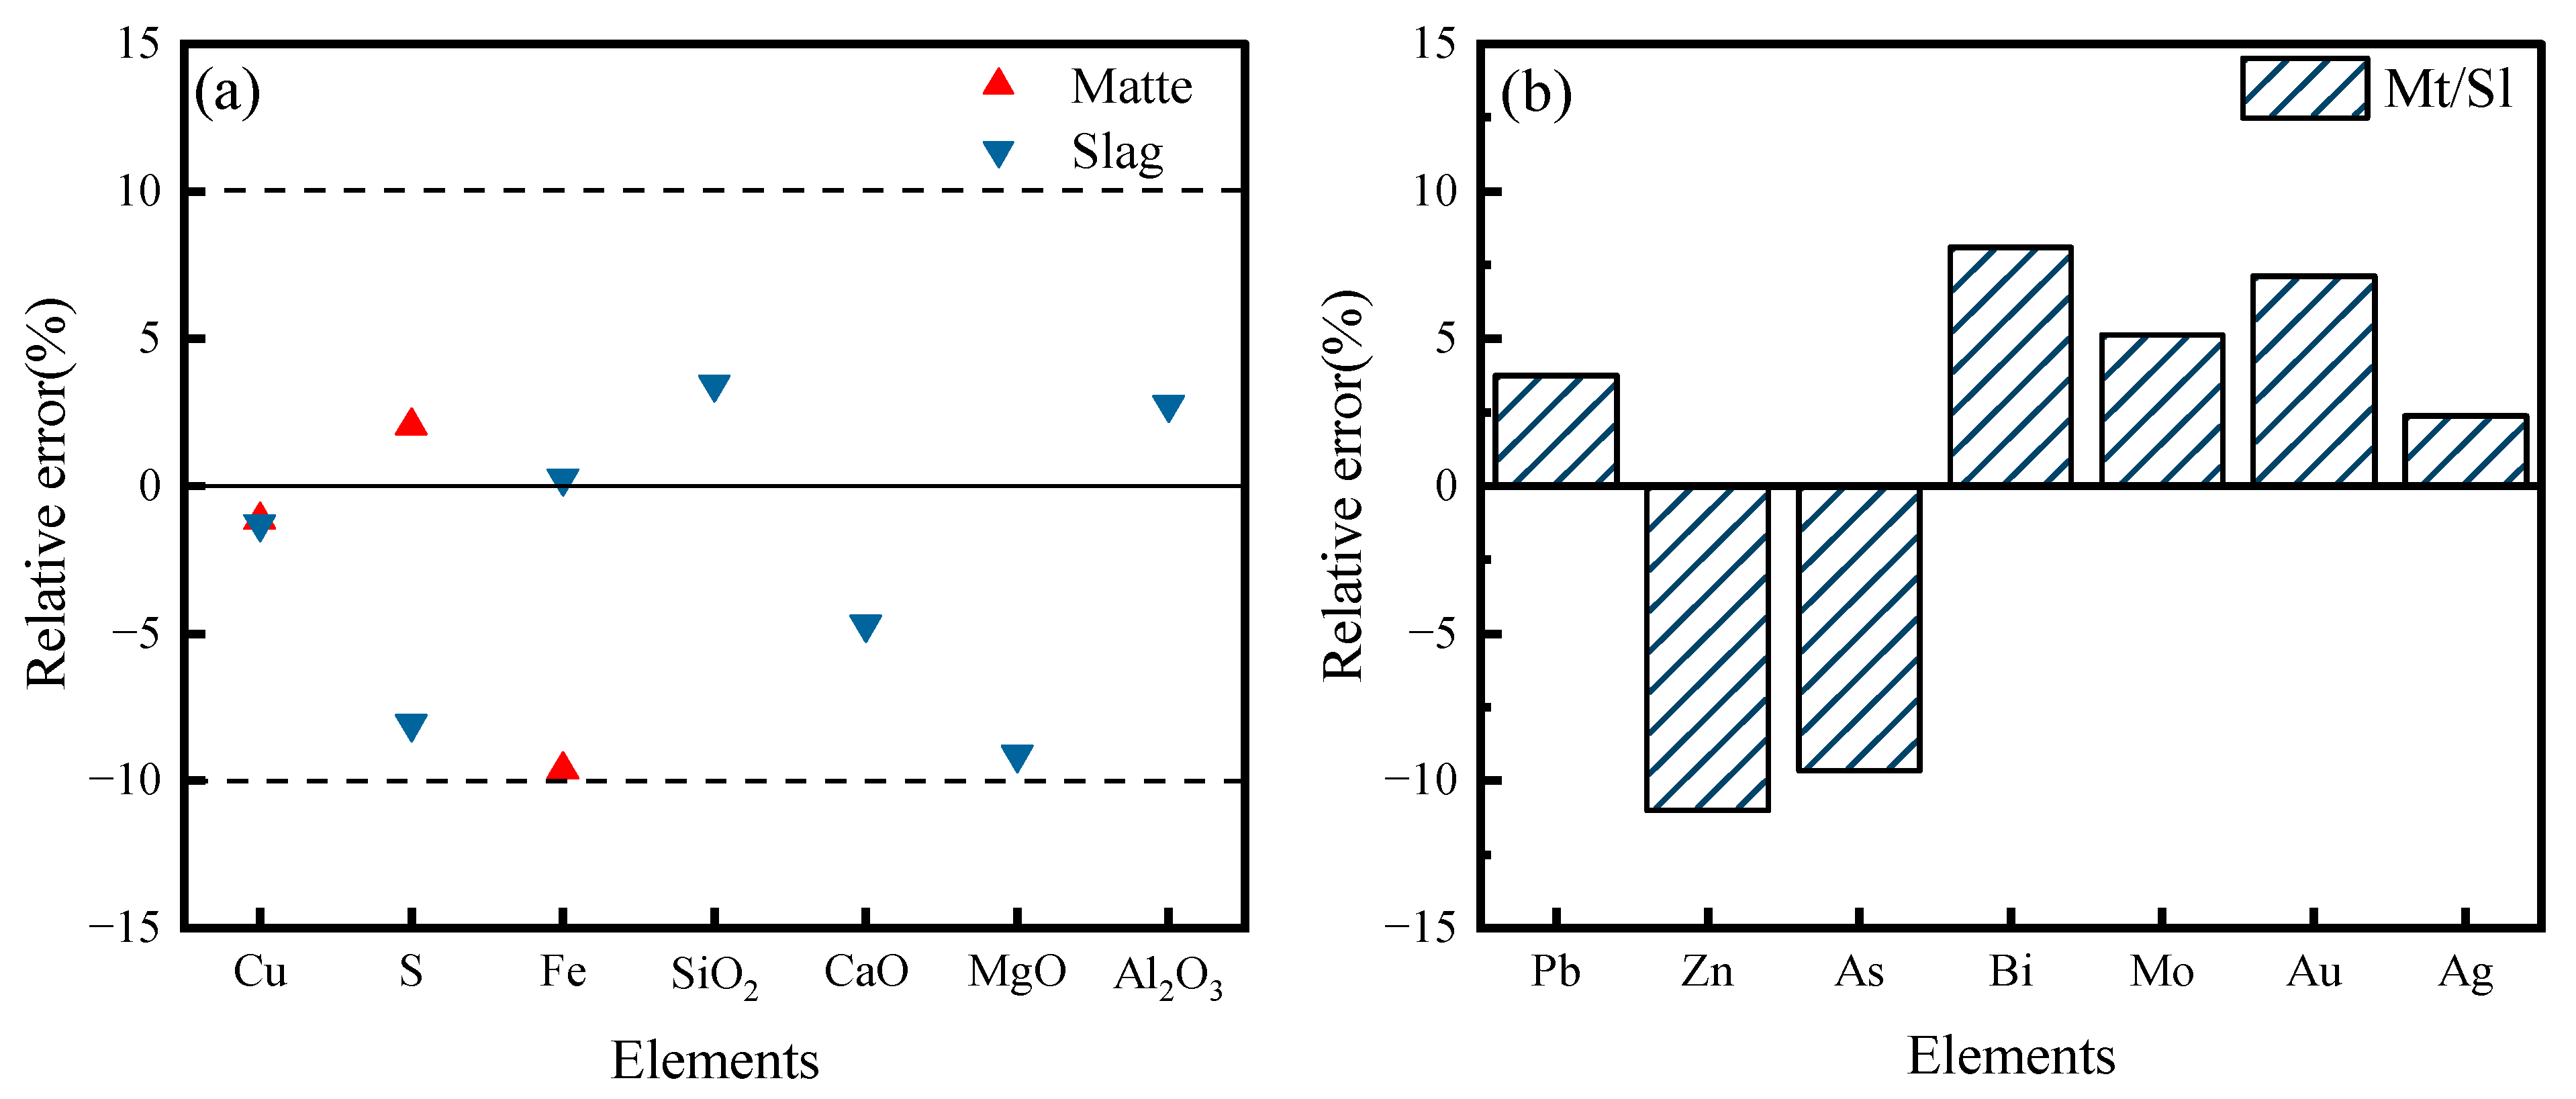
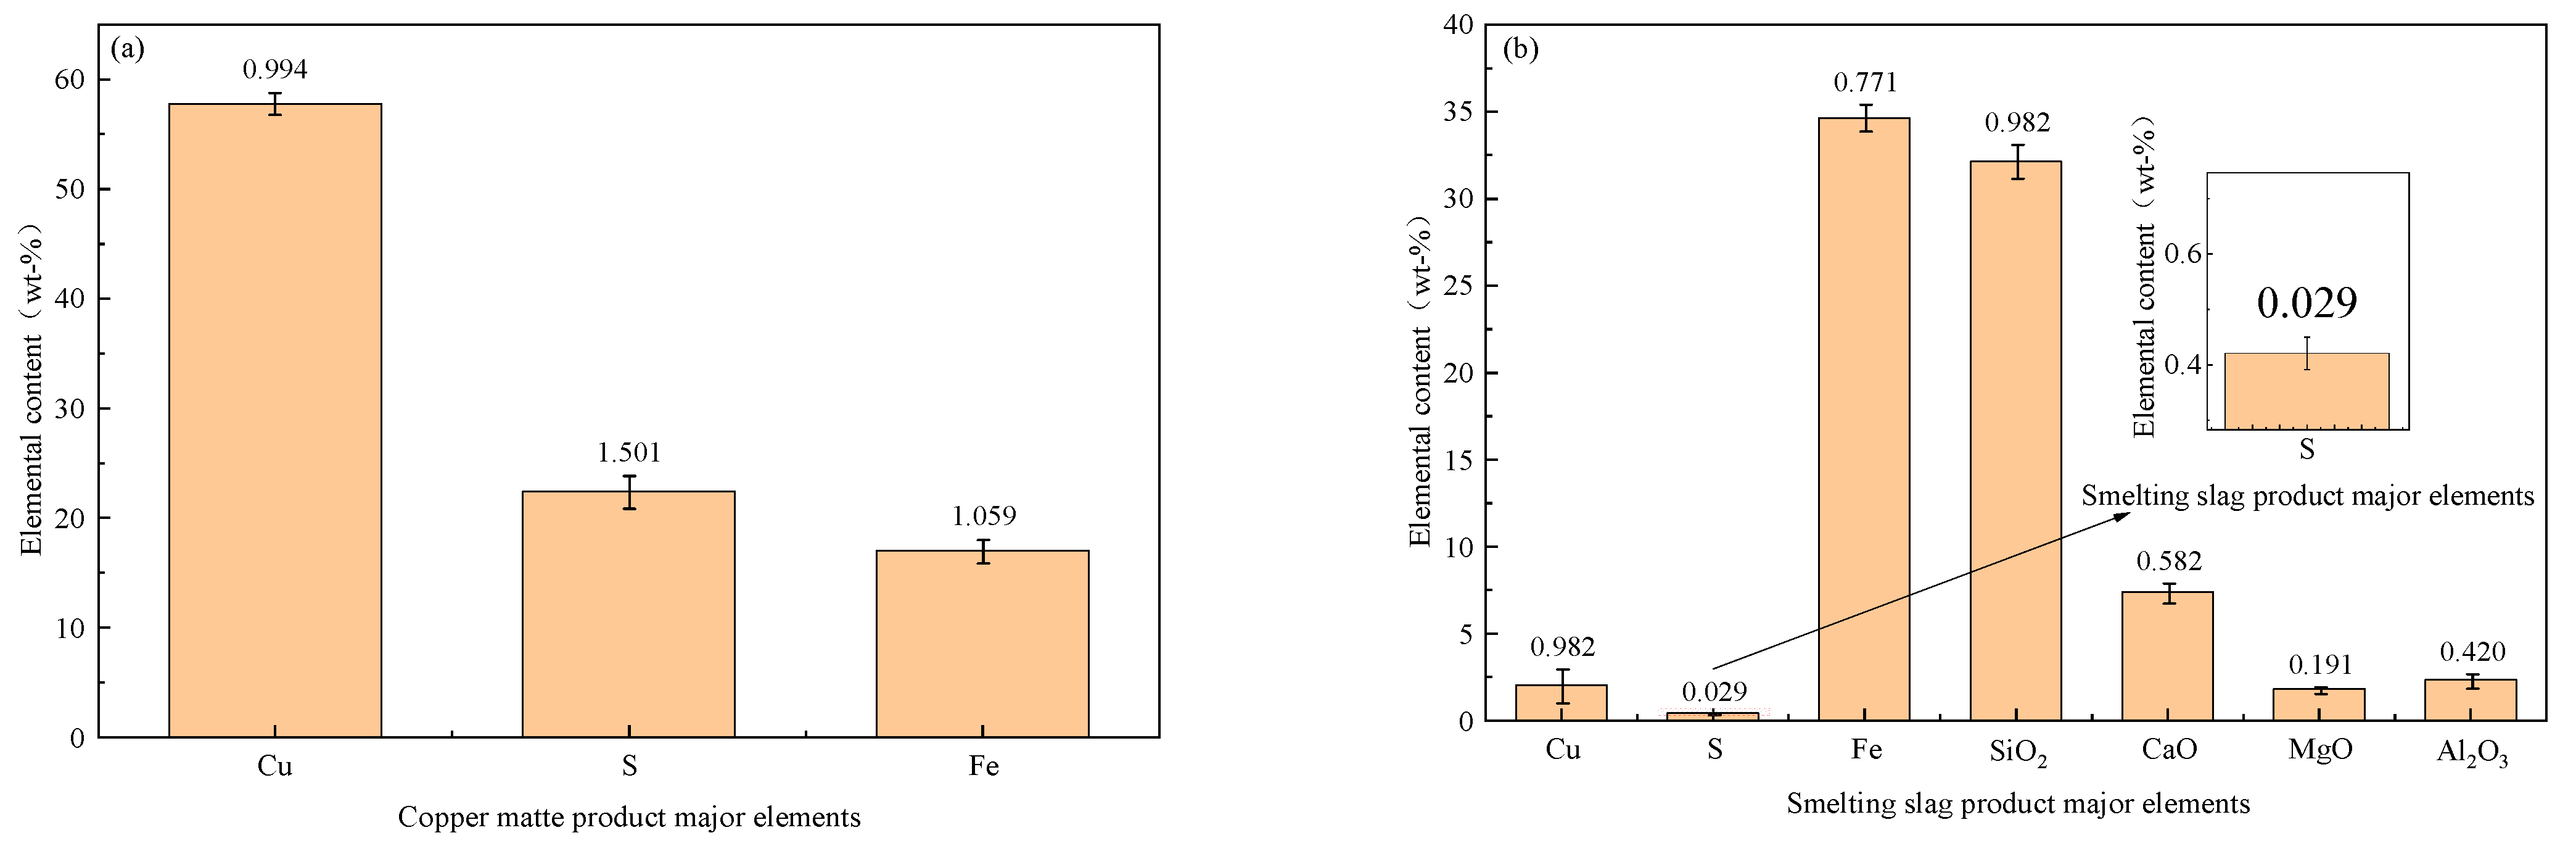
- Through calculation and comparison, it was found that the calculated values of the main element contents and impurity element distribution ratios in the products of the copper side-blown smelting process had small errors compared with the average measured values of production data. The relative errors of the calculated mass fractions of Cu, S, Fe, SiO2, CaO, MgO, and Al2O3 in copper matte and smelting slag are less than 10%. The relative errors of the distribution ratios of impurity elements such as Pb, Zn, As, Bi, Mo, Au, and Ag in copper matte and smelting slag are less than 11.5%. This indicates that the constructed simulation mathematical model can basically reflect the actual production situation of the copper side-blown smelting process and can be used as an effective tool for subsequent systematic thermodynamic analysis of the process.
Author Contributions
Funding
Data Availability Statement
Acknowledgments
Conflicts of Interest
Appendix A

| Component | Phase | Cu | S | Fe | O | Pb | Zn | As | Sb | Bi | Mo | Ag | Au | Si | Ca | Mg | Al | N | H | C |
|---|---|---|---|---|---|---|---|---|---|---|---|---|---|---|---|---|---|---|---|---|
| Cu2S | Mt | 2 | 1 | 0 | 0 | 0 | 0 | 0 | 0 | 0 | 0 | 0 | 0 | 0 | 0 | 0 | 0 | 0 | 0 | 0 |
| FeS | Mt | 0 | 1 | 1 | 0 | 0 | 0 | 0 | 0 | 0 | 0 | 0 | 0 | 0 | 0 | 0 | 0 | 0 | 0 | 0 |
| FeO | Mt | 0 | 0 | 1 | 1 | 0 | 0 | 0 | 0 | 0 | 0 | 0 | 0 | 0 | 0 | 0 | 0 | 0 | 0 | 0 |
| Fe3O4 | Mt | 0 | 0 | 3 | 4 | 0 | 0 | 0 | 0 | 0 | 0 | 0 | 0 | 0 | 0 | 0 | 0 | 0 | 0 | 0 |
| PbS | Mt | 0 | 1 | 0 | 0 | 1 | 0 | 0 | 0 | 0 | 0 | 0 | 0 | 0 | 0 | 0 | 0 | 0 | 0 | 0 |
| ZnS | Mt | 0 | 1 | 0 | 0 | 0 | 1 | 0 | 0 | 0 | 0 | 0 | 0 | 0 | 0 | 0 | 0 | 0 | 0 | 0 |
| As | Mt | 0 | 0 | 0 | 0 | 0 | 0 | 1 | 0 | 0 | 0 | 0 | 0 | 0 | 0 | 0 | 0 | 0 | 0 | 0 |
| Sb | Mt | 0 | 0 | 0 | 0 | 0 | 0 | 0 | 1 | 0 | 0 | 0 | 0 | 0 | 0 | 0 | 0 | 0 | 0 | 0 |
| Bi | Mt | 0 | 0 | 0 | 0 | 0 | 0 | 0 | 0 | 1 | 0 | 0 | 0 | 0 | 0 | 0 | 0 | 0 | 0 | 0 |
| MoS | Mt | 0 | 1 | 0 | 0 | 0 | 0 | 0 | 0 | 0 | 1 | 0 | 0 | 0 | 0 | 0 | 0 | 0 | 0 | 0 |
| Ag2S | Mt | 0 | 1 | 0 | 0 | 0 | 0 | 0 | 0 | 0 | 0 | 2 | 0 | 0 | 0 | 0 | 0 | 0 | 0 | 0 |
| Au | Mt | 0 | 0 | 0 | 0 | 0 | 0 | 0 | 0 | 0 | 0 | 0 | 1 | 0 | 0 | 0 | 0 | 0 | 0 | 0 |
| SiO2 | Sl | 0 | 0 | 0 | 2 | 0 | 0 | 0 | 0 | 0 | 0 | 0 | 0 | 1 | 0 | 0 | 0 | 0 | 0 | 0 |
| CaO | Sl | 0 | 0 | 0 | 1 | 0 | 0 | 0 | 0 | 0 | 0 | 0 | 0 | 0 | 1 | 0 | 0 | 0 | 0 | 0 |
| MgO | Sl | 0 | 0 | 0 | 1 | 0 | 0 | 0 | 0 | 0 | 0 | 0 | 0 | 0 | 0 | 1 | 0 | 0 | 0 | 0 |
| Al2O3 | Sl | 0 | 0 | 0 | 3 | 0 | 0 | 0 | 0 | 0 | 0 | 0 | 0 | 0 | 0 | 0 | 2 | 0 | 0 | 0 |
| N2 | Gas | 0 | 0 | 0 | 0 | 0 | 0 | 0 | 0 | 0 | 0 | 0 | 0 | 0 | 0 | 0 | 0 | 2 | 0 | 0 |
| CO2 | Gas | 0 | 0 | 0 | 2 | 0 | 0 | 0 | 0 | 0 | 0 | 0 | 0 | 0 | 0 | 0 | 0 | 0 | 0 | 1 |
| H2O | Gas | 0 | 0 | 0 | 1 | 0 | 0 | 0 | 0 | 0 | 0 | 0 | 0 | 0 | 0 | 0 | 0 | 0 | 2 | 0 |
| Component | Phase | Cu | S | Fe | O | Pb | Zn | As | Sb | Bi | Mo | Ag | Au | Si | Ca | Mg | Al | N | H | C |
|---|---|---|---|---|---|---|---|---|---|---|---|---|---|---|---|---|---|---|---|---|
| Cu2S | Sl | 2 | 1 | 0 | 0 | 0 | 0 | 0 | 0 | 0 | 0 | 0 | 0 | 0 | 0 | 0 | 0 | 0 | 0 | 0 |
| Cu2O | Sl | 2 | 0 | 0 | 1 | 0 | 0 | 0 | 0 | 0 | 0 | 0 | 0 | 0 | 0 | 0 | 0 | 0 | 0 | 0 |
| FeS | Sl | 0 | 1 | 1 | 0 | 0 | 0 | 0 | 0 | 0 | 0 | 0 | 0 | 0 | 0 | 0 | 0 | 0 | 0 | 0 |
| FeO | Sl | 0 | 0 | 1 | 1 | 0 | 0 | 0 | 0 | 0 | 0 | 0 | 0 | 0 | 0 | 0 | 0 | 0 | 0 | 0 |
| Fe3O4 | Sl | 0 | 0 | 3 | 4 | 0 | 0 | 0 | 0 | 0 | 0 | 0 | 0 | 0 | 0 | 0 | 0 | 0 | 0 | 0 |
| PbO | Sl | 0 | 0 | 0 | 1 | 1 | 0 | 0 | 0 | 0 | 0 | 0 | 0 | 0 | 0 | 0 | 0 | 0 | 0 | 0 |
| ZnO | Sl | 0 | 0 | 0 | 1 | 0 | 1 | 0 | 0 | 0 | 0 | 0 | 0 | 0 | 0 | 0 | 0 | 0 | 0 | 0 |
| As2O3 | Sl | 0 | 0 | 0 | 3 | 0 | 0 | 2 | 0 | 0 | 0 | 0 | 0 | 0 | 0 | 0 | 0 | 0 | 0 | 0 |
| Sb2O3 | Sl | 0 | 0 | 0 | 3 | 0 | 0 | 0 | 2 | 0 | 0 | 0 | 0 | 0 | 0 | 0 | 0 | 0 | 0 | 0 |
| Bi2O3 | Sl | 0 | 0 | 0 | 3 | 0 | 0 | 0 | 0 | 2 | 0 | 0 | 0 | 0 | 0 | 0 | 0 | 0 | 0 | 0 |
| MoO | Sl | 0 | 0 | 0 | 1 | 0 | 0 | 0 | 0 | 0 | 1 | 0 | 0 | 0 | 0 | 0 | 0 | 0 | 0 | 0 |
| Ag | Sl | 0 | 0 | 0 | 0 | 0 | 0 | 0 | 0 | 0 | 0 | 1 | 0 | 0 | 0 | 0 | 0 | 0 | 0 | 0 |
| Au | Sl | 0 | 0 | 0 | 0 | 0 | 0 | 0 | 0 | 0 | 0 | 0 | 1 | 0 | 0 | 0 | 0 | 0 | 0 | 0 |
| SO2 | Gas | 0 | 1 | 0 | 2 | 0 | 0 | 0 | 0 | 0 | 0 | 0 | 0 | 0 | 0 | 0 | 0 | 0 | 0 | 0 |
| SO3 | Gas | 0 | 1 | 0 | 3 | 0 | 0 | 0 | 0 | 0 | 0 | 0 | 0 | 0 | 0 | 0 | 0 | 0 | 0 | 0 |
| O2 | Gas | 0 | 0 | 0 | 2 | 0 | 0 | 0 | 0 | 0 | 0 | 0 | 0 | 0 | 0 | 0 | 0 | 0 | 0 | 0 |
| S2 | Gas | 0 | 2 | 0 | 0 | 0 | 0 | 0 | 0 | 0 | 0 | 0 | 0 | 0 | 0 | 0 | 0 | 0 | 0 | 0 |
| PbO | Gas | 0 | 0 | 0 | 1 | 1 | 0 | 0 | 0 | 0 | 0 | 0 | 0 | 0 | 0 | 0 | 0 | 0 | 0 | 0 |
| PbS | Gas | 0 | 1 | 0 | 0 | 1 | 0 | 0 | 0 | 0 | 0 | 0 | 0 | 0 | 0 | 0 | 0 | 0 | 0 | 0 |
| ZnS | Gas | 0 | 1 | 0 | 0 | 0 | 1 | 0 | 0 | 0 | 0 | 0 | 0 | 0 | 0 | 0 | 0 | 0 | 0 | 0 |
| ZnO | Gas | 0 | 0 | 0 | 1 | 0 | 1 | 0 | 0 | 0 | 0 | 0 | 0 | 0 | 0 | 0 | 0 | 0 | 0 | 0 |
| Zn | Gas | 0 | 0 | 0 | 0 | 0 | 1 | 0 | 0 | 0 | 0 | 0 | 0 | 0 | 0 | 0 | 0 | 0 | 0 | 0 |
| AsO | Gas | 0 | 0 | 0 | 1 | 0 | 0 | 1 | 0 | 0 | 0 | 0 | 0 | 0 | 0 | 0 | 0 | 0 | 0 | 0 |
| AsS | Gas | 0 | 1 | 0 | 0 | 0 | 0 | 1 | 0 | 0 | 0 | 0 | 0 | 0 | 0 | 0 | 0 | 0 | 0 | 0 |
| As2 | Gas | 0 | 0 | 0 | 0 | 0 | 0 | 2 | 0 | 0 | 0 | 0 | 0 | 0 | 0 | 0 | 0 | 0 | 0 | 0 |
| SbO | Gas | 0 | 0 | 0 | 1 | 0 | 0 | 0 | 1 | 0 | 0 | 0 | 0 | 0 | 0 | 0 | 0 | 0 | 0 | 0 |
| SbS | Gas | 0 | 1 | 0 | 0 | 0 | 0 | 0 | 1 | 0 | 0 | 0 | 0 | 0 | 0 | 0 | 0 | 0 | 0 | 0 |
| Sb | Gas | 0 | 0 | 0 | 0 | 0 | 0 | 0 | 1 | 0 | 0 | 0 | 0 | 0 | 0 | 0 | 0 | 0 | 0 | 0 |
| BiO | Gas | 0 | 0 | 0 | 1 | 0 | 0 | 0 | 0 | 1 | 0 | 0 | 0 | 0 | 0 | 0 | 0 | 0 | 0 | 0 |
| BiS | Gas | 0 | 1 | 0 | 0 | 0 | 0 | 0 | 0 | 1 | 0 | 0 | 0 | 0 | 0 | 0 | 0 | 0 | 0 | 0 |
| Bi | Gas | 0 | 0 | 0 | 0 | 0 | 0 | 0 | 0 | 1 | 0 | 0 | 0 | 0 | 0 | 0 | 0 | 0 | 0 | 0 |
| CO | Gas | 0 | 0 | 0 | 1 | 0 | 0 | 0 | 0 | 0 | 0 | 0 | 0 | 0 | 0 | 0 | 0 | 0 | 0 | 1 |
| Component | State | / (kJ·mol−1) | / (J·K−1·mol−1) | ||||
|---|---|---|---|---|---|---|---|
| a | b | c | d | ||||
| Cu2S | Liquid | −68.100 | 132.462 | 89.665 | 0.000 | 0.000 | 0.000 |
| Cu2O | Liquid | −130.224 | 96.402 | 99.916 | 0.000 | 0.000 | 0.000 |
| FeS | Liquid | −64.631 | 91.208 | 62.552 | 0.000 | 0.000 | 0.000 |
| FeO | Liquid | −257.276 | 57.591 | 68.201 | 0.000 | 0.000 | 0.000 |
| Fe3O4 | Liquid | −993.334 | 198.385 | 213.389 | 0.000 | 0.000 | 0.000 |
| SiO2 | Liquid | −927.548 | 9.310 | 85.774 | 0.000 | 0.000 | 0.000 |
| CaO | Liquid | −572.908 | 40.980 | 62.762 | 0.000 | 0.000 | 0.000 |
| MgO | Liquid | −561.018 | 12.833 | 66.946 | 0.000 | 0.000 | 0.000 |
| Al2O3 | Liquid | −595.568 | 45.145 | 144.866 | 0.000 | 0.000 | 0.000 |
| PbS | Liquid | −93.143 | 84.129 | 66.946 | 0.000 | 0.000 | 0.000 |
| PbO | Liquid | −202.249 | 73.379 | 65.000 | 0.000 | 0.000 | 0.000 |
| ZnS | Liquid | −203.005 | 58.661 | 67.002 | 0.000 | 0.000 | 0.000 |
| ZnO | Liquid | −309.542 | 47.920 | 60.669 | 0.000 | 0.000 | 0.000 |
| As | Liquid | 21.568 | 53.284 | 28.833 | 0.000 | 0.000 | 0.000 |
| As2O3 | Liquid | −643.439 | 128.135 | 152.720 | 0.000 | 0.000 | 0.000 |
| Sb | Liquid | 17.531 | 62.712 | 31.381 | 0.000 | 0.000 | 0.000 |
| Sb2O3 | Liquid | −675.490 | 143.628 | 156.904 | 0.000 | 0.000 | 0.000 |
| Bi | Liquid | 9.271 | 71.980 | 27.197 | 0.000 | 0.000 | 0.000 |
| Bi2O3 | Liquid | −578.024 | 149.814 | 202.005 | 0.000 | 0.000 | 0.000 |
| MoS | Liquid | −407.113 | 114.979 | 156.904 | 0.000 | 0.000 | 0.000 |
| MoO | Liquid | 358.015 | 302.620 | 38.457 | −1.797 | −0.517 | 0.825 |
| Au | Liquid | 0.000 | 47.489 | −268.634 | 237.139 | 1418.47 | −52.813 |
| Ag | Liquid | 6.393 | 43.220 | 33.473 | 0.000 | 0.000 | 0.000 |
| Ag2S | Liquid | −32.791 | 142.893 | 93.002 | 0.000 | 0.000 | 0.000 |
| SO2 | Gas | −296.820 | 248.226 | 54.781 | 3.350 | −24.745 | −0.241 |
| SO3 | Gas | −395.774 | 256.778 | 77.834 | 4.032 | −42.617 | −0.369 |
| N2 | Gas | 0.000 | 191.615 | 35.369 | 1.041 | −41.465 | 0.111 |
| O2 | Gas | 0.000 | 205.154 | 34.860 | 1.312 | −14.141 | 0.163 |
| S2 | Gas | 128.603 | 228.169 | 34.672 | 3.286 | −2.816 | −0.312 |
| CO2 | Gas | −393.515 | 213.774 | 54.437 | 5.116 | −43.579 | −0.806 |
| CO | Gas | −110.544 | 197.665 | 29.932 | 5.415 | −10.814 | −1.054 |
| H2O | Gas | −241.832 | 188.837 | 31.438 | 14.106 | −24.952 | −1.832 |
| PbS | Gas | 127.959 | 251.416 | 37.350 | 0.194 | −2.096 | 0.140 |
| PbO | Gas | 68.139 | 240.048 | 41.612 | −3.526 | −20.136 | 1.014 |
| ZnS | Gas | 204.322 | 236.404 | 27.713 | 7.021 | 251.297 | −1.105 |
| ZnO | Gas | 136.518 | 242.811 | 37.671 | −0.286 | −1.954 | 0.735 |
| Zn | Gas | 130.403 | 160.992 | 20.898 | −0.133 | −0.067 | 0.034 |
| AsO | Gas | 43.807 | 230.408 | 43.664 | −4.280 | −11.197 | 0.946 |
| AsS | Gas | 181.400 | 242.065 | 44.417 | −4.409 | −6.808 | 0.916 |
| As2 | Gas | 190.711 | 240.888 | 36.702 | 1.152 | −1.774 | −0.507 |
| SbO | Gas | −103.502 | 238.351 | 47.257 | −3.650 | −40.324 | 0.512 |
| SbS | Gas | 190.794 | 249.701 | 46.218 | −2.657 | −34.352 | 0.255 |
| Sb | Gas | 267.181 | 180.273 | 8.955 | 6.151 | 80.063 | −0.315 |
| BiO | Gas | 125.690 | 246.413 | 36.508 | 0.526 | −3.663 | 0.001 |
| BiS | Gas | 176.552 | 257.878 | 38.237 | −1.090 | −3.599 | 0.765 |
| Bi | Gas | 208.742 | 187.011 | 21.189 | −0.732 | −0.203 | 0.320 |
| Component | Product | Activity Coefficient | References |
|---|---|---|---|
| Cu2S | Mt | 1 | [25,26,27] |
| FeS | Mt | [25] | |
| FeO | Mt | [25] | |
| Fe3O4 | Mt | [25] | |
| PbS | Mt | [25] | |
| ZnS | Mt | [25] | |
| As | Mt | [28] | |
| Sb | Mt | [28] | |
| Bi | Mt | [29] | |
| MoS | Mt | MQC | Activity model |
| Au | Mt | [30,31] | |
| Ag2S | Mt | [30,31] | |
| Cu2O | Sl | [25] | |
| Cu2S | Sl | [25] | |
| FeS | Sl | 70 | [25] |
| FeO | Sl | [25] | |
| Fe3O4 | Sl | [25] | |
| SiO2 | Sl | 2.1 | [32] |
| CaO | Sl | 1 | [32] |
| MgO | Sl | 1 | [32] |
| Al2O3 | Sl | 1 | [32] |
| PbO | Sl | [30] | |
| ZnO | Sl | [33] | |
| As2O3 | Sl | [30] | |
| Sb2O3 | Sl | [30] | |
| Bi2O3 | Sl | [30] | |
| MoO | Sl | MQC | Activity model |
| Au | Sl | 480 | [31,34] |
| Ag | Sl | 920 | [31,35] |
References
- Hu, Z.Y. Design and Application of Oxygen Enriched Side Blowing for Copper Smelting Process Control System. South. Met. 2023, 9–12+29. [Google Scholar] [CrossRef]
- Yuan, J.H. Current Status and Outlook of Side Blowing Furnace. Nonferrous Met. (Extr. Metall.) 2022, 31–35. [Google Scholar] [CrossRef]
- Yang, B.; Liu, W.; Jiao, F.; Zhang, L.; Qin, W.; Jiang, S. Numerical Simulation and Application of an Oxygen-Enriched Side-Blown Smelting Furnace for the Treatment of Electroplating Sludge. Sustainability 2023, 15, 10721. [Google Scholar] [CrossRef]
- Xie, S.; Zhao, B. Phase Equilibrium Studies of Nonferrous Smelting Slags: A Review. Metals 2024, 14, 278. [Google Scholar] [CrossRef]
- Zou, Q.; Hu, J.; Yang, S.; Wang, H.; Deng, G. Investigation of the Splashing Characteristics of Lead Slag in Side-Blown Bath Melting Process. Energies 2023, 16, 1007. [Google Scholar] [CrossRef]
- Zhao, B.; Ren, Y.Z.; Jia, W.L.; Zhang, Y.Y.; Zhou, S.W.; Li, B. Regulation of arsenic element trend in copper top-blown smelting process. China Nonferrous Metall. 2024, 53, 88–97. [Google Scholar] [CrossRef]
- Wang, W.; Cai, X.; Mu, L.; Lu, T.; Lv, C.; Zhao, H.; Sohn, H.Y. CFD Simulation of the Effects of Mushroom Heads in a Bottom-Blown Copper Smelting Furnace. Metall. Mater. Trans. B-Proc. Metall. Mater. Proc. Sci. 2024, 55, 694–708. [Google Scholar] [CrossRef]
- Shi, L.; Wang, Z.Y. Analyzing the Factors Affecting the Concentration of Dilute Acid in the Copper Smelting Process of Oxygen-rich Side Blowing Furance. Non-Ferr. Min. Metall. 2024, 40, 31–33. [Google Scholar]
- Guo, X.Y.; Wang, Q.M.; Tian, Q.H.; Zhang, Y.Z. Non-steady multiphase equilbrium process of copperoxygen-enriched bottom blowing bath smelting with gradual changeof oxygen and sulfur potential of different positions in furance. Chin. J. Nonferrous Met. 2015, 25, 1072–1079. [Google Scholar] [CrossRef]
- Guo, X.Y.; Wang, Q.M.; Tian, Q.H.; Zhao, B.J. Analysis and optimization of oxygen bottomblowing copper smelting process. Chin. J. Nonferrous Met. 2016, 26, 689–698. [Google Scholar] [CrossRef]
- Wang, Q.; Guo, X.; Tian, Q.; Jiang, T.; Chen, M.; Zhao, B. Development and Application of SKSSIM Simulation Software for the Oxygen Bottom Blown Copper Smelting Process. Metals 2017, 7, 431. [Google Scholar] [CrossRef]
- Wang, Q.; Guo, X.; Tian, Q.; Jiang, T.; Chen, M.; Zhao, B. Effects of Matte Grade on the Distribution of Minor Elements (Pb, Zn, As, Sb, and Bi) in the Bottom Blown Copper Smelting Process. Metals 2017, 7, 502. [Google Scholar] [CrossRef]
- Li, M.; Zhou, J.; Tong, C.; Zhang, W.; Chen, Z.; Wang, J. Thermodynamic Modeling and Optimization of the Copper Flash Converting Process Using the Equilibrium Constant Method. Metall. Mater. Trans. B-Proc. Metall. Mater. Proc. Sci. 2018, 49, 1794–1807. [Google Scholar] [CrossRef]
- Li, M.Z.; Zhou, J.M.; Zhang, W.H.; Li, H.S.; Tong, C.R. Thermodynamics analysis of distribution behavior of impurity elements during copper flash converting. Chin. J. Nonferrous Met. 2017, 27, 1951–1959. [Google Scholar] [CrossRef]
- Wang, J.L.; Zhang, C.F.; Zhang, W.H. Multi-phase equilibrium model of lead flash smelting process. J. Cent. South Univ. (Sci. Technol.) 2012, 43, 429–434. [Google Scholar]
- Chen, L.; Yang, T.Z.; Liu, W.F.; Zhang, D.C.; Bin, S.; Bin, W.D. Distribution of valuable metals in liquid high lead slag during reduction process. Chin. J. Nonferrous Met. 2014, 24, 1056–1062. [Google Scholar] [CrossRef]
- Liu, Y.T.; Yang, T.Z.; Li, M.Z. Phase equilibrium model for lead oxygen-enriched side-blown oxidation bath smelting. Chin. J. Nonferrous Met. 2019, 29, 2609–2619. [Google Scholar] [CrossRef]
- Liu, Y.T.; Yang, T.Z.; Li, M.Z. Multielement and multiphase equilibrium analysis of lead oxygen-enriched side-blown oxidation smelting. Chin. J. Nonferrous Met. 2020, 30, 1110–1118. [Google Scholar]
- Shen, Z.; Li, Y.; Xu, N.; Sun, B.; Du, W.; Xu, M.; Chang, L. Investigation on the Chemical Equilibrium Products for CnHmOlNk Type Fuels Using Equilibrium Constants Database. Fuel 2022, 310, 122325. [Google Scholar] [CrossRef]
- Ye, Z.L.; Zhu, Y.F.; Zhang, H.P.; Zhou, S.W.; Li, B.; Shi, Z. A Thermodynamic Study of Copper Oxygen-Riched Smelting Process to Produce High-Grade Matte. J. Kunming Univ. Sci. Technol. (Nat. Sci.) 2022, 47, 54. [Google Scholar] [CrossRef]
- Xu, S.C.; Li, M.Z.; Zhao, Z.H.; Zhong, L.H.; He, F.Y.; Huang, J.D. Thermodynamic simulation modeling of copper anode furnace refining process based on MetCal software. Chin. J. Nonferrous Met. 2024, 1–21. [Google Scholar] [CrossRef]
- Chen, X.; Li, M.; Liu, F.; Huang, J.; Yang, M. Multi-Phase Equilibrium Model of Oxygen-Enriched Lead Oxidation Smelting Process Based on Chemical Equilibrium Constant Method. Processes 2023, 11, 3043. [Google Scholar] [CrossRef]
- Lin, L.; He, F. Numerical Simulation Whole Process of Oxygen-Enriched Side-Blown Smelting and Multi-Lance Top-Blown Converting. Nonferrous Met. (Extr. Metall.) 2023, 103–112. [Google Scholar] [CrossRef]
- Xiao, Y.; Lu, T.; Zhou, Y.; Su, Q.; Mu, L.; Wei, T.; Zhao, H.; Liu, F. Computational Fluid Dynamics Study on Enhanced Circulation Flow in a Side-Blown Copper Smelting Furnace. JOM 2021, 73, 2724–2732. [Google Scholar] [CrossRef]
- Tan, P.F.; Zhang, C.F. Computer Model of Distribution Behavior of Accessory Elements in Copper Smelting. Acta Metallurgica Sinica 1997, 10, 1094–1100. [Google Scholar] [CrossRef]
- Shimpo, R. An Application of Equibibrium Calculations to the Copper Smelting Operation. Available online: https://onemine.org/documents/an-application-of-equibibrium-calculations-to-the-copper-smelting-operation (accessed on 23 April 2024).
- Shimpo, R.; Goto, S.; Ogawa, O.; Asakura, I. A Study on the Equilibrium between Copper Matte and Slag. Can. Metall. Q. 1986, 25, 113–121. [Google Scholar] [CrossRef]
- Nagamori, M.; Errington, W.J.; Mackey, P.J.; Poggi, D. Thermodynamic Simulation Model of the Isasmelt Process for Copper Matte. Met. Mater. Trans. B 1994, 25, 839–853. [Google Scholar] [CrossRef]
- Nagamori, M.; Mackey, P.J.; Tarassoff, P. Copper Solubility in FeO−Fe2O3−SiO2−Al2O3 Slag and Distribution Equilibria of Pb, Bi, Sb and As between Slag and Metallic Copper. Met. Trans. B 1975, 6, 295–301. [Google Scholar] [CrossRef]
- Tan, P.; Zhang, C. Computer Model of Copper Smelting Process and Distribution Behaviors of Accessory Elements. J. Cent. South Univ. Technol. 1997, 4, 36–41. [Google Scholar] [CrossRef]
- Sinha, S.N.; Sohn, H.Y.; Nagamori, M. Distribution of Gold and Silver between Copper and Matte. Met. Trans. B 1985, 16, 53–59. [Google Scholar] [CrossRef]
- Swinbourne, D.R.; Kho, T.S. Computational Thermodynamics Modeling of Minor Element Distributions During Copper Flash Converting. Metall. Mater. Trans. B-Proc. Metall. Mater. Proc. Sci. 2012, 43, 823–829. [Google Scholar] [CrossRef]
- Mackey, P.J. The Physical Chemistry of Copper Smelting Slags—A Review. Can. Metall. Q. 1982, 21, 221–260. [Google Scholar] [CrossRef]
- Hall, L.D. The Vapor Pressure of Gold and the Activities of Gold in Gold-Copper Solid Solutions. J. Am. Chem. Soc. 1951, 73, 757–760. [Google Scholar] [CrossRef]
- Swinbourne, D.R.; Yazawa, A.; Barbante, G.G. Thermodynamic Modeling of Selenide Matte Converting. Met. Mater. Trans. B 1997, 28, 811–819. [Google Scholar] [CrossRef]
| Phase | Chemical Components |
|---|---|
| Copper matte (Mt) | Cu2S, FeS, FeO, Fe3O4, PbS, ZnS, As, Sb, Bi, MoS, Au, Ag2S, Other1 |
| Smelting slag (Sl) | Cu2S, Cu2O, FeS, FeO, Fe3O4, SiO2, CaO, MgO, Al2O3, PbO, ZnO, As2O3, Sb2O3, Bi2O3, MoO, Au, Ag, Other2 |
| Flue gas (Gas) | SO2, SO3, N2, O2, S2, PbO, PbS, ZnS, ZnO, Zn, AsO, AsS, As2, SbO, SbS, Sb, BiO, BiS, Bi, CO2, CO, H2O |
| Dust (Dt) | Cu2S, Cu2O, FeS, FeO, Fe3O4, PbS, PbO, ZnS, ZnO, As2O3, As, Sb2O3, Sb, Bi, Bi2O3, MoS, MoO, Au, Ag, Ag2S, SiO2, CaO, MgO, Al2O3, Other3 |
| Equilibrium Reaction | Kj | Equilibrium Reaction | Kj |
|---|---|---|---|
| Cu2S(Mt) + FeO(Mt) = Cu2O(Sl) + FeS(Sl) | K1 | 2CO(gas) + O2(gas) = 2CO2(gas) | K17 |
| 2FeS(Mt) + 3O2(gas) = 2FeO(Sl) + 2SO2(gas) | K2 | 2AsS + 2O2(gas) = As2(gas) + 2SO2(gas) | K18 |
| FeS(Mt) = FeS(Sl) | K3 | As2(gas) + O2(gas) = 2AsO(gas) | K19 |
| 6FeO(Mt) + O2(gas) = 2Fe3O4(Mt) | K4 | SbS(gas) + O2(gas) = Sb(gas) + SO2(gas) | K20 |
| 2PbS(Mt) + 3O2(gas) = 2PbO(gas) + 2SO2(gas) | K5 | 2Sb(gas) + O2(gas) = 2SbO(gas) | K21 |
| ZnS(Mt) = ZnS(gas) | K6 | BiS(gas) + O2(gas) = Bi(gas) + SO2(gas) | K22 |
| 2As(Mt) = As2(gas) | K7 | 2Bi(gas) + O2(gas) = 2BiO(gas) | K23 |
| Sb(Mt) = Sb(gas) | K8 | 2PbS(gas) + 3O2(gas) = 2PbO(gas) + 2SO2(gas) | K24 |
| Bi(Mt) = Bi(gas) | K9 | ZnS(gas) + O2(gas) = Zn(gas) + SO2(gas) | K25 |
| 2MoS(Mt) + 3O2(gas) = 2MoO(Sl) + 2SO2(gas) | K10 | PbO(gas) = PbO(Sl) | K26 |
| Au(Mt) = Au(Sl) | K11 | 4AsO(gas) + O2(gas) = 2As2O3(Sl) | K27 |
| Ag2S(Mt) + O2(gas) = 2Ag(Sl) + SO2(gas) | K12 | 4SbO(gas) + O2(gas) = 2Sb2O3(Sl) | K28 |
| 2Cu2S(Sl) + 3O2(gas) = 2Cu2O(Sl) + 2SO2(gas) | K13 | 4BiO(gas) + O2(gas) = 2Bi2O3(Sl) | K29 |
| 6FeO(Sl) + O2(gas) = 2Fe3O4(Sl) | K14 | 2Zn(gas) + O2(gas) = 2ZnO(Sl) | K30 |
| FeO(Sl) = FeO(Mt) | K15 | S2(gas) + 2O2(gas) = 2SO2(gas) | K31 |
| 2SO2(gas) + O2(gas) = 2SO3(gas) | K16 | 2ZnS(gas) + 3O2(gas) = 2ZnO(gas) + 2SO2(gas) | K32 |
| Raw Material | Cu | S | Fe | SiO2 | CaO | MgO | Al2O3 | Pb | Zn | As |
|---|---|---|---|---|---|---|---|---|---|---|
| Mixed copper concentrate | 17.999 | 22.314 | 23.583 | 15.219 | 1.201 | 0.889 | 1.224 | 0.352 | 0.770 | 0.101 |
| Reverts | 21.200 | 10.000 | 31.037 | 18.340 | 2.336 | 1.240 | 4.422 | - | - | - |
| Burning coal | - | 0.808 | 0.604 | 7.179 | 0.368 | 0.049 | 0.200 | - | - | - |
| Limestone | - | - | 0.194 | 4.370 | 50.768 | - | - | - | - | - |
| Quartz sand | - | - | 0.466 | 88.755 | 0.970 | 0.582 | 0.970 | - | - | - |
| Raw Material | Sb | Bi | Mo | Au | Ag | O | C | H | N | Other |
| Mixed copper concentrate | 0.011 | 0.012 | 0.159 | 8.29 × 10⁻⁴ | 3.90 × 10⁻³ | 11.076 | 0.522 | 1.036 | - | 3.527 |
| Reverts | - | - | - | - | - | 6.858 | - | - | - | 4.566 |
| Burning coal | - | - | - | - | - | 4.923 | 76.405 | 4.111 | 1.343 | 4.011 |
| Limestone | - | - | - | - | - | 31.688 | 10.873 | 0.336 | - | 1.770 |
| Quartz sand | - | - | - | - | - | 3.418 | 0.208 | 0.336 | - | 4.296 |
| CuFeS2 | Cu5FeS4 | FeS2 | FeS | SiO2 | CaCO3 | MgCO3 | Al2O3 | PbS | ZnS | As2S3 |
|---|---|---|---|---|---|---|---|---|---|---|
| 32.785 | 6.708 | 12.888 | 4.658 | 15.219 | 2.143 | 1.861 | 1.224 | 0.406 | 1.148 | 0.166 |
| Sb2S3 | Bi2S3 | MoS | Au | Ag2S | H2O | FeO | Fe2O3 | Cu2O | Other | |
| 0.016 | 0.014 | 0.213 | 0.001 | 0.004 | 9.263 | 4.672 | 0.385 | 2.701 | 3.525 |
| Cu2S | Cu2O | FeS | FeO | Fe3O4 | SiO2 | CaO | MgO | Al2O3 | Other |
|---|---|---|---|---|---|---|---|---|---|
| 26.411 | 0.123 | 12.834 | 25.552 | 4.176 | 18.34 | 2.336 | 1.240 | 4.422 | 4.566 |
| C | CH4 | CO2 | H2 | N2 | H2S | Fe2O3 | SiO2 |
|---|---|---|---|---|---|---|---|
| 75.397 | 1.2 | 0.4 | 3.703 | 1.343 | 0.1 | 0.863 | 7.179 |
| CaO | MgO | Al2O3 | H2O | O2 | S | Other | |
| 0.368 | 0.049 | 0.2 | 0.9 | 3.573 | 0.714 | 4.011 |
| CaCO3 | FeO | SiO2 | H2O | Other |
|---|---|---|---|---|
| 90.61 | 0.25 | 4.37 | 3 | 1.77 |
| SiO2 | Fe2O3 | CaCO3 | Al2O3 | MgO | H2O | Other |
|---|---|---|---|---|---|---|
| 88.755 | 0.666 | 1.731 | 0.97 | 0.582 | 3 | 4.296 |
| Cu2S | FeS | FeO | Fe3O4 | PbS | ZnS | As | Sb | Bi | MoS | Au | Ag2S | Other |
|---|---|---|---|---|---|---|---|---|---|---|---|---|
| 71.534 | 22.111 | 0.797 | 0.997 | 1.036 | 0.793 | 0.032 | 0.008 | 0.009 | 0.015 | 0.003 | 0.014 | 2.651 |
| Cu2S | Cu2O | FeS | FeO | Fe3O4 | SiO2 | CaO | MgO | Al2O3 |
|---|---|---|---|---|---|---|---|---|
| 1.917 | 0.552 | 0.001 | 32.437 | 13.164 | 33.240 | 7.034 | 1.655 | 2.416 |
| PbO | ZnO | As2O3 | Sb2O3 | Bi2O3 | MoO | Au | Ag | Other |
| 0.146 | 1.274 | 0.133 | 0.018 | 0.010 | 0.320 | 7.44 × 10⁻⁵ | 3.61 × 10⁻⁴ | 5.682 |
| Cu2S | FeS | FeO | Fe3O4 | PbS | ZnS | As | Sb | Bi |
|---|---|---|---|---|---|---|---|---|
| 20.018 | 5.750 | 24.211 | 10.000 | 0.269 | 0.206 | 0.008 | 0.002 | 0.002 |
| MoS | Au | Ag2S | Cu2O | SiO2 | CaO | MgO | Al2O3 | PbO |
| 0.004 | 0.001 | 0.004 | 0.409 | 24.598 | 5.205 | 1.225 | 1.788 | 0.108 |
| ZnO | As2O3 | Sb2O3 | Bi2O3 | MoO | Ag | Other | ||
| 0.943 | 0.098 | 0.014 | 0.007 | 0.237 | 0.000 | 4.894 |
| Heat Income | Heat Expense | ||||||||
|---|---|---|---|---|---|---|---|---|---|
| Heat Type | Supplies | Temp./°C | MJ/h | % | Heat Type | Supplies | Temp./°C | MJ/h | % |
| Physical heat | Mixed copper concentrate | 25 | 0.00 | 0.00 | Physical heat | Mt | 1173 | 16,873.44 | 8.26 |
| Reverts | 25 | 0.00 | 0.00 | Sl | 1193 | 56,541.64 | 27.70 | ||
| Burning coal | 25 | 0.00 | 0.00 | Gas | 1233 | 80,056.76 | 39.22 | ||
| Limestone | 25 | 0.00 | 0.00 | St | 1233 | 1708.54 | 0.84 | ||
| Quartz sand | 25 | 0.00 | 0.00 | ||||||
| Primary oxygen | 25 | 0.00 | 0.00 | ||||||
| Primary air | 25 | 0.00 | 0.00 | ||||||
| Secondary oxygen | 25 | 0.00 | 0.00 | ||||||
| Secondary air | 25 | 0.00 | 0.00 | ||||||
| Chemical heat | 25 | 204,219.43 | 100.00 | Chemical heat | 25 | 0.00 | 0.00 | ||
| Exchange heat | Cooling inlet water | 39 | Exchange heat | Cooling outlet water | 45 | 27,612.06 | 13.52 | ||
| Natural heat dissipation | 200 | 18,807.43 | 9.21 | ||||||
| Hydrocooling | 2500 | 1.23 | |||||||
| Total | 204,219.43 | 100.00 | Total | 204,219.43 | 100.00 | ||||
| Type | Phase | Cu | S | Fe | SiO2 | CaO | MgO | Al2O3 |
|---|---|---|---|---|---|---|---|---|
| Production data | Mt | 57.793 | 22.420 | 17.027 | 0.178 | - | - | - |
| Modeling results | 57.124 | 22.879 | 15.388 | - | - | - | - | |
| Production data | Sl | 2.048 | 0.421 | 34.643 | 32.131 | 7.381 | 1.821 | 2.351 |
| Modeling results | 2.022 | 0.387 | 34.739 | 33.240 | 7.034 | 1.655 | 2.416 |
| Type | Dx | Pb | Zn | As | Bi | Mo | Au | Ag |
|---|---|---|---|---|---|---|---|---|
| Production data | Mt/Sl | 6.388 | 0.498 | 0.350 | 1.000 | 0.039 | 32.350 | 32.863 |
| Modeling results | 6.628 | 0.443 | 0.316 | 1.081 | 0.041 | 34.651 | 33.647 |
Disclaimer/Publisher’s Note: The statements, opinions and data contained in all publications are solely those of the individual author(s) and contributor(s) and not of MDPI and/or the editor(s). MDPI and/or the editor(s) disclaim responsibility for any injury to people or property resulting from any ideas, methods, instructions or products referred to in the content. |
© 2024 by the authors. Licensee MDPI, Basel, Switzerland. This article is an open access article distributed under the terms and conditions of the Creative Commons Attribution (CC BY) license (https://creativecommons.org/licenses/by/4.0/).
Share and Cite
Li, M.; Feng, Y.; Chen, X. Thermodynamic Simulation Model of Copper Side-Blown Smelting Process. Metals 2024, 14, 840. https://doi.org/10.3390/met14080840
Li M, Feng Y, Chen X. Thermodynamic Simulation Model of Copper Side-Blown Smelting Process. Metals. 2024; 14(8):840. https://doi.org/10.3390/met14080840
Chicago/Turabian StyleLi, Mingzhou, Yuchen Feng, and Xinzhou Chen. 2024. "Thermodynamic Simulation Model of Copper Side-Blown Smelting Process" Metals 14, no. 8: 840. https://doi.org/10.3390/met14080840