Abstract
This work combined theoretical calculation with experimental characterization to methodically study the anisotropy mechanism and evolution of the plastic behavior of pure titanium. Initially, a constant-strain uniaxial tensile test was used to measure the anisotropy of the yield behavior along the rolling direction (RD) and transverse direction (TD). Subsequently, the information of crystal orientation both before and after deformation was statistically characterized using electron backscatter diffraction (EBSD). Ultimately, the main deformation mechanism was determined by combining Schmid law with an analysis of the variation of SF values of each deformation mode with the angular relationship between the loading axis and the grain’s c-axis. The findings demonstrate that, for each slip system, the variation trend and value of the SF are influenced by the angle formed by the loading axis and the grain’s c- and a-axes. The primary result of dislocation slip activation is the change of the tilt angle of the grain c-axis from ND to TD, but this has little effect on the tilt angle of the grain c-axis from ND to RD. Prismatic <a> slip dominates the tensile deformation along the RD. Pyramidal <a> slip and pyramidal <c+a> slip will be activated during the subsequent hardening, whereas basal <a> slip is difficult to activate. The prismatic <a> slip in the soft-oriented grain will be preferentially activated during the tensile deformation along the TD, and the prismatic <a> slip and pyramidal <a> slip will become the dominant deformation modes during the subsequent hardening. Some soft-oriented grains could activate basal <a> slip and pyramidal <c+a> slip, but dislocation slip is restricted and coordinated by {10-12}ET.
1. Introduction
Titanium metal is a highly functionalized and structured material with exceptional qualities, including low thermal expansion, biocompatibility, high specific strength, and resistance to corrosion [1,2,3,4]. However, the material’s own structured characteristics and the crystal’s preferential orientation during the subsequent forming process can easily lead to significant anisotropy in the macro-mesoscopic deformation behavior of the material, which in turn leads to the uncontrollable performance of titanium products and the expensive processing cost [5,6,7]. The complex and varied plastic deformation modes of this type of metal are caused by the poor symmetry of the hexagonal structure, and the CRSS needed to activate each deformation mode differs greatly due to the different degrees of atomic density [8,9,10,11]. The easiest to activate in titanium at room temperature is prismatic <a> slip {1 0 − 1 0}<1 1 − 2 0>, which is followed by basal slip {0 0 0 1}<1 1 − 2 0> and pyramidal slip {1 0 − 1 1}<1 1 − 2 0>, in that order. It is evident that the aforementioned three slip modes are limited to producing deformation along the grain a-axis [12,13,14]. Although the pyramidal <c+a> slip can coordinate the deformation in the c-axis direction, the nucleation of the slip system due to the high CRSS often requires strain accumulation to a certain extent or significant stress concentration locally [15,16,17,18]. Twins become one of the key mechanisms for coordinating plastic deformation in low-stacking-fault-energy metals when the activation of dislocation slip is restricted and unable to satisfy the demands of plastic deformation [19,20,21,22]. Although not a thermally activated phenomenon, the critically resolved shear stress and shear strain also have an impact on the activability of the twin behavior [23,24,25,26]. Consequently, the coupling effect between the deformation modes and the differences between CRSS has been found to lead to the complex and unpredictable macro-mesoscopic deformation behavior of titanium [27,28].
Different degrees of crystal preference orientation in the material can readily result from the rotation of the grain’s internal orientation caused by the activation of dislocation slip (twin) at the grain scale [29,30,31]. Specific crystal orientations lead to significant anisotropy in the activation characteristics of each deformation mode, and the difference in the activated deformation modes in turn leads to new texture redirection [32,33,34,35]. For example, the basal bimodal texture, in which the tilt angle of the grain c-axis from ND to TD is about 20~50°, is the most common texture type in rolled titanium plate under the traditional cold-rolling process [36,37,38,39]. Under this type of texture, the prismatic <a> slip has an absolute initial advantage when deformed in the RD-TD plane, but the activation of prismatic <a> slip may lead to the deterioration of the crystal orientation of other slip systems when they are first activated [40,41]. Moreover, the higher strain hardening phenomenon leads to an increase in the difficulty of the <a> type slip to adapt to the deformation in the direction of plate thickness, which in turn reduces the thinning ability in the forming process, such as during sheet strip rolling and stamping [42,43]. A large number of studies have shown that twins are not the cause of the initial yield of titanium, but the texture redirection and Hall–Petch effect induced by twins still have an important impact on the subsequent strain hardening behavior [44,45,46,47,48]. Therefore, a deeper comprehension of the connection between the crystal orientation and the activability of each deformation mode is essential for the reasonable formulation of processes.
In conclusion, the foundation of rational process formulation and material property control is to clarify the relationship between process, texture, deformation mode, and mechanical behavior. In order to systematically reveal the variation law of the activability of each deformation mode with loading mode and crystal orientation, this research studies the mechanism of texture on the anisotropic behavior of pure titanium plates. First, the textured titanium plate was tested with a constant-strain uniaxial tensile test in different directions, and the evolution of the crystal orientation information with strain during the deformation process was examined using EBSD. Then, based on Schmid law, the variation of the activation of each deformation mode with the angular relationship between the c-axis and the loading axis of the grain under different stress states was studied. Finally, considering the proportional relationship between the CRSS of each slip system, the dominant deformation mode was identified and predicted. This work can provide significant theoretical guidance for the process formulation of titanium plastic forming.
2. Materials and Methods
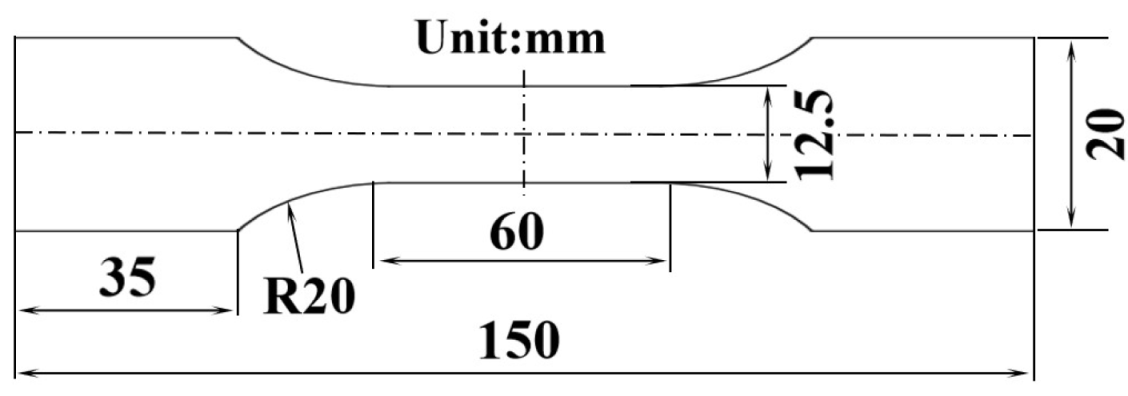
The experimental material was annealed TA2 pure titanium sheet with a thickness of 2 mm, and the composition is shown in Table 1. The tensile specimen was cut by WEDM, and the dimensions are shown in Figure 1. The uniaxial tensile tests were conducted along RD and TD at room temperature using the Zwickell 100 high-precision electronic universal materials testing machine. The tensile strains were set to 0.02, 0.04, 0.06, 0.08, and 0.12, and the average strain rate was 0.002 s−1. Each set of specimens was repeated two times to ensure good reproducibility. For ease of description, RD (0.04) was defined to mean a tensile of strain 0.04 along RD. The microstructure and crystal orientation both before and after deformation were examined using optical microscopy and EBSD, with the observation position being the RD-TD plate plane. The surface of the deformed specimen was first mechanically ground with silicon carbide sandpaper from P1000 to P2500 and then mechanically polished with a silica suspension with a particle size of 0.05 μm. The corrosion reagent of the metallographic sample was 1.5 mL HF + 15 mL HNO3 + 85 mL H2O, and the corrosion time was 60 s. The 10% perchloric acid + 90% methanol solution was used to electropolish the EBSD specimen for 5 s at 35 V and 5 °C. The microscopic texture detection instrument was JSM-7001F (JEOL Ltd., Tokyo, Japan), and the grain orientation information was constructed with a scanning step size of 0.5 μm. OIM software (EDAX Inc., Mahwah, NJ, USA) was utilized to evaluate the EBSD data, and the crystal information was processed and analyzed using the data with a confidence interval greater than 0.1.

Table 1.
Chemical composition of pure titanium plate.
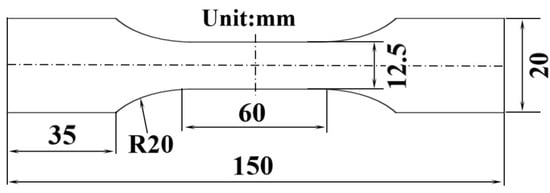
Figure 1.
Tensile specimen size.
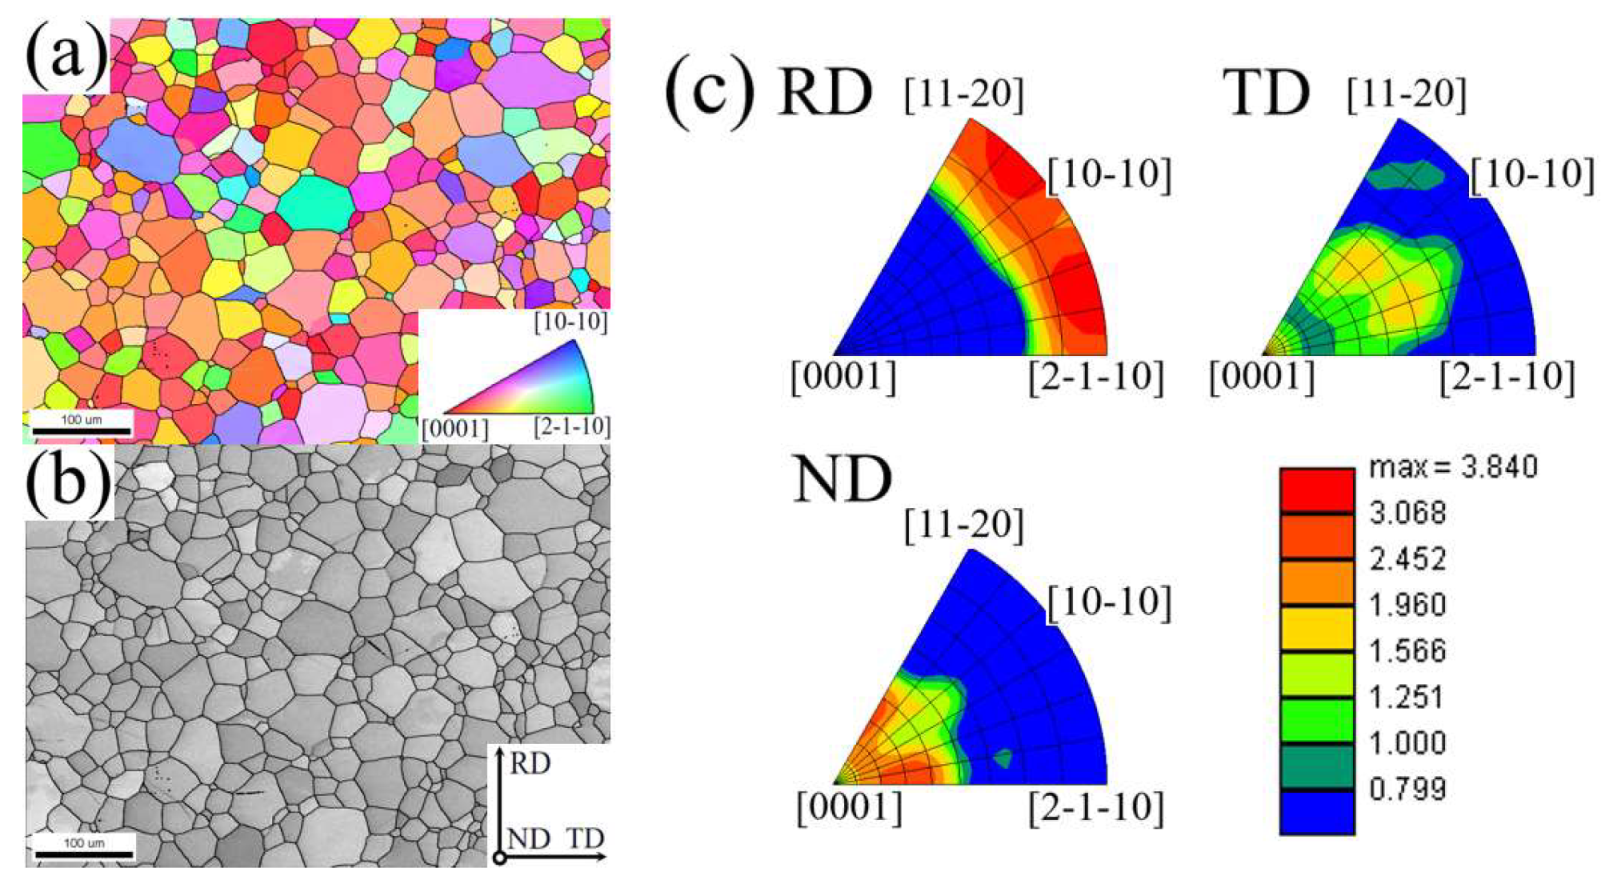
Figure 2 shows the microstructure of the initial plate. The colors of the grains in the orientation map (OM) correspond to their crystallographic orientation with respect to ND: Red grains indicate <0 0 0 1>//ND, green grains indicate <2 − 1 − 1 0>//ND, and blue grains represent <1 0 − 1 0>//ND. The OM (Figure 2a) shows that the initial structure is basically equiaxed, and the average intercept grain size is about 20 μm. To display the type and quantity of twin boundaries, the grain boundaries of the {1 0 − 1 2} extension twin (ET) and {1 1 − 2 2} contraction twin (CT) are superimposed on a grayscale map. Combined with the grayscale map (Figure 2b), it can be found that there are no twins inside the grain, and the color distribution is relatively uniform, indicating that the orientation difference inside the initial grain is small, and the dislocation density is low. Based on the IPF (Figure 2c), it is possible to determine that the initial texture type is the basal bimodal texture, in which the c-axis of the grain is tilted about 35 ± 5° from ND to TD. The angles between the <0 0 0 1> axis of the grain and RD, TD, and ND are concentrated at 75~90°, 30~65°, and 20~50°. The crystal orientation data of the textured titanium plate obtained by EBSD can be used to calculate the Schmid factor (SF) of each deformation mechanism under different loading conditions since the activability of plastic deformation mechanisms like slip or twin will be affected by the angle between the loading direction and the grain orientation. In order to facilitate the conversion of the coordinate system and the prediction of the plastic deformation mode in combination with the SF, the crystal coordinate system O-X2Y2Z2 (X2 = [1 0 − 1 0], Y2 = [−1 2 − 1 0], and Z2 = [0 0 0 1]) and the sample coordinate system O-X1Y1Z1 (RD = [1 0 0], TD = [0 1 0], and ND = [0 0 1]) were established.
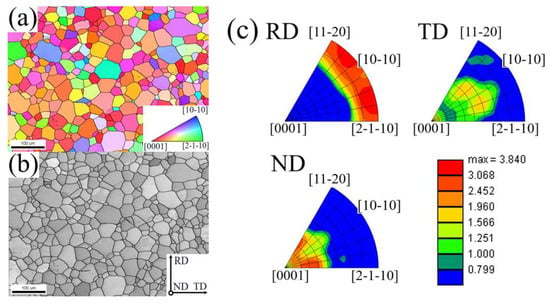
Figure 2.
Initial crystal orientation information of pure titanium: (a) orientation map (OM) indexed with inverse pole figure (IPF); (b) grayscale map; (c) IPF.
3. Results
3.1. Macroscopic Stress–Strain Curves
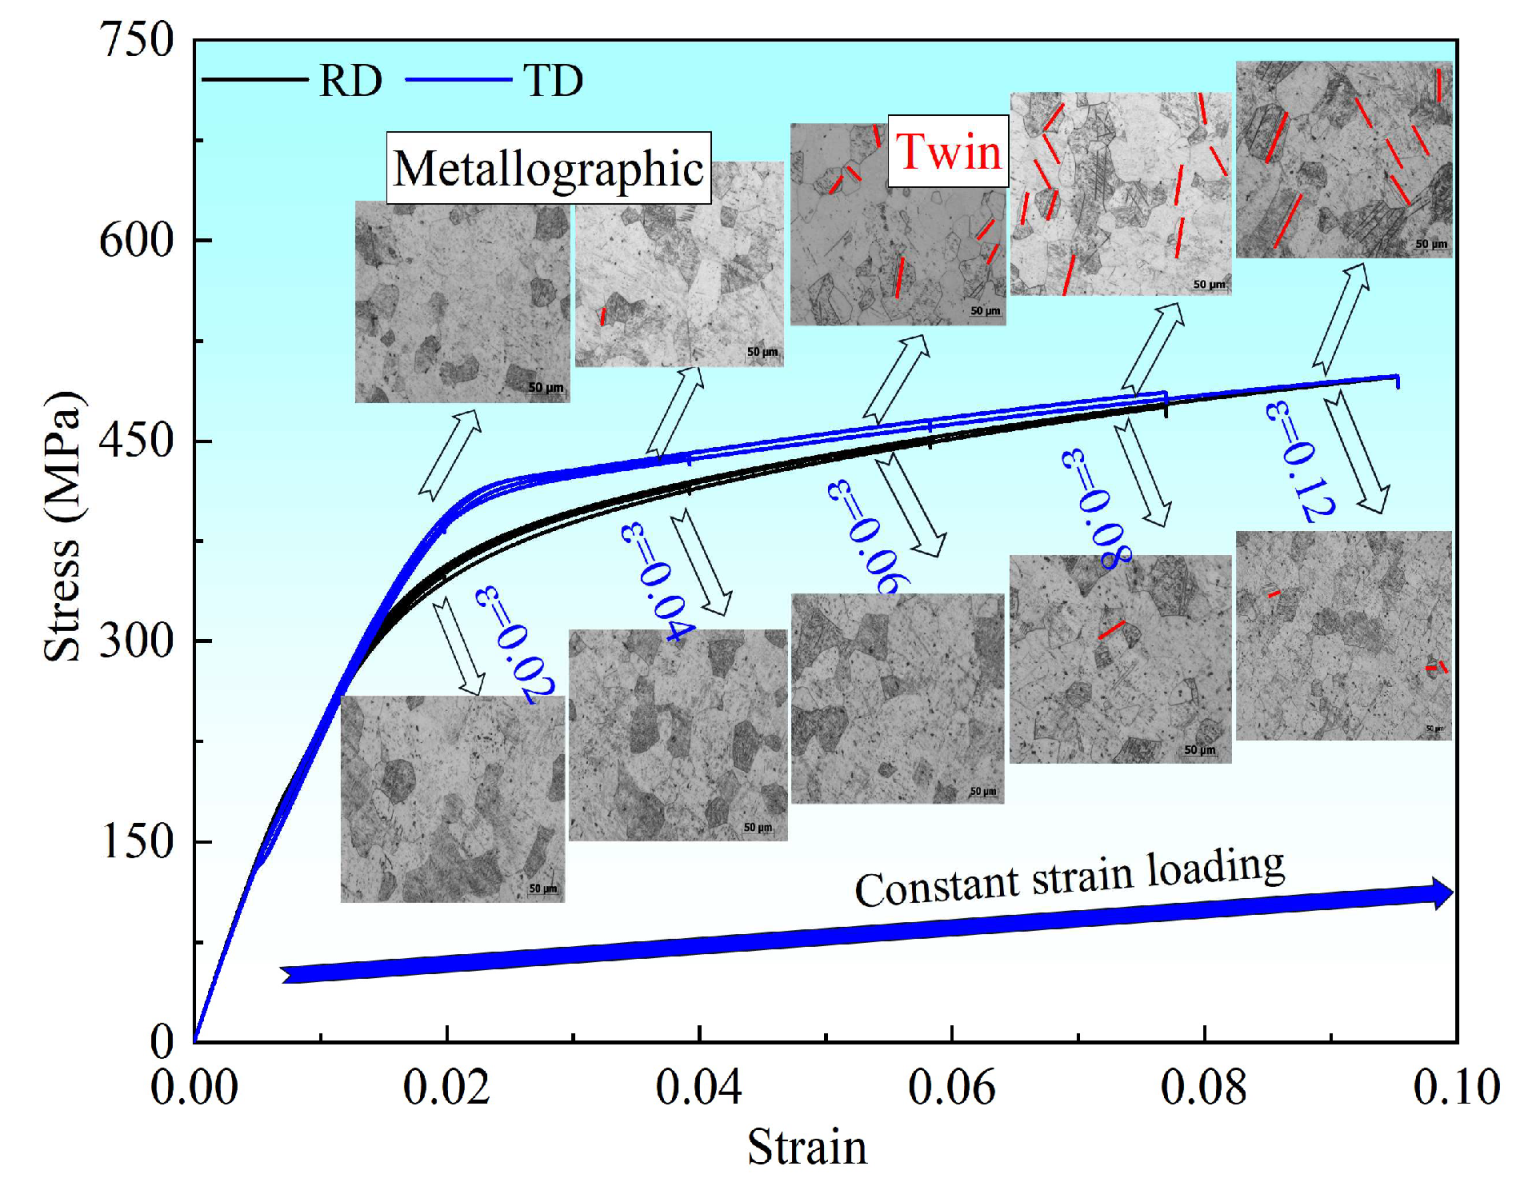
The metallographic structure and stress–strain curves during tensile along RD and TD are displayed in Figure 3. It is reasonable to believe that the macro- and mesoscopic characteristics under a certain strain can qualitatively reflect the deformation characteristics of the material during continuous deformation under this strain, as can be seen from Figure 3, where there is good continuity between the stress–strain curves under different strains. The higher initial yield strength when tensile along TD and the higher strain hardening rate during tensile along RD indicate that the basal bimodal texture clearly causes anisotropy in both the initial yield and subsequent strain hardening of the pure titanium plate. According to the metallographic structure, twins seldom occur during RD tensile; however, with TD tensile, twins start to form when the strain exceeds 0.04. Thus, dislocation slip, not twin, is the predominant deformation mechanism of the initial yield for a pure titanium plate with a basal bimodal structure, as may be inferred from the aforementioned phenomena.
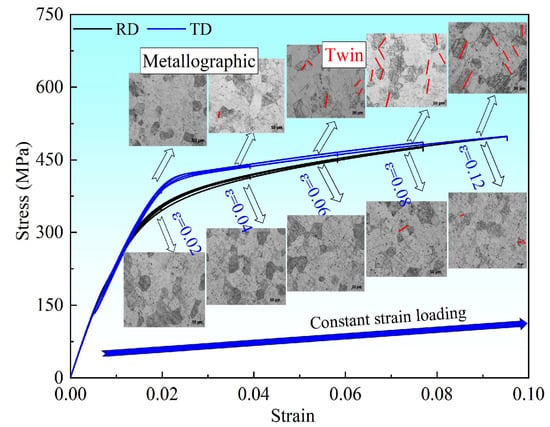
Figure 3.
Stress–strain curves and metallographic structure during tensile along RD and TD.
3.2. Microstructure Evolution
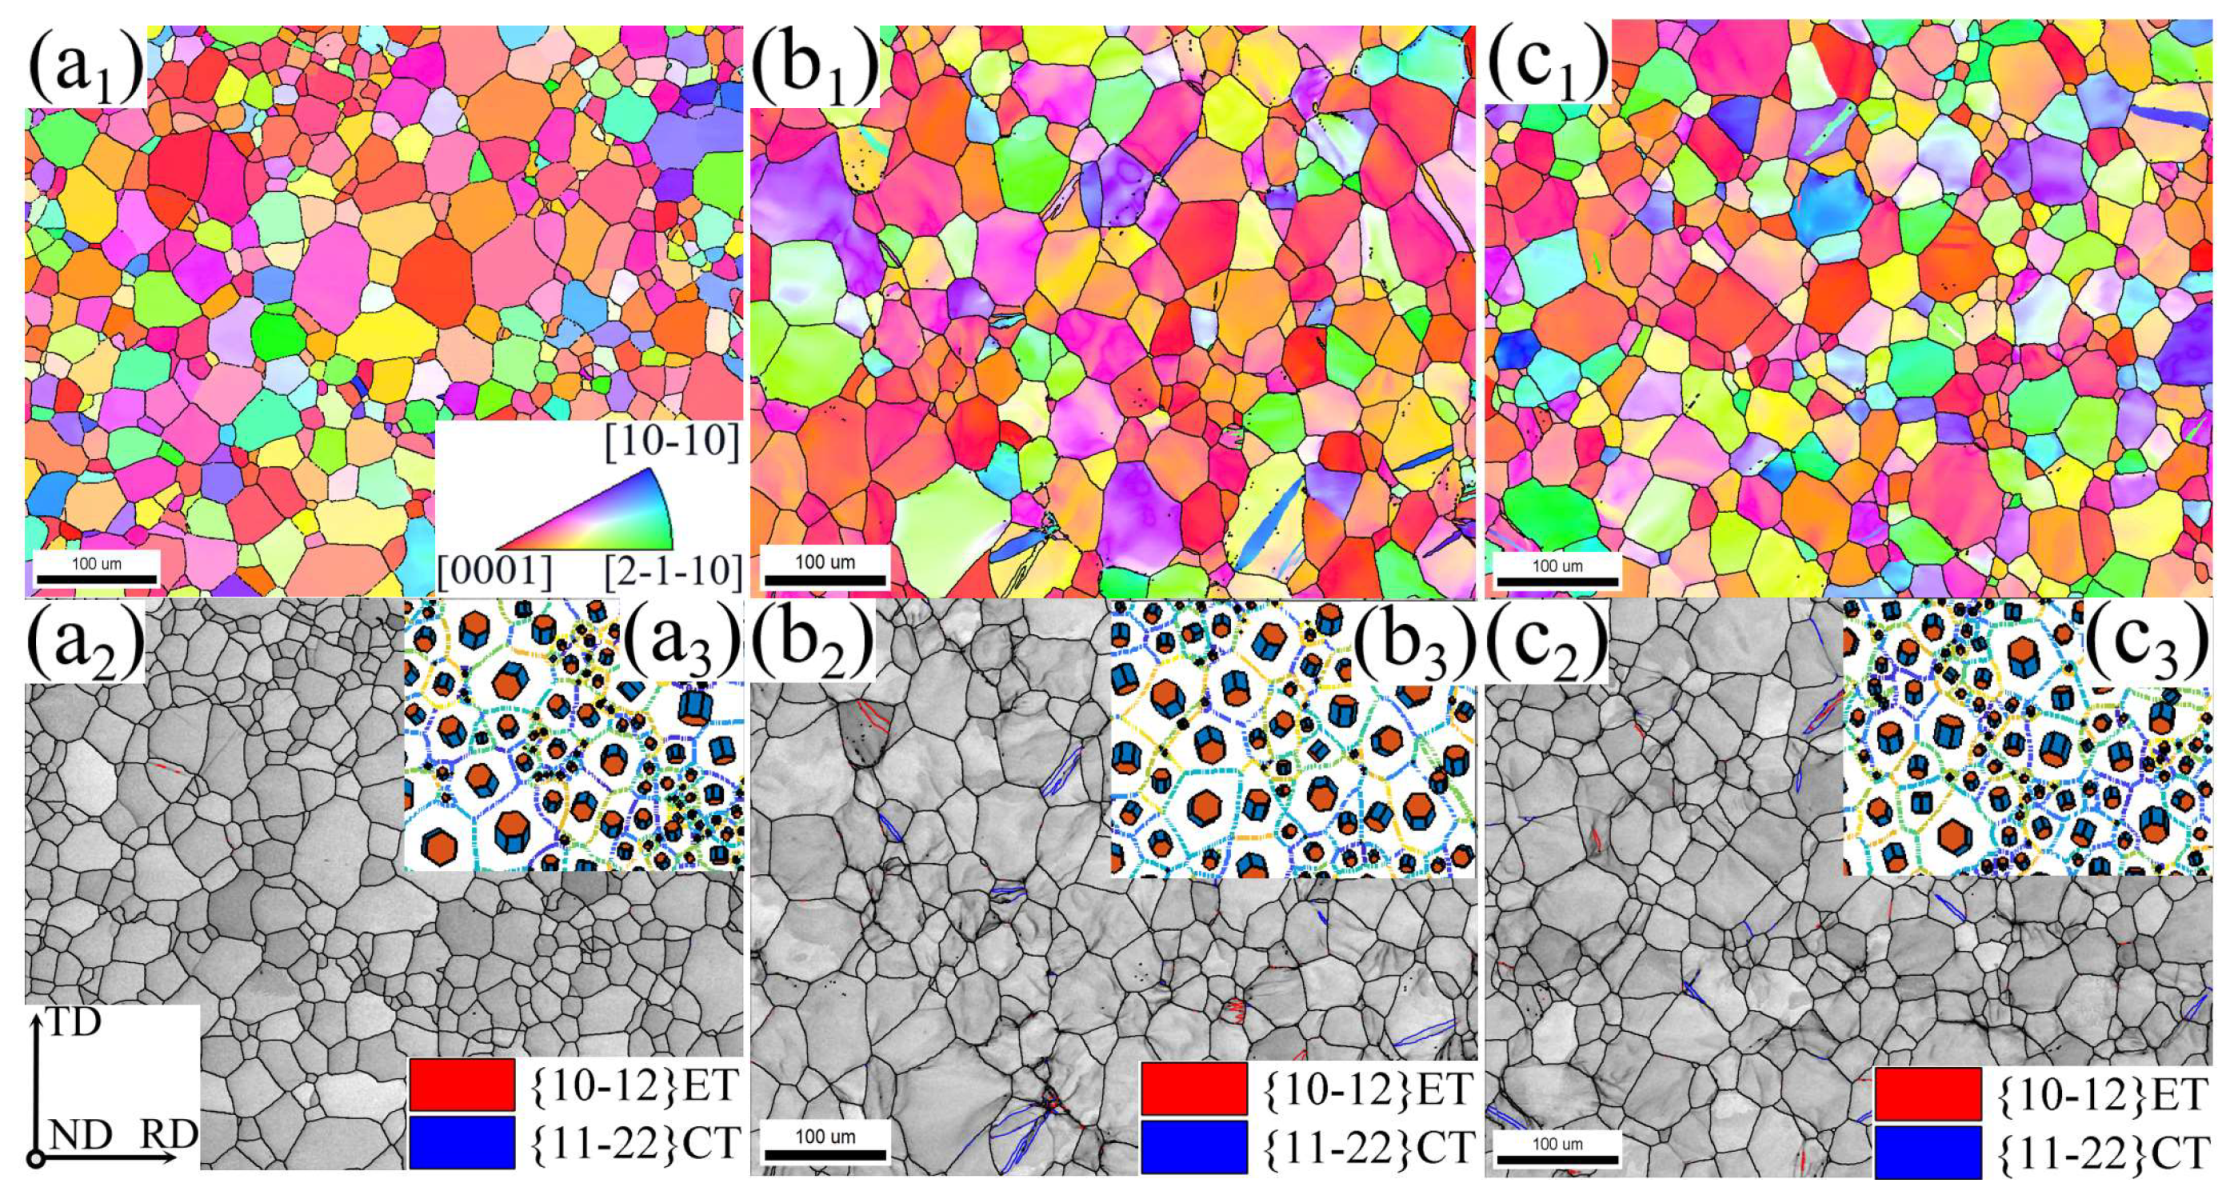
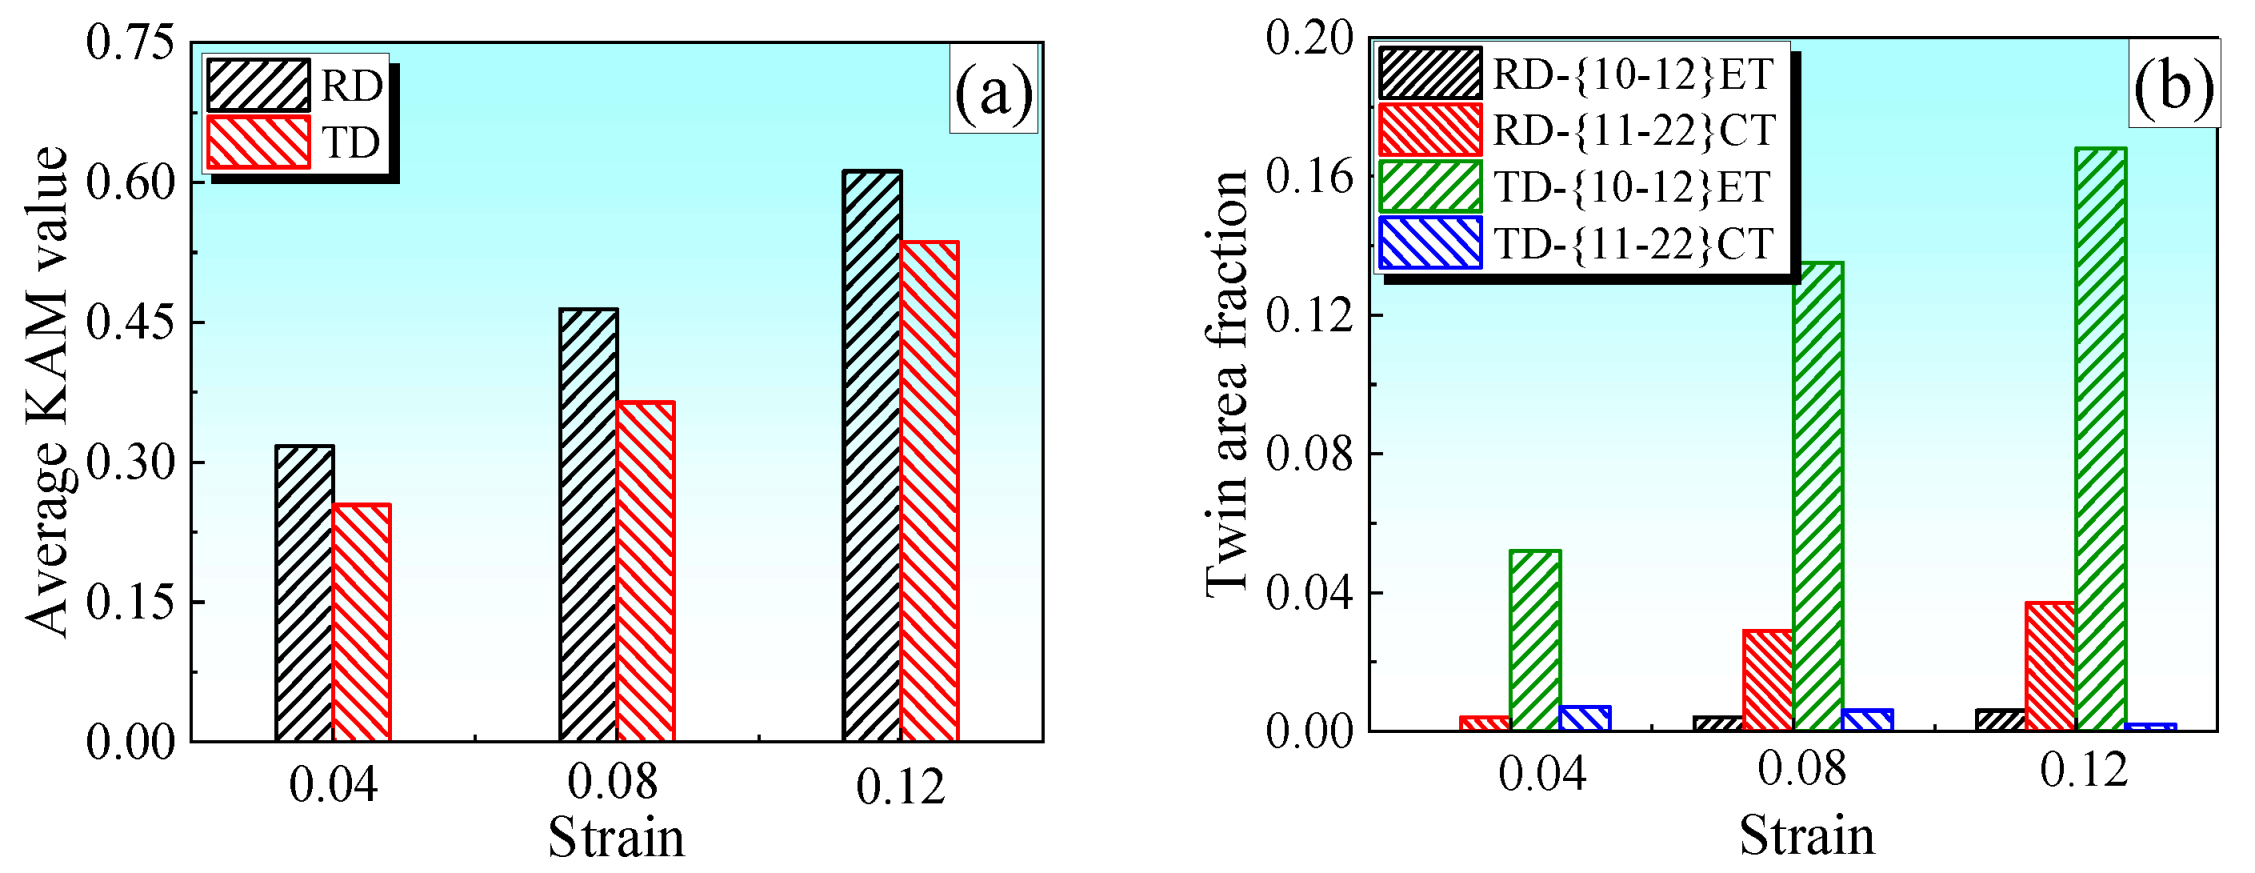
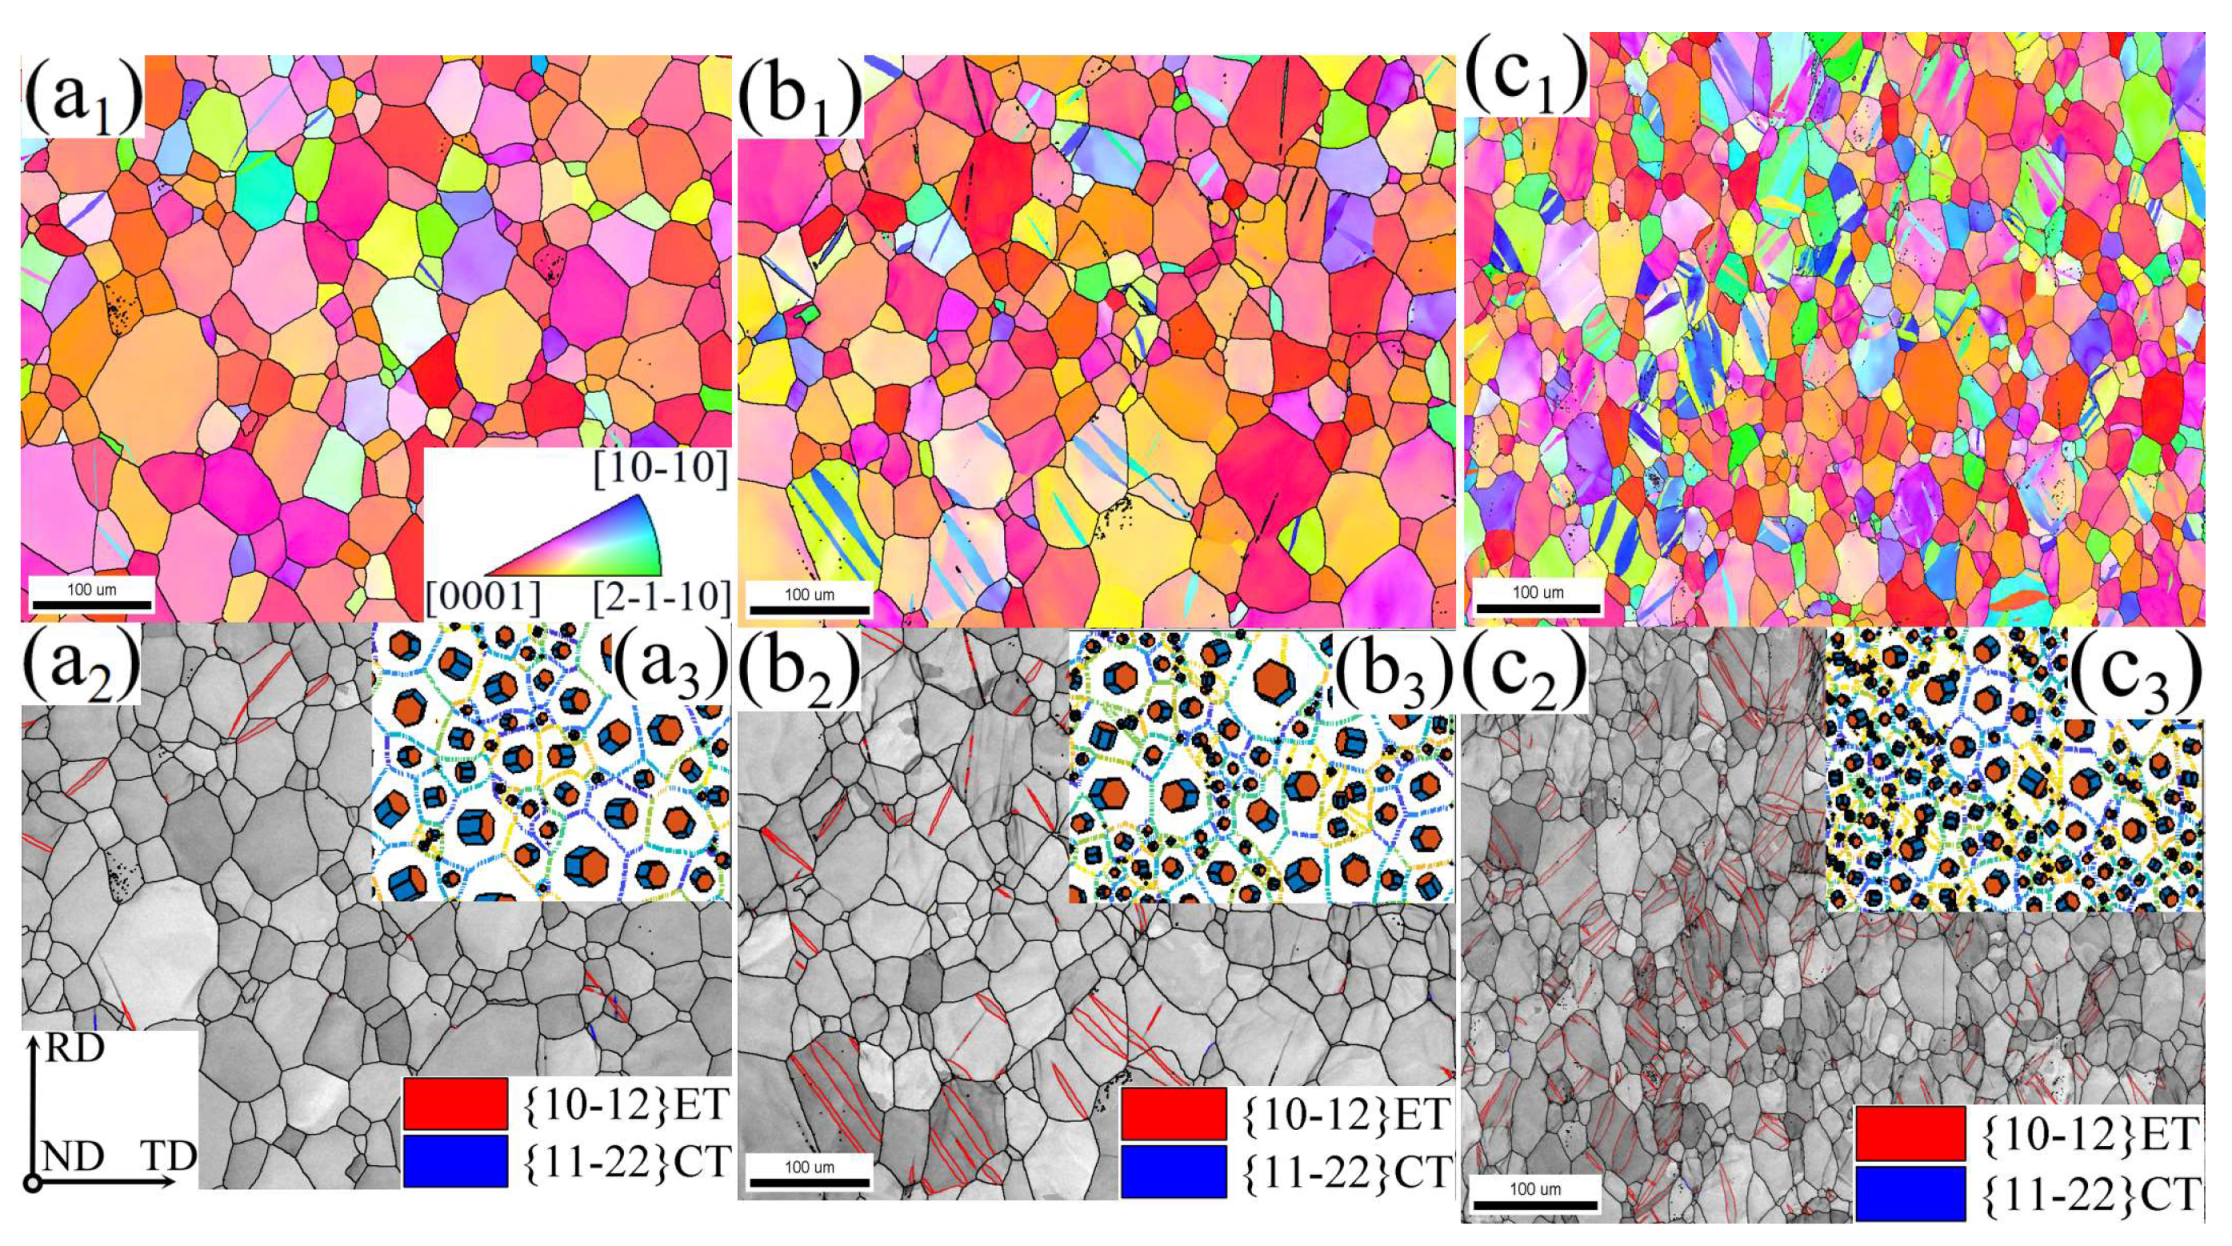
Figure 4 shows the evolution of the mesoscopic deformation characteristics of the RD tensile specimen with strain. The 85° {1 0 − 1 2} ET is represented by the red line in the grayscale map, while the 64° {1 1 − 2 2} CT is shown by the blue line. There is no twin and a rather consistent color distribution inside the grain at RD (0.04), as shown by the OM and grayscale map in Figure 4a. As the strain approaches 0.08, Figure 4b,c demonstrate the presence of a notable color gradient inside the grain, and in certain grains, 64° {1 1 − 2 2} CT is visible. Figure 5 calculates the twin area fractions and average KAM values under different loading conditions. The uneven plastic deformation and dislocation accumulation between and within the grains are often linked to changes in local orientation. Figure 5a illustrates this phenomenon, with the average KAM value of the RD tensile increasing rapidly from 0.317 at RD (0.04) to 0.612 at RD (0.12). The c-axis orientation of certain grains is displayed in the upper right corner of the grayscale map to facilitate the interpretation of the twin activation law. When combined with the IPF color card, it becomes even clearer that the majority of grains’ <0 0 0 1> axis is primarily tilted from ND to TD, while the <0 0 0 1> axis is only slightly tilted from ND to RD. As a result, the tensile stress component perpendicular to the grains’ <0 0 0 1> axis when tensile along RD is favorable for the nucleation of {1 1 − 2 2} CT. Figure 5b illustrates that during RD tensile, the twin area fraction of {1 1 − 2 2} CT is less than 4% and that the rate of increase in twin area fraction drastically drops after the strain approaches 0.08. The aforementioned phenomena suggest that dislocation slip during tensile along RD is the predominant mechanism of plastic deformation, while twins have essentially little effect on the total amount of plastic deformation.
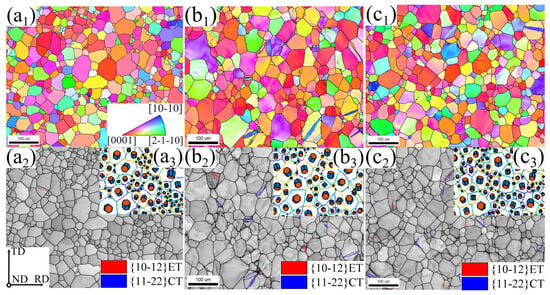
Figure 4.
Evolution of the mesoscopic deformation characteristics of the RD tensile specimen with strain: (a1) RD (0.04)-OM; (a2) RD (0.04)-grayscale map; (a3) RD (0.04)-grain orientation; (b1) RD (0.08)-OM; (b2) RD (0.08)-grayscale map; (b3) RD (0.08)-grain orientation; (c1) RD (0.12)-OM; (c2) RD (0.12)-grayscale map; (c3) RD (0.12)-grain orientation.
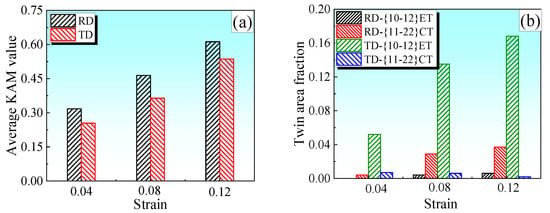
Figure 5.
The average KAM value and twin area fraction under different loading conditions: (a) average KAM value; (b) twin area fraction.
Figure 6 illustrates the evolution of the mesoscopic deformation characteristics of the TD tensile specimen with strain. This figure shows that the TD tensile specimen’s color gradient inside its grain is significantly weaker than that of the RD tensile specimen. When viewed together with Figure 5a, it is also evident that the TD tensile specimen’s KAM value is significantly smaller than that of the RD, indicating a relatively weak degree of dislocation accumulation during TD tensile. In combination with Figure 5b, it becomes evident that certain grains exhibit 85° {1 0 − 1 2} ET at TD (0.04), and the twin area fraction experiences a rapid increase, rising from around 5.2% at TD (0.04) to approximately 16.8% at TD (0.12). Although the twin undoubtedly contributes significantly to the coordination of deformation during TD tensile, it should be highlighted that, at least within a specific strain range, the amount of plastic deformation caused by the twin is still much smaller than that of the dislocation. The twins are mostly nucleated in certain grains, with crystal orientation tilted from [0 0 0 1]//ND to [1 0 − 1 0]//ND and [2 − 1 − 1 0]//ND, according to the IPF color card. The <0 0 0 1> axis of most grains during TD tensile is primarily tilted by ND to TD at a specific angle, as can be seen from the crystal orientation in the upper right corner of the grayscale map in Figure 6. The TD tensile stress will produce tensile stress along the grain <0 0 0 1> axis, which is favorable to the nucleation of {1 0 − 1 2}ET. The rules may be summed up as follows when comparing the twin characteristics under different strains: (1) The primary twin layer has a very thin thickness that progressively thickens as strain increases, forming a convex lens-like shape. (2) The twin wafer layer nucleates at the grain boundary and gradually grows into the grain, and most of the twins run through the entire grain. (3) The twin density increases significantly with the aggravation of the deformation degree. Twin density is defined as the proportion of twin grains and the number of twins in a given grain. (4) The occurrence of one or more twin layers within the grain and the entanglement between them can achieve grain refinement to a large extent. (5) It can be seen from OM that the emergence of twins realizes a rapid transformation of crystal orientation, and the redirected grains may make it easier for later dislocation slip to activate.
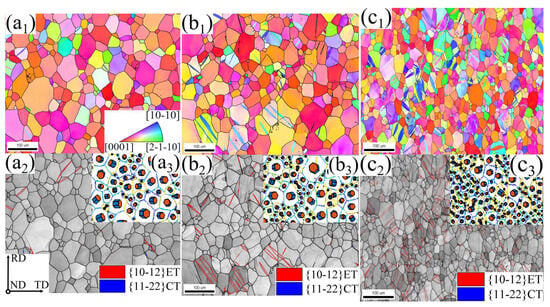
Figure 6.
Evolution of the mesoscopic deformation characteristics of the TD tensile specimen with strain: (a1) RD (0.04)-OM; (a2) RD (0.04)-grayscale map; (a3) RD (0.04)-grain orientation; (b1) RD (0.08)-OM; (b2) RD (0.08)-grayscale map; (b3) RD (0.08)-grain orientation; (c1) RD (0.12)-OM; (c2) RD (0.12)-grayscale map; (c3) RD (0.12)-grain orientation.
3.3. Texture Evolution
Figure 7 illustrates the evolution of the texture components with strain during tensile along RD. The RD-IPF shows that as strain increases, the angle between the grain <0 0 0 1> axis and RD is basically distributed between 75~90°. The <2 − 1 − 1 0> axis of the crystal orientation tilts gradually to the <1 0 − 1 0> axis, and the <1 0 − 1 0>//RD texture components generate after RD (0.08). The angle between the grain <0 0 0 1> axis and TD is discretely distributed at 20~70°, according to the TD-IPF. The most typical texture component is the <1 0 − 1 2>//TD, which tilts by about 45° from the <0 0 0 1> axis to the <1 0 − 1 0> axis. The <0 0 0 1>//TD texture component forms gradually as strain increases. The angle between the <0 0 0 1> axis and ND at RD (0.04) is mostly distributed in the range of 30~50°, according to the ND-IPF. As strain increases, however, the polarization phenomenon is seen, meaning that certain grains are tilted toward the <0 0 0 1> axis, while the remaining grains are tilted toward the <2 − 1 − 1 0> and <1 0 − 1 0 > axes and even generate the <2 − 1 − 1 0>//ND texture components. In conclusion, it is evident that the activation of dislocation slip during tensile along RD primarily causes the grain c-axis’ tilt angle to change from ND to TD. However, the approximately vertical angular relationship between the grain c-axis and RD is unaffected, which allows the basal bimodal texture to remain unchanged in its entirety.

Figure 7.
Evolution of texture components with strain during tensile along RD: (a) RD (0.04); (b) RD (0.08); (c) RD (0.12).
Figure 8 shows the evolution of the texture components with strain during tensile along TD. From the TD-IPF, it can be found that the angle between the grain <0 0 0 1> axis and TD is discretely distributed at 40~70°. The <1 0 − 1 2>//TD texture component at about 45° position (from the <0 0 0 1> axis tilt to the <10-10> axis) gradually changes to the <1 0 − 1 1>//TD texture component at 60° with the increase in strain. The RD-IPF demonstrates how, as strain increases, the grain progressively deflects from the <2 − 1 − 1 0> axis to the <1 0 − 1 0> axis, which causes the <1 0 − 1 0>//RD texture components to disappear and the <2 − 1 − 1 0>//RD texture components to appear. The <0 0 0 1>//RD texture generated by the {1 0 − 1 2} ET-induced redirection appears when the strain reaches 0.08, but its overall strength is significantly less than that of the basal bimodal texture. The angle between the <0 0 0 1> axis of most grains and RD is still distributed at 75~90°, which means that the approximate vertical angular relationship between the grain’s c-axis and RD does not change significantly during TD tensile, according to a comparison of the results of different strains. The angle between the <0 0 0 1> axis and the ND of the grain gradually decreases as strain increases, according to the ND-IPF. For example, the tilt angle from the <0 0 0 1> axis to <2 − 1 − 1 0> axis is distributed at 30~45°, 25~45°, and 0~35° at TD (0.04), TD (0.08), and TD (0.12), respectively, and the texture components of <0 0 0 1>//ND gradually become obvious. In summary, it can be seen that the activation of dislocation slip during tensile along TD mainly leads to the change of the tilt angle of the grain c-axis from ND to TD but does not significantly change the approximately vertical angular relationship between the grain c-axis and RD, so the basal bimodal texture is still maintained on the whole.

Figure 8.
Evolution of texture components with strain during tensile along TD: (a) TD (0.04); (b) TD (0.08); (c) TD (0.12).
4. Discussion
4.1. Effect of Texture on the Activability of Slip Systems
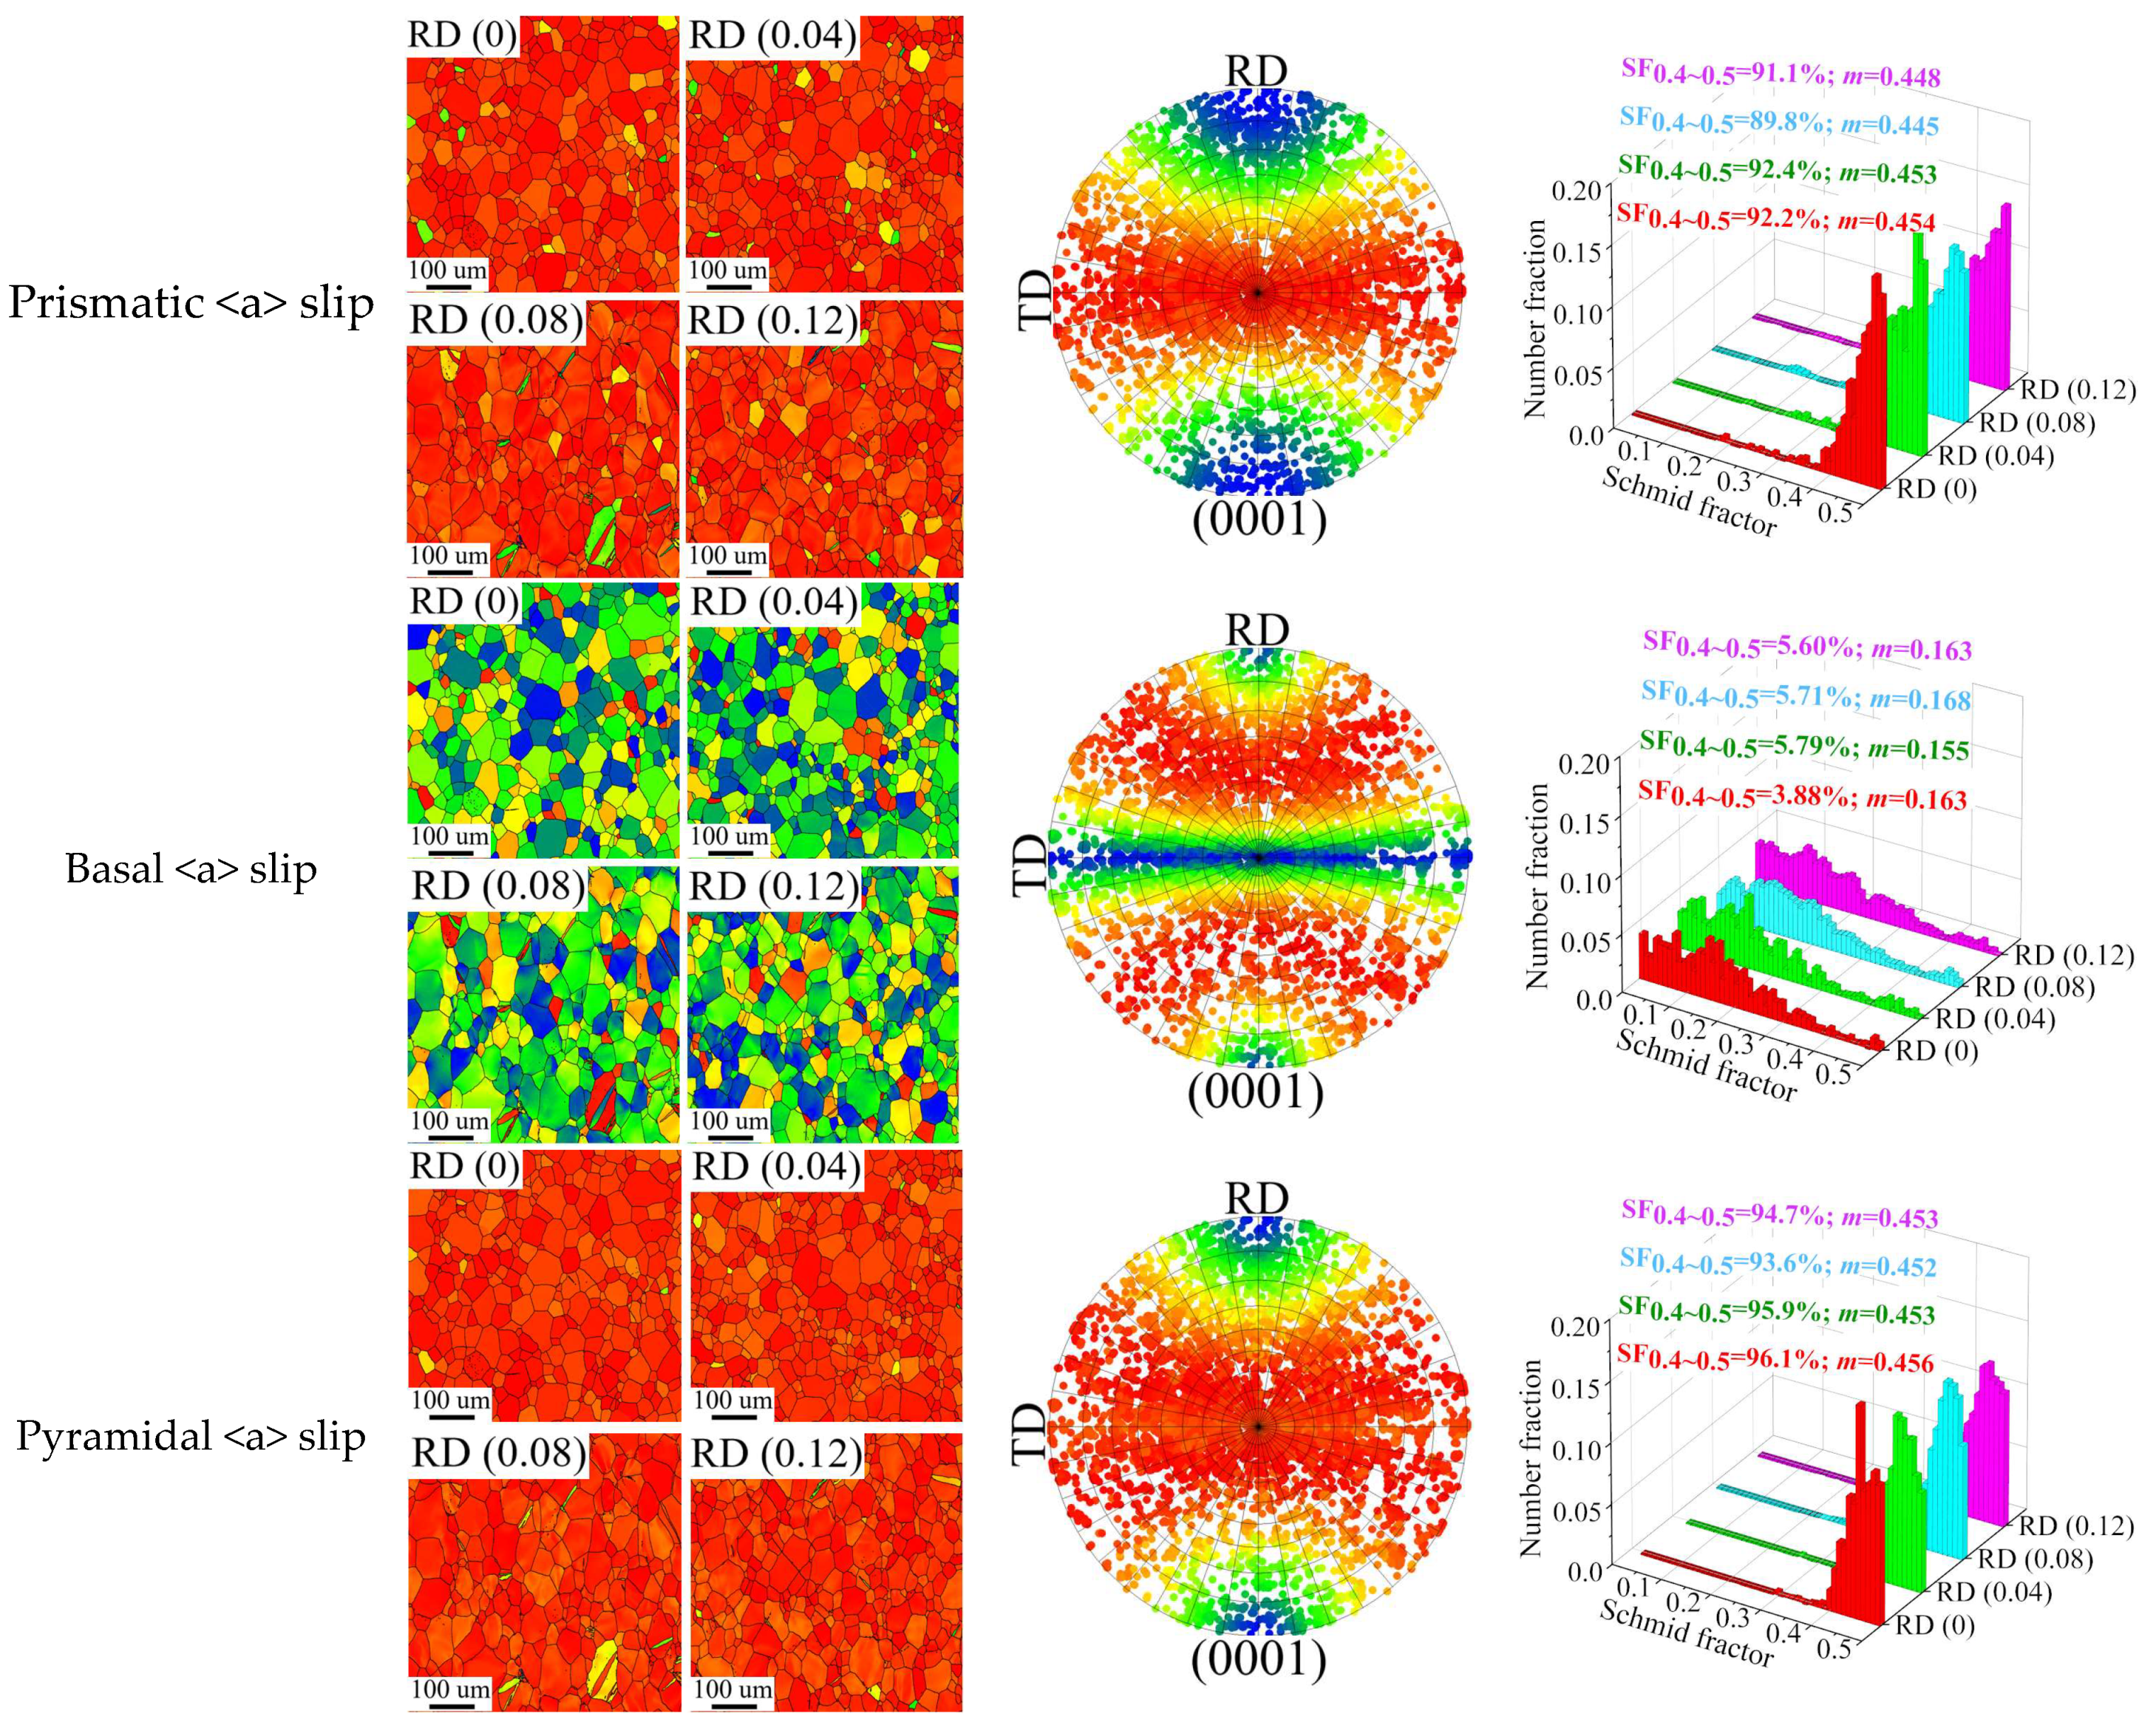
Figure 9 shows the evolution of the SF distribution of each deformation mode with strain when tensile along RD. The (0 0 0 1) PF is highlighted by the color card corresponding to SF, and it is easier to understand how the SF values of each deformation mode change with crystal orientation. Statistics for the grain proportion of soft orientation ψ (SF = 0.4~0.5), the average SF value m, and the distribution interval of SF are displayed in the histogram. The majority of the grains during RD tensile are favorable to the activation of prismatic <a> slip, pyramidal <a> slip, and pyramidal <c+a> slip but not to the activation of the basal <a> slip, as can be seen from SF distribution map (Figure 9a). To facilitate analysis, θa and θb, respectively, represent the angle of inclination of the grain c-axis from ND to RD and TD. It is evident from the (0 0 0 1) PF-SF (Figure 9b) that the color gradient of the SF values for each deformation mode mostly changes with θa change, but θb change is negligible. It is evident from the (0 0 0 1) PF-SF that the texture redirection at this point has no influence on the SF values of any slip system since the previous results demonstrate that θa always maintains an almost vertical angular connection during the tensile along the RD. The SF distribution histogram (Figure 9c) also shows that each slip system’s ψ and m values, which correspond to 90%–0.45, 5.7%–0.16, 95%–0.45, and 97%–0.47, respectively, are found to change little with strain in the prismatic <a> slip, basal <a> slip, pyramidal <a> slip, and pyramidal <c+a> slip.
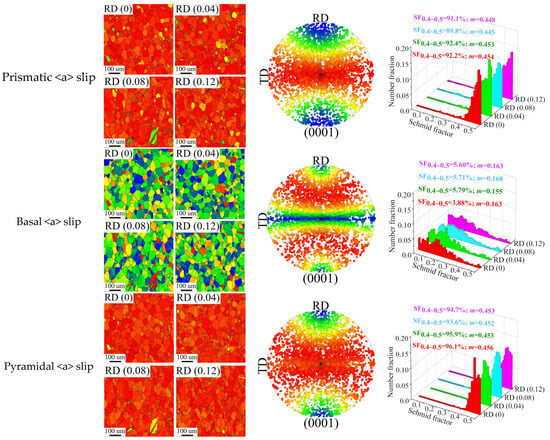

Figure 9.
The evolution of the SF distribution of each deformation mode with strain when tensile along RD: (a) SF distribution map; (b) PF indexed by SF; (c) the histogram of SF distribution.
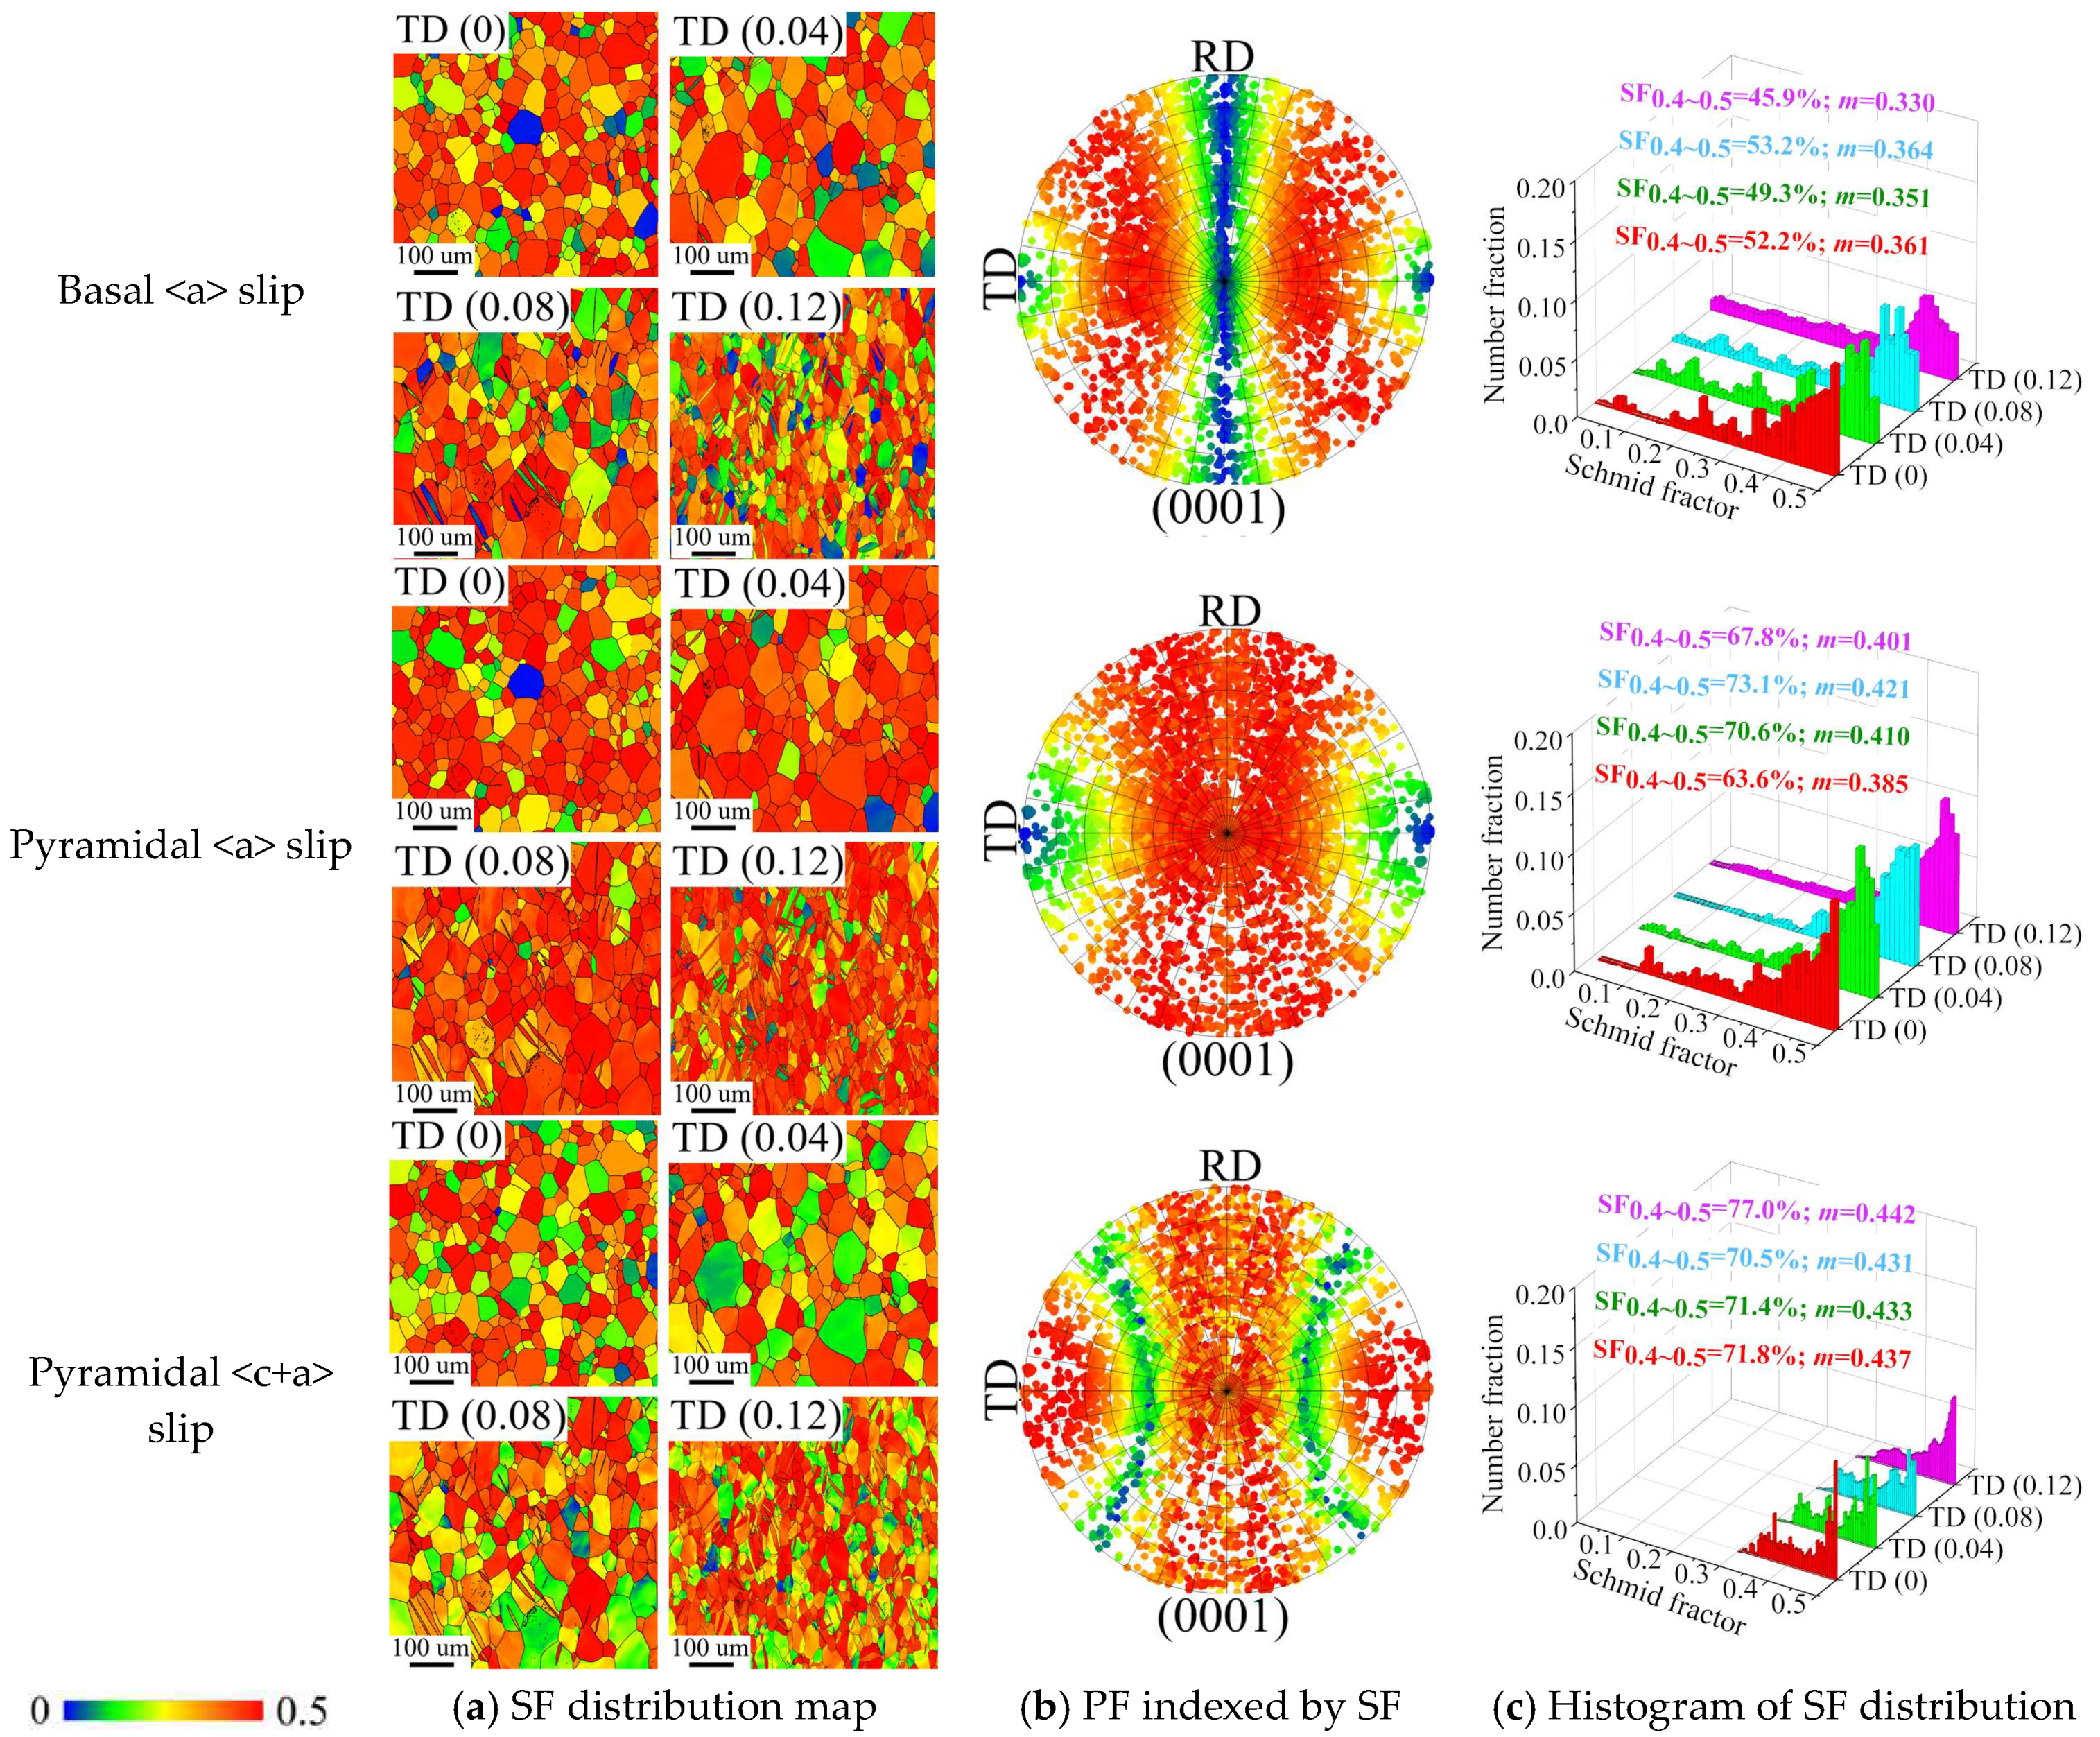
Figure 10 shows the evolution of the SF distribution of each deformation mode with strain when tensile along TD. The SF values of each slip system in the grain in the statistical region have an uneven distribution, as can be seen from SF distribution map (Figure 10a), which means that the types of slip systems activated during TD tensile are much more complex than those generated during RD tensile. This is due to the discrete distribution of the angle between the TD tensile axis and the grain c-axis. The color gradient of the SF values of each deformation mode mainly changes with the change of the tilt angle θb when tensile along TD, and changes less with the tilt angle θa, as can be seen from the (0 0 0 1) PF-SF (Figure 10b). This suggests that the SF values of each slip system have a strong angle θb dependence when tensile along TD. From OM and (0 0 0 1)PF-SF, it can be seen that the matrix with {1 0 − 1 2}ET is not conducive to the activation of prismatic <a> slip, pyramidal <a> slip, and pyramidal <c+a> slip, but it is conducive to the activation of the basal <a> slip. Consequently, {1 0 − 1 2} ET becomes the primary mode of coordinated c-axis deformation in this part of the grain. Simultaneously, it is shown that the <0 0 0 1>//RD texture components created by {1 0 − 1 2} ET-induced texture redirection are favorable for prismatic <a> slip, pyramidal <a> slip, and pyramidal <c+a> slip activation but not for basal <a> slip activation. The SF distribution histogram (Figure 10c) shows that the ψ and m values of prismatic <a> slip increase slightly as strain increases, going from around 26%–0.29 at TD (0) to roughly 35%–0.32 at TD (0.12). When the strain approaches TD (0.08), for example, the ψ and m values of the basal <a> slip start to dramatically decrease, going from around 53%–0.36 at TD (0.08) to approximately 46%–0.33 at TD (0.12). When the strain is smaller than TD (0.08), the cone slip’s ψ and m values increase, going from around 64%–0.38 at TD (0) to roughly 73%–0.42 at TD (0.08). It does, however, decrease to around 68%–0.4 at TD (0.12) as the strain increases. The ψ value of pyramidal <c+a> slip increases from about 71% at TD (<0.08) to 77% at TD (0.12), indicating that the crystal orientation at this point is increasingly favorable for the activation of pyramidal <c+a> slip. On the whole, the evolution of the ψ and m values of each slip system with strain is not a monotonic relationship; in addition to statistical errors, it is also influenced by the weight of the deformation modes that are active at different strain stages.

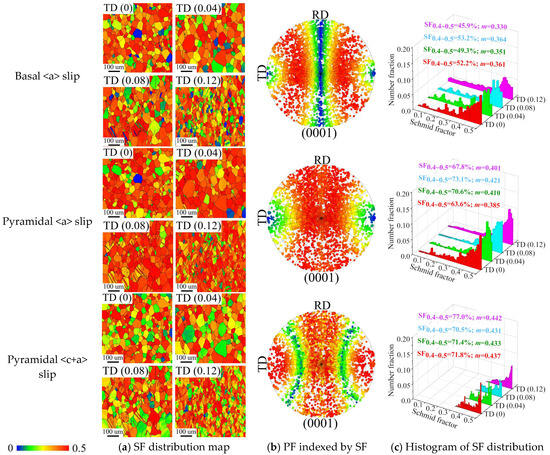
Figure 10.
The evolution of the SF distribution of each deformation mode with strain when tensile along TD: (a) SF distribution map; (b) PF indexed by SF; (c) the histogram of SF distribution.
4.2. Quantitative Calculation of SF
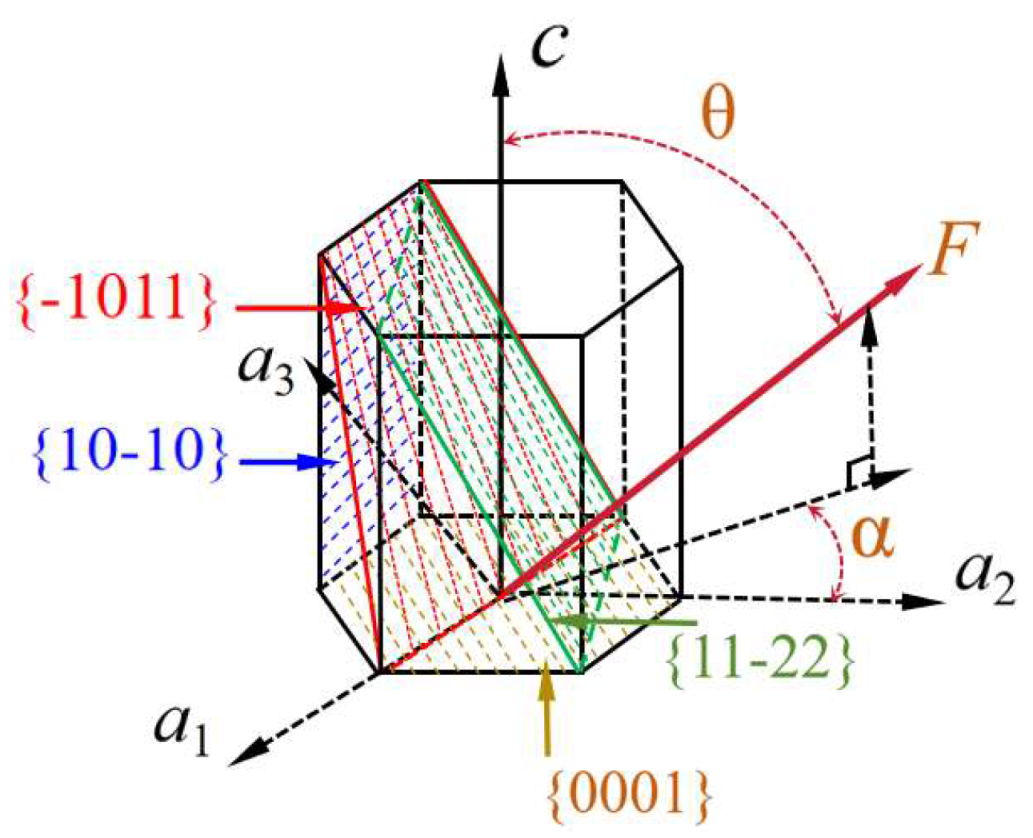
Figure 11 is a schematic diagram of the positional relationship between the loading axis and each deformation mode. As can be seen from Figure 11, SF is affected by the external force F and the positional relationship between the grain c-axis and the grain a-axis (θ, α), where θ ∈ (0~90°), and α ∈ (0~30°). The SF values of α and 60° α are equal, as can be seen from the symmetry of the hexagonal lattice structure. As a result, F = (sinθsinα sinθcosα cosθ) is the vector form of the external force F represented by (θ, α).
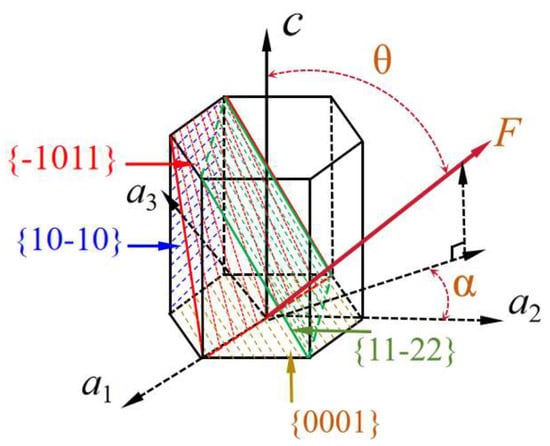
Figure 11.
Schematic diagram of the positional relationship between the loading axis and each slip system.
For a particular slip system (twin system), SF is the product of the cosine of the external force F and the angle between the normal direction n and the slip direction d of the slip system (twin system), respectively:
From the above experimental results, it can be determined that the basal <a> slip system {0 0 0 1} <1 1 − 2 0>, prismatic <a> slip {1 0 − 1 0} <1 1 -2 0>, pyramidal <a> slip {1 0 − 1 1 }<1 1 − 2 0>, and pyramidal <c+a> slip {1 1 − 2 2} <−1 − 1 2 3> as well as the {1 0 − 1 2} ET and {1 1 − 2 2} CT will be involved in the plastic deformation process of pure titanium. Equation (2) is utilized to transform the corresponding versions of each deformation mode in the hexagonal crystal system’s four-axis exponent (h k i l) [u v t w] into the normalized triaxial index (h1 k1 l1) [u1 v1 w1] in the orthogonal coordinate system:
where dhkl and duvw are the moduli of [h1 k1 l1] and [u1 v1 w1], respectively, and their expressions are as follows:
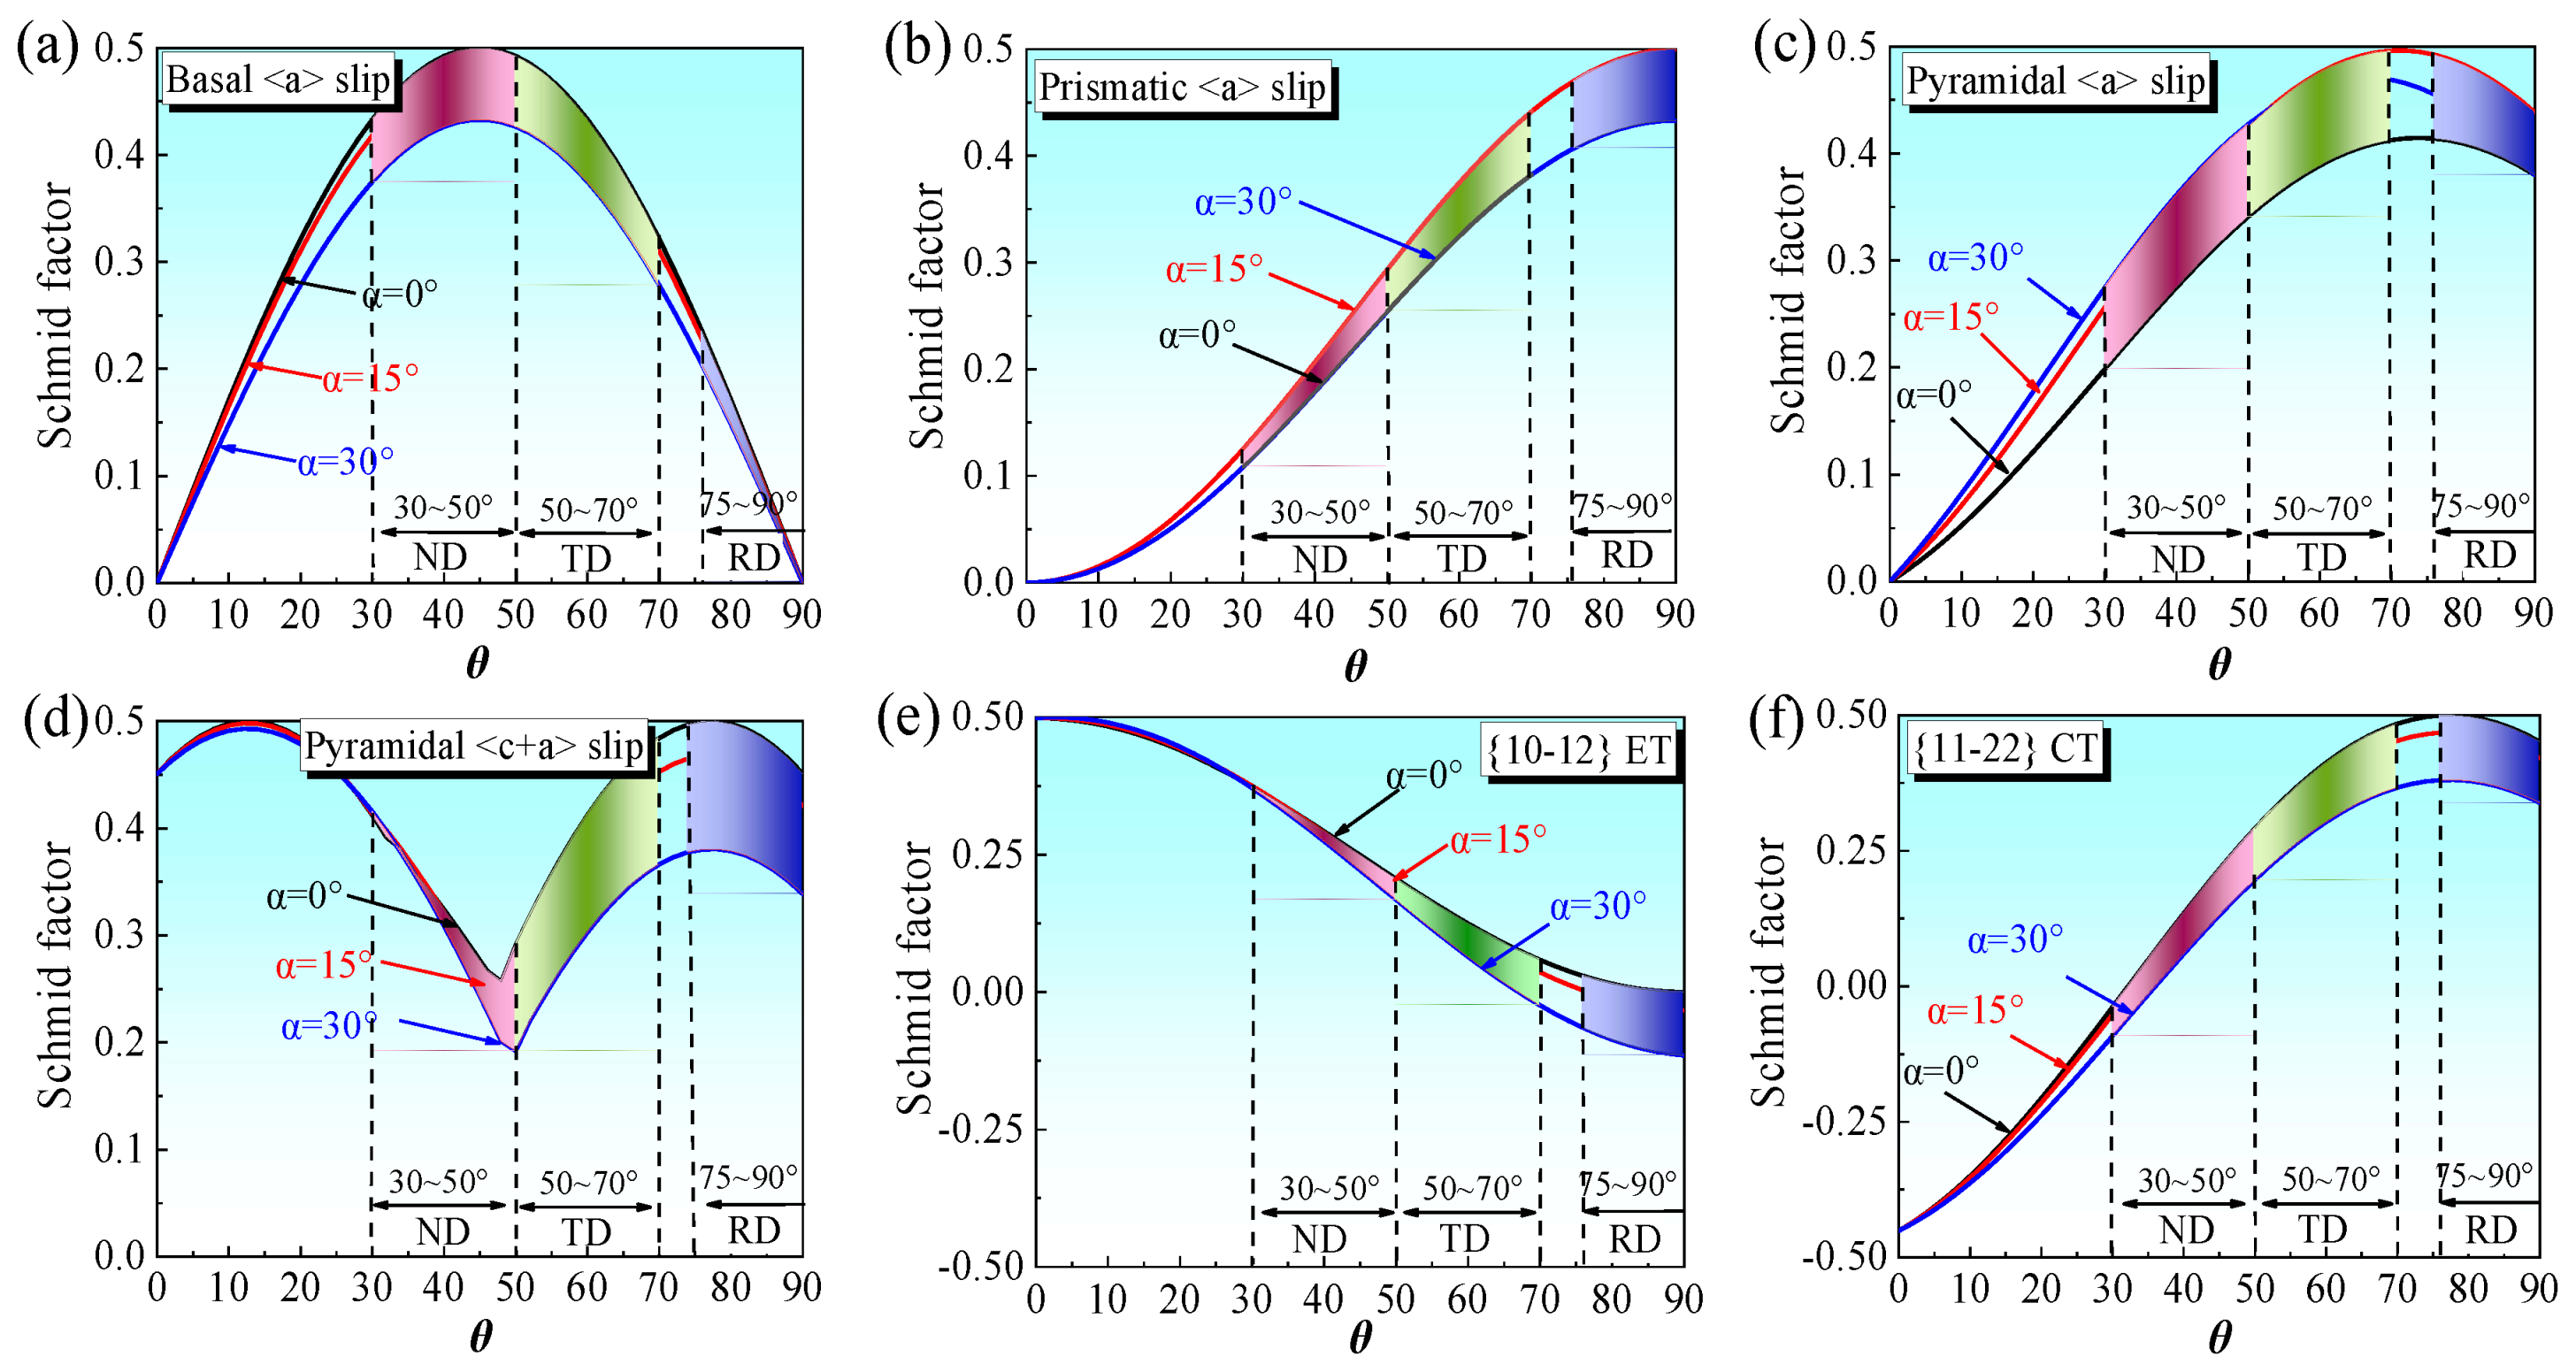
By substituting the external force F and the converted triaxial exponent into Equation (1), the relationship curves between SF and θ for each deformation mode can be obtained. Equivalent variants with maximum SF values will be activated preferentially. Figure 12 shows the variation law of the SFmax-θ curve of each deformation mode with the ψ value. To make the analysis easier, α = 0°, 15°, and 30° were used to calculate the SFmax-θ curves. The SFmax value is mostly influenced by the ψ value, whereas the θ value primarily influences the trend of the SFmax-θ curve for each deformation mode, as seen in Figure 12. The comparison of the various deformation modes reveals that when crystal preference orientation and loading mode change, the SFmax value of each deformation mode varies dramatically. This is one of the primary causes of the anisotropy of the material’s plastic behavior.
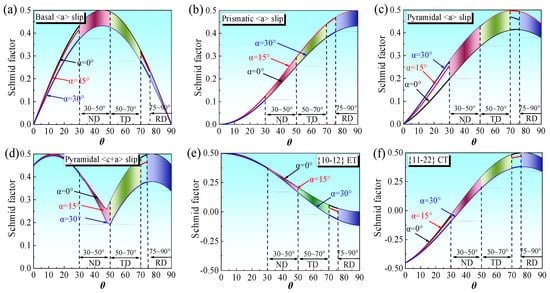
Figure 12.
The variation law of the SFmax-θ curve of each deformation mode with the ψ value: (a) basal <a> slip; (b) prismatic <a> slip; (c) pyramidal <a> slip; (d) pyramidal <c+a> slip; (e) {1 0 − 1 2} ET; (f) {1 1 − 2 2} CT.
Figure 13 displays the distribution range of the angle between the loading axis and the grain <0 0 0 1> axis for the rolled textured titanium plate under different loading situations. The IPF clearly shows the distribution of the angle θ between each loading axis and the grain <0 0 0 1> axis. Combined with the statistical results of histograms, it can be seen that the angle θ between the <0 0 0 1> axis of grain and the <1 0 0> axis is mainly distributed at 75~90°, and the number of grains accounts for 80%. Similarly, the angles θ between the <0 0 0 1> axis and the <0 1 0> and <0 0 1> axes are concentrated at 50~70° and 30~50°, respectively, and the corresponding grain number accounts for around 75% and 62% of the grain, respectively. It seems reasonable to assume that the majority of the material’s plastic behavior is dominated by grains in this specific range. The distribution range of the SF values of each deformation mode under different loading conditions can be obtained by labeling the obtained θ values in Figure 12, and the specific SF values are shown in Table 2.

Figure 13.
Distribution range of the angle between the grain <0001> axis and each loading axis under different loading conditions: (a) <100> axis; (b) <010> axis; (c) <001> axis.

Table 2.
Theoretical prediction values of SF for each deformation mode under different loading conditions.
The prismatic <a> slip, pyramidal <a> slip, pyramidal <c+a> slip, and {1 1 − 2 2} ET have m values of around 0.46, 0.43, 0.45, and 0.40, respectively, as shown in Table 2, suggesting that the crystal orientation is favorable for the activation of the aforementioned slip (twin) system. The m-values of {1 0 − 1 2} ET and basal <a> slip, on the other hand, are nearly zero, indicating that they are poorly activated. The m values of prismatic <a> slip, basal <a> slip, pyramidal <a> slip, and pyramidal <c+a> slip are around 0.33, 0.38, 0.41, and 0.42 when tensile along TD, respectively. Therefore, the activation of the above-mentioned slip system needs to take the influence of CRSS into account. In addition, it is observed that when tensile along ND, the basal <a> slip and pyramidal <a> slip are more likely to be activated, but the prismatic <a> slip is more difficult to activate. For twins, the mmax values of {1 0 − 1 2}ET and {1 1 − 2 2}CT during RD tensile are about 0.03 and 0.50, respectively, i.e., {1 1 − 2 2}CT is more likely to be activated. During TD tensile, the mmax values of {1 0 − 1 2}ET and {1 1 − 2 2}CT are around 0.20 and 0.48, respectively; nevertheless, it is really more probable that the former will be activated. The following are the causes of the aforementioned phenomenon: 1) Compared to {1 1 − 2 2}CT, the critical strain and CRSS needed for {1 0 − 1 2}ET are significantly lower. 2) The SF values are dispersed outside of the designated regions of Figure 12e,f, and {1 0 − 1 2}ET tends to nucleate in a small portion of the grains with a considerable tilt angle from ND to TD. Simultaneously, {1 0 − 1 2}ET is observed to be more likely to activate when tensile along ND. In conclusion, the theoretical SF calculation results in this section may accurately estimate the SF value of each slip system; nevertheless, but the local nucleation characteristics of twins need to be considered.
4.3. Identification of the Dominant Deformation Mechanism
The beginning of plastic deformation at the grain scale is associated with the activation of deformation modes such as dislocation slip (twin), and the combined effect of SF and CRSS is frequently utilized for predicting its activability [49,50,51]. The Schmid law indicates that the following requirements are satisfied by the equivalent critical shear stress τeff,s needed to activate the slip system s, the external stress σs needed to activate the slip system s, and the average SF value ms of the slip system s:
The prismatic <a> slip with low CRSS when stretched along RD and TD has absolute preferred activation based on the soft-oriented grain ratio ψ or SF values. This means that the activability of other deformation modes may be measured using prismatic slip as a reference. The values of σs, τeff,s, and ms of each slip system satisfy the following proportional relationship, which may be derived from Equation (4):
Obviously, the discrimination results of the dominant deformation mode will be directly affected by the proportionate relationship between the CRSS of each deformation mode. Combined with the results of the previous investigation, it is found that the proportional relationship between the CRSS of each slip system is concentrated in prismatic <a> slip: pyramidal <a> slip: basal <a> slip: pyramidal <c+a> slip = 1:1.2~1.4:1.7~2.1:2.5~4.0 [34,51]. The variation law of the needed activation stress ratio of each slip system with the τeff,s ratio may be determined by substituting the aforementioned CRSS proportional relationship and the m value of SF obtained in Section 4.2 into Equations (5)–(7), as shown in Figure 14. As shown in Figure 14a, when τeff,basal <a>/τeff,prism <a> ∈ [1.7, 2.1], σbasal <a>/σprism <a> are 6.51~8.05 and 1.48~1.82, respectively, when tensile along RD and TD. This indicates that the activation of the basal <a> slip requires at least 6.51 times (RD tensile yield strength ~285 MPa) and 1.48 times (TD tensile yield strength ~400 MPa) the current tensile yield strength. For the same reason, Figure 14b demonstrates that when τeff,pyram <c+a>/τeff,prism <a> ∈ [2.5, 4.0], the distribution of σpyram <c+a>/σprism <a> is 1.96~3.14 and 2.56~4.09, respectively, when tensile along RD and TD. This indicates that 2.56 and 1.96 times the current yield strength are necessary to activate the pyramidal <c+a> slip. In the case of the pyramidal <a> slip (Figure 14c), the distribution of σRD,pyram <a>/σRD,prism <a> is 1.28~1.50 at τeff,pyram <a>/τeff,prism <a> ∈ [1.2, 1.4]. This means that in order to activate the pyramidal <a> slip, at least 1.28 times the current yield strength (RD tensile initial yield) is needed. However, for τeff,pyram <a>/τeff,prism <a> ∈ [1.2, 1.4], σTD,pyram <a>/σTD,prism <a> are 0.96~1.13 at τeff,pyram <a>/τeff,prism <a>, suggesting a high probability that the pyramidal <a> slip is activated when tensile along TD.

Figure 14.
The variation of the needed activation stress ratio of each slip system with the τeff,s ratio under different loading conditions: (a) basal <a> slip; (b) pyramidal <c+a> slip; (c) pyramidal <a> slip.
It is possible to deduce that prismatic <a> slip dominates the initial yield of RD tensile, whereas the other three slip systems are difficult to activate, based on the evolution features of texture components and Schmid law analysis. Texture redirection has little effect on the angle formed by the loading axis and the grain c-axis during RD tensile; therefore, each slip system’s SF value changes very little (Figure 7). It can be predicted that, considering applied stress increases, the pyramidal <a> slip will activate, and the basal <a> slip will be difficult to activate when combined with the following strain hardening degree (the hardening value is around 200 MPa at ε = 0.08). Moreover, the pyramidal <c+a> slip is also activated in the soft-oriented portion of the grain to fulfill the requirements of c-axis deformation. During TD tensile deformation, the prismatic <a> slip is preferentially activated in the soft-oriented part of the grain; however, the other two slip systems are more difficult to activate, even if the activation of the pyramidal <a> slip during TD tensile is greater than that of RD. However, the prismatic <a> slip activation in the poor crystal orientation leads to a higher initial yield strength when tensile along TD. Prismatic <a> slip and pyramidal <a> slip are predicted to become the predominant deformation modes with an increase in applied stress when combined with the following strain hardening degree (the hardening value is around 80 MPa at ε = 0.08). The smaller activation stress ratio of σbasal <a>/σprism <a> when tensile along TD means that basal <a> slip is possible within the part of the grain with a smaller θ (with a greater SF value than mbasal <a>). A larger activation stress than σpyram <c+a>/σprism <a> means that the pyramidal <c+a> slip is less likely to be activated, or it may only be activated in grains with large theta angles or in areas where there is a significant local stress concentration. The c-axis deformation of the grain in the grain with hard orientation for prismatic <a> slip, pyramidal <a> slip, and pyramidal <c+a> slip can be coordinated by {10–12} ET after a certain cumulative strain, as can be observed when combined with Figure 5. Furthermore, the twin’s activation is correlated with the crystal orientation and the local stress concentration.
To summarize, the macro-mesoscopic deformation characteristics of materials are significantly influenced by the activability of each deformation mode. The reasonable prediction of the dominant deformation modes of material yield is directly impacted by the CRSS values of each slip system and the proportional relationship between them. Additionally, research on the deformation mechanism’s activation can help us better understand the constraints and conditional characteristics of different approaches to producing CRSS values in subsequent research. Consequently, in order to guide the rational formulation of the process and further realize the regulation of material characteristics, it is imperative that the analysis and identification process of the dominant mechanism of anisotropic deformation be thoroughly studied.
5. Conclusions
- In this work, the influence mechanism of rolling texture on the anisotropy of the plastic behavior of a pure titanium plate was studied by Schmid law in combination with a macroscopic tensile test and mesoscopic EBSD characterization. The conclusions are as follows:
- The special crystal orientation corresponding to the basal bimodal texture affects the activability of each slip system by changing the SF value, and the changes in the type and difficulty of the activated deformation mode lead to the obvious anisotropy of the macro- and micro- deformation characteristics of the rolled titanium plate. The angle θ between the loading axis and the c-axis mostly influences the variation trend of the SF of each slip system, whereas the angle α between the loading axis projection and the a-axis impacts the value of SF. The theoretical derivation results can well predict the SF value of each slip system under different loading conditions;
- The tilt angle θb of the grain c-axis from ND to TD becomes polarized due to dislocation slip during tensile along RD and TD, but the tilt angle θa of the grain c-axis from ND to RD stays approximately vertical. The SF value of each deformation mode changes with the change of θa during RD tensile, but the change of θa is minor, resulting in the ψ-m values of each deformation mode being almost constant. Since the SF values of each deformation mode change mainly with the change of θb during TD tensile, the discrete character of the SF values of each deformation mode results from the broad range of θb;
- The prismatic <a> slip essentially dominates the RD tensile deformation. The pyramidal <a> slip and pyramidal <c+a> slip will be activated during the subsequent hardening, but the basal <a> slip cannot. During TD tensile, the prismatic <a> slip is preferentially activated in the soft-oriented part of the grain. Prismatic <a> slip and pyramidal <a> slip become the dominant deformation modes during the subsequent hardening. The basal <a> slip will be activated in the soft-oriented grains, while the pyramidal <c+a> slip is more difficult to activate. {10-12} ET coordinates the c-axis deformation in the grains where the dislocation slip is limited.
Author Contributions
S.W., writing—original draft, writing—review and editing, investigation, and formal analysis; W.L., writing—original draft, writing—review and editing, conceptualization, methodology, data curation, and validation; Z.H., investigation, software, and data curation; S.L., investigation, software, and methodology; G.Z., investigation, data curation, and validation; H.Y., writing—review and editing, project administration, resources, data curation, validation, and visualization. All authors have read and agreed to the published version of the manuscript.
Funding
This work was supported by Natural Science Foundation of Hebei Province of China No. E2021203237 and Central Government Guides Local Science and Technology Development Fund Projects No. 216Z1002G.
Data Availability Statement
The original contributions presented in the study are included in the article, further inquiries can be directed to the corresponding authors.
Conflicts of Interest
The authors declare no conflicts of interest.
References
- Thomas, R. Titanium in the geothermal industry. Geothermics 2003, 32, 679–687. [Google Scholar] [CrossRef]
- Sathish, S.; Geetha, M.; Pandey, N.D.; Richard, C.; Asokamani, R. Studies on the corrosion and wear behavior of the laser nitrided biomedical titanium and its alloys. Mater. Sci. Eng. C 2010, 30, 376–382. [Google Scholar] [CrossRef]
- Shah, F.A.; Trobos, M.; Thomsen, P.; Palmquist, A. Commercially pure titanium (cp-Ti) versus titanium alloy (Ti6Al4V) materials as bone anchored implants—Is one truly better than the other? Mater. Sci. Eng. C 2016, 62, 960–966. [Google Scholar] [CrossRef] [PubMed]
- Lotfi, M.; Sajjady, S.A.; Amini, S. Wettability analysis of titanium alloy in 3D elliptical ultrasonic assisted turning. Int. J. Lightweight Mater. Manuf. 2019, 2, 235–240. [Google Scholar] [CrossRef]
- Battaini, M.; Pereloma, E.V.; Davies, C.H.J. Effect of orientation and temperature on the mechanical properties of commercially pure titanium. Adv. Mater. Res. 2007, 15, 941–946. [Google Scholar] [CrossRef]
- Merson, E.; Brydson, R.; Brown, A. The effect of crystallographic orientation on the mechanical properties of titanium. J. Phys. Conf. Ser. 2008, 126, 012120. [Google Scholar] [CrossRef]
- Nasiri, A.H.; Ekrami, A.; Ziaei, M.A.A. Effects of thickness and texture on mechanical properties anisotropy of commercially pure titanium thin sheets. Mater. Des. 2013, 44, 528–534. [Google Scholar] [CrossRef]
- Yoo, M.H. Slip, twinning, and fracture in hexagonal close-packed metals. Metall. Mater. Trans. A 1981, 12, 409–418. [Google Scholar] [CrossRef]
- Warwick, J.L.W.; Jones, N.G.; Rahman, K.M.; Dye, D. Lattice strain evolution during tensile and compressive loading of CP Ti. Acta Mater. 2012, 60, 6720–6731. [Google Scholar] [CrossRef]
- Li, H.; Mason, D.E.; Bieler, T.R. Methodology for estimating the critical resolved shear stress ratios of a-phase Ti using EBSD-based trace analysis. Acta Mater. 2013, 61, 7555–7567. [Google Scholar] [CrossRef]
- Wang, L.; Zheng, Z.; Phukan, H. Direct measurement of critical resolved shear stress of prismatic and basal slip in polycrystalline Ti using high energy X-Ray diffraction microscopy. Acta Mater. 2017, 132, 598–610. [Google Scholar] [CrossRef]
- Yoo, M.H.; Wei, C.T. Slip modes of hexagonal close packed metals. J. Appl. Phys. 1967, 38, 4317–4322. [Google Scholar] [CrossRef]
- Yoo, M.H.; Agnew, S.R.; Morris, J.R. Non-basal slip systems in HCP metals and alloys: Source mechanisms. Mater. Sci. Eng. A 2001, 319, 87–92. [Google Scholar] [CrossRef]
- Viswanathan, G.; Lee, E.; Maher, D.M. Direct observations and analyses of dislocation substructures in the α phase of an α/β Ti-alloy formed by nanoindentation. Acta Mater. 2005, 53, 5101–5115. [Google Scholar] [CrossRef]
- Williams, J.C.; Baggerly, R.G.; Paton, N.E. Deformation behavior of HCP Ti-Al alloy single crystals. Metall. Mater. Trans. A 2002, 33, 837–850. [Google Scholar] [CrossRef]
- Gong, J.C.; Wilkinson, A.J. Anisotropy in the plastic flow properties of single-crystal a titanium determined from micro-cantilever beams. Acta Mater. 2009, 57, 5693–5705. [Google Scholar] [CrossRef]
- Bertin, M.; Du, C.; Hoefnagels, J.P.M. Crystal plasticity parameter identification with 3D measurements and integrated digital image correlation. Acta Mater. 2016, 116, 321–331. [Google Scholar] [CrossRef]
- Salem, A.A.; Kalidindi, S.R.; Doherty, R.D. Strain hardening regimes and microstructure evolution during large strain compression of high purity titanium. Scr. Mater. 2002, 46, 419–423. [Google Scholar] [CrossRef]
- Song, S.G.; Gray, G.T. Structural interpretation of the nucleation and growth of deformation twins in Zr and Ti—I. application of the coincidence site lattice (CSL) theory to twinning problems in HCP structures. Acta Mater. 1995, 43, 2325–2337. [Google Scholar] [CrossRef]
- Song, S.G.; Gray, G.T. Structural interpretation of the nucleation and growth of deformation twins in Zr and Ti—II. Tem study of twin morphology and defect reactions during twinning. Acta Mater. 1995, 43, 2339–2350. [Google Scholar] [CrossRef]
- Murasawa, G.; Morimoto, T.; Yoneyama, S. Nucleation and growth behavior of twin region around yield point of polycrystalline pure Ti. Exp. Mech. 2012, 52, 503–512. [Google Scholar] [CrossRef]
- Chun, Y.B.; Yu, S.H.; Semiatin, S.L. Effect of deformation twinning on microstructure and texture evolution during cold rolling of CP-titanium. Mater. Sci. Eng. A 2005, 398, 209–219. [Google Scholar] [CrossRef]
- Wang, L.; Barabash, R.; Bieler, T. Study of {11-21} twinning in α-Ti by EBSD and laue microdiffraction. Metall. Mater. Trans. A 2013, 44, 3664–3674. [Google Scholar] [CrossRef]
- Deng, X.G.; Hui, S.X.; Ye, W.J. Analysis of twinning behavior of pure Ti compressed at different strain rates by schmid factor. Mater. Sci. Eng. A 2013, 575, 15–20. [Google Scholar] [CrossRef]
- Deng, X.G.; Zhang, D.L.; Jiao, Q.Y. Schmid factor analysis of twinning behavior in Ti-2Al alloy. Mater. Sci. Eng. A 2022, 844, 143201. [Google Scholar] [CrossRef]
- Chen, C.; Han, D.S.; Song, Y.T. Thermal stability of deformation twins in cryogenic rolled CP-Ti. Mater. Charact. 2023, 196, 112587. [Google Scholar] [CrossRef]
- Behnam, A.; Leyun, W.; Kumar, M.A. Grain boundary slip-twin transmission in titanium. Acta Mater. 2023, 244, 118556. [Google Scholar]
- Devesh, K.C.; Soumita, M.; Basudev, B. Role of slip and twinning on strain hardening, and correlation with geometric hardening, latent hardening, and grain boundary strengthening in titanium. Int. J. Plast. 2023, 161, 103516. [Google Scholar]
- Chun, Y.B.; Battaini, M.; Davies, C.H.J.; Hwang, S.K. Distribution characteristics of in-grain misorientation axes in cold-rolled commercially pure titanium and their correlation with active slip modes. Metall. Mater. Trans. A 2010, 41, 3473–3487. [Google Scholar] [CrossRef]
- Won, J.W.; Choi, S.W.; Yeom, J.T.; Hyun, Y.T.; Lee, C.S.; Park, S.H. Anisotropic twinning and slip behaviors and their relative activities in rolled alpha-phase titanium. Mater. Sci. Eng. A 2017, 698, 54–62. [Google Scholar] [CrossRef]
- Li, Q.X.; Liu, Y.F.; Si, C.Q.; Xu, Q.X.; Liu, D.X.; Le, Q.C.; Fu, L.; Jia, Z.; Ma, Z.B.; Yuan, R. The microstructure evolution, mechanical property and deformation mechanism of rolled Al3La/Mg-Li-Al-Zn composites prepared by in-situ synthesis. Mater. Sci. Eng. A 2024, 894, 146182. [Google Scholar] [CrossRef]
- Won, J.W.; Park, C.H.; Hong, S.G. Deformation anisotropy and associated mechanisms in rolling textured high purity titanium. J. Alloys Compd. 2015, 651, 245–254. [Google Scholar] [CrossRef]
- Kailas, S.V.; Prasad, Y.; Biswas, S.K. Influence of initial texture on the microstructural instabilities during compression of commercial α-titanium at 25°C to 400°C. Metall. Mater. Trans. A 1994, 25, 1425–1434. [Google Scholar] [CrossRef]
- Li, W.; Li, S.S.; Huang, Z.T.; Tang, G.Y.; Zhang, G.M.; Yu, H. Research on the anisotropic mechanism of plastic behavior during tensile process of textured pure titanium. Mater. Sci. Eng. A 2024, 894, 146153. [Google Scholar] [CrossRef]
- Wronski, M.; Kumar, M.A.; Capolungo, L.; Mccabe, R.J.; Wierzbanowski, K.; Tomé, C.N. Deformation behavior of cp-titanium: Experiment and crystal plasticity modeling. Mater. Sci. Eng. A 2018, 724, 289–297. [Google Scholar] [CrossRef]
- Roth, A.; Lebyodkin, M.A.; Lebedkina, T.A. Mechanisms of anisotropy of mechanical properties of α-titanium in tension conditions. Mater. Sci. Eng. A 2014, 596, 236–243. [Google Scholar] [CrossRef]
- Yi, N.; Hama, T.; Kobuki, A.; Fujimoto, H.; Takuda, H. Anisotropic deformation behavior under various strain paths in commercially pure titanium Grade 1 and Grade 2 sheets. Mater. Sci. Eng. A 2016, 655, 70–85. [Google Scholar] [CrossRef]
- Li, W.; Wang, S.Z.; Huang, Z.T.; Li, S.S.; Huang, Z.M.; Yu, H. Anisotropic mechanism of cold-rolled pure titanium plate during the two-step tensile process of the variable path. Mater. Sci. Eng. A 2024, 906, 146755. [Google Scholar] [CrossRef]
- Nasiri, A.H.; Ekrami, A.; Ziaei, M.A.A.; Shohani, M. Effects of rolling reduction on mechanical properties anisotropy of commercially pure titanium. Mater. Des. 2012, 34, 268–274. [Google Scholar] [CrossRef]
- Legrand, B. Influence De La Structure Electronique Sur La Facilit’e Relative Des Glissements Dans Les M´etaux De Structure Hexagonale Compacte. Ph.D. Thesis, Universite Pierre et Marie Curie, Paris, France, 1984. [Google Scholar]
- Amouzou, K.; Richeton, T.; Roth, A. Micromechanical modeling of hardening mechanisms in commercially pure α-titanium in tensile condition. Int. J. Plast. 2016, 80, 222–240. [Google Scholar] [CrossRef]
- Suh, B.C.; Kim, J.H.; Hwang, J.H. Twinning-mediated formability in Mg alloys. Sci. Rep. 2016, 6, 22364. [Google Scholar] [CrossRef] [PubMed]
- Park, S.H.; Hong, S.G.; Lee, C.S. Enhanced stretch formability of rolled Mg-3Al-1Zn Alloy at room temperature by initial {10–12} twins. Mater. Sci. Eng. A 2013, 578, 271–276. [Google Scholar] [CrossRef]
- Salem, A.A.; Kalidindi, S.R.; Doherty, R.D. Strain hardening of titanium: Role of deformation twinning. Acta Mater. 2003, 51, 4225–4237. [Google Scholar] [CrossRef]
- Salem, A.A.; Kalidindi, S.R.; Semiatin, S.L. Strain hardening due to deformation twinning in α-titanium: Constitutive relations and crystal-plasticity modeling. Acta Mater. 2005, 53, 3495–3502. [Google Scholar] [CrossRef]
- Salem, A.A.; Kalidindi, S.R.; Doherty, R.D. Strain hardening due to deformation twinning in -titanium: Mechanisms. Metall. Mater. Trans. A 2006, 37, 259–268. [Google Scholar] [CrossRef]
- Becker, H.; Pantleon, W. Work-hardening stages and deformation mechanism maps during tensile deformation of commercially pure titanium. Comput. Mater. Sci. 2013, 76, 52–59. [Google Scholar] [CrossRef]
- Gurao, N.P.; Sethuraman, S.; Suwas, S. Evolution of texture and microstructure in commercially pure titanium with change in strain path during rolling. Metall. Mater. Trans. A 2012, 44, 1497–1507. [Google Scholar] [CrossRef]
- Hutchinson, W.B.; Barnett, M.R. Effective values of critical resolved shear stress for slip in polycrystalline magnesium and other hcp metals. Scr. Mater. 2010, 63, 737–740. [Google Scholar] [CrossRef]
- Won, J.W.; Park, K.T.; Hong, S.G.; Lee, C.S. Anisotropic yielding behavior of rolling textured high purity titanium. Mater. Sci. Eng. A 2015, 637, 215–221. [Google Scholar] [CrossRef]
- Li, W.; Li, S.S.; Yu, H. Research on the anisotropy of plastic behavior and deformation mechanism of textured pure titanium. Mater. Charact. 2022, 194, 112483. [Google Scholar] [CrossRef]
Disclaimer/Publisher’s Note: The statements, opinions and data contained in all publications are solely those of the individual author(s) and contributor(s) and not of MDPI and/or the editor(s). MDPI and/or the editor(s) disclaim responsibility for any injury to people or property resulting from any ideas, methods, instructions or products referred to in the content. |
© 2024 by the authors. Licensee MDPI, Basel, Switzerland. This article is an open access article distributed under the terms and conditions of the Creative Commons Attribution (CC BY) license (https://creativecommons.org/licenses/by/4.0/).

