Article

Effects of Different Austenitising Conditions on the Strength–Ductility Balance in a High-Strength Low-Alloy Steel

1
School of Electronic Engineering, Guangxi University of Science and Technology, Liuzhou 545006, China
2
State Key Laboratory of Powder Metallurgy, Central South University, Changsha 410083, China
*
Authors to whom correspondence should be addressed.
Metals 2024, 14(8), 850; https://doi.org/10.3390/met14080850
Submission received: 31 May 2024 / Revised: 25 June 2024 / Accepted: 27 June 2024 / Published: 25 July 2024
(This article belongs to the Special Issue Advances in Phase Transformation Behavior of Steels)

Abstract

:
With the addition of microalloy elements to a high-strength low-alloy (HSLA) steel, various fine particles of carbides and nitrides are formed, which increase the matrix strength. These precipitates play a crucial role in precipitation strengthening. However, the role of precipitates in microstructural refinement is frequently overlooked. In this study, a series of hot-rolled HSLA steel samples were reheated to different temperatures above the austenite transformation point for a specified period to refine austenite grains via precipitation, then cooled to a dual-phase (austenitic/ferritic) region, and finally air-cooled to room temperature. The influences of different austenitising conditions on the microstructure and mechanical properties of the HSLA steel were examined. When a hot-rolled sample was reheated to 15 °C above the austenitic transition temperature for 20 min and then cooled to 25 °C below the austenitic transition temperature for 25 min, the most low-angle boundaries were formed, and the smallest effective grain size was achieved. Meanwhile, compared with the hot-rolled sample, the tensile and yield strengths of the reheated sample increased by 12.3% and 3.4%, respectively, while the elongation increased by 162.5%, exhibiting a good strength–ductility balance. By adopting an appropriate austenitising process, precipitates can refine the crystalline grains during austenitisation, thereby enhancing the comprehensive mechanical properties of the steel. Meanwhile, excessively high austenitising temperatures lead to the coarsening of the steel microstructure, decreasing the microstructural refinement efficiency via precipitation and consequently degrading the comprehensive mechanical properties of the steel. The findings provide valuable insights into the preparation process design of such steels or other steels with similar microstructures.

1. Introduction

High-strength low-alloy (HSLA) steel is a low-cost high-performance steel, and considerable efforts have been spent in the past few decades to improve its mechanical performance. Previous studies suggested that the contributions of different strengthening mechanisms to the strength of steels primarily originated from the obstruction of dislocation motions by dislocations [1,2,3], solute atoms [4], grain boundaries [5], and phase interfaces [1]. However, traditional challenges such as significantly reduced plasticity and toughness are frequently encountered when the steel strength is improved. Thus, it is difficult to balance the alloy strength and plasticity.
Although ferrite and pearlite structures exhibit good toughness and ductility, their strengths are relatively low and cannot be easily improved. While martensite possesses high strength, it lacks toughness. The strength and toughness of a ferrite + bainite mixture or monophase bainite fall between those of a ferrite + pearlite mixture and martensite with a higher potential for achieving a strength–toughness balance. This combination presents a promising direction for the development of energy-saving microalloyed high-strength steels in the future [6].
For HSLA steels, several equilibrium and non-equilibrium structures appear successively during continuous cooling, including polygonal ferrite, quasi-polygonal ferrite, Weinstein ferrite, acicular ferrite, granular bainite (GB), lath bainite (LB), martensite (M), and martensite–austenite (M–A) island structures [7]. GB is an important mid-temperature structure formed by the distribution of M–A islands on blocky or lath ferrites with high-density dislocations, although some controversy exists regarding its transformation mechanism.
Previous research studies have shown that a desired combination of strength, plasticity, and toughness can be achieved by appropriate heat treatment of HSLA steels with LB or M compared to those with a GB microstructure because GB typically contains an equiaxed bainitic ferrite matrix and massive M–A constituents [8]. These constituents decompose into ferrite and coarse carbides and/or agglomerated carbides during heat treatment, which exerts adverse effects on their plasticity and toughness [9,10,11]. Meanwhile, compared with the LB and M, equiaxed bainitic ferrite has a larger effective grain size and relatively low strength and toughness [12,13]. However, preparing an LB and M matrix typically requires a high cooling rate. In HSLA steels, excessively high cooling rates inhibit the formation of uniform fine precipitates (such as carbonitrides), thereby decreasing the precipitation-strengthening efficiency. Therefore, remarkable improvements in the strength and plasticity of HSLA steels cannot be achieved by optimising the rolling process alone [14,15,16]. Modification of the heat treatment process is essential for attaining superior microstructures and mechanical properties.
It is widely known that precipitates (such as carbonitrides) strengthen materials by impeding dislocation movements. However, the role of precipitates in microstructural refinement is frequently overlooked. For this purpose, a series of HSLA steel samples were reheated to different temperatures above the austenite transformation point for a specified period to refine austenite grains by generating precipitates, then cooled to a dual-phase (austenitic/ferritic) region for a period of time, and finally cooled to room temperature to refine the ferrite–pearlite microstructure and obtain an HSLA steel with excellent strength and ductility. The aim of the present work was to investigate the influence of the heat treatment process conducted at various austenitising conditions on the microstructure and mechanical properties of HSLA steels. Its findings provide valuable insights into the preparation process design of such steels or other steels with similar microstructures.

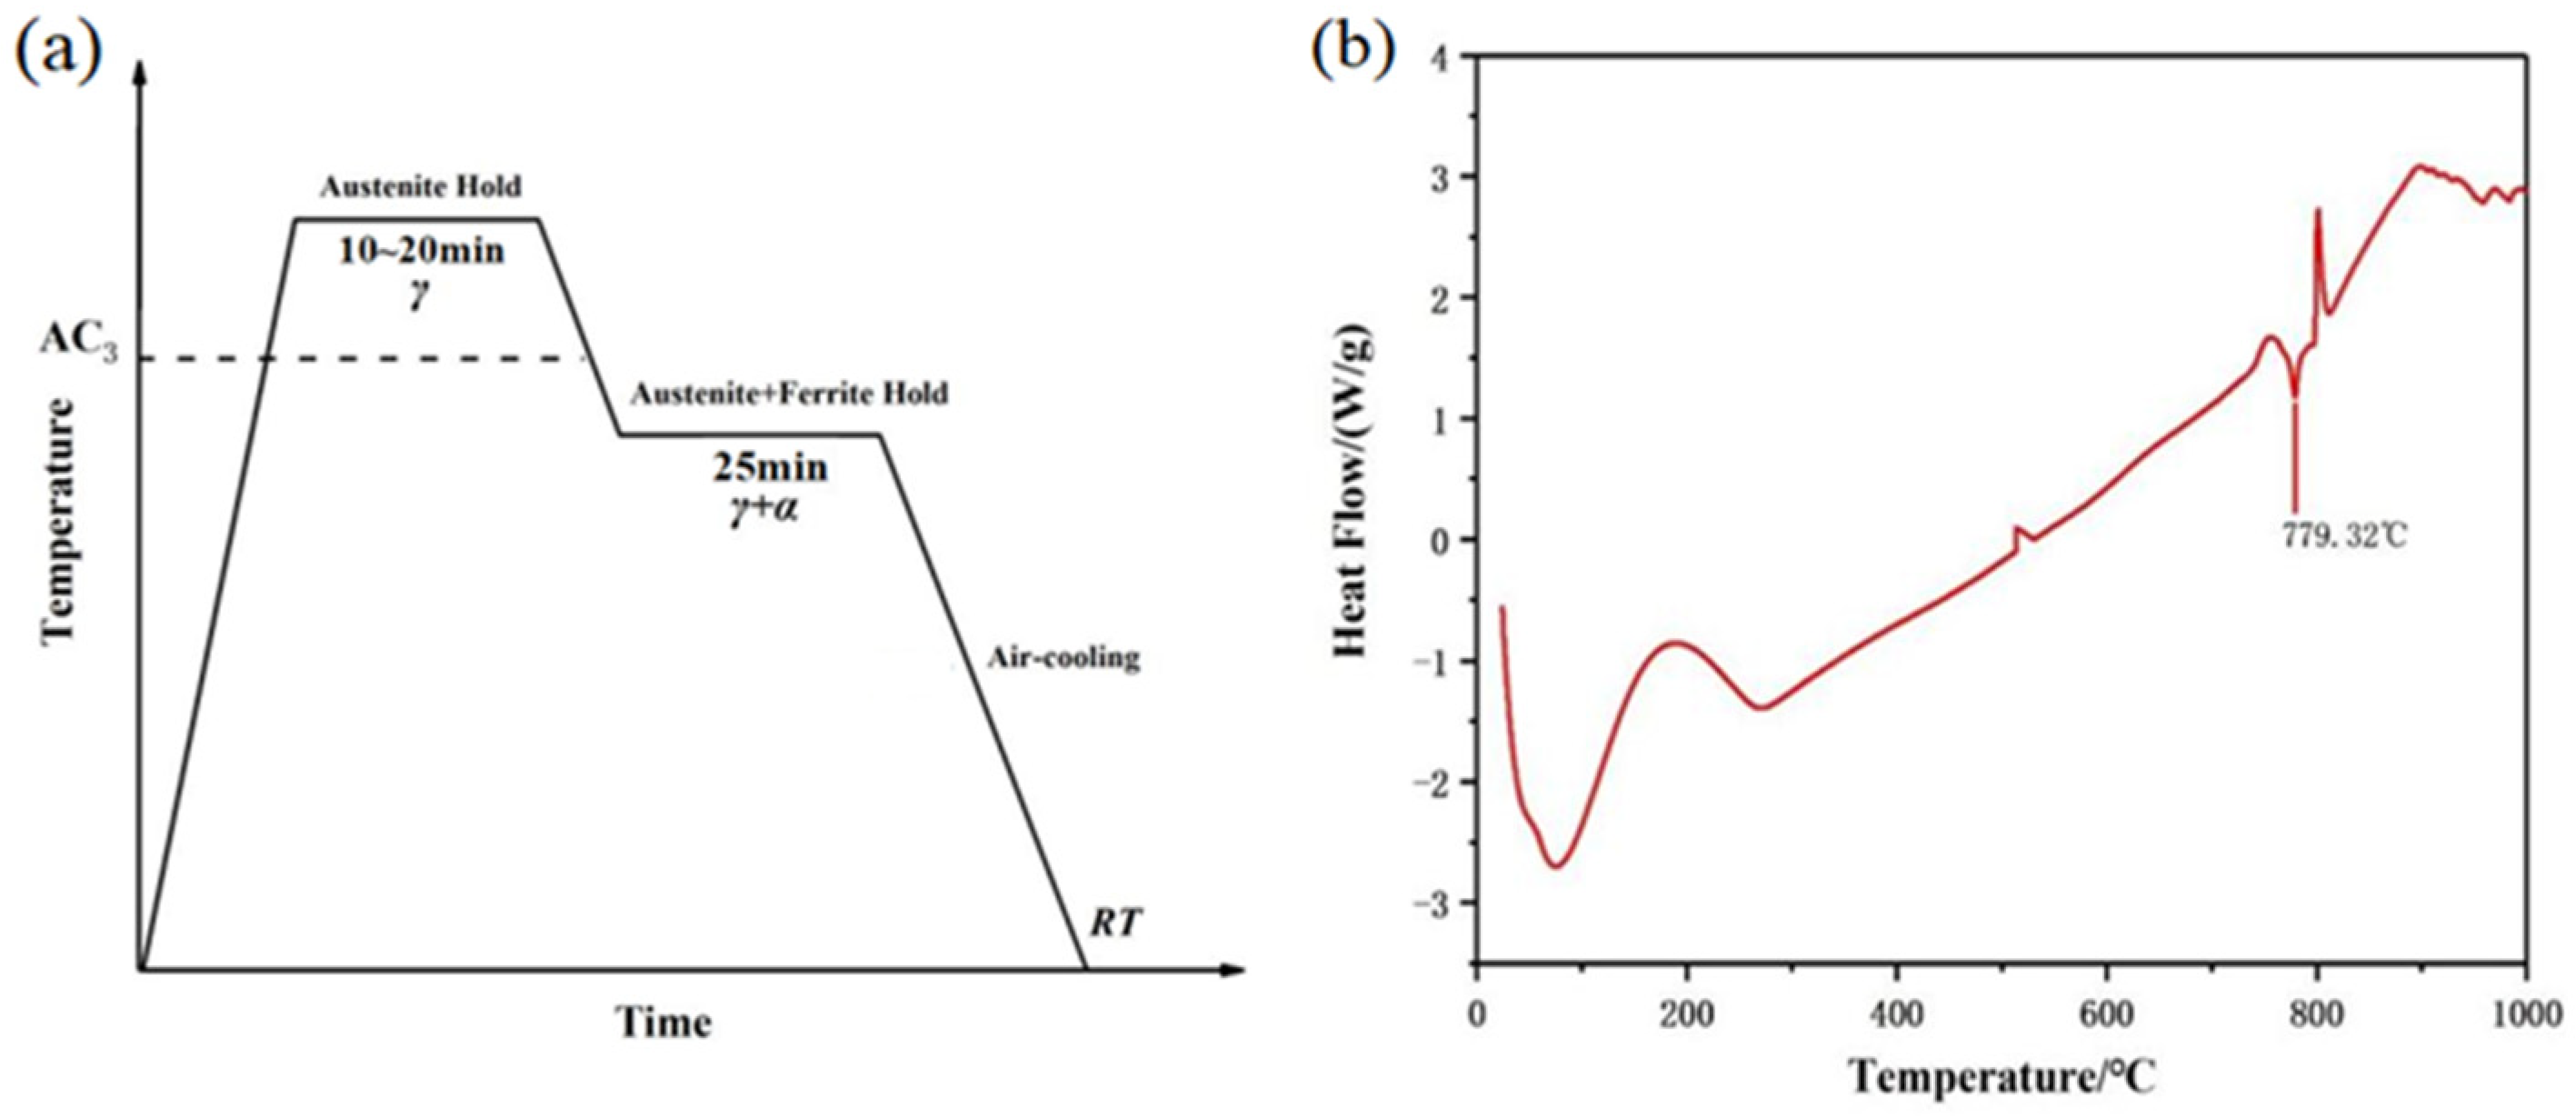
2. Materials and Experimental Procedure

An HSLA steel microalloyed with 0.15% Ti, 0.19% Mo, and 0.04% Nb was studied in this work (its detailed composition is listed in Table 1). First, the steel was melted, cast, and forged according to its chemical composition. The obtained billets were moved into a soaking furnace and heated to 1200–1250 °C for 50–80 min. Second, two-stage controlled rolling was performed; the rough rolling temperature was lower than 1150 °C, and the final rolling temperature was 1000–1050 °C. The temperature of finish rolling was lower than 950 °C, and the final temperature of finish rolling was 850–880 °C.
After rolling, the steel plates were cooled first to 600–650 °C using a laminar flow and then to 25 °C at a cooling rate of 10 °C/h. Finally, the steel plates were cut into smaller pieces for heat treatment. The austenite transition temperature (Ac1) was measured via differential scanning calorimetry (DSC). Differential Scanning Calorimetry (DSC) was used to examine the thermal properties of a 20–50 mg sample in an Al2O3 crucible and it was tested from 25 to 1000 °C at a heating rate of 5 °C/min under 400 sccm of Ar flow. The utilised heat treatment schedule is shown in Figure 1a. According to this schedule, six groups of materials were first heated to 15, 30, and 45 °C above the austenite transition temperature for 10 and 20 min, then cooled to 25 °C below the austenite transition point for 25 min at a rate of 20 °C/min, and finally air-cooled to room temperature. The austenite transition temperature measured by DSC was 794 °C (Figure 1b). The resulting series of the heat-treated samples were abbreviated 809-10, 809-20, 824-10, 824-20, 839-10, and 839-20, respectively.
The heat-treated sheet coupons were machined into standard tensile test samples with a gauge length of 78.6 mm and width of 14 mm, having the long axis oriented in the rolling direction. Tensile tests were conducted on samples with gauge sizes of ϕ5 mm × 30 mm at ambient temperature and a crosshead speed of 3 mm·min−1 using a Zwick Z050 tensile testing machine. Metallographic samples were prepared via conventional metallographic techniques. Microstructural examinations were performed using an FEI Inspect F50 scanning electron microscope (SEM). Grain boundary statistics of the samples were analysed via electron backscatter diffraction (EBSD), which was performed on the FEI Inspect F50 SEM at a step size of 0.5 μm, and the obtained results were interpreted using the Oxford Instruments Channel 5HKL 2.0 software package. In this study, a crystallographic misorientation angle greater than 15° was defined as an effective grain boundary of HSLA steels. Thin foil specimens for transmission electron microscopy (TEM, Tecnai F20) observations were prepared with a twin-jet electropolisher at a voltage of 18 V and temperature of 25 °C using a solution of 10 vol.% perchloric acid and 90 vol.% ethanolate. The phase structures and the dislocation density of samples were identified by X-ray diffraction (XRD). A Rigaku SmartLab X-ray diffractometer (CuKα: 40 kV, 200 mA) was used, after the sample was ground and polished, with a scanning speed of 0.5/min. The precipitate sizes and fractions were measured by quantitative image analysis on quenched samples. At least ten TEM images at different positions were selected. To separate the small and large precipitates from the images, the software Image-Pro Plus was used with the segmentation and threshold functions.

3. Result and Discussion

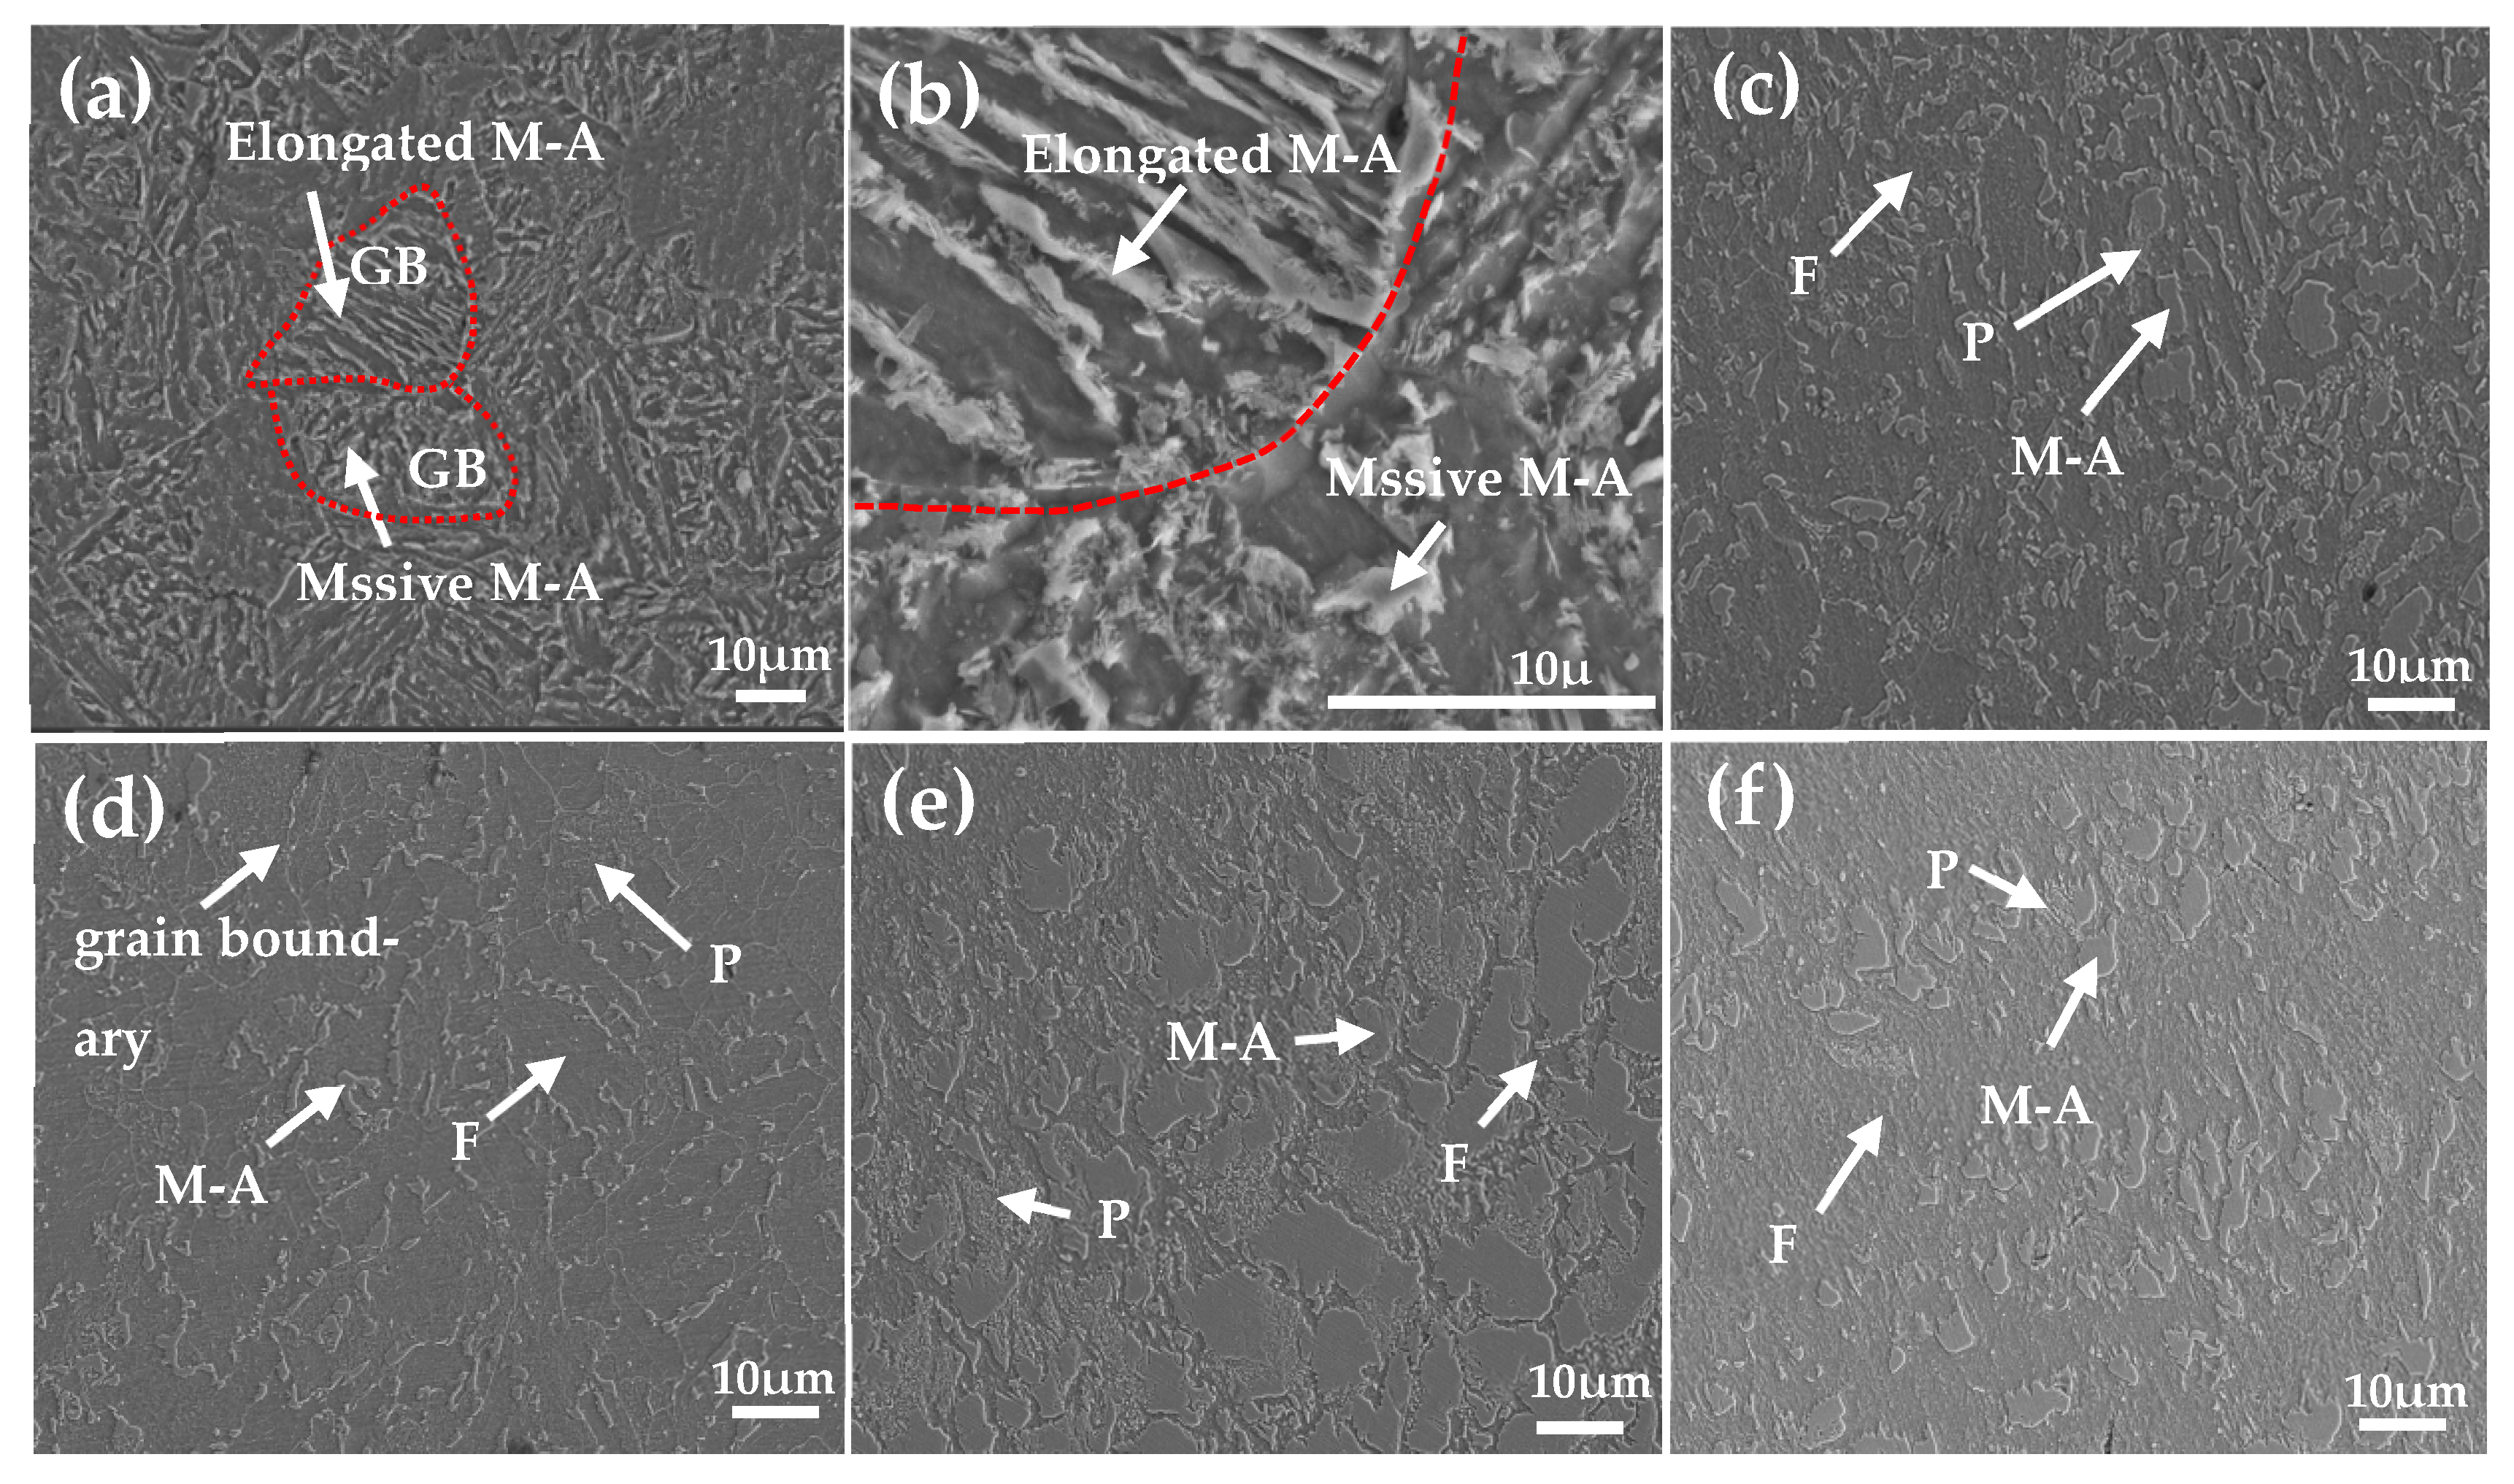
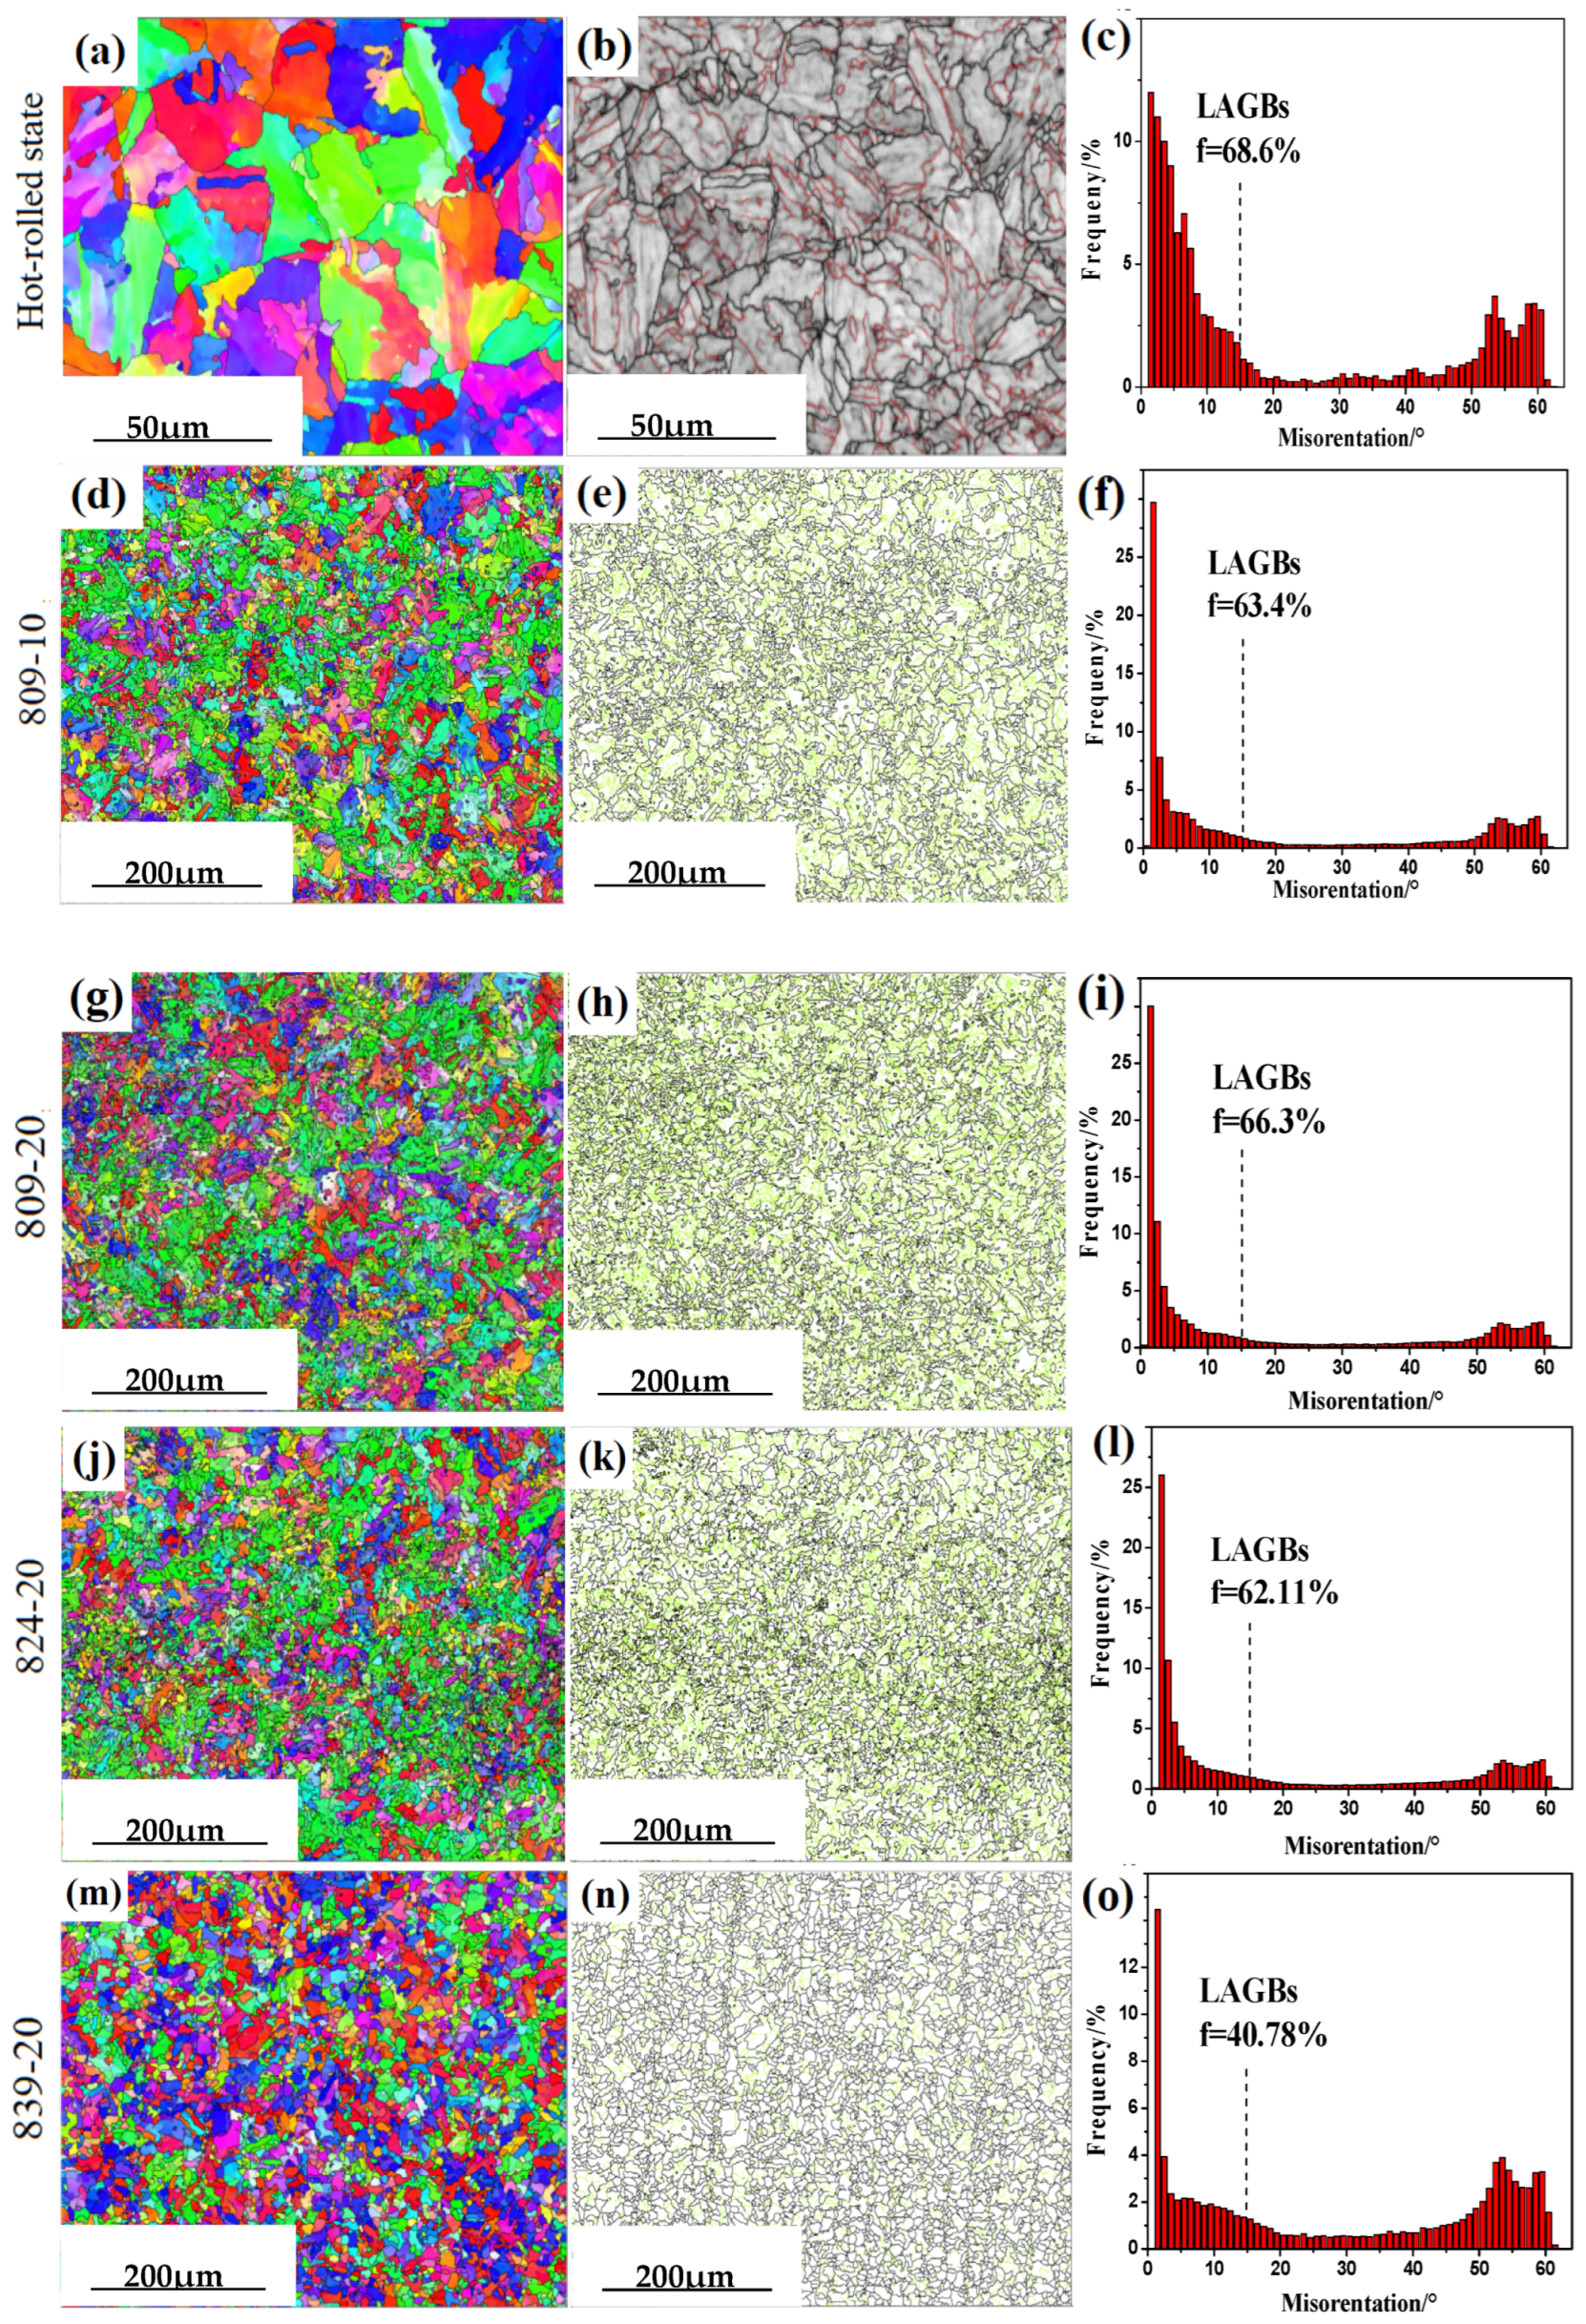
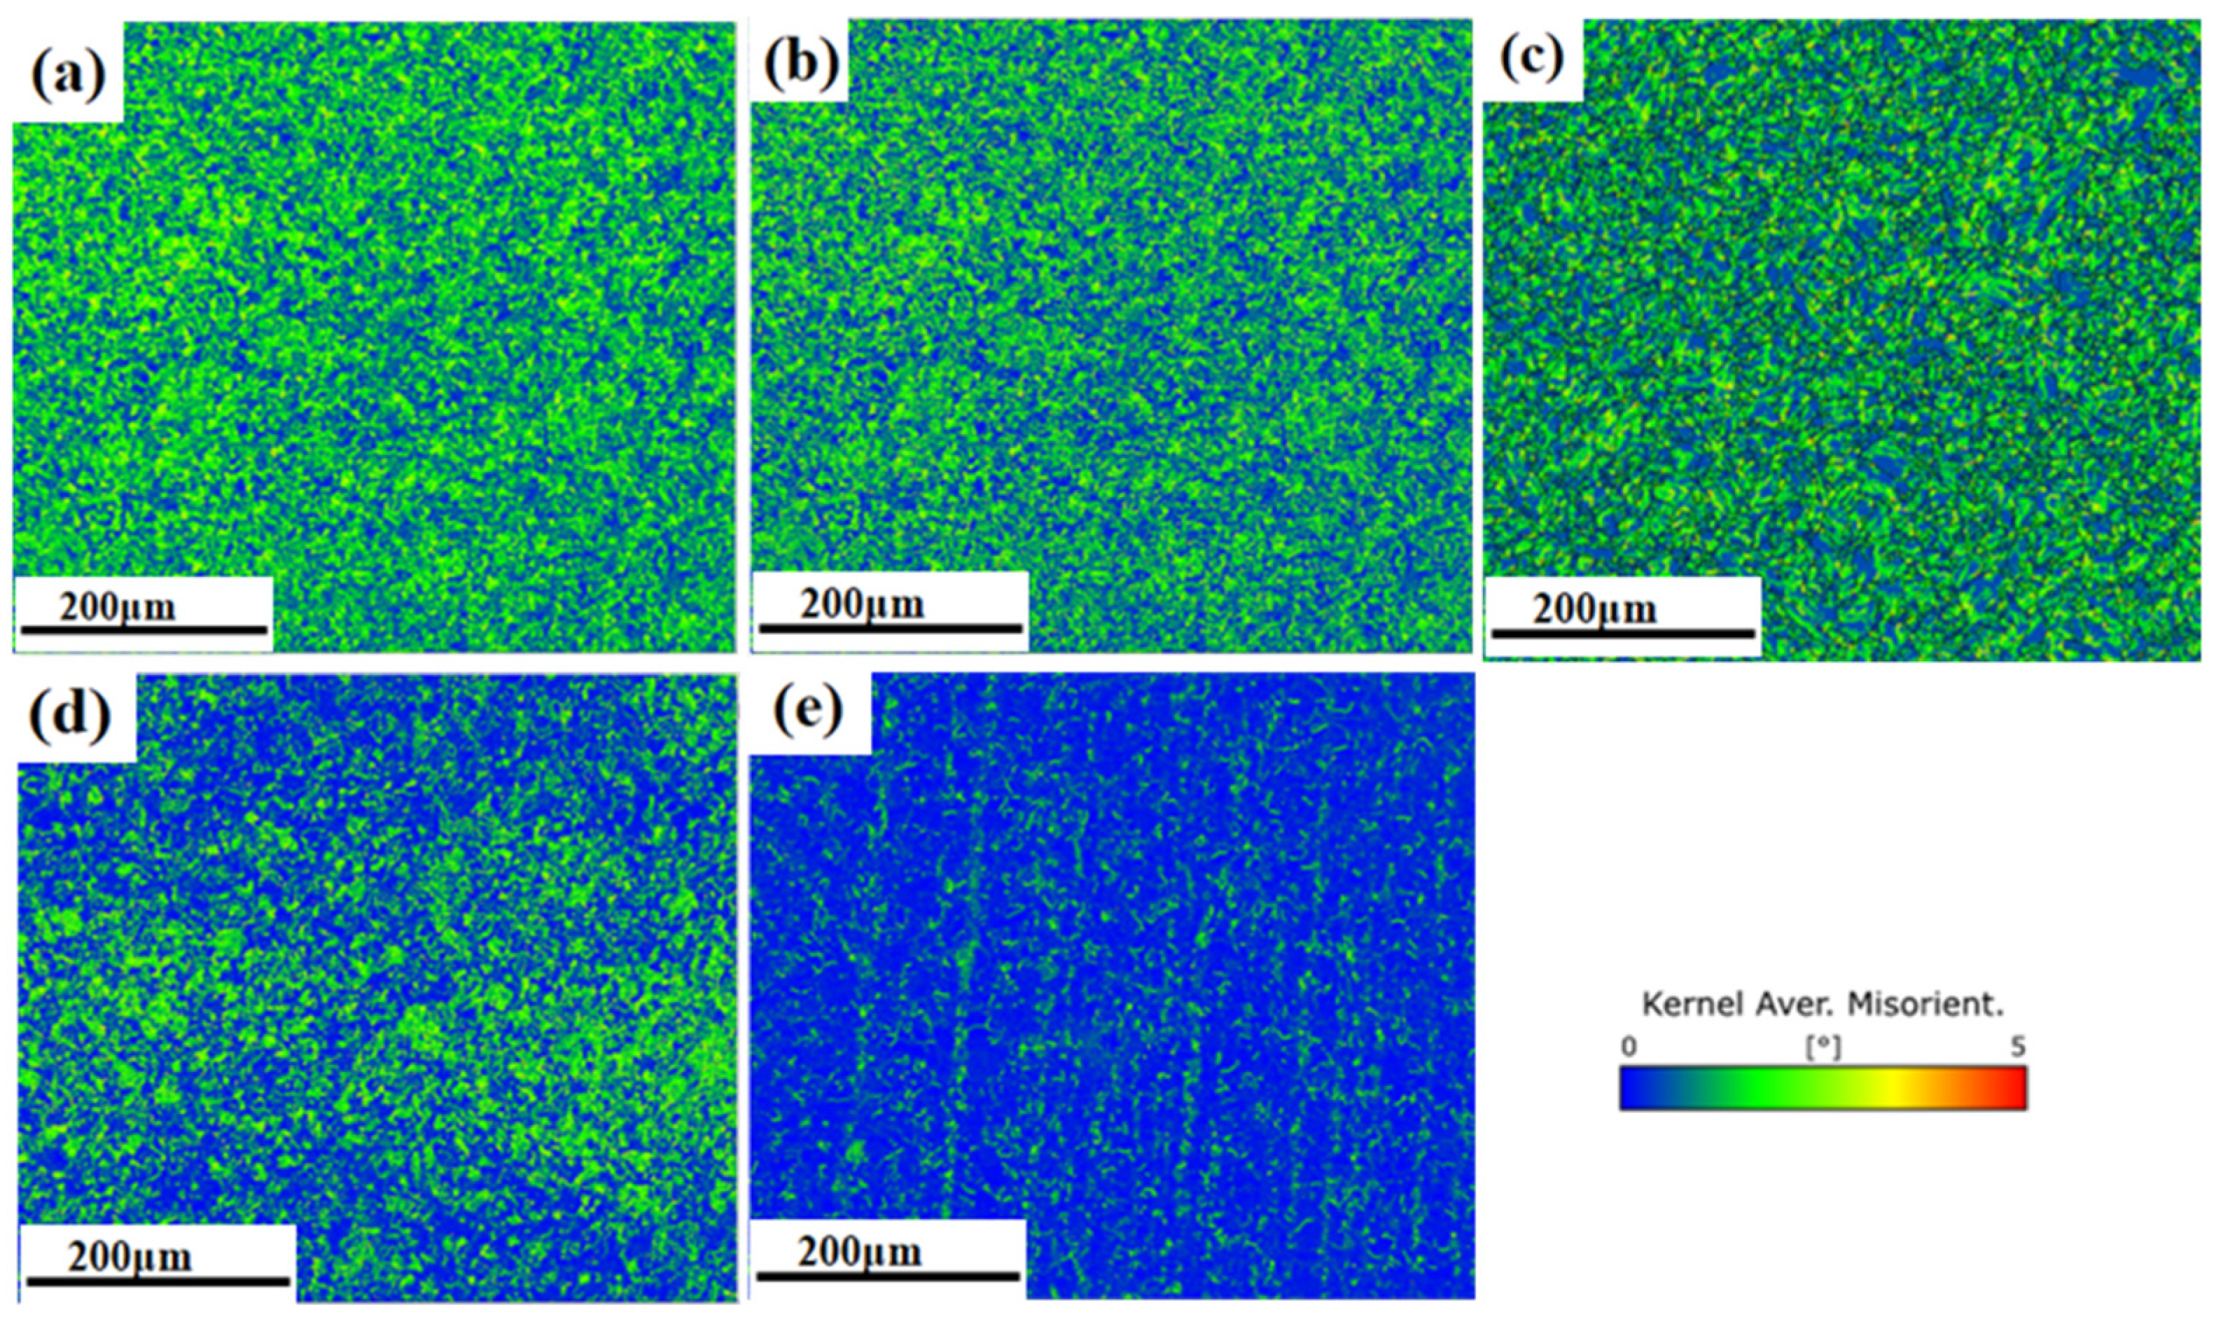
3.1. Microstructural Characteristics

The SEM images of the hot-rolled and four typical heat-treated samples are shown in Figure 2. The normalised microstructures of the hot-rolled samples are those of GB composed of bainitic ferrite and M–A constituents. Based on the characteristics of these constituents, GB was classified into two types, namely, GB1 and GB2. According to Figure 2a, in the GB1 region, the equiaxed bainitic ferrite phase formed inside prior austenite grains was randomly decorated with massive M–A constituents. GB2 differs from GB1 by the presence or distribution of M–A constituents and bainitic ferrite morphology. In particular, GB2 contains elongated M–A constituents and well-developed lath substructures inside the bainitic ferrite matrix. These are highly consistent with the previous research of Jiang et al. [17]. These massive M–A constituents are primarily located at the prior austenite grain boundaries and randomly distributed in the equiaxed bainitic ferrite regions, whereas the M–A constituents in the stringer form are distributed parallel to each other, mainly at the lath bainitic ferrite boundaries. The sizes of massive M–A particles were typically 1–3 μm, whereas the elongated M–A particles had lengths of 5–10 μm and widths of 0.4–1 μm (Figure 2b).
The microstructures of the four typical heat-treated samples are shown in Figure 2c–f. In the obtained SEM images, the dark regions depicted as large blocked structures correspond to the ferrite phase, and the light regions represent M–A constituents with island structures. Lamellar pearlite species surround the edges of M–A islands, and grain boundaries are distributed over the bulk ferrite phase (Figure 2c). After the austenitisation time was extended to 20 min, the M–A particles became smaller, and their volume fraction decreased; however, the austenite grain boundaries became more pronounced (Figure 2d). Pearlite particles were distributed around the blocked ferrites which grew along the austenitic grain boundaries. The amount of the pearlite phase is related to the austenite content and hold time in the α+β tow-phase region, which affects the austenite transformation into ferrite and pearlite [1]. A higher temperature is conducive to austenite formation at the initial stage of the heat treatment; therefore, the pearlite amount increases in Figure 2e,f.

3.2. Mechanical Properties

The room-temperature engineering stress–strain curves recorded for the hot-rolled and four typical heat-treated samples are shown in Figure 3. The tensile strength, yield strength, and elongation values of the hot-rolled samples are 751 MPa, 564 MPa, and 8%, respectively (as shown in Table 2). At an austenite hold time of 10 min, the austenite sample (824-10) exhibits the highest yield strength and tensile strength at a hold temperature of 824 °C, but the lowest elongation (Table 2). The yield and tensile strength of the 824-10 sample are equivalent to those of the hot-rolled sample, while its elongation increases by 106.3%. At an austenitisation time of 20 min, the yield and tensile strengths of the samples decrease gradually with increasing austenitisation temperature. It has been reported that almost 96–97% of structures are martensite phase in the MA structure [18]. The presence of small amounts of retained austenite in MA is also reported by other authors [19]. MA structure usually results in steel with higher strength and lower toughness and plasticity. This is also one of the reasons why hot-rolled steel has a higher strength and lower elongation compared to heat-treated steel.
Notably, increasing the austenitisation temperature and time promotes the growth of austenite grains, leading to the formation of coarser ferrite and pearlite substructures at room temperature. Meanwhile, more austenite is produced, and, when the temperature drops to the value corresponding to the two-phase region, more ferrite and pearlite grains with lower strengths are produced. Compared with the hot-rolled sample, the tensile and yield strengths of the 809-20 sample increased by 12.3% and 3.4%, respectively, while the elongation increased by 162.5%, demonstrating a good strength–ductility balance. This phenomenon may be related to the pinning effect of precipitates at austenite grain boundaries, which will be further discussed in this article.

3.3. Effect of Austenitising Conditions on Microstructural Properties

Figure 4 shows the inverse pole figures and distributions of grain boundary angles of the hot-rolled and four typical heat-treated state samples. The high-angle boundary (HAGB, θ > 15°) areas are black, and the low-angle boundary (LAGB, 2° < θ < 15°) areas are red and green. At an austenitisation temperature of 809 °C, the proportion of LAGBs slightly increases with an increase in the austenitisation time from 10 to 20 min, indicating the formation of additional sub-grains (Figure 4f,i). This phenomenon may be related to the pinning effect of the precipitation of carbides and nitrides of microalloying elements (such as Ti and Nb in steels) on the dislocation movement. With prolonged austenitisation, precipitates gradually coarsen, enhancing their ability to hinder the dislocation recovery and climb, thus forming LAGBs. Consequently, the LAGB proportion increases.
Generally, an increase in the number of LAGBs indicates an increase in the number of dislocations in steel, which improves the material strength. Owing to the higher austenitisation temperature, the diffusion of carbon and iron atoms proceeded faster, which was favourable for the nucleation and growth of austenite species. Many HAGBs were formed, and dislocations disappeared at the higher phase-transition temperatures. Therefore, after increasing the austenitisation temperature to 824 and 839 °C and holding for 20 min, the amount of LAGBs decreased to 62.11% and 40.78%, respectively (Figure 4l,o). In addition to the 839-20 sample whose proportion of LAGBs was lower than that of the hot-rolled sample, the proportions of LAGBs in the other heat-treated samples were higher than that of the hot-rolled sample, implying that the dislocation density of the 839-20 sample was also high.
Figure 5 shows the kernel average misorientation (KAM) maps of the hot-rolled steels. Generally, the higher KAM values indicate the higher dislocation densities in a sample. The hot-rolled sample demonstrates the highest KAM value. The observed trend of KAM value changes is consistent with the distribution of low-angle boundaries in several samples, indicating that, as the austenitisation temperature increases, the dislocation density gradually decreases. However, the dislocation density of the 809-20 sample is higher than that of the 809-10 sample, demonstrating the highest dislocation density among the heat-treated samples.
To confirm the observed changes in the dislocation density, X-ray diffraction patterns of the analysed samples were recorded (Figure 6). Multi-peak Gaussian fitting was performed to fit the data and obtain the best-fit curve. Based on the Williamson–Hall equation [20]:
β T c o s θ = ε 4 s i n θ + k λ L
where L is the effective grain size (nm) and the microstructure distinguished by HAGB is commonly referred to as effective grain size. k is the constant (in this work, k = 0.9), ε is the microstrain, and λ the X-ray wavelength (λ = 1.5418 Å). Therefore, the dislocation density can be computed as follows (2):
δ = 1 L 2
where δ is the dislocation density (nm−2) and L is the effective grain size (nm). Detailed data are presented in Table 3. It shows that the 809-20 sample exhibits the highest dislocation density among the heat-treated samples, which is consistent with the EBSD results.
Table 3 also shows the effective grain sizes of several samples measured via EBSD. As the austenitisation temperature increases, the effective grain size gradually increases. However, the effective grain size of the 809-20 sample is smaller than that of the 809-10 sample, which is the lowest value among the several samples. At an austenitisation temperature of 809 °C and holding time of 10 min, only partial austenitisation occurs in the alloy microstructure owing to the low temperature. Therefore, many large grains remain in the original structure, and the resulting grain size is relatively large under these conditions. As the austenitisation time was extended to 20 min, the austenitisation process was nearly complete and the grains did not grow further, at which point the sample had a smaller grain size. Therefore, it exhibited a smaller effective grain size after cooling to room temperature.
In addition, the grain boundary migration observed for the 809-10 sample was less intense owing to the incomplete austenite transformation, which exerted a weaker pinning effect of precipitates on the grain boundary migration. As the ausenitisation time was extended to 20 min, the proportion of the moved grain boundaries increased and precipitates gradually grew, exerting a stronger pinning effect on grain boundaries. Therefore, the effective grain size of the 809-20 sample was the smallest. However, atomic diffusion intensified as the austenitisation temperature continued to increase, thus weakening the pinning effect. The average precipitate size of the samples increased with the increase in heat treatment temperature and time (Table 3). In fact, the critical effective grain size that can be effectively pinned without growth is directly proportional to the size of the precipitate and inversely proportional to the volume fraction of the precipitate [21]. To reduce the size of the effective grains, the precipitates require a sufficient volume fraction and small size. Therefore, it is effective to precipitate more fine precipitates and pin grain boundaries through heat treatment.
To better understand the observed changes in the effective grain size, the austenite transformation process was investigated. The austenite transformation fraction can be expressed as [22] follows:
f a u t = 4 π ( 1 f a u ( t ) ) N γ R γ 2 ( t ) V ( t ) dt
where f a u t is the austenite volume fraction formed at time t; f a u ( t ) is the total austenite volume fraction; and N γ is the volume density of all austenite grain nuclei, which is calculated as follows:
N γ = i = 1 3 N γ i
where N γ 1 ,   N γ 2 , and N γ 3 are the nucleus volume densities in the three nucleation modes. The detailed calculation method can be referred to in reference [22]. R γ t is the radius of austenite grains at time t, which is calculated as follows:
R γ t = 0 t V γ ( t ) dt
where V γ (t) is the effective growth rate of spherical grains, V γ = k V k f k ; f k = f k (t) is the current volume fraction of the k component of the alloy microstructure; and k denotes ferrite, pearlite, or martensite. Using this model, the austenite transformation fraction can be calculated at specific austenitisation temperature and time. JMatPro 7.5 software may also be used to compute the austenite transformation fraction. The calculation results obtained via both methods are listed in Table 4.
They indicate that sample 809-10 is partially austenitised, while the 809-20 sample has almost completed the austenitisation process. In addition, the 824-20 and 839-20 samples have completed the austenitisation process and undergone rapid austenite growth. Based on these data, further improvements in the strength and ductility of the hot-rolled samples can be achieved through the optimisation of the heat treatment process. The 809-20 sample exhibits a higher strength owing to its higher dislocation density, whereas its minimum effective grain size is a key factor contributing to the high strength and ductility. Thus, modifying the heat treatment process can enhance the mechanical properties of a material.

3.4. Nano-Sized Precipitate Structure

The TEM images of the hot-rolled samples are shown in Figure 7a–e. A dislocation loop is depicted in Figure 7a. Dislocation loops can cause large stress concentrations around the precipitate phase, serving as crack nucleation points and increasing the risk of a brittle fracture in the material [23]. Figure 7b shows that a large number of precipitates with sizes of approximately 10 nm are dispersed in the matrix. A few precipitates with sizes of approximately 110 nm are observed as well. The precipitate particles contain bright cores, and the energy-dispersive X-ray spectroscopy (EDS) pattern suggests that the ratio of Ti to C is approximately 1:1 (Figure 7c). Combined with the fast Fourier transform (FFT) image of the central precipitate region (Figure 7b), the core composition was TiC formed via strain-induced precipitation during rolling. Additionally, numerous elongated M–A islands are present at the lath boundaries (Figure 7d,e). However, in the annealed samples (809-20), these M–A islands become shorter and a few carbides are present (Figure 7f). It can easily be concluded that the shape and characteristics of the M–A constituents and bainitic ferrite are closely linked to the continuous cooling rate, chemical composition, and transformation temperature, which mainly depend on the diffusion of C and Fe atoms [24,25].
Figure 8 shows the TEM images of the samples subjected to different heat treatments. According to Figure 8a, large precipitate particles are clearly observed in the 809-20 sample. These particles have nearly spherical shapes with sizes of approximately 102–130 nm. The sizes of the precipitates are not uniform, and a large number of fine particles with sizes of approximately 5–12 nm are present in the TEM image (Figure 8b). This indicates that the thermally induced precipitated particles are not uniformly distributed in austenite grains, and larger precipitates tend to form at the intersections of grain boundaries. However, smaller precipitates form at grain boundaries and sub-boundaries. The size of precipitates is related to the austenite hold time: when this time increases from 10 to 20 min, the size of the large precipitates increases from 98–128 nm to 112–140 nm (in this study, the precipitate sizes were measured using Image Pro Plus 6.0 software; approximately ten images were scanned). The growth law of the precipitated carbide particles can be described by the following equation [26]:
d = α D t
where d is the mean diameter of precipitates, α is the coefficient of growth, D is the diffusion coefficient of elements in precipitates, and t is the holding time. Therefore, the size of precipitates primarily depends on the holding time and diffusion coefficient of elements. Near the boundary, dislocations are clearly observed (Figure 8c), which may be a key factor in increasing the steel strength. Dispersed fine precipitates that interact with dislocations in steel can significantly improve its strength [27,28]. More importantly, these precipitates obstruct the migration of grain boundaries, resulting in smaller effective grain sizes and enhancing the strength and ductility of the material.
Figure 8d,e displays the line scan direction and results, respectively, which indicate that elements are non-uniformly distributed in the precipitates. In the edge region of the precipitate, the major elements are Fe and C; however, in the middle region of the precipitate, the Ti content increases, while the Fe content decreases, and the C content remains basically unchanged. This indicates that the precipitate exhibits a core–shell structure, in which the Fe–C compound forms the shell, and the Ti–C compound forms the core. It is also suggested that, in the heat treatment process, the Ti–C compound is precipitated earlier than the Fe–C compound because of the lower free energy. A considerable amount of Nb (10.64%) is detected by EDS (Figure 8f); meanwhile, Nb likely increases the strength of the HSLA steel through the precipitation of the second phase [29,30,31].
As shown in Figure 9a, the precipitate contains a core. To investigate the elemental distribution of the precipitates, an elemental mapping analysis was performed (Figure 9b), suggesting that C and Ti are mainly concentrated in the core, whereas Nb is uniformly distributed in the precipitate. Figure 9c,f displays the high-resolution transmission electron microscopy (HRTEM) images of the middle and edge regions of the precipitates. Several diffraction points are present in the FFT image in the middle region of the precipitate (Figure 9d), suggesting the existence of at least two phases. According to the line scan results, the phases in the middle region of the precipitate correspond to Fe3C and Ti8C5 species. In the precipitate edge region, only two bright diffraction points are present near the centre, which is significantly different from the middle region. Hence, this region mainly consists of a single phase. The inverse fast Fourier transform (IFFT) image depicted in Figure 9h indicates the existence of only one lattice type with a spacing of approximately 2.403 Å, which confirms the formation of the Fe3C phase in the edge region.

3.5. Strengthening Mechanism

The strength of steels depends on various factors, such as the matrix strength, precipitate amounts and sizes, dislocation density, etc. The yield strength can be expressed using the Hall–Petch relationship [32,33,34]:
σ y = σ i + σ s + σ p r e c + σ d i s l o c + σ g
where σi is the contribution of crystal lattice hardening, σs is the contribution of solution hardening, σprec is the contribution of precipitation hardening, σdisloc is the contribution of dislocation hardening, and σg is the contribution of grain refinement hardening. According to previous studies, varying heat treatment conditions changes the dislocation density, effective grain size, and precipitates; therefore, in this work, the mechanical properties of materials may be enhanced via dislocation hardening, grain refinement hardening, and precipitation hardening. Hence, the contributions of dislocation hardening, grain refinement hardening, and precipitation hardening were estimated. The dislocation density was calculated in the above-mentioned study; therefore, the corresponding hardening contribution can be computed using Taylor’s equation:
σ d i s l o c = α M μ b ρ 0.5
where α is a numerical constant, M is the Taylor factor, μ is the shear modulus (μ = 8 × 10⁴ MPa), b is Burgers’ vector (2.48 × 10⁻¹⁰ m), and ρ is the dislocation density. According to Equation (4), the dislocation density strongly depends on the αM value. Herein, αM = 0.9, which has been used in the literature [35]. The grain refinement hardening contribution σg = KHPD−1/2, where KHP is the coefficient related to the crystal type and grain size, and D is the average grain size. Precipitation hardening can be evaluated via the Ashby–Orowan equation:
Δ σ p r e c = 0.538 × G b × f v 1 / 2 X l n ( X 2 b )
where Δσprec is the yield strength increment due to precipitation hardening (MPa); G is the shear modulus (MPa), which is equal to 81,600 MPa for steels; b is Burger’s vector (nm), which is equal to 0.248 nm for ferrite; fv is the volume fraction of precipitates; and X is the diameter of precipitate particles (nm). The area fraction of precipitates produces no significant effect on the calculation results. The calculated values for the dislocation hardening, grain refinement hardening, and precipitation hardening contributions are listed in Table 5. All samples exhibit similar precipitation hardening values, and the 809-20 sample demonstrates a stronger fine-grain strengthening effect. Compared with the 809-10 sample, the 809-20 sample exerts a stronger pinning effect on the migration of grain boundaries owing to its larger precipitate size. Although the 824-20 and 839-20 samples exhibit strong precipitation strengthening effects, the hindrance of precipitates on grain boundary migration is limited due to the accelerated atomic diffusion at higher temperatures. This increases the austenitisation rate and promotes the rapid growth of the austenite grain size, which weakens the material more significantly than the precipitation-strengthening effect. Consequently, the 824-20 and 839-20 samples possess weaker combined mechanical properties. The calculated values of σy were slightly higher than the measured values, but their variation patterns with heat treatment temperature and time were consistent with the measured values. The 809-20 sample exhibited optimal yield strength (Table 5). By adopting an appropriate austenitisation process, precipitates can effectively refine the steel microstructure, thus enhancing its overall mechanical properties. However, excessively high austenitisation temperatures coarse the steel microstructure, decreasing the microstructural refinement efficiency via precipitation and consequently weakening the comprehensive steel mechanical properties.

4. Conclusions

In this study, a series of HSLA steel samples were prepared by varying the austenitisation temperature and time. The influence of the heat treatment conditions on the microstructure and mechanical properties of the HSLA steel with a chemical content (wt.%) of Fe-0.3C-0.25Si-1.39Mn-0.007P-0.15Ti-0.3Cr-0.003S-0.19Mo-0.04Nb was studied, and the following conclusions were derived.
(1)
When the hot-rolled sample was reheated to 15 °C above the austenitic transition temperature for 20 min and then cooled to 25 °C below the austenitic transition temperature for 25 min, more low-angle boundaries were formed, and the smallest effective grain size was achieved.
(2)
Compared with the hot-rolled sample, the tensile and yield strengths of the 810-20 sample (the sample was first heated to 15 °C above the austenite transition temperature for 20 min, then cooled to 25 °C below the austenite transition point for 25 min, and finally air-cooled to room temperature) increased by 10.2% and 3.1%, respectively, while the elongation increased by 162.5%, exhibiting a good strength–ductility balance.
(3)
By adopting an appropriate austenitisation process, precipitates can refine crystalline grains during austenitisation, thus enhancing the comprehensive mechanical properties of the steel.
(4)
Excessively high austenitisation temperatures coarsen the steel microstructure, decreasing the microstructural refinement efficiency via precipitation and consequently weakening the comprehensive mechanical properties of the steel.
(5)
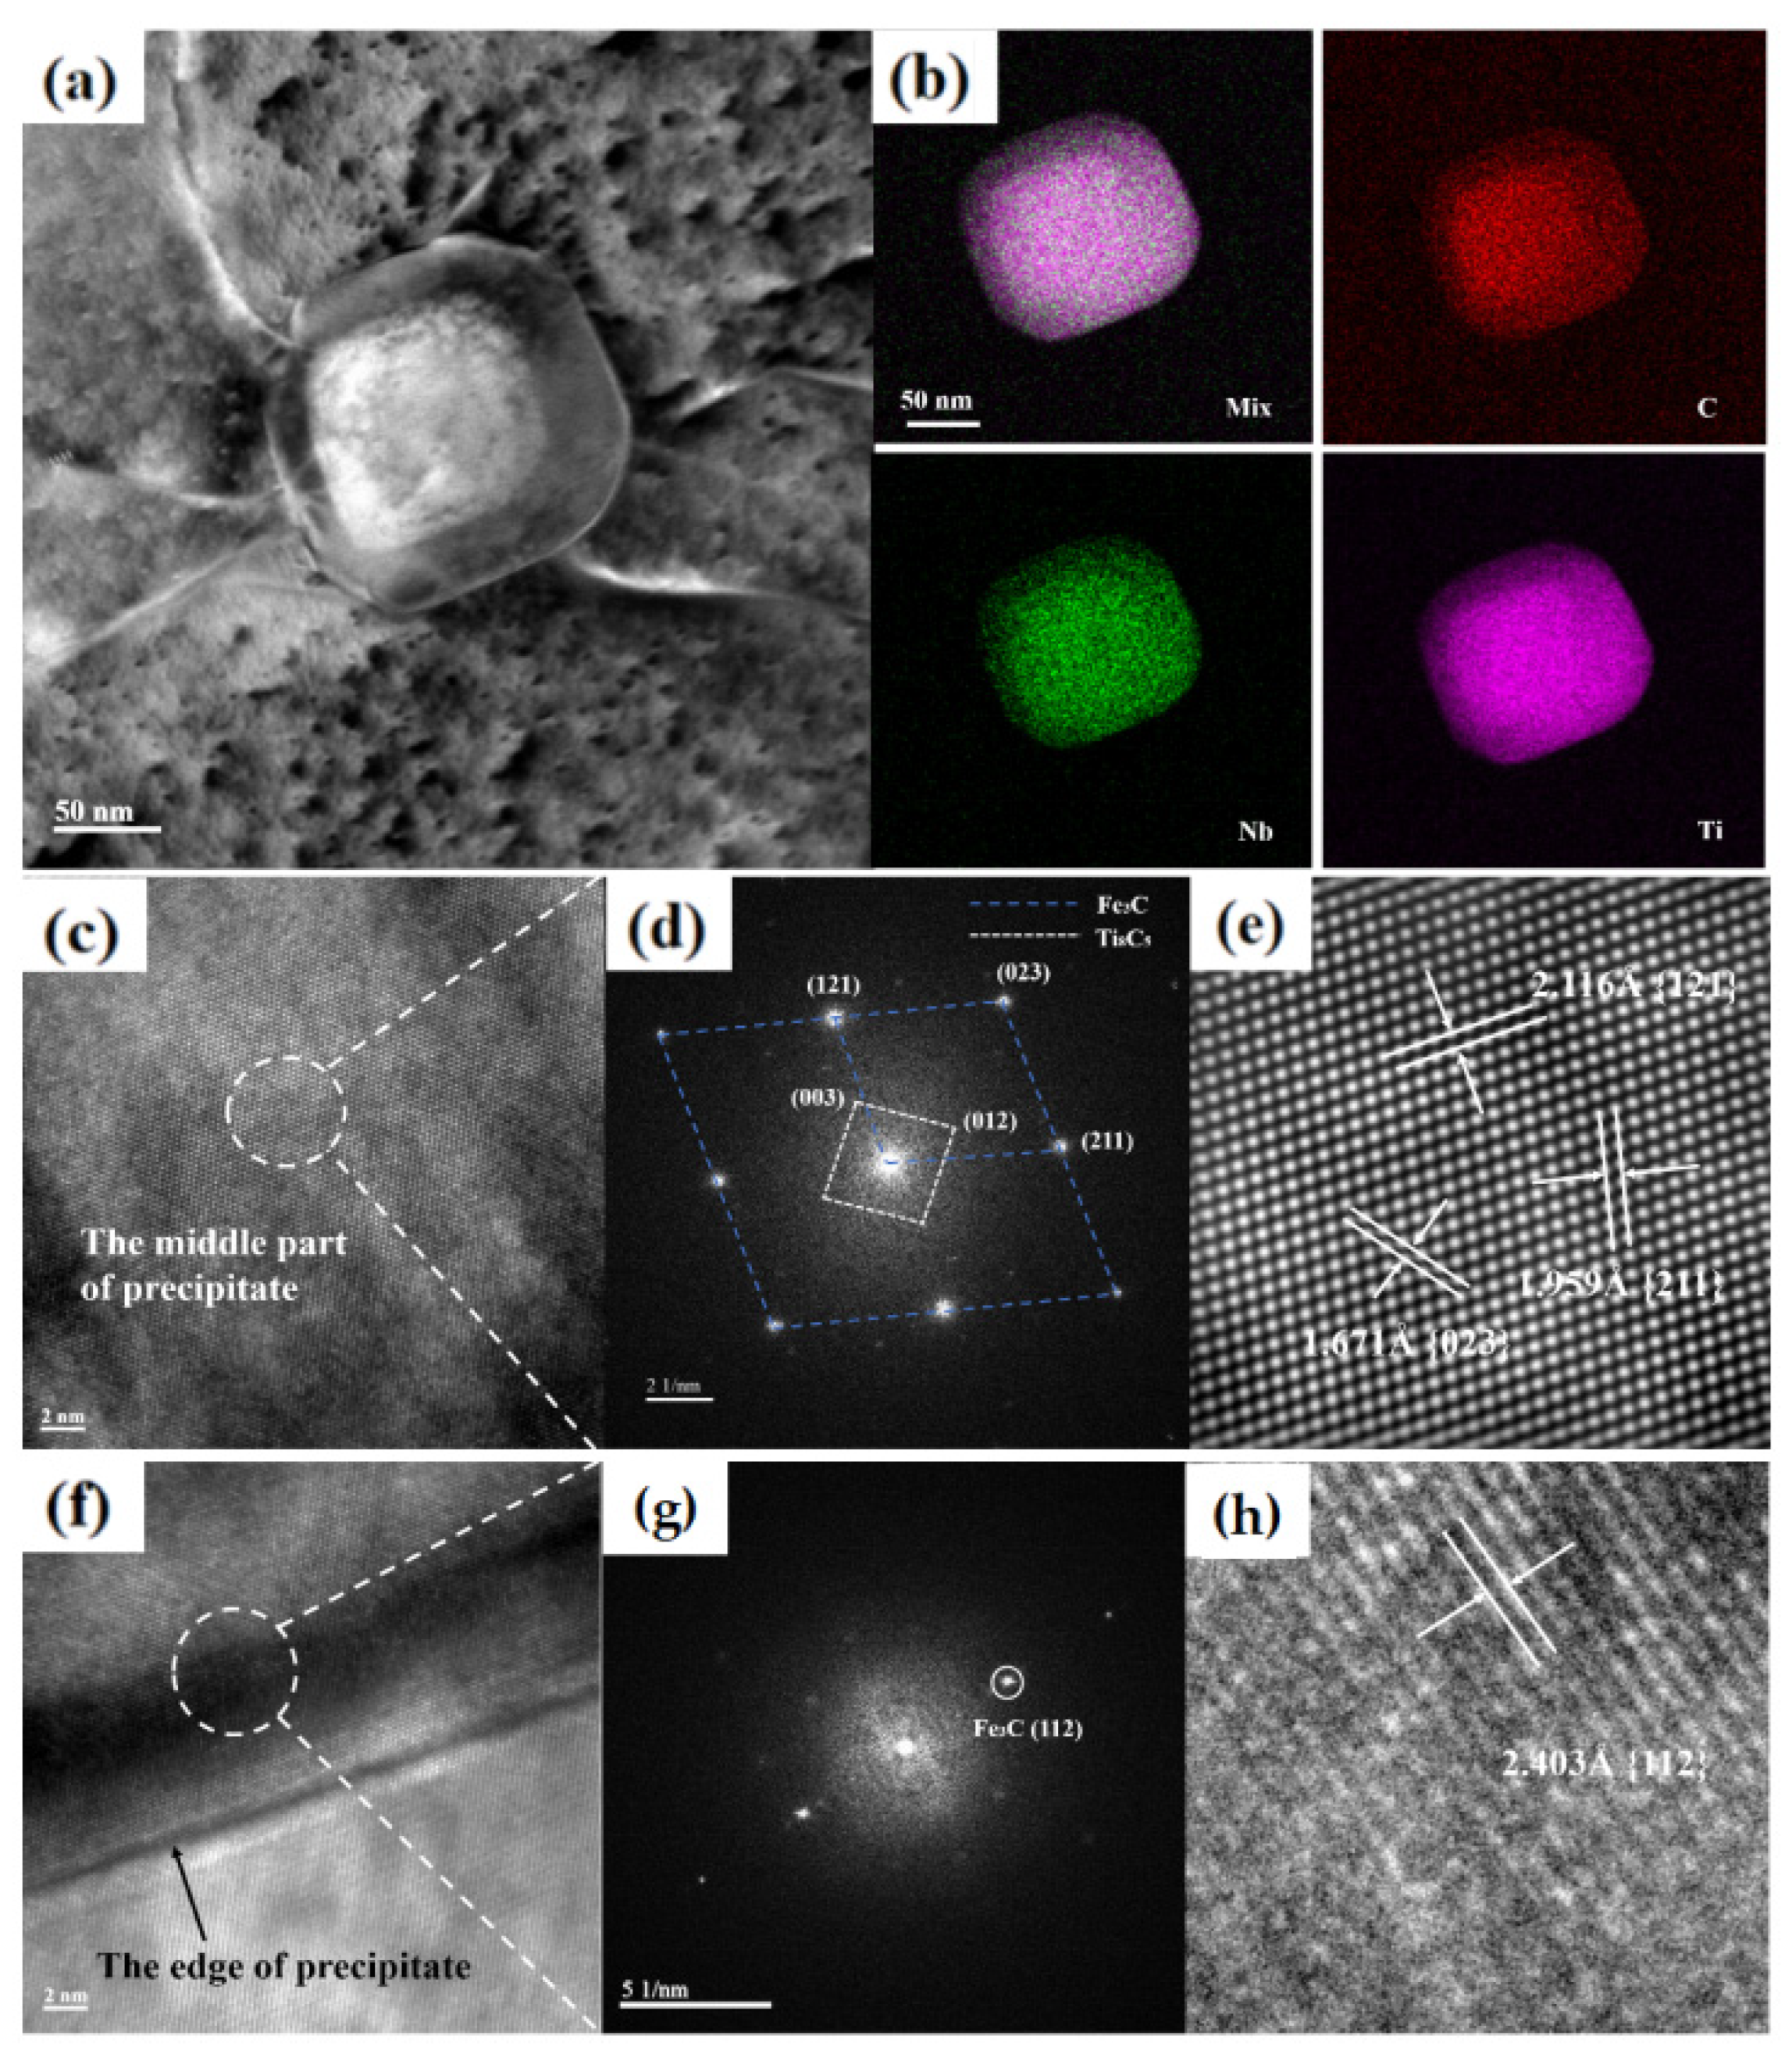
After heat treatment, a large number of fine particles with sizes of approximately 5–12 nm are dispersed in the matrix, and a few precipitates have nearly spherical shapes with sizes of approximately 102–130 nm. The precipitate exhibits a core–shell structure, in which the Fe–C compound forms the shell, and the Ti–C compound forms the core.

Author Contributions

Conceptualization, Y.L.; methodology, T.C.; formal analysis, L.L.; investigation, D.D.; resources, L.L.; data curation, Z.J. and T.C.; writing—original draft, L.L.; writing—review and editing, D.D.; project administration, Z.J.; funding acquisition, Y.L. All authors have read and agreed to the published version of the manuscript.

Funding

This research is sponsored by the National Natural Science Foundation of China (No. 52201114), Guangxi Science and Technology Plan Project (No. AD21238009), the China Postdoctoral Science Foundation (No. 2021MD703813), and Doctoral Fund Project, Guangxi University of Science and Technology (19Z28), Guangxi Postdoctoral Special fund project (2022039).

Data Availability Statement

The data that support the findings of this study are available from the corresponding author upon reasonable request.

Conflicts of Interest

The authors declare no conflicts of interest.

References

  1. Sietsma, J.J.; Forum, M.S. The Formation of Multiphase Microstructures in Low-Alloy Steel. Mater. Sci. Forum 2010, 638–642, 3520–3530. [Google Scholar] [CrossRef]
  2. Muneer, W.; Hu, K.; Chen, S.; Liu, D.T.; Liu, T.; Zhan, X.H. Comparative study of microstructure and mechanical properties using a novel filler rod ER 4943 and autogenously butt welded joint during laser welding of AA 6061-T6 in 1G position. Mod. Phys. Lett. B 2022, 24, 256–264. [Google Scholar] [CrossRef]
  3. Arsenlis, A.; Cai, W.; Tang, M.; Rhee, M.; Oppelstrup, T.; Hommes, G.; Pierce, T.G.; Bulatov, V.V. Enabling strain hardening simulations with dislocation dynamics. Model. Simul. Mater. Sci. Eng. 2007, 15, 553–559. [Google Scholar] [CrossRef]
  4. Khorrami, M.; Hanzaki, A.Z.; Abedi, H.R.; Moallemi, M.; Mola, J.; Chen, G.H. On the effect of Mn-content on the strength-ductility balance in Ni-free high N transformation induced plasticity steels. Mater. Sci. Eng. A 2021, 814, 141260. [Google Scholar] [CrossRef]
  5. Kuhr, B.R.; Aifantis, K.E. Interpreting the inverse Hall-Petch relationship and capturing segregation hardening by measuring the grain boundary yield stress through MD indentation. Mater. Sci. Eng. A 2019, 745, 107–114. [Google Scholar] [CrossRef]
  6. Nie, W.J.; Shang, C.J.; Guan, H.L.; Zhang, X.B.; Chen, S.H. Control of microstructures of ferritebainite(F/B) dual-phase steels and analysis of their resistance to deformation behavior. Acta Metall. Sin. 2012, 3, 298–306. [Google Scholar] [CrossRef]
  7. Shang, C.J.; Wang, X.M.; Zhou, Z.J.; Liang, X.; Miao, C.L.; He, X.L. Evolution of intermediate transformation microstructures in Mn-Mo-Nb-B low carbon microalloyed steel. Acta Metall. Sin. 2008, 3, 287–291. [Google Scholar]
  8. Klueh, R.L.; Nasreldin, A.M. Microstructure and mechanical properties of a 3Cr-1.5Mo steel. Mater. Trans. A 1987, 18, 1279–1290. [Google Scholar] [CrossRef]
  9. Jiang, Z.; Wang, P.; Li, D.; Li, Y. Influence of the decomposition behavior of retained austenite during tempering on the mechanical properties of 2.25Cr-1Mo-0.25 V steel. Mater. Sci. Eng. A 2019, 742, 540–552. [Google Scholar] [CrossRef]
  10. Li, Z.; Xiao, N.; Li, D.; Zhang, J.; Luo, Y.; Zhang, R. Predictive value of APE1, BRCA1, ERCC1 and TUBB3 expression in patients with advanced non-small cell lung cancer (NscLc) receiving first-line platinum-paclitaxel chemotherapy. Acta Metall. Sin. 2014, 50, 777–786. [Google Scholar] [CrossRef]
  11. Yan, G.; Han, L.; Li, C.; Luo, X.; Gu, J. Characteristic of retained austenite decomposition during tempering and its effect on impact toughness in SA508 Gr.3 steel. J. Nucl. Mater. 2017, 483, 167–175. [Google Scholar] [CrossRef]
  12. Lan, L.; Qiu, C.; Zhao, D.; Gao, X.; Du, L. Analysis of microstructural variation and mechanical behaviors in submerged arc welded joint of high strength low carbon bainitic steel. Mater. Sci. Eng. A 2012, 558, 592–601. [Google Scholar] [CrossRef]
  13. Tian, D.; Karjalainen, L.P.; Qian, B.; Chen, X. Cleavage fracture model for granular bainite in simulated coarse-grained heat-affected zones of high-strength low-alloyed steels. JSME Int. J. Ser. A 1997, 40, 179–188. [Google Scholar] [CrossRef]
  14. Cui, P.C.; Xia, T.; Wang, Y.Q.; Jia, C.H.; Wang, H.L.; Bai, Q.Q.; Zheng, H.B.; Lai, Z.H.; Liu, Y.; Zhu, J.C.; et al. Uncovering the isothermal transformation dynamics and elemental diffusion behavior of reversed austenite in PH13-8Mo steel. Mater. Chem. Phys. 2024, 312, 128666. [Google Scholar] [CrossRef]
  15. Li, H.X.; Lee, C.W.; Venezuelaa, J.; Kimc, H.; Atrens, A. Hydrogen diffusion and hydrogen embrittlement of a 1500 MPa hot-stamped steel 22MnB5 in different austenitizing condition. Mater. Sci. Eng. A 2024, 897, 146349. [Google Scholar] [CrossRef]
  16. Santos, S.L.; Toloczko, F.R.; Silva, D.M.; Santos, S.F. Investigating the role of the austenitizing temperature and cooling rate on the martensitic transformation kinetics in a SAE 9254 spring steel. J. Alloys Metall. Syst. 2024, 5, 100065. [Google Scholar] [CrossRef]
  17. Jiang, Z.H.; Wang, P.; Li, D.Z.; Li, Y.Y. Effects of rare earth on microstructure and impact toughness of low alloy Cr-Mo-V steels for hydrogenation reactor vessels. J. Mater. Sci. Technol. 2020, 45, 1–14. [Google Scholar] [CrossRef]
  18. Farichild, D. A study concerning intercritical HAZ microstructure andtoughness in HSLA steels. Weld. J. 1991, 70, 321–329. [Google Scholar]
  19. Kim, B. Microstructure and local brittle zone phenomena in high.strength low-alloy steel welds. Metall. Trans. A 1991, 22, 139–149. [Google Scholar] [CrossRef]
  20. Williamson, G.K.; Hall, W.H. X-ray line broadening from field aluminium and wolfram. Acta Metall. 1953, 1, 22–31. [Google Scholar] [CrossRef]
  21. Gladman, T. On the theory of the effect of precipitate particles on grain growth in metals. Proc. R. Soc. Lond. Ser. A Math. Phys. Sci. 1966, 42, 298–309. [Google Scholar]
  22. Alexander, V.; Dmitry, S.; Semen, S.; Nikolay, K. Modeling of austenitization kinetics under continuous heating of steels with complex microstructure. Proc. Manuf. 2019, 37, 613–620. [Google Scholar] [CrossRef]
  23. Ding, Y.F.; Wu, M.J.; Li, Y.P.; Sun, Y.D.; Zhao, Y.L.; Ran, G. Quantitative in-situ investigation of dislocation loop motion inFe9Cr1.5W ferritic/martensitic steel under the coupling effects of constant stress and irradiation. J. Nucl. Mater. 2024, 598, 155166. [Google Scholar] [CrossRef]
  24. Xie, Z.J.; Han, G.; Zhou, W.H.; Zeng, C.Y.; Shang, C.J. Study of retained austenite and nano-scale precipitation and their effects on properties of a low alloyed multi-phase steel by the two-step intercritical treatment. Mater. Charact. 2016, 113, 60–66. [Google Scholar] [CrossRef]
  25. Okada, H.; Matsuda, F.; Lkeuchi, K.; Li, Z. Decomposition behaviour of M-A constituent and recovery of toughness deterioration of HAZ toughness in 780 and 980 MPa class HSLA steels welded with high heat inputs and its improvement. Weld. Int. 1995, 9, 211–216. [Google Scholar] [CrossRef]
  26. Zener, C. Theory of growth of spherical precipitates from solid solution. J. Appl. Phys. 1949, 20, 950–953. [Google Scholar] [CrossRef]
  27. Davenport, A.T.; Brossard, L.C.; Miner, R.E.J.J. Precipitation in microalloyed high-strength low-alloy steels. JOM 1975, 27, 21–27. [Google Scholar] [CrossRef]
  28. Melnyk, C.; Grant, D.; Keener, S.G.; Ganser, R.V.; Schroeder, S. Improving the properties of cryomilled light alloys using spark plasma sintering and hot isostatic pressing. JOM 2011, 63, 65–68. [Google Scholar] [CrossRef]
  29. Zhang, Y.; Hou, H. Effects of Nb on microstructure and continuous cooling transformation of coarse grain heat-affected zone in 610MPa class HSLA structural steels. Mater. Sci. Eng. A 2009, 499, 182–186. [Google Scholar] [CrossRef]
  30. Kim, D.W.; Kwon, D.Y.; Kang, J. Strengthening of high nitrogen austenitic stainless steel by Nb addition. Mater. Charact. 2024, 209, 113776. [Google Scholar] [CrossRef]
  31. Pereda, B.; Rodriguez-Ibabe, J.M.; López, B. Improved model of kinetics of strain induced precipitation and microstructure evolution of Nb microalloyed steels during multipass rolling. ISIJ Int. 2008, 48, 1457–1466. [Google Scholar] [CrossRef]
  32. Iza-Mendia, A.; Gutierrez, I.J.M.S. Generalization of the existing relations between microstructure and yield stress from ferrite-pearlite to high strength steels. Mater. Sci. Eng. A 2013, 561, 40–51. [Google Scholar] [CrossRef]
  33. Pickering, F.B. Physical metallurgy and the design of steels. Phys. Metall. Des. Steel 1978, 23, 90–100. [Google Scholar]
  34. Yan, Z.; Zou, K.; Cheng, M.P.; Zhou, Z.P.; Song, L.J. Revealing relationships between heterogeneous microstructure and strengthening mechanism of austenitic stainless steels fabricated by directed energy deposition. J. Mater. Res. Technol. 2021, 15, 582–594. [Google Scholar] [CrossRef]
  35. Kestenbach, H.J.; Campos, S.S.; Gallego, J.; Morales, E.V. Discussion of “Precipitation behavior and its effect on strengthening of an HSLA-Nb/Ti steel”. Metall. Mater. Trans A 2003, 34, 1013–1017. [Google Scholar] [CrossRef]
Figure 1. (a) Schematic of heat treatments for HSLA steel, the “austenite hold” indicates thermal insulation in the austenite region and the “ferrite + austenite hold” indicates thermal insulation in the ferrite and austenite two-phase region. (b) DSC patterns of the experimental steel for the hot-rolled state.
Metals 14 00850 g001
Figure 2. SEM micrographs of the normalised samples, (a,b) hot-rolled sample, (c) 809-10, (d) 809-20, (e) 824-20, and (f) 839-20. “F”, “P”, and “M–A” represent ferrite, pearlite, and martensite–austenite, respectively.
Metals 14 00850 g002
Figure 3. The results of uniaxial tests; (a) the strain–stress curve of the hot-rolled, 809-10, 824-10, and 839-10 samples; (b) the strain–stress curve of the hot-rolled, 809-20, 824-20, and 839-20 samples.
Metals 14 00850 g003
Figure 4. Inverse pole figures, grain boundary distribution maps, and grain boundary misorientation distribution maps for the hot-rolled and heat-treated samples, (ac) hot-rolled sample, (df) 809-10, (gi) 809-20, (jl) 824-20, and (mo) 839-20.
Metals 14 00850 g004
Figure 5. Kernel average misorientation maps of the samples, (a) hot-rolled sample, (b) 809-10 (c) 809-20, (d) 824-10, and (e) 838-20.
Metals 14 00850 g005
Figure 6. XRD patterns of the hot-rolled and heat-treated samples.
Metals 14 00850 g006
Figure 7. TEM images of investigated samples, (a) the microtopography of hot-rolled sample, (b) the precipitate in hot-rolled sample, (c) the EDS pattern of precipitate, (d) the morphology of M–A islands for the hot-rolled sample in bright field, (e) the morphology of M–A islands for the hot-rolled sample in dark field, and (f) the morphology of M–A islands for the 809-20 sample.
Metals 14 00850 g007
Figure 8. TEM image of sample after different austenitizing conditions, (a,b) 809-20, (c) 809-10, (d) the image of precipitate in the 809-20 sample, and (e) the result of line scan for the precipitate in (d,f) the EDS pattern of precipitate in the 809-20 sample.
Metals 14 00850 g008
Figure 9. (a) Precipitate image in the 809-20 sample, (b) EDS elemental mapping analysis of the precipitate, (c) HRTEM image of precipitate’s centre region, (d) FFT image corresponding centre region of precipitate, (e) IFFT image of precipitate’s centre region, (f) HRTEM image of precipitate’s edge region, (g) FFT image corresponding edge region of precipitate, and (h) IFFT image of precipitate’s edge region.
Metals 14 00850 g009
Table 1. Chemical composition of the investigated HSLA steel (wt.%).
CSiMnPTiCrSMoNbFe
0.30.251.390.0070.150.30.0030.190.04Bal.
Table 2. Yield strength, tensile strength, and elongations of the samples in different conditions from the tensile tests.
SampleRot-rolled809-10809-20824-10824-20839-10839-20
Yield strength/MPa564443583551445416463
Tensile strength/MPa751693843798775705767
Elongation/%8252116.52018.519.5
Table 3. Average effective grain size, dislocation density, and average precipitate size of the samples in different conditions.
SampleAverage Effective Grain Size/μmDislocation Density/nm−2Average Large Precipitate Size/nmAverage Small Precipitate Size/nm
Rot-rolled6.261.26 × 10−2109.588.56
809-104.350.491 × 10−2113.438.83
809-203.680.906 × 10−2115.689.28
824-205.350.641 × 10−2121.3212.21
839-207.260.437 × 10−2126.7413.52
Table 4. The calculation results of the austenite transformation fraction at specific austenitizing temperature and time.
SampleAustenite Transformation Fraction/%
By Model in Reference [19]By JMatPro
809-1041.549.1
809-2087.693
824-20100100
839-20100100
Table 5. The calculation results of dislocation hardening, grain refining hardening, precipitate hardening, and yield strength σy.
SamplePrecipitation Hardening/MPaGrain Refining Hardening/MPaDislocation Hardening/MPaσy
Rot-rolled50.32279.7224.6595.36
809-1064.99335.6126.18566.23
809-2065.91364.8171.36643.36
824-2066.19302.6144.10556.75
839-2066.43259.8119.02496.65
Disclaimer/Publisher’s Note: The statements, opinions and data contained in all publications are solely those of the individual author(s) and contributor(s) and not of MDPI and/or the editor(s). MDPI and/or the editor(s) disclaim responsibility for any injury to people or property resulting from any ideas, methods, instructions or products referred to in the content.

