Article

Passivation Behavior of Chromium Alloyed High-Strength Rebar in Simulated Concrete Pore Solution

1
College of Materials and Metallurgy, Guizhou University, Guiyang 550025, China
2
Guizhou Provincial Key Laboratory of Metallurgical Engineering and Process Energy Saving, Guiyang 550025, China
3
Shougang Shuicheng Steel (Group) Co., Ltd., Liupanshui 553000, China
*
Author to whom correspondence should be addressed.
Metals 2024, 14(8), 859; https://doi.org/10.3390/met14080859
Submission received: 21 June 2024 / Revised: 17 July 2024 / Accepted: 25 July 2024 / Published: 26 July 2024

Abstract

:
In this study, SEM, AFM, TEM, XPS, and electrochemical tests are used to study the passivation behavior of chromium alloyed high-strength rebar in simulated concrete pore (SCP) solutions with different pH values. The results show that after passivation in SCP solution with different pH values, the passivating film on the surface of the chromium alloyed rebar primarily consists of a layer of nanoscale oxide particles, which makes the passive film exhibit a p-n type semi-conductor, and the passive film presents a rhombohedral crystal structure. As the pH value of the SCP solution decreases, the nanoscale oxide particles on the surface of the rebar become denser, which leads to a reduction in the carrier density (Nq and Na) of the passive film and an increase in film resistance (R2) and charge transfer resistance (R3), thus increasing the corrosion resistance of the passive film. The passive film on the surface of the chromium alloyed high-strength rebar predominantly exhibits a three-layer structure, the outer passive film layer is composed of Fe oxides, the stable layer of the passive film is composed of Fe oxides and Cr oxides, and the growth layer of inner passive film is composed of Cr oxides. Compared with passivation 10 d in SCP solutions with pH 13.5 and pH 12.5, the passive film on the surface of the rebar has good stability at pH 10.5, which indicates that the addition of Cr is beneficial to promote the corrosion resistance of the rebar.

1. Introduction

High-strength rebar serves as a crucial supporting element within the structural backbone of concrete structures and is extensively used in major civil engineering structures, including bridges and high-rise buildings [1,2]. However, in practical applications, the corrosion of rebar caused by concrete carbonization and chloride ion erosion will destroy the reinforced concrete structure, resulting in huge economic losses [2,3,4]. Therefore, it is of great significance to study the passivation behavior of chromium alloyed high-strength rebar under simulated concrete pore solution for the durability design and service life prediction of reinforced concrete structures.
In reinforced concrete, a nanoscale (<10 nm) and dense iron oxide protective film is spontaneously formed on the surface of the rebar. The passive film has excellent corrosion resistance and rapid healing performance [5,6,7,8,9], which can reduce the corrosion rate of the rebar surface and put it in a passivation state [10]. However, when the rebar is exposed to a concrete carbonation environment, the passive film will be invaded and destroyed, and its protective performance will be reduced [11,12,13,14,15], which has a strong correlation with microstructure defects (such as strain-induced martensite) and corrosion damage [5], especially in the weak area of the passive film. Therefore, Xu et al. [16] studied the fine structure of the passive film at the atomic scale and found that there were ion channels in the passive film, which formed defect areas and concentrated chloride ion erosion in the corrosion.
Many studies have reported the formation and structure of the passive film. Ai et al. [17] explored the composition and structural depth distribution of the passive film of the alloy corrosion-resistant steel Cr10Mo1 when simulating the pore solution of concrete with diverse pH values. They analyzed the influence kinetics of pH on the growth and formation of the passive film. The research shows that the growth and formation process of the passive film on the steel surface can be explained by the dissolution–precipitation reaction mechanism. Loh et al. [18] used in situ electron microscopy to study the natural nucleation and growth process of nanocrystals in aqueous solution, which is helpful to understand the nucleation and growth process of passive film on rebar. However, the growth and failure process of the passive film has not been clearly confirmed. Yuan et al. [7], Sun et al. [8], and Massoud et al. [9] also explored the structure of the passive film of micro-alloyed steel. The results found that the passive film can be divided into inner and outer layers, and Fe was enriched in the outer layer and Cr was enriched in the inner layer. However, there is still a lack of sufficient research to explore the microstructure of the passive film. Freire et al. [19], Fattah–Alhosseini et al. [20], and Ai et al. [21] explored the effect of pH value on the chemical composition and electrochemical properties of the passive film of Cr series alloy steels, and the results found that Cr series alloy steels with different pH values showed different passivation properties. However, there are few reports on the further study of the kinetics and mechanism of passive film formation under the influence of carbonization in Cr alloy steel. Therefore, it is of great significance to explore the passivation behavior of chromium alloyed high-strength rebar under simulated concrete pore solution.
In this paper, the passivation behavior of chromium alloyed high-strength rebar in SCP solution with different pH was studied. The surface morphology of the passive film was characterized by AFM. The phase composition of the passive film was characterized by XPS. At the same time, the electrochemical impedance test and capacitance-potential (Mott–Schorrky curve) test were carried out by an electrochemical workstation to explore the effect of SCP solution with different pH on the corrosion resistance of rebar passive film. Through the research of this paper, it can provide some theoretical reference for the durability design and service life prediction of reinforced concrete structures.

2. Experimental Procedures

2.1. Material Preparation

The experimental material came from HRB500E rebar, which was provided by Shougang Shuicheng Steel (Group) Co., Ltd., Liupanshui City, Guizhou Province, China. The diameter of the rebar is 22 mm (Φ22 mm), the chemical composition of the rebar is detected by inductively coupled plasma-optical emission spectrometry, the carbon–sulfur analysis instrument, and the nitrogen–hydrogen–oxygen analysis instrument, and the composition of rebar is given in Table 1. The yield strength (ReL) of the rebar is 545 MPa, the tensile strength (Rm) is 685 MPa, the ratio of strength to yield (ReL/Rm) is 1.26 and the elongation is 22%. The current national standard (GB/T 1499.2-2018 [22]) stipulates that the carbon content should be less than 0.25 wt.% in order not to reduce the welding carbon of rebar, to regulate the microstructure of rebar, and to obtain high volume fraction precipitates.
In the preparation of rebar samples, the electric spark numerical control wire cutting machine is used to cut the samples of the required size from the rebar, so as to avoid the influence of the surface oxide layer on the experiment. All rebar test samples (electrochemical test samples are de-rusted and then inlaid with epoxy resin before grinding and polishing) are ground step by step with SiC paper of 180 to 2000 particle size, and polished to a mirror-like surface with a diamond polishing agent of 1.5 μm and 0.5 μm. Then the surface of samples is cleaned using deionized water and alcohol cleaning, and finally dried and set aside for further use.

2.2. Simulated Solution

In C50 high-strength concrete, cement often contains a small amount of soluble strong alkali (Na2O and K2O), and it can provide a large amount of Ca(OH)2 after hydration, so that the pH of concrete pore fluid can reach more than 13. When the concrete is completely carbonized, the pH value is 8.5–9.0 [3].
The SCP solution in Table 2 is used to simulate the real environment of rebar in concrete. The No.1 solution simulates an uncarbonated concrete environment, while the No.2 and No.3 solutions simulate conditions of micro-carbonized or a concrete environment where the pH value is reduced, due to the improper preparation of inferior aggregates or concrete. The chemicals of this experiment (Ca(OH)2, NaOH, KOH, and NaHCO3) are all analytically pure, and are provided by the Chemical Reagent Co., Ltd. (Tianjin, China) of the State Pharmaceutical Group.
The steps of SCP solution are as follows: RO water, prepared by laboratory ultrapure water mechanism, is used as deionized water. When preparing saturated calcium hydroxide (Ca(OH)2) solution, NaOH and KOH are added to adjust the high pH value, and sodium bicarbonate (NaHCO3) is added to adjust the low pH value. In order to reduce the effect of carbonation of CO2 in the air on the SCP, an appropriate amount of Ca(OH)2 powder is added to the bottom of the No.1 and No.2 solutions. Moreover, the pH value of the No.3 solution is corrected every 3 days.

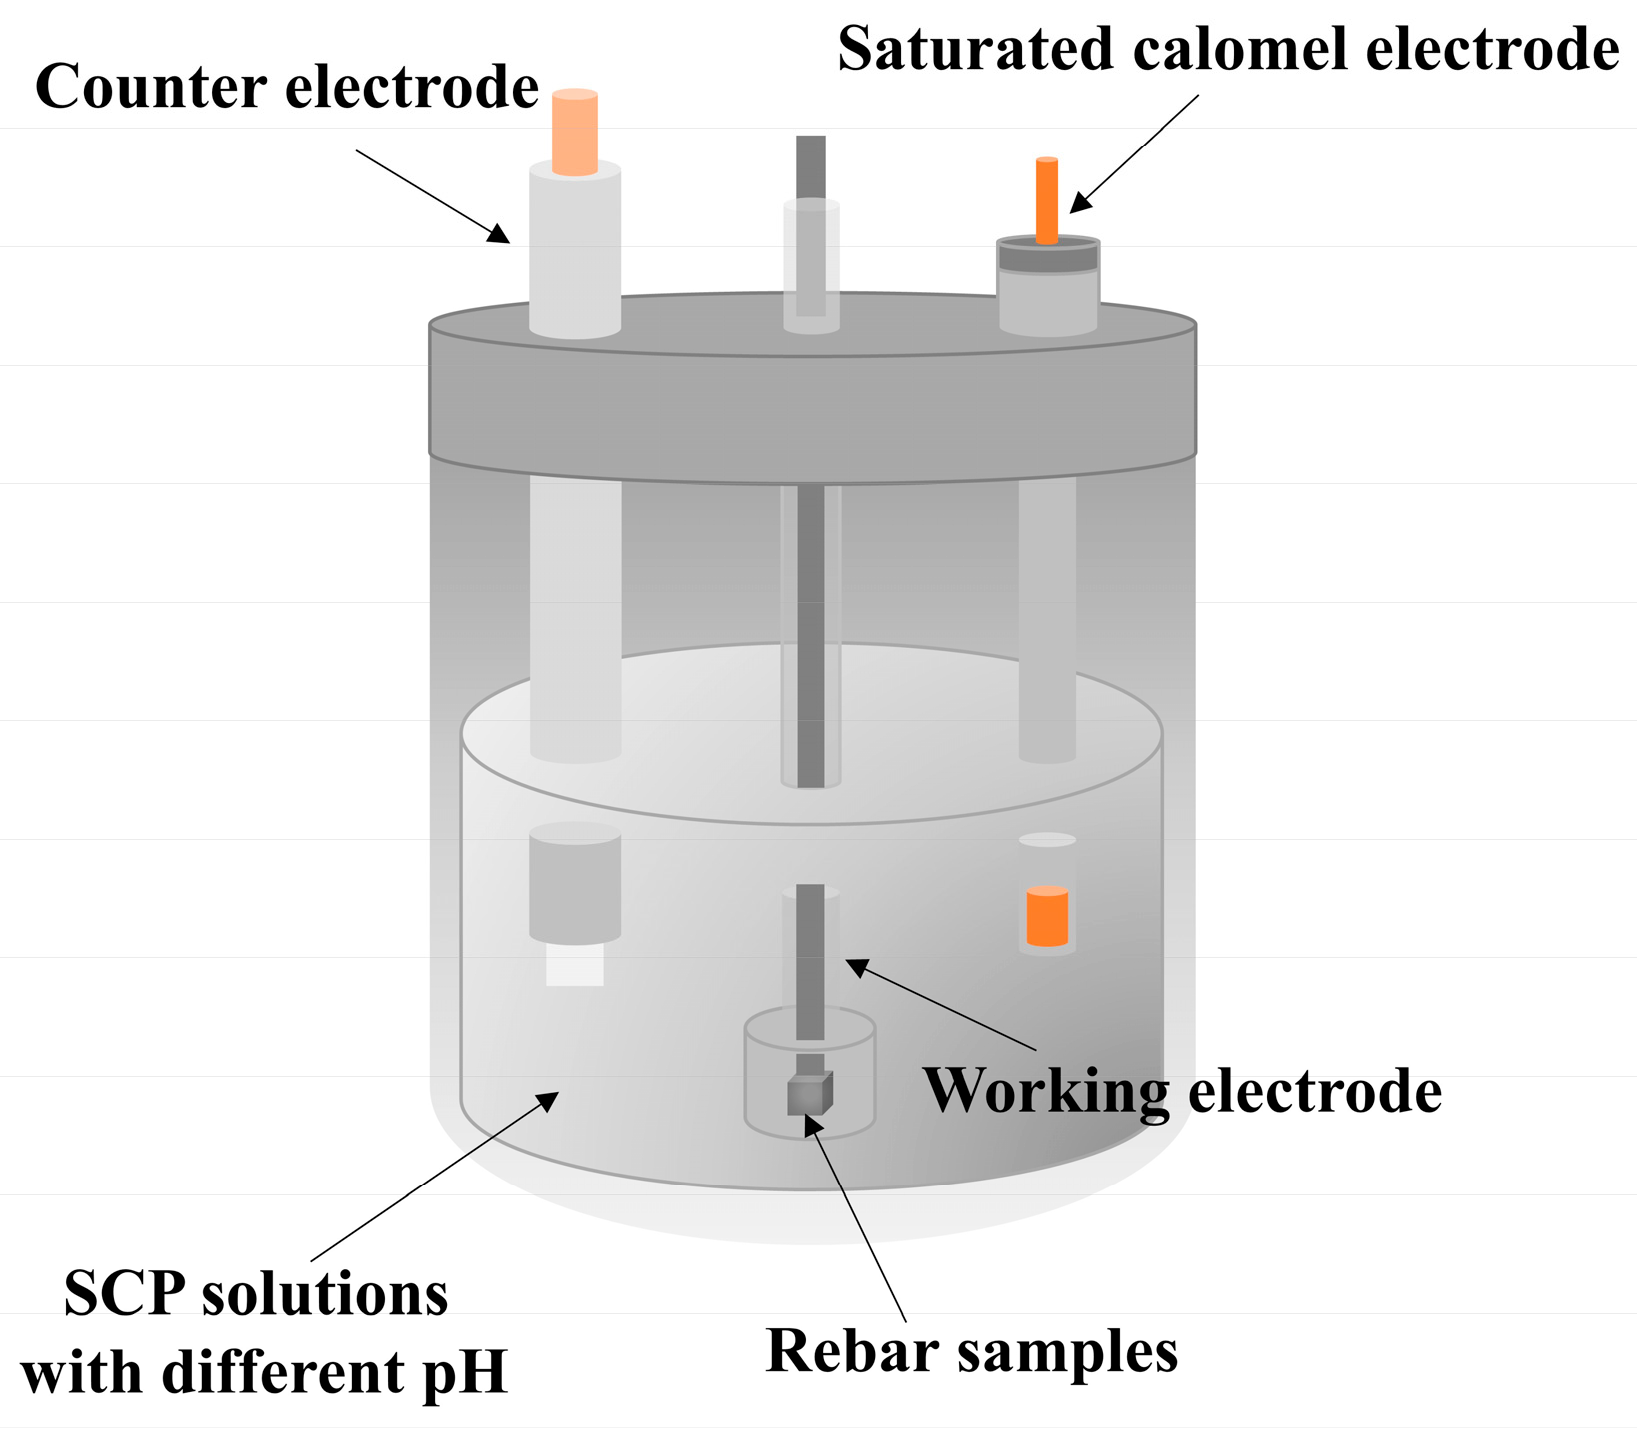
2.3. Electrochemical Test

Electrochemical measurements are performed on an electrochemical workstation (CHI660D 412081, Shanghai Chenhua Instrument Co., Ltd., Shanghai, China) using a classic three-electrode system at 25 °C water bath. The size of the electrochemical test sample is 10 mm × 10 mm × 5 mm, and a 100 mm long nickel sheet is spot-welded on the back of the sample as the electrode wire. Then the sample is covered with a polytetrafluoroethylene tube with a diameter of 5 mm, embedded in an epoxy resin. The exposed working area is 10 mm × 10 mm. The exposed working area is used as the working electrode (WE), the platinum electrode as the counter electrode (CE), and the saturated calomel electrode (SCE) as the reference electrode (RE). The open circuit potential (OCP) test time is not less than 1800 s. All electrochemical tests in this paper are carried out in a water bath environment at 25 °C, beginning after the OCP stabilized, and Figure 1 is the electrochemical test device.
The Mott–Schottky curve is tested with a fixed frequency of 1000 Hz, a sinusoidal voltage excitation signal with a disturbance range of 10 mV vs. OCP, a test potential of −1.0~1.0 V vs. OCP, and a scanning rate of 50 mV s−1. Electrochemical impedance spectroscopy (EIS) has two corresponding forms of Nyquist diagram and Bode diagram. In order to obtain the corresponding electroc hemical impedance parameters of the electrode system, the appropriate equivalent circuit is selected. Z View software (Version: 3.1) is used to fit the impedance spectra. According to the electrochemical impedance parameters, the control factors and mechanism of the electrochemical reaction process can be analyzed. In this paper, the amplitude of electrochemical impedance spectroscopy is ±5 mV vs. OCP, and the test frequency range is 100 kHz~10 mHz.

2.4. Characterization Method

The MIRA LMS scanning electron microscope (SEM) (TESCAN, Czech) and energy dispersive spectrometer (EDS) are used to analyze the experimental rebar samples. The surface and cross-sectional structures of the passive film are observed under an accelerated voltage of 15 kV, and the element distribution is characterized by EDS.
The change in surface morphology of the passive film on the rebar is observed using Dimension ICON AFM (Bruker Company, Billerica, MA, USA). The Dimension ICON atomic force microscope, produced by Bruker Company of Germany, is utilized. AFM results are analyzed using NanoScope Analysis software (Version: 1.5).
Strata 400S focused ion beam scanning electron microscope (FIB-SEM) (Feiyu Technology Co., Ltd., Guilin, China) is used. Because the passive film is relatively thin, generally less than 10 nm, its structure is not easily observable using conventional analysis methods. The JEM 2100F transmission electron microscope (TEM) (Japan Electronics Co., Ltd., Tokyo, Japan) samples are prepared by FIB-SEM. The obtained samples are observed by TEM to observe the cross-sectional structure of the passive film. Additionally, a Fourier transform (FFT) of Digital Micrograph software (Version: 8.1.0.147) is applied to the region of the passive film to analyze its crystal structure.
A Thermo Scientific K-Alpha X-ray photoelectron spectrometer (XPS) (Thermo Fisher Scientific, Waltham, MA, USA) is used, and the excitation source is Al Kα ray. The test is carried out at 12 kV operating voltage and 6 mA filament current. The full spectrum scanning pass energy is 100 eV, and the step size is 1 eV. The fine spectral scanning energy is 50 eV and the step size is 0.1 eV. The charge correction is performed according to the standard C1s peak (284.8 eV), and the data analysis is performed using Thermo Advantage software (Version: 5.948). The peak fitting is performed using the Smart back-off method and the Gaussian–Lorentzian product function.

3. Results and Analysis

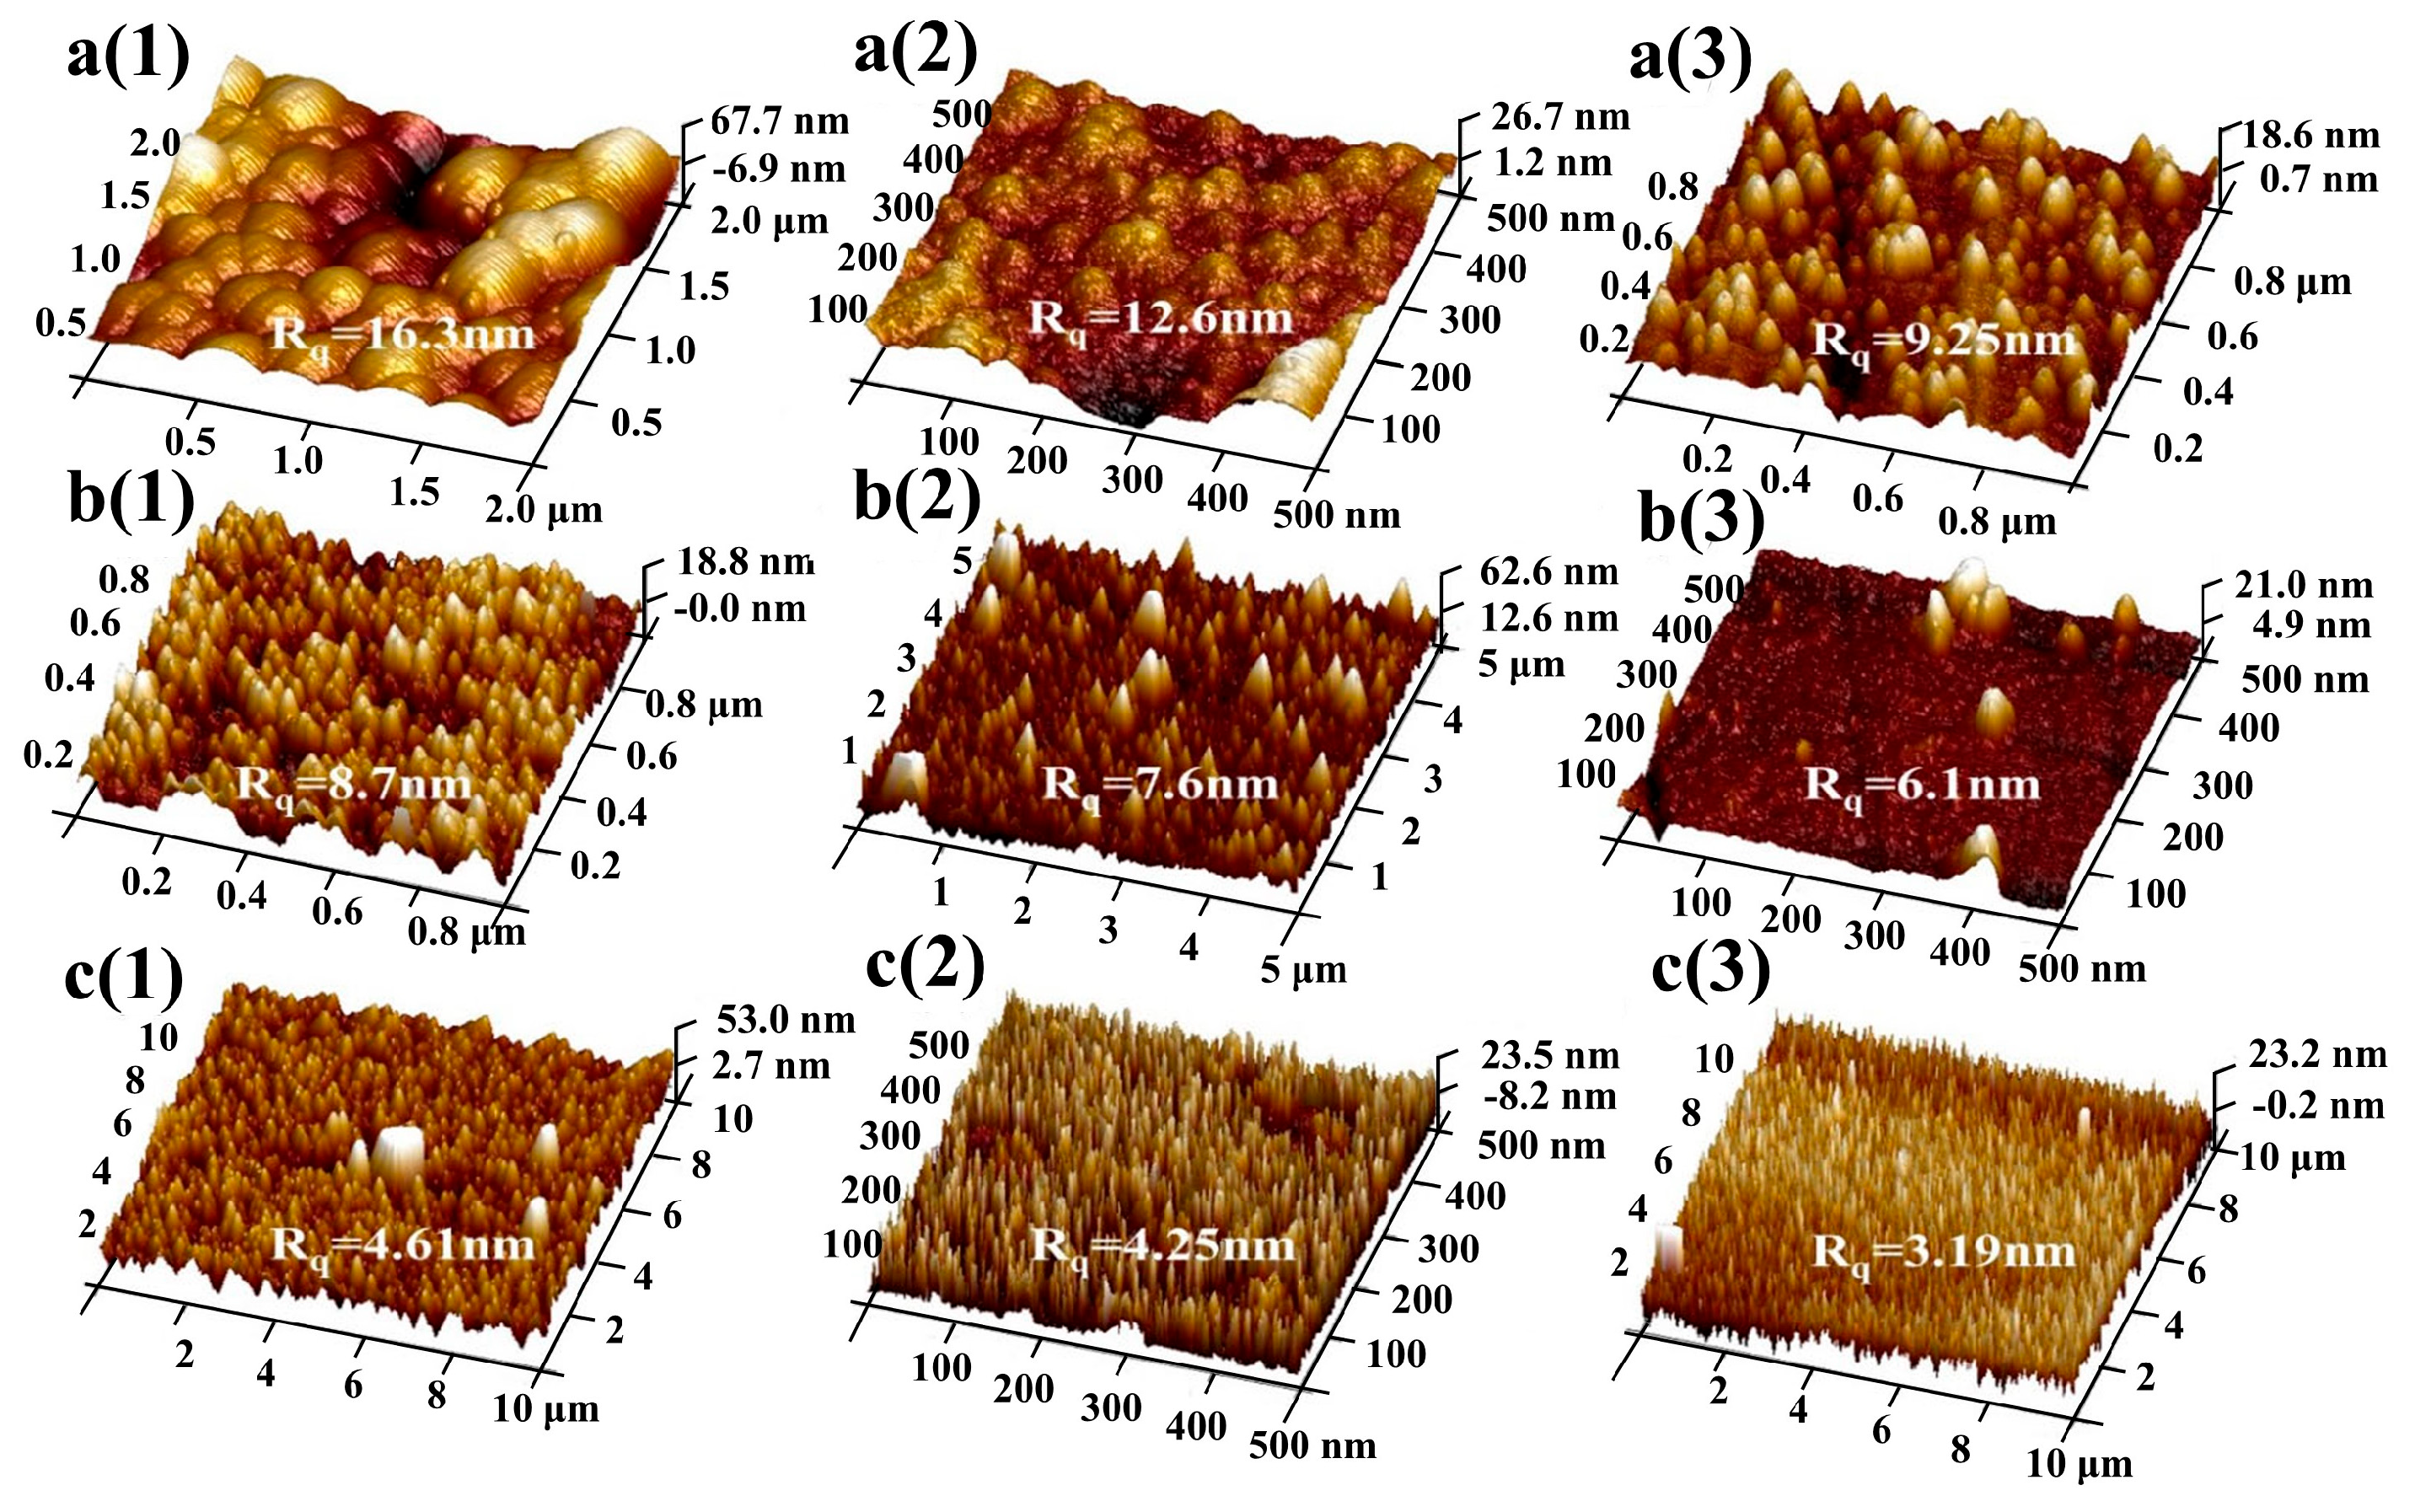
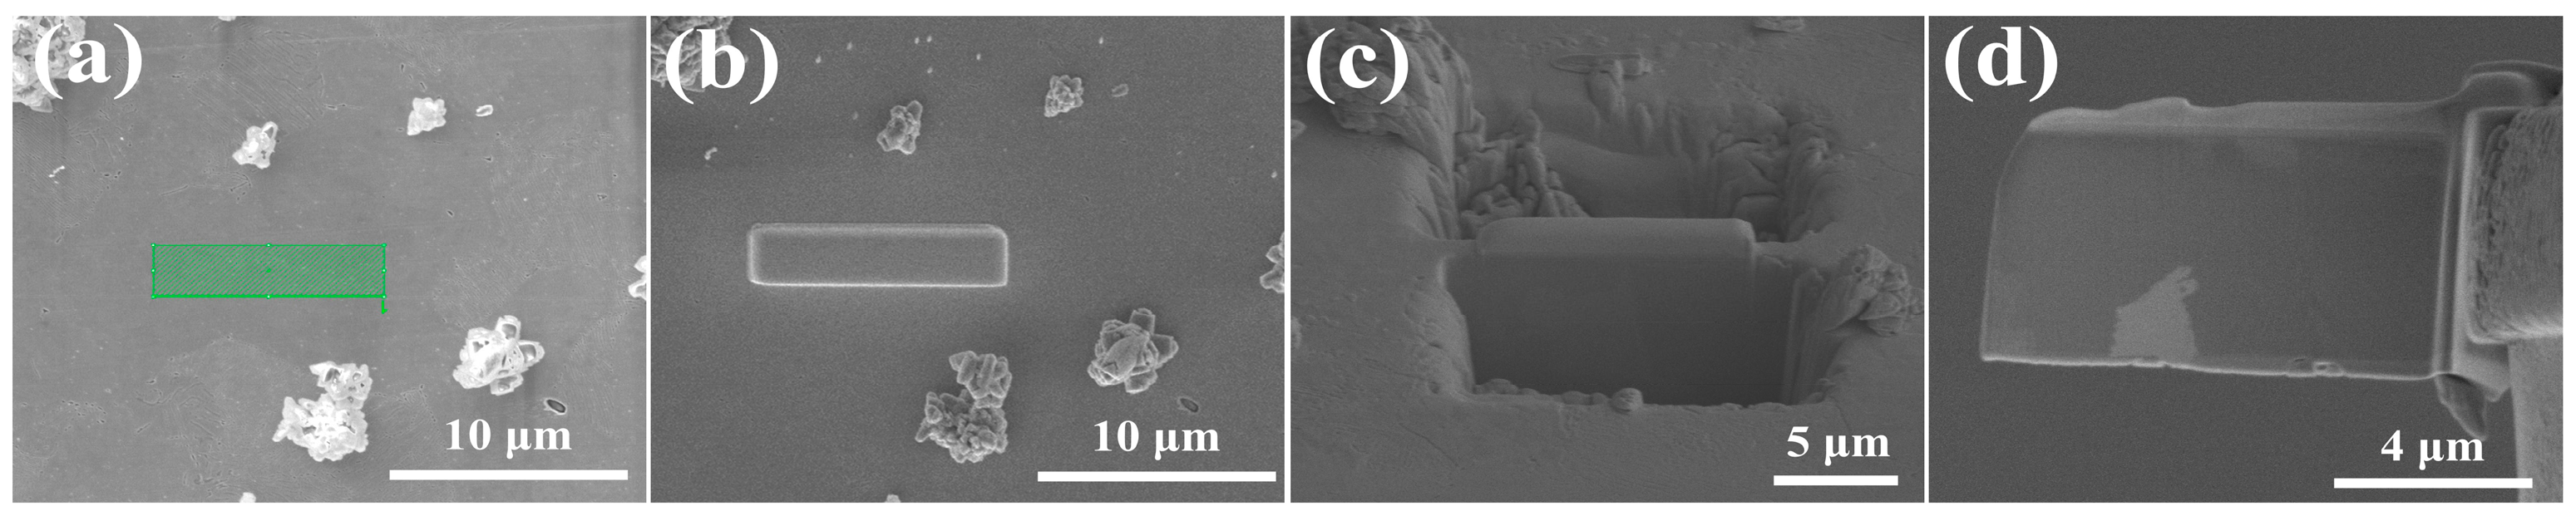
3.1. Morphology Analysis of Passive Film

The SEM morphology of the rebar immersed in SCP solution with pH 10.5 for 10 d is shown in Figure 2.
It can be seen from Figure 2a–c that in the SCP solution with pH 10.5, the passive film formed on the surface of the rebar is mainly composed of a micro-crack area and calcium-rich precipitate. The micro-gap area is formed after the induced corrosion of pearlite lamellae in the initial stage of passivation, and the flatter surface area is the ferrite area. Combined with Figure 2b, the passive film formed in the flatter area of Figure 2a is not flatly covered, displaying numerous nanoscale granules on the rebar surface, with additional calcium-rich precipitates present in certain areas.
Figure 3 shows the local AFM morphology of the passive film of the rebar after passivation in SCP solution with different pH values for various days. It can be seen from Figure 3 that the surface of the rebar is covered with nanoscale particles, showing a continuous small mountain peak shape, and there are low-lying valleys similar to basins in some areas. In the solution with different pH values, with increased immersion time, the passive film on the surface of the rebar gradually becomes flat, the surface roughness (Rq) of the passive film also decreases, and the passive film gradually becomes dense. The passive film on the rebar surface becomes flatter and denser as the immersion time increases, resulting in a decrease in surface roughness (Rq). According to the relevant references [3,23], the passive film on the surface of the rebar exhibits good stability and corrosion resistance after passivation in SCP solution for 10 d. This indicates that the formation of a layer of dense nanoscale particles on the surface of the micro-alloyed rebar effectively increases the compactness of the passive film, makes the surface smooth of the passive film, and the passive film combines closely with the rebar matrix, thereby improving the corrosion resistance of the rebar.

3.2. Structure Analysis of Passive Film

After the rebar samples were immersed in SCP solution with pH 10.5 for 10 d, the TEM samples of the cross-section of the rebar passive film were prepared by FIB-SEM. Then the cross-section of the passive film was observed by transmission electron microscopy. The preparation process is shown in Figure 4.
Using digital micrograph software to analyze the high-resolution photos taken under TEM, it can be obtained that after passivation in the SCP solution with pH 10.5 for 10 d, the average thickness of the passive film of the rebar is 3.72 nm, and the average atomic grain size is 0.24 nm. The microstructure of the passive film observed under TEM is shown in Figure 4.
The overall structure of the passive film and its uneven fluctuations are shown in Figure 5a. Figure 5a indicates that the thickness of the passive film varies across different regions, with fluctuations that cover the surface of the rebar. This phenomenon indicates that the passive film is not uniformly protective, and may be easily destroyed in some thin areas, leading to pitting corrosion. The diffraction spots in Figure 4a reveal that the crystal structure of the rebar matrix in this area is a cubic crystal system. Additionally, the passive film area is a rhombohedral crystal system.
Figure 5b reveals more details of the appearance of the passive film and the differences in crystal properties between the layers. There are large continuous crystals in this passive film with a complex multi-layer structure. According to the crystal arrangement and color, the passive film can be divided into three layers. Compared with the traditional single-layer and double-layer structure models [5,7,9,24], this precise stratification more systematically distinguishes the inner layer of the passive film and its contact surface with the metal. In the physical sense, the passive film from the inside to the outside can be named the inner passive film growth layer (I), passive film stability layer (II), and outer passive film layer (III).
Figure 5b indicates that there are still large atomic clusters in the stable layer (II) of the passive film of the experimental rebar. According to references [16,25], atomic clusters can provide carriers for the continuous growth of passive film and the conversion between different layers. During the passivation process, atomic clusters undergo an ‘order–disorder–new order’ transition. Therefore, it can be inferred that the stable layer (II) is still in an unstable growth state or in a disordered state in an ordered–disordered transition. At the same time, significant differences in the crystal orientation of the passive film were observed at adjacent positions. This is because the metal matrix itself is polycrystalline, and the growth of the orientation of the metal oxide in the passive film corresponds to the orientation of the metal. This characteristic will affect the growth law and performance of the passive film. At the junction of the crystal orientation region, the crystal structure is easily invaded or destroyed by external harmful ions. As a weak area, its structural morphology should be the controlling factor affecting the overall performance of the passive film. The above results show the precise multi-layer structure and growth law of the passive film, which can be used to understand the anti-corrosion mechanism of the passive film in detail.
Figure 6 displays the morphology and EDS of the passive film after immersion in the SCP solution with pH 10.5 for 10 d. In this study, FIB-SEM is used to prepare the passive film on the surface of the rebar, and a layer of platinum (Pt) is plated on the surface of the passive film to prevent the separation of the passive film from the matrix. It can be observed from Figure 6 that the boundary between the platinum layer and the passive film is obvious. The distribution of Fe and O in the passive film is relatively sufficient. The Pt is rarely divided in the passive film, and the passive film layer has a good connection with the substrate. The passive film area also contains a trace amount of carbon (C), Cr, and manganese (Mn).
In the above analysis, the complete passive film structure of rebar in low alkaline SCP solution with pH 10.5 is shown in Figure 7. The passive film is primarily composed of three layers, which are the inner passive film growth layer, the passive film stability layer, and the outer passive film layer from the inside to the outside. Firstly, the polygonal structure in the diagram is a thick passivation layer covering one or more layers on the surface of the rebar substrate after the corrosion induced by inert inclusions. Secondly, the white convex area is a calcium-rich precipitate. Finally, a large number of small particles can be found on the surface of the rebar matrix, which is formed by the cementite layer in the pearlite-induced corrosion and covered on the surface of the rebar matrix. In some areas, there are still relatively large particles of micron size, which are mainly related to calcium-rich precipitates. In addition, there are also some calcium-rich precipitates and rust layers mixed in the continuously distributed particles. In addition, integrating the structure diagram of the passive film in Figure 7 with the element distribution of the passive film structure in Figure 6, it is found that the outer layer of the passive film on the surface of chromium alloyed rebar is mainly composed of Fe oxide, the intermediate stable layer of the passive film is mainly composed of Fe oxide and Cr oxide, and the inner growth layer of the passive film is primarily composed of Cr oxide. These compositions significantly enhance the stability of the passive film.

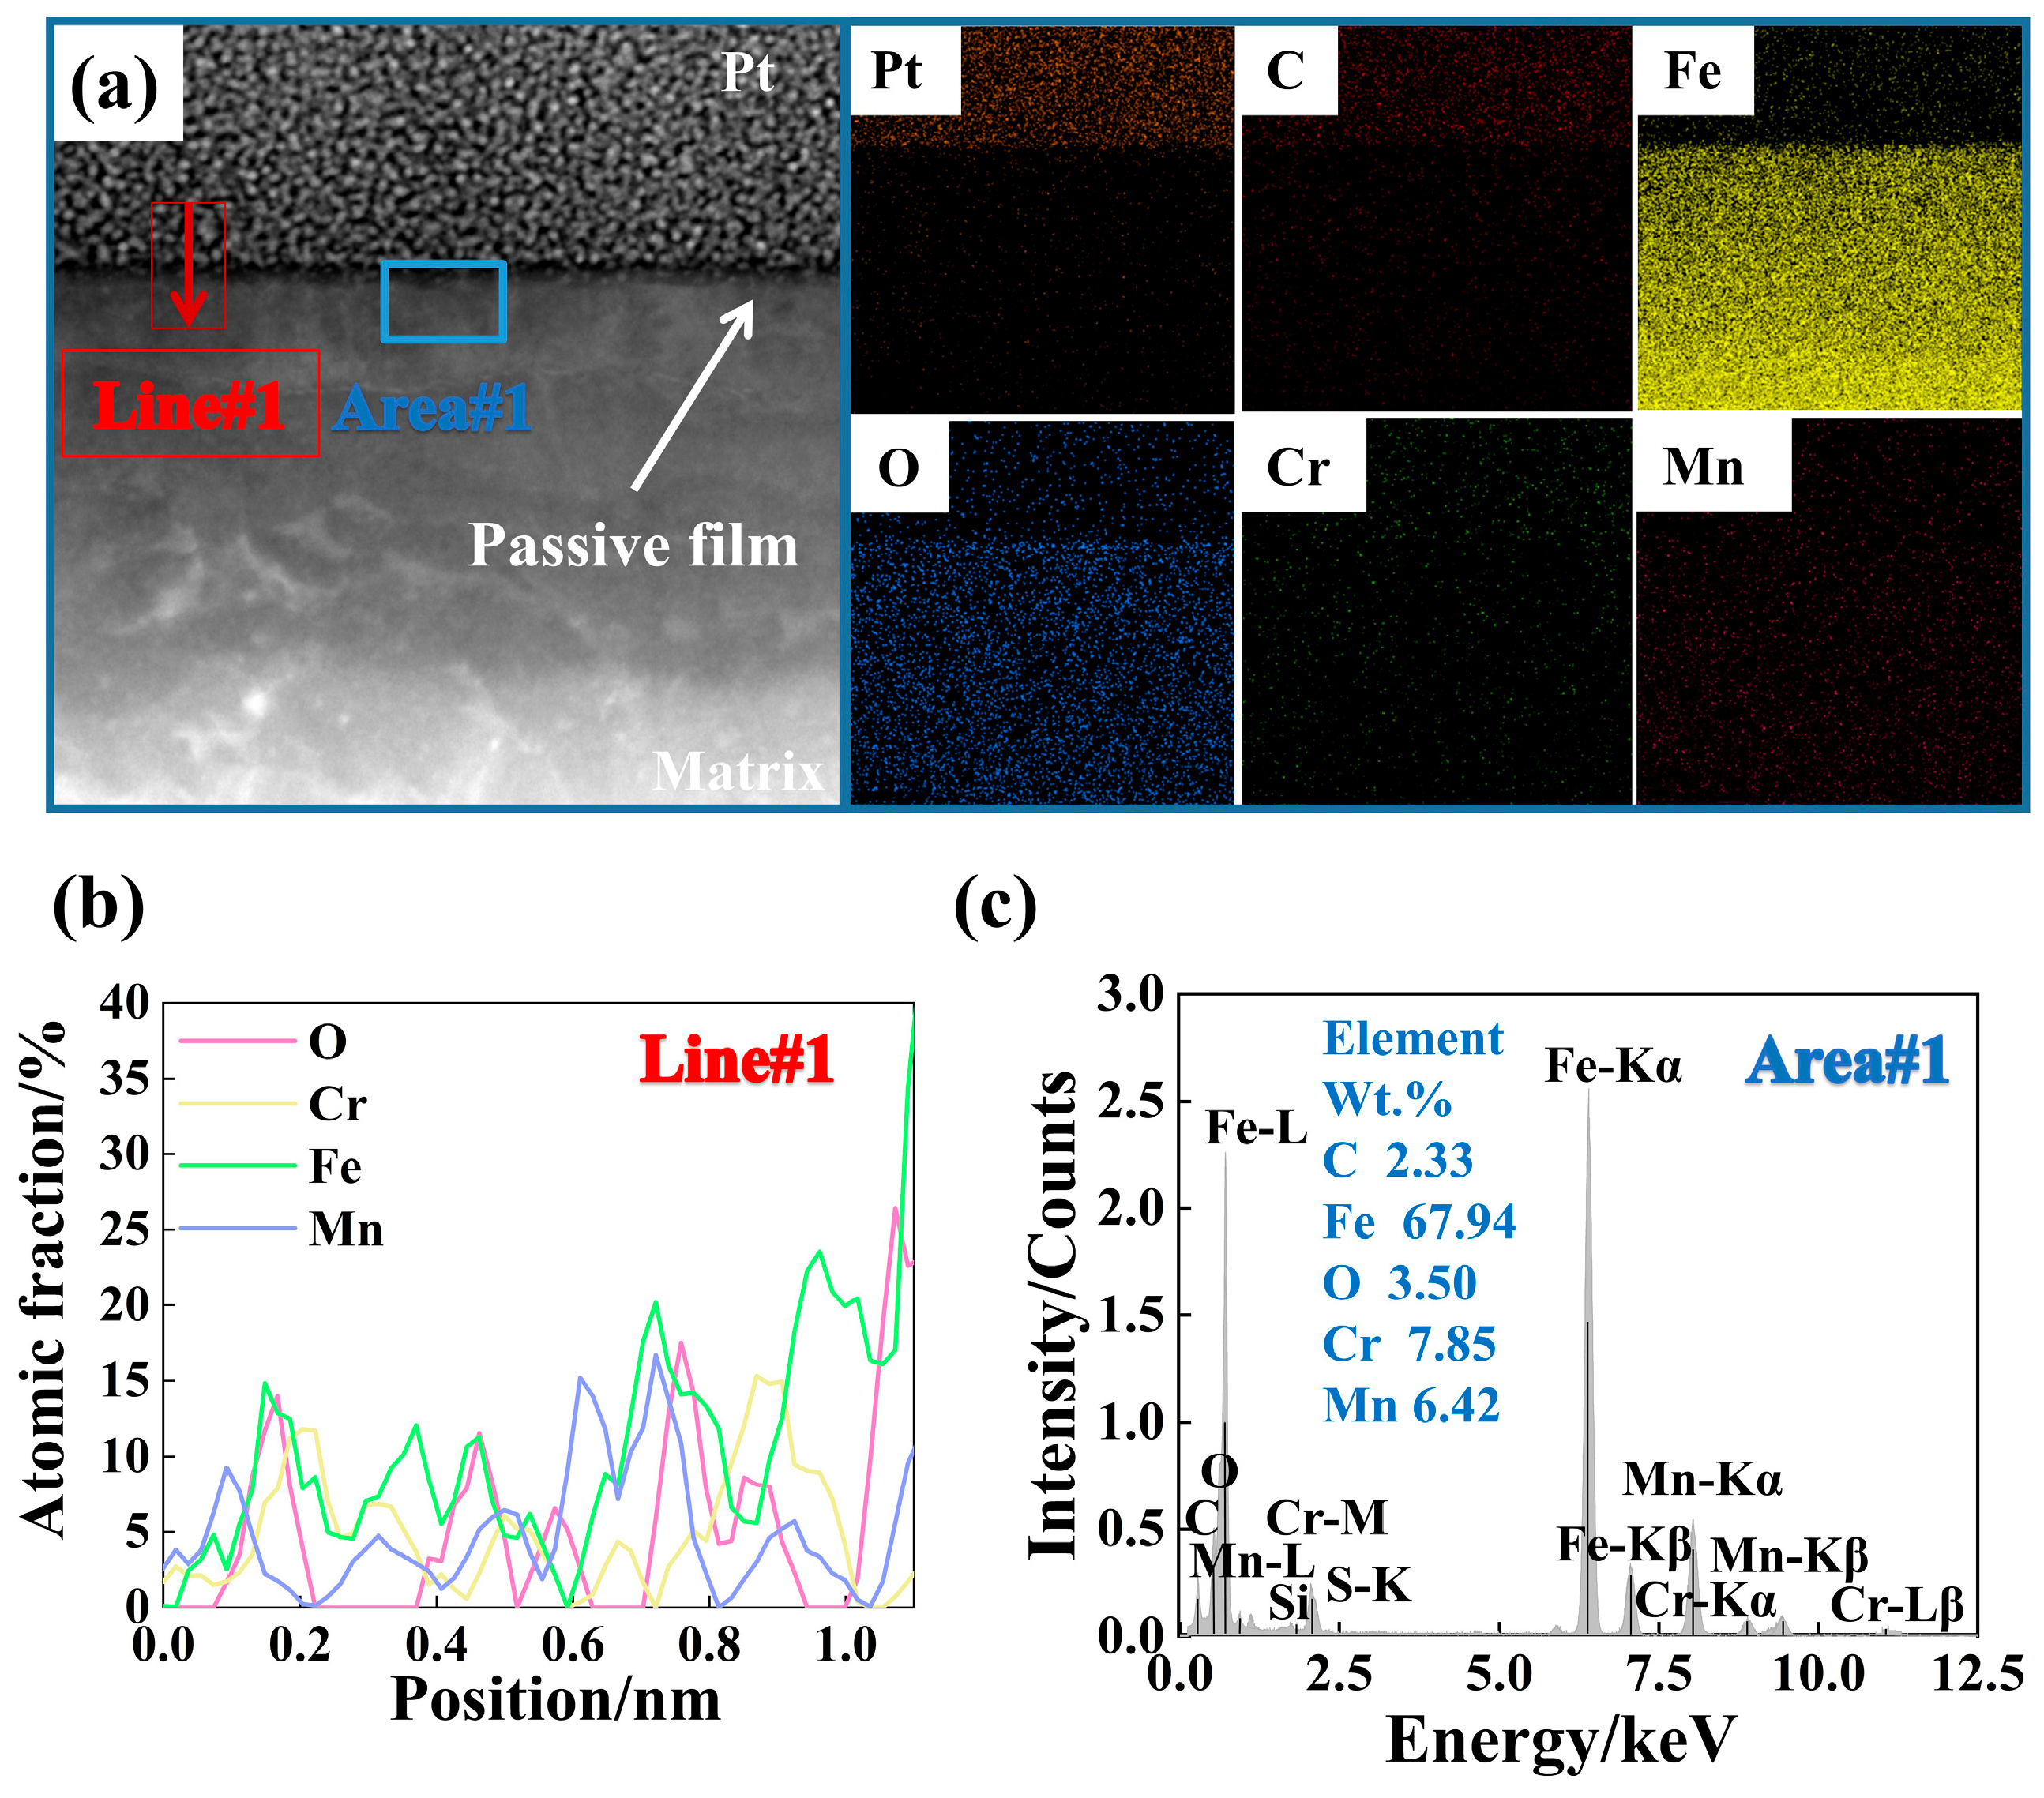
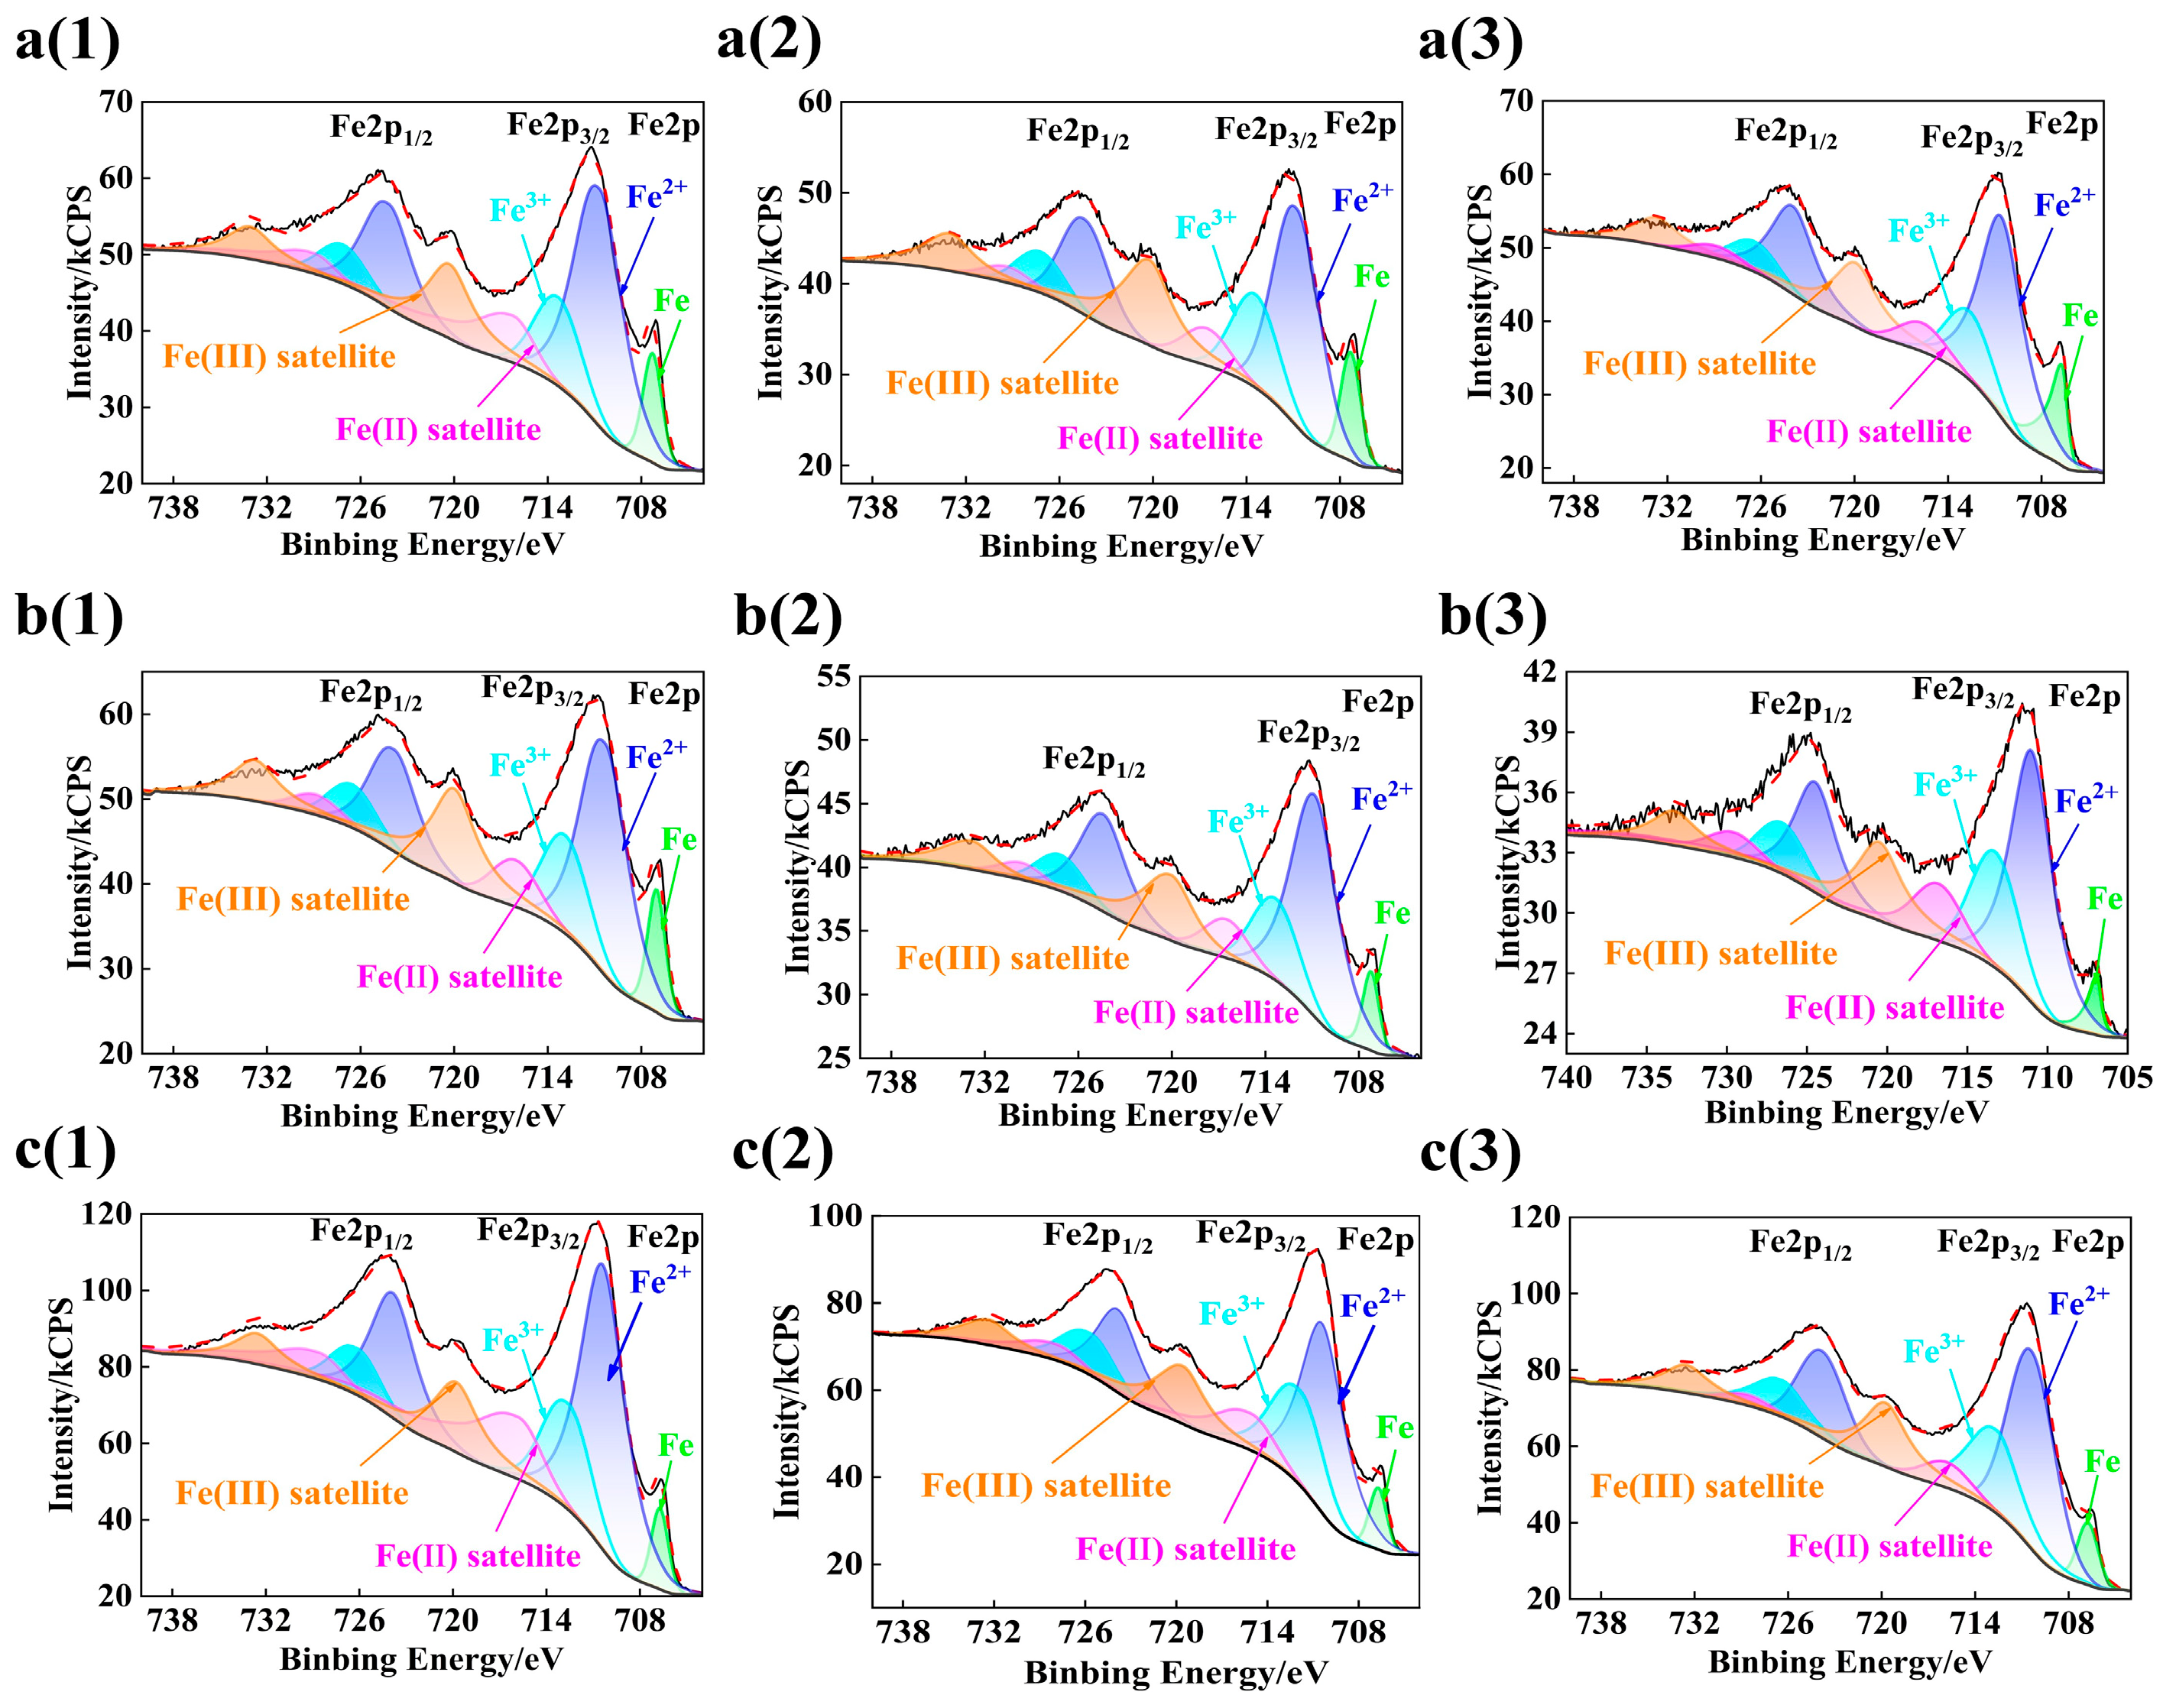
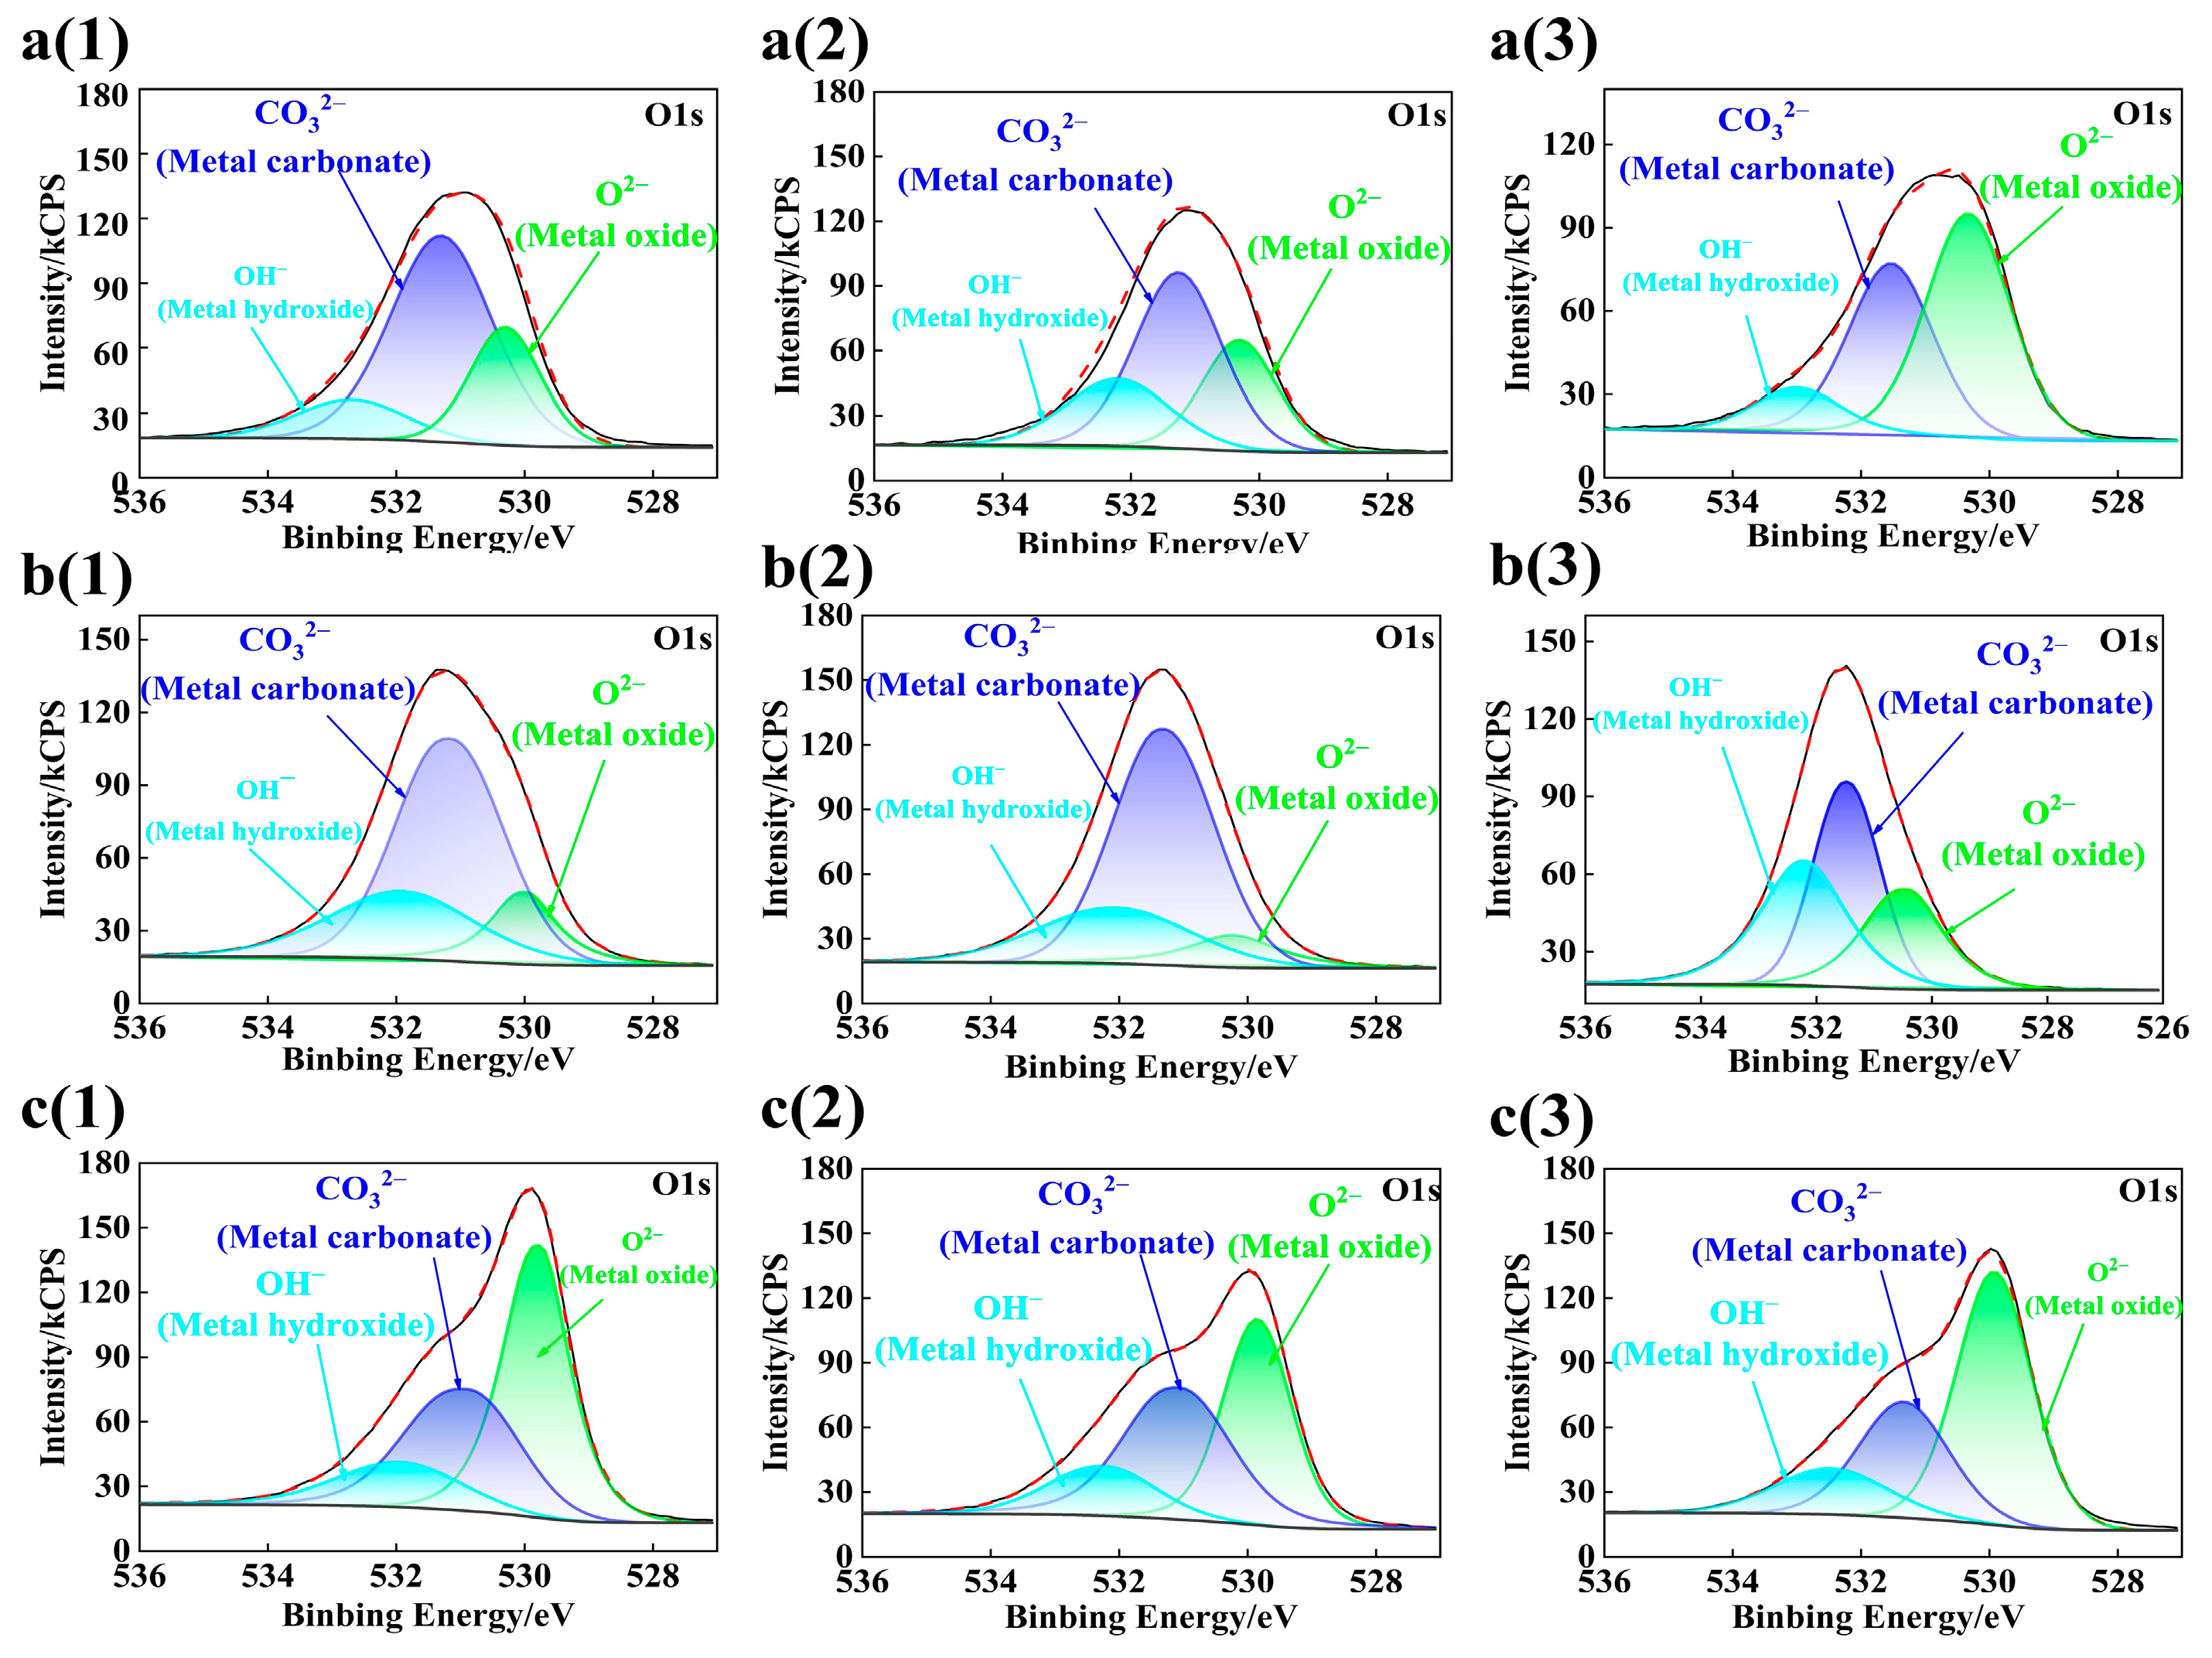
3.3. Composition Analysis of Passive Film

The Fe2p fine spectrum of the passive film of the rebar is given in Figure 8.
It can be seen from Figure 8 that in all samples, iron (Fe) has a high strength peak, indicating that the thickness of the passive film is less than 10 nm [26,27]. In addition, the passive films of all samples contain Fe2+ phase and Fe3+ phase, and the binding energies of Fe, Fe2+, and Fe3+ are 710.6 eV, 712.8 eV, and 716.8 eV, respectively. Combined with the analysis of the O1s fine spectrum of the passive film in Figure 9, it is found that the Fe2+ phase in the passive film of all samples exists in the form of FeO, while FeO exists in the form of Fe3O4 in most cases, and the Fe3+ phase exists in the form of Fe2O3 and FeOOH/Fe(OH)3 [21].
The fine spectrum of O1s of rebar passive film immersed in different pH solutions at various times is given in Figure 9.
It can be seen from Figure 9 that the three main combined peaks of the O1s peak are O2−, CO32−, and OH, and the corresponding binding energies are 530.3 eV, 531.2 eV, and 532.7 eV, respectively. O2− mainly represents Fe3O4, FeO, Fe2O3, and a small amount of microalloying element oxides, while OH is composed of FeOOH, Fe(OH)3, and a possible small amount of Cr(OH)3.
The semi-quantitative analysis is carried out according to the fine spectra of Fe2p and O1s in XPS spectra, and the atoms of each phase content are obtained as shown in Figure 10.
After a series of studies [27,28,29], it was found that the Fe2+ phase inside the passive film had stronger protection performance than the Fe3+ phase. At different pH values, Figure 10a shows that the ratio of Fe2+/Fe3+ increases with the increasing passivation time, and the protection performance of the passive film is also enhanced to varying degrees. Because the external Fe3+ phase of the experimental rebar is partially dissolved under the action of HCO3−/CO32− in the low alkalinity environment, the value of Fe2+/Fe3+ in the passive film is increased [21,29,30]. In the later stage of passivation, the Fe2+/Fe3+ value of the low carbon rebar decreases with the decrease of the pH value of the alkaline solution [19].
It can be seen from Figure 10b that the ratio of Fe oxide + Fe hydroxide to metal Fe is the highest in the SCP solution with pH 10.5, and increases sharply with the increasing passivation time. At 10 d, the ratio is the highest in each solution, and the ratio changes little in the pH 13.5 solution. Figure 10c shows the ratio of O2− to OH peaks (O2−/OH) fitted from the fine spectrum of O1s in Figure 9. The O2−/OH value is higher in each solution, and gradually increases with the increasing passivation time, while it was the lowest in the pH 13.5 solution and the highest in the pH 10.5 solution at the same passivation time. Since the outer layer of the passive film is mainly composed of Fe hydroxide and the inner layer is mainly composed of Fe oxide [7], the thickness of the outer passive film in different environments can be compared according to this ratio. Therefore, the passive film formed during this period is the thickest in the SCP solution with pH 10.5.
Figure 11 shows the fine spectrum of Cr2p of rebar passive film immersed in the SCP solution with diverse pH values at different times. Because there are many impurity peaks in the fine spectrum of Cr2p in Figure 11a,b, which are difficult to fit, the spectral peaks are simply fitted. The binding energies of Cr(OH)3, Cr2O3, and CrO3 are 577.4 eV, 576.1 eV, and 576.7 eV, respectively. The XPS detection depth is greater than the thickness of the passive film, so it is hard to determine whether the small amount of Cr2O3 is from the rebar substrate or the passive film. It is found from Figure 11c that the compounds of Cr gradually increase with time.

3.4. Analysis of the Passive Film Thickness

In order to study the effects of different pH values and passivation time on the thickness of the passive film, the intensity (relative height) of iron oxides (including Fe2+ and Fe3+ oxide peaks) and metal iron peaks were fitted by quantitative methods according to the fine spectrum of Fe in XPS results. According to the strength ratio of iron oxide to metallic iron, the thickness of passive film (dOX) can be calculated from Equation (1) [28,31,32]. Since the passive film is rough and unevenly distributed, the average thickness of the passive film is calculated here.
d O X = λ O X F e cos θ ln 1 + I O X F e I m F e × N m F e N O X F e × λ m F e λ O X F e
Here θ denotes the take-off angle relative to the surface normal (θ = 0°). I O X F e and I m F e are the strength (relative height) of iron oxides (including Fe2+ and Fe3+) and metallic iron (Fe), respectively; and N O X F e and I m F e are the atomic density of iron oxide and Fe, respectively ( N O X F e = 38 atom/nm3, I m F e = 84 atom/nm3). The λ O X F e and λ m F e (nm) are the decay lengths of iron oxides and metallic irons, respectively, which can be calculated by Equations (2) and (3) [29,32]:
λ O X F e = 0.72 a O X 3 2 E k 1 2
λ m F e = 0.41 a m 3 2 E k 1 2
E k (eV) is the kinetic energy of iron (779 eV); and a O X and a m (nm) are the monolayer thickness of iron oxide and metallic iron, respectively, which can be calculated from Equations (4) and (5) [32,33]:
a O X = 1 N O X F e 1 3
a m = 1 N m F e 1 3
The equivalent thickness of the passive film of the experimental rebar in different pH environments was calculated as shown in Table 3. At the same passivation time, the thickness of the passive film gradually increases with the decrease of pH value. This indicates that the low alkaline environment is more conducive to the growth of the passive film. The thickness of the passive film increased most obviously in the pH 10.5 environment on the 10 d. This phenomenon shows that the passive film is easier to grow in a low alkaline environment, and the formed passive film has better corrosion resistance.

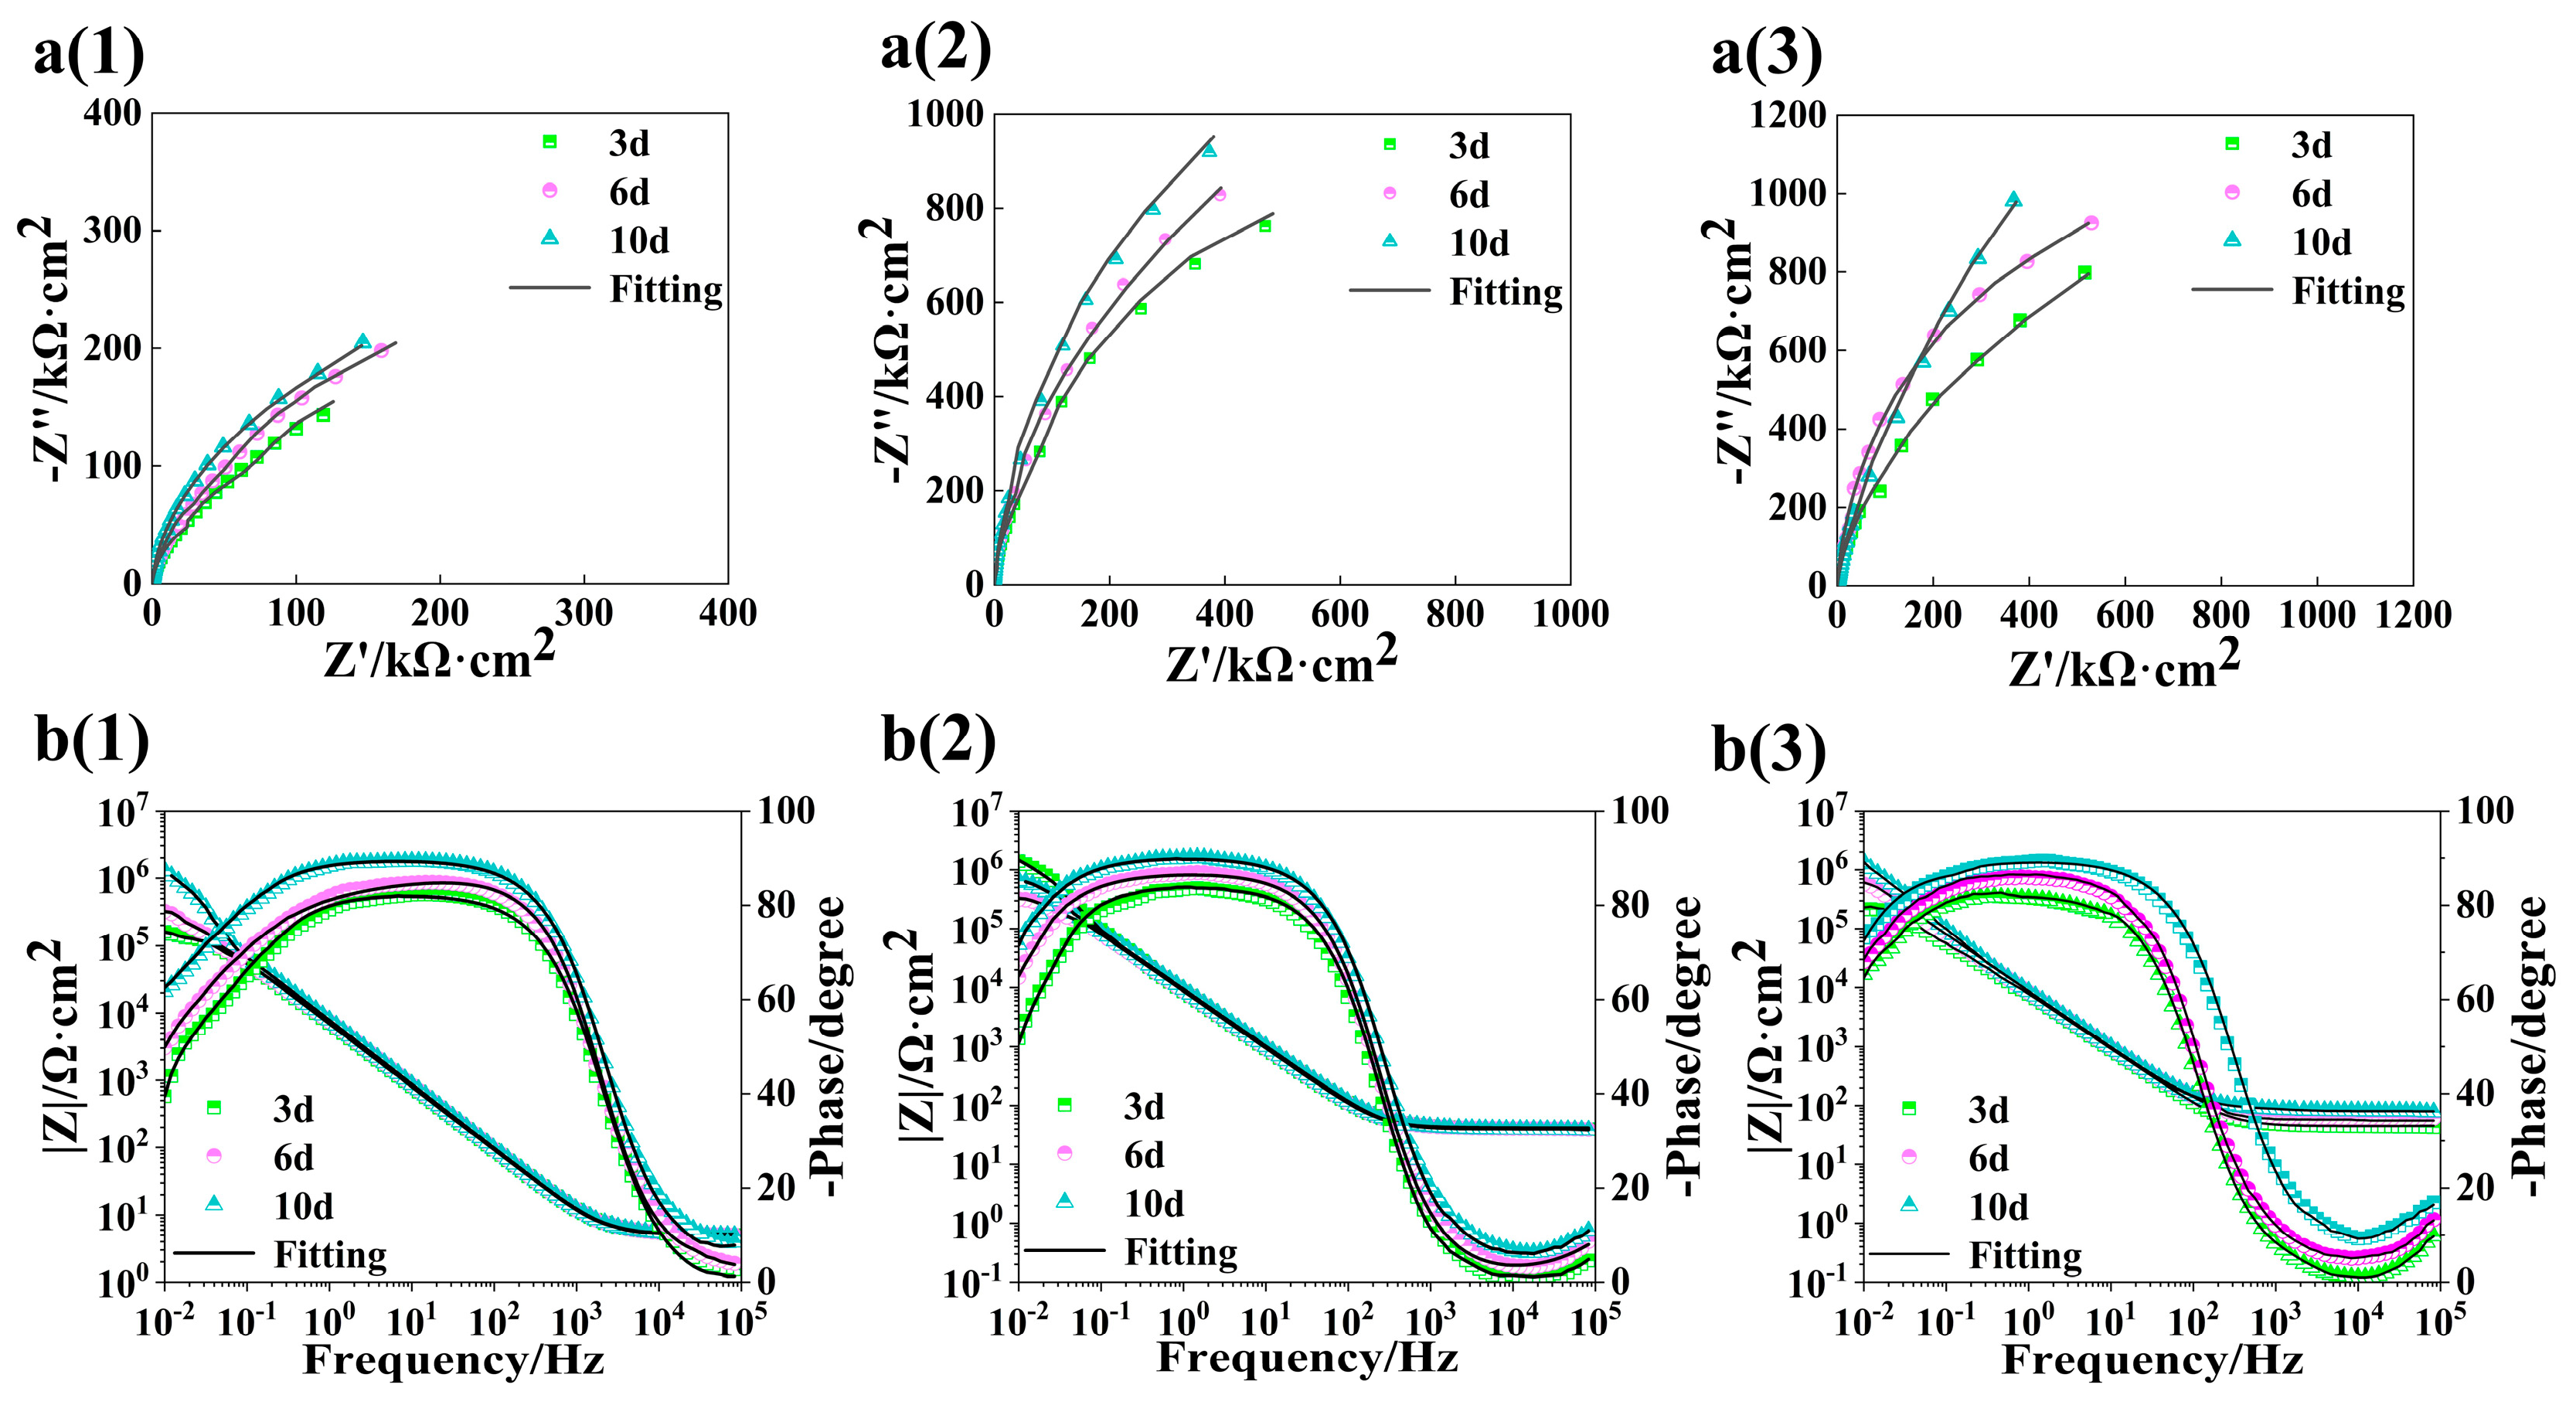
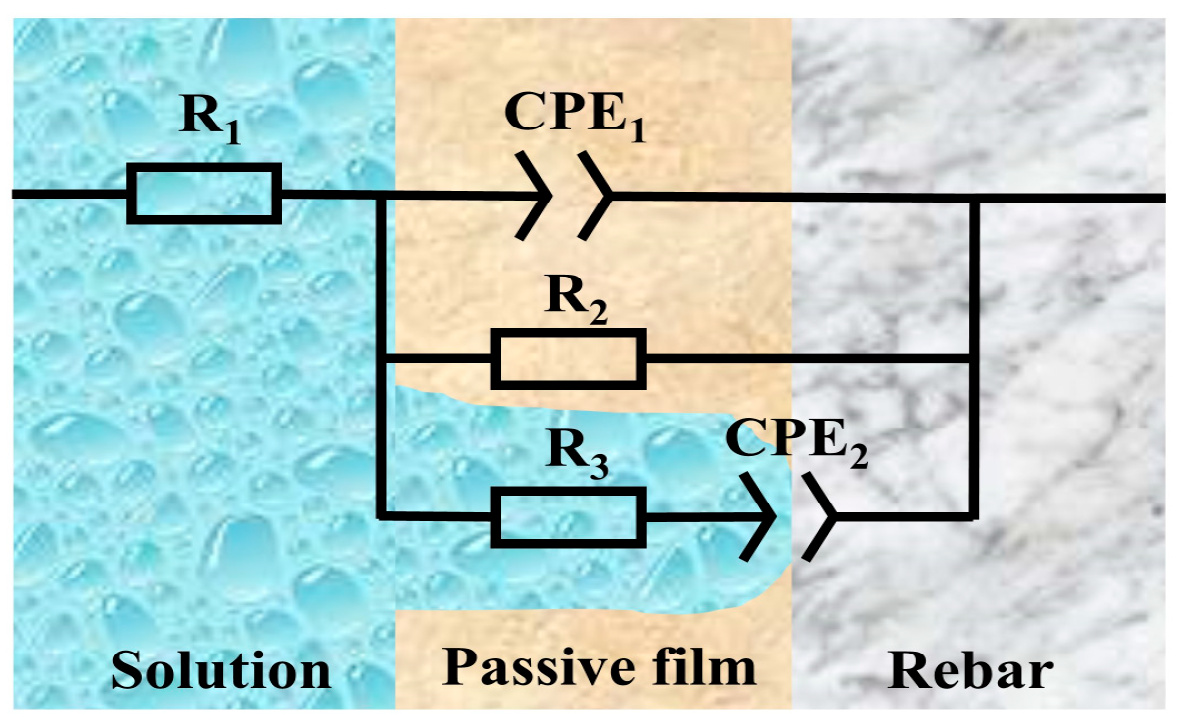
3.5. Performance Analysis of Passive Film

The Mott–Schottky curves of the passive film of rebar immersed in the SCP solutions with pH 13.5, pH 12.5, and pH 10.5 for 3 d, 6 d, and 10 d are shown in Figure 12. It can be seen from Figure 12 that when the polarization potential is higher than the flat band potential (EFB), there are two curves with different positive slopes representing the existence of two donor states with different energy levels. The deep donor energy level of the passive film may be related to the appearance of the second slope [34]. The deep and shallow energy levels are related to the presence of Fe2+ ions at the octahedral and tetrahedral positions, respectively [35]. The positive slope curve represents that the passive film is an n-type semiconductor [36,37], and the value of the donor carrier density (Nd) is fitted from the first positive slope curve greater than the EFB (−0.8 V~0 V in Figure 12a and −0.6 V~0 V in Figure 12b,c). In the potential range from −1.2 V to −1.0 V in Figure 12c, a Mott–Schottky curve segment with a negative slope was observed. This indicates that the passive film is a p-type semiconductor in this potential range, and Cr2O3 and CrOOH/Cr(OH)3 represent p-type semiconductor properties [38].
According to the point defect model (PDM) [5], the passive film in SCP solution with pH 10.5 has p-n structure semiconductor properties. The compound of Cr in the inner layer is continuously enriched, and even if the compound of Fe in the outer layer is continuously dissolved, the cation vacancies in the passive film will be filled. This leads to the formation of a dense film on the surface of the rebar, which hinders the conduction of electrons in the electrochemical reaction. Therefore, this passive film can effectively hinder the corrosion of rebar. The passive film of the experimental rebar in the solution with pH 13.5 and pH 12.5 only contains the phase of Fe. The passive film of the rebar in pH 10.5 solution contains both Fe and Cr phases in the form of phase separation, which is consistent with the XPS analysis results of the composition and structure of the passive film of the rebar.
The relationship between the semiconductor–solution interface capacitance C (the measured capacitance) and the electrode potential E can be described by the Mott–Schottky equation, as shown in Equation (6) [21].
C 2 = 2 ε ε 0 q N d E E F B k T q
In the formula, ε is the relative dielectric constant of semiconductor (alloy corrosion resistant rebar ε = 15.6 [39]); ε0 is the vacuum dielectric constant (ε0 = 8.85 × 10⁻¹⁴ F cm−1); q is the basic charge (for p-type semiconductor, q is −e, for n-type semiconductor, q is +e), e = 1.602 × 10⁻¹⁹ C); Nd is the carrier density; EFB is the flat band potential of semiconductor; k is the Boltzmann constant (k = 1.38 × 10⁻²³ J K−1); and T is the temperature, kT/e = 25 mV at room temperature, so this term can be ignored.
It can be seen from Equation (6) that C−2 has a linear relationship with E, that is, the semiconductor Mott–Schottky curve is theoretically a straight line. The slope of the n-type semiconductor line is positive, and the slope of the p-type semiconductor line is negative. The linear part of the Mott–Schottky curve is fitted. The intercept of the fitted line on the potential number axis is the flat band potential EFB. The slope k of the straight line is substituted into Equation (7), and the carrier density (Nd) can be calculated [40]. The semiconductor properties of the passive film can be analyzed by using the obtained carrier concentration and flat band potential of the passive film.
N d = 2 ε ε 0 q k
By fitting the Mott–Schottky curve of Figure 11, the flat band potential and carrier density of the passive film semiconductor on the surface of the rebar in the SCP solution with different pH values are obtained. The n-type semiconductor is the donor carrier density (Nq), and the p-type semiconductor is the host carrier density (Na), as shown in Table 4.
It can be seen from Table 4 that with the decrease in pH value, the flat band potential has a positive trend as a whole. However, at 3 d, the passive film at pH 13.5 has a much higher flat band potential (positive shift) than that at pH 12.5. This may be due to the increase of the Fermi level of the passive film semiconductor in the pH 13.5 solution, and the electron activation of the passive film surface during the electrochemical reaction [21]. This behavior also leads to more serious point defects in the passive film, and the compactness and protective performance are relatively poor.
Table 4 shows that the value of Na decreases with the decrease in the pH value of the solution. Because the compounds of Fe in the passive film of pH 10.5 continue to dissolve, then the compounds of Cr continue to form, which leads to a decrease in the cathodic polarization ability of the passive film itself. The XPS analysis results support this phenomenon. In the same passivation time, Nq increases with the decrease of solution pH value, and the longer the passivation time, the smaller the Nq value. This is because the p-type carrier density of chromium alloyed rebar in pH 10.5 solution will exhibit the characteristics of p-type semiconductors. The main components of the passive film are Fe2O3 and CrO3(CrO42−) [32], which represent p-type semiconductors. This high valent oxide can improve the compactness and stability of the passive film. Therefore, the value of Nq at pH 10.5 is lower than that at pH 12.5 and pH 13.5. The electrons are not easy to conduct in low alkalinity solutions, and the passive film with pH 10.5 has a stronger ability to hinder electron conduction [3].
Electrochemical impedance spectroscopy can analyze the control factors and mechanism of the electrochemical reaction process. The arc radius of the Nyquist diagram and the impedance modulus of the Bode diagram generally reflect the resistance of the rebar corrosion reaction. The greater the radius of the capacitive arc and the impedance modulus, the more corrosion-resistant the rebar [21]. When the surface of the rebar is flat, the absolute value of the maximum phase angle of the Bode diagram is close to 90°. The smaller the absolute value of the maximum phase angle, the lower the surface flatness. It can be considered that the rougher the surface film of the rebar, the worse the protective effect.
It can be seen from the Figure 13a Nyquist diagram that in the solution of different pH values, the radius of the capacitive arc of the rebar continues to rise with the increase of the passivation time. In the same passivation time, the radius of the rebar capacitive arc increases with the decrease of pH value. The above XPS analysis and Mott–Schottky semiconductor test analysis indicates that during the passivation process of the SCP solution with pH 10.5, there is Cr phase aggregation in the passive film. The Bode diagram of Figure 13b shows that the maximum phase angle at different times is basically stable at about −85° even if there are slight fluctuations.
According to the passivation mechanism of rebar and the structure of the passive film, the passivation process is a process of local activation corrosion, which is a process of initial inclusion-induced activation corrosion, and then cementite (Fe3C) lamellar in pearlite-induced activation corrosion. According to the passivation process and the type of corrosion, the local corrosion equivalent circuit diagram of Figure 14 is used for fitting. R1 represents the resistance of the SCP solution, R2 represents the resistance of the passive film layer in the passivation area of the rebar (hindering the electron transfer of the electrode reaction), R3 represents the ion charge transfer resistance in the local area corrosion reaction process, reflecting the difficulty of electron transfer in anodic dissolution. CPE1 represents the constant phase angle element of the rebar passive film capacitance and CPE2 represents the constant phase angle element of the electric double-layer capacitor at the rebar-electrolyte solution interface.
Due to the unevenness of the surface film and its non-ideal capacitance, the behavior of this non-ideal capacitance is characterized by a constant phase angle element. The impedance value ZCPE of the CPE parameters of its constant phase element can be defined as follows [41]:
Z C P E = 1 Y 0 ( j w ) n
Among them, Y0 is the basic admittance; n is the fitting index (0 < n > 1, n = 0 indicates that the film system is a conductor, n = 1 indicates that the film system is an ideal capacitor); j is an imaginary unit; w is the angular frequency. According to the relevant references [42,43,44,45], the CPE parameters are transformed into effective capacitance (C1) and effective capacitance (C2) by the Brug formula, Hsu formula, and Mansfeld formula. The calculation formulas of effective capacitance C1 and C2 are as follows:
C 1 = C P E 1 1 n 1 R 2 1 n 1 n 1
C 2 = C P E 2 1 n 2 1 R 1 + 1 R 3 n 2 1 n 2
The electrochemical impedance spectra of SCP solution with different pH values after passivation at different times were fitted using the equivalent circuit of Figure 13, and the fitting results are shown in Table 5. In SCP solution with pH 13.5, pH 11.5. and pH 10.5, the charge transfer resistance R3 gradually increases, and the C1 and C2 values decrease with the increasing passivation time. In the same passivation time, the R3 value is larger in low alkalinity solution. The resistance R2 of the passive film of the rebar is above 1.0 × 10⁵ Ω·cm2, which indicates that the passive film on the surface of the rebar is relatively complete. The passive film can effectively hinder the corrosion of rebar caused by electrochemical reactions and has a good protective effect. It can be seen from Table 3 that the passive film is relatively stable at 10 d. Comparing the resistance R2 of the passive film, it is found that the R2 value of pH 10.5 is higher than that of pH 13.5 and pH 12.5. This shows that the passive film formed in a low alkaline environment has higher electrical corrosion resistance.

4. Conclusions

  • In this study, SEM, AFM, TEM, XPS, and electrochemical tests are used to study the passivation behavior of chromium alloyed high-strength rebar in SCP solutions with different pH values, and the structure and composition of the passive film are analyzed. The main key conclusions are as follows:
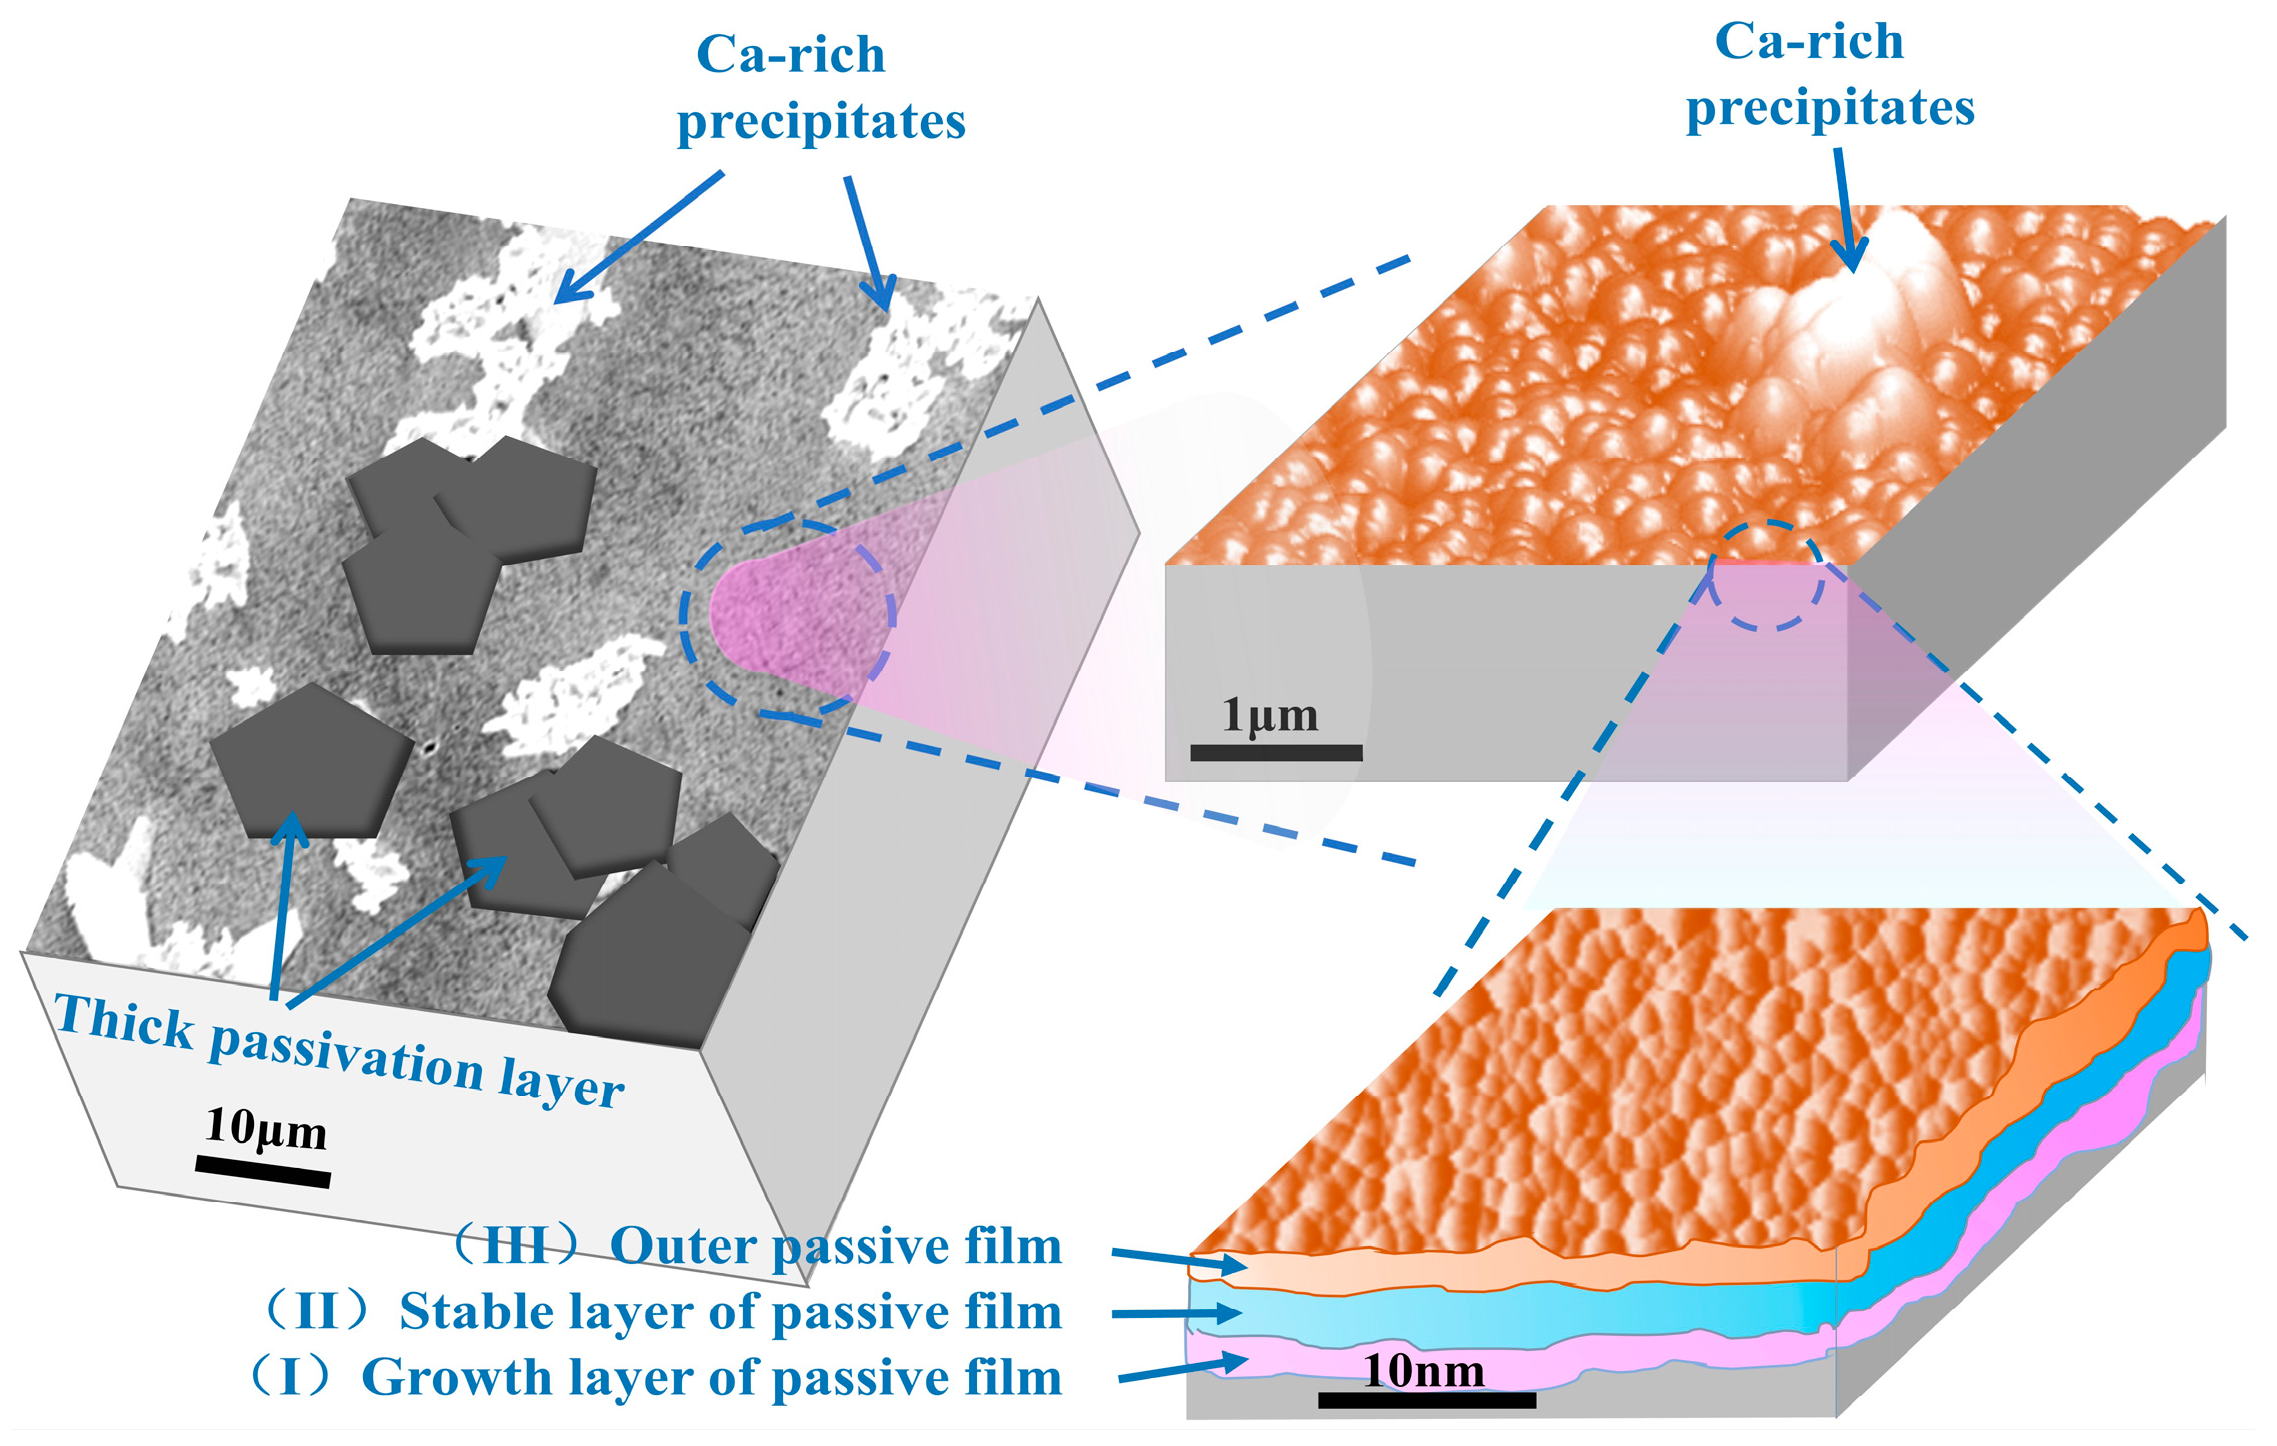
  • In SCP solution with pH 10.5, the passive film on the surface of the rebar is mainly composed of contiguous nanoparticles, and the surface is distributed with a multilateral passivation layer and calcium-rich precipitates, which enhance the compactness of the passive film.
  • When the rebar is passivated in the SCP solution with pH 10.5 for 10 d, the passive film is relatively stable, and its crystal structure is a rhombohedral crystal system. The passivating film on the surface of chromium-alloyed high-strength rebar mainly presents a three-layer structure. The structural changes from the inside to the outside are the growth layer of the inner passive film, the stable layer of the passive film, and the outer passive film layer. The outer layer of the passive film is mainly composed of Fe oxide, the intermediate stable layer of the passive film is mainly composed of Fe oxide and Cr oxide, and the inner growth layer of the passive film is mainly composed of Cr oxide.
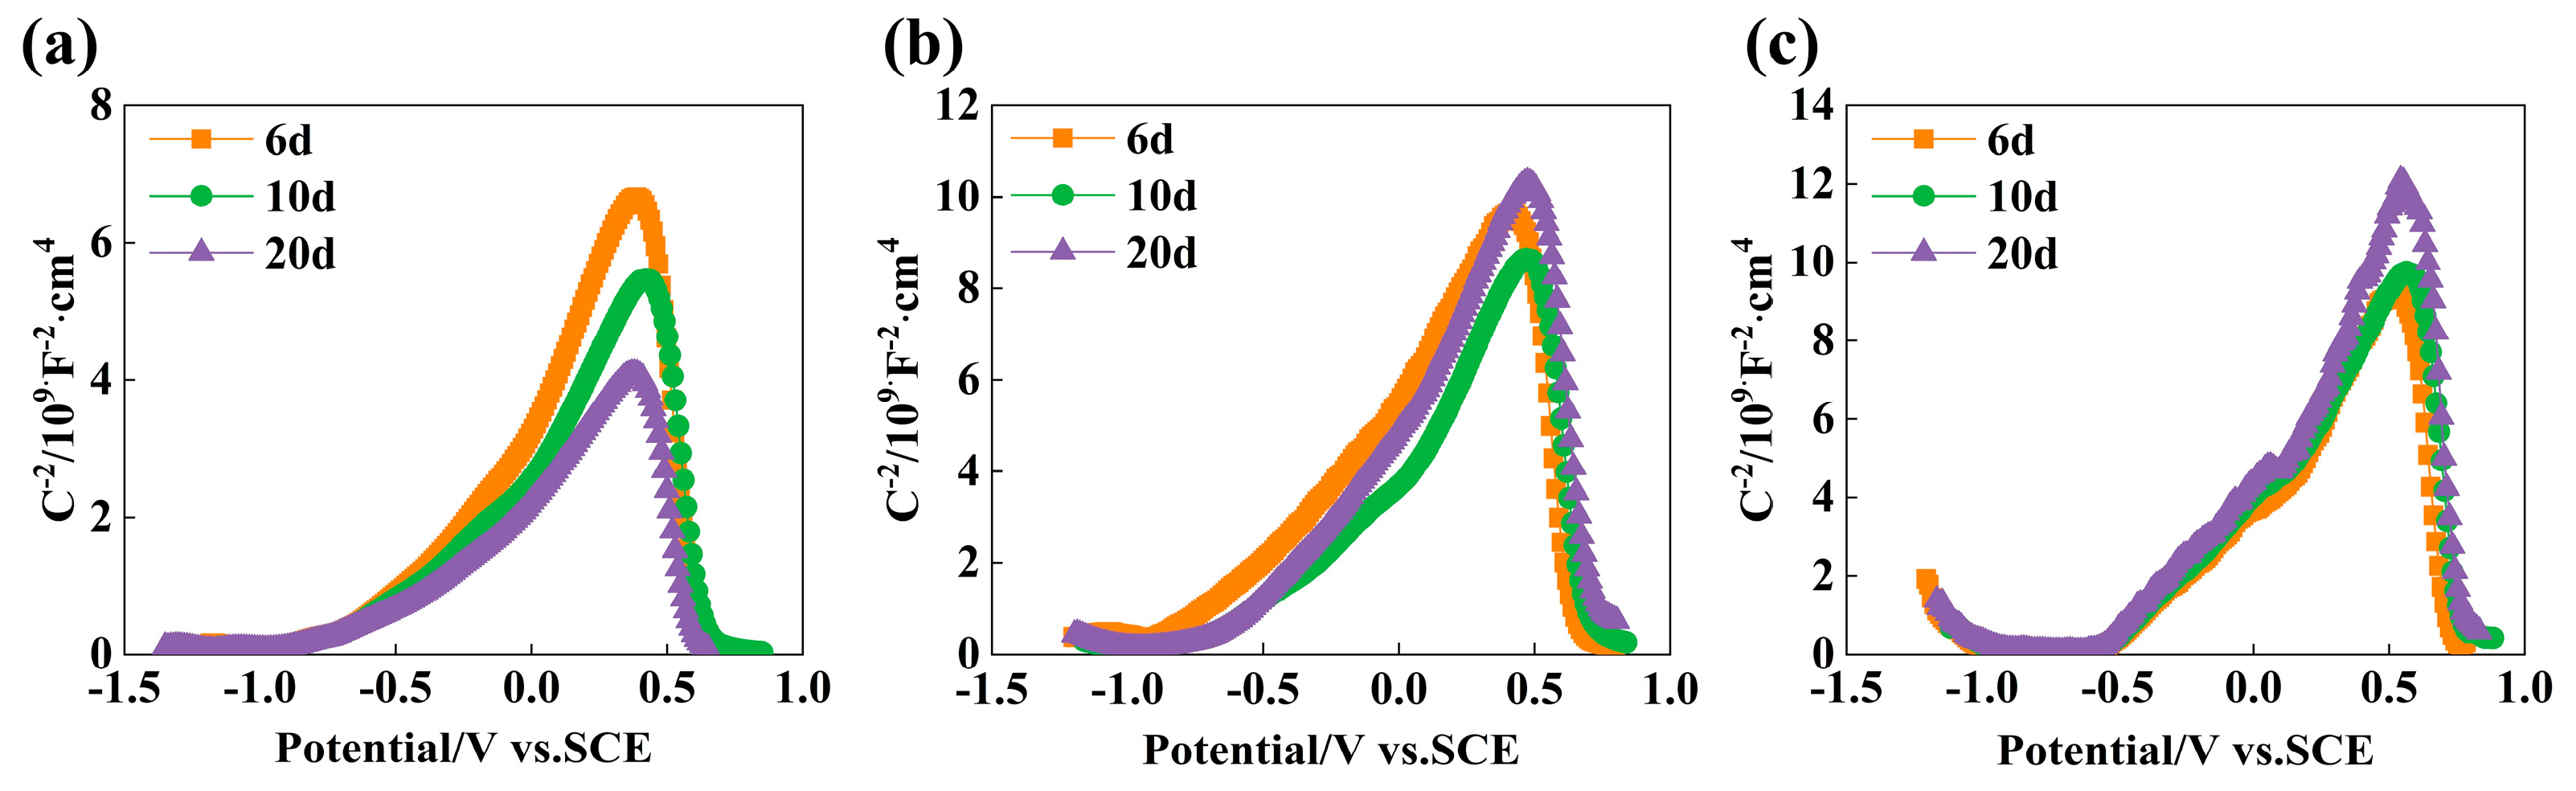
  • In SCP solution with pH 13.5, pH 12.5, and pH 10.5, the thickness of the passive film increases with the increasing passivation time, and the passive film of the experimental rebar is the thickest after immersion 10 d. The passive film formed in the pH 10.5 environment is the thickest and the passive film resistance is the largest at the same immersion time. In a high alkaline solution, the passive film is an n-type semiconductor. In the passivation process of low alkaline solution, the Cr element accumulates in the passive film, and the passive film exhibits p-n type semiconductors with better corrosion resistance.

5. Prospect

Chromium alloyed high-strength rebar is irreplaceable in concrete structures and is extensively used in large-scale engineering structures such as high-rise buildings and bridges. Since chloride is a significant source of corrosion of rebar in concrete structures, the corrosion of rebar under the action of chloride often results in the failure of concrete structures. In the highly alkaline environment of concrete, a dense passive film will be formed on the surface of the rebar, which will further prevent the corrosion of the rebar and increase the stability of the concrete structure. This study employs SCP solutions with different pH levels to explore the stability and passivation mechanism of the passive film, The structure and composition of the passive film in the rebar are studied, and the passivation mechanism of this film is explored.
The primary aim of this study is to provide some foundational research for the subsequent exploration of chloride erosion and critical chloride ions of the passive film on the surface of rebar in SCP solutions with different pH values. The corrosion resistance of rebar in concrete structures is further explored, which provides certain engineering practical value for further design of long-term stability and durability of rebar in concrete structures. Therefore, the chloride ion concentration of rebar passivation in concrete pore solutions with different pH values is the research content to be carried out in the later stage of this study.

Author Contributions

Conceptualization, H.B.; methodology, S.G., X.X. and H.B.; software, J.W.; validation, F.W. and Z.Z.; formal analysis, X.X. and F.W.; investigation, Z.L. and J.W.; resources, H.Y.; data curation, Z.Z. and J.W.; writing—original draft preparation, H.B. and X.X.; writing—review and editing, H.B. and C.L.; visualization, Z.L.; supervision, H.Y.; project administration, S.G.; funding acquisition, C.L. All authors have read and agreed to the published version of the manuscript.

Funding

This research was funded by the National Natural Science Foundation of China, grant number 52074095; the Guizhou Provincial Program on Commercialization of Scientific and Technological Achievements Development and Application of Key Technology, grant number QKHCG [2023]YB100; the Guizhou Provincial Basic Research Program (Natural Science), grant number QKHJC-ZK [2023] YB072; the Guizhou Provincial Key Technology R&D Program, grant number QKHZC [2023] YB404; the Guizhou Provincial Key Technology R&D Program, grant number QKHZC [2022] YB053; the Guizhou Provincial Program on Commercialization of Scientific and Technological Achievements Application and Demonstration, grant number QKHCG [2024]YB108; and the Shougang Shuicheng Iron and Steel (Group) Co., Ltd. Project, grant number HT-JSFW-202302-01.

Data Availability Statement

The raw data supporting the conclusions of this article will be made available by the authors on request. The original contributions presented in the study are included in the article, further inquiries can be directed to the corresponding author.

Conflicts of Interest

Authors S.G., X.X., J.W. and F.W. were employed by the company Shougang Shuicheng Steel (Group) Co., Ltd. The remaining authors declare that the research was conducted in the absence of any commercial or financial relationships that could be construed as a potential conflict of interest.

References

  1. Shi, J.; Wu, M.; Ming, J. Degradation effect of carbonation on electrochemical behavior of 2304 duplex stainless steel in simulated concrete pore solutions. Corros. Sci. 2020, 177, 109006. [Google Scholar] [CrossRef]
  2. Jin, Z.; Xiong, C.; Zhao, T.; Du, Y.; Zhang, X.; Li, N.; Yu, Y.; Wang, P. Passivation and depassivation properties of Cr–Mo alloyed corrosion-resistant steel in simulated concrete pore solution. Cem. Concr. Compos. 2022, 126, 104375. [Google Scholar] [CrossRef]
  3. Zhang, Z.; Yu, X.; Gong, N.; Zhang, Y.; Wu, H.; Mao, X.; Niu, G. Passivation behavior of Cr-modified rebar in simulated concrete pore solutions with different pH. J. Mater. Res. Technol. 2023, 26, 246–259. [Google Scholar] [CrossRef]
  4. Caprili, S.; Salvatore, W.; Valentini, R. Corroded TempCore® vs dual-phase steel reinforcing bars. Constr. Build. Mater. 2021, 277, 122301. [Google Scholar] [CrossRef]
  5. Macdonald, D.D. The history of the Point Defect Model for the passive state: A brief review of film growth aspects. Electrochim. Acta 2011, 564, 1761–1772. [Google Scholar] [CrossRef]
  6. Moser, R.D.; Singh, P.M.; Kahn, L.F.; Kurtis, K.E. Chloride-induced corrosion resistance of high-strength stainless steels in simulated alkaline and carbonated concrete pore solutions. Corros. Sci. 2012, 57, 241–253. [Google Scholar] [CrossRef]
  7. Yuan, X.; Wang, X.; Cao, Y.; Yang, H. Natural passivation behavior and its influence on chloride-induced corrosion resistance of stainless steel in simulated concrete pore solution. J. Mater. Res. Technol. 2020, 96, 12378–12390. [Google Scholar] [CrossRef]
  8. Sun, H.; Wu, X.; Han, E.-H. Effects of temperature on the oxide film properties of 304 stainless steel in high temperature lithium borate buffer solution. Corros. Sci. 2009, 5112, 2840–2847. [Google Scholar] [CrossRef]
  9. Massoud, T.; Maurice, V.; Klein, L.H.; Seyeux, A.; Marcus, P. Nanostructure and local properties of oxide layers grown on stainless steel in simulated pressurized water reactor environment. Corros. Sci. 2014, 84, 198–203. [Google Scholar] [CrossRef]
  10. Lv, S.; Li, K. Semiconducting behaviour and corrosion resistance of passive film on corrosion-resistant steel rebars. Materials 2022, 1521, 7644. [Google Scholar] [CrossRef]
  11. Goyal, A.; Pouya, H.S.; Ganjian, E.; Claisse, P. A review of corrosion and protection of steel in concrete. Arab. J. Sci. Eng. 2018, 43, 5035–5055. [Google Scholar] [CrossRef]
  12. Xie, Y.; Qian, C.; Xu, Y.; Wei, M.; Du, W. Effect of fine aggregate type on early-age performance, cracking analysis and engineering applications of C50 concrete. Constr. Build. Mater. 2022, 323, 126633. [Google Scholar] [CrossRef]
  13. Liu, C.; Zhang, W.; Liu, H.; Zhu, C.; Wu, Y.; He, C.; Wang, Z. Recycled aggregate concrete with the incorporation of rice husk ash: Mechanical properties and microstructure. Constr. Build. Mater. 2022, 351, 128934. [Google Scholar] [CrossRef]
  14. Tang, B.; Fan, M.; Yang, Z.; Sun, Y.; Yuan, L. A comparison study of aggregate carbonation and concrete carbonation for the enhancement of recycled aggregate pervious concrete. Constr. Build. Mater. 2023, 371, 130797. [Google Scholar] [CrossRef]
  15. Tam, V.W.; Soomro, M.; Evangelista, A.C.J. A review of recycled aggregate in concrete applications (2000–2017). Constr. Build. Mater. 2018, 172, 272–292. [Google Scholar] [CrossRef]
  16. Xu, L.; Wu, P.; Zhu, X.; Zhao, G.; Ren, X.; Wei, Q.; Xie, L. Structural characteristics and chloride intrusion mechanism of passive film. Corros. Sci. 2022, 207, 110563. [Google Scholar] [CrossRef]
  17. Ai, Z.; Jiang, J.; Sun, W.; Jiang, X.; Yu, B.; Wang, K.; Zhang, Z.; Song, D.; Ma, H.; Zhang, J. Enhanced passivation of alloy corrosion-resistant steel Cr10Mo1 under carbonation—Passive film formation, the kinetics and mechanism analysis. Cem. Concr. Compos. 2018, 92, 178–187. [Google Scholar] [CrossRef]
  18. Loh, N.D.; Sen, S.; Bosman, M.; Tan, S.F.; Zhong, J.; Nijhuis, C.A.; Král, P.; Matsudaira, P.; Mirsaidov, U. Multistep nucleation of nanocrystals in aqueous solution. Nat. Chem. 2017, 91, 77–82. [Google Scholar] [CrossRef]
  19. Freire, L.; Carmezim, M.; Ferreira, M.a.; Montemor, M. The passive behaviour of AISI 316 in alkaline media and the effect of pH: A combined electrochemical and analytical study. Electrochim. Acta 2010, 5521, 6174–6181. [Google Scholar] [CrossRef]
  20. Fattah-alhosseini, A.; Vafaeian, S. Passivation behavior of a ferritic stainless steel in concentrated alkaline solutions. J. Mater. Res. Technol. 2015, 44, 423–428. [Google Scholar] [CrossRef]
  21. Ai, Z.; Jiang, J.; Sun, W.; Song, D.; Ma, H.; Zhang, J.; Wang, D. Passive behaviour of alloy corrosion-resistant steel Cr10Mo1 in simulating concrete pore solutions with different pH. Appl. Surf. Sci. 2016, 389, 1126–1136. [Google Scholar] [CrossRef]
  22. GB 1499.2-2018; Steel for the Reinforcement Concrete-Part 2: Hot Rolled Ribbed Bars. China Standard Press: Beijing, China, 2018.
  23. Shi, J.; Wang, D.; Ming, J.; Sun, W. Long-term electrochemical behavior of low-alloy steel in simulated concrete pore solution with chlorides. J. Mater. Civ. Eng. 2018, 304, 04018042. [Google Scholar] [CrossRef]
  24. Maurice, V.; Marcus, P. Passive films at the nanoscale. Electrochim. Acta 2012, 84, 129–138. [Google Scholar] [CrossRef]
  25. Jeon, S.; Heo, T.; Hwang, S.-Y.; Ciston, J.; Bustillo, K.C.; Reed, B.W.; Ham, J.; Kang, S.; Kim, S.; Lim, J.; et al. Reversible disorder-order transitions in atomic crystal nucleation. Science 2021, 3716528, 498–503. [Google Scholar] [CrossRef] [PubMed]
  26. Liu, M.; Cheng, X.; Li, X.; Pan, Y.; Li, J. Effect of Cr on the passive film formation mechanism of steel rebar in saturated calcium hydroxide solution. Appl. Surf. Sci. 2016, 389, 1182–1191. [Google Scholar] [CrossRef]
  27. Koga, G.Y.; Albert, B.; Roche, V.; Nogueira, R.P. On the intrinsic passivating ability of Belite-Ye’elimite-Ferrite towards carbon steel: A straightforward comparison with ordinary Portland cement. Corros. Sci. 2019, 147, 141–151. [Google Scholar] [CrossRef]
  28. Song, Z.; Zhang, Y.; Liu, L.; Pu, Q.; Jiang, L.; Chu, H.; Luo, Y.; Liu, Q.; Cai, H. Use of XPS for quantitative evaluation of tensile-stress-induced degradation of passive film on carbon steel in simulated concrete pore solution. Constr. Build. Mater. 2021, 274, 121779. [Google Scholar] [CrossRef]
  29. Ghods, P.; Isgor, O.B.; Brown, J.; Bensebaa, F.; Kingston, D. XPS depth profiling study on the passive oxide film of carbon steel in saturated calcium hydroxide solution and the effect of chloride on the film properties. Appl. Surf. Sci. 2011, 25710, 4669–4677. [Google Scholar] [CrossRef]
  30. Shang, B.; Ma, Y.; Meng, M.; Li, Y. The roles carbonate and bicarbonate ions play on pre-passive HRB400 rebars in simulated pore solutions of deteriorating concrete. Mater. Corros. 2018, 6912, 1800–1810. [Google Scholar] [CrossRef]
  31. Barroux, A.; Duguet, T.; Ducommun, N.; Nivet, E.; Delgado, J.; Laffont, L.; Blanc, C. Combined XPS/TEM study of the chemical composition and structure of the passive film formed on additive manufactured 17-4PH stainless steel. Surf. Interfaces 2021, 22, 100874. [Google Scholar] [CrossRef]
  32. You, N.; Shi, J.; Zhang, Y. Electrochemical performance of low-alloy steel and low-carbon steel immersed in the simulated pore solutions of alkali-activated slag/steel slag pastes in the presence of chlorides. Corros. Sci. 2022, 205, 110438. [Google Scholar] [CrossRef]
  33. Miserque, F.; Huet, B.; Azou, G.; Bendjaballah, D.; L’hostis, V. X-ray photoelectron spectroscopy and electrochemical studies of mild steel FeE500 passivation in concrete simulated water. EDP Sci. 2006, 136, 89–97. [Google Scholar] [CrossRef]
  34. Dong, Z.H.; Shi, W.; Zhang, G.A.; Guo, X.P. The role of inhibitors on the repassivation of pitting corrosion of carbon steel in synthetic carbonated concrete pore solution. Electrochim. Acta 2011, 5617, 5890–5897. [Google Scholar] [CrossRef]
  35. Wang, Z.; Jin, J.; Zhang, G.-H.; Fan, X.-H.; Zhang, L. Effect of temperature on the passive film structure and corrosion performance of CoCrFeMoNi high-entropy alloy. Corros. Sci. 2022, 208, 110661. [Google Scholar] [CrossRef]
  36. Feng, X.; Lu, X.; Zuo, Y.; Zhuang, N.; Chen, D. The effect of deformation on metastable pitting of 304 stainless steel in chloride contaminated concrete pore solution. Corros. Sci. 2016, 103, 223–229. [Google Scholar] [CrossRef]
  37. Li, L.; Dong, C.; Xiao, K.; Yao, J.; Li, X. Effect of pH on pitting corrosion of stainless steel welds in alkaline salt water. Constr. Build. Mater. 2014, 68, 709–715. [Google Scholar] [CrossRef]
  38. Hakiki, N.; Montemor, M.; Ferreira, M.; da Cunha Belo, M. Semiconducting properties of thermally grown oxide films on AISI 304 stainless steel. Corros. Sci. 2000, 424, 687–702. [Google Scholar] [CrossRef]
  39. Hakiki, N.; Boudin, S.; Rondot, B.; Belo, M.D.C. The electronic structure of passive films formed on stainless steels. Corros. Sci. 1995, 3711, 1809–1822. [Google Scholar] [CrossRef]
  40. Liu, M.; Cheng, X.; Li, X.; Lu, T.J. Corrosion behavior of low-Cr steel rebars in alkaline solutions with different pH in the presence of chlorides. J. Electroanal. Chem. 2017, 803, 40–50. [Google Scholar] [CrossRef]
  41. Pan, Z.; Luo, H.; Zhao, Q.; Cheng, H.; Wei, Y.; Wang, X.; Zhang, B.; Li, X. Tailoring microstructure and corrosion behavior of CoNiVAlx medium entropy alloys via Al addition. Corros. Sci. 2022, 207, 110570. [Google Scholar] [CrossRef]
  42. Brug, G.; van den Eeden, A.L.; Sluyters-Rehbach, M.; Sluyters, J.H. The analysis of electrode impedances complicated by the presence of a constant phase element. J. Electroanal. Chem. Interfacial Electrochem. 1984, 176, 275–295. [Google Scholar] [CrossRef]
  43. Hirschorn, B.; Orazem, M.E.; Tribollet, B.; Vivier, V.; Frateur, I.; Musiani, M. Determination of effective capacitance and film thickness from constant-phase-element parameters. Electrochim. Acta 2010, 5521, 6218–6227. [Google Scholar] [CrossRef]
  44. Han, S.; Zhang, J.; Lei, X.; Yang, R.; Wang, N. Insight into the anisotropic electrochemical corrosion behaviors of laser metal deposited Ni-based single crystal superalloy. Corros. Sci. 2023, 217, 111111. [Google Scholar] [CrossRef]
  45. Liu, Q.; Zhou, B.; Zhang, J.; Zhang, W.; Zhao, M.; Li, N.; Xiong, M.; Chen, J.; Yu, Y.; Song, S.Y. Influence of Ru-Ni-Nb combined cathode modification on corrosion behavior and passive film characteristics of Ti-6Al-4V Alloy used for oil country tubular goods. Corros. Sci. 2022, 207, 110569. [Google Scholar] [CrossRef]
Figure 1. The electrochemical test device.
Metals 14 00859 g001
Figure 2. SEM morphology of the passive film of rebar in the SCP solution with pH 10.5 after the passivation 10 d: (a) whole morphology; (b,c) local morphology and EDS of Figure 2(a).
Metals 14 00859 g002
Figure 3. AFM morphology of the passive film of rebar in the SCP solution: (a(1)a(3)) pH 13.5, (b(1)b(3)) pH 12.5 and (c(1)c(3)) pH 10.5; (a(1)c(1)) 3 d, (a(2)c(2)) 6 d, and (a(3)c(3)) 10 d.
Metals 14 00859 g003
Figure 4. FIB-SEM TEM sample preparation process: (a) the surface morphology of the passive film, (b) the marking position, (c) the pit after removing the passive film sheet, and (d) the removed passive film sheet.
Metals 14 00859 g004
Figure 5. TEM image of the cross−section structure of the passive film after passivation in the SCP solution with pH 10.5 for 10 d: (a) the cross−section thickness morphology of the passive film, and (b) the cross−section structure of the passive film converted by FFT.
Metals 14 00859 g005
Figure 6. TEM and EDS images of passive film cross-section after passivation in the SCP solution with pH 10.5 for 10 d: (a) cross-section morphology, (b) EDS line scan, and (c) EDS point scan diagram.
Metals 14 00859 g006
Figure 7. Structure diagram of passive film.
Metals 14 00859 g007
Figure 8. The fine spectrum of Fe2p in the passive film of rebar: (a(1)a(3)) pH 13.5, (b(1)b(3)) pH 12.5 and (c(1)c(3)) pH 10.5; (a(1)c(1)) 3 d, (a(2)c(2)) 6 d, and (a(3)c(3)) 10 d. (The black solid line represents the original data, and the red dashed line represents the fitted data.)
Metals 14 00859 g008
Figure 9. O1s fine spectrum of the passive film of rebar: (a(1)a(3)) pH 13.5, (b(1)b(3)) pH 12.5 and (c(1)c(3)) pH 10.5; (a(1)c(1)) 3 d, (a(2)c(2)) 6 d and (a(3)c(3)) 10 d. (The black solid line represents the original data, and the red dashed line represents the fitted data.)
Metals 14 00859 g009
Figure 10. The atomic ratio of each phase content: (a) Fe2+/Fe3+, (b) (Fe oxide + Fe hydroxide)/Fe, and (c) O2−/OH.
Metals 14 00859 g010
Figure 11. Cr2p fine spectrum of the passive film of rebar: (a(1)a(3)) pH 13.5, (b(1)b(3)) pH 12.5 and (c(1)c(3)) pH 10.5; (a(1)c(1)) 3 d, (a(2)c(2)) 6 d, and (a(3)c(3)) 10 d. (The black solid line represents the original data, and the red dashed line represents the fitted data.)
Metals 14 00859 g011
Figure 12. Mott–Schottky curves of passive film of rebar in SCP solution with (a) pH 13.5, (b) pH 12.5, and (c) pH 10.5.
Metals 14 00859 g012
Figure 13. Electrochemical impedance diagrams of rebar immersed in SCP solution: (a(1)b(1)) pH 13.5, (a(2)b(2)) pH 12.5, and (a(3)b(3)) pH 10.5; (a(1)a(3)) Nyquist diagram and (b(1)b(3)) Bode diagram.
Metals 14 00859 g013
Figure 14. EIS equivalent circuit diagram.
Metals 14 00859 g014
Table 1. Experimental rebar composition table (wt.%).
BrandCSiMnPSOCrFeCeq
HRB500E0.200.611.420.0260.0210.0080.84Bal.0.445
Table 2. Composition of simulated concrete pore solution with different pH values.
SolutionConcentration/mol·L−1pHPotential Values/mV
Ca(OH)2NaOHKOHNaHCO3
1saturation0.10.2-13.5−392
2saturation--0.01412.5−343
3saturation--0.03610.5−277
Table 3. Comparison of passive film thickness of the rebar (unit: nm).
TimepH 13.5pH 12.5pH 10.5
3 d2.762.923.06
6 d2.913.183.41
10 d2.953.955.01
Table 4. Flat band potential and carrier density of passive film of the rebar in SCP solution with different pH values.
TimeNq/1020 × cm−3Na/1020 × cm−3EFB/V
pH 13.5pH 12.5pH 10.5pH 10.5pH 13.5pH 12.5pH 10.5
3 d14.1614.6527.1220.01−0.65−0.79−0.56
6 d13.4713.9825.8316.33−0.70−0.69−0.56
10 d12.8413.2722.1812.05−0.67−0.66−0.58
Table 5. Electrochemical impedance spectroscopy fitting results of passive film of rebar after immersion in SCP solution with diverse pH values for different times.
pH ValueTimeR1 (Ω·cm2)CPE1R2 (Ω·cm2)R3 (Ω·cm2)CPE2C1 (F·cm−2)C2 (F·cm−2)
Y1−1·cm2·sn)n1Y2−1·cm2·sn)n2
13.53 d5.102.16 × 10−50.968.83 × 1037.16 × 1052.27 × 10−50.982.06 × 10−52.14 × 10⁻⁵
6 d5.201.70 × 10−50.961.39 × 1041.92 × 1061.76 × 10−50.961.60 × 10−51.27 × 10⁻⁵
10 d5.371.44 × 10−50.952.99 × 1042.16 × 1061.47 × 10−50.951.38 × 10−58.94 × 10⁻⁶
12.53 d30.911.36 × 10−50.941.06 × 1048.59 × 1056.36 × 10−60.951.20 × 10−54.46 × 10⁻⁶
6 d34.571.22 × 10−50.951.60 × 1041.75 × 1065.60 × 10−60.961.12 × 10−53.56 × 10⁻⁶
10 d41.651.06 × 10−50.953.41 × 1042.33 × 1064.62 × 10−60.951.00 × 10−52.94 × 10⁻⁶
10.53 d34.776.68 × 10−60.991.43 × 1041.10 × 1064.53 × 10−60.976.52 × 10−63.45 × 10⁻⁶
6 d79.095.43 × 10−70.982.41 × 1042.09 × 1064.10 × 10−60.944.97 × 10−72.46 × 10⁻⁶
10 d82.632.59 × 10−70.947.25 × 1042.84 × 1062.73 × 10−60.962.01 × 10−81.92 × 10⁻⁶
Disclaimer/Publisher’s Note: The statements, opinions and data contained in all publications are solely those of the individual author(s) and contributor(s) and not of MDPI and/or the editor(s). MDPI and/or the editor(s) disclaim responsibility for any injury to people or property resulting from any ideas, methods, instructions or products referred to in the content.

