Article

Exploring Mechanical Properties Using the Hydraulic Bulge Test and Uniaxial Tensile Test with Micro-Samples for Metals

1
Special Equipment Safety Supervision Inspection Institute of Jiangsu Province, Zhangjiagang 215600, China
2
School of Mechanical Engineering and Rail Transit, Changzhou University, Changzhou 213164, China
3
Jiangsu Province Engineering Research Center of High-Level Energy and Power Equipment, Changzhou 213164, China
*
Author to whom correspondence should be addressed.
Metals 2024, 14(8), 917; https://doi.org/10.3390/met14080917
Submission received: 24 June 2024 / Revised: 10 August 2024 / Accepted: 12 August 2024 / Published: 13 August 2024
(This article belongs to the Special Issue Fatigue, Creep Behavior and Fracture Mechanics of Metals)

Abstract

:
The hydraulic bulge test with micro-samples is expected to be useful in the damage assessment of long-service-period metals to understand the degeneration of their mechanical properties. Since the hydraulic bulge test has a different stress state from the classical uniaxial tensile test, we need to understand their correlation and differences. In this study, the hydraulic bulge test and the uniaxial tensile test are employed to analyze the mechanical properties of three typical metals used in pressure vessels: 316L, 16MnDR, and Q345R. By utilizing Kruglov’s vertex thickness and Panknin’s curvature radius equivalent, the pressure–displacement curves from the hydraulic bulge test are converted into biaxial stress–strain curves. Based on the equivalent plastic energy model, the biaxial stress–strain curves are converted into uniaxial stress–strain curves with an error less than 10% in the strain hardening stage, achieving the unified characterization of mechanical properties under different stress states. Moreover, the hydraulic bulge test provides a more extensive strain hardening stage, and the fracture strains are 9–16.5% larger than those of uniaxial tensile test. This paper provides a reference for using the hydraulic bulge test with micro-samples in studying the mechanical properties and presents the advantages of this novel test method.

Graphical Abstract

1. Introduction

Various chemical process apparatuses may suffer significant damage during long-term service, such as creep, fatigue, and corrosion [1,2]. Assessing the damage level of the metals used in these apparatuses urgently needs to be addressed. Micro-sample testing techniques offer the advantage of being non-destruction or causing minimal destruction [3,4,5], including the small punch test (SPT), the hydraulic bulge test (HBT), the micro-sample uniaxial tensile test (UTT), and the indentation test (IT). These methods can evaluate the mechanical properties of metals and assess the damage incurred after long-term service without compromising the structural integrity of equipment. The small punch test involves applying a load on the center of a thin sample using a spherical punch until the sample fractures, while various mechanical properties, including the tensile strength [6], creep [7], fatigue [8], ductile-to-brittle transition temperature [9], and fracture toughness [10], are considered. The HBT [11,12] uses liquid to apply uniform pressure instead of a spherical punch, and the thin sample deforms in a biaxial stress state, obtaining biaxial stress–strain curves [13,14,15]. The micro-sample tensile test applies tensile force on the small sample ends until fracture, in order to obtain tensile parameters such as the elastic modulus [16,17] and yield strength [18,19]. The indentation test measures hardness [18,19] and the elastic modulus [20] by pressing a rigid indenter into the material surface.
Among these micro-sample testing techniques, the HBT is receiving widespread attention due to its ability to avoid eccentric loading and friction effects [5]. Hill [21] studied metal diaphragms under lateral pressure, investigating the changes in curvature radius and vertex thickness, laying the groundwork for subsequent semi-analytical stress solutions. Based on Hill’s work, Panknin [22] considered the fixture chamfer R d and redefined the curvature radius. Chakrabarty-Alexander [23] introduced the strain hardening coefficient n into Hill’s vertex thickness equation, while Kruglov [24] incorporated the curvature radius ρ at the vertex into the thickness equation. Table 1 and Table 2 present the mechanical models of the curvature radius and vertex thickness, proposed based on the membrane theory. Koc [25] conducted HBTs on AA5754 and AISI201 by combining experimental results with theoretical equations, and found that Panknin’s curvature radius and Kruglov’s vertex thickness calculation methods provide a suitable combination for obtaining flow stress.
The tensile mechanical properties of metals are typically obtained through uniaxial tensile tests. However, uniaxial tensile tests can only provide a hardening curve up to the point of diffuse necking, with strain generally reaching only 0.15–0.25 [26]. This strain range is often insufficient in biaxial and complex stress states. Traditionally, the hardening curve is extrapolated to higher strains, but this method has been proven to be unreliable [27]. To address this issue, the hydraulic bulge test is employed to achieve higher levels of plastic strain and flow stress. Several studies have demonstrated the advantages of the HBT over the UTT in evaluating mechanical properties in different stress states. A. Boyer [13] used bulge samples with a diameter of 240 mm to evaluate the biaxial stress–strain curves of quenched boron steel sheets at high temperatures. Their findings indicate that the HBT shows similar hardening behavior to that observed in the UTT at high temperatures. Nasser [15] studied five types of advanced high-strength steels using 254 mm × 254 mm square bulge samples and compared the results of the UTT, proving that the bulge test could achieve approximately twice the equivalent plastic strain compared to the UTT, highlighting its capability to explore higher strain ranges. Tiago [28] evaluated the plastic behavior of interstitial-free steel sheets through the HBT with a diameter of 180 mm, and an equivalent work–hardening curve, representing the higher strain ranges instead of the conventional uniaxial tensile data, was proposed based on the HBT results. Amaral [29] analyzed the mechanical properties of dual-phase steel using bulge samples with a diameter of 250 mm through the HBT. Various methodologies were applied to convert the biaxial stress–strain curve into an equivalent uniaxial curve, effectively addressing the limitations of extrapolation inherent in uniaxial tensile tests. These studies collectively demonstrate that the HBT provides a more comprehensive understanding of material behavior under different stress states and higher strain ranges compared to the UTT.
To meet the requirements of damage assessment of long-service-period metals, micro-specimen testing methods need to be developed. The hydraulic bulge test has the advantage of a biaxial stress state, but it widely uses large samples. Therefore, there is an urgent need to develop a hydraulic bulge test that uses micro-samples. The novelty of this study is proposing a conversion method for the biaxial stress–strain curve using the hydraulic bulge test and the uniaxial stress–strain curve using the uniaxial tensile test and developing our understanding of the difference between them. Three typical metals widely used in pressure vessels, 316L, 16MnDR, and Q345R, are used as the testing metals to prove the suitability of the hydraulic bulge test and the conversion method in engineering metals. This study not only presents a novelty testing method, the HBT, that can be used to understand the mechanical properties of long-service-period metals using very limited amounts of material, but also shows the advantages of the biaxial tensile test with a longer fracture strain, which has practical significance in the damage assessment of long-service-period metals in engineering.

2. Materials and Methods

2.1. Materials

Three typical steels used in pressure vessels were investigated: 316L, 16MnDR, and Q345R. 316L stainless steel is commonly used in the corrosive service environment, due to its excellent corrosion resistance, while 16MnDR steel is extensively applied in low-temperature environments because of its superior low-temperature resistance, and Q345R steel is one of the most widely used carbon steels in pressure vessels. These three metals were all commercially supplied. 316L was provided by Qingshan Iron Steel Co., Ltd. (Lishui City, China), 16MnDR was provided by Wuyang Iron and Steel Co., Ltd. (Wugang City, China), and Q345R was provided by Nanjing Iron and Steel Co., Ltd. (Nanjing City, China). The chemical compositions of the three materials are listed in Table 3.

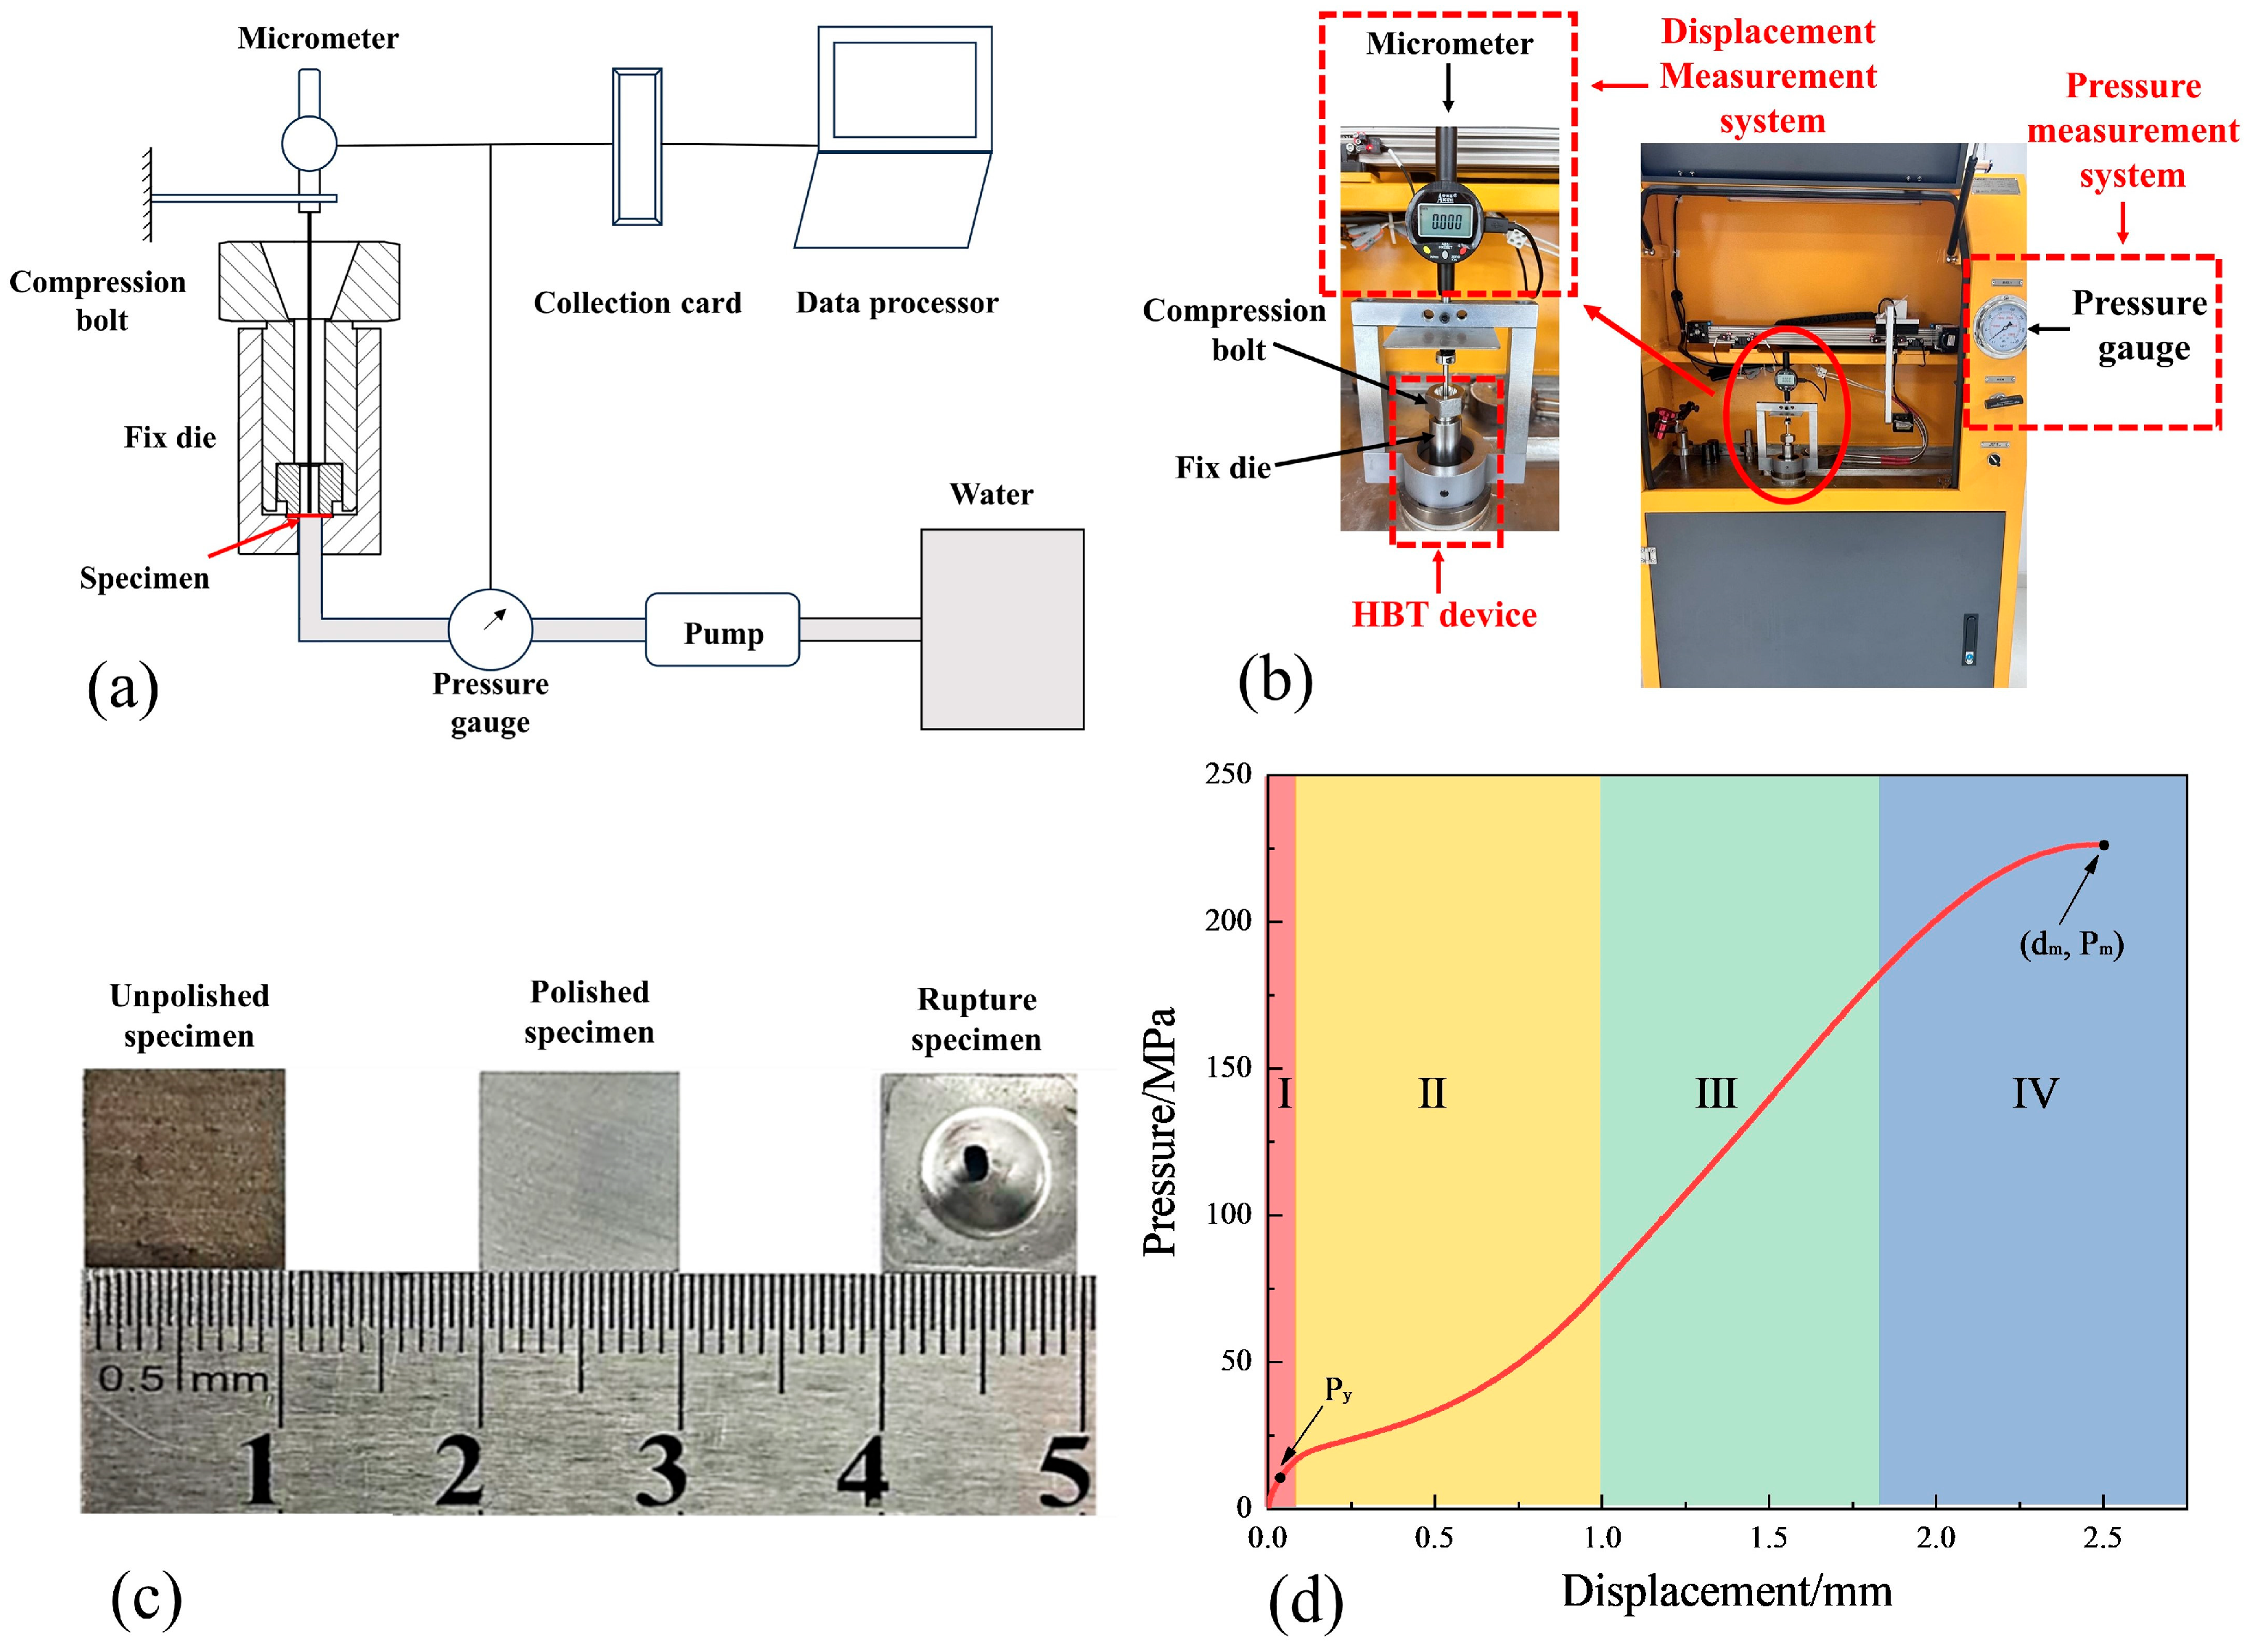
2.2. Hydraulic Bulge Test

The HBT procedure follows the guidelines of ISO 16808:2022 [30]. ISO 16808:2022 is primarily for large samples, but there is no HBT standard specified for micro-samples. The experimental process is consistent, while the sizes of the sample and the fixture are changed. The experimental details of the HBT are as follows:
(1) Figure 1a illustrates the schematic diagram of the HBT system, and Figure 1b shows a photo of the test system. The HBT system consists of a high-pressure pump, an HBT device, a pressure measurement system, and a displacement measurement system. The upper die of the HBT device has a central hole with a diameter of 5 mm and a chamfer of 1 mm. The precision of pressure measurement is 0.1 MPa, that of displacement measurement is 0.001 mm, and the maximum pressure load is 300 MPa.
(2) Figure 1c shows a HBT micro-sample, with a size of 10 mm × 10 mm and a thickness of 0.5 mm. Each sample is initially cut to a thickness of 0.6 mm using slow-rate wire cutting. Then, it is carefully polished by 800#, 1000#, and 2000# grit sandpapers step by step. During the polishing, the polishing direction is adjusted to different angles to ensure uniform thickness, and a micrometer with an accuracy of 0.001 mm is used to measure the thickness of the sample at different locations, which allows us to monitor the sample thickness in real time. When the sample achieves the target thickness within the specified error margin of 0.5 ± 0.005 mm, it is used; otherwise, it is invalid.
(3) During testing, the micro-sample is located between the upper and lower dies, and the upper die is tightened by the compression bolt. High-pressure water is added to the bottom of the sample through a pipe connected to the pump, and a 10 MPa/min loading rate is applied until the sample is fractured. The pressure–displacement curves are recorded by the pressure measurement system and the displacement measurement system. Three sets of repeated tests are performed on each material to ensure reliable test data.
(4) Figure 1d displays a typical pressure–displacement curve obtained by means of the HBT. According to the deformation and damage characteristics, the pressure–displacement curve can be divided into four stages: Stage I, the elastic bending stage; Stage II, the plastic bending stage; Stage III, the plastic hardening stage; and Stage IV, the plastic instability stage. Additionally, the mechanical parameters of the HBT can be extracted from the pressure–displacement curve, including the yield pressure P y , maximum pressure P m , and the displacement corresponding to the maximum pressure d m .

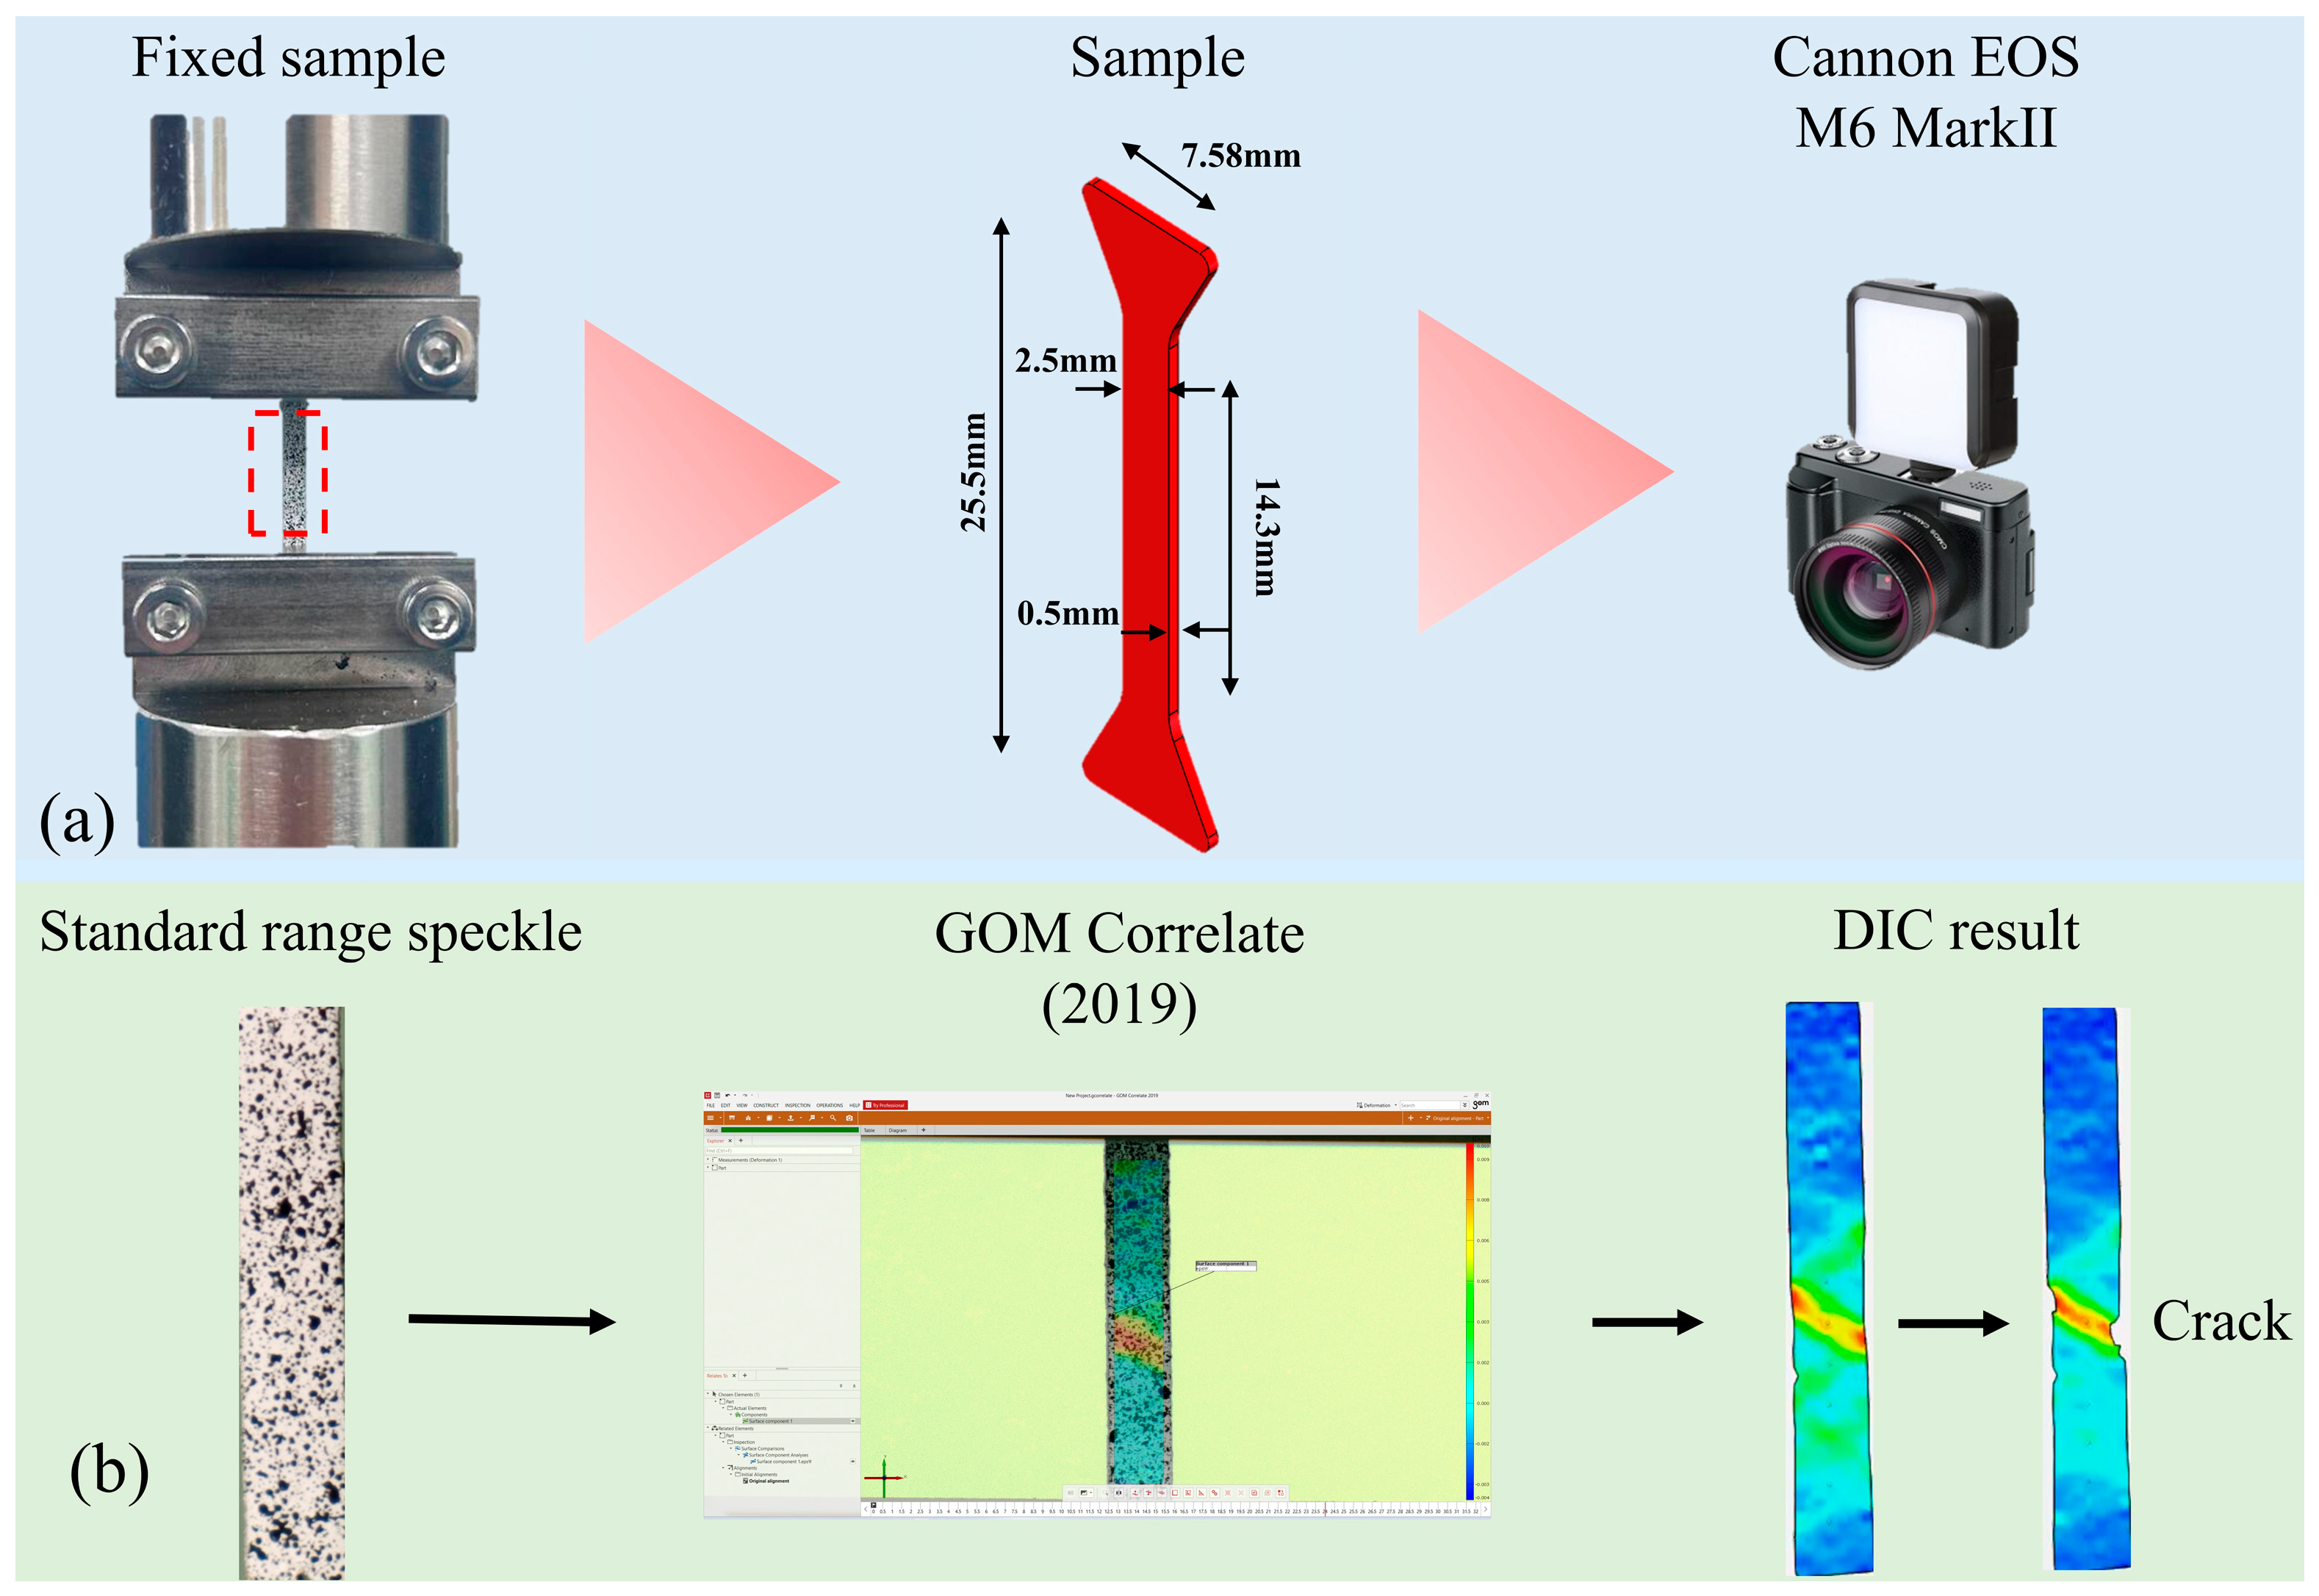
2.3. Uniaxial Tensile Test

The UTT follows the standard of BS EN ISO 6892-1:2019 [31], and digital image correlation (DIC) was utilized to obtain the stress–strain curves of 316L, 16MnDR, and Q345R. The experimental details of the UTT are as follows:
(1) Figure 2a shows the dimensions of the UTT sample, which is machined using slow-rate wire cutting and polished using 800#, 1000#, and 2000# grit sandpapers step by step. In order to obtain the strain distribution, a layer of white primer is applied on the sample surface, followed by black paint in a stochastic speckled pattern. The whole gauge section of sample is sprayed with speckle paint.
(2) The UTT is conducted using the UTM5105 electronic universal testing machine at room temperature, with a displacement rate of 0.2 mm/min. During the tensile test, a high-resolution Canon EOS M6 Mark II camera, equipped with a 32-megapixel sensor, captures images of the speckled surface. The camera takes one image every 5 s.
(3) After the tensile test, the images are imported into GOM Correlate (2019) non-contact strain measurement software [32]. Surface components are created, and Epsilon (Y) and equidistant deviation annotations are set to detect the displacement of the speckle pattern. The strain distribution on the sample surface is obtained as shown in Figure 2b.
(4) The engineering stress–strain curves can be obtained by combining the engineering strain calculated by DIC with GOM Correlate software and the engineering stress recorded by the UTM5105 electronic universal testing machine.

3. Results

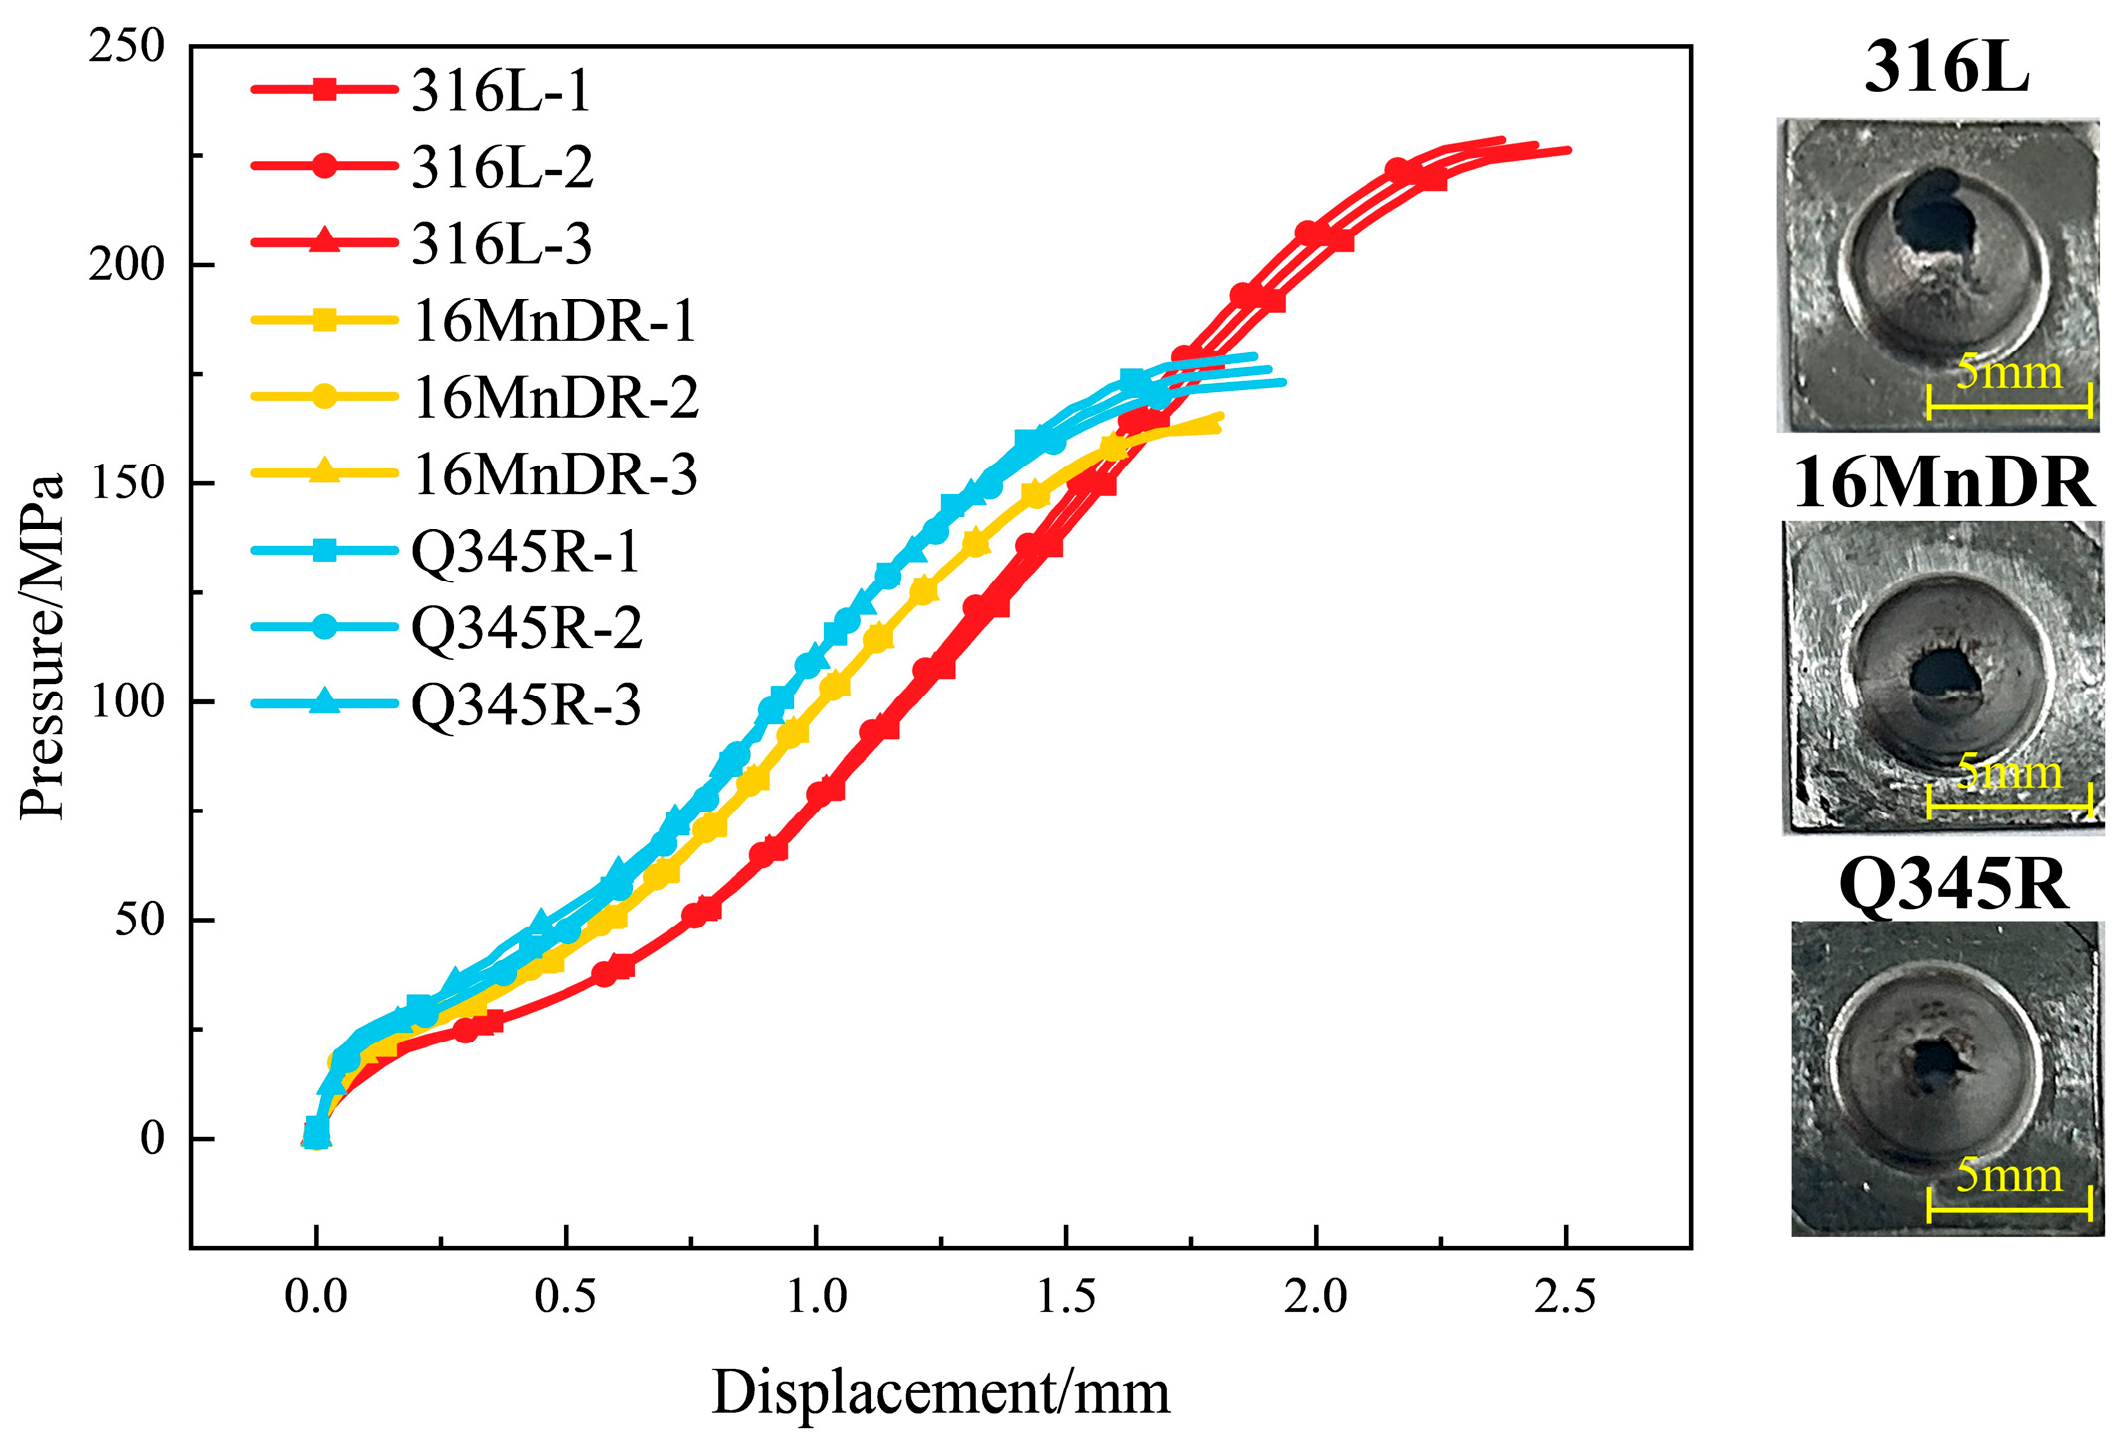
3.1. Results of the HBT

The HBT pressure–displacement curves for 316L, 16MnDR, and Q345R are depicted in Figure 3. The pressure–displacement curves of three ductile materials demonstrate similar variations, reflecting the typical characteristics of ductile materials.
In Stage I, known as the elastic bending stage, the displacement increases linearly with the load, exhibiting elastic deformation behavior, occupying a very short portion of the curve. As the pressure increases, the curve transitions into Stage II, the plastic bending stage, where irreversible plastic deformation begins, leading to an acceleration in the displacement increasing rate. When reaching the critical pressure, the curve enters into Stage III, characterized as the plastic hardening stage. In this stage, 316L has the best deformation capacity, and the area under the pressure–displacement curve is the largest, reflecting its good plasticity. Meanwhile, the displacements and the areas of the pressure–displacement curves of 16MnDR and Q345R are relatively small, indicating their lower plastic deformation capacities. Moving into Stage IV, the plastic instability stage, the pressure–displacement curve shows divergence, indicative of plastic instability phenomena. From the fracture morphologies in Figure 3, all three materials undergo ductile rupture in the central region of sample. The fracture area of the 316L sample is larger, with significant plastic deformation, while those of 16MnDR and Q345R are smaller, reflecting their lower plastic deformation capacities and toughness.
Based on the pressure–displacement curves in Figure 3, the HBT mechanical parameters can be obtained, including the yield pressure P y , maximum pressure P m , and the displacement corresponding to the maximum pressure d m . The maximum pressure P m and the displacement corresponding to the maximum pressure d m are easy to determine in the curve, while the determination method of the yield pressure is given in Figure 4. Firstly, the intersection point of the two tangent lines of the elastic stage and the plastic stage on the HBT curve is plotted. Then, the vertical line across the intersection point is given. Based on the intersection point of the vertical line and the pressure–displacement curve, the yield pressure P y can be determined [33], and d y is the displacement corresponding to the yield pressure.
The yield pressure P y , maximum pressure P m , and the displacement corresponding to the maximum pressure d m were determined from the pressure–displacement curves of 316L, 16MnDR, and Q345R, as listed in Table 4. It can be observed that the maximum pressure P m and the displacement corresponding to the maximum pressure d m of 316L are significantly higher than those of 16MnDR and Q345R, but the yield pressure is lower than that of the other two metals. This indicates that 316L has good ductility and toughness. Moreover, the detailed statistical analyses on yield load, maximum load, and the displacement corresponding to the maximum load are listed in Table 4. The standard deviations all display low values, indicating that the hydraulic bulge test results with micro-samples show good test repeatability.

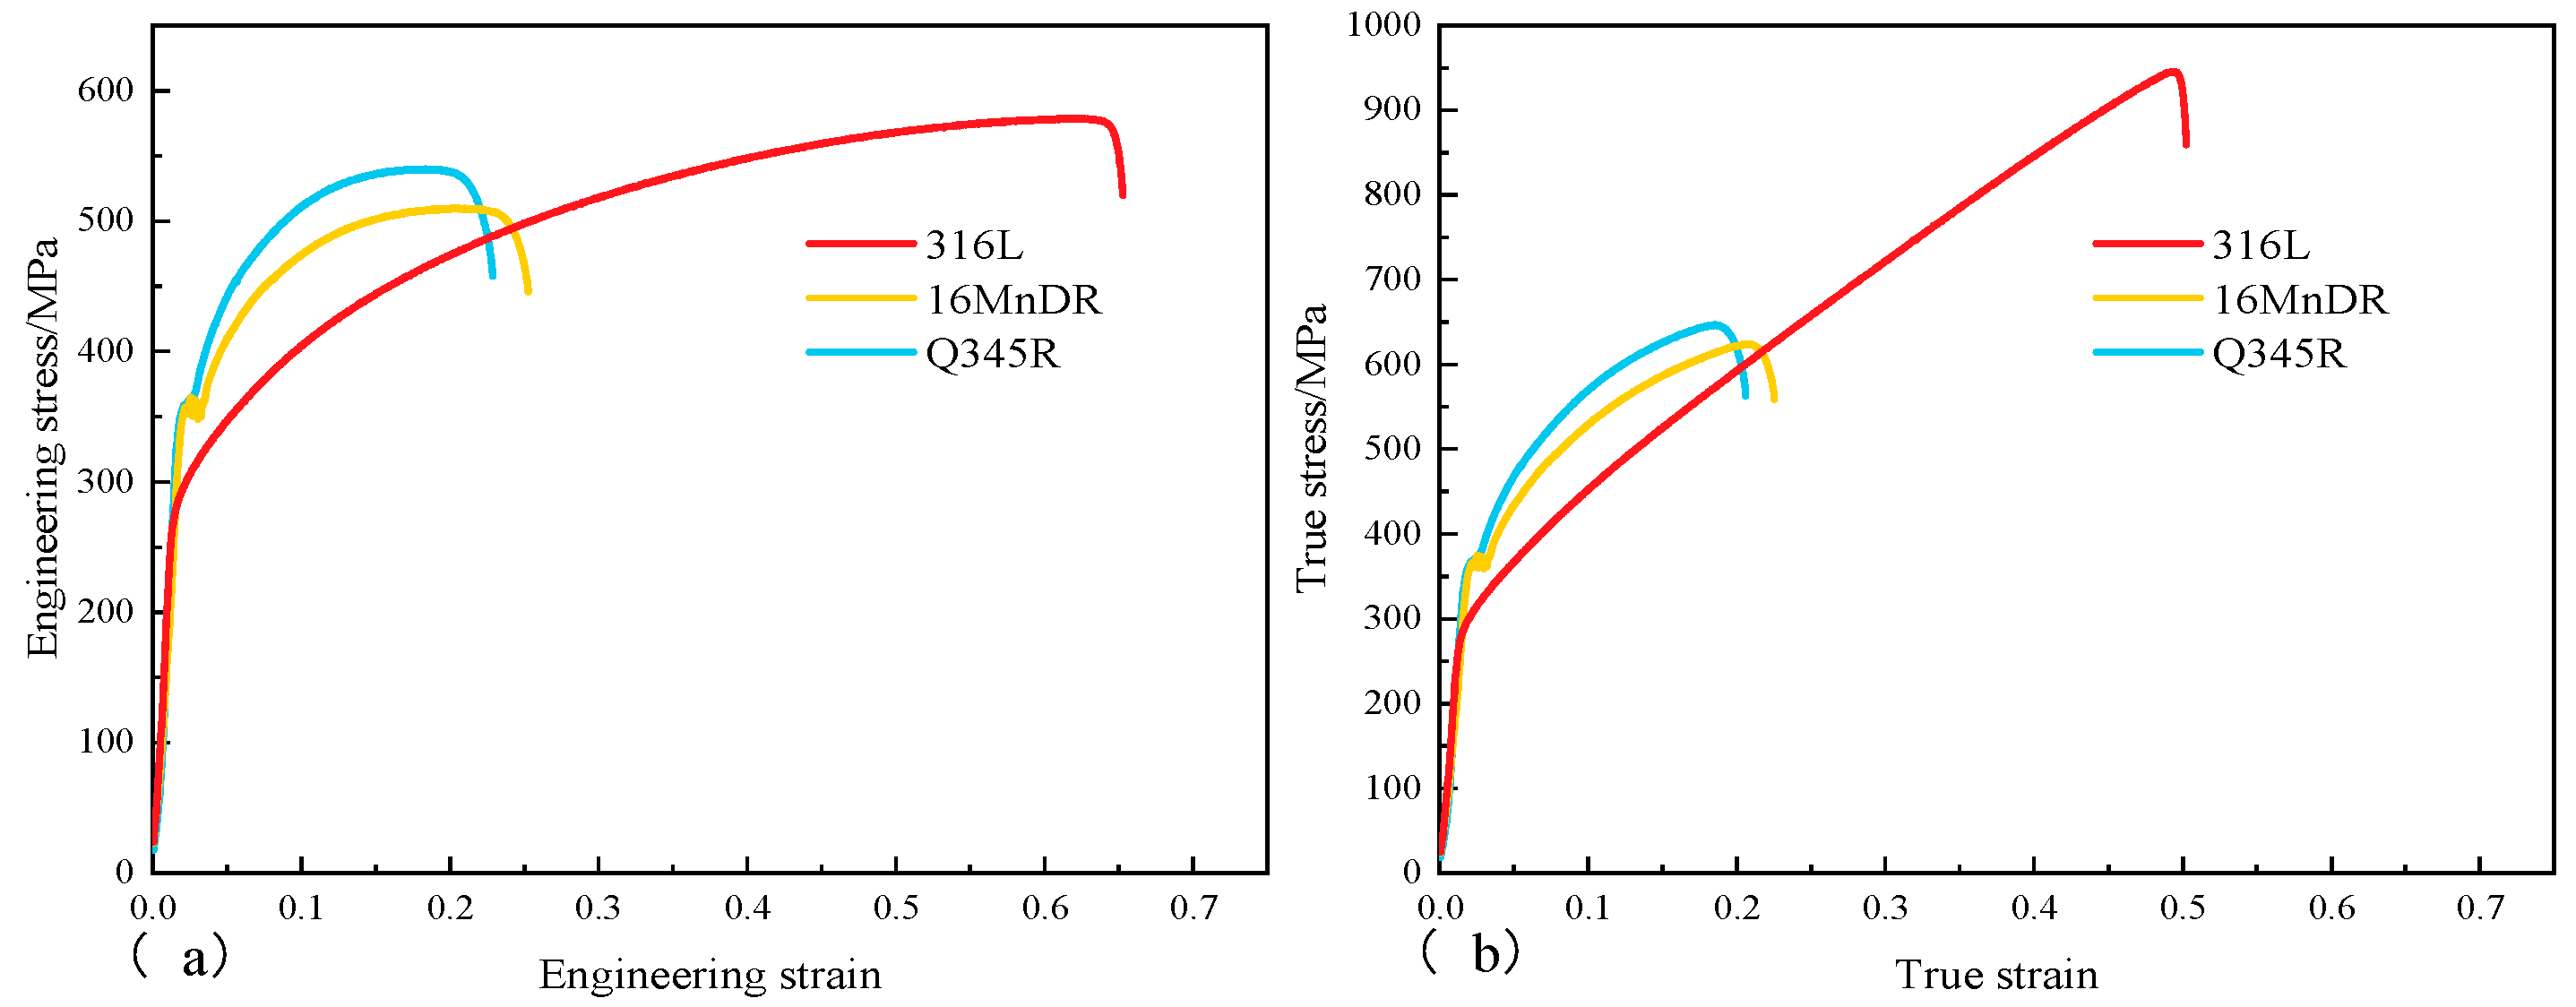
3.2. Results of the UTT

For comparison with the HBT results, 316L, 16MnDR, and Q345R were tested using the UTT. The engineering stress–strain curves of these three metals were obtained by means of the UTT, as shown in Figure 5a. Then, the engineering stress–strain curves were converted to true stress–strain curves using Equations (1) and (2), as shown in Figure 5b.
σ true = σ eng 1 + ε eng
ε true = ln 1 + ε eng
where σ true is the true stress, ε true is the true strain, σ eng is the engineering stress, and ε eng is the engineering strain.
In Figure 5, the engineering stress–strain curves of 316L, 16MnDR, and Q345R all exhibit typical deformation characteristics of ductile metals. 316L stainless steel shows the most significant plastic hardening stage, with lower yield strength but a higher ultimate tensile strength, indicating good ductility and plastic flow behavior. 16MnDR and Q345R exhibit higher yield strengths but lower ultimate strength and fracture toughness. After reaching the maximum engineering stress, the stress drops quickly, indicating poor plastic deformation capacity before fracture. The true stress–strain curves show the differences between 316L, 16MnDR, and Q345R more clearly. 316L stainless steel has the best strength, fracture strain, and ductile energy, while 16MnDR and Q345R have similar strength, deformation, and fracture parameters.
Table 5 summarizes the UTT mechanical parameters of 316L, 16MnDR, and Q345R, including the yield strength R p 0.2 and ultimate tensile strength R m . The results show that 316L has the lowest yield strength of 326.34 MPa and the highest ultimate tensile strength of 580.87 MPa, indicating that 316L begins to undergo plastic deformation at lower stresses but can withstand higher maximum stresses, demonstrating excellent ductility and plastic flow behavior. Regarding the ultimate tensile strength, that of 16MnDR is 511.34 MPa, while that of Q345R is 537.28 MPa. Although 16MnDR and Q345R have higher yield stress, their ultimate tensile strengths are lower than that of 316L, indicating that 16MnDR and Q345R can withstand lower maximum stresses, exhibiting lower ductility.

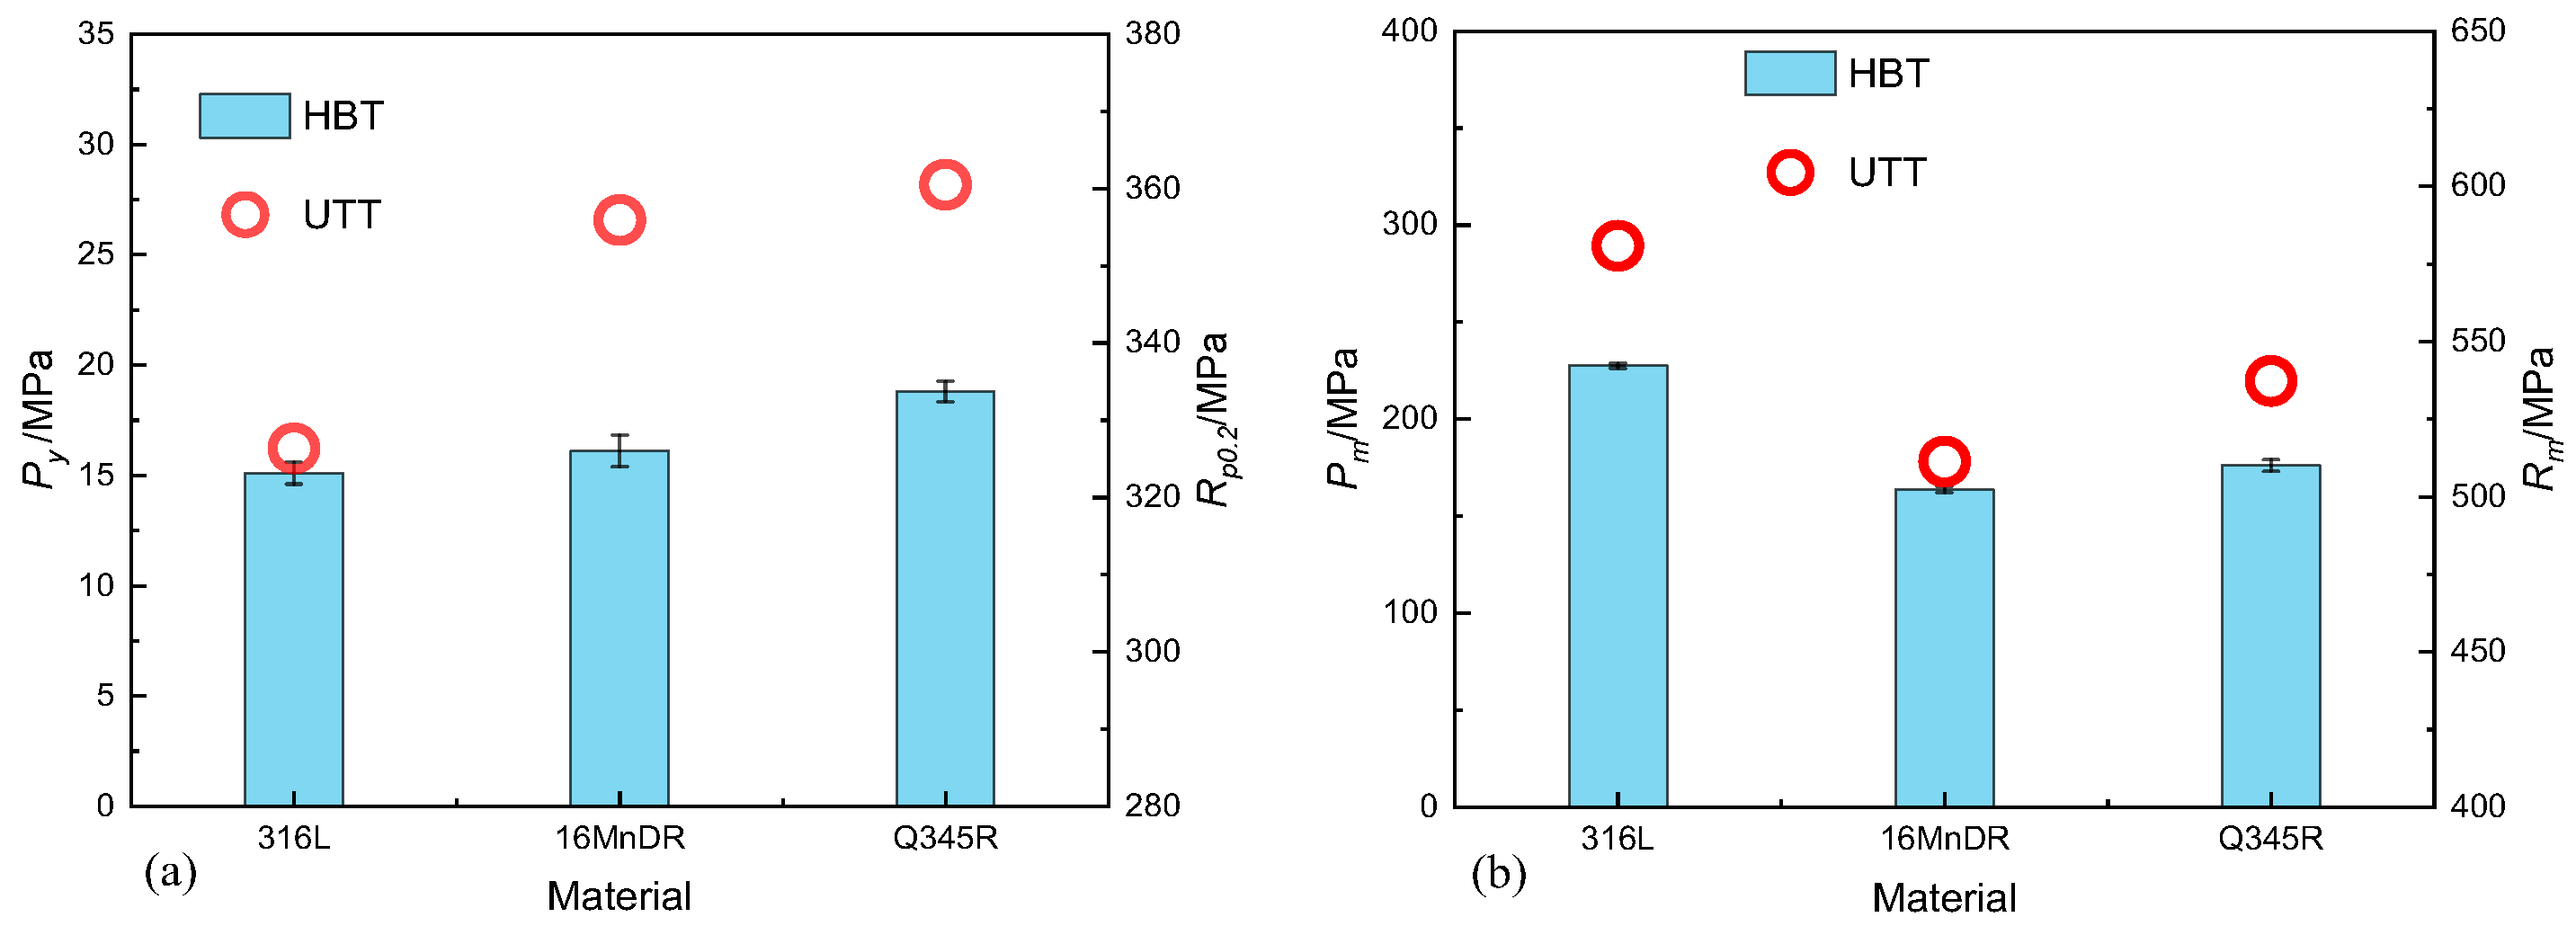
3.3. Comparison of Mechanical Parameters between the HBT and UTT

In Figure 6a, the variation in yield pressure among the metals obtained from the HBT exhibits a consistent trend with the variation in yield stress among the metals from the UTT, indicating good agreement regarding the yield behavior between the two testing methods. Figure 6b demonstrates the consistency in the variations in the HBT’s maximum pressure and the UTT’s ultimate tensile strength among the metals. Despite the good agreement in the results of the HBT and UTT, they have inherent differences in their testing principles. The HBT assesses metals’ mechanical properties in a biaxial stress state, while the UTT evaluates the mechanical properties under uniaxial stress conditions. Therefore, to accurately characterize and compare the mechanical performance of metals under different stress conditions, establishing correlation equations between the HBT and UTT results is crucial.

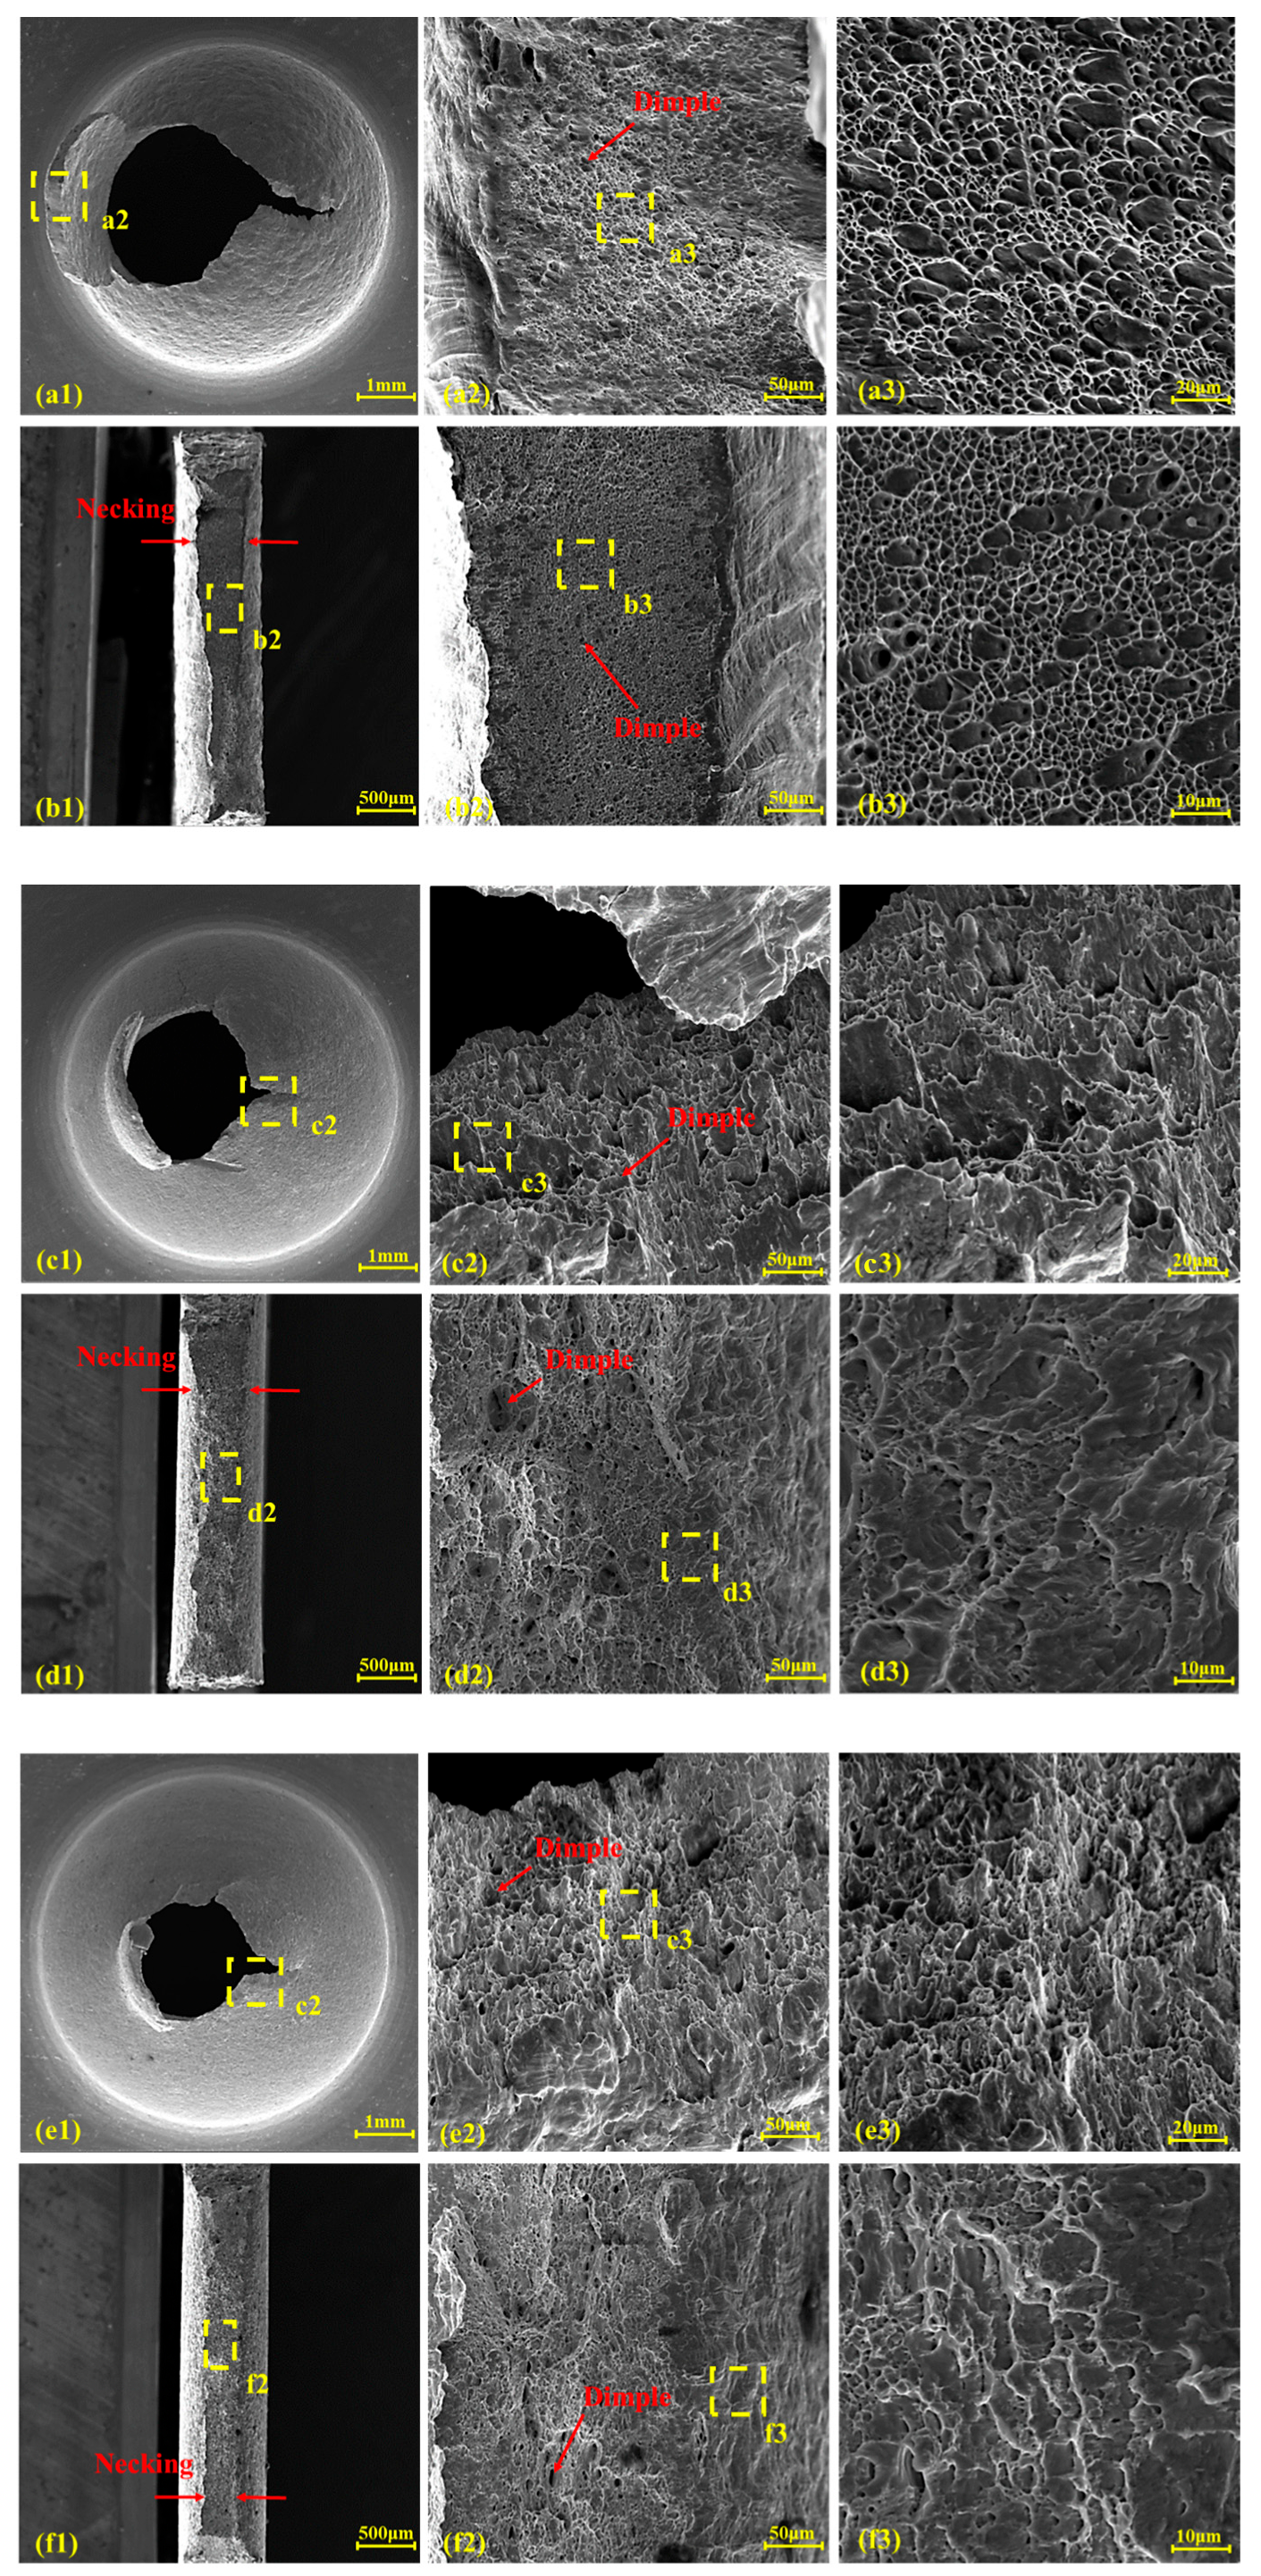
3.4. Fracture Mechanisms of the HBT and UTT

To understand the correlation of fracture mechanisms between the HBT and UTT and compare their differences, SEM observations were conducted to observe the fracture morphologies of the tested 316L, 16MnDR, and Q345R samples produced by the HBT and UTT, as shown in Figure 7.
From Figure 7(a1,c1,d1), it can be observed that under HBT conditions, the fracture samples of 316L, 16MnDR, and Q345R all exhibit explosive cracks and tearing-type fractures. The explosive area of 316L is the largest, while those of 16MnDR and Q345R are similar. From Figure 7(b1,d1,f1) under UTT conditions, the fractured samples all display distinct necking phenomena, and the necking area of 316L is the most obvious.
For 316L under HBT conditions in Figure 7(a1–a3), the fracture surface mainly exhibits uniformly distributed and deep dimples with a high density, indicating significant plastic deformation under the biaxial stress state. However, under UTT conditions in Figure 7(b1–b3), the fracture surface also displays dimple fractures, but the depth and density of dimples are relatively lower, suggesting lower deformation in the uniaxial stress state compared to the biaxial stress state.
For 16MnDR under HBT conditions in Figure 7(c1–c3), the fracture surface exhibits shallow and unevenly distributed dimples, indicating relatively weak plastic deformation capacity in the biaxial stress state. At the same time, under UTT conditions in Figure 7(d1–d3), the dimple characteristics are also shallow, and the necking phenomenon is evident, reflecting minimal deformation before fracture in the uniaxial tensile state.
As shown in Figure 7(e1–e3,f1–f3), under both HBT and UTT conditions, Q345R exhibits typical ductile fracture characteristics. As a comparison, the dimples on the fractured surface of HBT samples are more dense and more uniform than those on the UTT samples, indicating the better ductility properties provided by the HBT.
This comparison reveals that the fracture characteristics of the samples tested using the HBT and UTT are similar, and the fractured sample of 316L exhibits the best ductile fracture characteristics. Moreover, under the biaxial stress state of the HBT, the fracture surfaces have deeper and more densely distributed dimples, providng a better plastic deformation capacity and ductility characteristics. Therefore, the fracture mechanism not only relates to the metal, but also to the stress state.

4. Discussion

4.1. Correlation between the HBT and UTT

The micro-sample is placed between the upper and lower dies in the HBT. As shown in Figure 8, the radius of the upper fixture R , the radius of the upper fixture chamfer R d , and the initial thickness of the micro-sample t 0 can be directly measured. The pressure p and the dome height h can be obtained from the pressure–displacement curve during the HBT, but it is necessary to determine the vertex thickness t through analytical formulas using the initial thickness t 0 . The radius of curvature at the vertex ρ is determined through analytical formulas using the dome height h .
To obtain the biaxial stress–strain curve, it is necessary to obtain the pressure p and the dome height h during the bulge test and then convert them using correlating equations. By comparing the biaxial stress–strain curve obtained from the HBT with the true stress-plastic strain curve obtained from the UTT, the differences in the mechanical properties in the biaxial stress state and the uniaxial stress state can be observed.

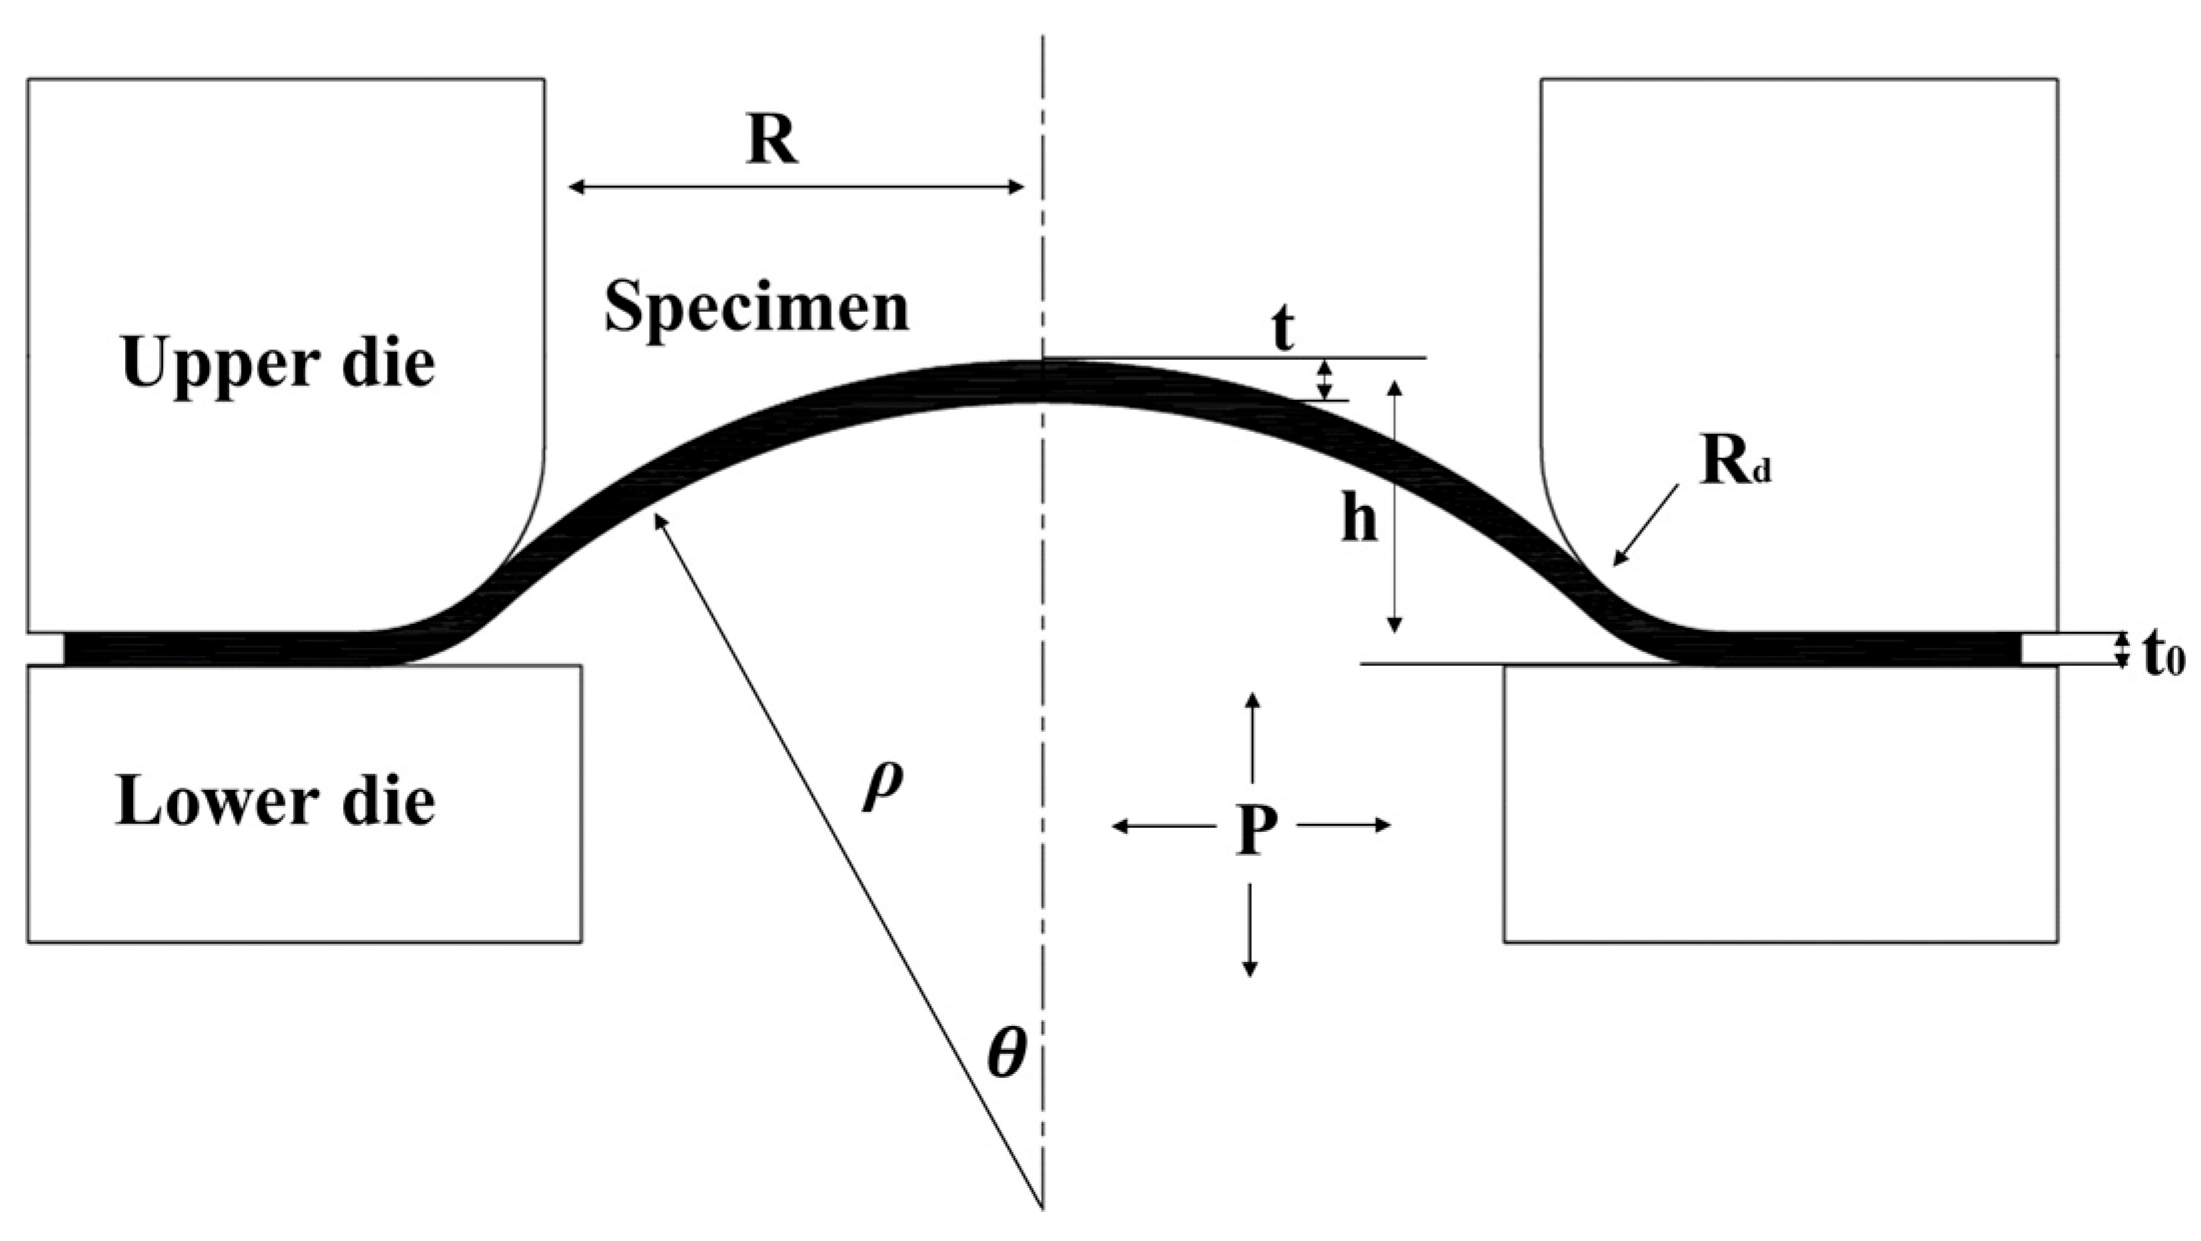
4.2. Calculation of Biaxial Stress

For the HBT in Figure 8, the square micro-sample is clamped and sealed in a circular cavity, and the pressure is continuously applied to induce biaxial deformation in the sample. Then, the micro-sample deforms into a spherical shape. During the HBT, it is assumed that the geometric shape of the bulged sample is spherical. Therefore, based on the assumption of the membrane stress state at the vertex of the bulge [13,34], the equilibrium equation is
σ 1 ρ 1 + σ 2 ρ 2 = p t
where p is the pressure, t is the current thickness at the vertex, σ 1 and σ 2 are the principal stresses, and ρ 1 and ρ 2 are the radii of curvature at the vertex. Due to axisymmetric conditions, σ 1 = σ 2 and ρ 1 = ρ 2 . The biaxial stress σ b can be calculated as
σ b = p ρ 2 t
Through Equation (4), the biaxial stress σ b can be determined, but the curvature radius ρ needs to be further calculated. According to Hill [21], it can be defined as
ρ = R 2 + h 2 2 h
where R is the radius of the upper punch and h is the dome height.
Pankin [22] considered the influence of the radius of the upper fixture chamfer and modified Equation (5) as follows:
ρ = R + R d 2 + h 2 2 R d h 2 h
where R d is the chamfer radius of the upper fixture.

4.3. Calculation of Biaxial Strain

The biaxial strain can be calculated by considering the thickness reduction at the pole [22,25]:
ε x + ε y + ε z = 0
ε x + ε y = ε z
ε t = ε z = ln t 0 t
where ε x , ε y , and ε z are the strains in the x , y , a n d   z directions, respectively. t is the thickness at the vertex and t 0 is the initial thickness.
For the calculation of the vertex thickness t , Hill [21] established an analytical formula for t based on the initial thickness t 0 and the vertex thickness t :
t = t 0 1 1 + h R d 2 2
Chakrabarty-Alexander [23] incorporated the strain hardening coefficient n into the Hill equation:
t = t 0 1 1 + h R d 2 2 n
Kruglov [24] proposed a new formula for calculating thickness, taking into account the curvature radius ρ at the vertex, making it more accurate in solving for the vertex thickness t :
t = t 0 R d ρ sin 1 R d ρ 2
Through the calculations of different curvature radius and vertex thickness solutions, Koç [25] found that the results of Panknin’s curvature radius and Kruglov’s vertex thickness calculation methods were the closest. Therefore, in this study, Equation (6) is used to calculate the curvature radius and Equation (12) is used to calculate the vertex thickness.

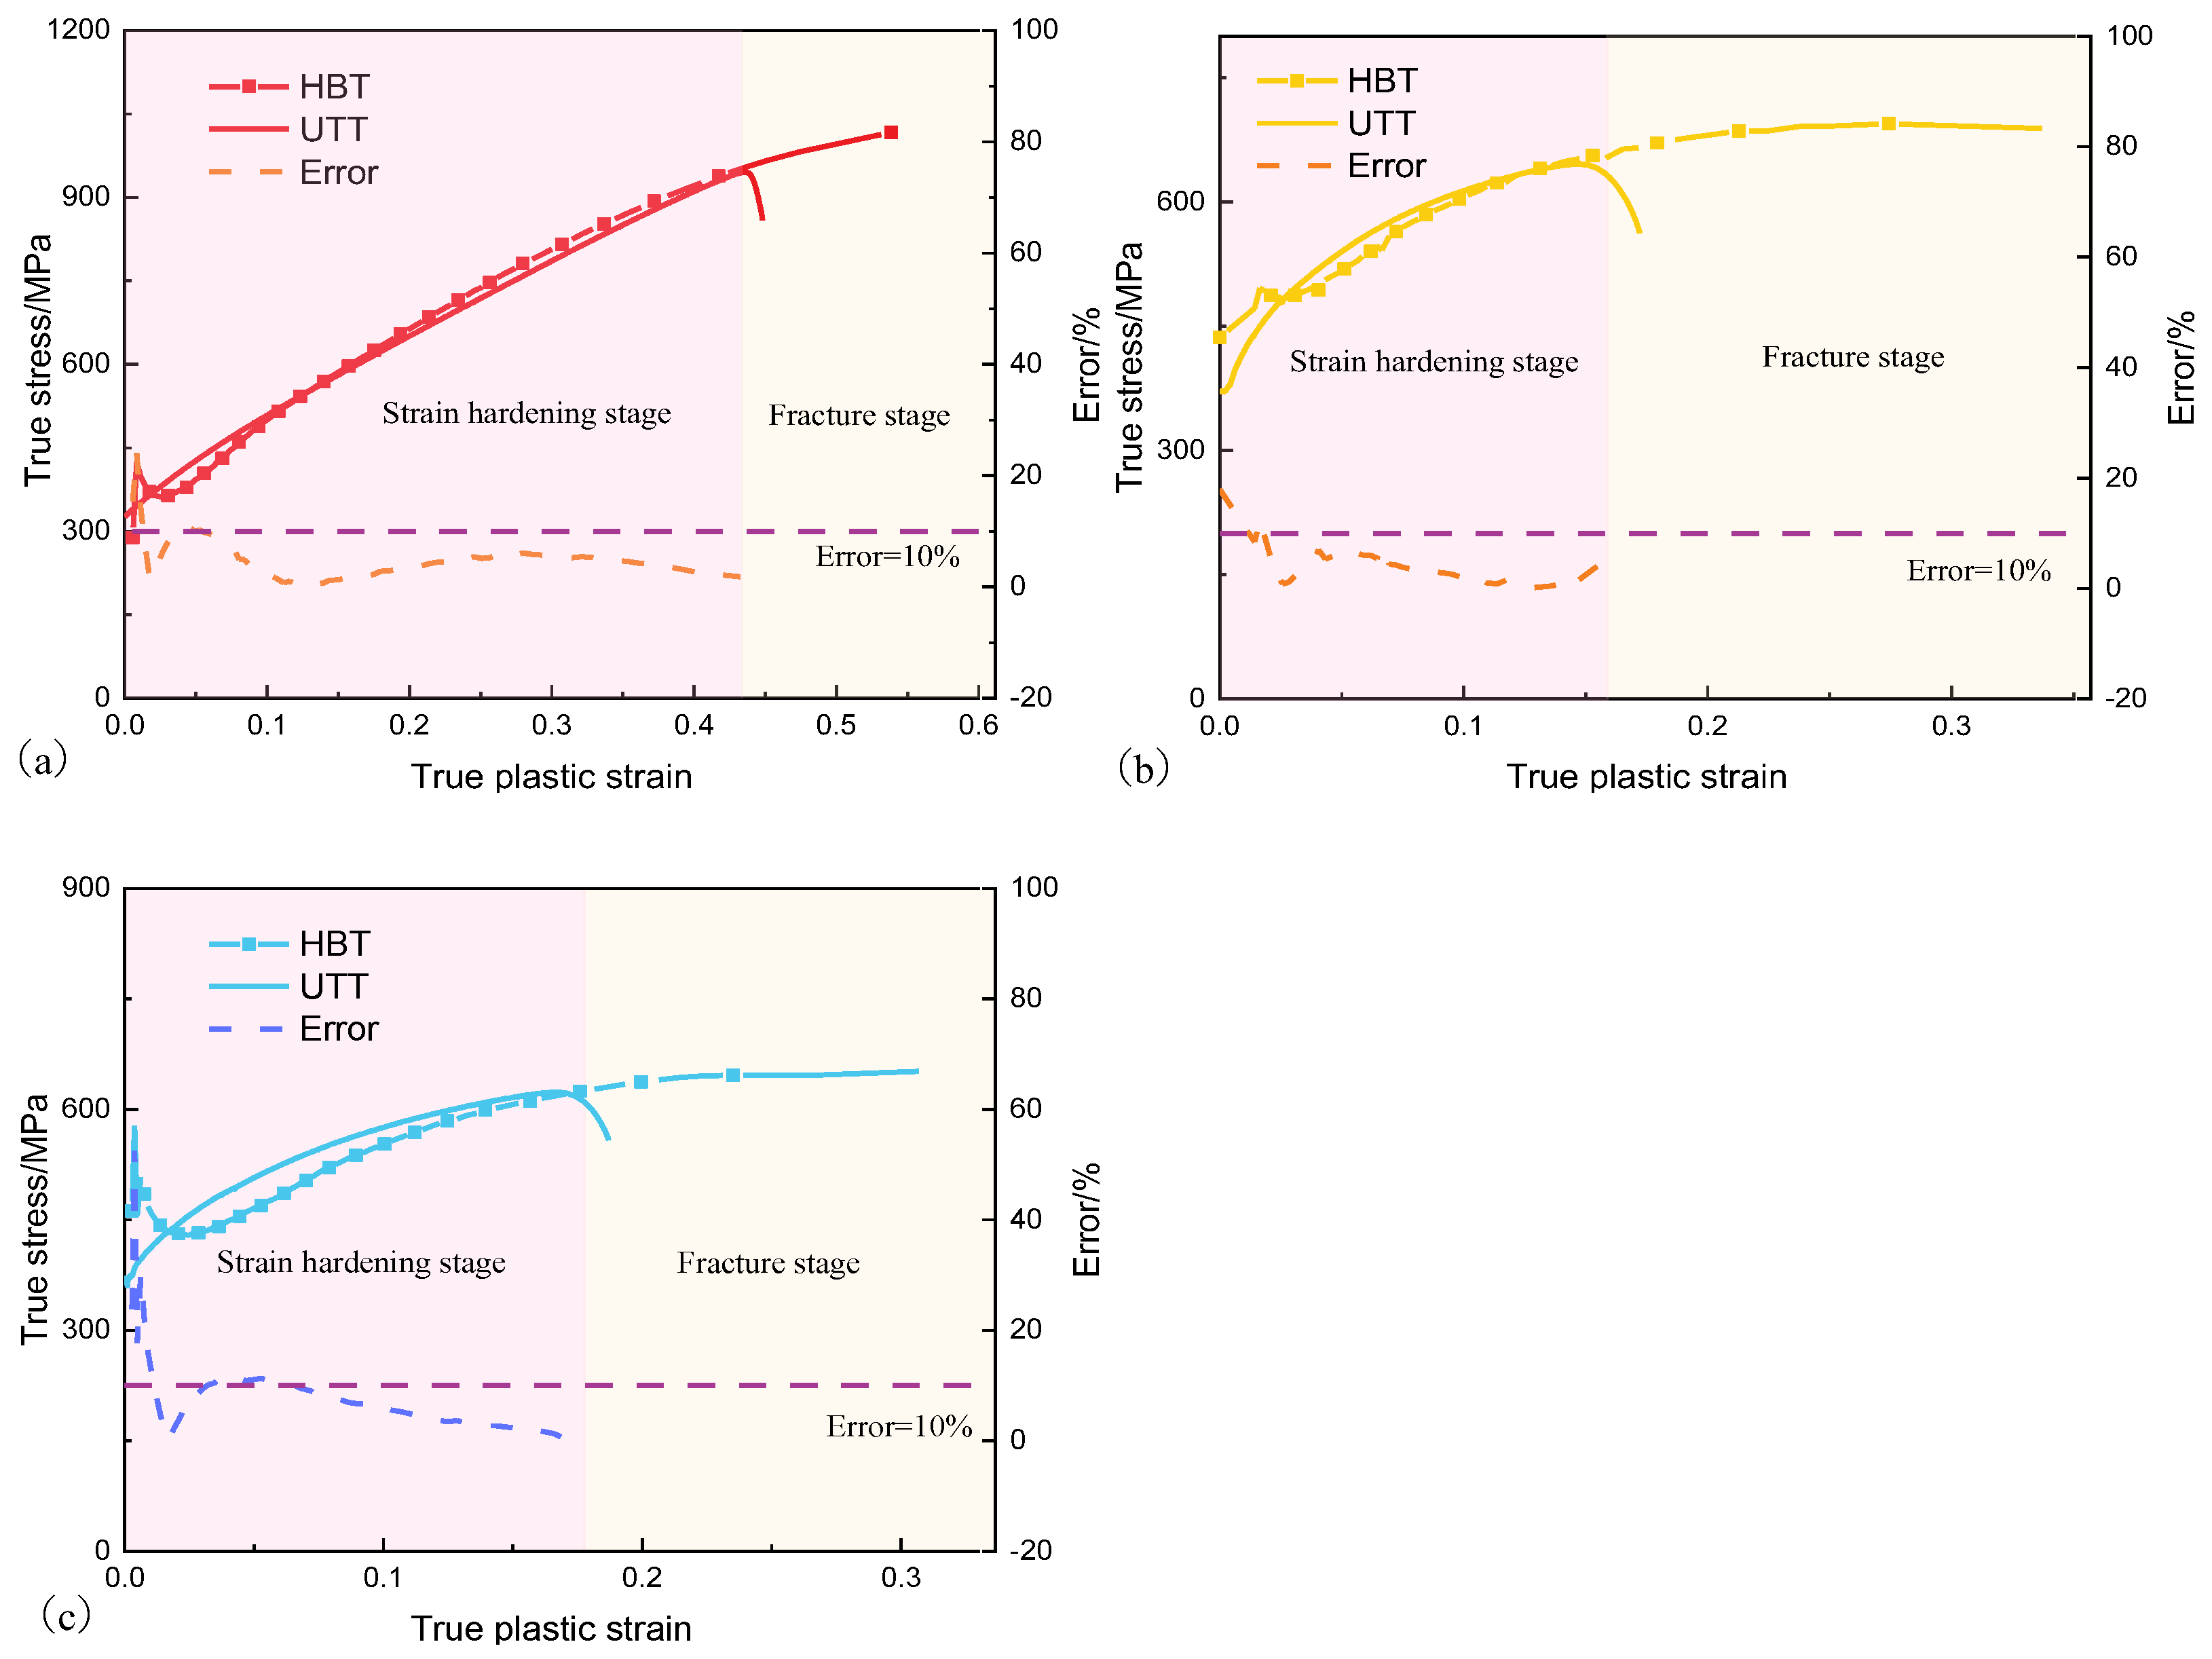
4.4. Relationship of the Stress–Strain Curves between the HBT and UTT

By using Equations (4) and (9), the HBT pressure–displacement curves of 316L, 16MnDR, and Q345R are converted into biaxial stress–strain curves. These curves are compared with the uniaxial stress–strain curves obtained from the UTT. The comparison is illustrated in Figure 9.
In Figure 9, it can be observed that there are significant differences in the biaxial stress–strain curve provided by the HBT and the uniaxial stress–strain curve provided by the UTT for the same metal. Both the strength and deformation parameters of the HBT are higher than those of the UTT. The studies on the mild steel named DX56DZ using the viscous pressure bulge test by Sigvant et al. [26] and on dual-phase steels (DP500, DP600 and DP780) using the hydraulic bulge test by Rui et al. [29] provided similar results indicating that the biaxial stress–strain curves displayed higher strength and larger fracture strain than the uniaxial stress–strain curves. Therefore, the mechanical properties are not only related to the metals, both also the stress state.
To make them comparable, the biaxial stress–strain curves obtained from the HBT need to be converted to uniaxial stress–strain curves. The principle of equivalent plastic energy is used in this paper. Assuming that the material is incompressible, the increment of plastic work per unit volume dw can be calculated as follows [26,29,34]:
dw = σ b d ε x + d ε y = σ b d ε z = σ ¯ d ε ¯
where σ ¯ is the equivalent stress, d ε ¯ is the equivalent plastic strain increment, and d ε x , d ε y , and d ε z are the strain increments in the x , y , a n d z directions, respectively.
The equivalent stress σ ¯ can be expressed as
σ ¯ = k σ b
where k is the scaling factor.
Combining Equations (13) and (14), the equivalent plastic strain increment can be expressed as
d ε ¯ = 1 k d ε z
By assuming a proportional strain path, Equation (15) can be expressed as:
ε ¯ = 1 k ε z
If the biaxial stress–strain curve is converted into a uniaxial stress–strain curve, the equivalent stress σ ¯ = σ t r u e and equivalent plastic strain ε ¯ = ε p l a s t i c from Equations (14) and (16) can be expressed as
σ true σ ¯ = ε ¯ ε p l a s t i c = k
σ b = 1 k σ true
ε t = k ε p l a s t i c
Through Equations (18) and (19), the biaxial stress–strain curve can be scaled to the uniaxial stress–strain curve by determining the value of k . Here, the conversion is based on the equivalent plastic energy, where the specific plastic work for the UTT is denoted as W u and that for the HBT is denoted as W b , as follows:
W b = σ b d ε t
W u = σ t r u e d ε p l a s t i c
The parameter k corresponding to the UTT ultimate strength point is determined, as shown in Figure 10.
W b = W u k = σ u m a x σ b
Using Equation (22), the values of k for 316L, 16MnDR, and Q345R are determined to convert the biaxial stress–strain curve into the uniaxial stress–strain curve, as listed in Table 6.
Therefore, the pressure–displacement curves obtained from the HBT are first converted into biaxial stress–strain curves using Equations (4) and (9), and then transformed into uniaxial stress–strain curves using Equations (18) and (19). Figure 11 shows the comparison of true stress–plastic strain curves obtained from the HBT and UTT.
In the strain hardening stage of the UTT, the HBT and UTT show good consistency for all three materials, and the errors are less than 10%, as shown in Figure 11. Therefore, the true stress–strain curves derived from the HBT pressure–displacement curve using Kruglov’s vertex thickness, Panknin’s curvature radius, and the equivalent plastic energy model closely match those obtained from the UTT. This demonstrates that the equivalent plastic energy model accurately converts biaxial stress–strain curves to uniaxial ones for all three metals in the strain hardening stage.
It is worth noting that, besides the good consistency in the strain hardening stage, there are also notable differences in fracture strain. As shown in Figure 11, the fracture strains of the HBT are 9%, 16.5%, and 12% larger than those of the UTT for 316L, 16MnDR, and Q345R, respectively. The viscous pressure bulge tests on the advanced high-strength steels DP 600, DP 780, DP780-CR, DP 780-HY, and TRIP 780 by Nasser [15] indicate that the flow stress data can be obtained at higher strain values under the biaxial state of stress. Moreover, for metals with relatively low ductility, such as 16MnDR and Q345R, the differences in fracture strain are more pronounced, with the HBT showing approximately twice the fracture strain of the UTT. For metals with relatively high ductility, such as 316L, this difference exists but is not significant.
The results for the three metals prove that the conversion method using Kruglov’s vertex thickness, Panknin’s curvature radius, and the equivalent plastic energy model can effectively transform the biaxial stress–strain curve into an uniaxial stress–strain curve, especially in the strain hardening stage with an error lower than 10%. Moreover, the HBT allows for a broader strain hardening stage and provides a more comprehensive understanding of the mechanical properties under biaxial stress conditions.

5. Conclusions

This paper studies the mechanical properties of 316L, 16MnDR, and Q345R using the hydraulic bulge test employing micro-samples and constructs a conversion method based on the plastic energy for the hydraulic bulge test and the uniaxial tensile test. The following conclusions are drawn:
(1) Mechanical property agreement: The variation in the hydraulic bulge test’s pressure–displacement curve among the tested metals shows good agreement with the stress–strain curve of the uniaxial tensile test, validating the effectiveness of the hydraulic bulge test in evaluating materials’ mechanical performance.
(2) Fracture characteristics: The fracture characteristics observed in the hydraulic bulge test and the uniaxial tensile test are similar, but the hydraulic bulge test shows better plastic deformation capacity and ductile characteristics due to the presence of the biaxial stress state. Specifically, the fracture surfaces provided by the hydraulic bulge test have deeper and more densely distributed dimples compared to those provided by the uniaxial tensile test.
(3) Conversion method: The calculation method using Kruglov’s vertex thickness and Panknin’s curvature radius effectively converts the pressure–displacement curve to a biaxial stress–strain curve. Using the equivalent plastic energy model, the biaxial stress–strain curve provided by the hydraulic bulge test can be transformed into a uniaxial stress–strain curve with an error less than 10% in the strain hardening stage, achieving a unified characterization of materials’ mechanical properties in different stress states.
(4) Larger fracture strain in hydraulic bulge test: The hydraulic bulge test provides a more extensive strain hardening stage compared to the uniaxial tensile test for all three metals, and the fracture strains are 9%, 16.5% and 12% larger than those of the uniaxial tensile test for 316L, 16MnDR, and Q345R, respectively.

Author Contributions

Conceptualization, J.B., Z.Z. and J.P.; Data curation, H.D.; Funding acquisition, J.P.; Investigation, J.B.; Methodology, J.B., H.D. and Z.Z.; Project administration, J.P.; Software, J.B., H.D. and Z.Z.; Supervision, Z.Z. and J.P.; Visualization, J.P.; Writing—original draft, J.B. and H.D.; Writing—review and editing, Z.Z. and J.P. All authors have read and agreed to the published version of the manuscript.

Funding

This research was funded by the National Natural Science Foundation of China, grant number 52075050, Natural Science Foundation of the Jiangsu Higher Education Institutions of China, grant number 23KJA460002, Science and Technology Planning Project of Special Equipment Safety Supervision Inspection Institute of Jiangsu Province, grant number KJ(Y)2023021.

Data Availability Statement

Data will be made available upon request.

Conflicts of Interest

The authors declare no conflicts of interest.

References

  1. Barsoum, I.; Lawal, S.A.; Simmons, R.J.; Rodrigues, C.C. Failure analysis of a pressure vessel subjected to an internal blast load. Eng. Fail. Anal. 2018, 91, 354–369. [Google Scholar] [CrossRef]
  2. Zheng, Y.; Yang, S.; Ling, X. Creep life prediction of small punch creep testing specimens for service-exposed Cr5Mo using the theta-projection method. Eng. Fail. Anal. 2017, 72, 58–66. [Google Scholar] [CrossRef]
  3. Zhang, T.; Shang, X.; Zhang, N.; Lu, K.; Xie, M. An investigation on fracture toughness predictions from mini-sized uniaxial tensile specimens with global and local approaches. Theor. Appl. Fract. Mech. 2024, 131, 104366. [Google Scholar] [CrossRef]
  4. Lai, H.S.; Wang, R.; Zhong, Y.; Du, P.; Guo, J.; Huang, Q. A modified small punch testing scheme to investigate the circumferential mechanical behavior of nuclear fuel cladding tubes. J. Nucl. Mater. 2023, 583, 154517. [Google Scholar] [CrossRef]
  5. Shi, J.; Guo, Z.-J.; Wang, J.-X.; Liu, X.; Zhou, Y.; Tang, J.-Q.; Wen, J.-F.; Tu, S.-T. A novel small specimen testing method based on a pneumatic bulging test: Measurement of tensile properties at high temperatures. Int. J. Press. Vessel. Pip. 2024, 209, 105210. [Google Scholar] [CrossRef]
  6. Jeffs, S.; Douglas, R.; Beard, W.; Coleman, M.; Adams, J.; Jones, T.; Poole, D.; Lancaster, R. Characterising the high temperature tensile behaviour of laser powder bed fused duplex stainless steel 2205 using the small punch test. Mater. Charact. 2022, 189, 111953. [Google Scholar]
  7. Peng, J.; Gao, M.; Zhang, H.; Geng, X.; Liu, X.; Pan, H. Small punch creep test reveals the differences of high-temperature creep behaviours for laser powder bed fusion and Rolled Inconel 718 alloys. Mater. Sci. Eng. A 2023, 886, 145698. [Google Scholar] [CrossRef]
  8. Wang, X.; Xu, L.; Zhao, L.; Han, Y. Evaluation of defect-related fatigue performance of additive manufacturing GH4169 via small punch test. Theor. Appl. Fract. Mech. 2023, 128, 104162. [Google Scholar] [CrossRef]
  9. Altstadt, E.; Bergner, F.; Houska, M. Use of the small punch test for the estimation of ductile-to-brittle transition temperature shift of irradiated steels. Nucl. Mater. Energy 2021, 26, 100918. [Google Scholar] [CrossRef]
  10. Zu, Y.; Cao, Y.; Zhen, Y.; Li, F.; Wu, G. Determination on the fracture toughness of the welded joints of X80 pipeline steels based on small punch test. Eng. Fract. Mech. 2023, 291, 109525. [Google Scholar] [CrossRef]
  11. Chen, K.; Scales, M.; Kyriakides, S.; Corona, E. Effects of anisotropy on material hardening and burst in the bulge test. Int. J. Solids Struct. 2016, 82, 70–84. [Google Scholar] [CrossRef]
  12. Kim, H.; Lee, J.; Barlat, F.; Kim, D.; Lee, M.-G. Experiment and modeling to investigate the effect of stress state, strain and temperature on martensitic phase transformation in TRIP-assisted steel. Acta Mater. 2015, 97, 435–444. [Google Scholar] [CrossRef]
  13. Boyer, A.; Demazel, N.; Coër, J.; Carin, M.; Laurent, H.; Oliveira, M.C. A novel hydraulic bulge test in hot forming conditions. J. Mater. Process. Technol. 2023, 316, 117917. [Google Scholar]
  14. Liu, K.; Lang, L.; Cai, G.; Yang, X.; Guo, C.; Liu, B. A novel approach to determine plastic hardening curves of AA7075 sheet utilizing hydraulic bulging test at elevated temperature. Int. J. Mech. Sci. 2015, 100, 328–338. [Google Scholar] [CrossRef]
  15. Nasser, A.; Yadav, A.; Pathak, P.; Altan, T. Determination of the flow stress of five AHSS sheet materials (DP 600, DP 780, DP 780-CR, DP 780-HY and TRIP 780) using the uniaxial tensile and the biaxial Viscous Pressure Bulge (VPB) tests. J. Mater. Process. Technol. 2010, 210, 429–436. [Google Scholar]
  16. Dzugan, J.; Lucon, E.; Koukolikova, M.; Li, Y.; Rzepa, S.; Yasin, M.S.; Shao, S.; Shamsaei, N.; Seifi, M.; Lodeiro, M.; et al. ASTM interlaboratory study on tensile testing of AM deposited and wrought steel using miniature specimens. Theor. Appl. Fract. Mech. 2024, 131, 104410. [Google Scholar]
  17. Jackson, K.M. Fracture strength, elastic modulus and Poisson’s ratio of polycrystalline 3C thin-film silicon carbide found by microsample tensile testing. Sens. Actuators A Phys. 2005, 125, 34–40. [Google Scholar]
  18. Jiao, Y.; Chen, Y.; Yang, H.; Wang, C. Experimental characterization on fracture behavior of UHPMC under small-scale sample tensile testing: Acoustic emission monitoring and digital image correlation. Theor. Appl. Fract. Mech. 2024, 130, 104342. [Google Scholar]
  19. Molak, R.M.; Paradowski, K.; Brynk, T.; Ciupinski, L.; Pakiela, Z.; Kurzydlowski, K.J. Measurement of mechanical properties in a 316L stainless steel welded joint. Int. J. Press. Vessel. Pip. 2009, 86, 43–47. [Google Scholar] [CrossRef]
  20. Qian, X.; Cao, Y.; Liu, Z.; Lu, J. Influence of hardening behaviour of elastoplastic materials on the determination of elastic modulus using indentation tests. Mater. Sci. Eng. A 2010, 527, 4571–4575. [Google Scholar]
  21. Hill, R.C. A theory of the plastic bulging of a metal diaphragm by lateral pressure. Lond. Edinb. Dublin Philos. Mag. J. Sci. 1950, 41, 1133–1142. [Google Scholar] [CrossRef]
  22. Gutscher, G.; Wu, H.-C.; Ngaile, G.; Altan, T. Determination of flow stress for sheet metal forming using the viscous pressure bulge (VPB) test. J. Mater. Process. Technol. 2004, 146, 1–7. [Google Scholar] [CrossRef]
  23. Chakrabarty, J.; Alexander, J.M. Hydrostatic bulging of circular diaphragms. J. Strain Anal. Eng. Des. 1970, 5, 155–161. [Google Scholar] [CrossRef]
  24. Kruglov, A.A.; Enikeev, F.U.; Lutfullin, R.Y. Superplastic forming of a spherical shell out a welded envelope. Mater. Sci. Eng. A 2002, 323, 416–426. [Google Scholar] [CrossRef]
  25. Koç, M.; Billur, E.; Cora, Ö.N. An experimental study on the comparative assessment of hydraulic bulge test analysis methods. Mater. Des. 2011, 32, 272–281. [Google Scholar] [CrossRef]
  26. Sigvant, M.; Mattiasson, K.; Vegter, H.; Thilderkvist, P. A viscous pressure bulge test for the determination of a plastic hardening curve and equibiaxial material data. Int. J. Mater. Form. 2009, 2, 235–242. [Google Scholar] [CrossRef]
  27. Atkinson, M. Accurate determination of biaxial stress-strain relationships from hydraulic bulging tests of sheet metals. Int. J. Mech. Sci. 1997, 39, 761–769. [Google Scholar] [CrossRef]
  28. Gonoring, T.B.; Moreira, L.P.; Orlando, M.T.D.A. An equivalent work-hardening description of an interstitial-free steel sheet based on uniaxial tensile and hydraulic bulge tests. J. Mater. Res. Technol. 2021, 13, 2138–2143. [Google Scholar] [CrossRef]
  29. Amaral, R.; Santosa, A.D.; Lopes, A.B. Mechanical properties determination of dual-phase steels using uniaxial tensile and hydraulic bulge test. Ciênc. Tecnol. Dos Mater. 2017, 29, e239–e243. [Google Scholar] [CrossRef]
  30. ISO 16808:2022; Metallic Materials—Sheet and Strip—Determination of Biaxial Stress-Strain Curve by Means of Bulge Test with Optical Measuring Systems. ISO: Geneva, Switzerland, 2022.
  31. BS EN ISO 6892-1; Metallic Materials-Tensile Testing-Part 1: Method of Test at Room Temperature. British Standards Institution: London, UK, 2019.
  32. GOM GmbH. (n.d.). GOM Correlate. Available online: https://www.gom.com (accessed on 1 October 2020).
  33. Moreno, M.F.; Bertolino, G.; Yawny, A. The significance of specimen displacement definition on the mechanical properties derived from Small Punch Test. Mater. Des. 2016, 95, 623–631. [Google Scholar] [CrossRef]
  34. Mirnia, M.J.; Vahdani, M. Calibration of ductile fracture criterion from shear to equibiaxial tension using hydraulic bulge test. J. Mater. Process. Technol. 2020, 280, 116589. [Google Scholar] [CrossRef]
Figure 1. HBT device, sample, and typical result: (a) schematic diagram of the HBT device; (b) HBT device and pressure–displacement measurement system; (c) micro-sample; (d) pressure–displacement curve.
Metals 14 00917 g001
Figure 2. UTT: (a) micro-sample dimensions; (b) full-field strain measurement by DIC.
Metals 14 00917 g002
Figure 3. HBT pressure–displacement curves and fracture morphologies of 316L, 16MnDR, and Q345R.
Metals 14 00917 g003
Figure 4. Yield pressure determination method.
Metals 14 00917 g004
Figure 5. Stress–strain curves of 316L, 16MnDR, and Q345R: (a) engineering stress–strain curves; (b) true stress–strain curves.
Metals 14 00917 g005
Figure 6. Comparison of mechanical parameters of the UTT and HBT: (a) yield parameters; (b) ultimate tensile parameters.
Metals 14 00917 g006
Figure 7. Comparison of fracture morphologies between the HBT and UTT tests: (a1a3) 316L-HBT; (b1b3) 316L-UTT; (c1c3) 16MnDR-HBT; (d1d3) 16MnDR-UTT; (e1e3) Q345R-HBT; (f1f3) Q345R-UTT.
Metals 14 00917 g007
Figure 8. Structural model of the HBT.
Metals 14 00917 g008
Figure 9. Comparison of the biaxial stress–strain curve provided by the HBT and the uniaxial stress–strain curve provided by the UTT: (a) 316L; (b) 16MnDR; (c) Q345R.
Metals 14 00917 g009
Figure 10. Stress–plastic work curves obtained from the HBT and UTT.
Metals 14 00917 g010
Figure 11. The true stress–plastic strain curves obtained from the HBT and UTT: (a) 316L; (b) 16MnDR; (c) Q345R.
Metals 14 00917 g011
Table 1. Models for curvature radius.
ApproachCurvature Radius
Hill [21] ρ = R 2 + h 2 2 h
Pankin [22] ρ = R + R d 2 + h 2 2 R d h 2 h
Table 2. Models for vertex thickness.
ApproachVertex Thickness
Hill [21] t = t 0 1 1 + h R d 2 2
Chakrabarty-Alexander [23] t = t 0 1 1 + h R d 2 2 n
Kruglov [24] t = t 0 R d ρ s i n 1 R d ρ 2
Table 3. Chemical compositions of 316L, 16MnDR, and Q345R (wt.%).
ElementCSiSPCrNiMnMoAlFe
316L0.0170.520.0240.01116.7210.120.712.56-Bal.
16MnDR0.140.350.00120.013--1.47-0.045Bal.
Q345R0.180.240.0070.0150.030.011.270.005-Bal.
Table 4. HBT mechanical parameters of 316L, 16MnDR, and Q345R.
Material P y /MPa P m /MPa d m /mm
316L-114.6226.32.50
316L-215.1228.62.37
316L-315.6227.42.44
316L-Mean15.1227.42.44
316L-Standard deviation0.501.150.06
16MnDR-116.3165.51.81
16MnDR-215.3163.31.79
16MnDR-316.7162.41.80
16MnDR-Mean16.1163.71.80
16MnDR-Standard deviation0.721.590.01
Q345R-119.3179.11.88
Q345R-218.4173.11.83
Q345R-318.7176.11.90
Q345R-Mean18.8176.11.87
Q345R-Standard deviation0.463.010.04
Table 5. Mechanical parameters of 316L, 16MnDR, and Q345R in the UTT.
MaterialRp0.2/MPaRm/MPa
316L326.34580.87
16MnDR355.92511.34
Q345R360.52537.28
Table 6. Values of k of 316L, 16MnDR, and Q345R.
Material316L16MnDRQ345R
k0.91410.81570.8284
Disclaimer/Publisher’s Note: The statements, opinions and data contained in all publications are solely those of the individual author(s) and contributor(s) and not of MDPI and/or the editor(s). MDPI and/or the editor(s) disclaim responsibility for any injury to people or property resulting from any ideas, methods, instructions or products referred to in the content.

