Article

The 650 °C Tensile Deformation of Graded IN718-René41 Superalloy Fabricated by Laser Blown-Powder Directed Energy Deposition

1
GE Aerospace Research, 1 Research Circle, Niskayuna, NY 12309, USA
2
Neutron Scattering Division, Oak Ridge National Laboratory, 1 Bethel Valley Rd., Oak Ridge, TN 37830, USA
3
Edison Welding Institute, 683 Northland Avenue, Buffalo, NY 14211, USA
*
Authors to whom correspondence should be addressed.
Metals 2024, 14(8), 950; https://doi.org/10.3390/met14080950 (registering DOI)
Submission received: 16 July 2024 / Revised: 13 August 2024 / Accepted: 19 August 2024 / Published: 21 August 2024
(This article belongs to the Special Issue Composition Design and Damage Mechanism of Crystal Superalloys)

Abstract

:
The microstructure and 650 °C tensile properties of a compositionally graded IN718-René41 (718-R41) superalloy fabricated by laser blown-powder directed energy deposition (DED-LB/M) are investigated to understand structure–property relationships and baseline tensile properties. Digital Image Correlation (DIC), in situ neutron diffraction, and conventional characterization techniques are performed to study the as-built and heat-treated states. The applied heat treatment generates static recrystallization and equiaxed grains in 718-rich compositions, while R41-rich compositions remain partially or un-recrystallized possibly influenced by a higher MC carbide fraction (>0.5%). The yield strengths of the 718 and R41 sections in the heat-treated state are comparable to wrought forms but the graded compositions show weakness due to unoptimized heat treatment. Diffraction elastic constants first decrease and then increase along the 718-R41 composition gradient, while a small difference is observed between the as-built and heat-treated states and γ, γ′ phases. Overall, the compositionally graded region shows a smooth transition in the elastic properties. Grain-level load transfer from the (220) to (200) grains shows compositional dependence, and qualitatively agrees with DIC-measured macroscopic yield strength. Within the (200) grains, the γ/γ′ phases deform elastically until the γ phase yields and afterwards, the γ′ phase takes load from the γ phase.

1. Introduction

Additive manufacturing (AM) has brought new capabilities for the development of Functionally Graded Material (FGM) in the past decade [1,2,3,4,5,6]. Unlike the conventional welding and cladding approach for multiple materials, AM makes it easier to deposit mixed powder and tailor location-specific material chemistry, microstructure, and properties of FGM structure. Thus, it offers a new degree of freedom in material and component design that could lead to innovations beyond state-of-the-art material/manufacturing technologies. Several AM modalities, i.e., directed energy deposition (DED), laser powder bed fusion (LPFB), electron beam melting (EBM), cold spray, etc., have demonstrated the feasibility of manufacturing FGM coupons or prototypes [1,2,3,4].
The motivation of the present work is to develop a graded IN718-René41 (718-R41) superalloy structure by laser blown-powder directed energy deposition (DED-LB/M) with balanced performance and cost, which potentially replaces a single cast/wrought alloy (with R41 equivalent temperature capability) or dissimilar metal weld structure. 718-R41 combination is chosen due to established DED build parameters for 718 and the availability of the commercial powder of the two alloys. DED-LB/M additive modality is chosen to manufacture FGM coupons owing to its flexibility in mixing powders from different hoppers to custom gradient compositions. The structural components operated in temperature gradient require higher temperature capability at one end (i.e., up to 900 °C) and lower temperature capability at the other end (i.e., up to 600 °C). Compared to using a higher temperature superalloy (900 °C capability) for the whole structure or joining dissimilar alloys, a compositionally graded superalloy structure offers several advantages, such as matching alloy capability to thermal gradient, reducing component cost by allowing the use of a less expensive alloy, eliminating welds or mechanical joints, and allowing gradual transition in physical properties. However, developing compositionally graded superalloys also faces several technical challenges, such as the compatibility of terminal materials and gradient path design, cracking susceptibility of medium to high γ′ superalloys, additive manufacturing process control to minimize defects, and heat treatment optimization for mechanical properties.
To the best of our knowledge, the published research on graded superalloys is quite limited [7,8,9,10,11,12,13,14] compared to the number of publications for other graded dissimilar alloys. Although the existing literature shows the feasibility of creating a unique graded superalloy or microstructure, the limitation of superalloy FGM is not well addressed, and microstructure–property relationship within the graded zone is not fully understood. Several papers have shown success in the microstructure grading of 718 by modifying AM process parameters such as heat input and scanning strategy, which drastically change grain structure (columnar vs. equiaxed grain), grain size, texture, and dendrite orientation [7,8]. Grain size grading, i.e., fine grain size at the bore and coarse grain size at the rim of a turbine disk in 718 was achieved by advanced heat treatment after forging to balance tensile, creep, and fatigue properties at the bore and rim of the disk [9]. A gradient of nano to micron grain size as well as residual stress was generated at a surface depth of ~500 µm using an ultrasonic surface rolling process (a severe plastic deformation method), resulting in a significant increase in fretting fatigue life at 600 °C [10]. Directional recrystallization heat treatment with varying draw rates produced a graded structure of fine equiaxed grains and columnar coarse grains in LPBF IN738LC to balance location-specific fatigue and creep properties [11]. In terms of compositional grading, a complex gradient pattern between two superalloys was made by powder DED for turbine blisk application, and the selected heat treatment achieved tensile properties comparable to the terminal alloys in cast form despite a creep property debit [12]. Although hardness profile across the gradient zone and bulk tensile curves were reported, the paper did not investigate microstructure response to heat treatment and local deformation within the gradient zone. IN625 coating with a gradient of γ′ precipitates in 10–80% was in situ synthesized by plasma-transferred arc deposition using a mixture of IN625 powder and Ni, Al elemental powders [13]. This graded IN625 coating was reported to show good weldability, improved hardness, and oxidation resistance compared to the IN625 bulk. Compositional grading in a superalloy from low to high γ′ was built by powder DED as a high throughput method for superalloy design and property screening [14]. However, this work did not intend to create a graded superalloy structure and perform a detailed evaluation of its gradient zone.
In a previous study, we fabricated crack-free single-pass thin wall specimens in 718/R41 graded composition using DED-LB/M and mapped the residual stress profile [15]. R41 is a medium γ′ alloy (~30% volume fraction of γ′) with up to 900 °C temperature capability and cost, whereas 718 is a γ′/γ″ strengthened alloy with up to 650 °C temperature capability and cost. Lately, defect-free 718-R41 graded thick blocks have been successfully built using the contour and hatch scan strategy. In the present work, we experimentally investigated tensile properties within the graded region to improve the understanding of the structure–property relationship and evaluate a baseline heat treatment condition. The composition-dependent stress–strain response of 718-R41 graded alloy was determined by in situ Digital Image Correlation (DIC) and tensile test. Diffraction elastic constants (DECs), grain and phase level yielding, and load partition as a function of composition were quantified using in situ neutron diffraction for the as-built and heat-treated specimens. The influence of heat treatment on microstructure and tensile behavior was discussed. This work presents novelty in revealing microstructure and mesoscale deformation of graded superalloys fabricated by DED-LB/M.

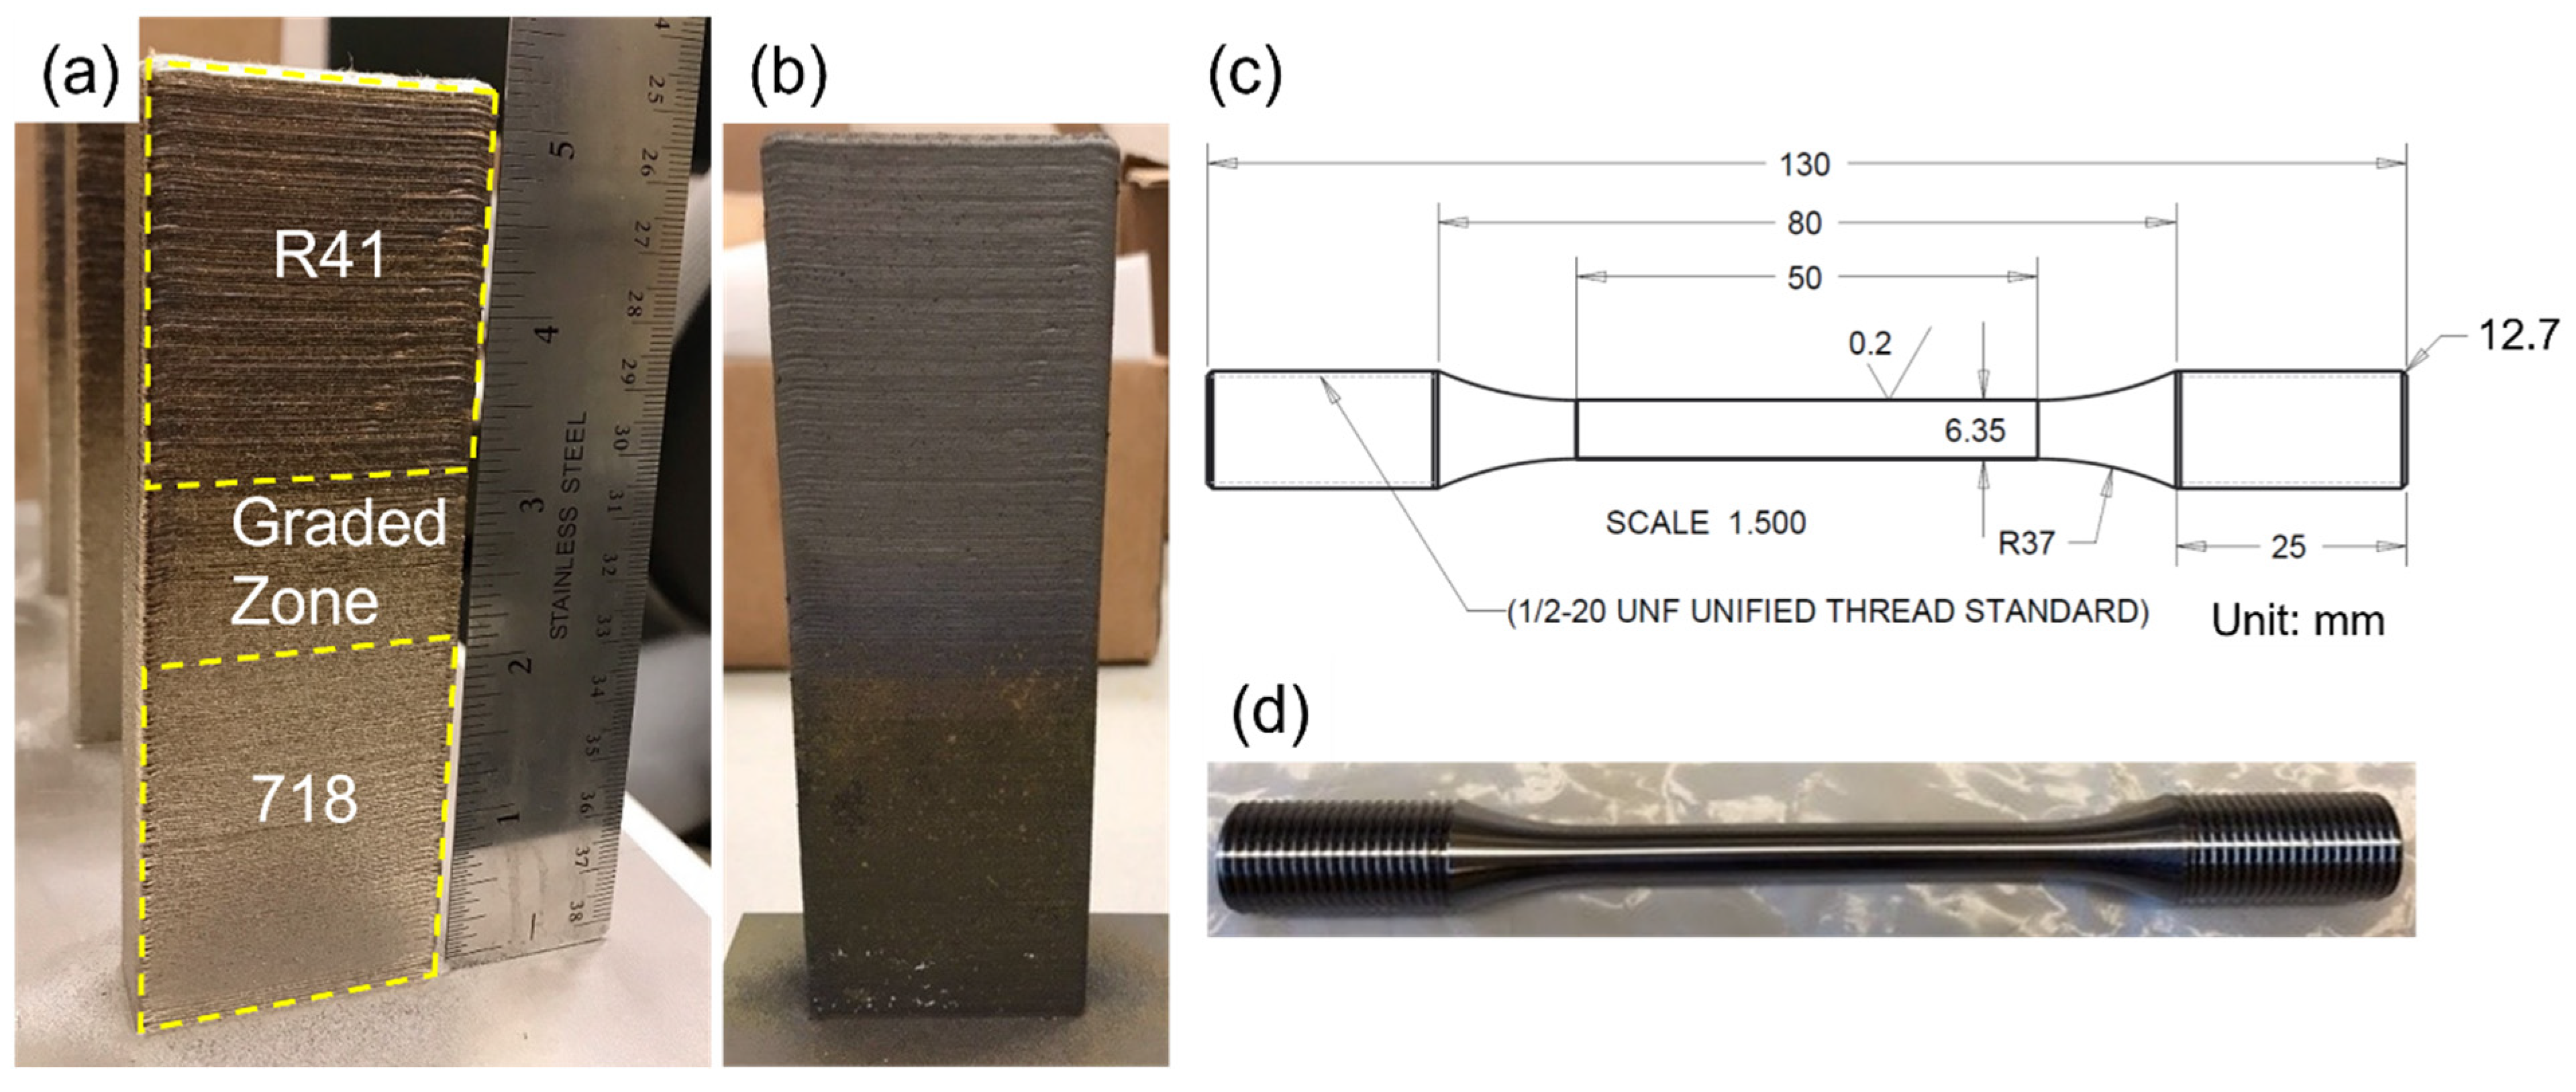
2. Materials and Methods

Plasma-atomized 718 alloy powder in the powder size range of 45–150 µm was acquired from AP&C (Colibrium, Saint-Eustache, QC, Canada). Gas-atomized R41 alloy powder in the powder size range of 44–125 µm was acquired from Linde (previously known as Praxair, Indianapolis, IN, USA). Alloy powder compositions measured by inductively coupled plasma mass spectrometry and LECO combustion testing are described in Table 1.
718-R41 graded blocks were built by a RPMI 557 DED-LB/M AM system which melts and deposits powder using a continuous wave fiber laser capable of 3 kW focused to a beam diameter between 1.27 and 4 mm. Two hoppers containing 718 and R41 powders allowed the mixing of powder in the desired ratio for deposition. An argon gas environment with oxygen less than 10 ppm was applied during the building. Each block dimension had a build height of 133.3 mm, a length of 45.7 mm, and a width of 15.2 mm. The contour and hatch strategy was adopted to first build the outer contour (45.7 × 15.2 mm) and then build the interior material by hatching passes. The detailed build parameters are summarized in Table 2. The DED build parameters were down-selected from machine learning-guided build parameter optimization, with the criteria of no lack of fusion, minimal porosity, no cracking, and good powder mixing for uniform composition. A wrought 718 build plate was used and 718 powder was first deposited to reduce thermal expansion-induced residual stress in the initial built material. The build process was performed at ambient temperature without heating the build plate or part. Monolithic 718 in 54 mm height was first built. The next 25.4 mm height (approximate mid-height of each block) contained 4 graded compositions in equal height with a decreased amount of 718 and increased amount of R41 by weight percent: 80% 718 20% R41 (80–20 mix), 60% 718 40% R41 (60–40 mix), 40% 718 60% R41 (40–60 mix), and 20% 718 80% R41 (20–80 mix). Monolithic R41 in 54 mm height was built on top of the graded region. The linear composition grades were predicted by Thermo-Calc to have minimal detrimental brittle phases (topologically close-packed phases, σ and µ) along the gradient path, and thus were chosen for build. These build parameters were verified to produce crack-free materials by X-ray CT scan and metallography on cut-up sections.
After the DED build, a baseline heat treatment (not optimized) was applied on one block as described in Table 3. The block was positioned upright during the heat treatments. The stress relief temperature was selected to be above the γ′ solvus temperature of R41, above the δ solvus temperature of 718, and below the solidus temperatures of the terminal and graded alloys. It served as stress relief as well as homogenization to remove chemical segregation and Laves phase at the interdendritic region in the 718-rich compositions. There was no part distortion after the stress relief heat treatment. A hot isostatic pressing (HIP) cycle was applied to close the porosities in the as-built material. A super-solvus solution was intended to dissolve γ′ and γ″ precipitates in the entire block. The two-step aging condition was modified based on the time–temperature–transformation (TTT) diagrams of wrought 718 [16] and heat treatment protocols of R41 [17] to generate γ′ + γ″ precipitates in 718-rich compositions without going into the δ phase region.
Figure 1a,b show the as-built block and heat-treated block that had obvious surface oxidation in the 718 region. Screw-threaded cylindrical tensile specimens were machined along the build height (Figure 1c,d). The graded region was in the center of the specimen gauge section.
Micro X-ray fluorescence (μXRF) was utilized to semi-quantify major composition profiles along the gauge section of the tensile specimens. Composition transitions were identified by the distinct signals of Fe, Co, Ti, and Nb elements. Lab tensile tests were performed to failure at 650 °C in lab air using an MTS servo-hydraulic loading frame and a clam-shell furnace. A test temperature of 650 °C was chosen as the operating temperature limit for 718. A constant crosshead displacement rate of 0.5 mm/min was applied. A high-temperature extensometer with a 25 mm initial length was applied to the graded region to record strain data. The stress–strain curves of the as-built and heat-treated specimens were collected to help determine the loading scheme for a neutron diffraction experiment. After tensile rupture, the specimen halves were measured by μXRF again to determine the failure location with respect to composition.
Separate lab tensile tests coupled with in situ DIC were also performed at the same temperature and with the same displacement rate control. The purpose was to provide the direct observation of non-uniform deformation in the graded material and quantify stress–strain responses within each composition zone. A furnace with an elongated viewport was picked to allow DIC access to the entire gauge length. High-temperature ceramic paint was applied along the gauge length except for a bare region used as a fiducial mark that identified composition locations. A dummy test using wrought 718 with a thermocouple placed near the center gauge was conducted to analyze thermal strain and verify the temperature uniformity of the entire gauge section at 650 °C. The actual DIC/tensile tests for the as-built and heat-treated specimens were interrupted at a few percent macroscopic engineering strain. The composition profile measured by μXRF was used to locate the six composition regions within the calibrated DIC X-coordinates from initial room temp positions. Strain as a function of composition was averaged from the uniaxial strain collected within each region, excluding the composition transition areas. Speckle paint started to spall and data quality suffered when applied stress was above 720 MPa for the as-built specimen and 860 MPa for the heat-treated specimen. Therefore, high-stress data for the specimens were chopped off.
Electron Backscatter Diffraction (EBSD) analysis was performed on the as-built and heat-treated materials to provide grain structure/morphology, grain orientations, retained plastic strain, and the fraction of recrystallization after heat treatment. A Hitachi SU-70 FEG-SEM (Hitachi High-Tech America, Inc., Schaumburg, IL, USA) with an Oxford Aztek Symmetry EBSD detector (Oxford Instruments, High Wycombe, UK) was used. An accelerating voltage of 20 kV and a step size of 2 μm were applied. The scanned area was a strip of 1 mm width along 37–38 mm build height where a 25 mm graded region was approximately centered along the height. Grain boundary maps, inverse pole figures, pole figures, and kernel average misorientation (KAM) maps were collected and analyzed. DED materials contained large grain in hundreds of μm to several mm and EBSD covered a relatively small sampling area. Therefore, the quantification of grain size was not conducted given insufficient grain statistics. The high-resolution backscattered electron images of representative microstructure were taken by Hitachi SU-70 FEG-SEM.
Neutron diffraction coupled with in situ loading is a unique experimental approach that provides the mesoscale elastic and plastic behavior of matrix and secondary phases in the constrained state, whereas other conventional methods are not able to probe [18,19]. Additionally, it offers deep penetration in Ni-based alloy, a large beam size beneficial for capturing statistics of large grain materials such as DED-built alloys, and the ability to detect superlattice reflections of the γ′ phase. Mesoscale deformation behavior at grain- and phase levels was studied by in situ neutron diffraction at BL-7, the VULCAN beamline at Spallation Neutron Source, Oak Ridge National Laboratory [18,19]. The experimental setup is displayed in Figure 2. The in situ tensile loading and unloading at 650 °C was performed with interrupted engineering strains of 1% and 4.8% for the as-built and heat-treated specimens, respectively. The specimen was held horizontally on a customized MTS loading frame. The specimen axial direction was positioned at a 45° angle with respect to the incident neutron beam. Neutron diffraction data along and transverse to the loading directions were collected by two area detectors (Banks 1 and 2) positioned at ±90° with respect to the incident neutron beam. Neutron experimental parameters included the high-resolution mode, a chopper speed of 30 Hz, a data collection of 5 min at each location, and a defined beam size of 5 mm × 5 mm horizontal and 5.5 mm height (irradiated volume of ~137.5 mm3) to prevent diffraction signals from thermocouple wires. A custom induction heating coil was placed several mm above and below the gauge section to heat the specimen. The macroscopic strain was measured by a high-temperature extensometer with a 12 mm gauge length that was positioned at the center of the gauge section (two ceramic rods in contact with the specimen gauge top in Figure 2a). Based on the measured μXRF profiles along gauge length, thermocouple welding locations and neutron beam probing locations were determined for the six studied compositions. Before loading the specimen, six pairs of K-type thermocouple wires were spot-welded to each composition region. One thermocouple at the center was assigned as a control thermocouple (set point of 650 °C), and the rest five thermocouples were assigned as readout thermocouples. The thermocouples shown in Figure 2a from left to right were TC1 at 718, TC2 at 80–20 mix, control TC at 60–40 mix, TC3 at 40–60 mix, TC4 at 20–80 mix, and TC5 at R41. The grips of the loading frame were water-cooled. The specimen grip section had a lower temperature, which created a temperature distribution along the gauge length. For the as-built specimen test, TC1 and TC5 had stable temperatures of 580–590 °C, while TC2, TC3, and TC4 had stable temperatures of 630–640 °C. For the heat-treated specimen test, a stable temperature of 610–640 °C at various thermocouple locations was obtained. Stepwise loading was applied during the in situ neutron measurements, which included 4–5 loading levels within the elastic regime, several loading levels within the elastoplastic and plastic regimes, and 5 levels during unloading. At each loading step, the load frame was translated on the VULCAN sample stage along the loading direction to measure, respectively, the nominal graded region determined from the μXRF measurement.
The diffraction peaks of (111), (200), (220), and (311) grains were obtained. These fundamental reflections had overlapped γ and γ′ peaks. Single peak fitting was conducted to extract peak position, intensity, and width as the representation of grain orientations that contain the γ and γ′ phases. Superlattice peaks from the γ′ phase including (210), (211), and (300)/(221) were only observed for R41 and R41-rich compositions. γ′ superlattice peaks in 718-rich compositions were not observed. Given the limit of lattice spacing with neutron instrument setup, the γ′ (100) peak was outside the measurement range. In theory, (300) and (221) reflections of γ′ share the same lattice spacing and both contribute to the diffraction intensity of the same peak. However, they behave differently in elastic and plastic responses. Orientation parameter Ahkl ( A h k l = h 2 k 2 + l 2 k 2 + h 2 l 2 h 2 + l 2 + k 2 2 ) of (300) and (221) are 0 and 0.296, respectively. Therefore, it was considered not appropriate to use the γ′ (300)/(221) peak to determine the γ′ peak position at (200) and further deconvolute the γ/γ′ (200) peak. Instead, the γ/γ′ (200) peak was deconvoluted into γ and γ′ peaks by using the Lebail fit in GSAS [20] with the consideration of the instrument profile. The presence of some low-intensity γ″ peaks in 718-rich compositions did not result in a reliable fitting, and thus was not reported.

3. Results

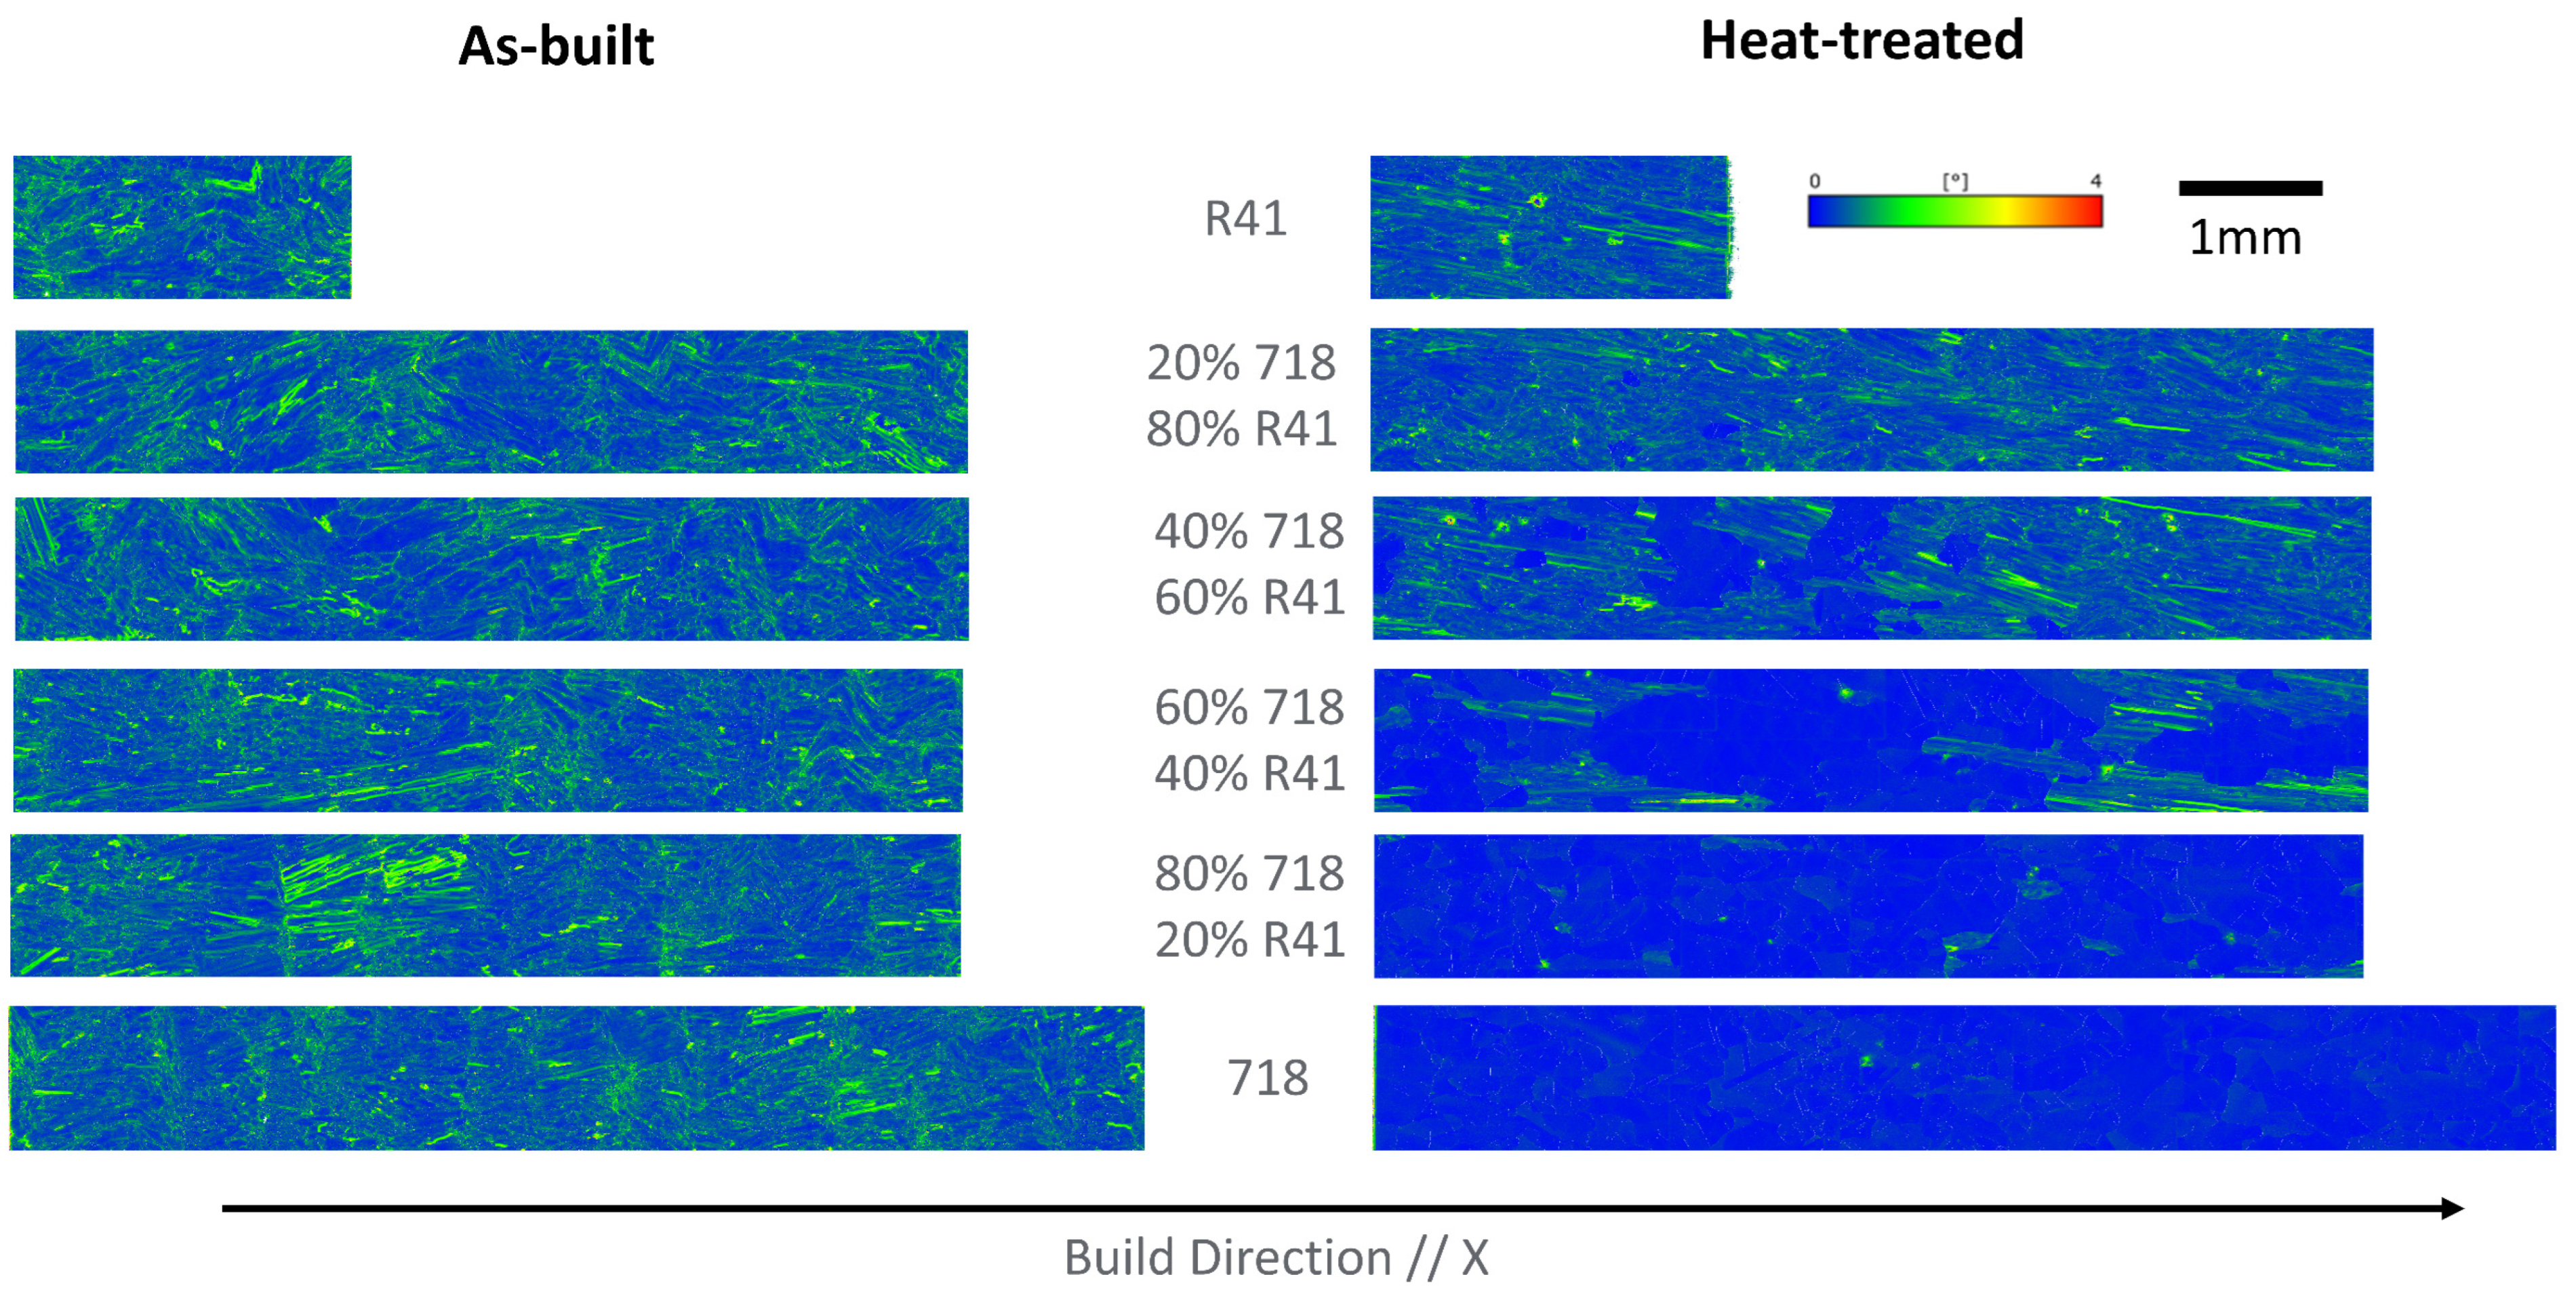
3.1. As-Built and Heat-Treated Microstructure

The grain structure, texture, and retained plastic strain in the as-built and heat-treated specimens are visualized by inverse pole figures along the build direction, pole figures, and KAM maps obtained from the EBSD analysis in Figure 3, Figure 4 and Figure 5. In the as-built specimen (Figure 3), the contour and hatch strategy creates a dominant columnar grain structure. Many columnar grains have a length comparable to or shorter than the build layer thickness of 0.5 mm, indicating that these grains form by the nucleation and growth of new grains during the remelting and deposition of the new layer. There are several long columnar grains with (001) or (101) parallel to build direction whose lengths cover several layers, suggesting that epitaxial dendrite growth occurs during deposition. Several fine equiaxed grains at the very top of each layer are observed, implying grain nucleation under a fast cooling rate during remelting. Regarding the texture, a weak (001) fiber texture along the build direction is observed, and (001) grain growth direction is slightly off the build direction indicating that the heat flow direction in the melt pool is slightly off. Laser scanning patterns affect local heat flow direction and solidification texture (dendrite growth direction) in multi-layer AM process [21]. The observed texture is similar to (001) fiber reported in the unidirectional DED scanning pattern of 718, except that the grain growth direction is close to the build direction rather than a 30° rotated angle [22]. The present results differ from strong Goss texture with weak Cube texture observed in DED IN625 [23] and brass texture component {110} <211> observed in DED 718 [24]. The R41-rich compositions appear to have less texture and a lower number of (001) aligned grains than the 718-rich compositions. A single-pass scan strategy for a thin-wall specimen of 718-R41 graded alloy was reported in our prior work [15]. Compared to the current work, columnar grains observed in single-pass thin-wall are long and continuous over many layers. Epitaxial growth is dominant in single-pass strategy vs. mixed mode of grain nucleation and epitaxial growth in the studied contour and hatch strategy. The strong (001) fiber texture is dominant in the single-pass strategy, compared to a weak (001) fiber texture with the presence of other grain orientations in the contour and hatch strategy.
After the heat treatments, the 718-rich compositions (80–20 mix and 60–40 mix) all reveal signs of recrystallization and grain growth (Figure 4). Large equiaxed grains in hundreds of μm to mm scale are observed in the 718 and 80–20 mix, while the 60–40 mix presents a mixture of equiaxed grains and columnar grains. The pole figures of these three compositions show a more random orientation without obvious texture. In contrast, the R41-rich compositions present dominant columnar grains and a higher occurrence of (001) grains along the build direction. The pole figures of these three compositions retain the weak (001) fiber texture from the as-built state.
As shown in Figure 5, the KAM maps measure intergranular crystal rotation and qualitatively indicate the level of plastic strain in the specimens. In the as-built state, higher misorientation angles (1–2°) are observed intragranularly along dendrites and near grain boundaries in the as-built state. The average KAM is around 0.5 degrees for all six compositions, without a clear dependence on composition. After the heat treatment, the 718-rich compositions display little misorientation values (close to 0°) inside grains and along grain boundaries. In the 60–40 and 40–60 mixes, the (001) oriented columnar grains in Figure 4 remain to have high misorientation angles, whereas the equiaxed grains all have a low strain with low misorientation values close to 0°. In contrast, the 20–80 mix and the R41 reveal a reduced level of localized plastic strain than the as-built state, despite higher strain levels than other compositions. The average KAM becomes 0.18, 0.17, 0.26, 0.39, 0.44, and 0.45 degrees from 718 to R41 in the heat-treated state, respectively. Together with grain morphology and texture interpreted from Figure 4, this further confirms that recrystallization occurs in the 718-rich compositions, but partial recrystallization or no recrystallization occurs in the R41-rich compositions. Discussions around recrystallization behavior differences are described in Section 4.2.

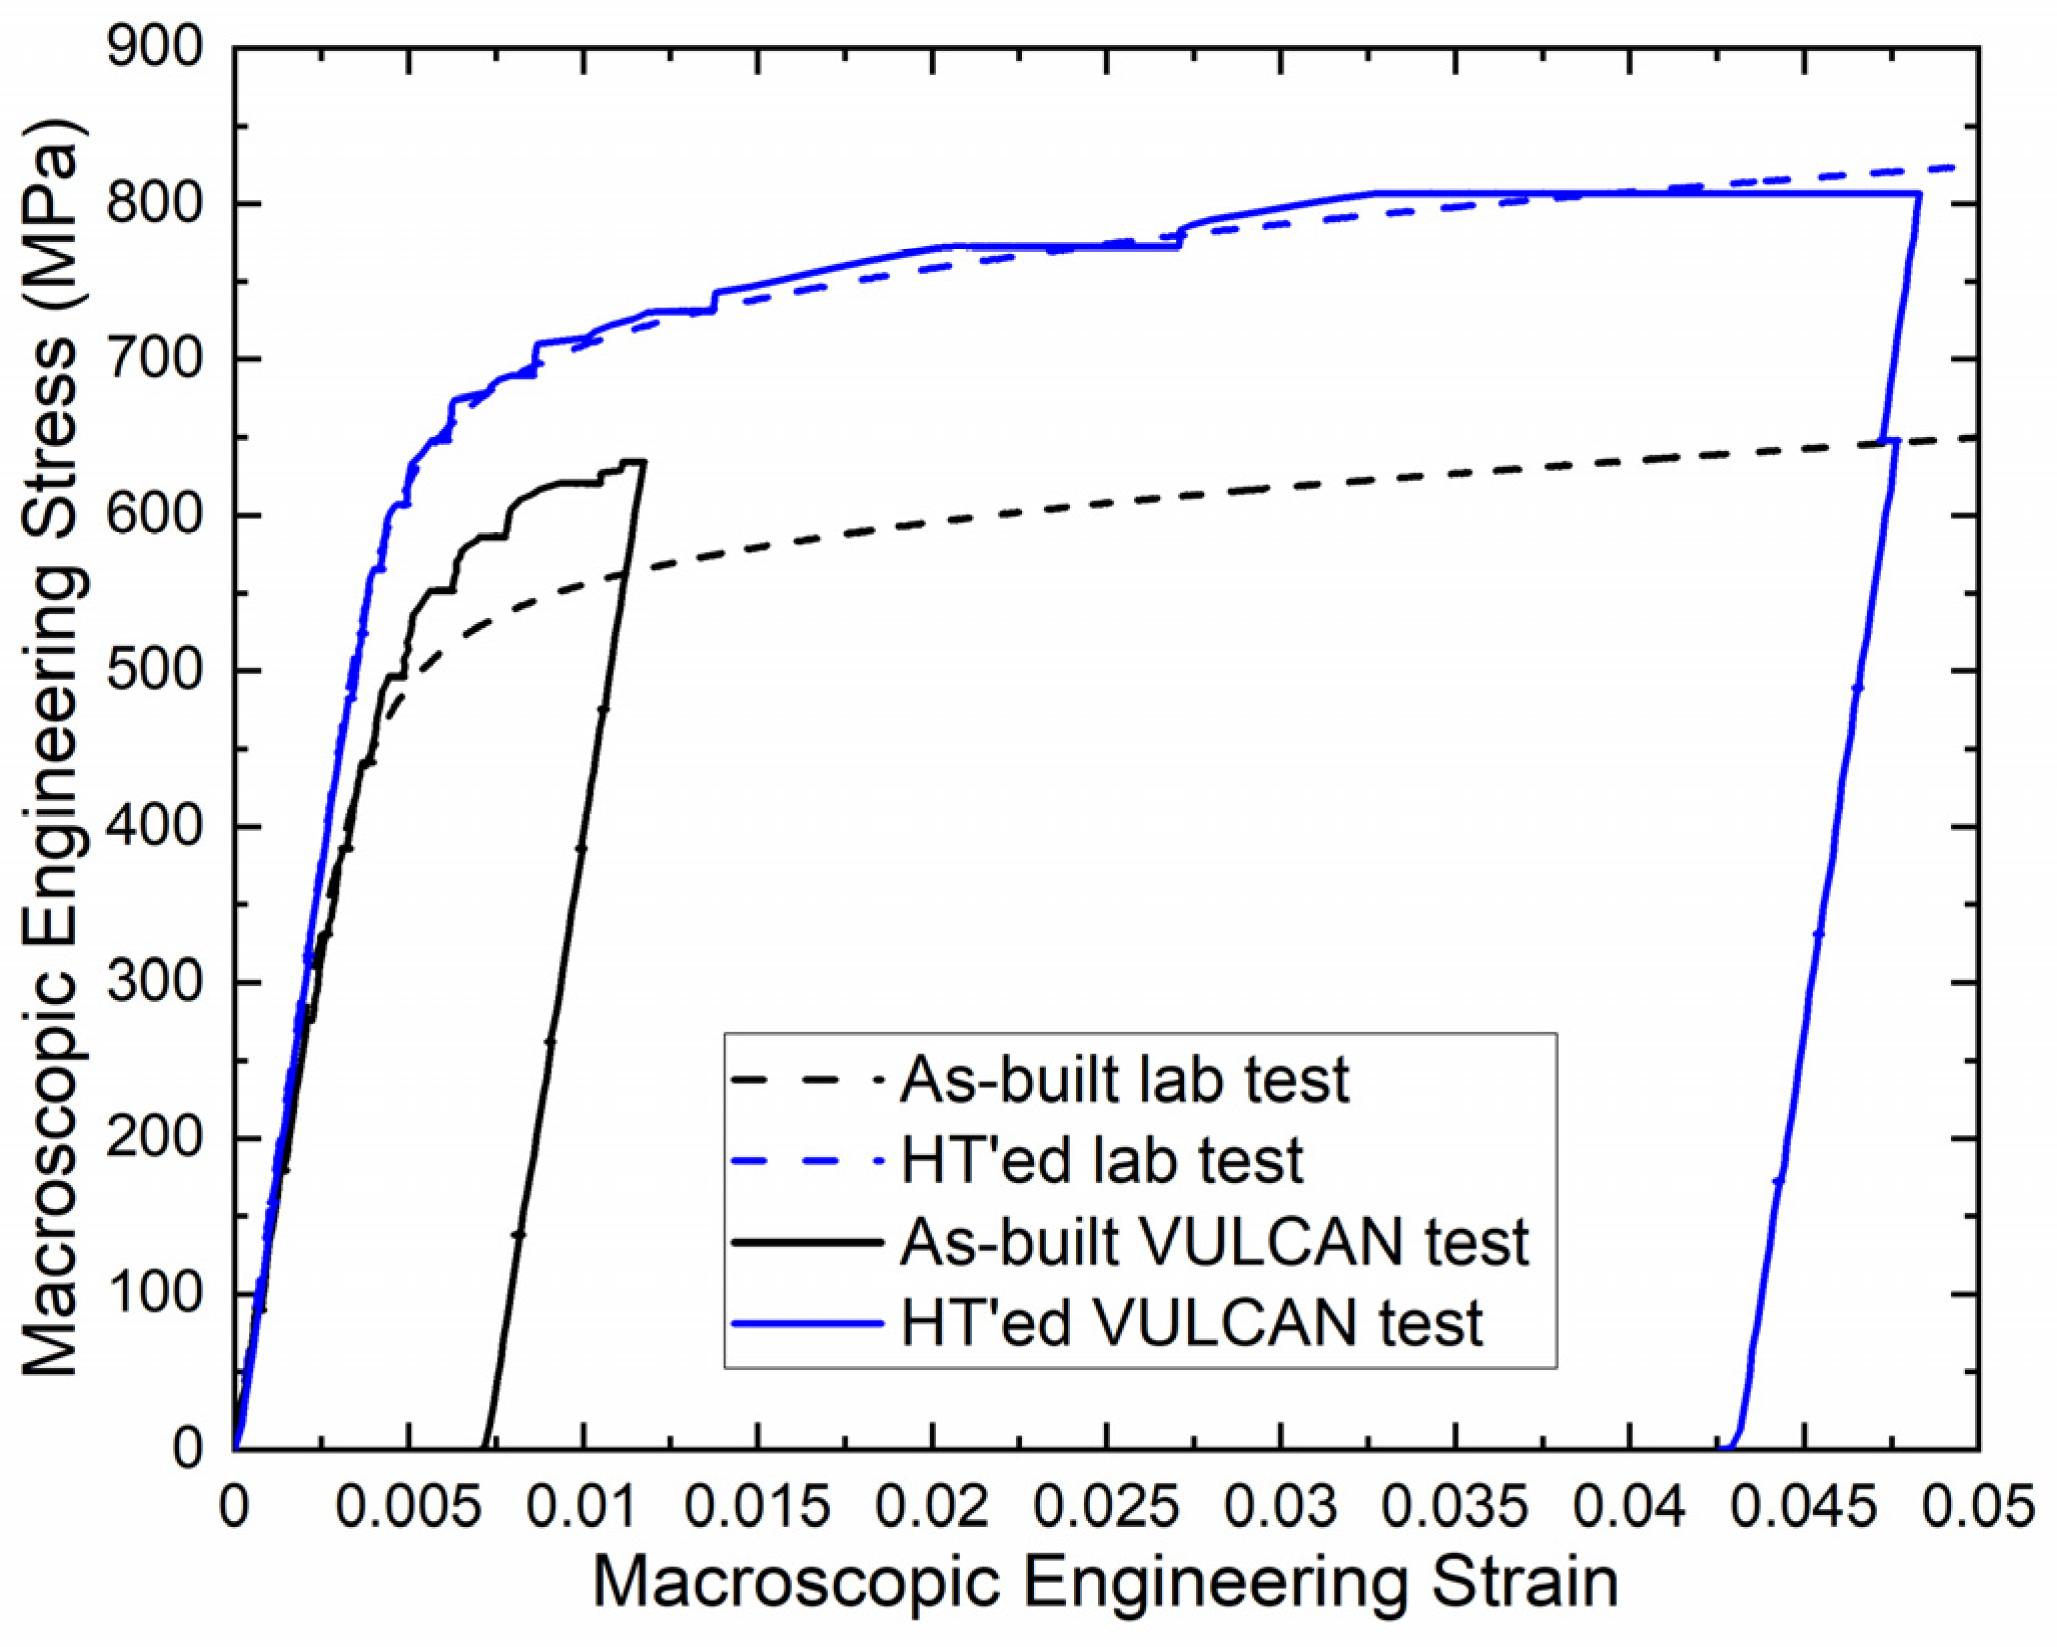
3.2. Macroscopic Stress–Strain Response at 650 °C

The macroscopic stress–strain curves at 650 °C obtained by the lab test and neutron experiment are plotted together in Figure 6. The lab test was performed under a constant displacement rate, while the VULCAN test was conducted by incremental loading steps representing quasi-static behavior. Data up to 5% strain are plotted for better comparison. During the neutron measurement, the holding time at stress levels higher than 500 MPa for data collection accumulates creep strain, shown as the collected horizontal plateaus in the VULCAN stress–strain curves. The heat-treated specimen shows highly consistent stress–strain responses between the lab test and VULCAN test, except for the creep strain evolved at high stresses. However, the as-built specimen by the VULCAN test reveals an increased hardening rate and higher strength than the lab test. This could be explained by γ′, γ″ precipitation during several hours of neutron collection and testing at 650 °C. The difference in the extensometer span (25 mm vs. 12 mm) could also explain some strain behavior differences in the heterogenous sample between the lab and VULCAN tests since the 25 mm span covers the four graded compositions while the 12 mm span only covers the 40–60 and 60–40 mix. Neither of the mechanical tests with the two-point extensometer can reflect the localized heterogeneous deformation, while the DIC approach provides the needed fidelity.
The DIC experiments determined local strain in the as-built and the heat-treated specimens. Strain distribution along the gauge at ~3% macroscopic strain is shown in Figure 7. μXRF-measured Fe profile is overlaid to visualize different composition regions. The non-uniform distribution of strain is evident in both specimens. In the as-built specimen, the 80–20 mix region shows the highest strain while the R41 region shows the lowest strain. In contrast, after the heat treatment, the highest strain appears in 40–60 and 60–40 regions, while the lowest strain is in the 718 region. The extracted stress–strain curves for each compositional region are presented in Figure 8. The calculated 0.2% yield strength for each curve is listed in Table 4. In the as-built specimen, the yield strength increases in the order of 80–20, 718, 60–40, 40–60, 20–80, and R41. In contrast, the yield strength follows an ascending order of 60–40, 40–60, 20–80, 80–20, R41, and 718 in the heat-treated specimen. The stress–strain behavior of the graded compositions is quite complicated and does not follow a simple linear transition from 718 to R41. The selected 2-step aging treatments effectively improve the yield strength of all six compositions compared to the as-built state. The 718-rich compositions present a larger increase in yield strength after the heat treatment than the R41-rich compositions. The relative improvement is 66%, 55%, 21%, 12%, 8%, and 5% accordingly going from 718 to R41. From the obtained curves, only the initial stage of work hardening could be compared among the six compositions, as zoomed in the inserts in Figure 8. The slope of initial hardening does not differ a lot with composition or heat treatment. The correlation with the neutron results is described in Section 3.5.

3.3. Grain Orientation-Dependent Diffraction Elastic Constants

Using the neutron data collected during the unloading steps, diffraction elastic constants (DECs) are calculated based on the linearly fitted slopes of true stress vs. lattice strain data along the loading direction. DECs at high temperatures are useful parameters to allow calculating grain-specific and phase-specific internal stresses from the measured lattice strain data. The lattice strains of the four grain orientations are calculated based on zero strain reference (lattice spacing at temperature without loading). The linear fitting quality is extremely good for all the measured data, with R2 above 99%. The absolute values of DEC differ from the bulk Young’s moduli, but imply a qualitative ranking among the six compositions. Table 5 lists the obtained average and standard deviation of DECs. Regardless of the grain orientations, the DECs in the as-built state decrease from 718 to 80–20 mix, reach the minimal value, and then increase continuously from 60–40 mix to R41 where the DECs reach the maximum value. The heat-treated state presents a similar decreasing and increasing trend. The difference is that the minimal values after the heat treatments lie within the 60–40 mix instead of the 80–20 mix. The as-built and heat-treated states show similar magnitudes of DECs with differences smaller than 12%. The DEC differences between the two states are real. It is believed that the chemistry segregation at the interdendritic region in the as-built state vs. homogenized chemistry in the heat-treated state could lead to such a difference. The bulk Young’s moduli at 650 °C are also predicted by the JMatPro software to compare with the neutron results. The predicted values follow a monolithic increasing trend of 167.3, 170.5, 173.3, 176.0, 178.7, and 181.1 GPa from 718 to R41. The minimum values at mixed compositions are not well predicted, although the increasing trend towards the R41 is generally captured.
In addition, the measured DECs for DED 718 are quantitatively compared to the interpolated values for wrought 718 (in Figure 8 of Ref. [25]), which used a similar diffraction measurement approach. The interpolated DECs for (111), (200), (220), and (311) orientations at 650 °C are 185.5, 121.9, 160.6, and 141.4 GPa, respectively. These values for wrought 718 are within a 10% difference in the neutron measured values for DED 718. The results are also compared with the interpolated values for wrought alloy 625, another widely used commercial superalloy with little to no precipitates. The interpolated DECs from Table 2 in [26] are 211.1 for (111), 121.8 for (200), 180.3 for (220), and 155.4 GPa for (311) orientations at 650 °C, respectively.
The DECs of γ′ precipitates in the as-built and heat-treated states are also determined for the R41-rich compositions only, where γ′ superlattice peaks are obtained. The linear fitting of true stress vs. lattice strain during unloading is applied for superlattice peaks (210) and (211). The R2 of the fitting was slightly lower (~95%) than the R2 fitting of the fundamental reflections. Although (211) overlaps with another γ′ superlattice reflection (110), the two orientations have the same orientation parameter of 0.25, and thus calculating DEC is still justified. Table 6 lists the obtained values for γ′ phase. Two pairs of γ, γ′ peaks can be compared in DECs given the similar magnitude of orientation parameter. The orientation parameter of the γ′ (210) peak is 0.16, similar to 0.157 of the γ/γ′ (311) peak. The orientation parameter of the γ′ (211) peaks is 0.25, same as the γ/γ′ (220) peak. A quantitative comparison for the as-built specimen shows that the γ′ (210) and (211) orientations have slightly higher DEC than the γ (311) and (220) orientations in most cases. The difference in DEC between the γ and γ′ phases is within 10%, consistent with the published results suggesting similar moduli in other superalloys [25,27,28,29,30]. A subtle difference is observed with and without heat treatments. This could be attributed to the γ′ composition in the two states. During the DED process, a low fraction of γ′ could form either in cooling from solidification or subsequent heating when depositing the next layer, where non-equilibrium conditions and dendritic micro-segregation determine γ′ composition being far from equilibrium and size being ultrafine. After heat treatment, dendritic segregation has been homogenized, and γ′ completely dissolves and reprecipitates to a higher volume fraction leading to a composition closer to an equilibrium state. This is supported by the observed γ′ peak profile change from lower intensity and broader peak width in the as-built state to higher intensity and narrower peak width in the heat-treated state.
Grain orientation-dependent Poisson’s ratio were obtained from the ratio of diffraction elastic modulus and linear fitted slope of true stress vs. lattice strain transverse to the loading direction. The calculated values from the neutron experiment are listed in Table 7. Neutron data in the transverse direction are noisier than data in the axial/loading direction. Thus, the uncertainty in Poisson’s ratio is higher than that of diffraction elastic modulus. It is difficult to draw a clear conclusion on the composition dependency and difference in the as-built and heat-treated states. For reference, interpolated Poisson’s ratios at 650 °C for (311) and (111) of wrought 718 are 0.3163 and 0.2270, respectively [25]. These values are not far from the measured data for DED 718.

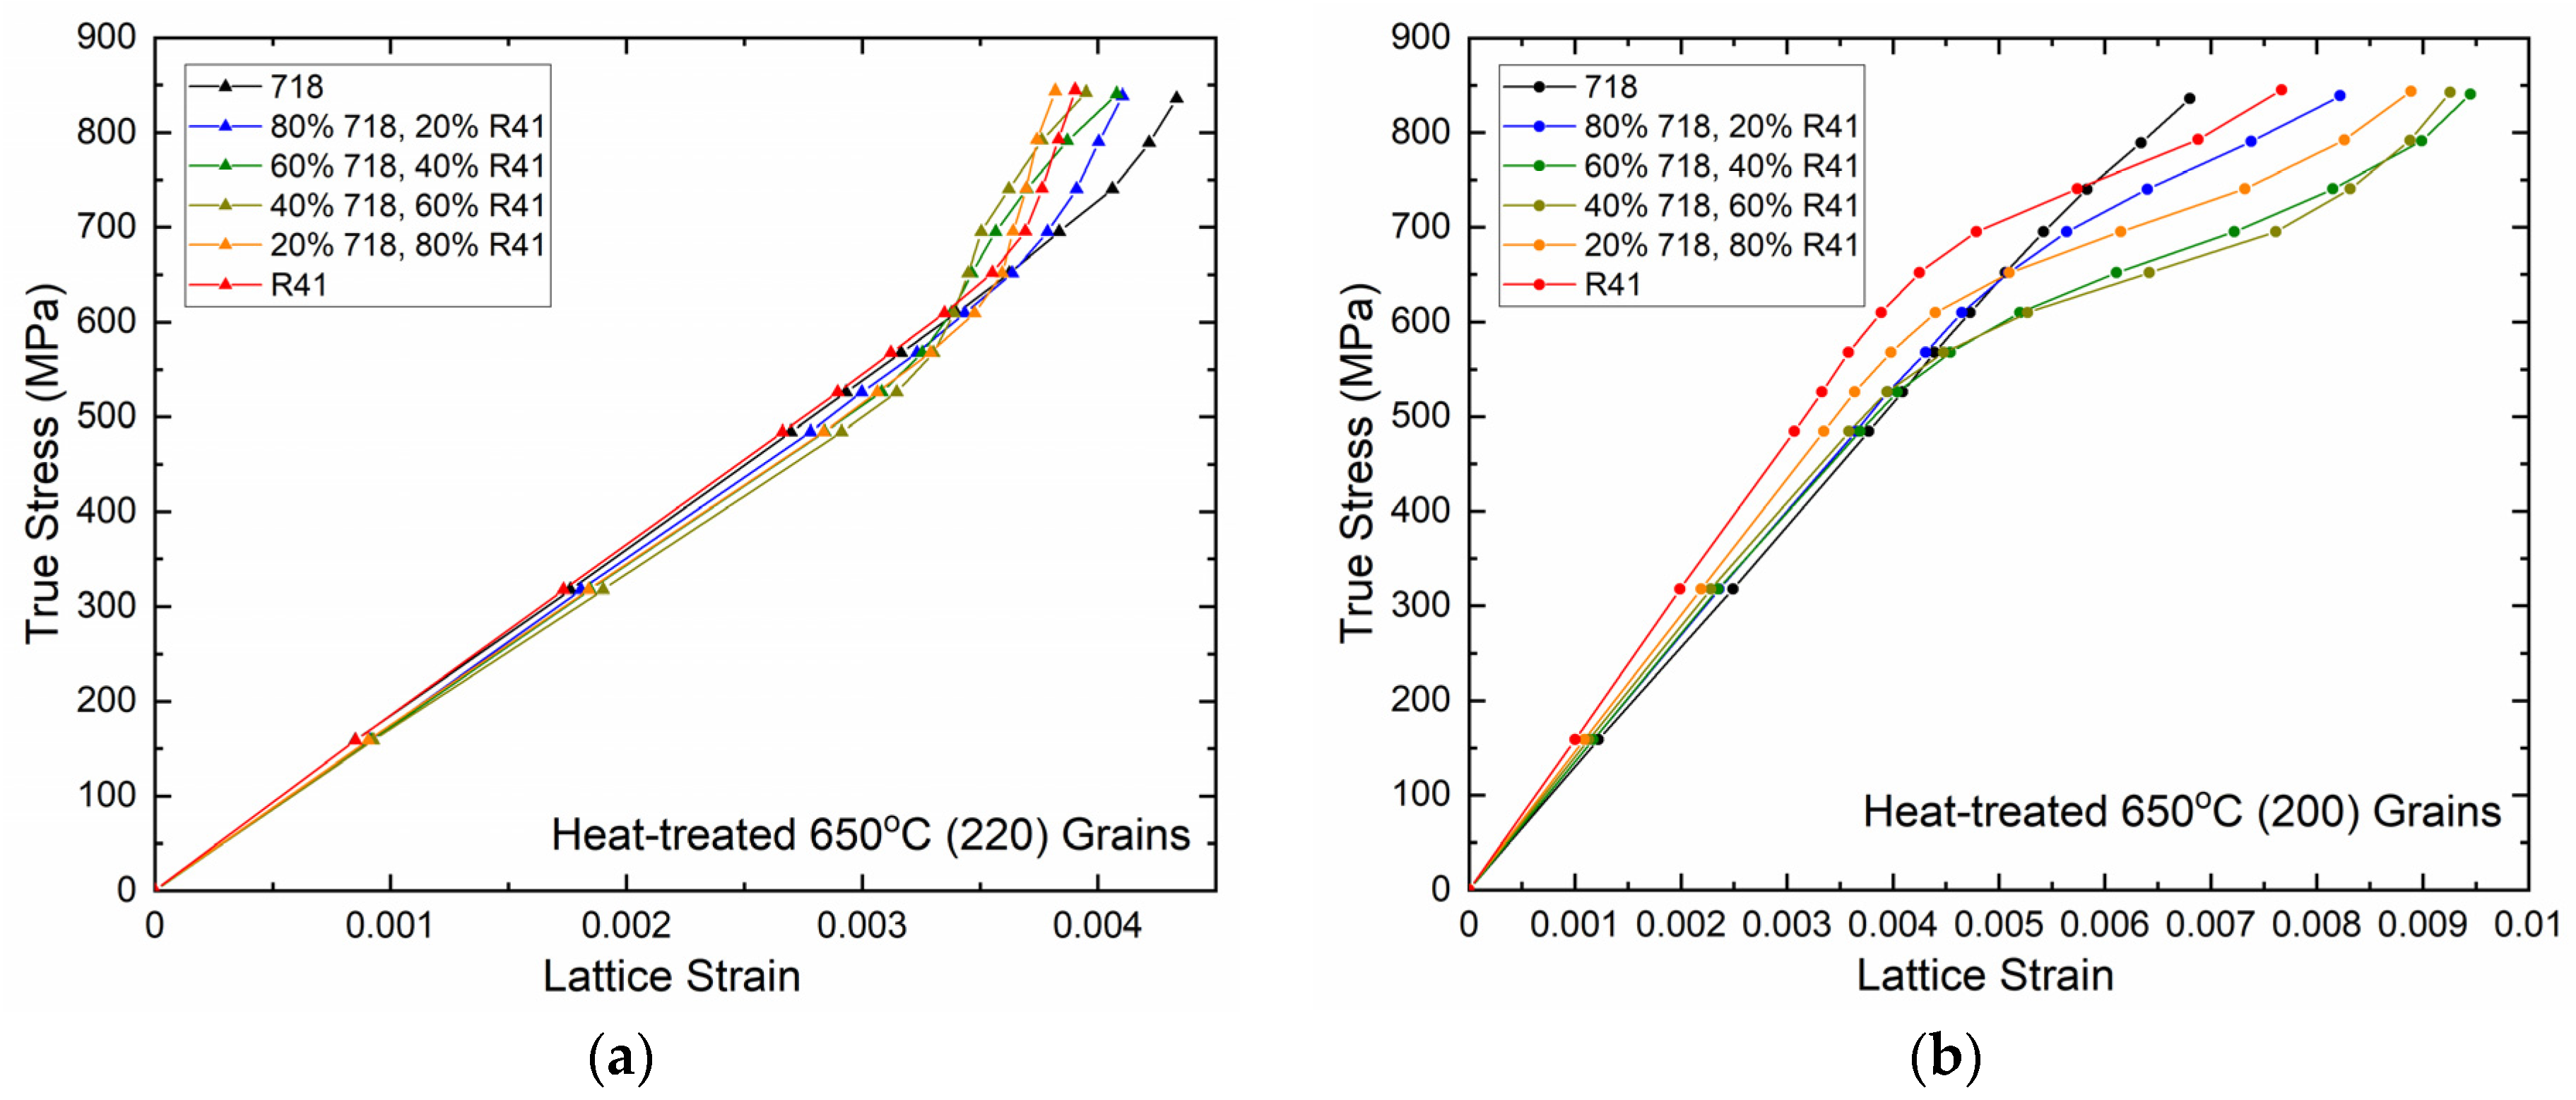
3.4. Grain-Level Elastoplastic Behavior

The neutron results of lattice strain evolution for the four grain orientations are plotted in Figure 9 and Figure 10. Only loading data (along the build direction) are shown for clarity. The elastic region in loading, where the lattice strain has a linear relationship with true stress, basically shows the same trend as the unloading data described in Section 3.3. The elastoplastic region contains a state of mixed elastic and plastic deformation at grain levels where grain orientation-dependent yielding occurs sequentially in different grains with increased stress. Deviation from linearity in the elastic region with increased slope (slower increase in lattice strain) is a signature of the yielding of a specific grain orientation. On the other hand, reduced slope with a faster increase in lattice strain is a signature of load transfer to bear more stress in a specific grain orientation, although plastic deformation with hardening could happen. Such plastic anisotropy at grain level creates intergranular stress. Among the measured four grain orientations, the (220) grain orientation is the earliest yielding orientation with the lowest yield point. Upon (220) yielding, intergranular stress redistribution occurs and more load is transferred onto other grains such as (200) grain orientations, as evident by the diverging response of the (220) and (200) lattice strains. Grain-level yield strength clearly shows a composition dependence and heat treatment influence. Table 4 summarizes the yield point of (220) grains in various compositions. Qualitative agreement is reached with macroscopic 0.2% yield strength measured by DIC, implying a consistent composition-dependent trend in yield strength. The magnitude of the (220) yield point is lower than the macroscopic yield strength. This quantitative discrepancy could be explained by neutron’s capability to detect the early yielding of internal grain families at high stresses before macroscopic yielding is observed and the 0.2% yield strength often comes with obvious plastic macroscopic strain value. Comparing the (220) yield point before and after the heat treatment, a relative increase of 95%, 118%, 57%, 57%, 27%, and 29% are observed in the compositions from 718 to R41. Therefore, the heat treatment applied enhances yield strength more effectively in the 718-rich compositions than the R41-rich compositions, in qualitative agreement with the DIC results. The magnitude of intergranular strain also depends on the compositions and the heat treatment, as shown in Figure 11. The spread of (220) and (200) grains became smaller after the heat treatment for all six alloys, suggesting that intergranular strain in the heat-treated state is lower than the as-built state under the same applied stress. Comparing among compositions, intergranular strain increases in the order from 718 to R41 in the as-built state, while it increases in the order of 40–60, 60–40, 20–80, 80–20, R41, and 718 in the heat-treated state. Composition dependence on intergranular strain is similar to its dependence on yield strength.

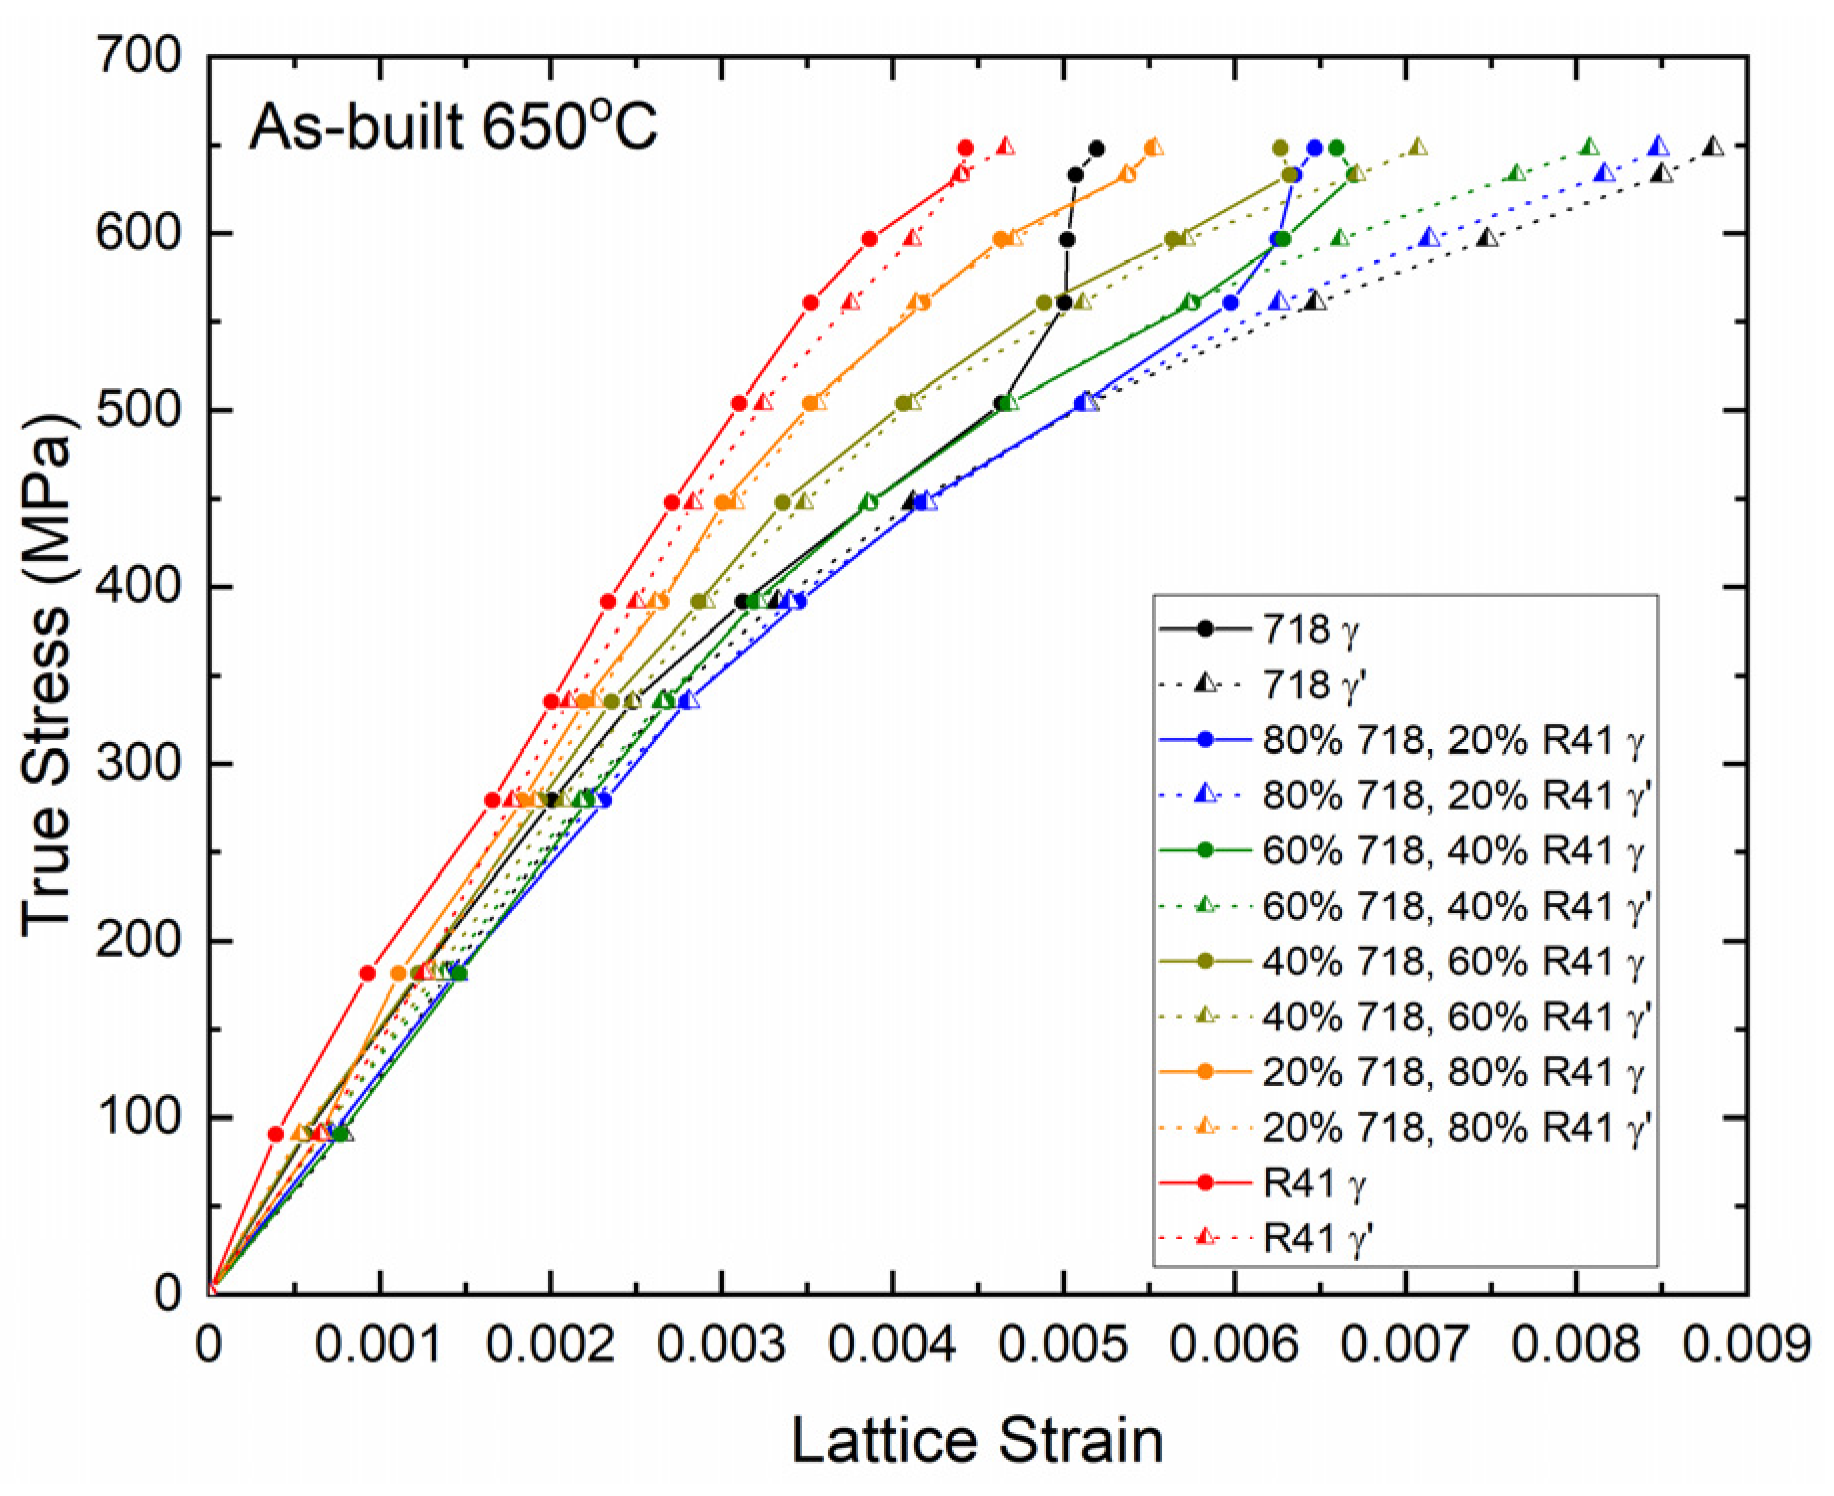
3.5. γ/γ′ Interphase Load Transfer

The (200) diffraction peaks are further analyzed to deconvolute into γ and γ′ peaks. The (200) grain yields later than the other orientations and shares a higher load when the other grains yield. It is a representative grain orientation to probe the γ/γ′ interphase load partitioning at low and high internal stresses. The measured superlattice peaks of (210) do not have the pair fundamental reflection (420) measured to allow comparison. The other two superlattice peaks (211) and (300) are overlapped with superlattice reflections (110) and (221), which likely show different plastic behavior and make interpretation difficult. Figure 12 presents the lattice response of the (200) grains at the γ and γ′ phase levels for the as-built state. γ and γ′ elastically deform together up to the yield point of the (220) grains (values listed in Table 4). Afterwards, the load is transferred from (220) to (200) grains. γ and γ′ maintain elastic deformation with the applied stress increasing until stress further reaches the yield point of the γ matrix, whose value is highly dependent on the compositions. The 718 and 80–20 mix first show γ yielding around 500 MPa, followed by the 60–40 mix at ~600 MPa, and the 40–60 mix at ~630 MPa. The 20–80 mix and R41 do not clearly display a signature of γ yielding up to the highest measured stress. Thus, γ yield point appears to increase with an increased fraction of R41 in the as-built state. After the yield of the (200) γ matrix, the apparent divergence of the γ and γ′ lattice strain data suggests that γ′ remains elastic and takes a higher load from the γ matrix. A similar peak analysis of (200) grains in the heat-treated state was attempted but did not yield reliable fitting results.

4. Discussion

4.1. Yield Strength of Heat-Treated 718-R41 Graded Alloy

The measured yield strength of six compositions (Table 4) is a result of the applied two-step aging treatments that govern γ′ and γ″ precipitate size/fraction. As noticed in Figure 3 of the EBSD results, the average grain size of the as-built DED material is on the order of hundreds of µm to mm. When the 718-rich compositions recrystallize during heat treatment, grain growth also occurs, leading to the final grain size on the same order of magnitude. Thus, the effect of Hall–Petch strengthening by grain size at 650 °C is considered a minor contribution to the overall strength. Instead, precipitation strengthening from γ′ and γ″ is a dominant factor in determining the yield strength. Preliminary TEM characterization suggests that γ′ precipitate size is around 5 nm in the as-built R41, while no γ′/γ″ is observed in the as-built 718 (unpublished results). When the as-built specimen was tested at a neutron beamline, the exposure time at 650 °C test temperature probably caused additional precipitation and growth of γ′/γ″ in 718 and γ′ in R41 (supported by the measured γ′ and very weak γ″ diffraction peaks). This implies that precipitate volume fraction and size may dominate the yield strength.
With 760 °C/3h and 718 °C/13 h two-step aging, the DED 718 reaches a 0.2% yield strength of 821.2 MPa at 650 °C, based on the DIC strain data. Conventional wrought 718 has a 0.2% yield strength in the range of 793 to 862 MPa at 650 °C after 718 °C/8 h and 621 °C/8 h two-step aging [31]. The 650 °C yield strength of DED 718 has been reported to be ~800 MPa, with 1080 °C homogenization, 980 °C solution, and double aging at 720 °C/8 h and 620 °C/8 h [32]. Thus, the modified two-step aging results in yield strength comparable to commercial wrought 718 and DED 718 research data. Wrought R41 shows 650 °C yield strength of 743 MPa with 900 °C/4 h aging and 954 MPa yield strength with 760 °C/16 h aging [17]. DED R41 has a 650 °C yield strength of 752.9 MPa after 760 °C/3 h and 718 °C/13 h two-step aging. This value is comparable to the low-strength version of wrought material generated by higher aging temperatures. While adopting one-step aging of 760 °C/16 h may significantly improve DED R41 strength, the challenge is that DED 718 may run into an undesired δ phase region based on the TTT diagram [16].
Under the applied two-step aging treatments, the 718-R41 mixed compositions all show lower yield strength than 718 and R41 with the lowest being the 60–40 mix. To explain the result, the prediction of equilibrium γ′ and δ phases at 718 °C aging temperature by Thermo-Calc was conducted and is presented in Figure 13a. Since γ″ phase is metastable, the calculation considers the stable δ phase to reflect γ″ phase fraction. With the increase in R41 fraction in the mixed powder, δ fraction decreases sharply and becomes zero around 50% R41. In contrast, γ′ fraction increases monotonically from 718 to R41. It is well known that γ″ has a higher strengthening effect than γ′, so a lower fraction of γ″ could achieve a comparable strength as a higher fraction of γ′. High-resolution SEM images (with 100 k magnification) are obtained to compare with thermodynamics simulation. As shown in Figure 14, 718 and 80–20 mix reveal typical γ″ fine plates and 718 appears to have denser γ″ precipitation than the 80–20 mix. From the 60–40 mix to R41, only γ′ precipitates are observed, and its fraction appears to increase with the R41 fraction. The size of γ′ precipitates is below 30nm and increases from the 60–40 mix to R41. These observations are qualitatively consistent with the thermodynamic predictions. The composition 60–40 mix has the lowest yield strength, possibly due to two contributions: the low fraction of γ′ precipitates and little to no γ″ to provide additional strength. The quantification of precipitate size and volume fraction was not attempted because of large uncertainty with the SEM image conditions or phase fraction analysis from neutron diffraction patterns.
The desired mechanical properties of 718-R41 FGM for high-temperature applications are (1) the properties of terminal alloys are comparable to wrought alloys, and (2) the properties of the gradient path bridge properties of the terminal alloys and exceed the weaker terminal alloy. The results suggest that the combination of the applied aging condition and composition gradient path requires further optimization to improve mechanical strength for the graded compositions and R41. Lower aging temperature and modified aging time may help increase the volume fraction of precipitates to reach peak aging conditions. It will be tremendously helpful to establish heat treatment–precipitate–mechanical property relationship models and include the modeling results into the consideration of the gradient path design, which eliminates the number of trials and errors and accelerates gradient path optimization. Additionally, heat treatment methods that provide non-uniform temperature distribution (such as using a custom induction heating design) shall be explored as a new degree of freedom to tune local precipitate distribution and local strength. Alternatively, the gradient path may be modified to skip the low-strength compositions while accepting a minimal impact on the smooth transition of properties. Actually, the team has recently figured out a new heat treatment condition that leads to improved mechanical properties (to be published).

4.2. Recrystallization of DED-Built Superalloy after Heat Treatment

From the EBSD results (Figure 3, Figure 4 and Figure 5), it is intriguing that recrystallization occurs in the 718-rich compositions but not in the R41-rich compositions after the heat treatment. In Figure 15, recrystallized and un-recrystallized grains are color-coded by the EBSD analysis in the heat-treated specimen. The quantified recrystallization area fraction is 99.8% in 718, 99.8% in the 80–20 mix, 62.1% in the 60–40 mix, 19.6% in the 40–60 mix, 3.8% in the 20–80 mix, 2.6% in R41, respectively. The recrystallization fraction decreases monotonically with an increased fraction of R41 mixed with 718.
Recrystallization in 718 is not a surprising finding. Full recrystallization with dissolved Laves after 1080 °C/1 h heat treatment (a lower temperature than the present study) was reported for powder DED 718 [32]. In the literature, recrystallized fine grain structure was reported in R41 printed by laser powder bed fusion (L-PBF), with subsequent supersolvus solution treatment at 1200 °C/4 h [33]. This is different from the present observation of un-recrystallization in DED R41 that withstands a 1200 °C stress relief/homogenization treatment. Although L-PBF vs. DED is not the most relevant comparison in terms of build thermal condition and the resulting microstructure, the fact that L-PBF R41 shows recrystallization suggests the stored plastic energy determined by AM modality and build parameters is critical to grain structure after heat treatment.
The retained columnar grain structure and texture in heat-treated DED material has been a technical challenge for the DED process. This microstructure causes anisotropic properties and inferior tensile and fatigue properties when the grain size is large. The attempt to obtain fine recrystallized grain structure through post heat treatment has shown limited success and is highly dependent on additive process conditions and alloy compositions. Fine equiaxed grains are only generated by adopting a mechanical interlayer deformation step subsequent to DED [34]. Research suggests that stored energy from additive process as well as secondary phases resisting grain boundary migration contributes to static recrystallization in AM material. In DED alloy 625, recrystallization occurred at 80% fraction after solution treatment at 1200 °C, while only 40% recrystallization was obtained at 1100 °C solution treatment [35]. It was concluded that compared to forged 625, DED 625 had lower plastic deformation from thermal cycling during the build and thus lower stored energy as a driving force for recrystallization, leading to a higher recrystallization temperature. Stored energy is dependent on crystal orientation and (100) has the lowest stored energy compared to the other orientations, suggesting that stored energy can be varied by DED texture. The dissolution of the interdimeric Laves phase that formed in solidification was also attributed to promoting recrystallization because the Laves phase inhibited the nucleation and growth of recrystallized grains. Zener pinning force can largely explain the dragging force controlled by particle size and fraction. Another study reported a somewhat surprising result of how carbides can rule recrystallization even after a stress-relief heat treatment that reduced stored energy from an as-built state [36]. By adding a stress relief heat treatment prior to homogenization heat treatment, the recrystallization onset temperature was decreased from 1230 °C to 1170 °C, and the recrystallization temperature range was widened in SLM IN738LC. Despite its efficacy in reducing dislocation density (stored energy), this stress relief condition promoted phase transformation from metastable MC to M23C6 carbide, which reduced MC carbide quantity and its pinning on grain boundary migration. However, the influence of carbide structure, composition, and morphology as a result of alloy composition and solidification conditions is not well understood for recrystallization and grain growth in AM materials.
From the EBSD KAM map (Figure 5), the retained plastic strain from 718 to R41 in the as-build state is similar and not dependent on composition. Therefore, the role of stored energy could not well explain the observed grain structure difference after the heat treatment. The present work uses a 1200 °C heat treatment to serve as stress relief and homogenization for as-built material. Micro-segregation from solidification is removed and γ′ precipitates are dissolved during this heat treatment. Thus, γ′ is not the main reason for the observed recrystallization difference among the 718- and R41-rich compositions. The subsequent HIP and solution treatments are at 1121 °C. MC carbide that forms in DED solidification is likely the only stable carbide phase at these temperatures. A temperature of 1121 °C is hundreds of degrees higher than MC to M23C6 and MC to M6C transformation temperatures (Figure 13b). The equilibrium fraction of MC carbides at 1200 °C increases from 0.1% to 0.65% in 718 towards R41. Therefore, it can be inferred that these MC carbides play a critical role in the recrystallization temperature of the DED-built superalloys. The hypothesis is that a higher fraction of MC carbides in R41-rich compositions could more effectively resist grain boundary migration and discourage recrystallization and grain growth in contrast to 718-rich compositions with a low fraction of MC carbides. Approximate 0.5% MC carbide appears to be the boundary of recrystallization vs. recovery in the studied 718-R41 graded compositions. Unfortunately, carbide characterization after stress relief treatment was not performed. Carbide microstructure after the full heat treatments are provided in Figure 16 as the experimental supporting evidence for the hypothesis. EDS analysis along with predicted equilibrium phases was used to indicate the carbide type and chemistry. In 718-rich compositions, Ti, Nb-rich carbides in dark contrast (presumably MC type) and Mo, Nb-rich carbides in bright contrast (presumably M23C6 type) are observed. The fraction of dark contrast MC carbides is lower than bright contrast M23C6 carbides. The grain boundaries have very few carbide decorations. In contrast, R41-rich compositions have increased amounts of dark contrast Ti, Nb-rich MC carbides, besides the presence of bright contrast Mo, Cr-rich M23C6 carbides. The grain boundaries are more decorated with carbides than the 718-rich compositions. The fraction of MC carbides is significantly higher than M23C6 carbides in the 20–80 mix and R41. Note that M23C6 carbides are expected to form during aging treatment and do not exist at stress-relief temperatures.

4.3. Insights of Mesoscale Deformation from Neutron Diffraction

A weak (001) fiber texture is observed in the as-built state. After the heat treatments, this texture is replaced by random texture after recrystallization in the 718-rich compositions, while it is retained to some extent in the R41-rich compositions. DECs measured by neutron diffraction with/without heat treatments show a small difference, suggesting that the effect of weak texture and recrystallization on elastic deformation could be minor. This is further supported by similar DEC values in DED 718 vs wrought 718. In addition, the measured DECs as a function of compositions fall within a narrow range, suggesting a smooth transition in the elastic properties of compositional graded structure.
In the as-built state, the lattice strains of (111) and (311) grains maintain a linear increase with the applied stress, and do not develop intergranular stress until higher stress levels. After the heat treatment, the lattice strains of (111) and (311) grains maintain the linear increase with stress even at higher stress levels than the as-built state. Note that the (311) orientation is routinely recommended for calculating macroscopic residual stress in face-centered cubic materials because it is found to be less affected by intergranular strain. Numerous literature data support the linear stress–strain response of (311) reflections in face-centered cubic crystal structures with random texture. In the present work, (311) in DED material presents a stress limit for its linear behavior, in particular for low-strength compositions (such as 718 and the 80–20 mix in the as-built state, and the 60–40 and 40–60 mix in the heat-treated state). Therefore, caution should be taken when using the diffraction elastic constant of (311) to estimate high residual stress in DED materials. A neutron diffraction experiment under mechanical loading is recommended to choose the best grain family with the least intergranular effect to minimize the errors.
The phase level γ to γ′ load transfer above the yield point of γ matrix in (200) grains differs from the other literature reported for VDM780 and HAYNES® 282® with fine γ′ size [37,38]. In those works, γ/γ′ co-deformation without load transfer was observed by in situ loading with neutron diffraction, which was indicative of dislocation shearing through γ′. In contrast, Figure 12 of the as-built state shows the diverging of γ and γ′ curves within (200) grains in several compositions, which is a clear sign of load transfer from γ to γ′ when γ phase starts plastic deformation. The present finding shows consistency with the early-stage plastic deformation of CM247LC which had trimodal γ′ distribution [30]. The size of precipitates in the as-built state is extremely fine (not observed in 718 and ~5 nm in R41 based on unpublished TEM results). Considering possible precipitation during the 11 h incremental loading at 650 °C, the precipitate size would still remain fine, although detailed TEM characterization on a heating replicate was not performed. Based on the computational prediction of precipitate evolution after solution treatment in 718 (Figure 7 in [39]), the estimated precipitate diameter could be below 10 nm after 11 h exposure. The alloys with a higher mix ratio of R41 and high equilibrium fraction of γ′ are expected to have slightly coarser γ′ size than 718. Given the expected ultrafine size of precipitates, the Orowan looping mechanism that is used to explain load transfer for coarse γ′ precipitates [38] shall be excluded from the deformation mechanism. One possible explanation is that the dislocation pinning of ultrafine precipitates could be more favored in terms of energy compared to dislocation shearing so that the increased load sharing in γ′ makes more sense. A similar dislocation pinning mechanism has been widely reported in alloys strengthened by nanoscale oxide dispersion below 20 nm size [40]. In a superalloy with 40% coarse γ′ precipitates, dislocation pile-up at γ/γ′ interface instead of dislocation shearing through γ′ was observed as the dominant deformation mechanism after 7–10% compressive strain at 650 °C and 750 °C [41]. Another possible explanation is that the critical resolved shear stress of γ′ in the 718, 80–20, 60–40, and 40–60 mixes is higher than the max applied stress at 650 °C. In the 718-rich compositions, the presence of γ″ is expected to form during 650 °C exposure based on the TTT diagram [16], which further complicates the problem. Since γ″ peak also overlaps with (200) fundamental reflection, excluding γ″ from (200) peak analysis (not well resolved in diffraction data) introduces higher uncertainty in splitting γ and γ′ phases for 718 and the 80–20 mix. In addition, some amount of coprecipitated γ′/γ″ in hamburger morphology may also form during the 650 °C test, which is reported to have complicated dislocation-particle interaction [42]. Without additional extensive investigation, it is challenging to correlate the observed γ to γ′ load transfer with deformation mechanisms at the precipitate level.

5. Conclusions

A compositionally graded material comprising 718 (γ′/γ″ strengthened superalloy) and R41 (a medium γ′ strengthened superalloy) is fabricated using DED-LB/M. Hot gas path components that require high- and low-temperature capabilities at different locations may benefit from such graded superalloy, potentially eliminating the use of welded or mechanically joined components and reducing cost. DIC, in situ neutron diffraction, and conventional characterization techniques are performed to understand the structure–property relationships and baseline tensile properties. The major conclusions are summarized in the following:
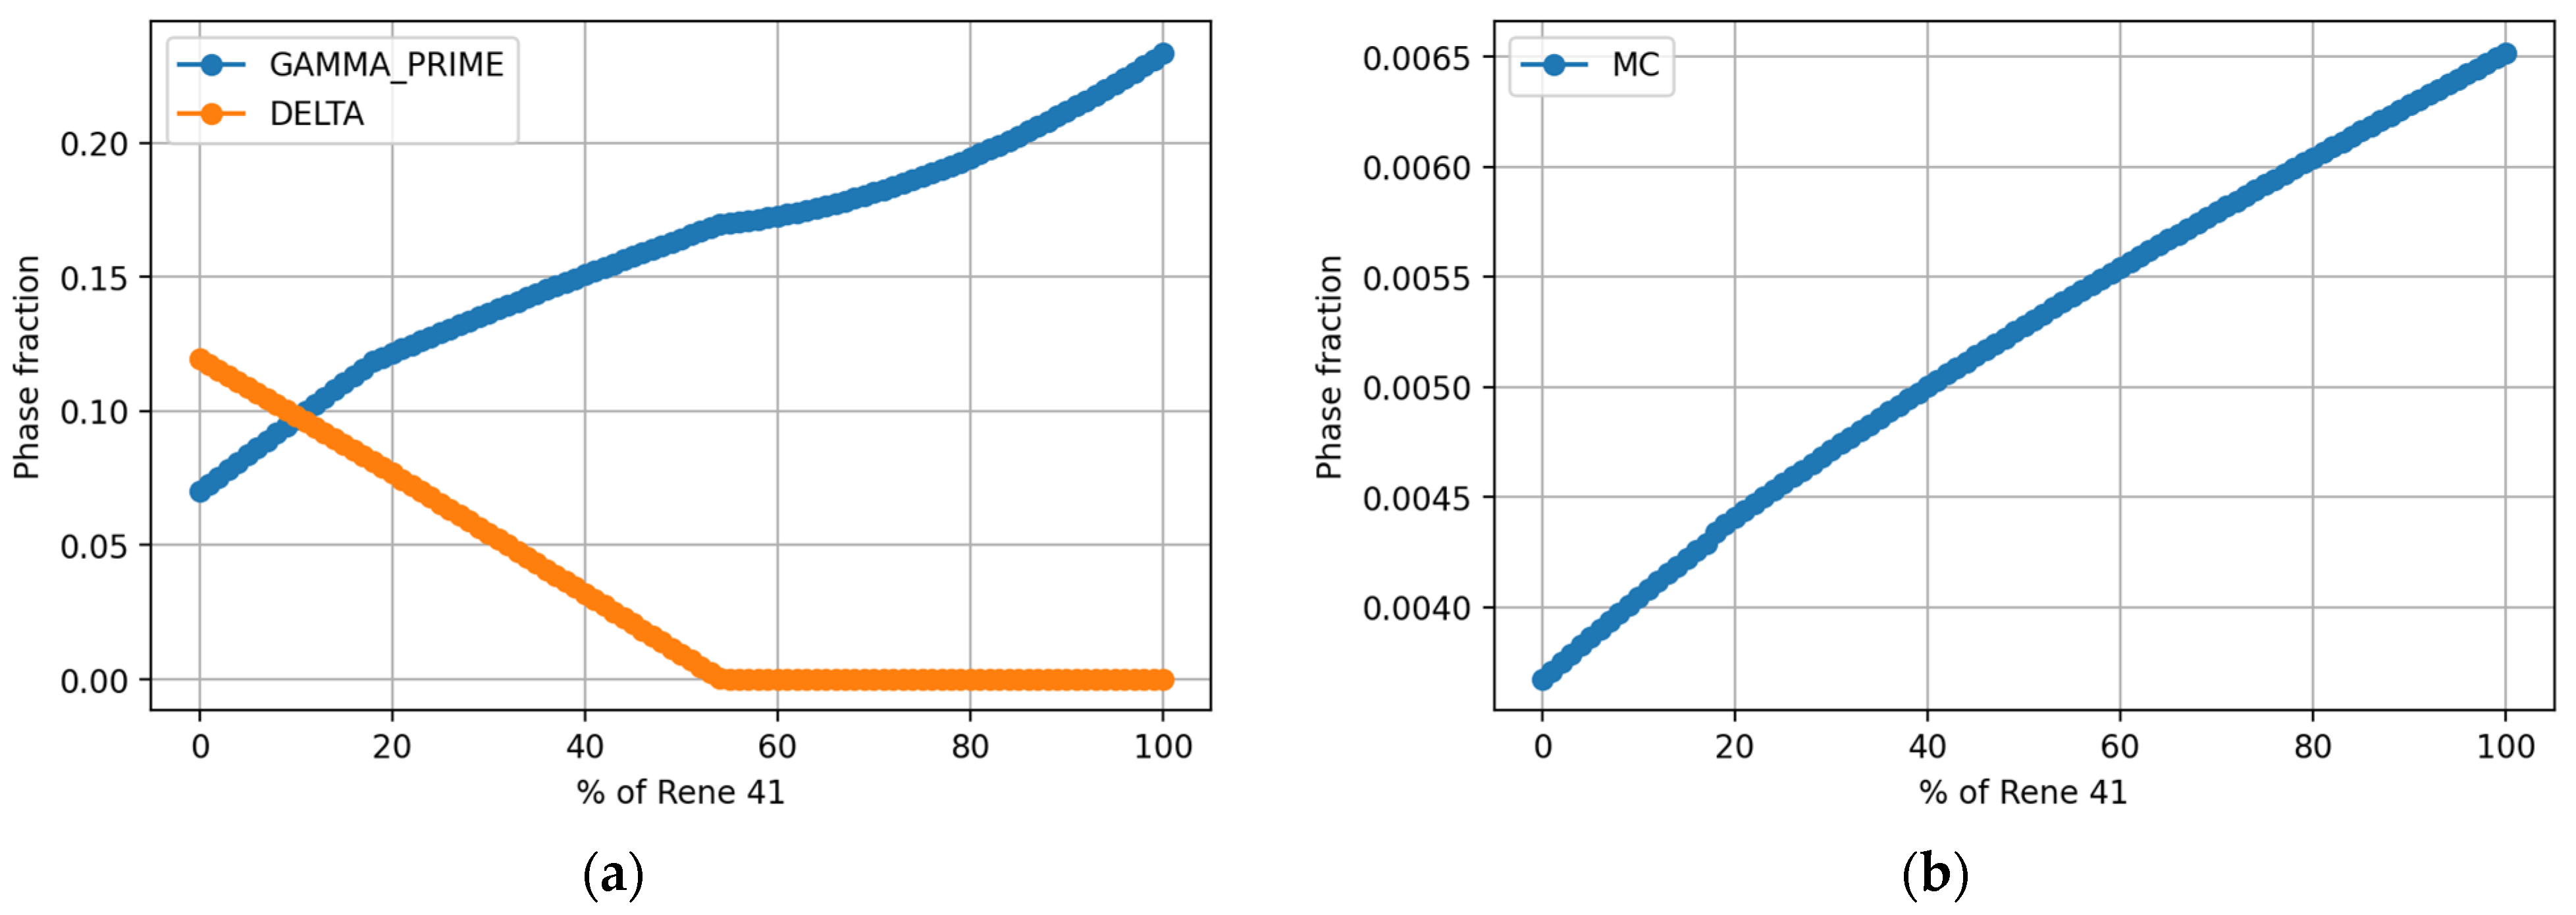
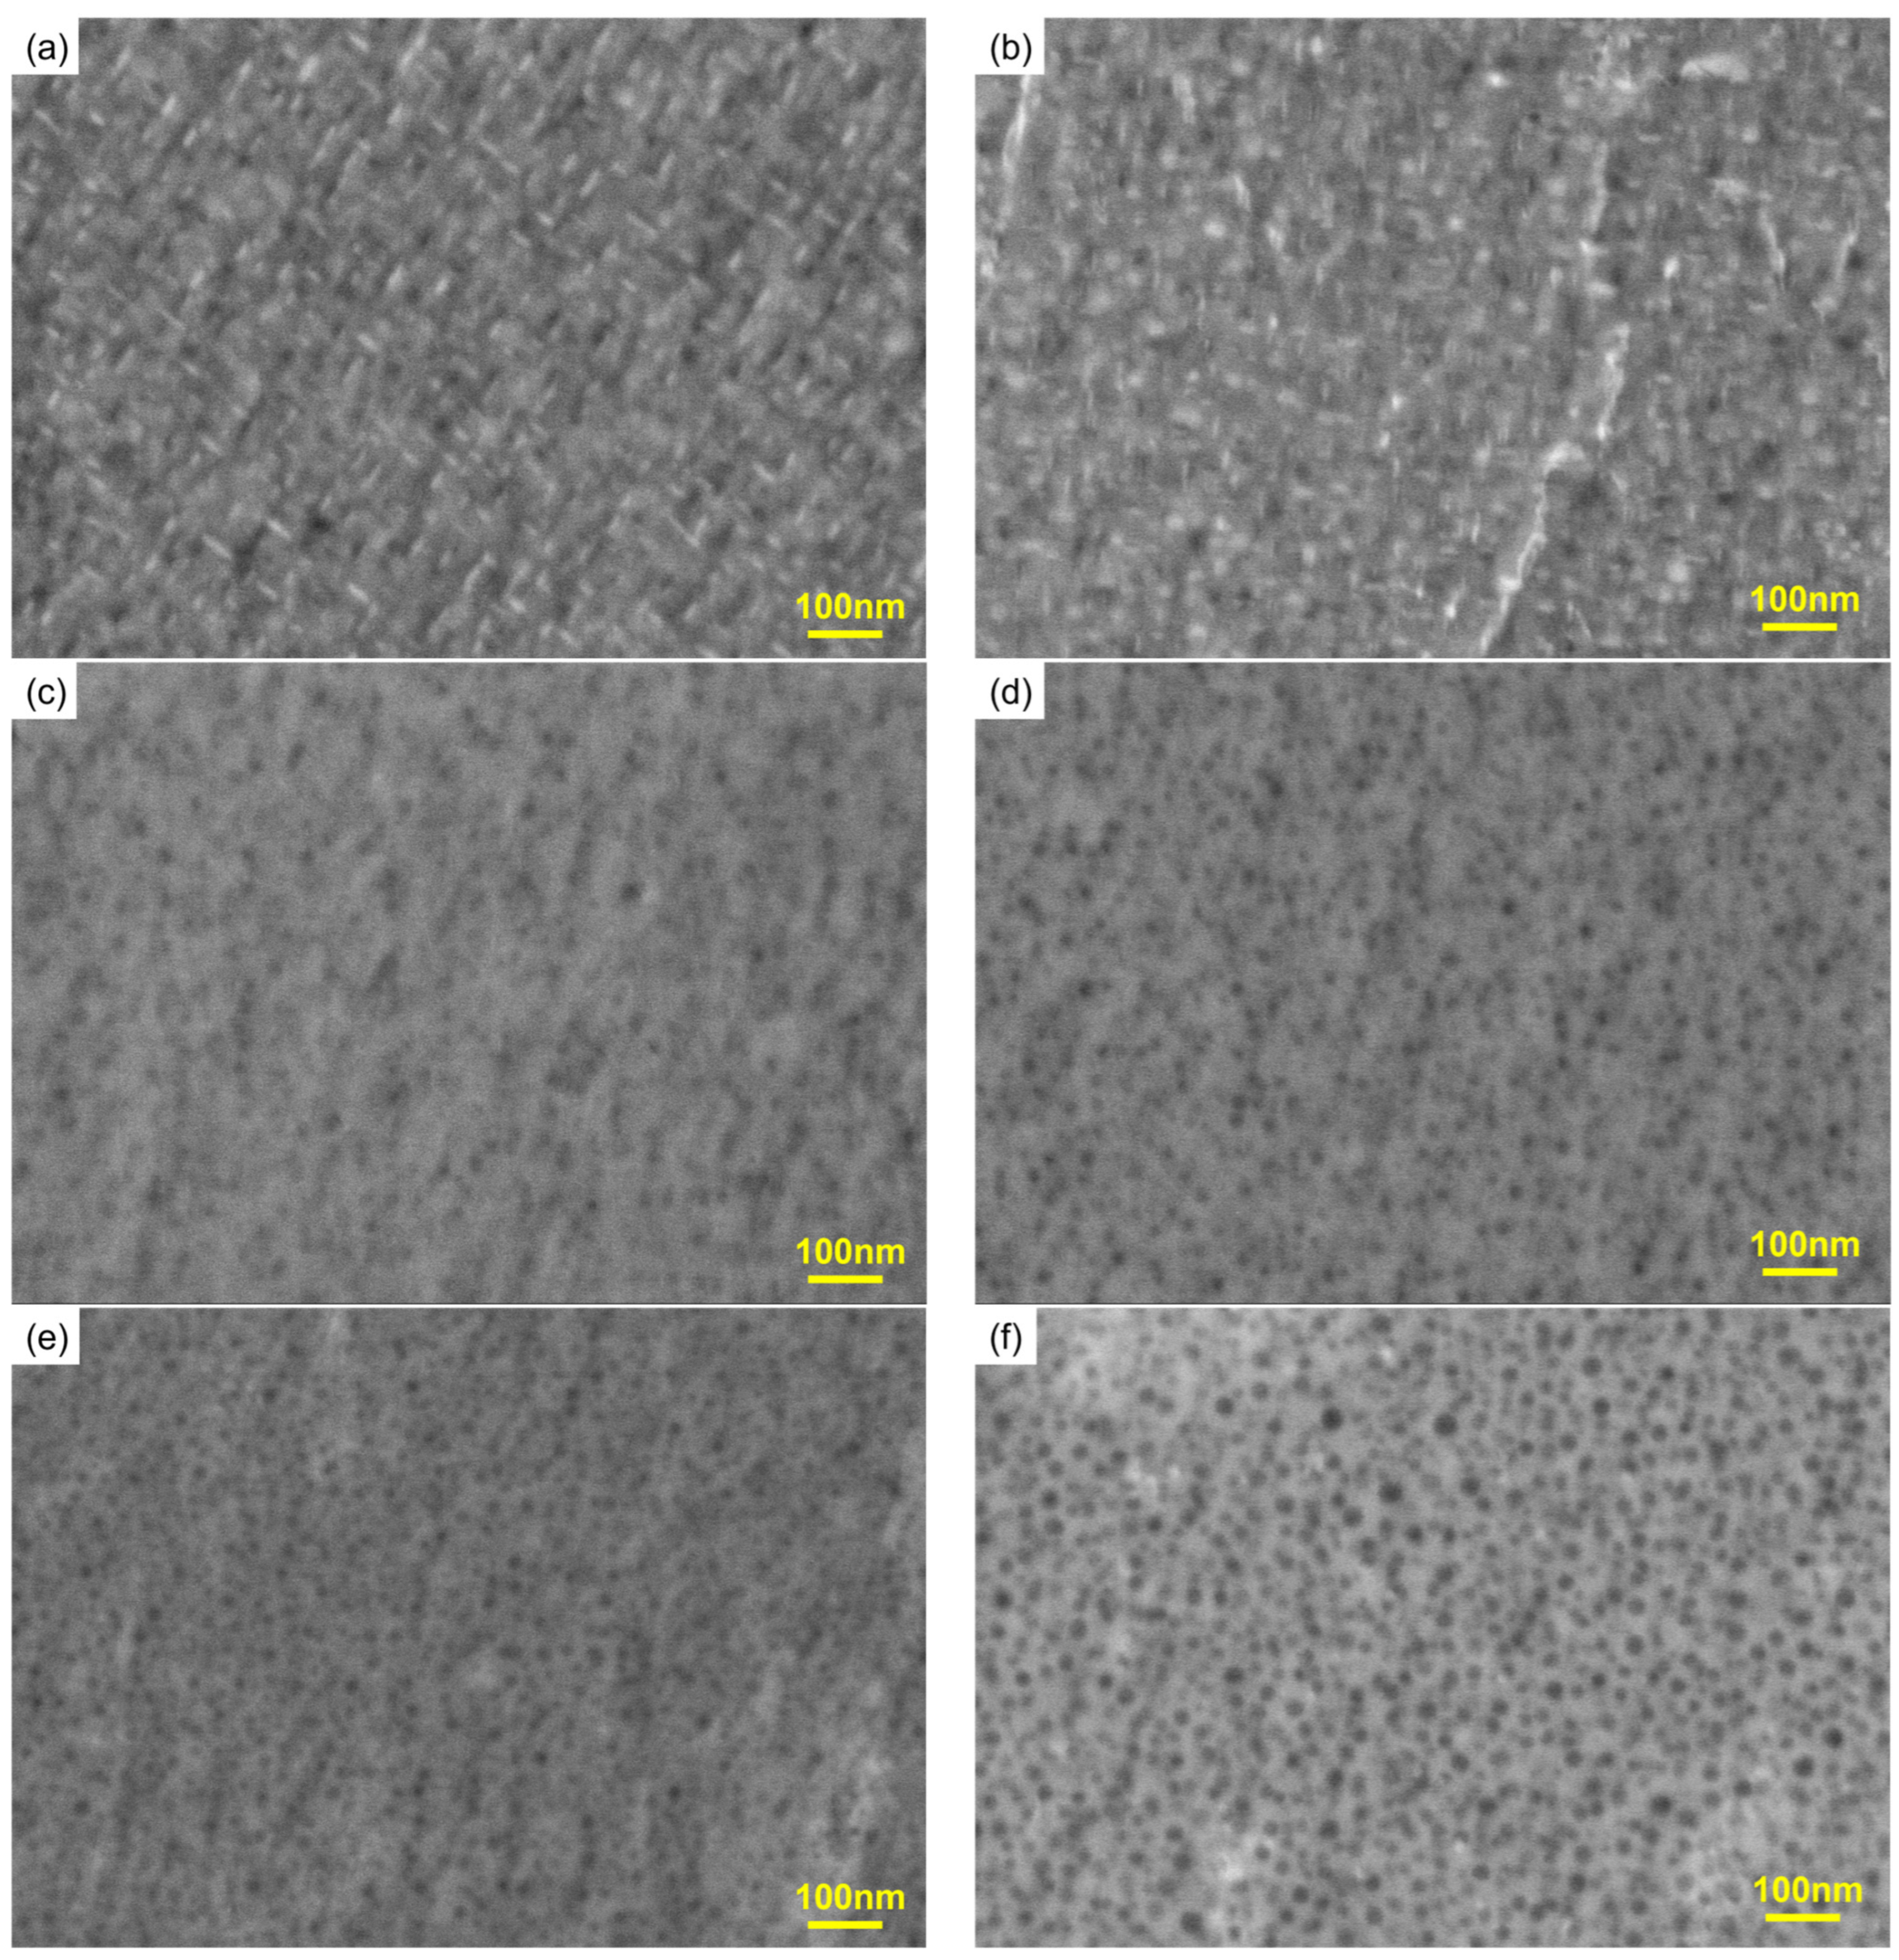
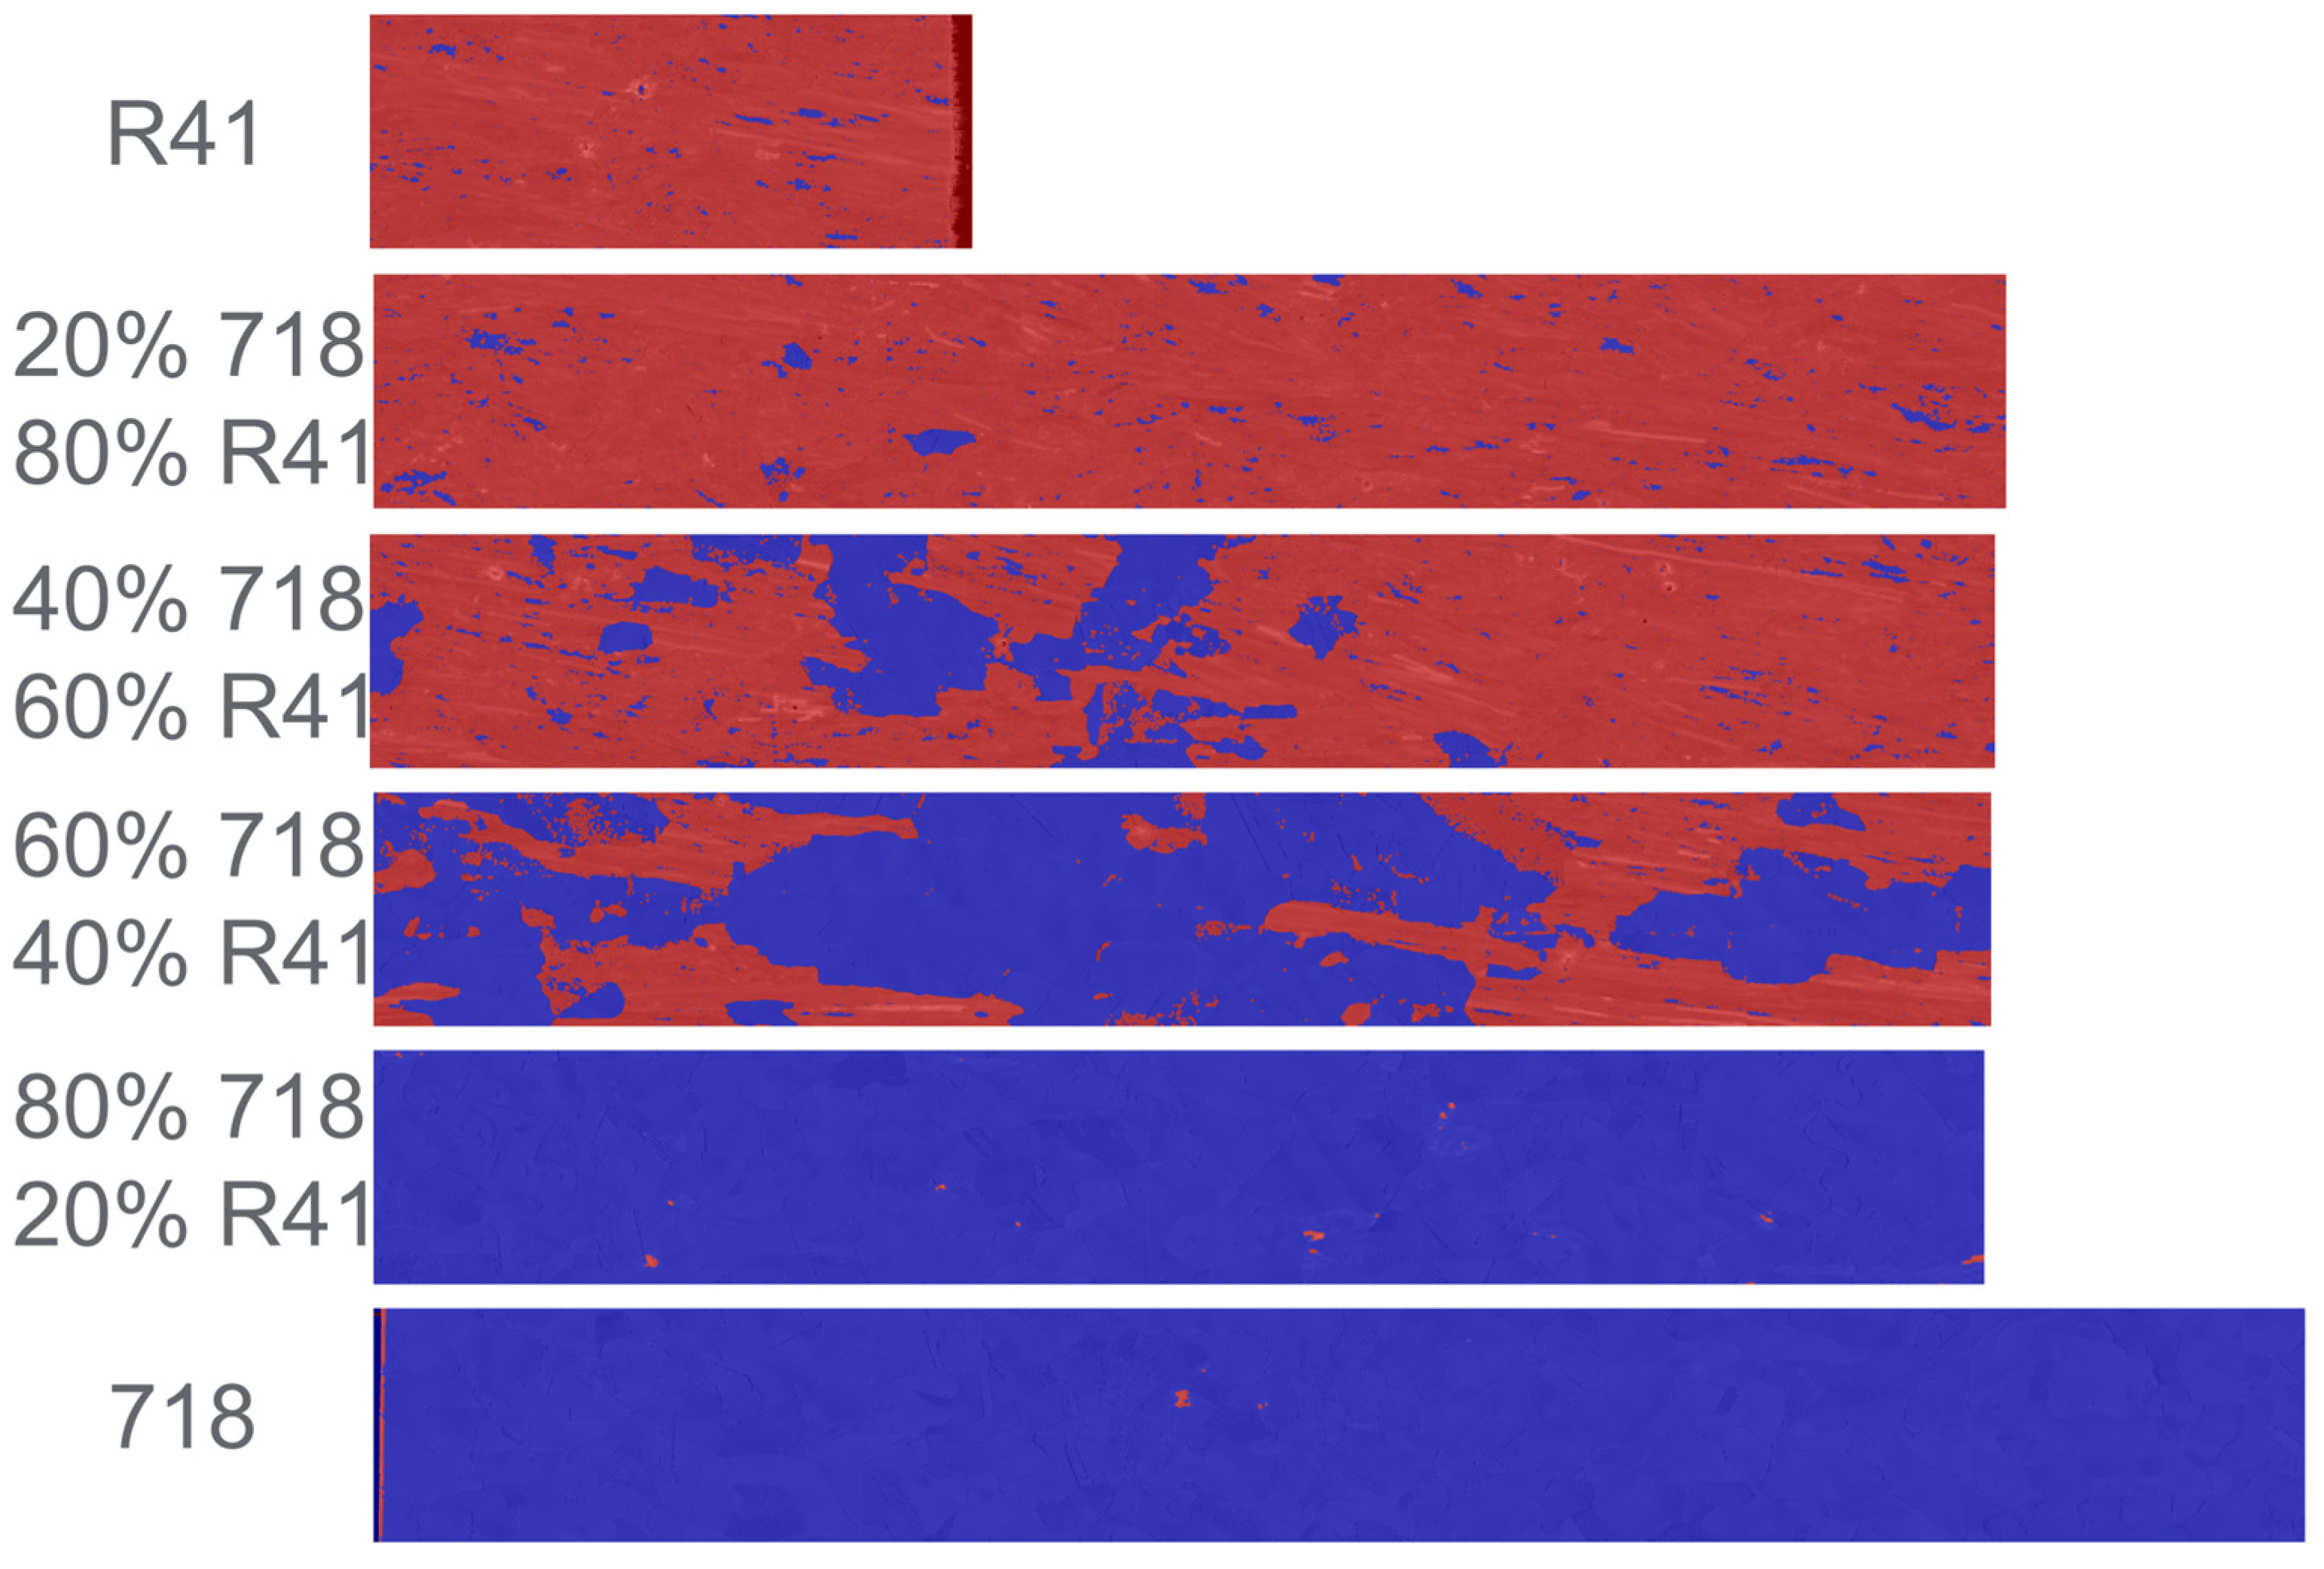
  • The grain structure in the as-built state is dominated by large columnar grains with some plastic strain localized near grain boundaries. After the heat treatment, static recrystallization and equiaxed grains are observed in the 718-rich compositions only, while the R41-rich compositions remain partially or un-recrystallized possibly influenced by an MC carbide fraction higher than 0.5%.
  • The applied heat treatment significantly improves 650 °C yield strength for the 718-rich compositions, while a small improvement is observed in the R41-rich compositions. In heat-treated material, the yield strengths of 718 and R41 are comparable to wrought forms but the graded compositions show weakness, suggesting the need to further optimize the heat treatment.
  • Diffraction elastic constants first decrease then increase along the 718-R41 composition gradient, while a small difference is observed between the as-built and heat-treated states and γ, γ′ phases. Overall, the compositionally graded region shows a smooth transition in the elastic properties.
  • Grain-level load transfer from (220) grains to (200) grains is found to be composition-dependent, which qualitatively agrees with DIC-measured macroscopic yield strength. Within (200) grains of the as-built state, the γ/γ′ phases deform elastically until the γ phase yields and afterwards the γ′ phase takes load from the γ phase. γ yield point increases with an increased fraction of R41 in the alloy composition.
Future research work is recommended, including heat treatment optimization to improve 718-R41 FGM properties and exploring other FGM alloy combinations with temperature capabilities on par or exceeding 718-R41.

Author Contributions

Conceptualization, S.H. and C.S.; formal analysis, S.H., C.S., K.A., M.S., I.S. and M.D.; investigation, S.H., K.A., C.S., M.S., I.S., M.D. and A.L.K.; methodology, S.H., K.A. and C.S.; writing—original draft preparation, S.H.; writing—review and editing, K.A.; supervision, A.L.K.; funding acquisition, A.L.K. All authors have read and agreed to the published version of the manuscript.

Funding

This work was supported by the Department of Energy, Office of Energy Efficiency and Renewable Energy, Advanced Manufacturing Office through Award DE-EE0009118.

Data Availability Statement

The raw data supporting the conclusions of this article will be made available by the authors on request.

Acknowledgments

The authors would like to acknowledge supervision and funding acquisition from Changjie Sun at GE Aerospace Research; technical support from Eric Telfeyan, Marissa Brennan, Cole Crawford, and David Bodner at GE Aerospace Research; Jason Parolini at GE Vernova; Dunji Yu at Oak Ridge National Laboratory; and Lee Kerwin and Alber Sadek at Edison Welding Institute. A portion of this research used resources at the Spallation Neutron Source (IPTS-28084), DOE Office of Science User Facilities operated by the Oak Ridge National Laboratory.

Conflicts of Interest

The authors declare no conflicts of interest.

References

  1. Sam, M.; Jojith, R.; Radhika, N. Progression in manufacturing of functionally graded materials and impact of thermal treatment—A critical review. J. Manuf. Process. 2021, 68, 1339–1377. [Google Scholar] [CrossRef]
  2. Ghanavati, R.; Naffakh-Moosavy, H. Additive manufacturing of functionally graded metallic materials: A review of experimental and numerical studies. J. Mater. Res. Technol. 2021, 13, 1628–1664. [Google Scholar] [CrossRef]
  3. Ansari, M.; Jabari, E.; Toyserkani, E. Opportunities and challenges in additive manufacturing of functionally graded metallic materials via powder-fed laser directed energy deposition: A review. J. Mater. Process. Technol. 2021, 294, 117117. [Google Scholar] [CrossRef]
  4. Hofmann, D.C.; Roberts, S.; Otis, R.; Kolodziejska, J.; Dillon, R.P.; Suh, J.O.; Shapiro, A.A.; Liu, Z.K.; Borgonia, J.P. Developing gradient metal alloys through radial deposition additive manufacturing. Sci. Rep. 2014, 4, 5357. [Google Scholar] [CrossRef]
  5. Stavropoulos, P.; Panagis, F. Modelling of additive manufacturing processes: A review and classification. Manuf. Rev. 2018, 5, 2. [Google Scholar] [CrossRef]
  6. Stavropoulos, P. Additive Manufacturing: Design, Processes and Applications, 1st ed.; Springer: Cham, Switzerland, 2023; pp. 95–121. [Google Scholar] [CrossRef]
  7. Attard, B.; Cruchley, S.; Beetz, C.; Megahed, M.; Chiu, Y.L.; Attallah, M.M. Microstructural control during laser powder fusion to create graded microstructure Ni-superalloy components. Addit. Manuf. 2020, 36, 101432. [Google Scholar] [CrossRef]
  8. Popovich, V.A.; Borisov, E.V.; Popovich, A.A.; Sufiiarov, V.S.; Masaylo, D.V.; Alzina, L. Functionally graded inconel 718 processed by additive manufacturing: Crystallographic texture, anisotropy of microstructure and mechanical properties. Mater. Des. 2017, 114, 441–449. [Google Scholar] [CrossRef]
  9. Gayda, J.; Gabb, T.P.; Kantzos, P.T. The effect of dual microstructure heat treatment on an advanced nickel-base disk alloy. In Superalloys 2004 (Tenth International Symposium Superalloys); The Minerals, Metals & Materials Society: Pittsburgh, PA, USA, 2004; pp. 323–329. [Google Scholar] [CrossRef]
  10. Yang, J.; Liu, D.; Fan, K.; Liu, Y.; Ren, Z.; Liu, D.; Xu, X.; Jia, T.; Zhang, H.; Ye, C. Designing a gradient structure in a Ni-based superalloy to improve fretting fatigue resistance at elevated temperatures through an ultrasonic surface rolling process. Int. J. Fatigue 2023, 168, 107397. [Google Scholar] [CrossRef]
  11. Peachey, D.D.; Carter, C.P.; Garcia-Jimenez, A.; Mukundan, A.; Leonard, D.N.; Charpagne, M.A.; Cordero, Z.C. Directional recrystallization of an additively manufactured Ni-base superalloy. Addit. Manuf. 2022, 60, 103198. [Google Scholar] [CrossRef]
  12. Luo, Y.W.; Ma, T.; Shao, W.W.; Zhang, G.P.; Zhang, B. Effects of heat treatment on microstructures and mechanical properties of GH4169/K418 functionally graded material fabricated by laser melting deposition. Mater. Sci. Eng. A 2021, 821, 141601. [Google Scholar] [CrossRef]
  13. Mazur, V.T.; Mazur, M.M.; D’Oliveira, A.S.C. Graded Inconel 625 coatings with in-situ processing of Ni3Al. Surf. Coat. Technol. 2022, 445, 128660. [Google Scholar] [CrossRef]
  14. Sreeramagiri, P.; Bhagavatam, A.; Ramakrishnan, A.; Alrehaili, H.G.P. Dinda. Design and development of a high-performance Ni-based superalloy WSU 150 for additive manufacturing. J. Mater. Sci. Technol. 2020, 47, 20–28. [Google Scholar] [CrossRef]
  15. Huang, S.; Shen, C.; An, K.; Zhang, Y.; Spinelli, I.; Brennan, M.; Yu, D. Residual Stress and Microstructure in IN718-René41 Graded Superalloy Fabricated by Laser Blown Directed Energy Deposition. Front. Met. Alloys 2022, 1, 1070562. [Google Scholar] [CrossRef]
  16. Oradei-Basile, A.; Radavich, J.F. A current TTT diagram for wrought alloy 718. In Superalloys 718, 625 and Various Derivatives; Loria, E.A., Ed.; The Minerals, Metals & Materials Society: Pittsburgh, PA, USA, 1991; pp. 325–335. [Google Scholar]
  17. Haynes® R-41 Brochure. Available online: https://haynesintl.com/wp-content/uploads/2023/06/r-41-brochure.pdf (accessed on 15 July 2024).
  18. An, K.; Skorpenske, H.D.; Stoica, A.D.; Ma, D.; Wang, X.L.; Cakmak, E. First in situ lattice strains measurements under load at VULCAN. Metall. Mater. Trans. A 2011, 42, 95–99. [Google Scholar] [CrossRef]
  19. An, K.; Chen, Y.; Stoica, A.D. VULCAN: A “hammer” for high-temperature materials research. MRS Bull. 2019, 44, 878–885. [Google Scholar] [CrossRef]
  20. Huang, S.; An, K.; Gao, Y.; Suzuki, A. Determination of γ/γ′ lattice misfit in Ni-based single-crystal superalloys at high temperatures by neutron diffraction. Metall. Mater. Trans. A 2018, 49, 740–751. [Google Scholar] [CrossRef]
  21. Wei, H.L.; Mazumder, J.; DebRoy, T. Evolution of solidification texture during additive manufacturing. Sci. Rep. 2015, 5, 164446. [Google Scholar] [CrossRef]
  22. Dinda, G.P.; Dasgupta, A.K.; Mazumder, J. Texture control during laser deposition of nickel-based superalloy. Scr. Mater. 2012, 67, 503–506. [Google Scholar] [CrossRef]
  23. Ma, D.; Stoica, A.D.; Wang, Z.; Beese, A.M. Crystallographic texture in an additively manufactured nickel-base superalloy. Mater. Sci. Eng. A 2017, 684, 47–53. [Google Scholar] [CrossRef]
  24. Markanday, J.F.S.; Carpenter, M.A.; Jones, N.G.; Thompson, R.P.; Rhodes, S.E.; Heason, C.P.; Stone, H.J. Occurrence of a brass texture and elastic anisotropy in laser blown powder processed superalloy IN718. Mater. Sci. Eng. A 2021, 825, 141781. [Google Scholar] [CrossRef]
  25. Aba-Perea, P.E.; Pirling, T.; Withers, P.J.; Kelleher, J.; Kabra, S.; Preuss, M. Determination of the high temperature elastic properties and diffraction elastic constants of Ni-base superalloy. Mater. Des. 2016, 89, 856–863. [Google Scholar] [CrossRef]
  26. Wang, Z.; Stoica, A.D.; Ma, D. Diffraction and single-crystal elastic constants of Inconel 625 at room and elevated temperatures determined by neutron diffraction. Mater. Sci. Eng. A 2016, 674, 406–412. [Google Scholar] [CrossRef]
  27. Daymond, M.R.; Preuss, M.; Clausen, B. Evidence of variation in slip mode in a polycrystalline nickel-base superalloy with change in temperature from neutron diffraction strain measurements. Acta Mater. 2007, 55, 3089–3102. [Google Scholar] [CrossRef]
  28. Coakley, J.; Reed, R.C.; Warwick, J.L.; Rahman, K.M.; Dye, D. Lattice strain evolution during creep in single-crystal superalloys. Acta Mater. 2012, 60, 2729–2738. [Google Scholar] [CrossRef]
  29. Dye, D.; Coakley, J.; Vorontsov, V.A.; Stone, H.J.; Rogge, R.B. Elastic moduli and load partitioning in a single-crystal nickel superalloy. Scr. Mater. 2009, 61, 109–112. [Google Scholar] [CrossRef]
  30. Coakley, J.; Dye, D. Lattice strain evolution in a high volume fraction polycrystal nickel superalloy. Scr. Mater. 2012, 67, 435–438. [Google Scholar] [CrossRef]
  31. Special Metals 718 Brochure. Available online: https://www.specialmetals.com/documents/technical-bulletins/inconel/inconel-alloy-718.pdf (accessed on 15 July 2024).
  32. Li, Y.; Dlouhý, J.; Koukolíková, M.; Kirana, A.; Vavřík, J.; Džugan, J. Effect of deposit thickness on microstructure and mechanical properties at ambient and elevated temperatures for Inconel 718 superalloy fabricated by directed energy deposition. J. Alloys Compd. 2022, 908, 164723. [Google Scholar] [CrossRef]
  33. Atabay, S.E.; Sanchez-Mata, O.; Muñiz-Lerma, J.A.; Brochu, M. Effect of heat treatment on the microstructure and elevated temperature tensile properties of Rene 41 alloy produced by laser powder bed fusion. J. Alloys Compd. 2021, 858, 157645. [Google Scholar] [CrossRef]
  34. Farias, F.W.C.; Santos, T.J.G.D.; Oliveira, J.P. Directed energy deposition + mechanical interlayer deformation additive manufacturing: A state-of-the-art literature review. Int. J. Adv. Manuf. Technol. 2024, 131, 999–1038. [Google Scholar] [CrossRef]
  35. Hu, Y.L.; Li, Y.L.; Zhang, S.Y.; Lin, X.; Wang, Z.H.; Huang, W.D. Effect of solution temperature on static recrystallization and ductility of Inconel 625 superalloy fabricated by directed energy deposition. Mater. Sci. Eng. A 2020, 772, 138711. [Google Scholar] [CrossRef]
  36. Messé, O.M.D.M.; Muñoz-Moreno, R.; Illston, T.; Baker, S.; Stone, H.J. Metastable carbides and their impact on recrystallisation in In738LC processed by selective laser melting. Addit. Manuf. 2018, 22, 394–404. [Google Scholar] [CrossRef]
  37. Kümmel, F.; Kirchmayer, A.; Solís, C.; Hofmann, M.; Neumeier, S.; Gilles, R. Deformation mechanisms in Ni-based superalloys at room and elevated temperatures studied by in situ neutron diffraction and electron microscopy. Metals 2021, 11, 719. [Google Scholar] [CrossRef]
  38. Jaladurgam, N.R.; Li, H.; Kelleher, J.; Persson, C.; Steuwer, A.; Colliander, M.H. Microstructure-dependent deformation behaviour of a low γ′ volume fraction Ni-base superalloy studied by in-situ neutron diffraction. Acta Mater. 2020, 183, 182–195. [Google Scholar] [CrossRef]
  39. Balan, A.; Perez, M.; Chaise, T.; Cazottes, S.; Bardel, D.; Corpace, F.; Pichot, F.; Deschamps, A.; De Geuser, F.; Nelias, D. Precipitation of γ ″in Inconel 718 alloy from microstructure to mechanical properties. Materialia 2021, 20, 101187. [Google Scholar] [CrossRef]
  40. Capdevila, C.; Bhadeshia, H.K. Manufacturing and microstructural evolution of mechanically alloyed oxide dispersion strengthened superalloys. Adv. Eng. Mater. 2001, 3, 647–656. [Google Scholar] [CrossRef]
  41. Wang, H.; Tong, R.; Shang, H.; Sha, A.; Liu, G.; Song, L.; Zhang, T. In situ synchrotron HEXRD study on the deformation mechanism of a nickel-based superalloy during medium-temperature compression. Metals 2023, 13, 904. [Google Scholar] [CrossRef]
  42. McAllister, D.; Lv, D.; Feng, L.; Deutchman, H.; Wessman, A.; Wang, Y.; Mills, M.J. Characterization; modeling of deformation mechanisms in Ni-base superalloy. In Proceedings of the 9th International Symposium on Superalloy 718 & Derivatives: Energy, Aerospace, and Industrial Applications; Ott, E., Groh, J., Liu, X., Andersson, J., Bi, Z., Bockenstedt, K., Dempster, I., Heck, K., Jablonski, P., Kaplan, M., et al., Eds.; Springer International Publishing: Cham, Switzerland, 2018; pp. 319–338. [Google Scholar] [CrossRef]
Figure 1. (a) As-built 718-R41 graded block, (b) one block after heat treatment, (c) dimension of tensile specimen, and (d) tensile specimen machined along build direction.
Metals 14 00950 g001
Figure 2. (a) A specimen under loading and heating by induction heating setup. A total of 6 spot-welded thermocouples and high-temperature extensometer were attached to the specimen gauge. (b) Experimental setup via the direction of looking back to the incident beam.
Metals 14 00950 g002
Figure 3. Inverse pole figure along build direction and <001> pole figures parallel and perpendicular to build direction for as-built 718-R41 graded specimen.
Metals 14 00950 g003
Figure 4. Inverse pole figure along build direction and <001> pole figures parallel and perpendicular to build direction for heat-treated 718-R41 graded specimen.
Metals 14 00950 g004
Figure 5. KAM map with 11 × 11 kernel size and max 4° angle for as-built and heat-treated 718-R41 graded specimens.
Metals 14 00950 g005
Figure 6. Macroscopic stress vs. strain curves of as-built and heat-treated specimens at 650 °C by lab tensile test and VULCAN test. Strain was calculated from extensometer data. Data up to 5% strain are plotted.
Metals 14 00950 g006
Figure 7. Strain distribution along gauge length at 3% macroscopic strain: (a) as-built and (b) heat-treated specimens. μXRF-measured Fe profile was aligned to visualize different composition regions.
Metals 14 00950 g007aMetals 14 00950 g007b
Figure 8. Stress–strain curves for each composition obtained from DIC analysis: (a) as-built specimen and (b) heat-treated specimen. The inserts magnify data up to 2% strain.
Metals 14 00950 g008
Figure 9. Lattice strain evolution in as-built specimen for (a) (220) grains, (b) (200) grains, (c) (111) grains, and (d) (311) grains.
Metals 14 00950 g009
Figure 10. Lattice strain evolution in heat-treated specimen for (a) (220) grains, (b) (200) grains, (c) (111) grains, and (d) (311) grains.
Metals 14 00950 g010aMetals 14 00950 g010b
Figure 11. Intergranular strain evolution in (220) and (200) grains of as-built and heat-treated specimens.
Metals 14 00950 g011
Figure 12. Lattice strain evolution in γ and γ′ phases and (200) orientation in as-built specimen.
Metals 14 00950 g012
Figure 13. Equilibrium mole % of (a) γ′ and δ at 718 °C; (b) MC carbides at 1200 °C as a function of R41% mixed with 718 predicted by Thermo-Calc.
Metals 14 00950 g013
Figure 14. Backscattered electron images at 100 k magnification in heat-treated (a) 718, (b) 80% 718 20% R41, (c) 60% 718 40% R41, (d) 40% 718 60% R41, (e) 20% 718 80% R41, and (f) R41.
Metals 14 00950 g014
Figure 15. Recrystallized grains (blue) and un-recrystallized grains (red) visualized by EBSD analysis for heat-treated specimens.
Metals 14 00950 g015
Figure 16. Backscattered electron images of carbides in heat-treated (a) 718, (b) 80% 718 20% R41, (c) 60% 718 40% R41, (d) 40% 718 60% R41, (e) 20% 718 80% R41, and (f) R41.
Metals 14 00950 g016
Table 1. Alloy powder compositions in weight percent (wt.%).
AlloyNiCoCrAlTiMoCBFeNb + Ta
R41Bal.10.818.81.23.19.20.0802--
71852.6<0.118.90.60.93.10.040.004Bal.4.75–5.5
Table 2. DED-LB/M build parameters for 718-R41 graded blocks.
Laser Power (W)886
Travel speed (mm/min)711
Hatch travel speed (mm/min)838
Hatch-hatch spacing (mm)1.04
Hatch-contour spacing (mm)0.61
Rotation of hatch orientation45°
Feed rate (g/min)10.9
Laser spot (mm)1.78
Laser thickness (mm)0.5
Total number of layers262
Dwell time (s)5
Graded region startLayer 106
Graded region endLayer 155
Table 3. The heat treatment procedure for one 718-R41 graded block (temperature controlled within ±5 °C).
Stress relief/homogenization1200 °C/1 h in vacuum followed by furnace cool
HIP1121 °C/15 ksi/4 h
Solution treatment1121 °C/0.5 h in flowing argon followed by air cool
Two-step aging treatments760 °C/3 h in flowing argon followed by air cool
718 °C/13 h in flowing argon followed by air cool
Table 4. Macroscopic 0.2% yield strength measured by DIC and elastic limit of (220) grains measured by neutron diffraction at 650 °C.
As-Built 718-R41 Graded MaterialHeat-Treated 718-R41 Graded Material
0.2% Yield Strength, MPaYield Point of (220) Grains, MPa0.2% Yield Strength, MPaYield Point of (220) Grains, MPa
718494335821652
80% 718 20% R41472279734610
60% 718 40% R41528335636526
40% 718 60% R41581335651526
20% 718 80% R41654448706568
R41718504753652
Table 5. Grain orientation-dependent DECs at 650 °C (unit: GPa).
As-Built 718-R41 Graded Material, 650 °C
(111)(200)(220)(311)
718190.2 ± 2.7133.7 ± 4.2158.6 ± 1.4147.9 ± 2.5
80% 718 20% R41171.1 ± 2.3120.8 ± 1.0148.6 ± 0.7137.3 ± 1.1
60% 718 40% R41182.8 ± 2.1123.8 ± 0.6152.6 ± 0.4142.2 ± 0.7
40% 718 60% R41189.5 ± 1.7134.1 ± 0.3160.1 ± 0.5152.8 ± 0.4
20% 718 80% R41206.3 ± 0.7144.8 ± 0.6170.0 ± 0.8164.0 ± 0.6
R41218.7 ± 1.1156.6 ± 0.6180.7 ± 0.7175.5 ± 0.6
Heat-Treated 718-R41 Graded Material, 650 °C
(111)(200)(220)(311)
718195.9 ± 1.4129.3 ± 0.3170.4 ± 1.7153.2 ± 0.8
80% 718 20% R41191.2 ± 0.8125.8 ± 1.5166.5 ± 0.5149.6 ± 0.3
60% 718 40% R41187.4 ± 0.8115.6 ± 3.3163.7 ± 0.9144.9 ± 0.6
40% 718 60% R41193.4 ± 0.6122.1 ± 4.0171.7 ± 0.4153.3 ± 0.7
20% 718 80% R41194.3 ± 1.5135.3 ± 1.7168.5 ± 0.6158.8 ± 0.1
R41213.2 ± 1.5156.3 ± 0.3180.1 ± 0.9174.0 ± 0.7
Table 6. Orientation dependent γ′ DECs at 650 °C (unit: GPa).
As-Built 718-R41 Graded Material, γ′ Phase, 650 °C
(210)(211)/(110)
20% 718 80% R41181.2 ± 14.4177.0 ± 19.7
R41176.3 ± 5.5184.6 ± 13.9
Heat-Treated 718-R41 Graded Material, γ′ Phase, 650 °C
(210)(211)/(110)
40% 718 60% R41159.1 ± 6.3195.9 ± 16.9
20% 718 80% R41175.7 ± 5.2168.0 ± 9.7
R41187.9 ± 1.8193.2 ± 8.7
Table 7. Grain orientation-dependent Poisson’s ratio at 650 °C.
As-Built 718-R41 Graded Material, 650 °C
(111)(200)(220)(311)
7180.2700.3860.3570.329
80% 718 20% R410.2620.3730.3730.323
60% 718 40% R410.2730.3890.3870.344
40% 718 60% R410.2670.3990.3190.347
20% 718 80% R410.2780.4280.2680.352
R410.2770.4260.2500.349
Heat-Treated 718-R41 Graded Material, 650 °C
(111)(200)(220)(311)
7180.2430.3670.3090.346
80% 718 20% R410.2490.3770.3300.346
60% 718 40% R410.2510.3550.3670.335
40% 718 60% R410.2750.3570.3630.345
20% 718 80% R410.2750.4050.3230.347
R410.2830.4400.2690.369
Disclaimer/Publisher’s Note: The statements, opinions and data contained in all publications are solely those of the individual author(s) and contributor(s) and not of MDPI and/or the editor(s). MDPI and/or the editor(s) disclaim responsibility for any injury to people or property resulting from any ideas, methods, instructions or products referred to in the content.

