Article

Engineering Corrosion Resistance in Magnesium Alloys for Biomedical Applications: A Synergy of Zn/Ca Atomic Ratio and Texture-Based Approach

Univ. Lille, CNRS, INRA, ENSCL, UMR 8207-UMET-Unité Matériaux et Transformations, F-59000 Lille, France
*
Author to whom correspondence should be addressed.
Metals 2024, 14(9), 1002; https://doi.org/10.3390/met14091002
Submission received: 29 May 2024 / Revised: 22 August 2024 / Accepted: 27 August 2024 / Published: 2 September 2024
(This article belongs to the Special Issue Advanced Biomedical Materials (2nd Edition))

Abstract

:
Magnesium (Mg) and Magnesium-Zinc-Calcium alloys present a compelling option for biodegradable implant materials. Utilizing Vacuum Induction Casting, Mg–2.5Zn-xCa (with x = 0.3, 0.5, 0.9, 1.15 wt%) alloys were fabricated and subjected to hot-rolling for thermo-mechanical processing. The hot-rolled Mg–2.5Zn-0.3Ca alloy exhibits the lowest corrosion rate along with the highest basal texture. Increasing the Zn/Ca atomic ratio intensifies the basal texture and enhances corrosion resistance. Elevated Zn concentration improves corrosion resistance via Ca2Mg6Zn3 phase formation, while increased Ca content diminishes corrosion resistance due to the Mg2Ca phase. Advancement of this alloy is poised to extend Mg alloy use in innovative biomedical bone implants.

Graphical Abstract

1. Introduction

Magnesium and its alloys have gained significant attention in orthopedic implants in biomedical research due to their favorable mechanical properties. With an elastic modulus from 41 to 45 GPa and a density between 1.74 and 1.84 g/cm3, these alloys closely emulate the properties of natural bone (E = 15–25 GPa, density = 1.8–2.1 g/cm3) and are coupled with excellent biocompatibility [1,2]. Magnesium ions are naturally present in the body, constituting a metabolite found in bones and absorbed daily at a rate of 250 to 300 mg/day. As a result, magnesium-based alloys exhibit superior compatibility with bones, attributed to their similar structures and excellent biocompatibility [3]. However, rapid degradation of Mg and its alloys in chlorine environments makes them susceptible to corrode in the human body, leading to increased hydrogen gas generation. These factors result in diminished mechanical properties and potential implant failure before the healing period is complete. Meticulous control of the implant material’s degradation is essential to prevent undesirable side effects such as improper bone healing, hydrogen gas evolution, and/or extensive inflammation [4]. This challenge can be overcome by using suitable alloying at appropriate concentrations, controlling the microstructure, and adapting the thermo-mechanical processing [5,6].
The corrosion rate of the Mg alloys is influenced by the choice of alloying elements and the presence of secondary phase segregation [7]. Magnesium alloying is crucial for modifying implant corrosion rates. Selection of alloying elements should consider toxicity, non-allergic properties, and nutrient levels in the human body, favoring metals like Zn and Ca [8]. In relation to the corrosion behavior, Mg-based biodegradable implants should have a Zn concentration lower than 6 wt% and a Ca content less than 2 wt%. Moreover, the degradation rate must follow daily intake doses of human physiology for each alloying element or ideally surpass these limits with more favorable values [9,10,11]. The Zn/Ca ratio in Mg alloys is crucial for determining their microstructure and corrosion behavior. Moreno et al. showed that Mg alloys with the highest Zn/Ca ratio, such as Mg–0.6Ca–1.8Zn, exhibit a greater presence of Ca2Mg6Zn3 peaks; this is in accordance with other studies [12]. The grain sizes and volume fraction of second phases increase with higher zinc and calcium content, with calcium promoting a dendritic grain shape; zinc does not influence the shape. Alloys like Mg–0.6Ca–1.8Zn, which have a high Zn/Ca ratio, show the presence of three phases and demonstrate reduced corrosion rates due to a decreased potential difference between phases. This makes them particularly suitable for biodegradable implant materials [13].
Various thermomechanical processing techniques, including rolling, can modify the microstructure and crystallographic texture of Mg based systems. These modifications can influence the corrosion behavior of the Mg alloys [14,15]. A strong basal texture in the surface of the rolled Mg alloy demonstrates a higher corrosion resistance than the cross-section surface. In cases of hcp-structured materials like magnesium, the corrosion rate decreases in the order basal plane > prismatic II plane > prismatic III plane; this is due to the difference in atomic packing densities [16]. Q. Li et al. [17] reported that unidirectional rolling develops a stronger basal rolling texture along with a more homogenized grain size distribution as compared to cross-rolling processing.
Based on the literature [18,19,20], alloying concentrations can influence corrosion resistance in two ways. First, the alloying elements concentration changes the alloy chemistry, resulting in the change of corrosion response. Second, the influence of microstructural changes like grain refinement and formation of secondary phases affect the corrosion kinetics. The secondary phases that develop in Mg-Zn-Ca alloys are also dependent on the Zn/Ca atomic ratios [21]. P. Duley et al. explored the age-hardening behavior induced by homogenization in Mg-4Zn-0.5Ca-0.16Mn (wt%) alloy [22]. They observed coarse eutectic networks of the Ca2Mg6Zn3 phase and were identified as crack-initiating sites causing reduced ductility. Further homogenization treatment led to dissolution of those crack-initiating eutectic phases and a marginal increase in grain size. Y. Lu et al. [23] studied the corrosion behavior of Mg-3Zn-0.3Ca alloy in Simulated Body Fluid (SBF). These alloys were subjected to heat treatment to modify the grain size and volume fraction of the secondary phase. The results highlighted the influence of secondary phases and grain size on corrosion behavior. A microstructure with a smaller grain size and a maximum secondary phase volume fraction exhibited the highest corrosion rate. This is attributed to the difference in standard electrode potential of secondary phases in the following order, Ca2Mg6Zn3 > α-Mg > Mg2Ca, leading to galvanic corrosion induced by these phases.
Song et al. [24] discussed that the corrosion behavior of the matrix is significantly influenced by the presence of second-phase particles and impurity-containing particles within the matrix. Key factors include the quantity, quality, and distribution of these second-phase particles. Large, well-separated second-phase particles induce micro-galvanic acceleration, while a continuous distribution of the second phase results in a barrier effect. The effectiveness of the second phase is determined by the ease of the hydrogen evolution reaction (HER) from the second phase, the potential difference between the second phase and the matrix, and the stability or passivity of the second phase [25].
J. Luo et al. [26] investigated the effect of Zn and Ca concentration on microstructure, texture, and mechanical properties of the hot-rolled Mg-Zn-Ca alloys. The results showed that an increasing volume fraction of Ca2Mg6Zn3 phases decreased the uniform elongation of the Mg-Zn-Ca alloys. Hot-rolled Mg-0.73Zn-0.12Ca (wt%) demonstrated the maximum elongation of 37% due to its lowest volume fraction of Ca2Mg6Zn3. All the hot-rolled alloys showed a decrease in basal texture intensity with an increase in Ca concentration. Similar results were found by B. Zhang et al. [27] in Mg-1Zn-0.5Ca (wt%). The weakening basal textures and the presence of fine grains can be attributed to particle-stimulated nucleation of recrystallization, which impedes the dynamic growth of recrystallized grains [28]. Hence, based on these investigations, it can be inferred that the corrosion resistance of magnesium could be enhanced by controlling microstructure and Zn/Ca atomic ratio.
In this study, we developed a unique Mg-Zn-Ca alloy composition using the Vacuum Induction casting technique followed by thermomechanical hot-rolling. The newly developed alloy exhibits enhanced corrosion resistance, stronger basal texture, and minimal secondary phases. Furthermore, the study discussed the correlation of grain size, crystallographic texture, and atomic ratio of Zn/Ca on the corrosion behavior of new-class hot-rolled Mg-Zn-Ca alloys. This involved evaluating the microstructure and texture of unidirectional hot-rolled Mg-2.5Zn-xCa (x = 0.3, 0.5, 0.9, and 1.15) (wt%) along with evaluating their corrosion rate in SBF solution. Corrosion behavior was evaluated using electrochemical measurements and weight loss measurements from immersion testing.

2. Experimental

2.1. Materials

Composition and nomenclature of the MgZnCa alloy used in this work are listed in Table 1. The raw materials used to cast these alloys were high purity Mg (99.9%), Mg-30 wt% Zn master alloy, and Mg-22 wt% Ca master alloy. The whole process of melting and casting was performed in a Vacuum induction furnace (Indutherm VC 450, Indutherm, Walzbachtal, Germany) backfilled with high purity argon and nitrogen protection. A graphite crucible was used for melting all elements. The steel casting mold was preheated to 400 °C prior to casting. After the vacuum induction melting furnace was charged, the melting pressure was set to 0.5 bar to start the heating. The temperature was gradually increased to 690 °C with continuous electromagnetic induced agitation in order to ensure proper mixing. The casting pressure was the same as the melting pressure, and was followed by a cooling time of 10 min. The as-cast Mg alloy ingots were then homogenized at 450 °C for 24 h in a muffle furnace under an Ar atmosphere, followed by rolling them down to 35% reduction in thickness. The as-rolled pure Mg was also prepared by following the above procedure and considered as control in this work. The as-rolled samples were cut into 7 × 7 × 2 mm3 sections from the ND plane for material characterization. The thermo-mechanical processing and the direction of rolling is depicted in Figure 1. All the studies are conducted on rolled alloys.

2.2. Chemical Composition and X-ray Diffraction

Energy-dispersive X-ray spectroscopy (EDS) was performed using a Hitachi SU5000 scanning electron microscope (SEM) to analyze the chemical composition of the alloys. SEM was operated at 15 kV accelerating voltage with a working distance of 10 mm.
The crystalline phases of the alloys were investigated using X-ray Diffraction (XRD, Rigaku, Akishima, Japan) with Cu Kɑ (λ = 0.154 nm) at a scan speed of 0.02° s−1. The samples were scanned from 2θ range of 5° to 80°. Recorded XRD peaks were matched with their respective ICDD databases and processed using Diffrac. Eva (Bruker, Karlsruhe, Germany) software (Diffrac. Eva, 3.1).

2.3. Microstructural Analysis

Specimens of 7 × 7 mm2 of as-cast and rolled samples were cut from the ND plane as shown in Figure 1. The surface was prepared by standard metallographic techniques, starting from mechanical grinding using SiC paper of 800 grit to 4000 grit, followed by polishing till 0.25 µm diamond polish and then etching the surface with Acetic-Picral solution. Grain morphology was observed using an optical microscope (Olympus BX70, Westborough, MA, USA). Backscattered electron (BSE) micrographs were observed on unetched samples using SEM (Hitachi, Hitachi, Japan)

2.4. EBSD Analysis

For EBSD analysis, the samples were ion-polished at 4 kV voltage at an angle of 5° and 6 rpm for 10 min prior to measurement. The EBSD analysis was performed on the ND plane in FE-SEM (Hitachi, Hitachi, Japan), equipped with an EBSD detector, at 20 kV, 15 mm working distance, and a step size of 1 µm. The texture analysis was obtained by using HKL channel 5 and processed using ATEX software (Beausir and Fundenberger, 2017).

2.5. Mechanical Properties

Micro-indentation was performed to investigate the elastic modulus and micro-hardness of the alloys. Prior to the indentation, the sample surface was polished up to a 0.25 μm mirror finish. Indentation was conducted at room temperature using a CSM2-107 Tester with a pyramidal Vickers indenter (CSM instruments, Peseux, Switzerland). The test was a load-controlled system and comprised of indents arranged in five-by-two pattern with 500 μm spacing between indents. A maximum load of 0.5 N with a loading rate of 1 N/min was applied. The holding time for each indent was 70 s.

2.6. Electrochemical Behaviour

A three-electrode system was used for the potentiodynamic polarization test (OrigaLys ElectroChem, Rhône, France), in which a Standard Calomel electrode was taken as a reference electrode, a platinum electrode as a counter electrode, and the test specimen as a working electrode. Samples with a 49 mm2 surface area were used in the electrochemical measurement in SBF solution as the electrolyte. Prior to Tafel extrapolation, an Open Circuit Potential (OCP) was measured for 30 min in order to stabilize the system and ensure proper connections. Tafel plots were recorded at a voltage range of 1 V with reference to OCP measured, with constant stirring at 4 rpm and a scan rate of 0.2 mVs−1. Three samples for each condition were examined for statistical significance.

2.7. Immersion Test

Samples in triplicates for each condition of 7 × 7 × 2 mm2 were immersed in SBF solution and placed in an incubator shaker at 150 rpm with a temperature of 37 °C for 21 days. Every 72 h, fresh SBF solution was added to keep the solution fresh for 21 days. The pH of the SBF solution and the mass of each sample was measured every 2 days. The surface topography was observed using a stereomicroscope (Keyence, Osaka, Japan) and SEM.

3. Results and Discussion

3.1. Chemical Composition and XRD Phase Analysis

Table 2 presents the measured weight percentage of each element present in the respective alloys determined by EDS analysis. It was observed that measured elemental compositions are close to the nominal compositions. Figure 2 shows the XRD patterns of hot-rolled alloys. The peaks were indexed using the standard ICDD database. It can be seen that all the peaks show the presence of Ca2Mg6Zn3 phase in the hot rolled alloys. Additionally, we observed there are peaks of Mg2Ca phase as the Ca alloying increases from 0.5 wt% to 1.15 wt%. The variation in XRD peak intensities serves as an indicator of crystal orientation within the alloy matrix. Notably, with a Zn/Ca atomic ratio more than 1.0–1.2, we can infer that the intensities of peaks corresponding to the (α-Mg + Ca2Mg6Zn3) phase remain consistent, as reported by Zhang et al. [29].

3.2. Microstructural Analysis

Optical micrographs are illustrated in Figure 3 for ZC00 (Figure 3a), ZC01 (Figure 3b), ZC02 (Figure 3c), ZC03 (Figure 3d), and ZC04 (Figure 3e). The average grain size of all rolled alloys were calculated using the linear intercept method and the grain sizes are tabulated in Table 3. The as-cast alloys optical images are illustrated in Supplementary Materials. The secondary phase volume fraction (%) was calculated using ImageJ software (1.8).
The optical micrographs and grain size measurements collectively indicate a synergistic effect of incorporating Zn and Ca, resulting in grain refinement across all hot-rolled alloy systems in comparison to the ZC00 alloy. On comparing the ZC00 and ZC01 alloys, a substantial decrease in grain size from 342 µm to 173 µm is observed. For other alloys, where the Zn content was held constant at 2.5 wt% and Ca content was varied, a reduction in grain size is observed, although not as pronounced as with Zn addition. For instance, at 0.3 wt% Ca content, the grain size is 173 µm, reducing to 158 µm at 0.5 wt% Ca content. Similarly, at 0.9 wt% Ca content, the grain size is 136 µm, while at 1.15 wt% Ca content, it further decreases to 107 µm. This observed trend in grain size reduction can be attributed to the growth-restricted factor (Q), which quantifies the solute effect in alloy systems concerning grain refinement and growth. Q is defined as Q = mco (k − 1), where m is the gradient of the liquidus line of a binary alloy, co is the bulk concentration of the solute, and k is the equilibrium partition coefficient of the solute. A solute with a higher Q value is expected to exhibit greater grain refining potency due to its stronger constitutional undercooling effect [30,31]. The growth restriction factor (Q) is a crucial parameter in contemporary models of the solute effect on grain growth and grain refinement during alloy solidification. Previous studies [32] present a rigorous method for evaluating Q in multicomponent alloys, utilizing consistent thermodynamic descriptions of alloy phase equilibria. Upon closer examination, the conventional approach for calculating Q in multicomponent alloys, based on the liquidus gradient (mi) and partition coefficient (ki), is shown to be inadequate for a wide range of common alloys that exhibit trace amounts of primary crystallizing intermetallic phases. The Mg–Zn system has a larger slope of the liquidus line, m = 6.04 °C/wt.%, compared to Mg–Ca (m = 2.12 °C/wt.%), which indicates a higher potential for Zn to reduce the grain size. Therefore, the growth restriction factor increases when Zn is added to the MgCa alloy [30]. Additionally, we observed that there is presence of Ca2Mg6Zn3 secondary phase distributed along the grain boundaries and some inside the grains.
SEM micrographs of all hot-rolled alloys are depicted in Figure 4. It is observed both in optical and SEM micrographs that some of the larger grains are surrounded by fine grains. This is probably because these large size grains correspond to preformed primary grains, while the formation of smaller grains is associated with dynamic recrystallization. In metals with low crystal symmetry (like in hcp and bcc), the twin deformation mechanism occurs in the hcp α-Mg matrix during hot rolling due to low number of slip systems [31,33].
It is evident that secondary phases or precipitates of Ca2Mg6Zn3 increase from the ZC01 to the ZC04 alloy system, as seen in Figure 4b–e. The volume fraction (%) of secondary phases are tabulated in Table 3. This is notably more pronounced, particularly in the ZC04 alloy system. The reason behind this is not only the increase/decrease in Ca content or Zn/Ca atomic ratio, but could be due to an increase in the sum of Zn and Ca content. Moreover, as the Ca content increases from 0.3 wt% to 1.15 wt%, while maintaining Zn at 2.5 wt%, the volume fraction of Ca2Mg6Zn3 phase also increases.
EDS point analysis results, illustrated in Figure 5, support the XRD analyzed peaks of Ca2Mg6Zn3 and Mg2Ca phases. Backscattered electron (BSE) micrographs differentiate the two kinds of secondary phases at higher magnification. EDS results revealed that the dark contrast phase was composed of Mg and Ca with an atomic ratio of 2.1, while the bright phase composed of Mg, Zn, and Ca, with the Zn/Ca atomic ratio being 1.57. With reference to the ternary phase diagram of the Mg-Zn-Ca alloy system [34] and the binary phase diagram of the Mg-Ca system, along with the above discussion, this confirms that the dark contrast phase was an Mg2Ca phase and the bright phase was a Ca2Mg6Zn3 phase.

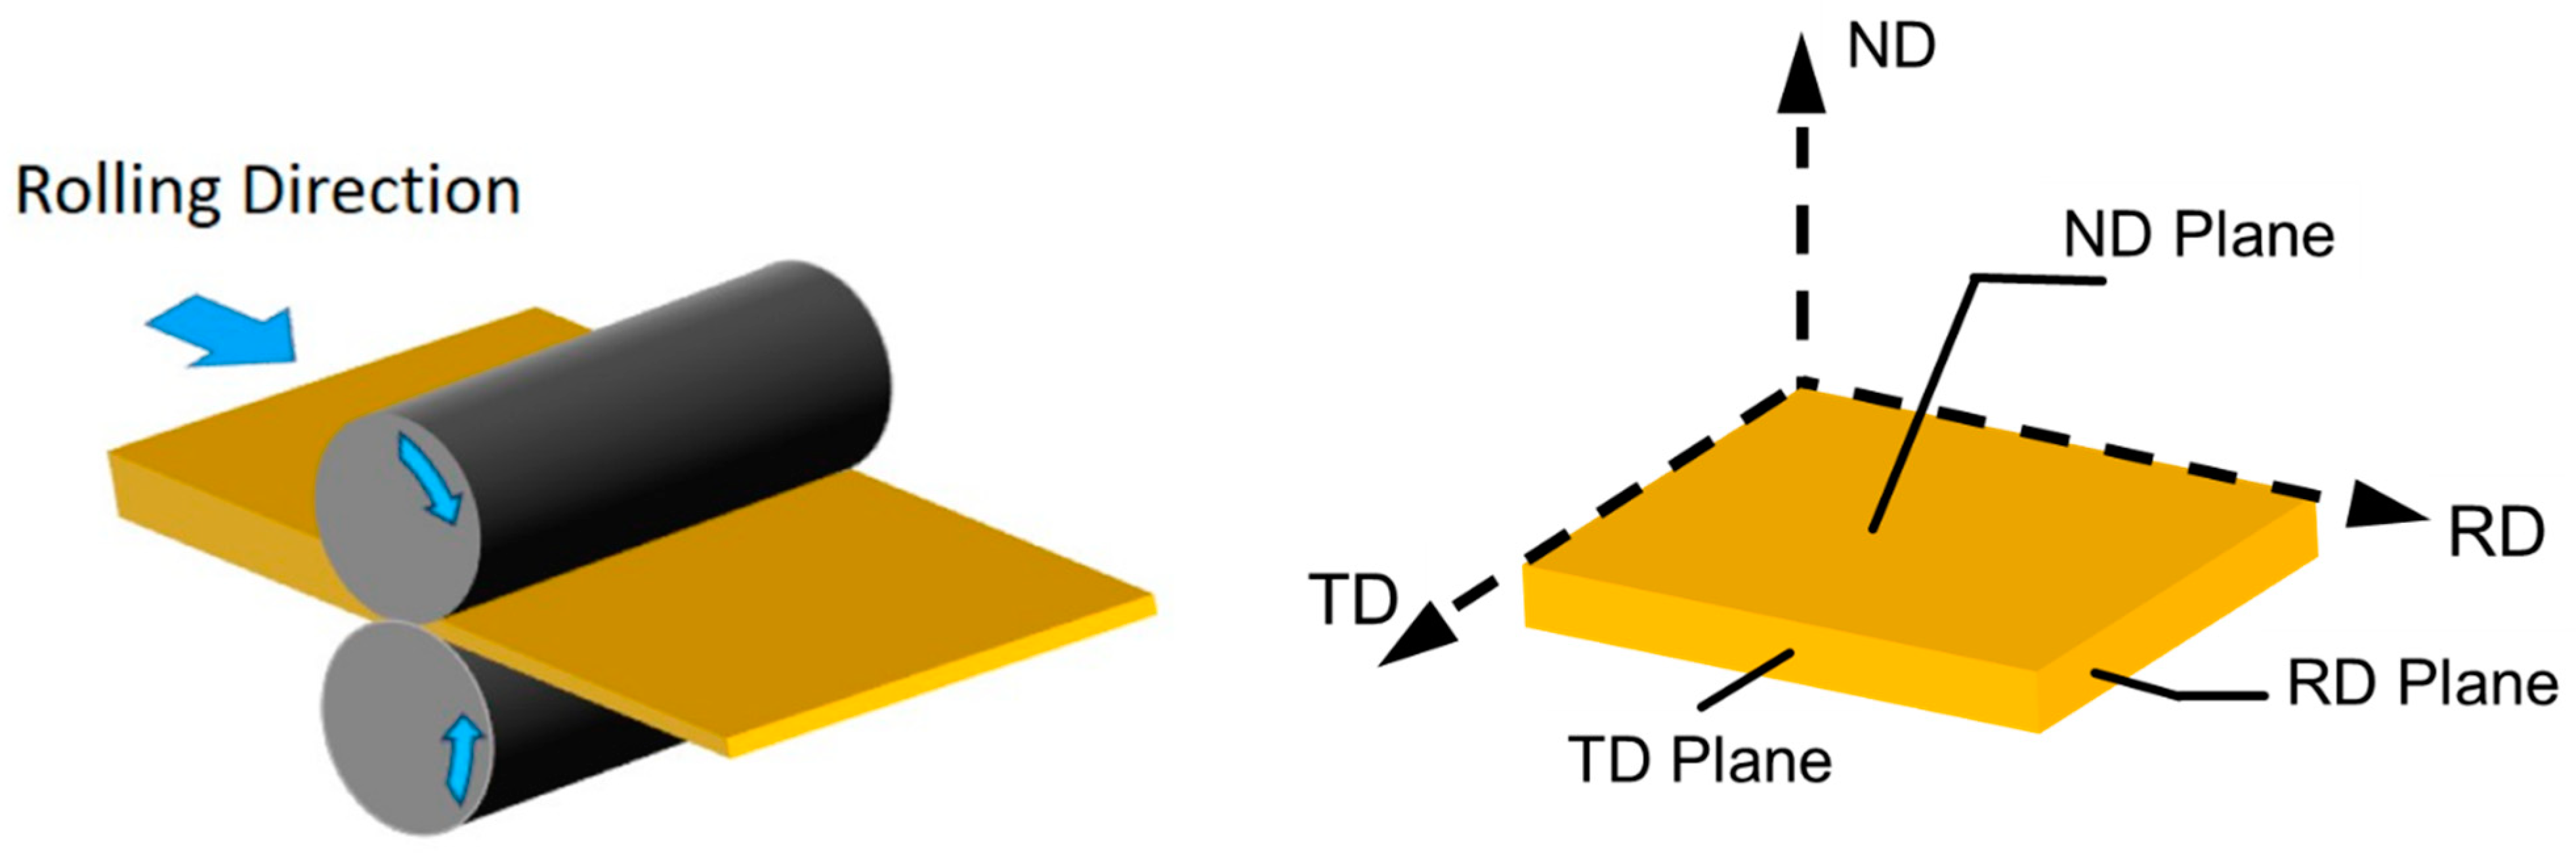
3.3. Crystallographic Texture Analysis

EBSD maps along with (0002) pole figures of rolled alloys are depicted in Figure 6. It is observed that a small fraction of the hot-rolled sample surfaces was not indexed by EBSD. This could primarily be due to the high strain in those regions. These regions in the EBSD maps have band-like shapes and therefore they are considered to be shear bands. Each hot-rolled sample was indexed on the surface parallel to the rolling direction (RD) and exhibited a basal texture. There was a significant difference in the basal texture intensities as the Ca content increased. Among all the studied systems, hot-rolled ZC01 yielded the maximum basal texture intensity of 11.67. The basal texture intensity decreases in the order ZC01 > ZC00 > ZC02 > ZC03 > ZC04. It is reported that deformation twinning could serve as the predominant mechanism in shear band formation in hot-rolling of Mg alloys [35,36]. Moreover, Chun et al. have discussed that a weakened texture promotes recrystallization and mitigates the twinning effect [37]. A weakened texture or decrease in grain size would result in an increase of slip activity and a reduction in twinning [38]. It can be observed in the IPF maps of Figure 6e that recrystallization was enhanced for ZC04, with minimum basal texture intensity of 7.22, as compared to other hot-rolled alloy systems. The correlation of solute aggregation to grain boundaries and twin boundaries has been reported in previous studies [39,40]. A high energy grain boundary has stronger solute segregation compared to a low energy grain boundary. As the Ca content increased from 0.3 wt% to 1.15 wt%, co-segregation of Zn and Ca atoms increased in the grain boundaries and eliminated their preferential grain growth. This creates a significant drag effect or pinning force on the grain boundary migration during dynamic recrystallisation that retards growth of recrystallized grain [41,42].

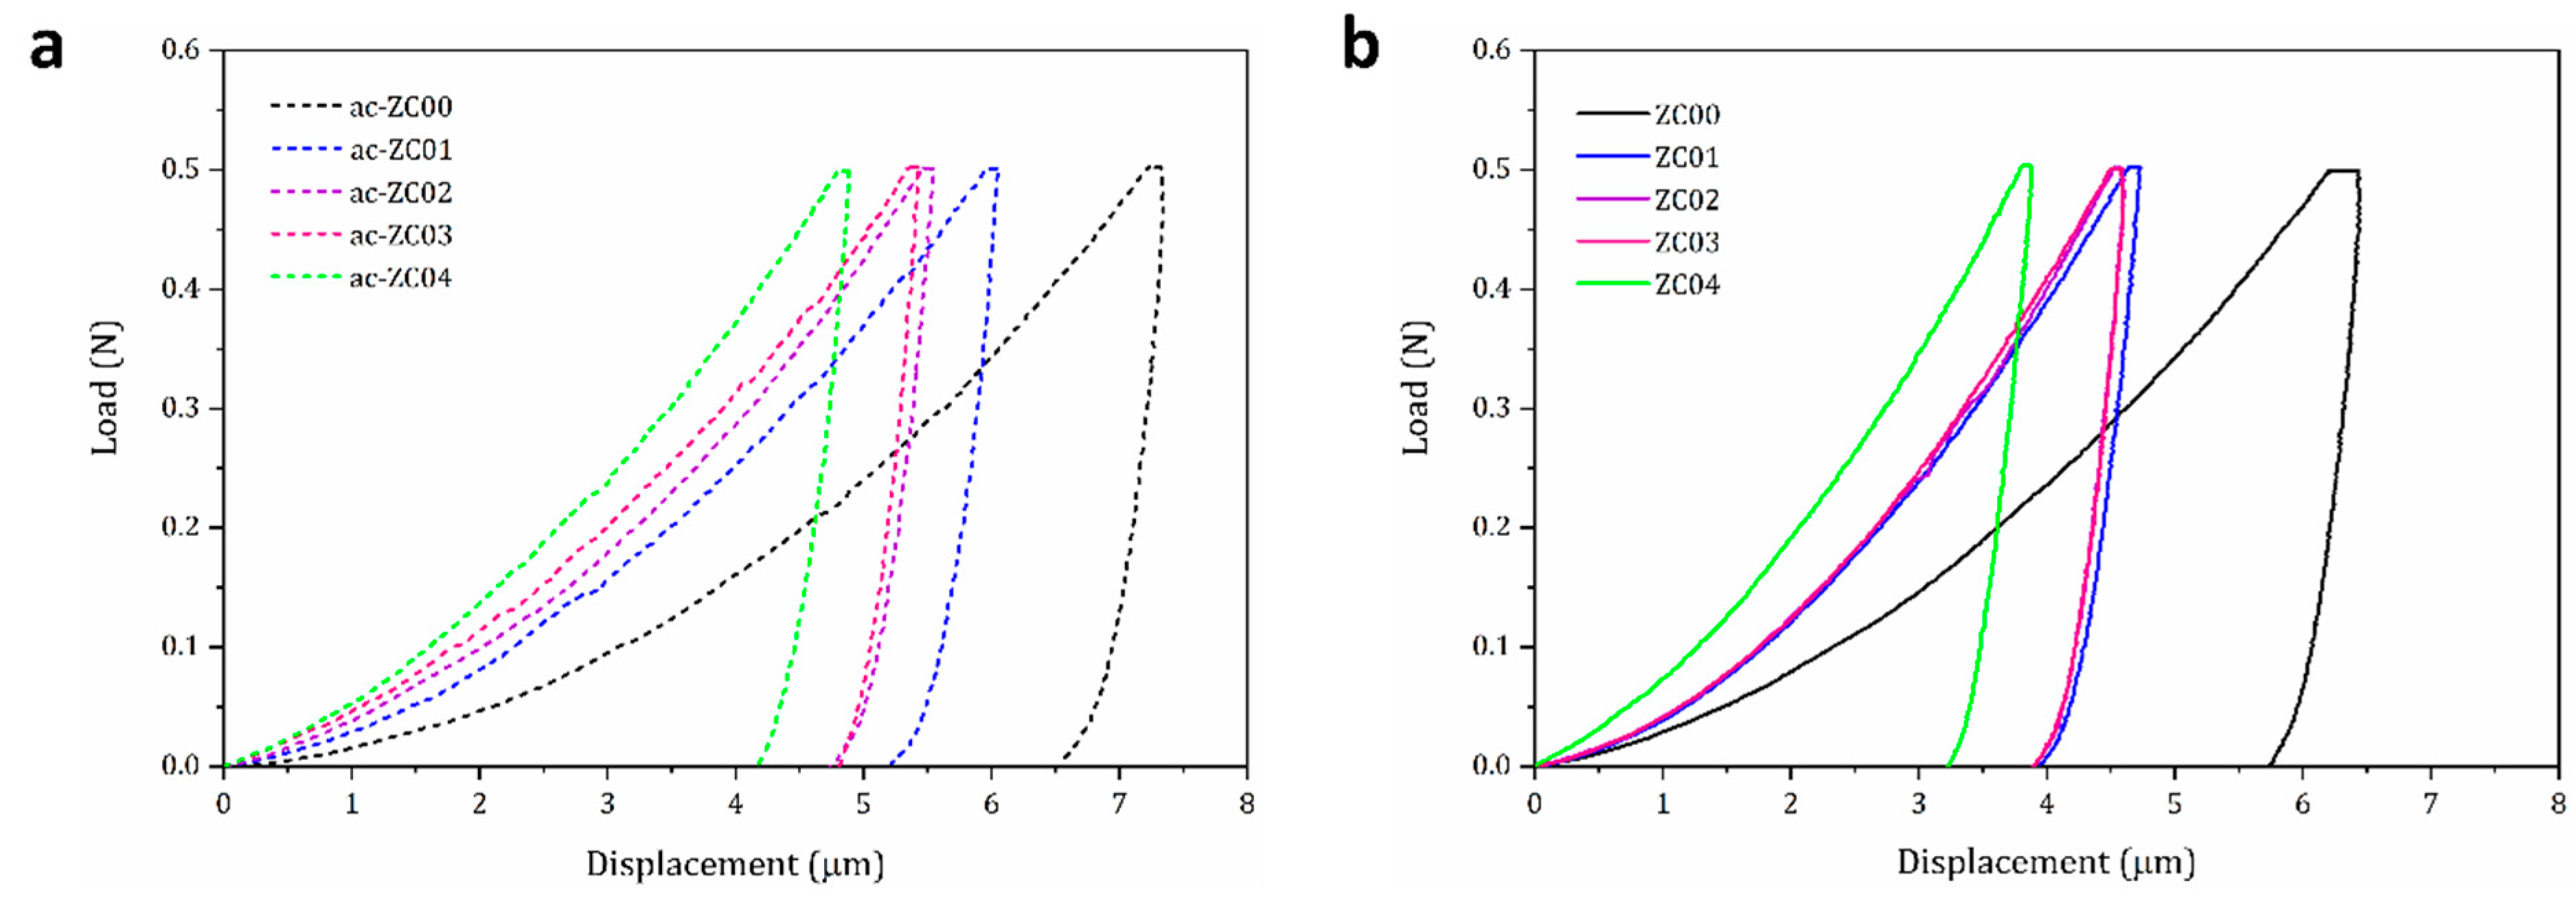
3.4. Mechanical Properties

Figure 7 represents the load-displacement curve for the as-cast (Figure 7a) and hot-rolled (Figure 7b) alloys. The elastic modulus and micro-hardness of these alloys was calculated by the Oliver and Pharr method [43]. The results feature load-displacement curves closest to the mean value. Figure 8a,b illustrates the graphical comparison of elastic modulus and micro-hardness, respectively, with as-cast and hot-rolled alloys.
It was revealed in Figure 8 that the addition of Zn to the Mg system increased the elastic modulus and hardness of the alloys in comparison to as-cast ZC00. In addition, increasing the Ca content from 0.3 to 1.15 wt % also leads to a significant increase in the elastic modulus and hardness in both as-cast and hot-rolled alloys. An increase in elastic modulus and hardness values in both as-cast and hot-rolled conditions after alloying could be explained by grain size reduction, solid solution strengthening, and presence of secondary phases (Mg2Ca and Ca2Mg6Zn3) as precipitates at the grain boundaries [44,45]. ZC04 shows the maximum elastic modulus of 56 GPa and the maximum hardness of 128 HV in hot-rolled conditions. As-cast ZC04 has an elastic modulus and hardness of 45 GPa and 82 HV, respectively. Among the hot-rolled alloys, ZC01 measures the minimum elastic modulus and hardness value of 46 GPa and 95 HV, respectively, while as-cast ZC01 has an elastic modulus of 37 GPa and hardness value of 58 HV. When the elastic modulus and hardness values of as-cast alloys were compared with hot-rolled alloys, it was observed that hot-rolled alloys were mechanically stronger than as-cast ones. This is probably the result of the dynamic recrystallization, grain refinement, and precipitate strengthening observed in hot-rolled alloys [46,47,48]. From the load-displacement curve (Figure 7), we can observe that with an increase in the Ca content, the displacement depth decreases. This is attributed to the decrease of ductility in the system, which is in the decreasing order of ZC00 > ZC01 > ZC02 > ZC03 > ZC04. This is because the increasing volume fraction of Mg2Ca and Ca2Mg6Zn3 precipitates with the increase in Ca content effectively inhibits the grain boundary migration and sliding [26,49].

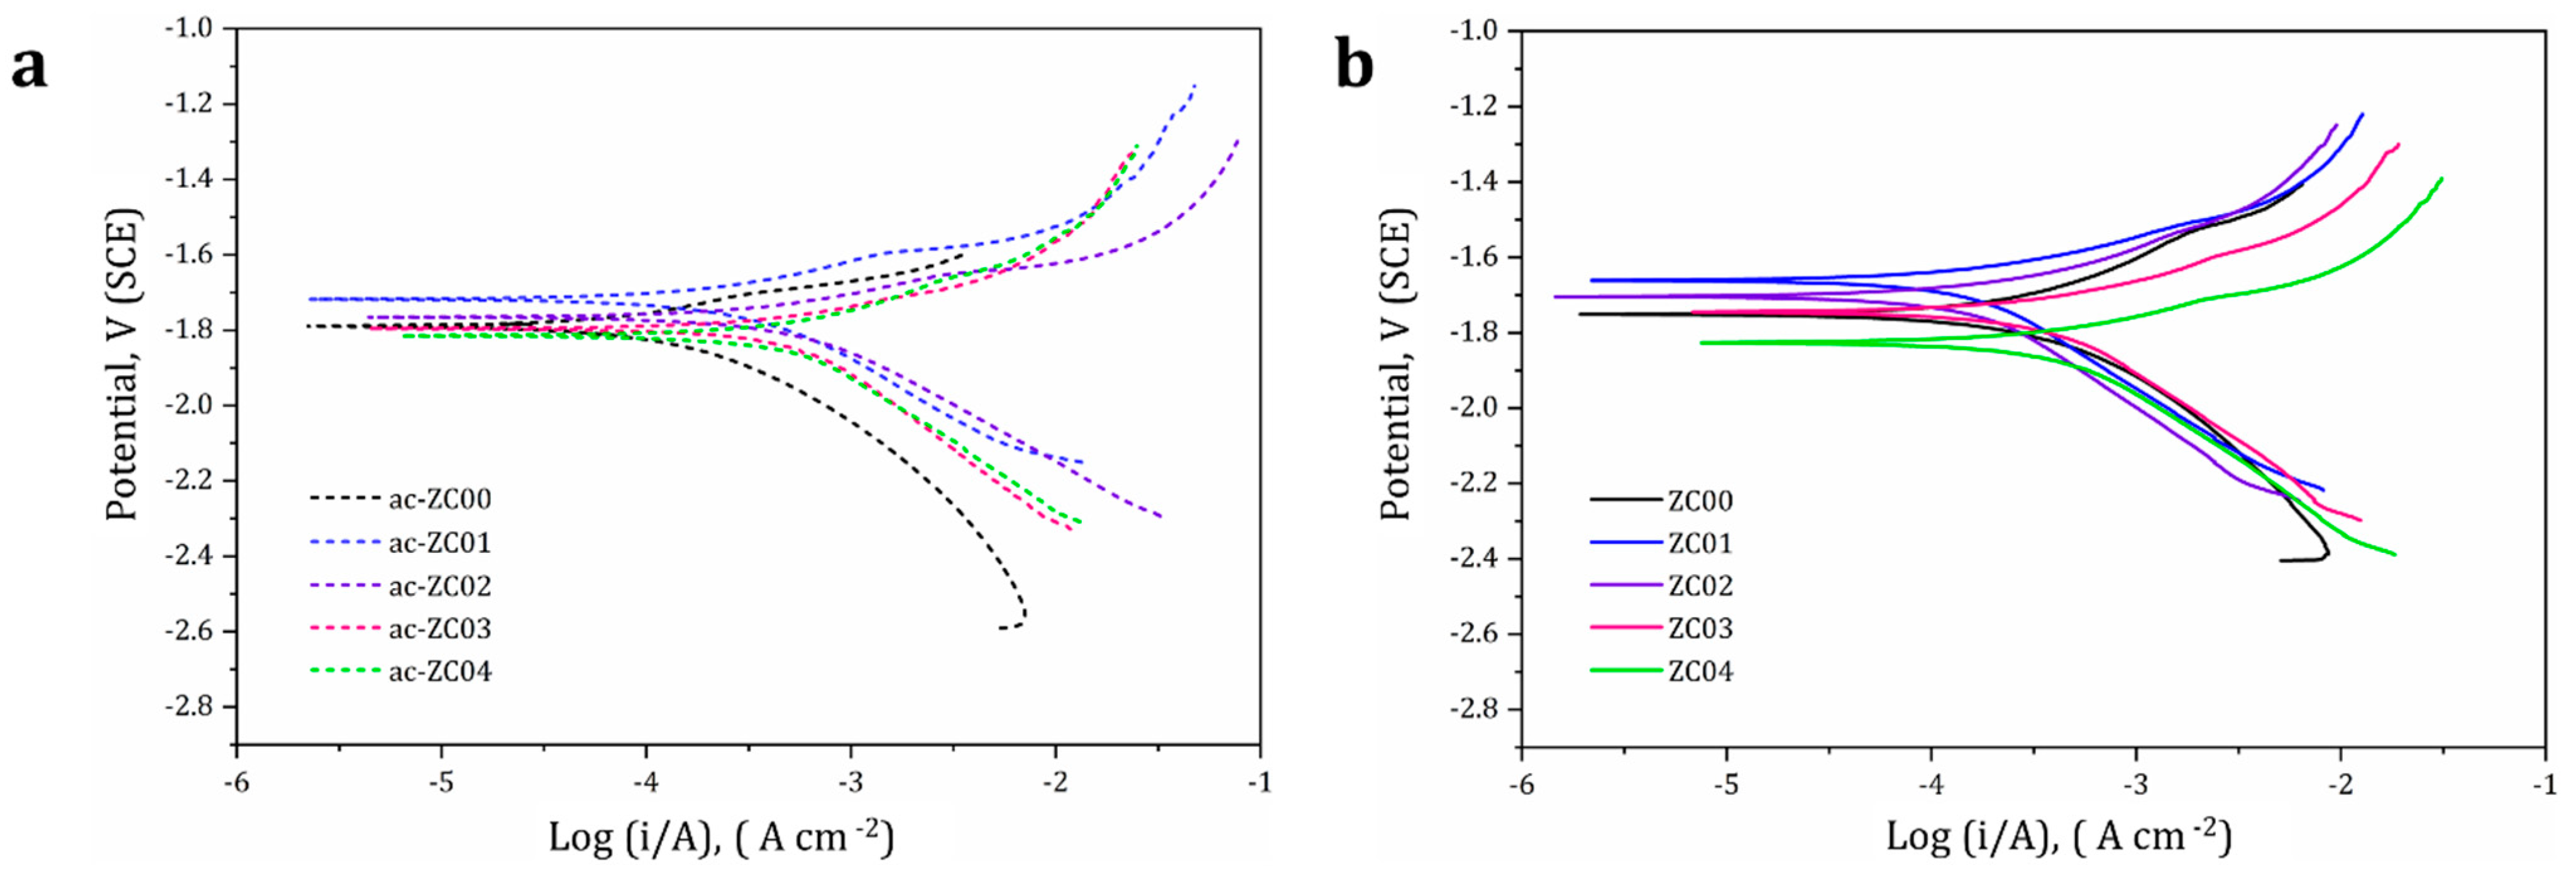
3.5. Corrosion Behaviour

Potentiodynamic polarization curves for as-cast and hot-rolled alloys are illustrated in Figure 9a and Figure 9b, respectively. Corrosion potential (Ecorr) and Corrosion current density (Icorr) of each alloy condition are tabulated in Table 4. Corrosion rate (CR, mm year−1) was calculated using the following equation [50]:
C R   ( mm   yr 1 ) = 3.27 × 10 3 × I c o r r   × E w ρ
where, Ew represents the equivalent weight of the material in grams (g), Icorr in A cm−2, and ρ is the density of the material in g cm−3.
Ecorr and Icorr values in Table 4 reveal that hot-rolling of these alloys has enhanced the corrosion resistance in comparison to as-cast alloys. It can be observed from the electrochemical parameters that ZC01 exhibits the minimum Icorr value of 1.68 × 10⁻⁴ A cm−2 with a maximum Ecorr of −1.67 V, along with minimum corrosion rate of 3.7 mm yr−1. In both as-cast and hot-rolled alloys, it can be seen that an increase in Ca content in the system leads to an increase in the corrosion current density, which is directly proportional to corrosion rate. This can be attributed to the increase of secondary phases or precipitates of Ca2Mg6Zn3 and Mg2Ca in the alloys, as seen in Figure 4. The reason behind this is the difference in standard electrode potentials of the precipitates in the Mg-Zn-Ca alloy. The potential decrease follows the order Ca2Mg6Zn3 > α-Mg > Mg2Ca [51,52,53]. Therefore, the high electrochemical activity of the Mg2Ca phase functions as an anode and the Mg matrix act as a cathode. Similarly, the Ca2Mg6Zn3 phase acts as a cathode and the Mg matrix as an anode at the interface between Mg matrix and Ca2Mg6Zn3 phase. Hence, we can deduce that when the Ca content is equal to or less than 0.3 wt%, there is no formation of Mg2Ca precipitates, resulting in a minimum corrosion rate.
Furthermore, in terms of Zn/Ca atomic ratios for the present system, where we increase Ca content from 0.3 wt% to 1.15 wt%, it is evident that if the Zn/Ca atomic ratio less than or equal to 3, α-Mg + Mg2Ca + Ca2Mg6Zn3 phases are formed, while for a Zn/Ca atomic ratio of 5, which is the case for the ZC01 alloy, only a α-Mg + Ca2Mg6Zn3 phase is formed.
Corrosion behavior of Mg alloys is also influenced by the crystallographic plane orientation, because they contribute to the atomic density and surface energy [54]. It has been reported that the activation energy for the dissolution of a loosely packed surface is lower than for a densely packed surface. This refers to the atomic packing density of crystallographic planes, which is inversely proportional to surface energy of these planes. The atomic densities of certain crystallographic planes of the Mg system i.e., hcp system, decrease in the order of (0001) > (11-20) > (10-10), which quantifies to 1.13 × 10¹⁹ atoms m−2 for (0001) plane, 6.94 × 10¹⁸ atoms m−2 for (11-20), and 5.99 × 10¹⁸ atoms m−2 for (10-10) plane. Additionally, the (0001) plane has the lowest surface energy, 1.5 × 10⁴ J mol−1, while (11-20) and (10-10) have surface energies of 3.04 × 10⁴ J mol−1 and 2.99 × 10⁴ J mol−1, respectively [55]. This makes it evident that the (0001) surface with a low surface energy slows the dissolution and corrodes more slowly [56]. We can also interpret that the higher atomic coordination number is attributed to a more closely packed plane with high binding energy, low surface energy, and requiring high activation energy. R. Xin et al. have investigated the corrosion rate of the (0001) surface in comparison with the (11-20) and (10-10) surfaces. They reported that the corrosion rates of the (11-20) and (10-10) surfaces are 18–20 times higher than the (0001) basal plane [57]. Figure 6 depicts the maximum basal texture intensity for ZC01, which explains the reason for the low corrosion rate of ZC01. Since the hot-rolled alloys demonstrated better corrosion resistance compared to the as-cast alloys, the subsequent immersion testing in SBF focused only on the hot-rolled alloys.

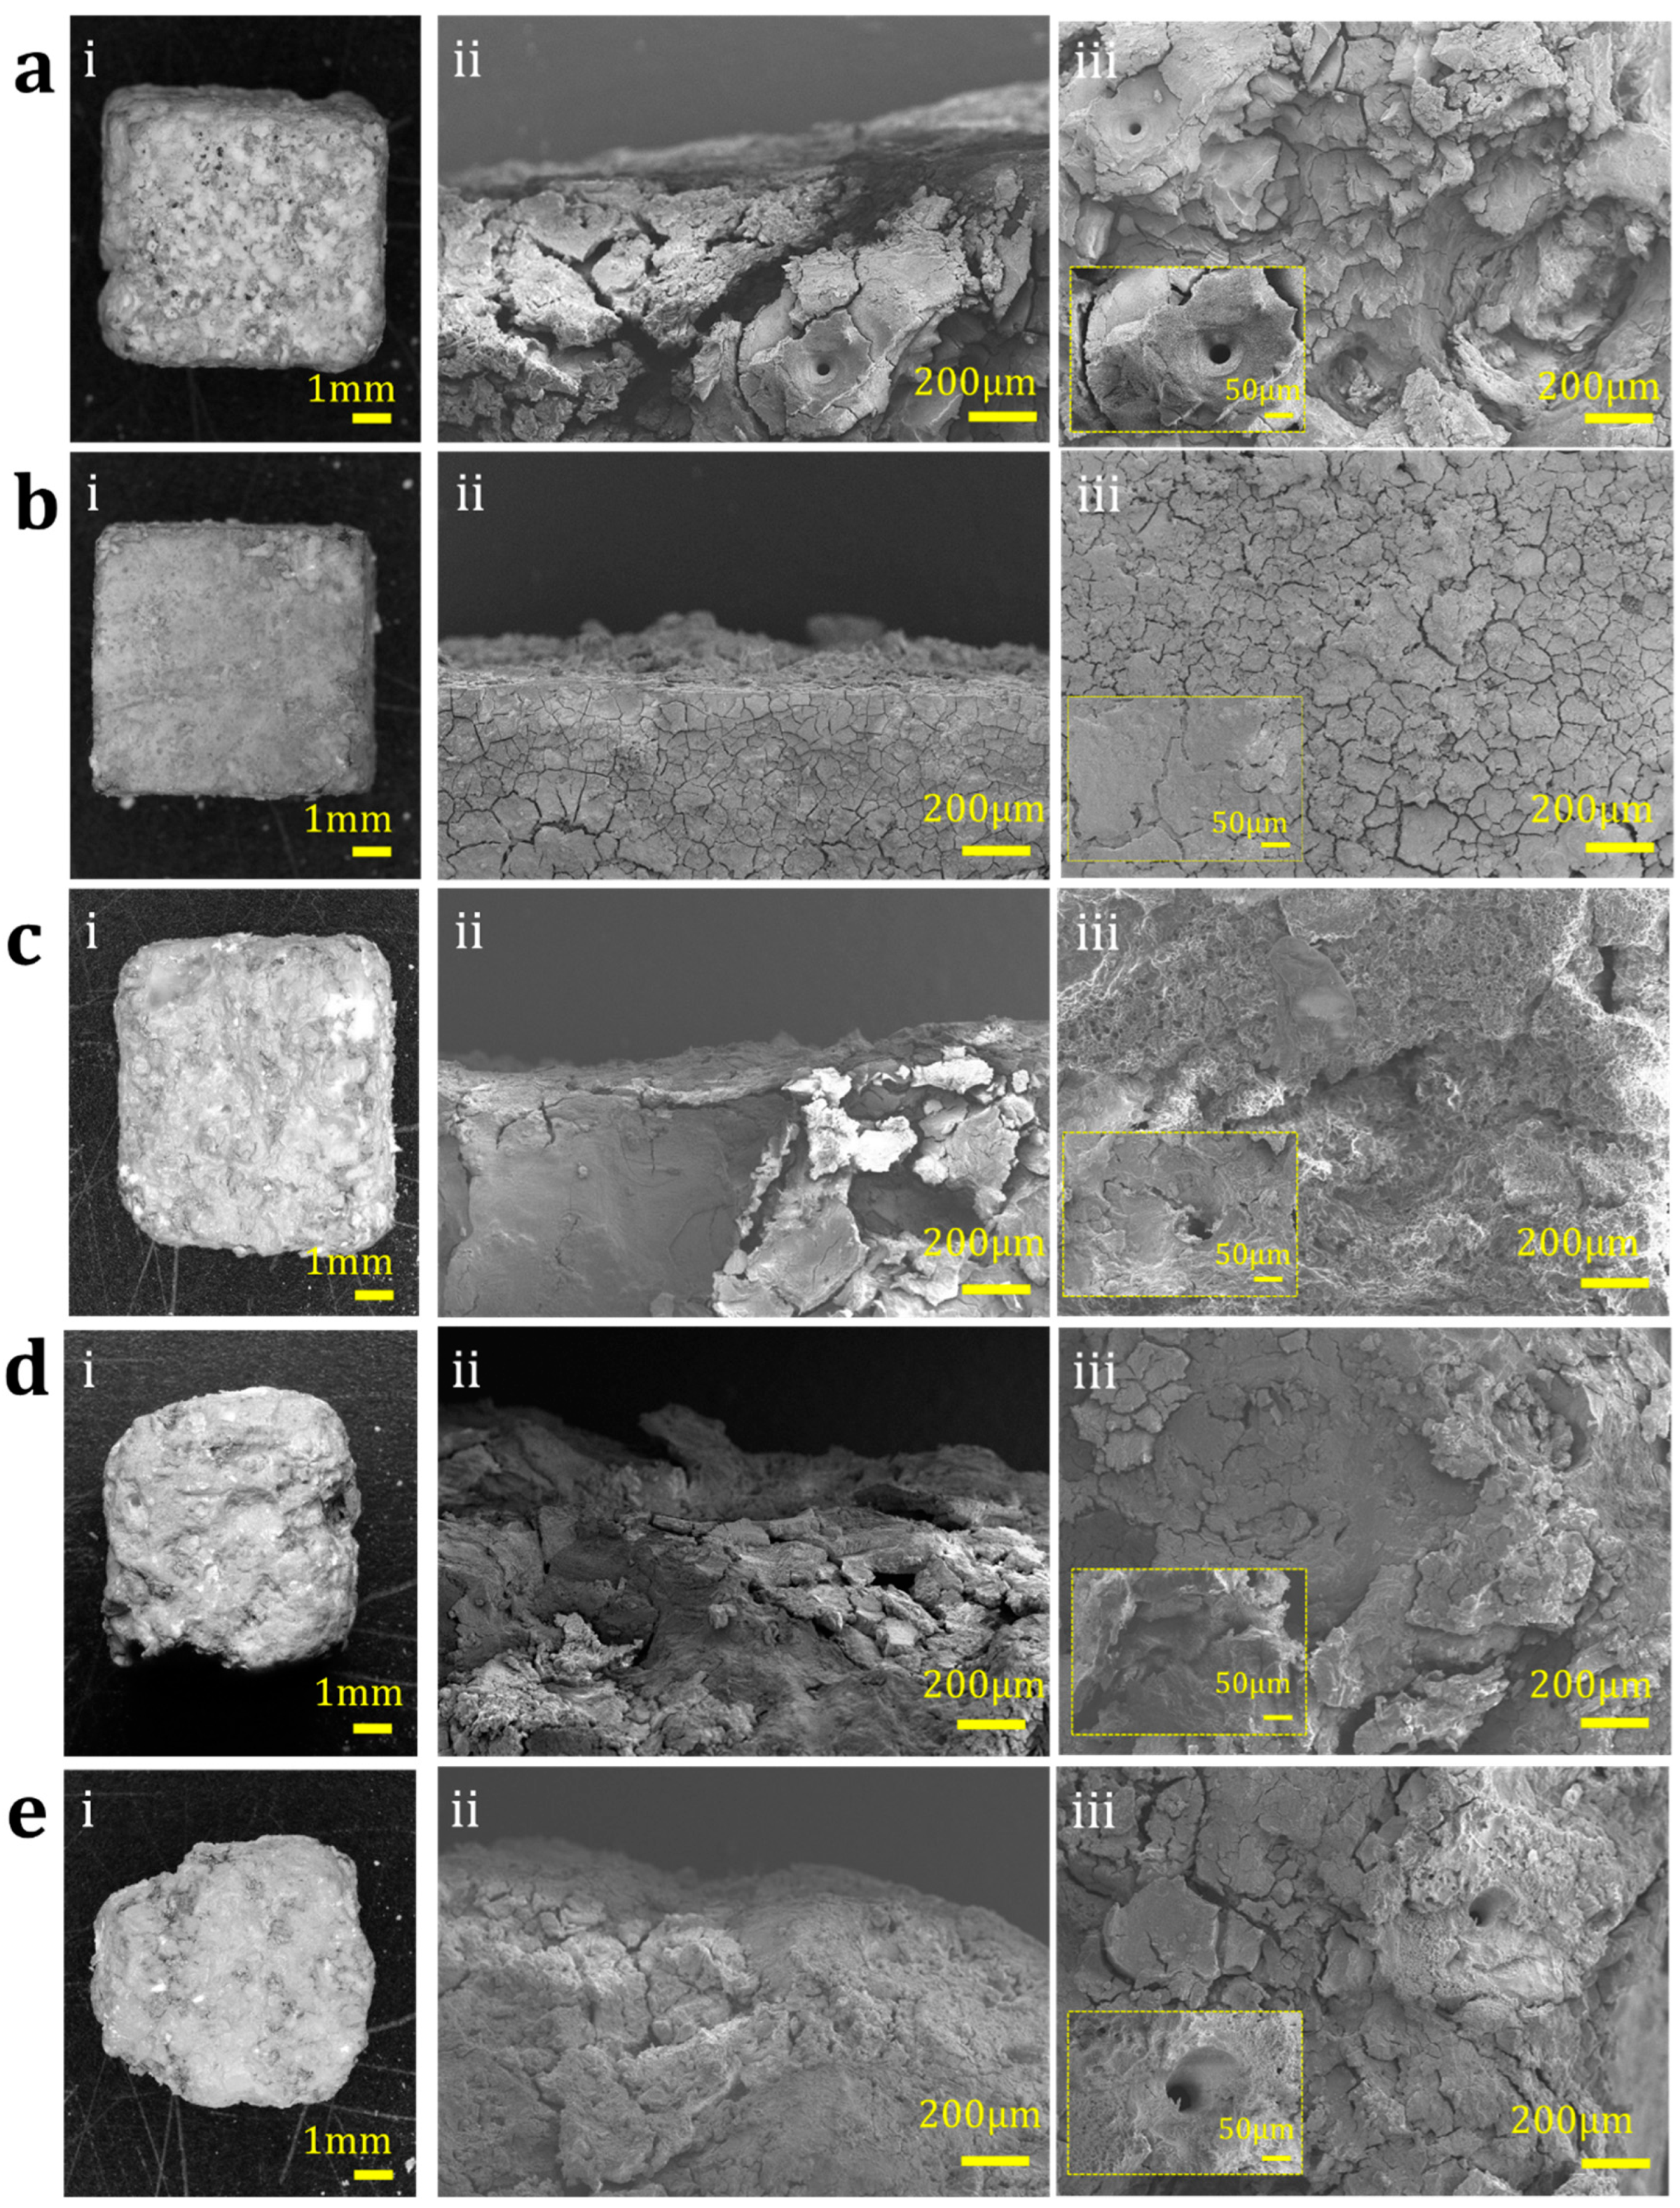
3.6. Degradation Behaviour in Simulated Body Fluid

Figure 10a represents the average weight loss (%) of the hot-rolled alloys degraded under both in vitro and dynamic conditions for 21 days. ZC01 showed the minimum weight loss, 5%, during the whole period of observation, and the weight loss increases in the order of ZC01 < ZC00 < ZC02 < ZC03 < ZC04. The weight loss rate is directly proportional to the degradation rate behavior of the alloy and inversely proportional to the corrosion resistance. In the case of the ZC04 alloy, it underwent a maximum weight loss of 64% over 21 days of degradation. This clearly indicates that the addition of 2.5 wt% of Zn improved the corrosion resistance of the hot-rolled alloys. However, the addition of more than 0.3 wt% of Ca leads to a reduction in corrosion resistance because the Mg2Ca phase formed undergoes anodic dissolution, which is discussed in Section 3.5.
During the degradation study, as soon as the alloys were immersed in SBF solution, an oxide layer was formed on the Mg alloy surface. SBF solution forms a closed-loop circuit with numerous galvanic cells comprised of the secondary phases and Mg matrix. Figure 11 shows the optical images along with SEM micrographs of degraded hot-rolled alloys after 21 days. From the optical images, it was evident that ZC04 had the maximum degradation rate in SBF. The primary corrosion product formed on the surface is solid Mg(OH)2. However, the presence of the Cl ion from the SBF corrosion medium reacts with the insoluble Mg (OH)2 layer, resulting in the formation of soluble MgCl2 through the reaction: {Mg(OH)2 + Cl →MgCl2 + 2OH} [8,58]. Other than ZC01, all other hot-rolled alloys and ZC00 showed small corrosion pits in the SEM images in Figure 11a(iii),c(iii),d(iii),e(iii). Simultaneously, the second phases situated at both the grain boundaries and dendrites undergo reactions with the anions in the solution, leading to oxidation and dissolution into the solution or detachment. Consequently, small corrosion pits develop along the grain boundaries [59]. Further, the existence of PO43− and Ca2+ in the SBF solution triggers a reaction with OH, resulting in the formation of hydroxyapatite (HA) (Ca10(PO4)6(OH)2). This compound tends to nucleate and expand on the surface of the alloys, thereby diminishing the corrosion reaction. HA is biocompatible and constitutes a vital element in human bone tissue. The deposition of HA particles on the Mg substrate can expedite the healing process of bone tissue [60]. The electrochemical corrosion results show good agreement with the degradation behavior of the hot-rolled alloys.
The degradation of Mg alloys also resulted in a rapid increase in the pH of the SBF. Figure 10b demonstrates the pH change of SBF during the degradation period of 21 days. The pH values of SBF initially increased rapidly with immersion time and then slowly stabilized to a constant value. Table 5 presents the pH values of day 0 and day 21 for all the studied hot-rolled alloys.
Corrosion rate from immersion studies (CRi, mm yr−1) was calculated using the following equation [61]:
C R i   ( mm   yr 1 ) = 8.76 × 10 4 × w ρ × A × T
where, w is weight loss in grams, ρ is density of the alloy, A is the surface area of sample in cm2, and T is the time of immersion in h.
Table 6 presents the comparison between the corrosion rates calculated from Electrochemical studies (CR) and Immersion studies (CRi). In both the studies, ZC01 shows the minimum corrosion rates and ZC04 showed the maximum corrosion rates.
ZC04 had the highest pH value, 10.3, on day 21, while ZC01 had a pH value of 9.23 on day 21. The pH increases above 10, which is attributed to the low solubility of Mg (OH)2. This contributes to enhancing the stability of surface films in the SBF solution. A higher pH facilitates the precipitation of magnesium hydroxide, as indicated by the elevated concentration of OH ions. This occurrence allows for the formation of a more enduring layer on the surface, even at lower Mg2+ concentrations. Conversely, a higher concentration of Mg2+ may result in an unstable surface layer, leading to the development of surface cracks and pits and consequently a greater material weight loss due to increased dissolution of Mg2+ ions [62,63], which can be observed in ZC00, ZC02, ZC03, and ZC04.

4. Conclusions

In summary, different Mg-Zn-Ca alloys with a constant concentration of 2.5 wt% Zn and a varying Ca content, ranging from 0.3 to 1.15 wt%, were hot-rolled until they reached a 35% reduction in thickness Experimental results revealed that the microstructures of all the alloys were composed of α-Mg as matrix and Ca3Mg6Zn3 as the secondary phase. Increasing Ca% content in the alloy increases the volume fraction of Mg2Ca secondary phase and weakens the basal texture intensity. Among all the hot-rolled alloys, ZC01 demonstrated the lowest volume fraction of secondary phases, highest basal texture intensity, lowest corrosion rate, and closest elastic modulus to natural bone. The electrochemical parameter tests reveal that the corrosion resistance of the alloys increases with increasing basal texture intensity and Zn/Ca atomic ratio. The degradation results over 21 days show a good agreement with the electrochemical behavior of the hot-rolled alloys. The profound texture effect on the corrosion resistance in SBF opened a new window to control the corrosion property of Mg alloys for biomedical applications.

Supplementary Materials

The following supporting information can be downloaded at: https://www.mdpi.com/article/10.3390/met14091002/s1, Figure S1. Optical microscopy images of as-cast alloys: (a) ac-ZC00, (b) ac-ZC01, (c) ac-ZC02, (d) ac-ZC03 and (e) ac-ZC04. Figure S2. XRD pattern of as-cast Mg (ac-ZC00). Figure S3. XRD pattern of commercially purchased Mg-30 wt% Zn master alloy. Figure S4. XRD pattern of commercially purchased Mg-22wt% Ca master alloy. Figure S5. XRD pattern of hot-rolled Mg. Figure S6. XRD patterns of as-cast Mg alloys recorded on the ND plane. Figure S7. EDS area analysis (red for Mg, Green for Zn and Blue for Ca) of (a) (a) ZC00, (b) ZC01, (c) ZC02, (d) ZC03 and (e) ZC04.

Author Contributions

R.S. and M.B. conceived and designed the study. M.B. and C.G. fabricated the Mg alloy castings. M.B. conducted all the experiments and performed the data analysis. M.B. wrote the first draft of the manuscript. R.S. provided the resources and critical inputs in the project. All the authors reviewed the manuscript. M.B. prepared the final draft of the manuscript. All authors have read and agreed to the published version of the manuscript.

Funding

This research was funded by European Union’s Horizon 2020 Research and Innovation program and ‘Magnesium based Nano Composites for Orthopedic Applications’ MAGNACOM, project under the aegis of Programme for Early-Stage Researchers (PEARL, I-Site ULNE under the Marie Sklodowska-Curie grant agreement, PEARL program No. 847568). This work was supported by University of Lille (France) and Hauts-de-France region.

Data Availability Statement

The original contributions presented in the study are included in the article/Supplementary Material, further inquiries can be directed to the corresponding authors.

Acknowledgments

The authors would like to acknowledge Damein Creton, Assistant Engineer, UMET lab, University of Lille for his help in thermo-mechanical processing of the alloys.

Conflicts of Interest

The authors declare no competing interests.

References

  1. Uppal, G.; Thakur, A.; Chauhan, A.; Bala, S. Magnesium based implants for functional bone tissue regeneration—A review. J. Magnes. Alloys 2022, 10, 356–386. [Google Scholar] [CrossRef]
  2. Behera, M.; Panemangalore, D.B.; Shabadi, R. Additively manufactured magnesium-based bio-implants and their challenges. Trans. Indian Natl. Acad. Eng. 2021, 6, 917–932. [Google Scholar] [CrossRef]
  3. Agarwal, S.; Curtin, J.; Duffy, B.; Jaiswal, S. Biodegradable magnesium alloys for orthopaedic applications: A review on corrosion, biocompatibility and surface modifications. Mater. Sci. Eng. C 2016, 68, 948–963. [Google Scholar] [CrossRef] [PubMed]
  4. Bordbar-Khiabani, A.; Yarmand, B.; Mozafari, M. Emerging magnesium-based biomaterials for orthopedic implantation. Emerg. Mater. Res. 2020, 8, 305–319. [Google Scholar] [CrossRef]
  5. Li, C.; Huang, T.; Liu, Z. Effects of thermomechanical processing on microstructures, mechanical properties, and biodegradation behaviour of dilute Zn–Mg alloys. J. Mater. Res. Technol. 2023, 23, 2940–2955. [Google Scholar] [CrossRef]
  6. Tekumalla, S.; Seetharaman, S.; Bau, N.Q.; Wong, W.L.E.; Goh, C.S.; Shabadi, R.; Gupta, M. Influence of Cerium on the Deformation and Corrosion of Magnesium. J. Eng. Mater. Technol. 2016, 138, 031011. [Google Scholar] [CrossRef]
  7. Zerankeshi, M.M.; Alizadeh, R.; Gerashi, E.; Asadollahi, M.; Langdon, T.G. Effects of heat treatment on the corrosion behavior and mechanical properties of biodegradable Mg alloys. J. Magnes. Alloys 2022, 10, 1737–1785. [Google Scholar] [CrossRef]
  8. Becerra, L.H.C.; Rodríguez, M.A.L.H.; Solís, H.E.; Arroyo, R.L.; Castro, A.T. Bio-inspired biomaterial Mg-Zn-Ca: A review of the main mechanical and biological properties of Mg-based alloys. Biomed. Phys. Eng. Express 2020, 6, 042001. [Google Scholar]
  9. Black, J. Biological Performance of Materials: Fundamentals of Biocompatibility; CRC Press: Boca Raton, FL, USA, 2005. [Google Scholar]
  10. Gu, X.N.; Zheng, Y.F. A review on magnesium alloys as biodegradable materials. Front. Mater. Sci. China 2010, 4, 111–115. [Google Scholar] [CrossRef]
  11. Gu, X.; Zheng, Y.; Cheng, Y.; Zhong, S.; Xi, T. In vitro corrosion and biocompatibility of binary magnesium alloys. Biomaterials 2009, 30, 484–498. [Google Scholar] [CrossRef]
  12. Moreno, L.; Matykina, E.; Yasakau, K.A.; Blawert, C.; Arrabal, R.; Mohedano, M. As-cast and extruded MgZnCa systems for biodegradable implants: Characterization and corrosion behavior. J. Magnes. Alloys 2023, 11, 1102–1120. [Google Scholar] [CrossRef]
  13. Zander, D.; Zumdick, N.A. Influence of Ca and Zn on the microstructure and corrosion of biodegradable Mg–Ca–Zn alloys. Corros. Sci. 2015, 93, 222–233. [Google Scholar] [CrossRef]
  14. Pu, Z.; Song, G.L.; Yang, S.; Outeiro, J.C.; Dillon, O.W.; Puleo, D.A.; Jawahir, I.S. Grain refined and basal textured surface produced by burnishing for improved corrosion performance of AZ31B Mg alloy. Corros. Sci. 2012, 57, 192–201. [Google Scholar] [CrossRef]
  15. Ahmadkhaniha, D.; Fedel, M.; Sohi, M.H.; Deflorian, F. Corrosion behavior of severely plastic deformed magnesium based alloys: A review. Surf. Eng. Appl. Electrochem. 2017, 53, 439–448. [Google Scholar] [CrossRef]
  16. Bahmani, A.; Arthanari, S.; Shin, K.S. Formulation of corrosion rate of magnesium alloys using microstructural parameters. J. Magnes. Alloys 2020, 8, 134–149. [Google Scholar] [CrossRef]
  17. Li, Q.; Huang, G.J.; Huang, X.D.; Pan, S.W.; Tan, C.L.; Liu, Q. On the texture evolution of Mg–Zn–Ca alloy with different hot rolling paths. J. Magnes. Alloys 2017, 5, 166–172. [Google Scholar] [CrossRef]
  18. Gu, X.N.; Xie, X.H.; Li, N.; Zheng, Y.F.; Qin, L. In vitro and in vivo studies on a Mg-Sr binary alloy system developed as a new kind of biodegradable metal. Acta Biomater. 2012, 8, 2360–2374. [Google Scholar] [CrossRef]
  19. Song, G.; Atrens, A.; Dargusch, M. Influence of microstructure on the corrosion of diecast AZ91D. Corros. Sci. 1998, 41, 249–273. [Google Scholar] [CrossRef]
  20. Bahmani, A.; Lotfpour, M.; Taghizadeh, M.; Kim, W.J. Corrosion behavior of severely plastically deformed Mg and Mg alloys. J. Magnes. Alloys 2022, 10, 2607–2648. [Google Scholar] [CrossRef]
  21. Du, H.; Wei, Z.; Liu, X.; Zhang, E. Effects of Zn on the microstructure, mechanical property and bio-corrosion property of Mg-3Ca alloys for biomedical application. Mater. Chem Phys. 2011, 125, 568–575. [Google Scholar] [CrossRef]
  22. Duley, P.; Sanyal, S.; Bandyopadhyay, T.K.; Mandal, S. Homogenization-induced age-hardening behavior and room temperature mechanical properties of Mg-4Zn-0.5Ca-0.16Mn (wt%) alloy. Mater. Des. 2019, 164, 107554. [Google Scholar] [CrossRef]
  23. Lu, Y.; Bradshaw, A.R.; Chiu, Y.L.; Jones, I.P. Effects of secondary phase and grain size on the corrosion of biodegradable Mg-Zn-Ca alloys. Mater. Sci. Eng. C 2015, 48, 480–486. [Google Scholar] [CrossRef] [PubMed]
  24. Song, G.-L.; Atrens, A. Recently deepened insights regarding Mg corrosion and advanced engineering applications of Mg alloys. J. Magnes. Alloys 2023, 11, 3948–3991. [Google Scholar] [CrossRef]
  25. Cao, F.; Xiao, B.; Wang, Z.; Ying, T.; Zheng, D.; Atrens, A.; Song, G.-L. A Mg alloy with no hydrogen evolution during dissolution. J. Magnes. Alloys 2023, 11, 2084–2095. [Google Scholar] [CrossRef]
  26. Luo, J.; Yan, H.; Zheng, N.; Chen, R.S. Effects of zinc and calcium concentration on the microstructure and mechanical properties of hot-rolled Mg-Zn-Ca sheets. Acta Metall. Sin. (Engl. Lett.) 2016, 29, 205–216. [Google Scholar] [CrossRef]
  27. Zhang, B.; Wang, Y.; Geng, L.; Lu, C. Effects of calcium on texture and mechanical properties of hot-extruded Mg-Zn-Ca alloys. Mater. Sci. Eng. A 2012, 539, 56–60. [Google Scholar] [CrossRef]
  28. Mirzadeh, H. Grain refinement of magnesium alloys by dynamic recrystallization (DRX): A review. J. Mater. Res. Technol. 2023, 25, 7050–7077. [Google Scholar] [CrossRef]
  29. Zhang, E.; Yang, L. Microstructure, mechanical properties and bio-corrosion properties of Mg-Zn-Mn-Ca alloy for biomedical application. Mater. Sci. Eng. A 2008, 497, 111–118. [Google Scholar] [CrossRef]
  30. Bakhsheshi-Rad, H.R.; Abdul-Kadir, M.R.; Idris, M.H.; Farahany, S. Relationship between the corrosion behavior and the thermal characteristics and microstructure of Mg-0.5Ca-xZn alloys. Corros. Sci. 2012, 64, 184–197. [Google Scholar] [CrossRef]
  31. Gungor, A.; Incesu, A. Effects of alloying elements and thermomechanical process on the mechanical and corrosion properties of biodegradable Mg alloys. J. Magnes. Alloys 2021, 9, 241–253. [Google Scholar] [CrossRef]
  32. Schmid-Fetzer, R.; Kozlov, A. Thermodynamic aspects of grain growth restriction in multicomponent alloy solidification. Acta Mater. 2011, 59, 6133–6144. [Google Scholar] [CrossRef]
  33. Robson, J.D.; Stanford, N.; Barnett, M.R. Effect of particles in promoting twin nucleation in a Mg-5 wt.% Zn alloy. Scr. Mater. 2010, 63, 823–826. [Google Scholar] [CrossRef]
  34. Liu, C.M.; Zhu, X.R.; Zhou, H.T. Phase Diagrams of Magnesium Alloys; Central South University Press: Changsha, China, 2006; Volume 35, p. 63. [Google Scholar]
  35. Wang, Y.; Xin, Y.; Yu, H.; Lv, L.; Liu, Q. Formation and microstructure of shear bands during hot rolling of a Mg-6Zn-0.5Zr alloy plate with a basal texture. J. Alloys Compd. 2015, 644, 147–154. [Google Scholar] [CrossRef]
  36. Wang, M.; Xin, R.; Wang, B.; Liu, Q. Effect of initial texture on dynamic recrystallization of AZ31 Mg alloy during hot rolling. Mater. Sci. Eng. A 2011, 528, 2941–2951. [Google Scholar] [CrossRef]
  37. Chun, Y.B.; Davies, C.H.J. Texture effects on development of shear bands in rolled AZ31 alloy. Mater. Sci. Eng. A 2012, 556, 253–259. [Google Scholar] [CrossRef]
  38. Zhen, L.; Zou, D.L.; Xu, C.Y.; Shao, W.Z. Microstructure evolution of adiabatic shear bands in AM60B magnesium alloy under ballistic impact. Mater. Sci. Eng. A 2010, 527, 5728–5733. [Google Scholar] [CrossRef]
  39. Hadorn, J.P.; Hantzsche, K.; Yi, S.; Bohlen, J.; Letzig, D.; Wollmershauser, J.A.; Agnew, S.R. Role of solute in the texture modification during hot deformation of Mg-rare earth alloys. Metall. Mater. Trans. A Phys. Metall. Mater. Sci. 2012, 43, 1347–1362. [Google Scholar] [CrossRef]
  40. Bugnet, M.; Kula, A.; Niewczas, M.; Botton, G.A. Segregation and clustering of solutes at grain boundaries in Mg-rare earth solid solutions. Acta Mater. 2014, 79, 66–73. [Google Scholar] [CrossRef]
  41. Zeng, Z.R.; Zhu, Y.M.; Xu, S.W.; Bian, M.Z.; Davies, C.H.J.; Birbilis, N.; Nie, J.F. Texture evolution during static recrystallization of cold-rolled magnesium alloys. Acta Mater. 2016, 105, 479–494. [Google Scholar] [CrossRef]
  42. Trang, T.T.T.; Zhang, J.H.; Kim, J.H.; Zargaran, A.; Hwang, J.H.; Suh, B.C.; Kim, N.J. Designing a magnesium alloy with high strength and high formability. Nat. Commun. 2018, 9, 2522. [Google Scholar] [CrossRef]
  43. Oliver, W.C.; Pharr, G.M. An improved technique for determining hardness and elastic modulus using load and displacement sensing indentation experiments. J. Mater. Res. 1992, 7, 1564–1583. [Google Scholar] [CrossRef]
  44. Incesu, A.; Gungor, A. Mechanical properties and biodegradability of Mg–Zn–Ca alloys: Homogenization heat treatment and hot rolling. J. Mater. Sci. Mater. Med. 2020, 31, 123. [Google Scholar] [CrossRef]
  45. Pulido-González, N.; Torres, B.; García-Rodríguez, S.; Rodrigo, P.; Bonache, V.; Hidalgo-Manrique, P.; Mohedano, M.; Rams, J. Mg–1Zn–1Ca alloy for biomedical applications. Influence of the secondary phases on the mechanical and corrosion behaviour. J. Alloys Compd. 2020, 831, 154735. [Google Scholar] [CrossRef]
  46. Rad, H.R.B.; Idris, M.H.; Kadir, M.R.A.; Farahany, S.; Fereidouni, A.; Yahya, M.Y. Characterization and corrosion behavior of biodegradable Mg-Ca and Mg-Ca-Zn implant alloys. Appl. Mech. Mater. 2012, 121–126, 568–572. [Google Scholar] [CrossRef]
  47. Shi, H.; Xu, C.; Hu, X.; Gan, W.; Wu, K.; Wang, X. Improving the Young’s modulus of Mg via alloying and compositing—A short review. J. Magnes. Alloys 2022, 10, 2009–2024. [Google Scholar] [CrossRef]
  48. Nayak, S.; Bhushan, B.; Jayaganthan, R.; Gopinath, P.; Agarwal, R.D.; Lahiri, D. Strengthening of Mg based alloy through grain refinement for orthopaedic application. J. Mech. Behav. Biomed. Mater. 2016, 59, 57–70. [Google Scholar] [CrossRef]
  49. Jung, Y.G.; Yang, W.; Kim, Y.J.; Kim, S.K.; Yoon, Y.O.; Lim, H.; Kim, D.H. Effect of Ca addition on the microstructure and mechanical properties of heat-treated Mg-6.0Zn-1.2Y-0.7Zr alloy. J. Magnes. Alloys 2021, 9, 1619–1631. [Google Scholar] [CrossRef]
  50. ASTM G59-97; Standard Test Method for Conducting Potentiodynamic Polarization Resistance Measurements. ASTM International: West Conshohocken, PA, USA, 2014.
  51. Zhang, B.; Hou, Y.; Wang, X.; Wang, Y.; Geng, L. Mechanical properties, degradation performance and cytotoxicity of Mg-Zn-Ca biomedical alloys with different compositions. Mater. Sci. Eng. C 2011, 31, 1667–1673. [Google Scholar] [CrossRef]
  52. Yin, P.; Li, N.F.; Lei, T.; Liu, L.; Ouyang, C. Effects of Ca on microstructure, mechanical and corrosion properties and biocompatibility of Mg-Zn-Ca alloys. J. Mater. Sci. Mater. Med. 2013, 24, 1365–1373. [Google Scholar] [CrossRef]
  53. Li, H.X.; Qin, S.K.; Ma, Y.Z.; Wang, J.; Liu, Y.J.; Zhang, J.S. Effects of Zn content on the microstructure and the mechanical and corrosion properties of as-cast low-alloyed Mg–Zn–Ca alloys. Int. J. Miner. Metall. Mater. 2018, 25, 800–809. [Google Scholar] [CrossRef]
  54. Xin, R.; Luo, Y.; Zuo, A.; Gao, J.; Liu, Q. Texture effect on corrosion behavior of AZ31 Mg alloy in simulated physiological environment. Mater. Lett. 2012, 72, 1–4. [Google Scholar] [CrossRef]
  55. Jiang, B.; Xiang, Q.; Atrens, A.; Song, J.; Pan, F. Influence of crystallographic texture and grain size on the corrosion behaviour of as-extruded Mg alloy AZ31 sheets. Corros. Sci. 2017, 126, 374–380. [Google Scholar] [CrossRef]
  56. Gerashi, E.; Alizadeh, R.; Langdon, T.G. Effect of crystallographic texture and twinning on the corrosion behavior of Mg alloys: A review. J. Magnes. Alloys 2022, 10, 313–325. [Google Scholar] [CrossRef]
  57. Xin, R.; Li, B.; Li, L.; Liu, Q. Influence of texture on corrosion rate of AZ31 Mg alloy in 3.5 wt.% NaCl. Mater. Des. 2011, 32, 4548–4552. [Google Scholar] [CrossRef]
  58. Meng, X.; Jiang, Z.; Zhu, S.; Guan, S. Effects of Sr addition on microstructure, mechanical and corrosion properties of biodegradable Mg–Zn–Ca alloy. J. Alloys Compd. 2020, 838, 155611. [Google Scholar] [CrossRef]
  59. Zhang, Y.; Li, J.; Li, J. Effects of calcium addition on phase characteristics and corrosion behaviors of Mg-2Zn-0.2Mn-xCa in simulated body fluid. J. Alloys Compd. 2017, 728, 37–46. [Google Scholar] [CrossRef]
  60. Abdel-Gawad, S.A.; Shoeib, M.A. Corrosion studies and microstructure of Mg−Zn−Ca alloys for biomedical applications. Surf. Interfaces 2019, 14, 108–116. [Google Scholar] [CrossRef]
  61. Dhanapal, A.; Boopathy, S.R.; Balasubramanian, V. Influence of pH value, chloride ion concentration and immersion time on corrosion rate of friction stir welded AZ61A magnesium alloy weldments. J. Alloys Compd. 2012, 523, 49–60. [Google Scholar] [CrossRef]
  62. Atrens, A.; Song, G.L.; Cao, F.; Shi, Z.; Bowen, P.K. Advances in Mg corrosion and research suggestions. J. Magnes. Alloys 2013, 1, 177–200. [Google Scholar] [CrossRef]
  63. Johnston, S.; Shi, Z.; Atrens, A. The influence of pH on the corrosion rate of high-purity Mg, AZ91 and ZE41 in bicarbonate buffered Hanks’ solution. Corros. Sci. 2015, 101, 182–192. [Google Scholar] [CrossRef]
Figure 1. Schematic of hot rolling directions of MgZnCa alloy.
Metals 14 01002 g001
Figure 2. XRD patterns of hot-rolled alloys: (a) ZC01, (b) ZC02, (c) ZC03, and (d) ZC04, recorded on the ND plane.
Metals 14 01002 g002
Figure 3. Optical microscopy images of hot-rolled alloys: (a) ZC00, (b) ZC01, (c) ZC02, (d) ZC03, and (e) ZC04, recorded on ND plane.
Metals 14 01002 g003
Figure 4. SEM micrographs of (a) ZC00, (b) ZC01, (c) ZC02, (d) ZC03, and (e) ZC04, with magnified images.
Metals 14 01002 g004
Figure 5. EDS point analysis of (a) ZC01, (b) ZC02, (c) ZC03, and (d) ZC04, with magnified images.
Metals 14 01002 g005
Figure 6. EBSD orientation maps and (0002) pole figures of (a) ZC00, (b) ZC01, (c) ZC02, (d) ZC03, and (e) ZC04, showing the evolution of microstructures. The number in each pole figure indicates maximum texture intensity.
Metals 14 01002 g006
Figure 7. Load vs. displacement curve of (a) as-cast and (b) hot-rolled alloys.
Metals 14 01002 g007
Figure 8. Comparison of mechanical properties between as-cast and hot-rolled alloys revealed by micro-indentation, in terms of (a) Elastic modulus (GPa) and (b) microhardness (HV).
Metals 14 01002 g008
Figure 9. Potentiodynamic polarization measurements of (a) as-cast and (b) hot-rolled alloys in SBF.
Metals 14 01002 g009
Figure 10. Degradation behavior of hot-rolled alloys in SBF: (a) weight loss (%) and (b) pH change of SBF for 21 days.
Metals 14 01002 g010
Figure 11. Optical (i) and SEM (ii,iii) of (a) ZC00, (b) ZC01, (c) ZC02, (d) ZC03, and (e) ZC04 after 21 days degradation in SBF. The insets in each section depict the magnified version of corrosion pits.
Metals 14 01002 g011
Table 1. Nomenclature and nominal composition of Mg alloys after hot-rolling.
NomenclatureMaterial ConditionNominal Composition (by wt%)
ac-ZC00As-castCommercially pure magnesium (99.99%)
ac-ZC01As-castMg 97.2%, Zn 2.5%, Ca 0.3%
ac-ZC02As-castMg 97%, Zn 2.5%, Ca 0.5%
ac-ZC03As-castMg 96.6%, Zn 2.5%, Ca 0.9%
ac-ZC04As-castMg 96.35%, Zn 2.5%, Ca 1.15%
ZC00Hot-rolledCommercially pure magnesium (99.99%)
ZC01Hot-rolledMg 97.2%, Zn 2.5%, Ca 0.3%
ZC02Hot-rolledMg 97%, Zn 2.5%, Ca 0.5%
ZC03Hot-rolledMg 96.6%, Zn 2.5%, Ca 0.9%
ZC04Hot-rolledMg 96.35%, Zn 2.5%, Ca 1.15%
Table 2. Elemental analysis of hot-rolled Mg and its alloys using SEM-EDS.
Material Elemental Composition (wt%) Zn/Ca Atomic Ratio
MgZnCa
ZC00100---
ZC01Balance2.5 ± 0.30.3 ± 0.025
ZC02Balance2.41 ± 0.20.5 ± 0.043
ZC03Balance2.35 ± 0.70.9 ± 0.011.7
ZC04Balance2.5 ± 0.11.15 ± 0.011.3
Table 3. Average grain size and secondary phase volume fraction (%) of hot-rolled Mg and its alloys.
MaterialGrain Size (µm)
Mean ± S.D for n = 3
Volume Fraction of Secondary Phases (%)
ZC00342 ± 5.70
ZC01173.8 ± 2.50.9
ZC02158.1 ± 31.5
ZC03136.7 ± 3.73.4
ZC04107.2 ± 2.813.5
Table 4. Electrochemical parameters evaluated from Potentiodynamic polarization curves.
Material SystemEcorr (V, SCE)Icorr (×10−4) (A cm−2)CR (mm yr−1)
ac-ZC00−1.733.42 ± 0.77.6 ± 1.1
ac-ZC01−1.72.35 ± 1.05.2 ± 0.8
ac-ZC02−1.754.2 ± 0.39.4 ± 0.2
ac-ZC03−1.784.7 ± 0.310.5 ± 0.2
ac-ZC04−1.825.2 ± 0.910.8 ± 0.6
ZC00−1.72.86 ± 0.116.4 ± 0.03
ZC01−1.671.68 ± 0.43.7 ± 0.1
ZC02−1.723.02 ± 0.86.7 ± 0.7
ZC03−1.753.5 ± 0.77.8 ± 0.8
ZC04−1.824.17 ± 0.38.7 ± 0.5
Table 5. Initial and final pH values over 21 days degradation in SBF.
DayspH Values
ZC00ZC01ZC02ZC03ZC04
Day 07.47.47.47.47.4
Day 219.539.2310.0910.2810.33
Table 6. Comparison between corrosion rates of electrochemical and immersion studies.
Material SystemElectrochemical StudiesImmersion Studies
Icorr (× 10−4) (A cm−2)CR (mm yr−1)CRi (mm yr−1)
ZC002.86 ± 0.116.4 ± 0.033.6 ± 0.05
ZC011.68 ± 0.43.7 ± 0.11.4 ± 0.02
ZC023.02 ± 0.86.7 ± 0.75.7 ± 0.1
ZC033.5 ± 0.77.8 ± 0.813.1 ± 0.07
ZC044.17 ± 0.38.7 ± 0.516.7 ± 0.5
Disclaimer/Publisher’s Note: The statements, opinions and data contained in all publications are solely those of the individual author(s) and contributor(s) and not of MDPI and/or the editor(s). MDPI and/or the editor(s) disclaim responsibility for any injury to people or property resulting from any ideas, methods, instructions or products referred to in the content.

