Article

Corrosion Properties and Surface Chemistry of Graphene Oxide-Coated AZ91D Magnesium Alloy in Sodium Chloride Solution

by
Nathalia Sartori da Silva
,
Aila Cossovan Alves
,
Jaine Aparecida da Silva Pereira
,
Leandro Antonio de Oliveira
,
Mara Cristina Lopes de Oliveira
and
Renato Altobelli Antunes
*
Center for Engineering, Modeling and Applied Social Sciences (CECS), Federal University of the ABC (UFABC), Santo André 09210-580, SP, Brazil
*
Author to whom correspondence should be addressed.
Metals 2024, 14(9), 1019; https://doi.org/10.3390/met14091019
Submission received: 27 July 2024 / Revised: 29 August 2024 / Accepted: 4 September 2024 / Published: 6 September 2024
(This article belongs to the Special Issue Advances in Corrosion and Protection of Materials (Second Edition))

Abstract

:
In the present work, the corrosion properties and the surface chemistry of a graphene oxide-coated AZ91D alloy were investigated. The coatings were deposited on the substrate specimens by immersion in solutions with GO concentrations of 0.05% and 0.1% (m/v). An intermediate silane layer was firstly obtained to improve adhesion between the GO films and the AZ91D substrate. The electrochemical behavior of the coated specimens was assessed using electrochemical impedance spectroscopy and potentiodynamic polarization curves in 3.5 wt.% NaCl solution. The surface chemistry was assessed using X-ray photoelectron spectroscopy (XPS). The GO films consisted of a mixture of carbon-based bonds (C-C, C-OH, C=O, and O-C=O). The surface morphology of the coated specimens was examined using scanning electron microscopy. The results revealed that the compactness of the GO films was dependent on the deposition conditions. The corrosion resistance was affected by the surface morphology.

1. Introduction

The AZ series of magnesium alloys has found applications in the automotive and aircraft industries. The lightweight AZ91D alloy, for instance, is especially employed for use in structural components in the automotive industry due to its excellent castability and suitable mechanical strength [1,2,3]. Nonetheless, the well-known intrinsic low corrosion resistance of magnesium alloys is a major drawback for large-scale applications [4,5].
In order to take advantage of the attractive engineering properties of magnesium alloys, such as high strength-to-weight ratio and good formability and weldability, it is imperative to employ corrosion protection methods [6,7,8]. Traditional methods rely on microstructural and compositional control [9,10] combined with suitable surface treatments such as anodization or plasma electrolytic oxidation, conversion coatings, and so on [11,12,13,14,15].
Graphene-related materials have gained importance in several fields owing to an impressive set of attributes, such as high mechanical strength, surface functionalization, wear resistance, self-lubrication, and impermeability [16,17,18,19,20]. The chemical inertness of graphene materials has been advantageously explored for corrosion protection applications, either as additive for organic coatings or as a topcoat itself [21,22,23].
Graphene oxide (GO) has been used as corrosion-protective coating for magnesium alloys instead of pure graphene sheets. This is due to its stronger interaction with the metal’s surface [24,25]. GO contains carbonyl, epoxide, and hydroxyl groups, which account for its hydrophilic nature that makes it readily dispersible in water or polar solvents. As a consequence, stable aqueous solutions of GO in water can be prepared [26]. Neupane et al. [27] successfully obtained GO coatings on the surface of pure magnesium. The GO layer was formed on aqueous solutions of dispersed GO particles over previously silanized samples. Silanization was employed to promote the formation of silanol groups (Si-OH) from reactions of silane and water. The silanol groups can attach to the metal surface after a proper hydration treatment, enabling the formation of Si-O-metal bonds [28]. The combined silanization pre-treatment and GO coating increased the corrosion resistance of the magnesium surface. The beneficial effect of GO coating on the corrosion properties of bulk metallic surfaces was also observed by Prasai et al. [29]. Copper and nickel substrates were coated by graphene layers obtained using chemical vapor deposition or which were mechanically transferred onto the substrates. They observed the corrosion rate decreased one order of magnitude for the graphene-coated surfaces with respect to the pristine materials. Recently, Chu et al. [30] employed an innovative concept to obtain hybrid graphene oxide-polyvinyl alcohol (GO-PVA) coatings on Mg-Zn-Ca alloy substrates. They aimed to improve the interaction of GO with the magnesium surface by means of an organic medium that promotes a crosslinking effect, such as PVA. Effective barrier properties of the hybrid GO-PVA layer decreased the corrosion rate of the Mg alloy by one order of magnitude with respect to the bare substrate. By contrast, a single GO layer did not increase the corrosion resistance due to its poor interaction with the bulk metallic surface.
It is, therefore, imperative that chemical interaction exists between the graphene oxide layer and the metallic substrate in order to consolidate the corrosion protection ability of the graphene-based topcoat. In this respect, X-ray photoelectron spectroscopy (XPS) can be regarded as a powerful technique to assess such interactions. Lin et al. [31] studied the corrosion behavior of nickel–aluminum–bronze substrates with GO coatings. XPS was employed to examine the formation of chemical bonds between the metallic substrate and the GO layer. They were capable of identifying the main carbon chemical states and correlate them with the GO/metallic alloy interfacial bonding. Furthermore, they observed the dependence of corrosion resistance of the coated substrates with the presence of these chemical interactions.
In spite of the knowledge accumulated so far, the literature is still scarce on the relationship between the surface chemistry and the corrosion-protective properties of GO-coated magnesium alloys. In this work, we shed additional light on this subject by studying the electrochemical behavior of a GO-treated AZ91D magnesium alloy and its connections to the surface morphology and chemical composition. Silanization pre-treatment was combined with GO deposition to promote suitable bonding between the bulk metal surface and the topcoat. XPS analysis was employed to assess the surface chemical’s states. The corrosion behavior was evaluated using electrochemical impedance spectroscopy and potentiodynamic polarization.

2. Materials and Methods

2.1. Materials and Sample Preparation

AZ91D magnesium alloy (nominal chemical composition in wt.%: Al 8.3–9.7%; Mn 0.15%; Zn 0.35–1.00%; Si 0.1%; Fe 0.005%; Cu 0.3%; Ni 0.002%; Mg balance) was kindly provided by Rima Industrial Magnésio S/A (Belo Horizonte, Brazil) as a die-cast ingot. The as-received material was cut into small pieces with approximate dimensions of 1.8 × 1.8 × 0.5 cm using silicon carbide disks in a conventional cut-off machine. Next, samples were ground using waterproof silicon carbide papers up to grit 2000. After grinding, samples were carefully rinsed with ethanol, washed with distilled water, and dried in a warm air stream provided by a conventional heat gun.
In order to increase the number of OH groups on the surface of the AZ91D, an initial pretreatment was undertaken by immersing the ground samples in a 3 M NaOH solution at room temperature for 1 h. The hydrolyzed surface was washed with distilled water and let to naturally dry in the air. After the NaOH-based treatment, samples were silanized in a solution consisting of a mixture of 5 vol% 3-Aminopropyltriethoxysilane (APTES), 5 vol% water, and 90 vol% ethanol at room temperature for 1 h. Right after, the samples were cured at 100 °C for 1 h in a laboratory oven.
GO was purchased from Graphenea Inc. (Cambridge, MA, USA) as an aqueous suspension. Different GO-based solutions were prepared from the GO suspensions in order to achieve distinct GO contents. The different samples are described in Table 1. The as-received (AR) and silanized conditions (without GO coating) were also tested for comparison. The GO coating was prepared by immersing the silanized specimens in the GO solutions under soft magnetic stirring for different times, as described in Table 1. After deposition, the specimens were rinsed with distilled water and dried in open air.

2.2. Characterization

The surface morphology of the different GO coatings was examined using scanning electron microscopy (Jeol 6010 LA, Tokyo, Japan). The surface chemical states were analyzed with XPS using a Thermo VG K-alpha+ spectrometer operating with Al-kα radiation source (1486.6 eV). The pressure in the analysis chamber was approximately 10−7 Pa. High-resolution spectra were fitted using a combination of Lorentzian–Gaussian functions in the Avantage® software (version 5.976) and Smart algorithm for background subtraction. Complementary analysis of the functional groups of the silane and GO layers was carried out by Fourier Transfrorm Infrared spectroscopy (FTIR, Varian 660-IR, Santa Clara, CA, USA) in the attenuated total reflection (ATR) mode in the wavenumber range of 600 to 4000 cm−1. Baseline correction was carried out using a second derivative method. Smoothing was also applied to reduce noise with the Savitsky–Golay (SG) function with a polynomial order of 2.
The electrochemical behavior of the different samples was assessed in an Autolab M101 potentiostat/galvanostat. A conventional three-electrode cell configuration was used for the measurements with a platinum wire as the auxiliary electrode, Ag/AgCl (KCl, 3 M) as reference, and the AZ91·D alloy in the AR and treated states as the working electrodes. The open circuit potential (OCP) was monitored for 1 h. Next, electrochemical impedance spectroscopy (EIS) measurements were made at the OCP in the frequency range of 100 kHz to 0.01 Hz using a sinusoidal perturbation signal with an amplitude of ±10 mV (rms) and an acquisition rate of 10 points per frequency decade. Potentiodynamic polarization curves were obtained right after the EIS measurements. The potential was swept from −300 mV versus the OCP up to 0 VAg/AgCl or up to a current of 10 mA was achieved. The sweep rate was 1 mV·s−1. The tests were conducted in quadruplicate. All measurements were carried out in 3.5 wt.% NaCl solution at room temperature. The working electrode area exposed to solution was 2 cm2.

3. Results

3.1. Morphological Examination

Figure 1 shows macroscopic images of the AR, silanized, and GO-coated samples. The visual aspects of the AR and silanized samples were quite similar, whereas the GO coating can be promptly seen in the other samples with its typical black surface. No distinguishable features could be seen on the GO-coated surfaces by only visually inspecting them.
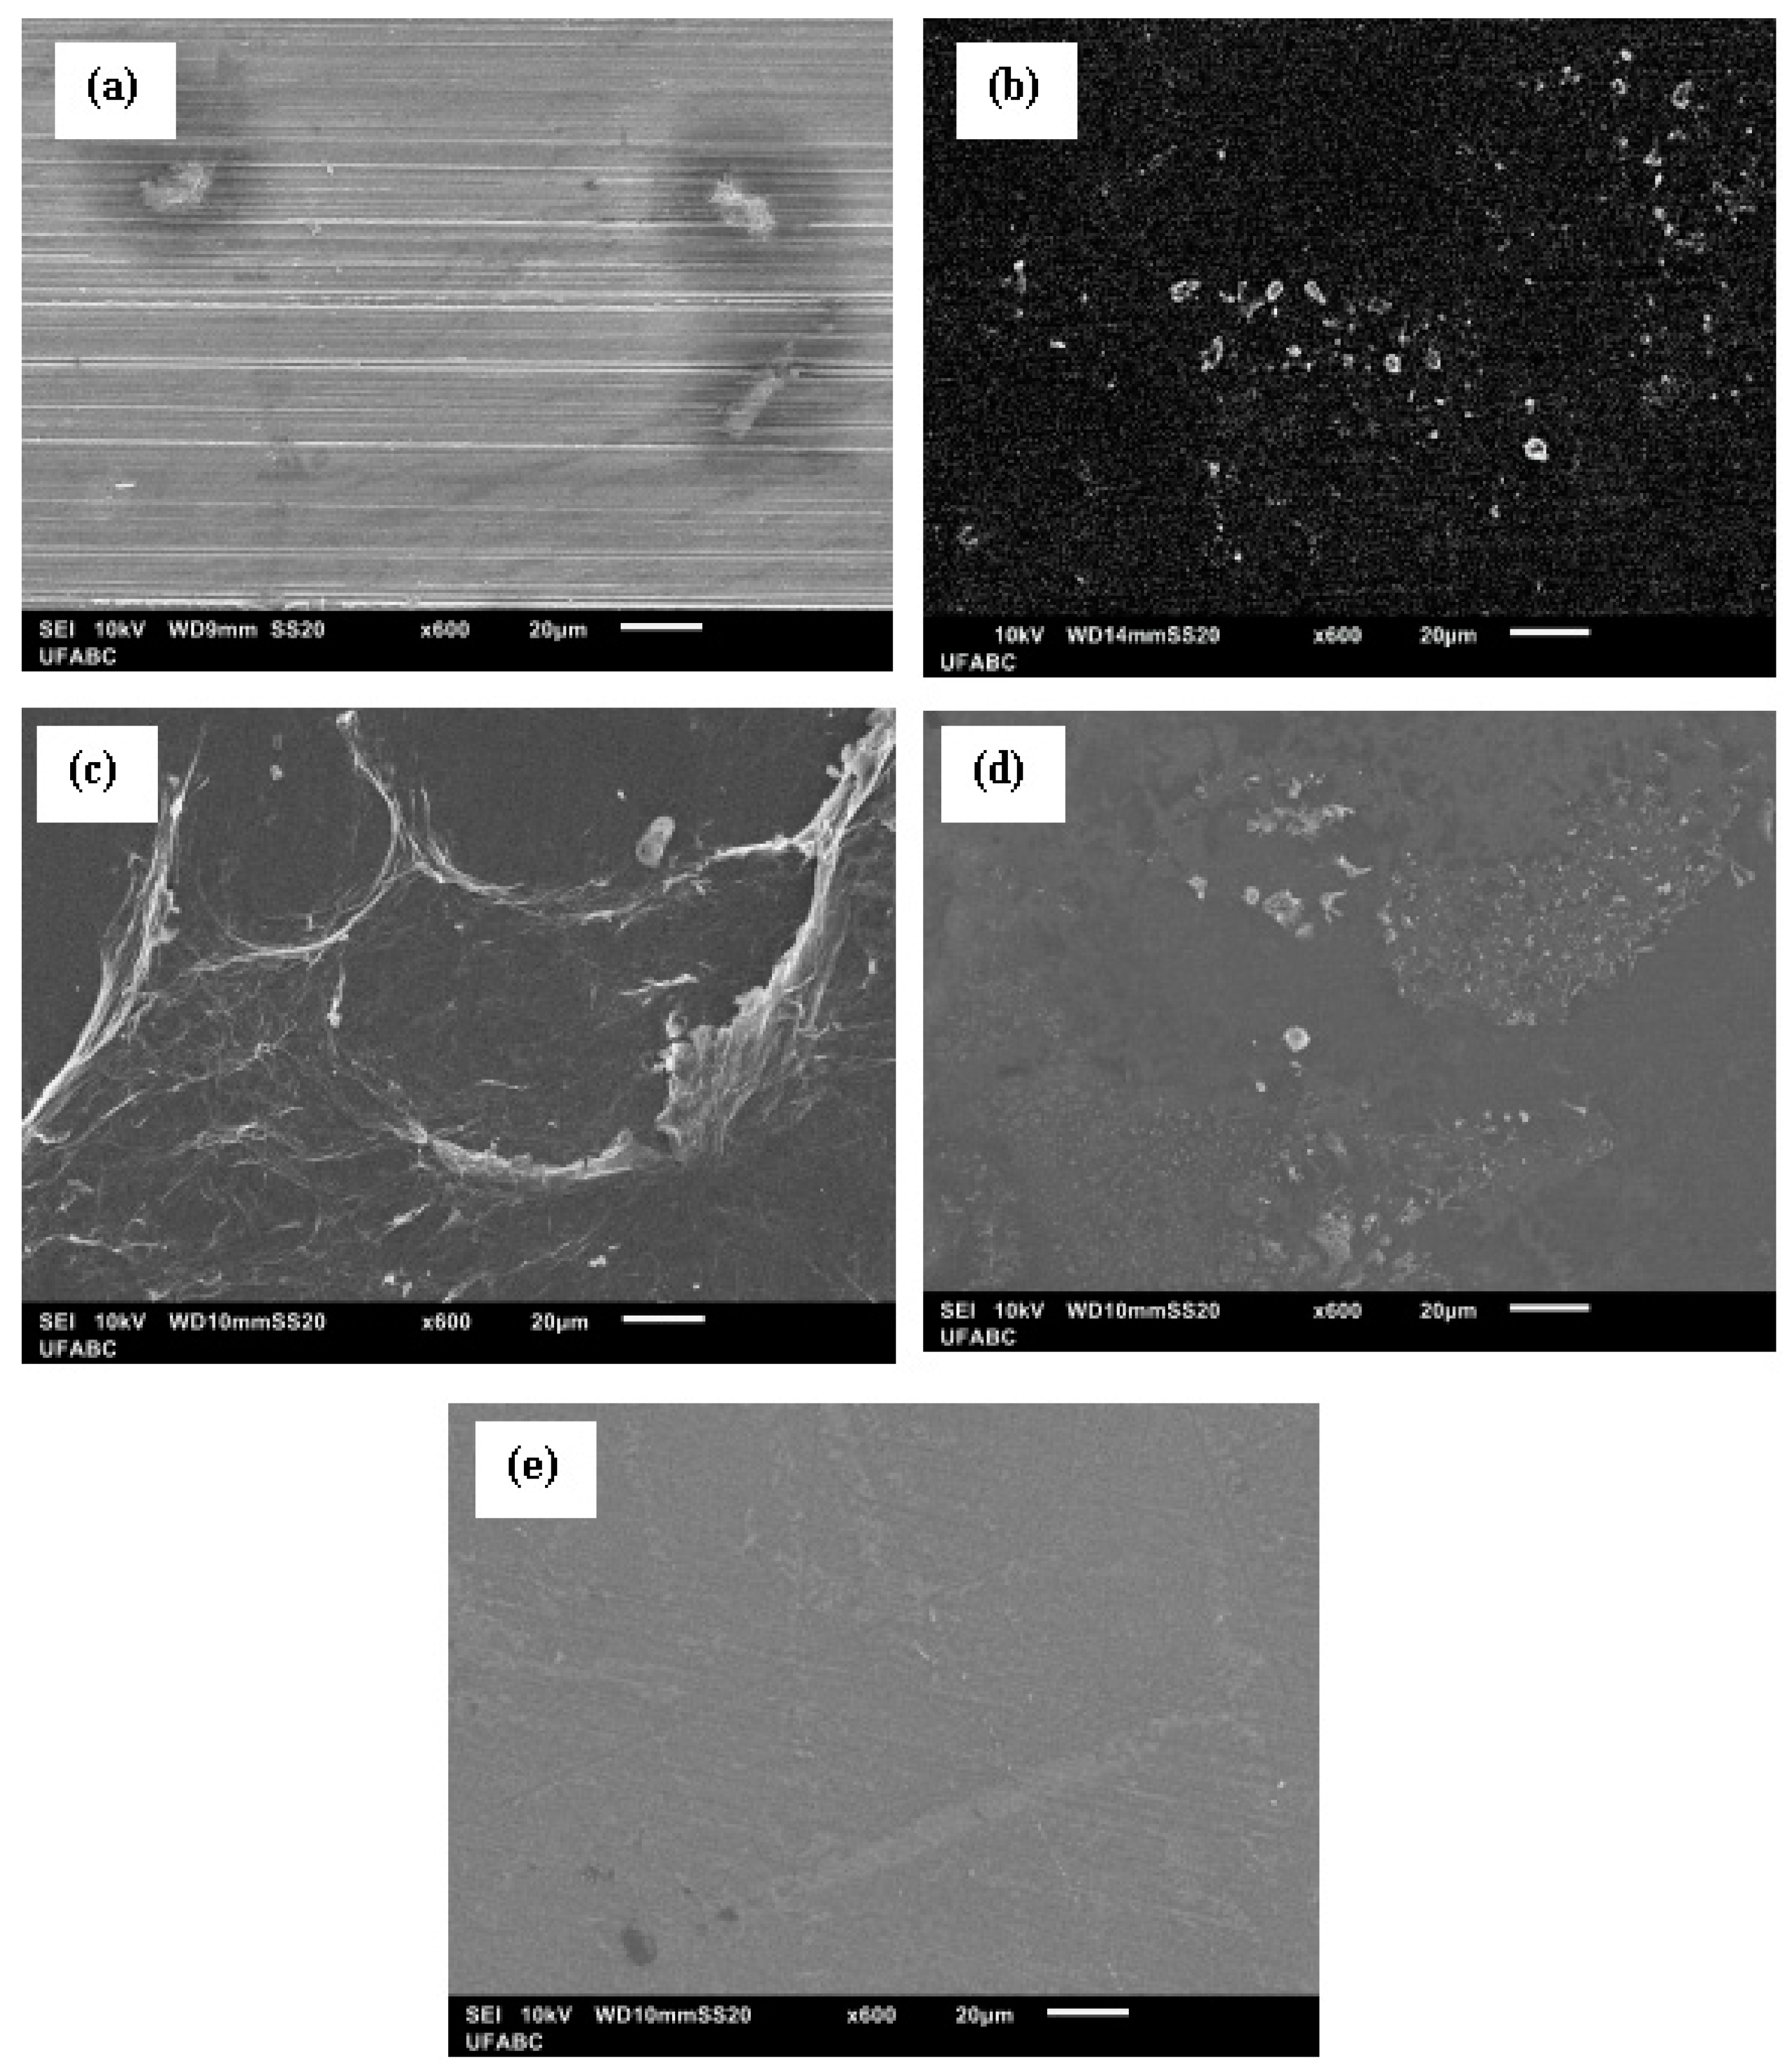
SEM analysis was carried out in order to gain further understanding on the morphological aspects of the different samples. Figure 2 shows the SEM micrographs of the AZ91D samples.
The morphology of the AR condition (Figure 2a) exhibited the ground markings of the surface preparation procedure. The surface aspect of the coated samples is completely different. The ground markings are no longer visible, as the GO coating covers the whole surface. The coatings obtained in both solutions at 2 h displayed a granular aspect (Figure 2b,d) with an irregular morphology, especially in the solution with a GO concentration of 0.05 wt.% (Figure 2b). By increasing the immersion time to 4 h, the coatings became smoother and fewer defects were observed. Sample 0.05% 4 h (Figure 2c) spread over the surface, showing a layered structure. Sample 0.1% 4 h (Figure 2e), in turn, displayed a uniform surface aspect.

3.2. Spectroscopic Analyses

The surface chemical states of the different AZ91D samples were assessed using XPS. Figure 3 shows the survey spectra of AR, silanized, and 0.1% 4 h samples. The spectra of the pure GO and the other GO-coated samples are shown as Supplementary Materials (Figure S1). In the AR condition, the main photoelectron lines were assigned to magnesium and oxygen. Carbon was found as surface contamination (adventitious carbon), as observed by other authors for the air-formed surface oxide of magnesium alloys [32,33]. In the silanized sample, in addition to these species, a small silicon peak appears, as well as nitrogen. These elements are part of the APTES molecule. The spectrum of the 0.1% 4 h sample, in turn, exhibited a stronger C 1s peak and the magnesium signal was attenuated due to the presence of the GO film.
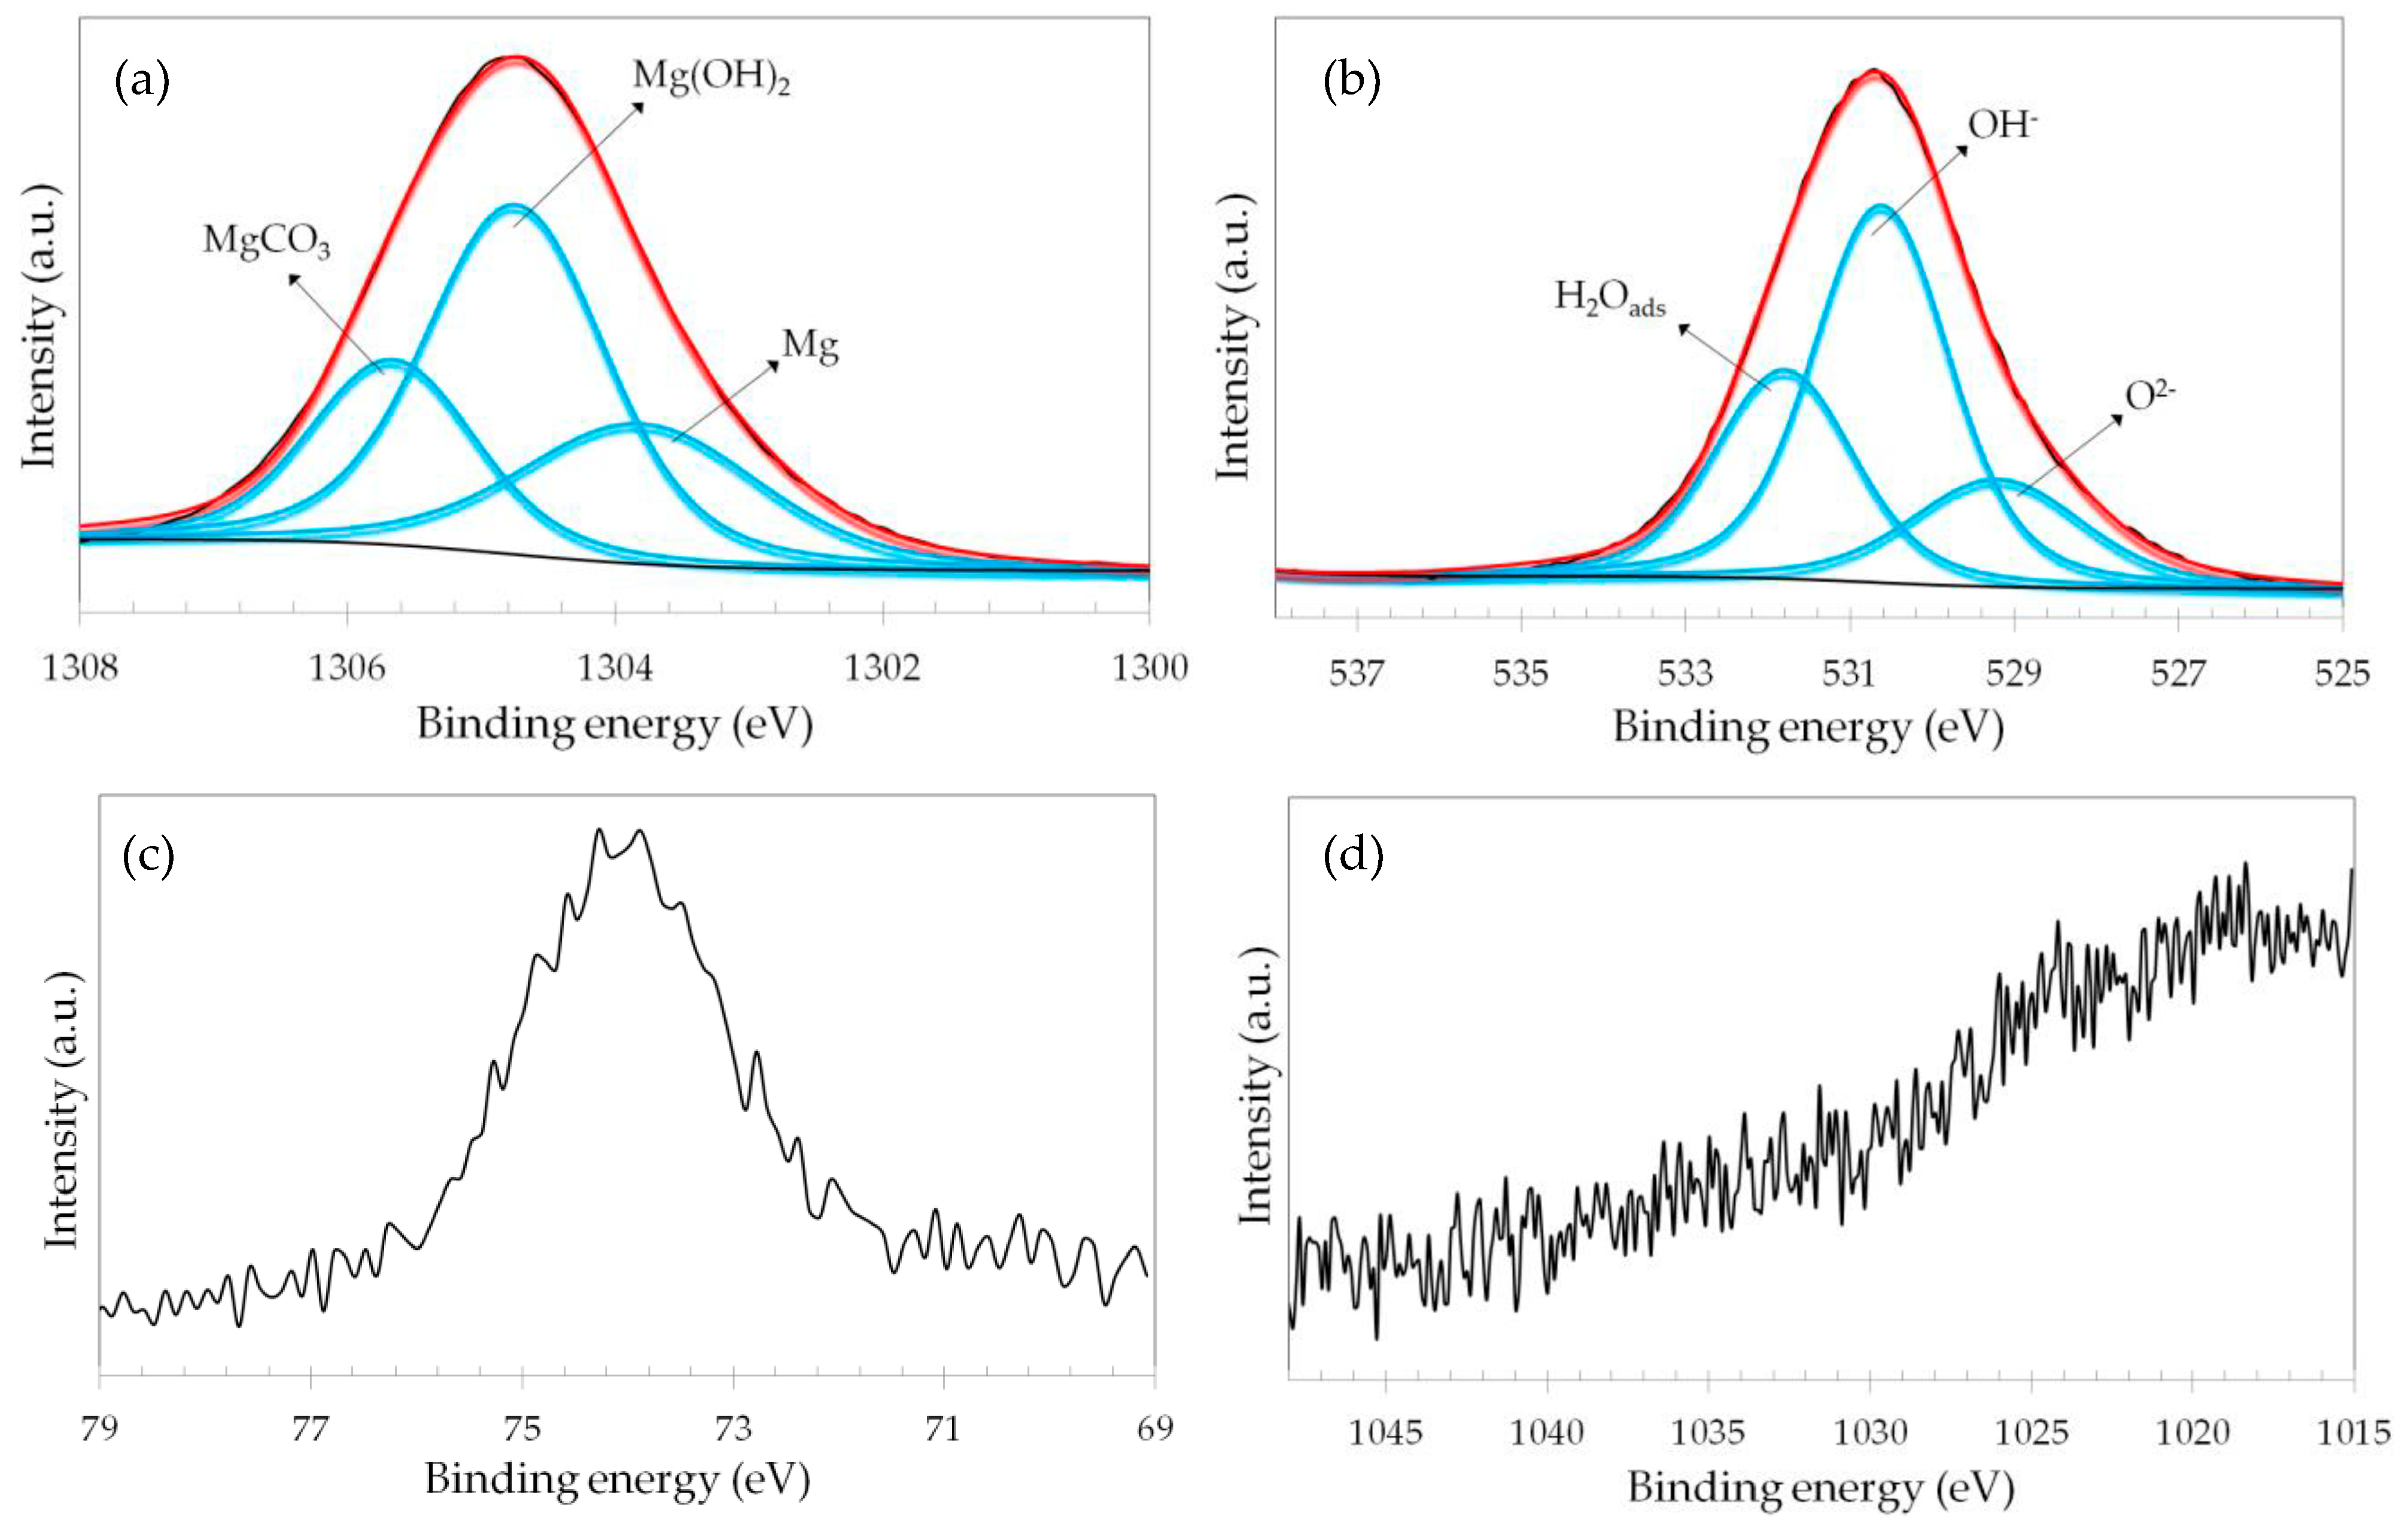
Figure 4 shows the high-resolution spectra for the Mg 1s, O 1s, Al 2p, and Zn 2p photoelectron lines of the AR sample. The Mg 1s spectrum (Figure 4a) was fitted with three peaks centered at 1303.7, 1304.7, and 1305.6 eV, which were assigned to metallic magnesium, Mg(OH)2, and MgCO3, respectively, in accordance with other reports [34,35]. The naturally formed oxide film on magnesium and its alloys is mainly comprised of Mg(OH)2 which, in turn, reacts with the CO2 in the atmosphere, forming MgCO3, as shown in the sequence of reactions (1)–(5) [36].
Cathodic reaction:
H2O + 2e → H2(g) + 2OH(aq)
O2 + 2H2O + 4e → 4OH (aq)
Anodic reaction: Mg(s) → Mg2+ (aq) + 2e
Overall reaction: Mg2+ (aq) + 2OH (aq) → Mg(OH)2 (s)
Mg(OH)2 + CO2 → Mg(CO)3 (s) + H2O
The O 1s spectrum (Figure 4b) was deconvoluted with three peaks, which were assigned to oxide-type bonds (O2−), hydroxide-type bonds (OH), and adsorbed water (H2Oads), in agreement with the literature [37,38]. Hydroxide bonds predominate over oxide ones, likely due to the relatively large amount of Mg(OH)2 formed on the AZ91D surface, as Mg is the main constituent of the alloy.
Figure 4c shows the Al 2p high-resolution spectrum of the AR sample. One single peak was observed. It was centered at 74.1 eV, which is typically assigned to Al3+ species such as AlOOH, Al(OH)3, and Al2O3, as reported by other authors [39,40]. The signal of Zn 2p was very weak, as seen in Figure 4d. This is likely due to the relatively small amount of zinc in the AZ91D alloy (less than 1.0 wt.%). Thus, it is not one of the main constituents of the native oxide film, which is mainly comprised of magnesium and aluminum oxidized species.
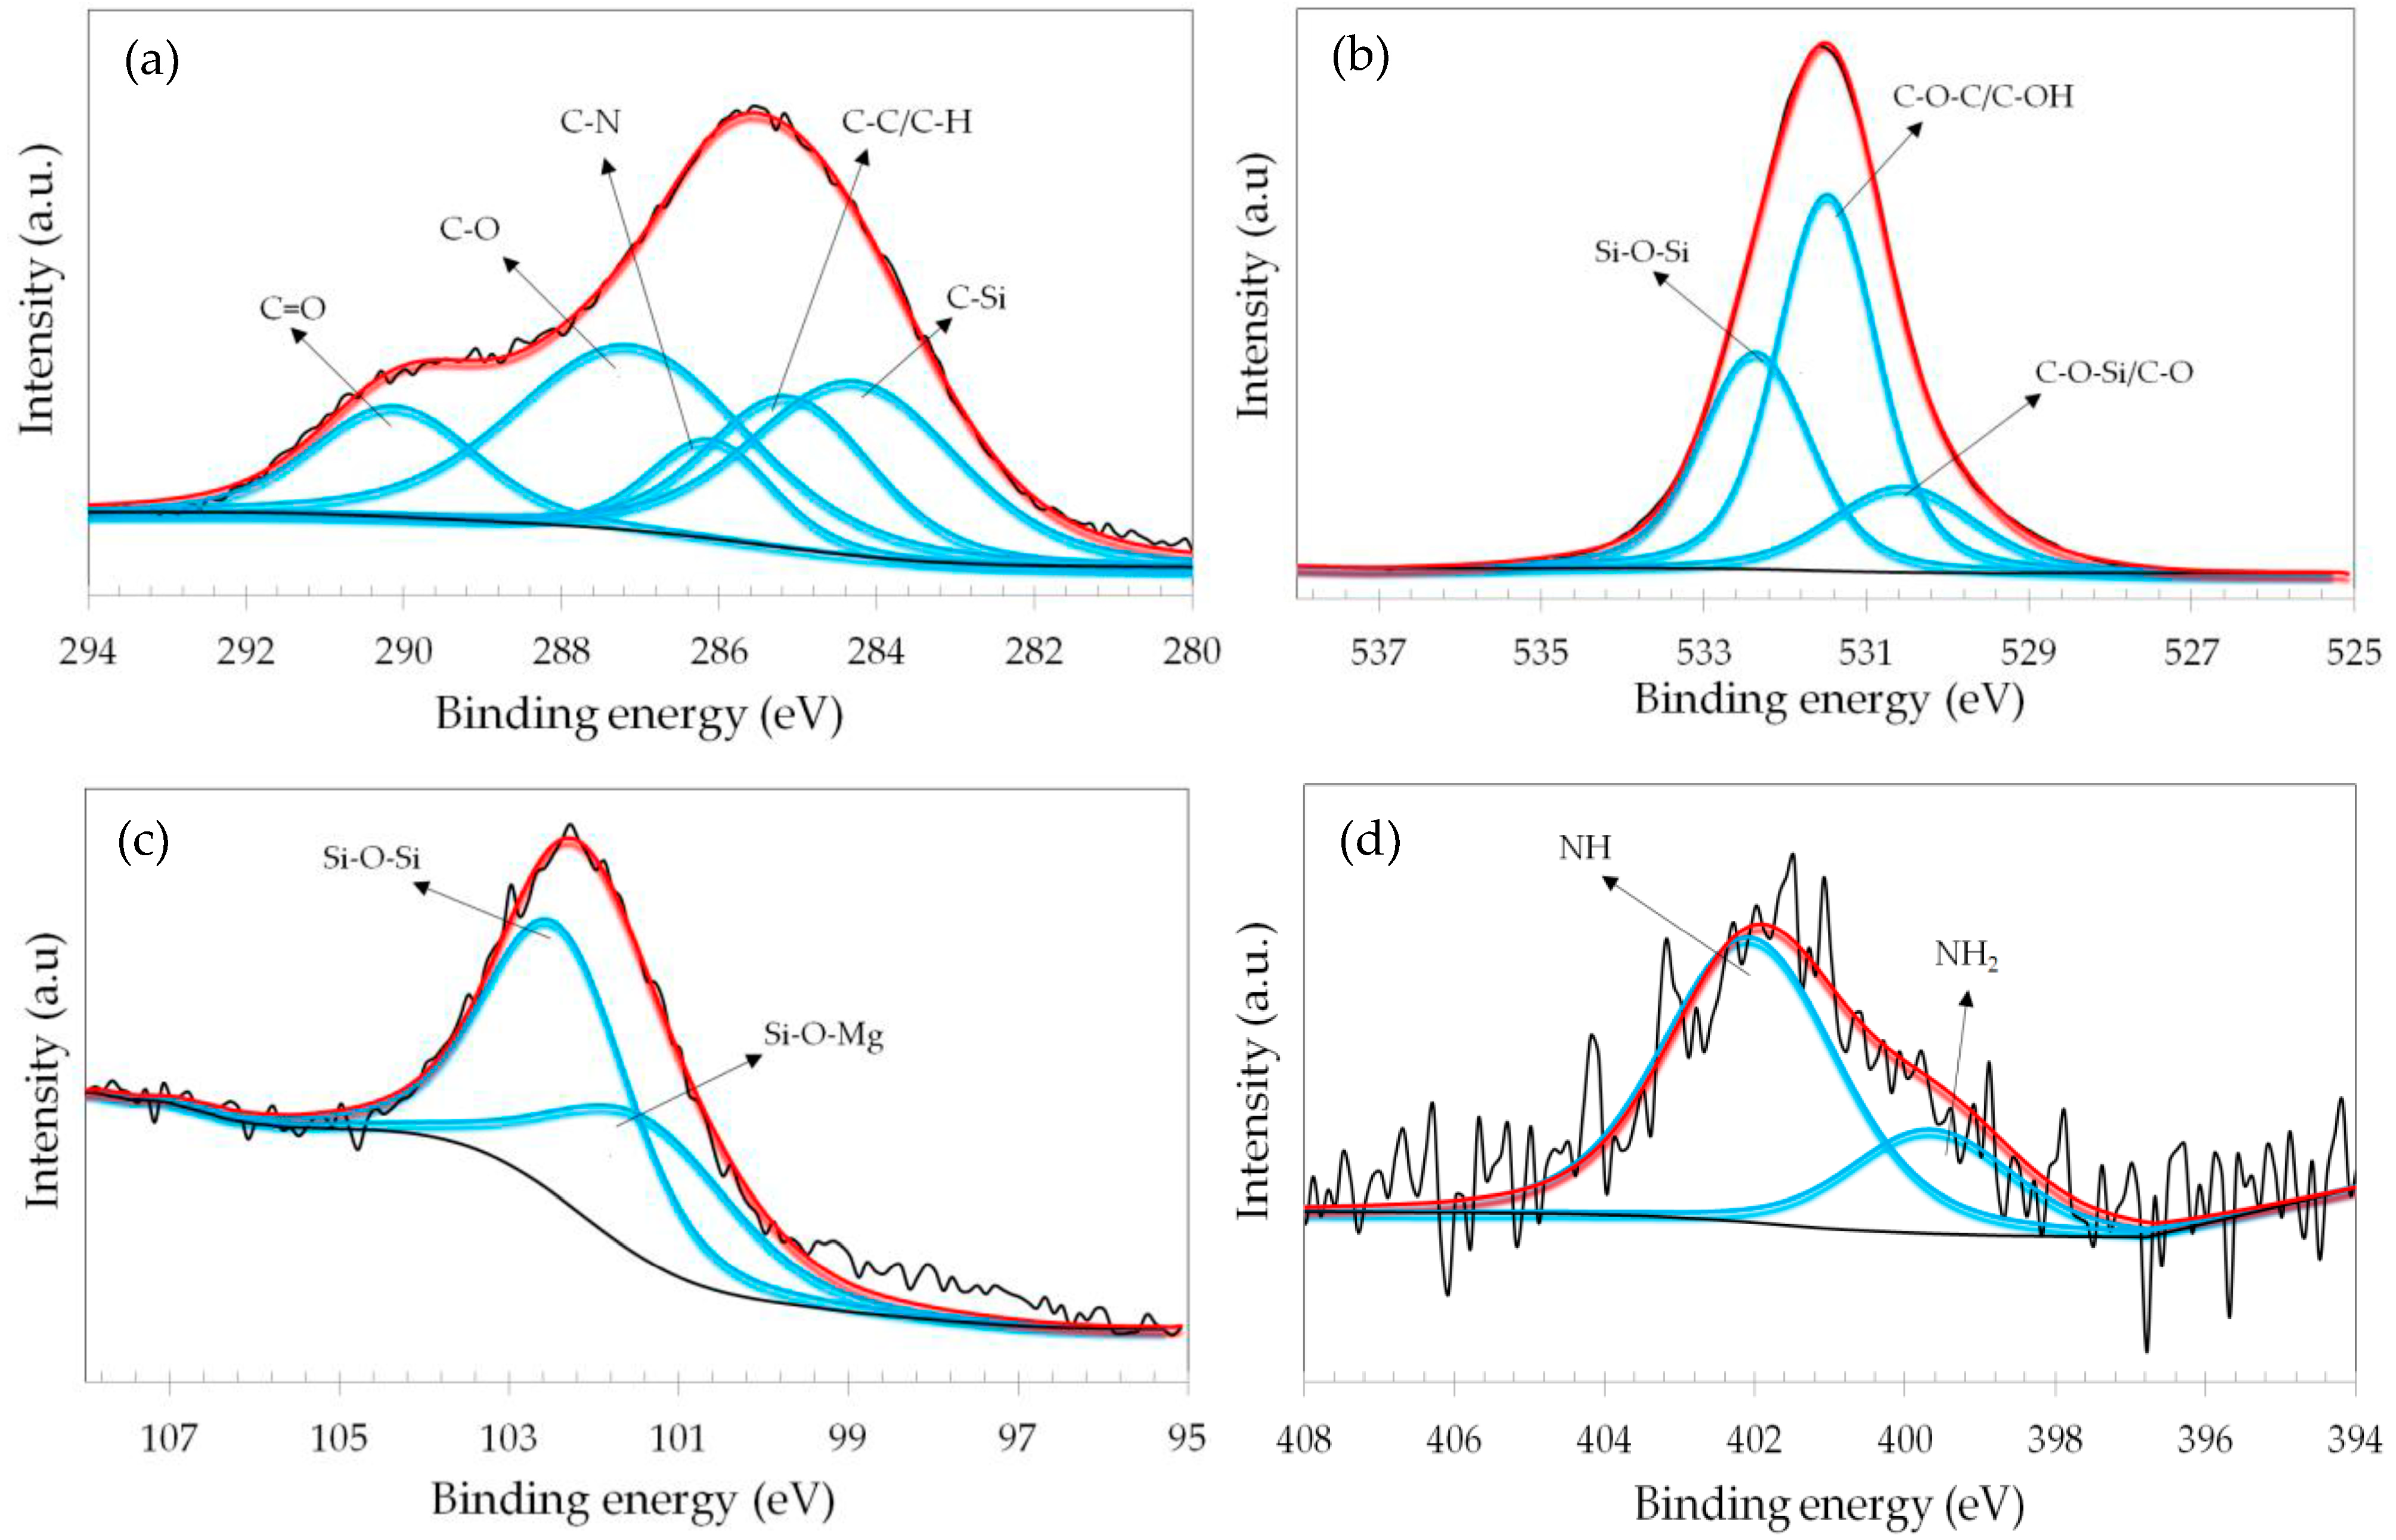
Figure 5 shows the XPS high-resolution spectra of the silanized sample (without GO coating). The C 1s peak (Figure 5a) was deconvoluted with five peaks. The lowest-binding energy component was assigned to C-Si bonds (284.2 eV). The second component (at approximately 285 eV) was assigned to C-C/C-H bonds. The peak at 286 eV was assigned to C-N, where the higher-binding energy components were due to C-O and C=O bonds. These peaks are in good agreement with the literature [41]. The O 1s spectrum (Figure 5b) was fitted with three peaks. The lowest-binding energy component was assigned to C-O-Si/C-O bonds. The intermediate component was assigned to C-O-C/C-OH bonds, whereas the highest-binding energy component was due to siloxane-type bonds of the APTES molecule (Si-O-Si), as reported in the literature [42,43].
The Si 2p spectrum of the silanized sample is presented in Figure 5c. It was deconvoluted with two peaks that were assigned to Si-O-Mg and Si-O-Si bonds, in accordance with other published results [44,45]. The presence of Si-O-Mg bonds gives unequivocal evidence of the interaction between the APTES molecule and the AZ91D substrate. The N 1s spectrum is shown in Figure 5d. It was fitted with two components. The first peak is centered at 339.6 eV and was assigned to primary amine bonds (NH2). The highest-binding energy peak (at approximately 402 eV) was due to secondary amine bonds, in good agreement with the literature [45].
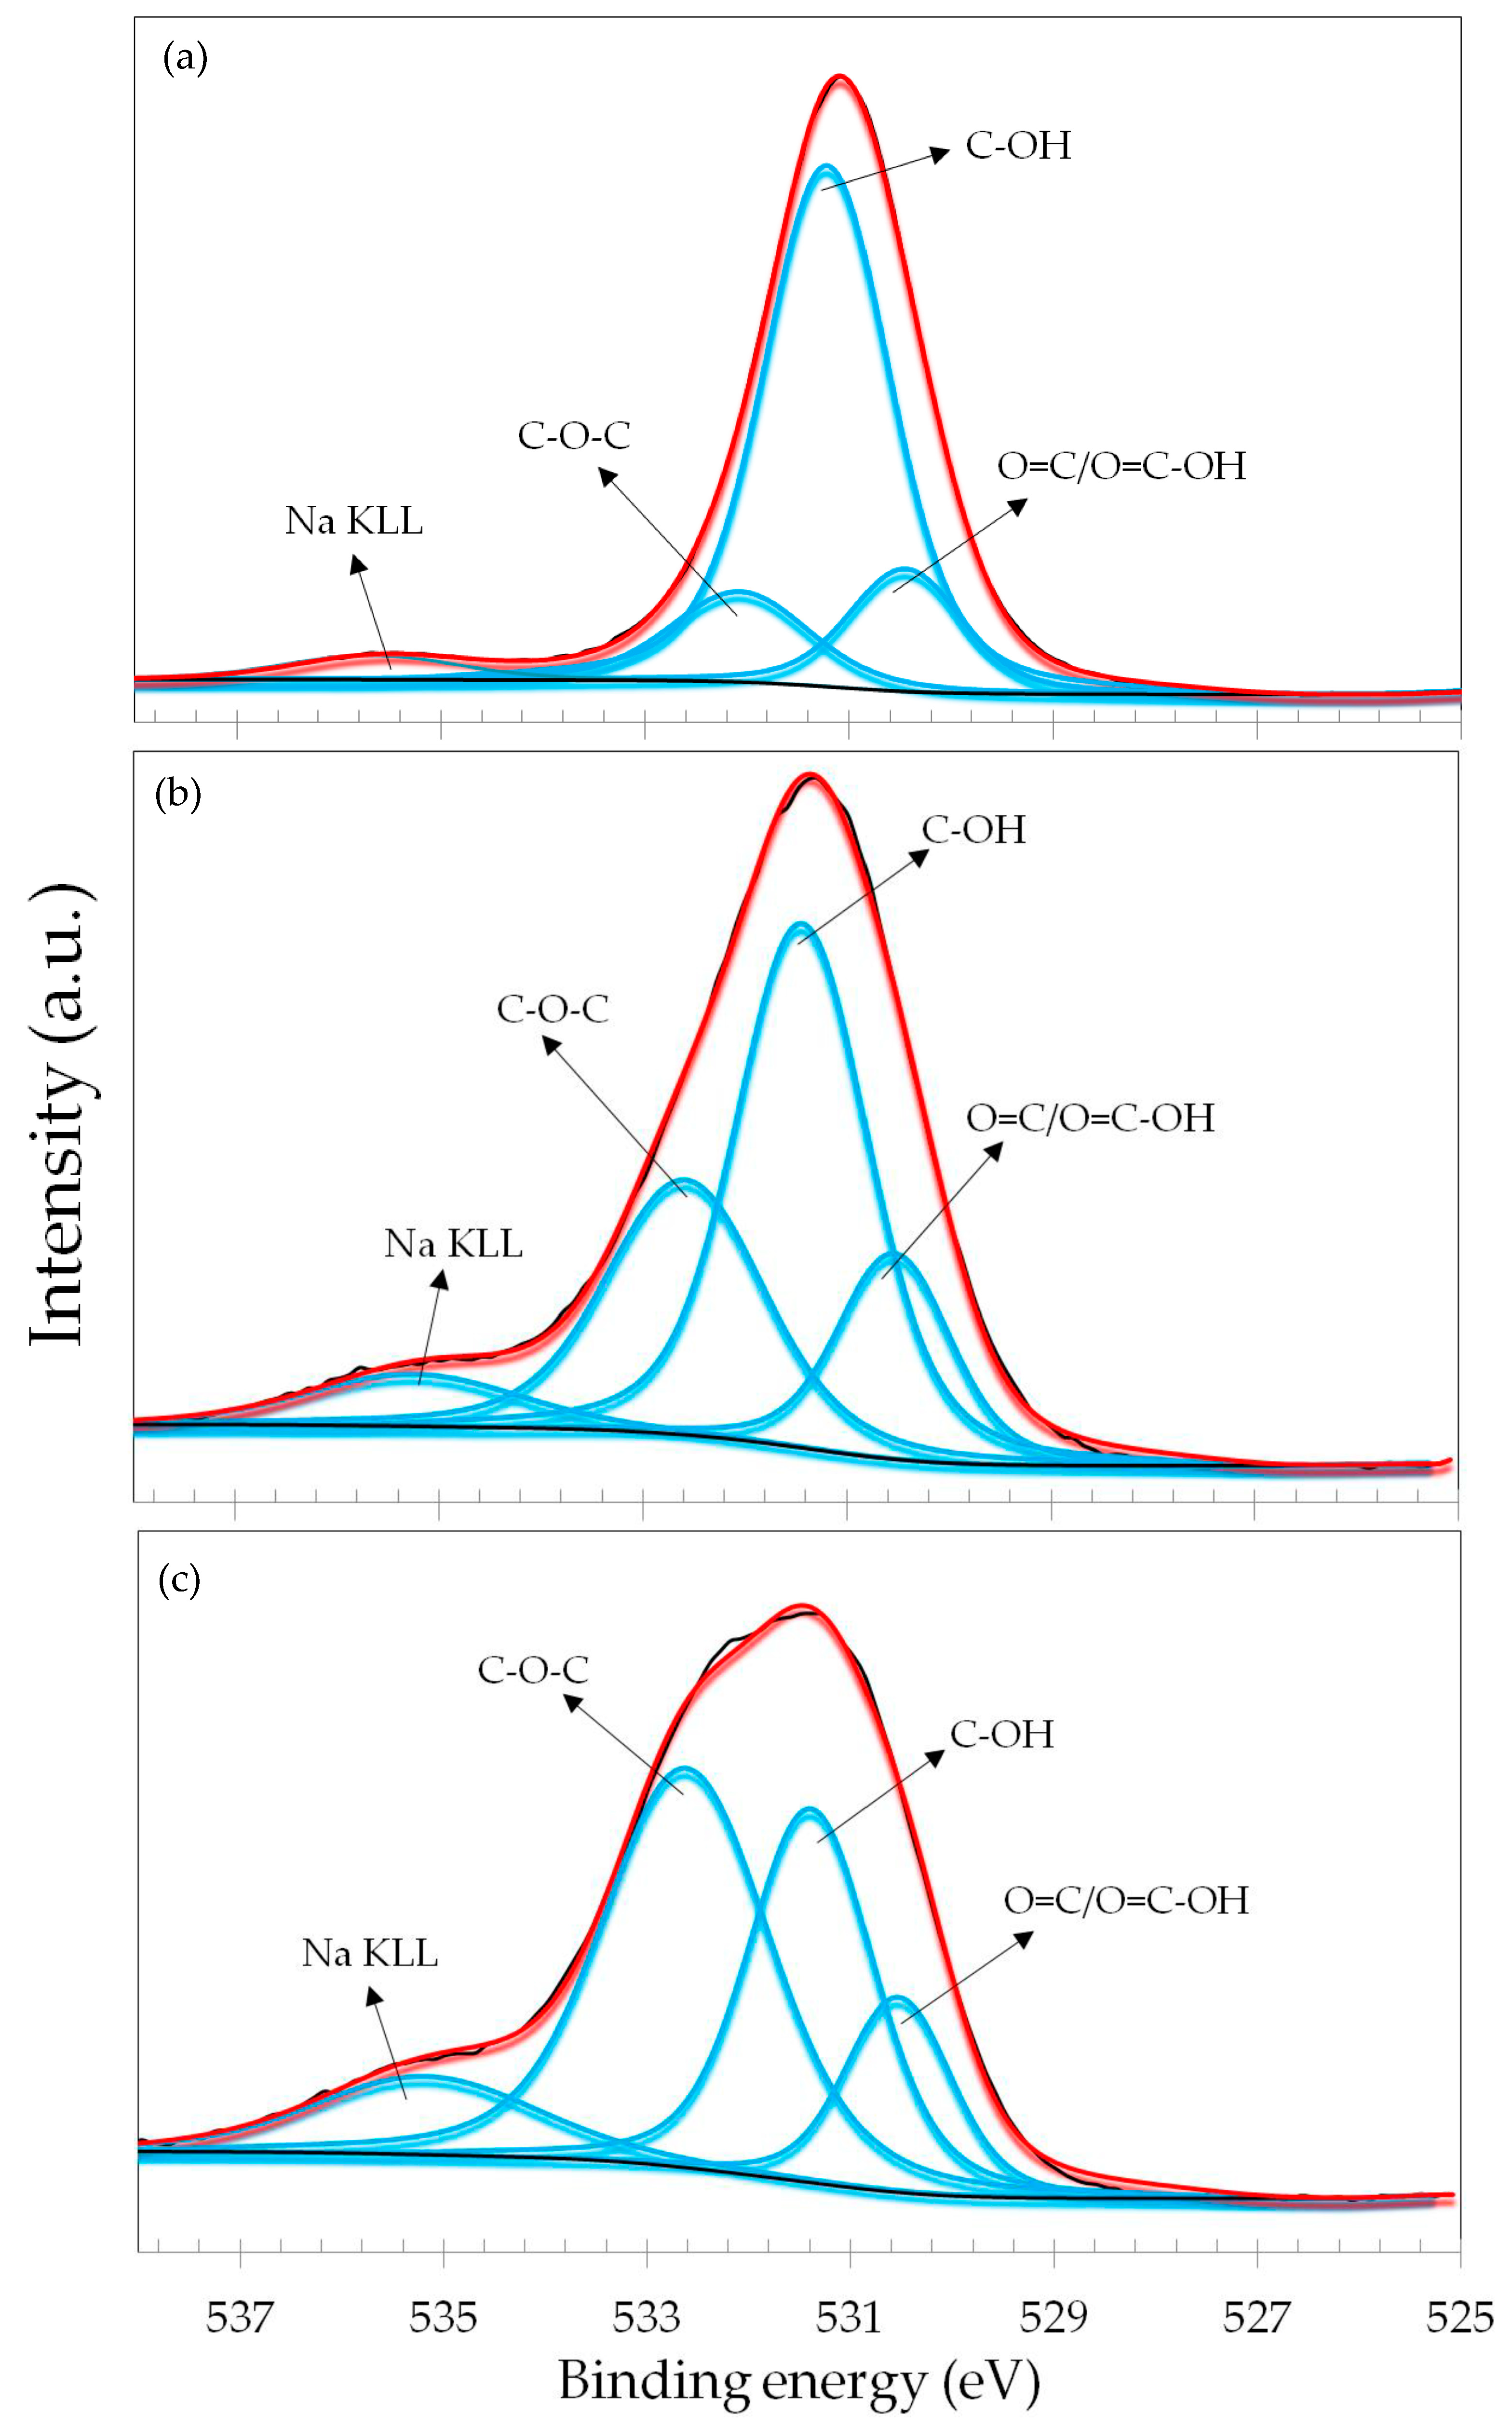
Figure 6 shows the XPS high-resolution spectra of the 0.1% 4 h sample for the C 1s, O 1s, N 1s, and Si 2p photoelectron lines. This sample was chosen as representative of all GO-coated samples due to its high corrosion resistance, as will be discussed in Section 3.3. The C 1s, N 1s, and Si 2p spectra of the other GO-coated samples are very similar to those of 0.1% 4 h. They are presented as Supplementary Materials. The O 1s high-resolution spectra of the other GO-coated samples exhibited one additional feature that is not encountered in the spectrum of the 0.1% 4 h sample. They are shown in Figure 7.
The C 1s spectrum of the 0.1% 4 h sample (Figure 6a) was deconvoluted with five peaks, in accordance with the literature for the XPS results of graphene oxide, showing its typical functional groups [46,47,48]. The same components were also observed for the C 1s photoelectron lines of the other GO-coated samples, as shown in Figure S2 (Supplementary Materials). A pure GO sample was also analyzed using XPS, and its C 1s spectrum is shown in Figure 8a. The same components were also observed. They were assigned to C=C (284.4 eV), C-C (285.4 eV), C-OH (286.4 eV), C=O (288.0 eV), and O-C=O (290.0 eV) bonds of the GO coating on the surface of the AZ91D substrate.
The O 1s spectrum of the 0.1% 4 h sample is displayed in Figure 6b. It was deconvoluted with three components assigned to O=C/O=C-OH, C-OH, and C-O-C bonds, in good agreement with other reports for the O 1s photoelectron line of graphene oxide [49,50]. The O 1s spectrum of the GO sample (Figure 8b) exhibited the same components. However, if one considers the other GO-coated samples, one additional feature was observed. As shown in Figure 7, besides the three components already mentioned above for the pure GO and 0.1% 4 h samples, one additional peak was encountered at approximately 535 eV. This peak was due to an Auger peak of sodium (Na KLL), as reported in the literature [51]. Sodium species originate from the NaOH pretreatment of the AZ91D substrate to enhance its interaction with the intermediate APTES layer before GO deposition. Thus, the presence of such a peak in the O 1s spectrum suggests that the GO layer is less defective on the 0.1% 4 h sample when compared to the other GO-coated samples, as it did not display the Na KLL peak. In fact, the surface morphology of 0.1% 4 h (Figure 2e) indicated that it exhibited the best surface coverage and less-defective topography among the GO-coated samples. Yet, it is interesting to note that the intensity of the Na KLL peak decreases as the GO concentration and deposition time increased (see the evolution of the Na KLL intensity from Figure 7c to Figure 7a), thus indicating that the coverage of the NaOH-treated AZ91D substrate was gradually improved. Furthermore, as evident in Figure 7, the relative area of the peak assigned to hydroxyl bonds (C-OH) increased with the GO concentration and immersion time. These bonds are typical functional groups present in the basal planes of GO [52]. Hence, its increased relative fraction in the 0.1% 2 h sample (Figure 7a) with respect to the samples obtained at a GO concentration of 0.05% (Figure 7b,c) suggests an increased coverage of the substrate with the GO film.
The N 1s and Si 2p signals (Figure 6c,d) are due to the intermediate APTES layer. The N 1s spectrum exhibited one single peak centered at 399.6 eV that was assigned to NH2 bonds in the APTES molecule, in agreement with other authors [53]. The Si 2p spectrum also displayed one single peak. This peak was assigned to Si-O-Si bonds formed during the silanization treatment, indicating that APTES was chemically bonded to the AZ91D surface [54]. The N 1s and Si 2p spectra of the other GO-coated samples are very similar, and are displayed as Supplementary Materials (Figures S3 and S4 for the N 1s and Si 2p spectra, respectively).
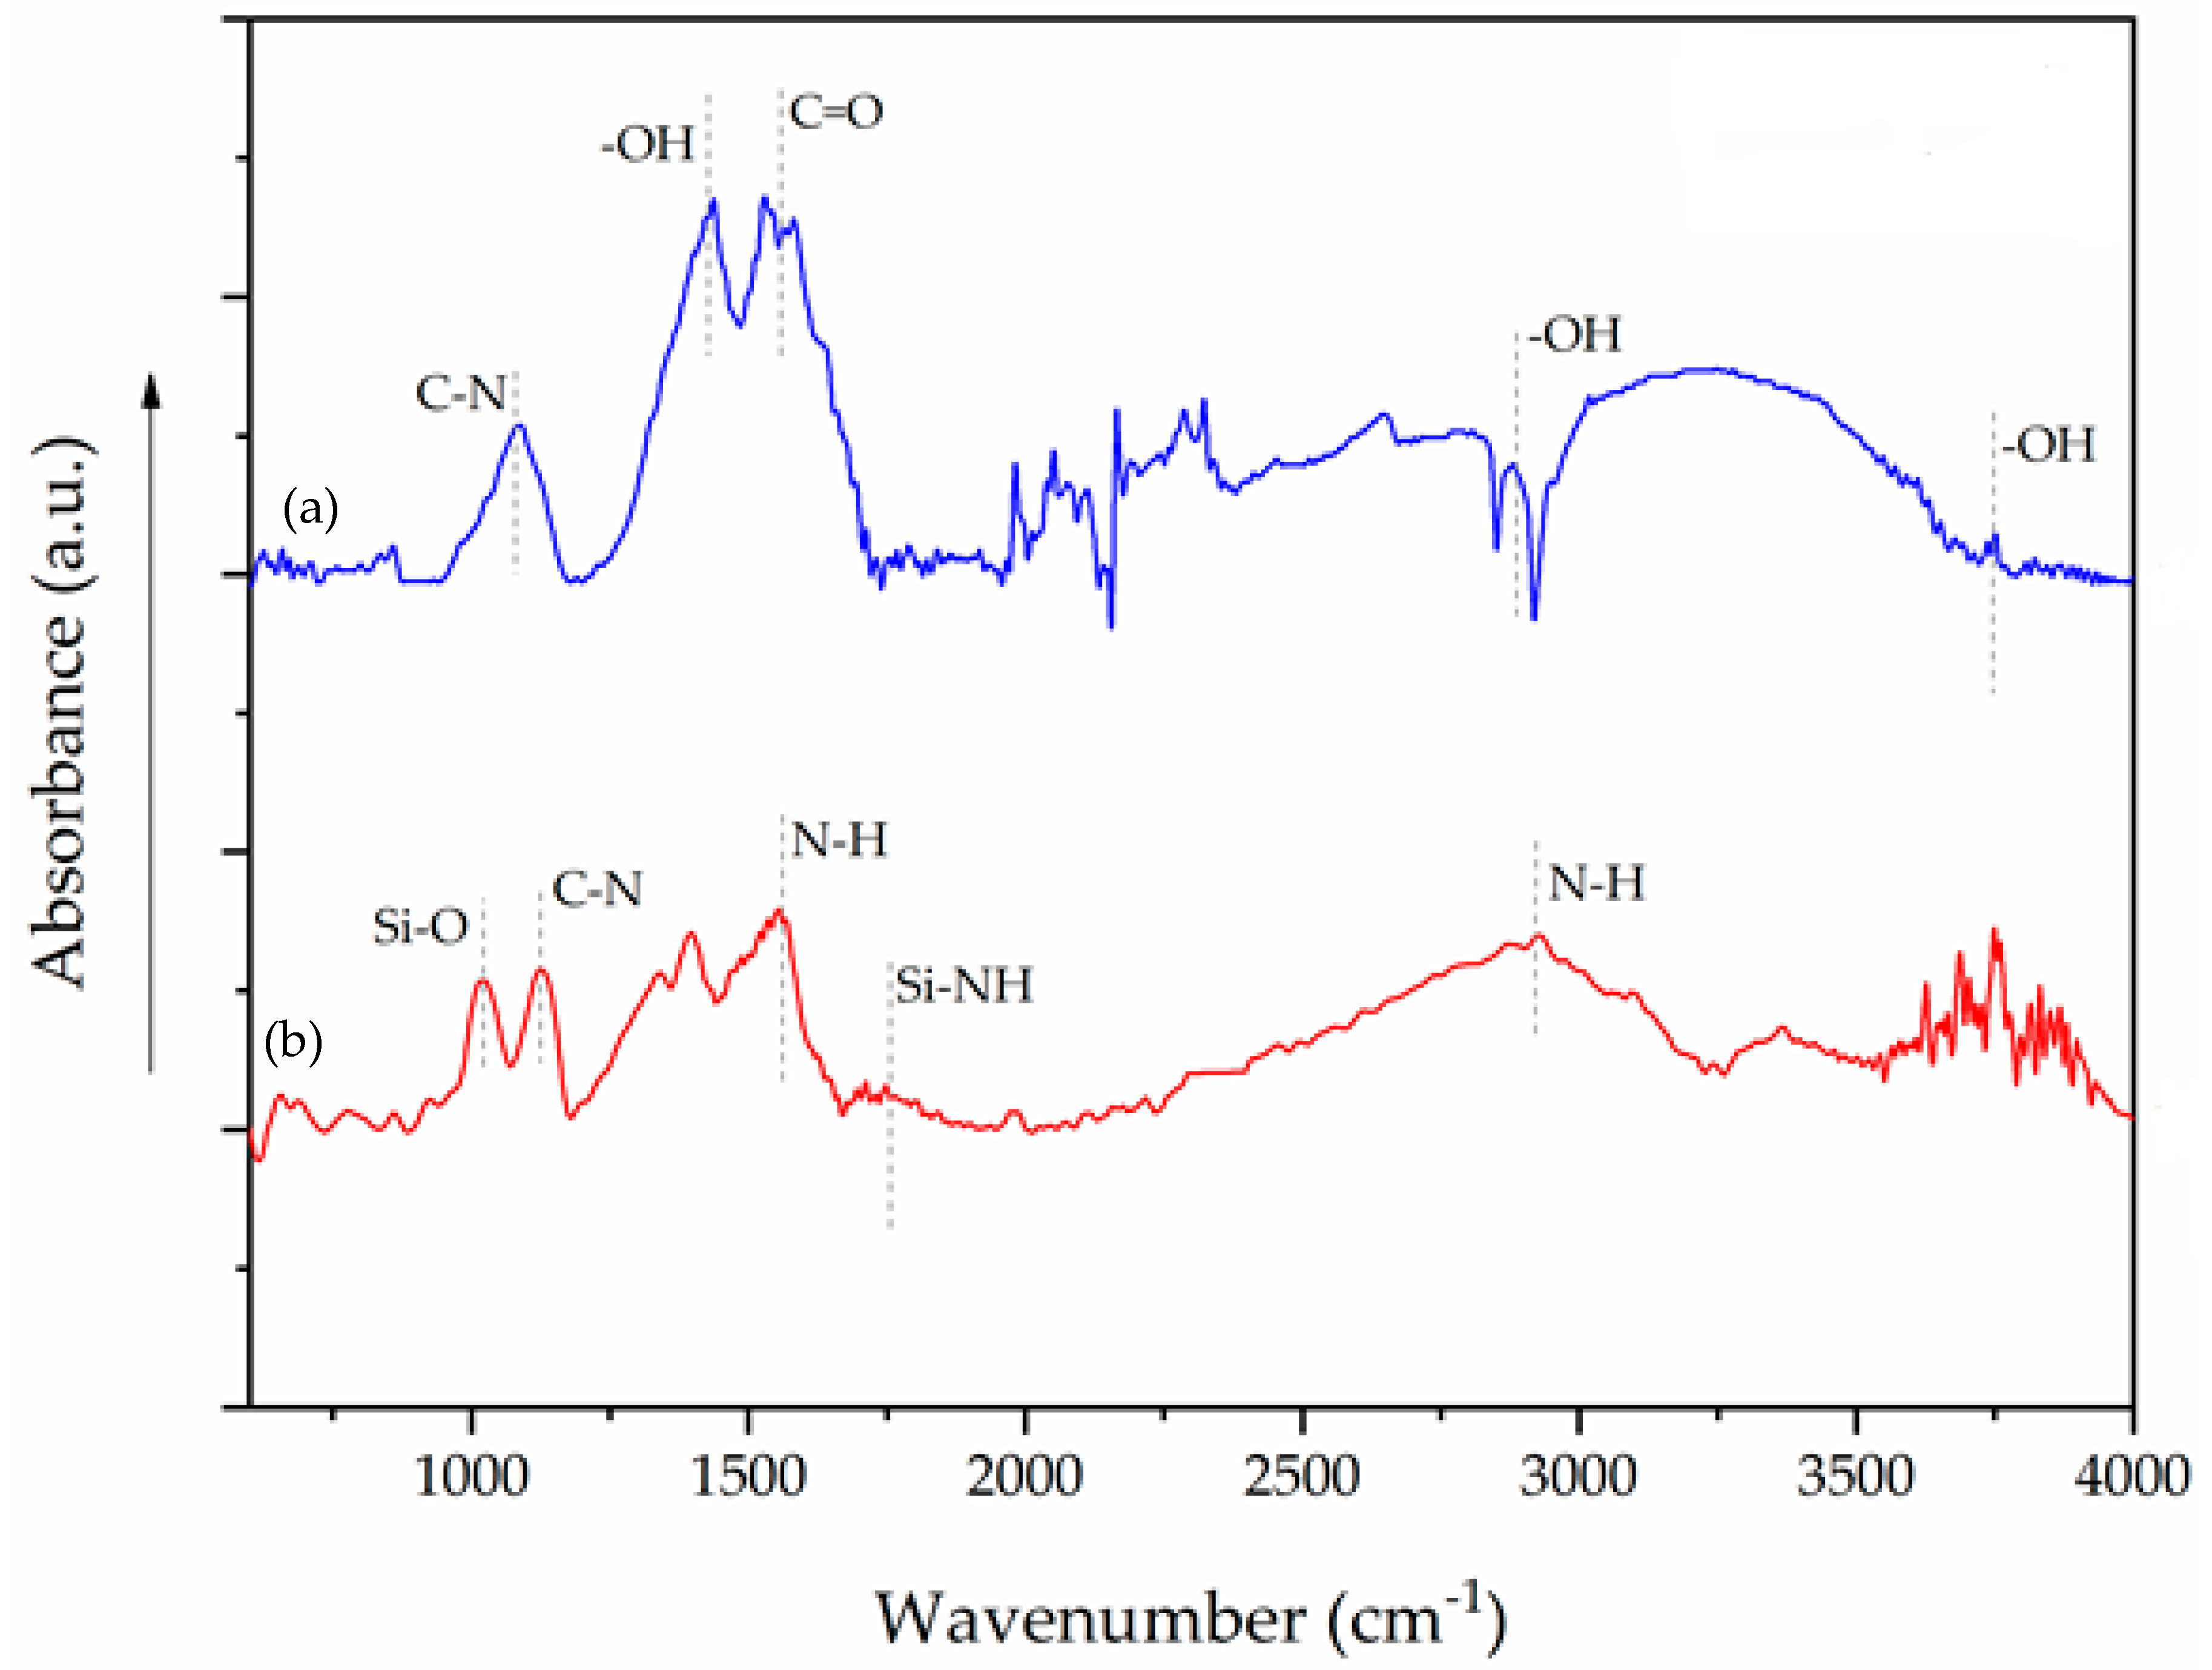
Further assessment of the functional groups was carried out using FTIR. The silanized sample was analyzed to help understand its interaction with the AZ91D substrate. The 0.1% 4 h sample was chosen as a representative of the GO-coated samples. The spectra are shown in Figure 9.
The spectrum of the silanized sample exhibited the characteristic band of –OH groups at 3700 cm−1, indicating the formation of hydroxyl groups in the NaOH pretreatment step and humidity. Characteristic bands of N-H groups were encountered at 3500 cm−1, between 2800 and 3000 cm−1 and 1580–1650 cm−1, followed by the band at 1020–1250 cm−1 that is typical of C-N groups, both due to amino groups of the APTES structure. The bands in the region 1580–1650 cm−1 indicate the presence of aminosilane bonds (Si-NH). Furthermore, bands of Si-O groups (Si-O-Si and O-Si-O) appear in the region 1000–1150 cm−1. The presence of these bands is an evidence of the bonding between the APTES layer and the magnesium alloy substrate [27].
In the spectrum of the 0.1% 4 h sample, the peak at 3700 cm−1 is due to –OH groups in the GO structure and also likely due to humidity in the sample. The bands around 2500–3300 cm−1 and 1440–1395 cm−1 correspond to –OH bonds in carboxyl groups. The absorption peaks around 1650–2000 cm−1 correspond to C-H in the structure of the graphene oxide. The band at 1590 cm−1 indicates the presence of C=O groups in amide groups, indicating that an amidation reaction occurred between the intermediate silane layer and the GO top film [26,27]. The spectrum of the GO-coated sample also exhibits the C-N band at 1020–1250 cm−1, characteristic of the silane layer, but with a lower intensity when compared to the silanized sample.

3.3. Corrosion Behavior

3.3.1. Open Circuit Potential (OCP) and Electrochemical Impedance Spectroscopy (EIS)

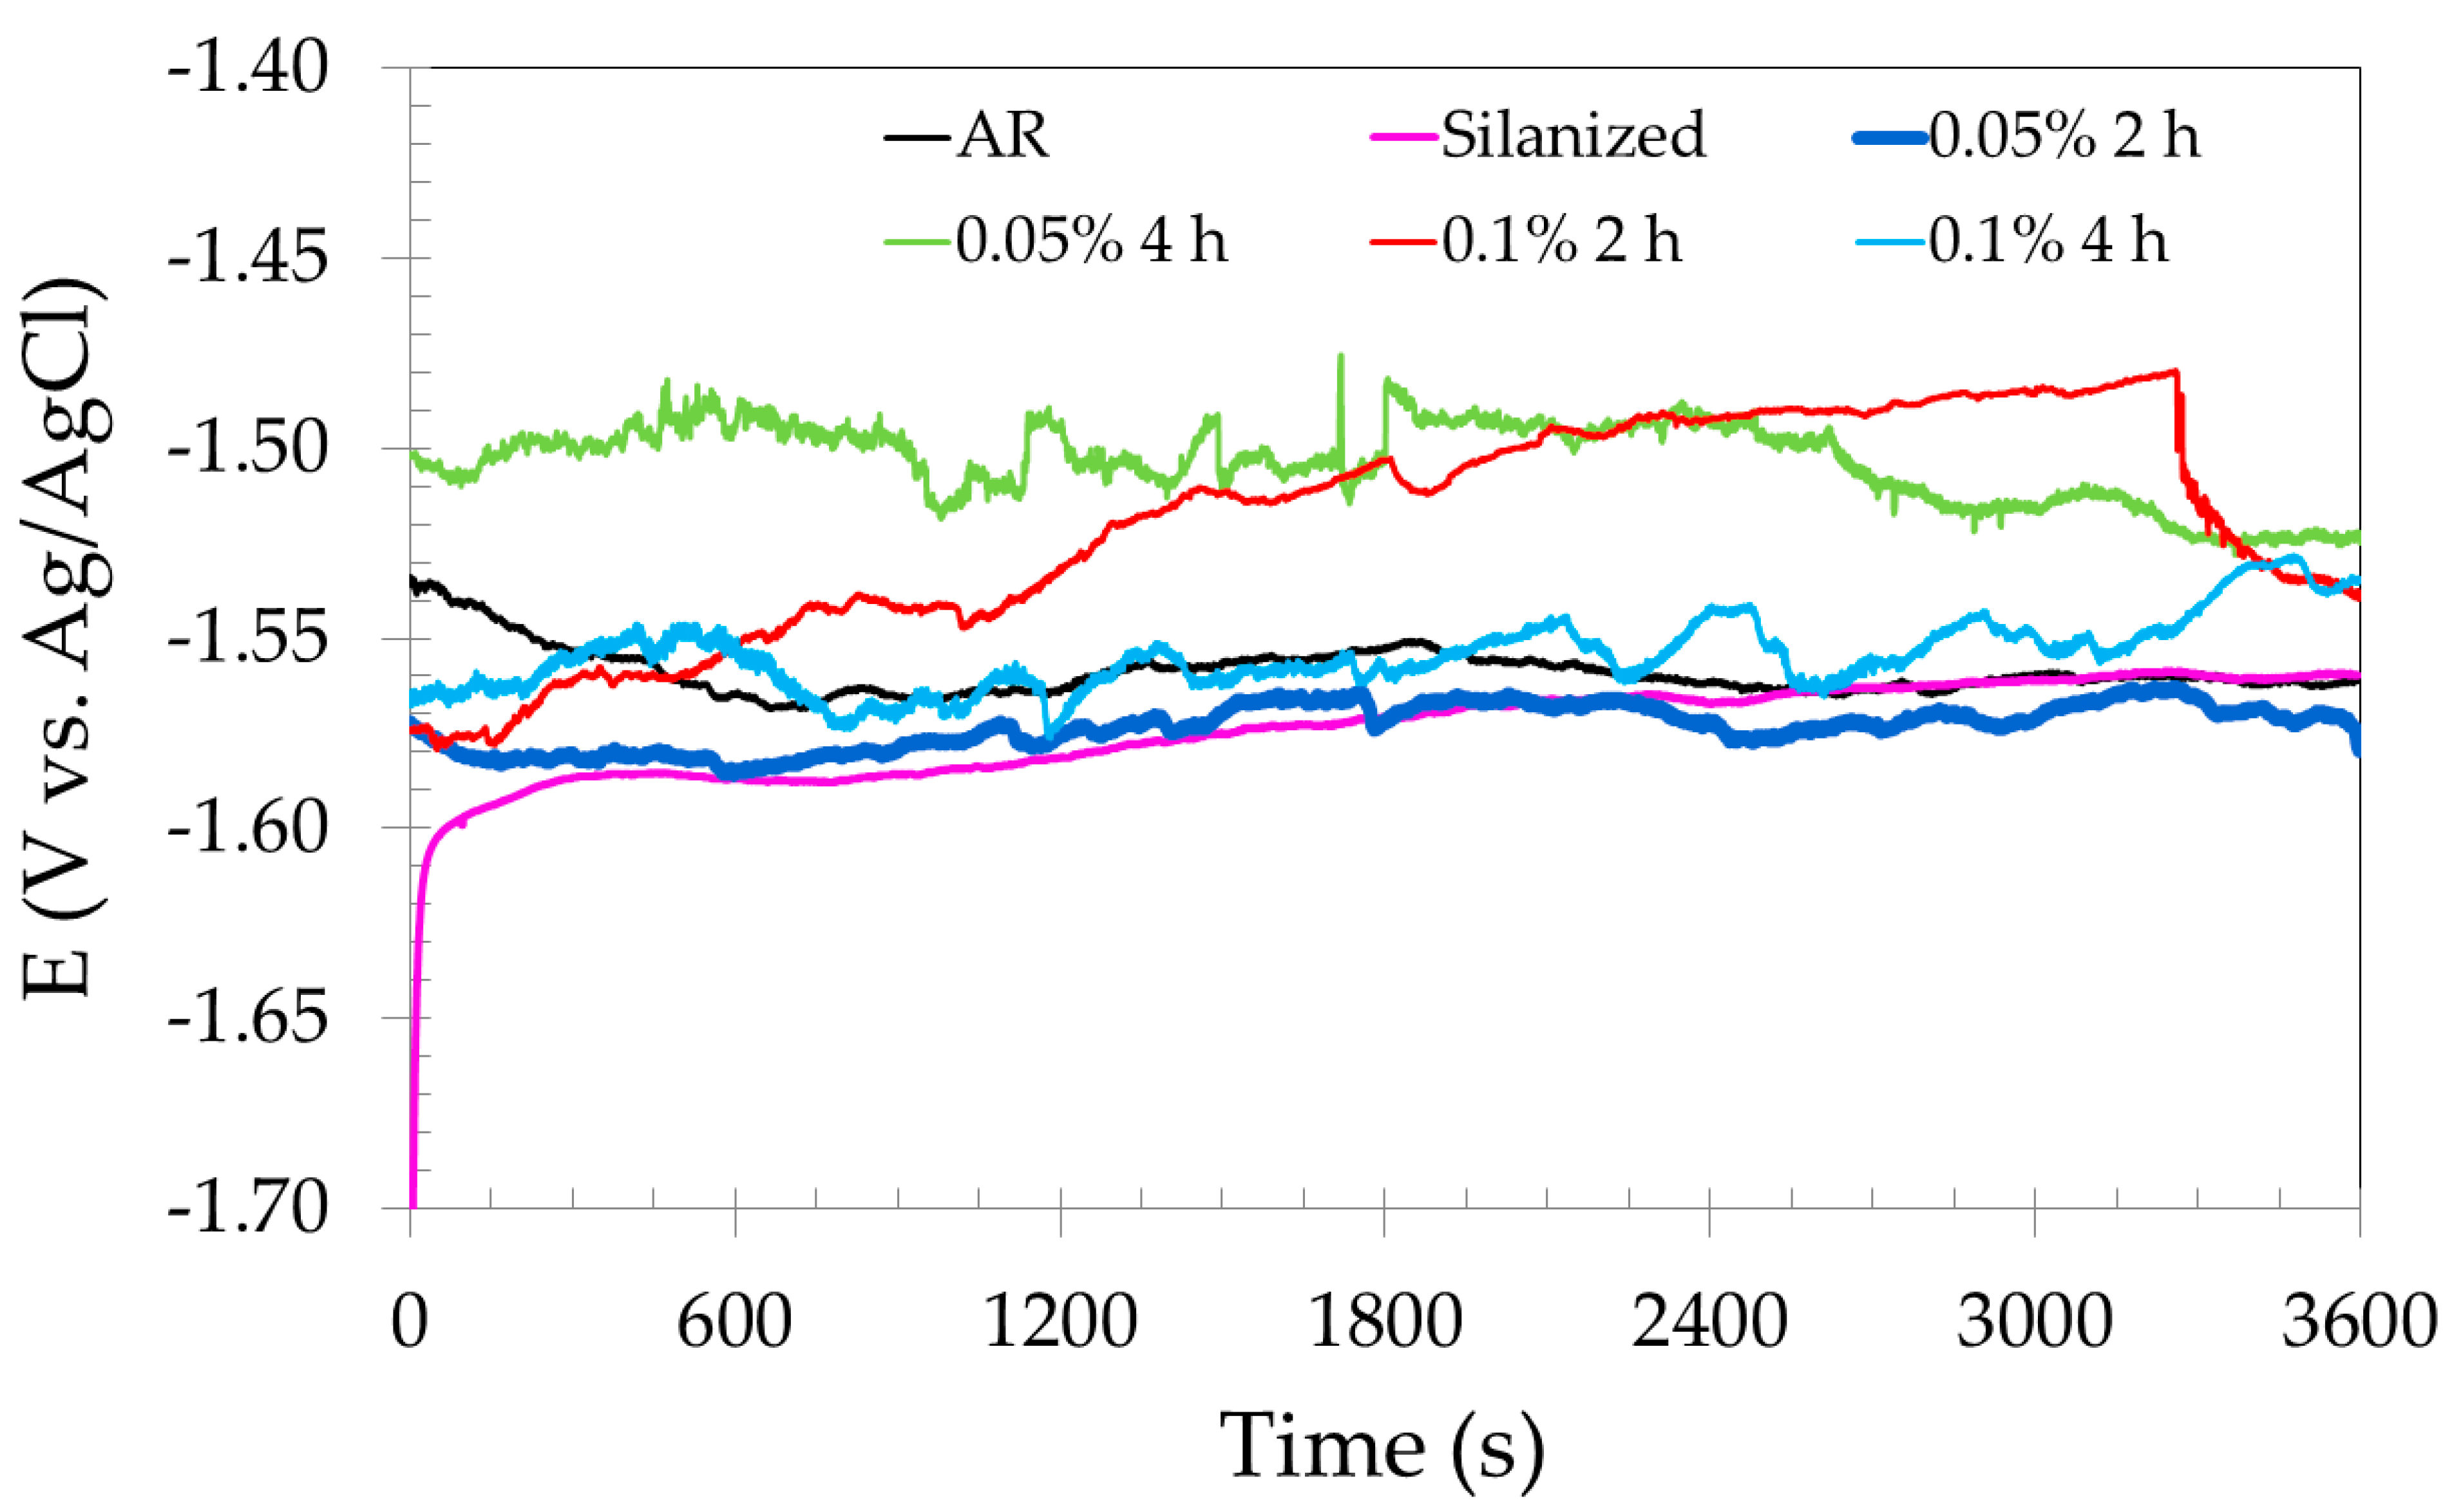
Before the EIS measurements, the open circuit potential (OCP) was monitored for 3600 s. The results are shown in Figure 10. The AR condition presented a gradual decrease in the OCP with time, which is likely associated with the non-protective nature of the naturally formed corrosion film on the surface of the AZ91D electrode [55]. When compared to the AR condition, the silanized sample exhibited a sharp increase in the very beginning of the monitoring period, followed by a gradual ascending trend up to the end of the test, without significant fluctuations. All GO-coated samples also showed an ascending trend, which was less pronounced for the 0.05% 2 h condition. The OCP was shifted to nobler values for the other GO-coated samples [56], suggesting a decrease in the electrochemical activity of the AZ91D substrate, depending on the GO concentration.
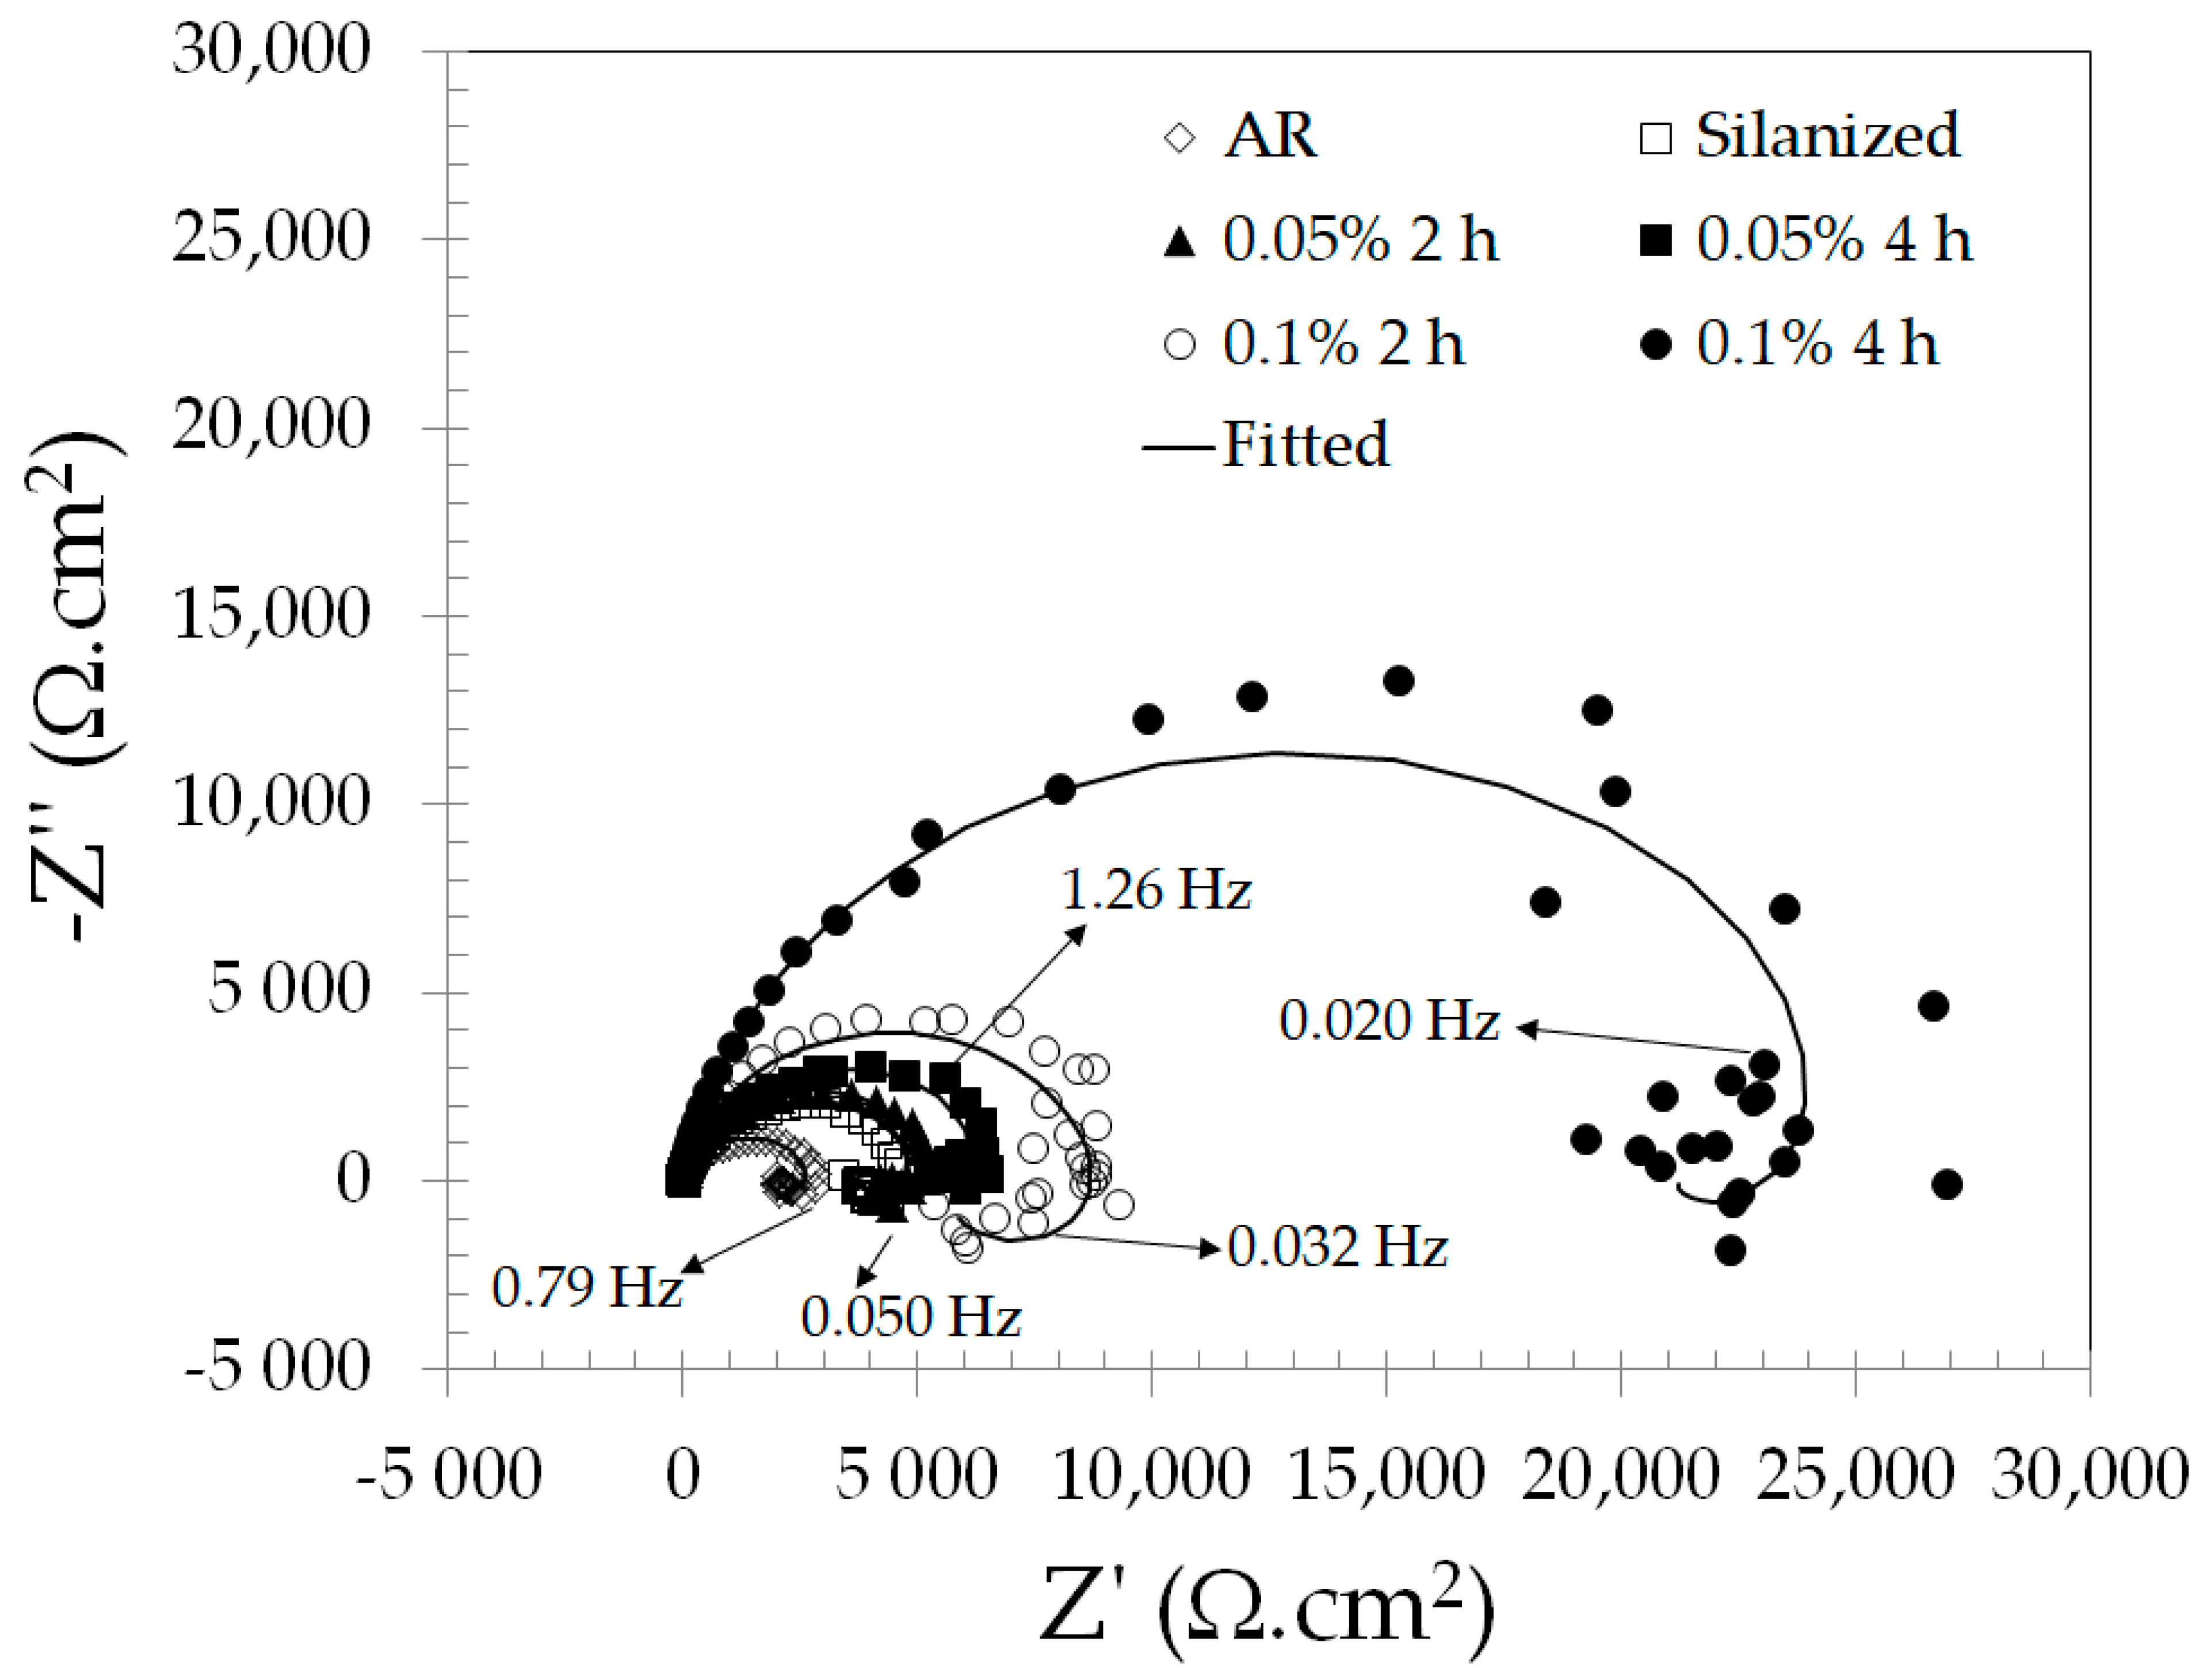
Nyquist plots of the AR, silanized, and GO-coated AZ91D samples are shown in Figure 11. The results were obtained after 1 h of immersion in 3.5 wt.% NaCl solution at room temperature. The AR sample (uncoated AZ91D) exhibited a depressed capacitive loop in the high- to medium-frequency domain, followed by an inductive loop at the lowest frequencies. The silanized (without GO coating) and GO-coated samples displayed similar behavior. The smallest capacitive loop diameter was observed for the uncoated AZ91D alloy. The diameter of the capacitive loop is associated with the corrosion resistance of the electrode surface, being related to its charge in transfer resistance [57,58]. The best corrosion resistance was, therefore, observed for the 0.01% 4 h sample, which displayed the highest impedance values and the largest capacitive loop. Furthermore, two additional features can be noticed from Figure 11. The first one is related to the deposition time: (i) the corrosion resistance was gradually decreased when the deposition time was reduced at the same GO concentration. The second one refers to the effect of GO concentration: (ii) the corrosion resistance increased, as the GO concentration was raised from 0.05% to 0.1% at the same deposition time.
The origin of the low-frequency inductive behavior is due to localized corrosion and relaxation processes of adsorbed corrosion species such as Mg+ads and Mg(OH)+ads [59,60]. This is frequently reported for Mg alloys, being associated with the onset of corrosion processes for uncoated alloys and for coated alloys at the interface between the coating and the substrate [61,62]. Nie et al. [63], for instance, observed that the AZ91D alloy exhibited a low-frequency inductive behavior when exposed to 3.5 wt.% NaCl solution. The authors considered that this behavior was due to the adsorbed Mg+ads during corrosion.
The EIS response of the AZ91D samples can be further evaluated from the Bode plots shown in Figure 12. As seen in Figure 12a, the phase angle plot of the AR condition is characterized by one peak, whose maximum reaches an angle of approximately −71°. The phase angle dropped off below 100 Hz, indicating the onset of corrosion processes. The capacitive response was improved for the silanized sample, as the phase angle peak was shifted to a slightly higher value and dropped off only at lower frequencies. The GO-coated samples displayed more capacitive response with respect to the silanized one, as inferred from the increase in the maximum phase angle that reached up to −80° for the 0.1% 4 h sample. Furthermore, the peak plateau widened for the GO-coated samples when compared to AR, suggesting that one additional time constant can be superimposed. One additional feature is that the phase angles dropped off at lower frequencies for the GO-coated samples, indicating its superior capacitive response and higher corrosion resistance. This is confirmed by the results shown in the |Z| vs. log f plots in Figure 12b. The impedance magnitude at 0.01 Hz is often employed as a measure of the corrosion resistance of the electrode [64,65].
The corrosion protection ability of the GO coating can, therefore, be associated with the results exhibited in Figure 12b. The best corrosion resistance was shown by 0.1% 4 h. In light of the results obtained using EIS, it is possible to correlate the electrochemical behavior of the GO-coated samples with the morphological aspects described in Section 3.1. Based on the SEM micrographs displayed in Figure 2, the GO coating became less defective and more homogeneously spread over the surface as the deposition time and GO concentration increased. In this respect, the 0.1% 4 h sample (Figure 2e) exhibited the best surface morphology, with few defects. According to the EIS results (Figure 11 and Figure 12), it also exhibited the best corrosion resistance. The barrier properties of the GO coating were, therefore, enhanced for this sample, thus improving its corrosion protection ability.
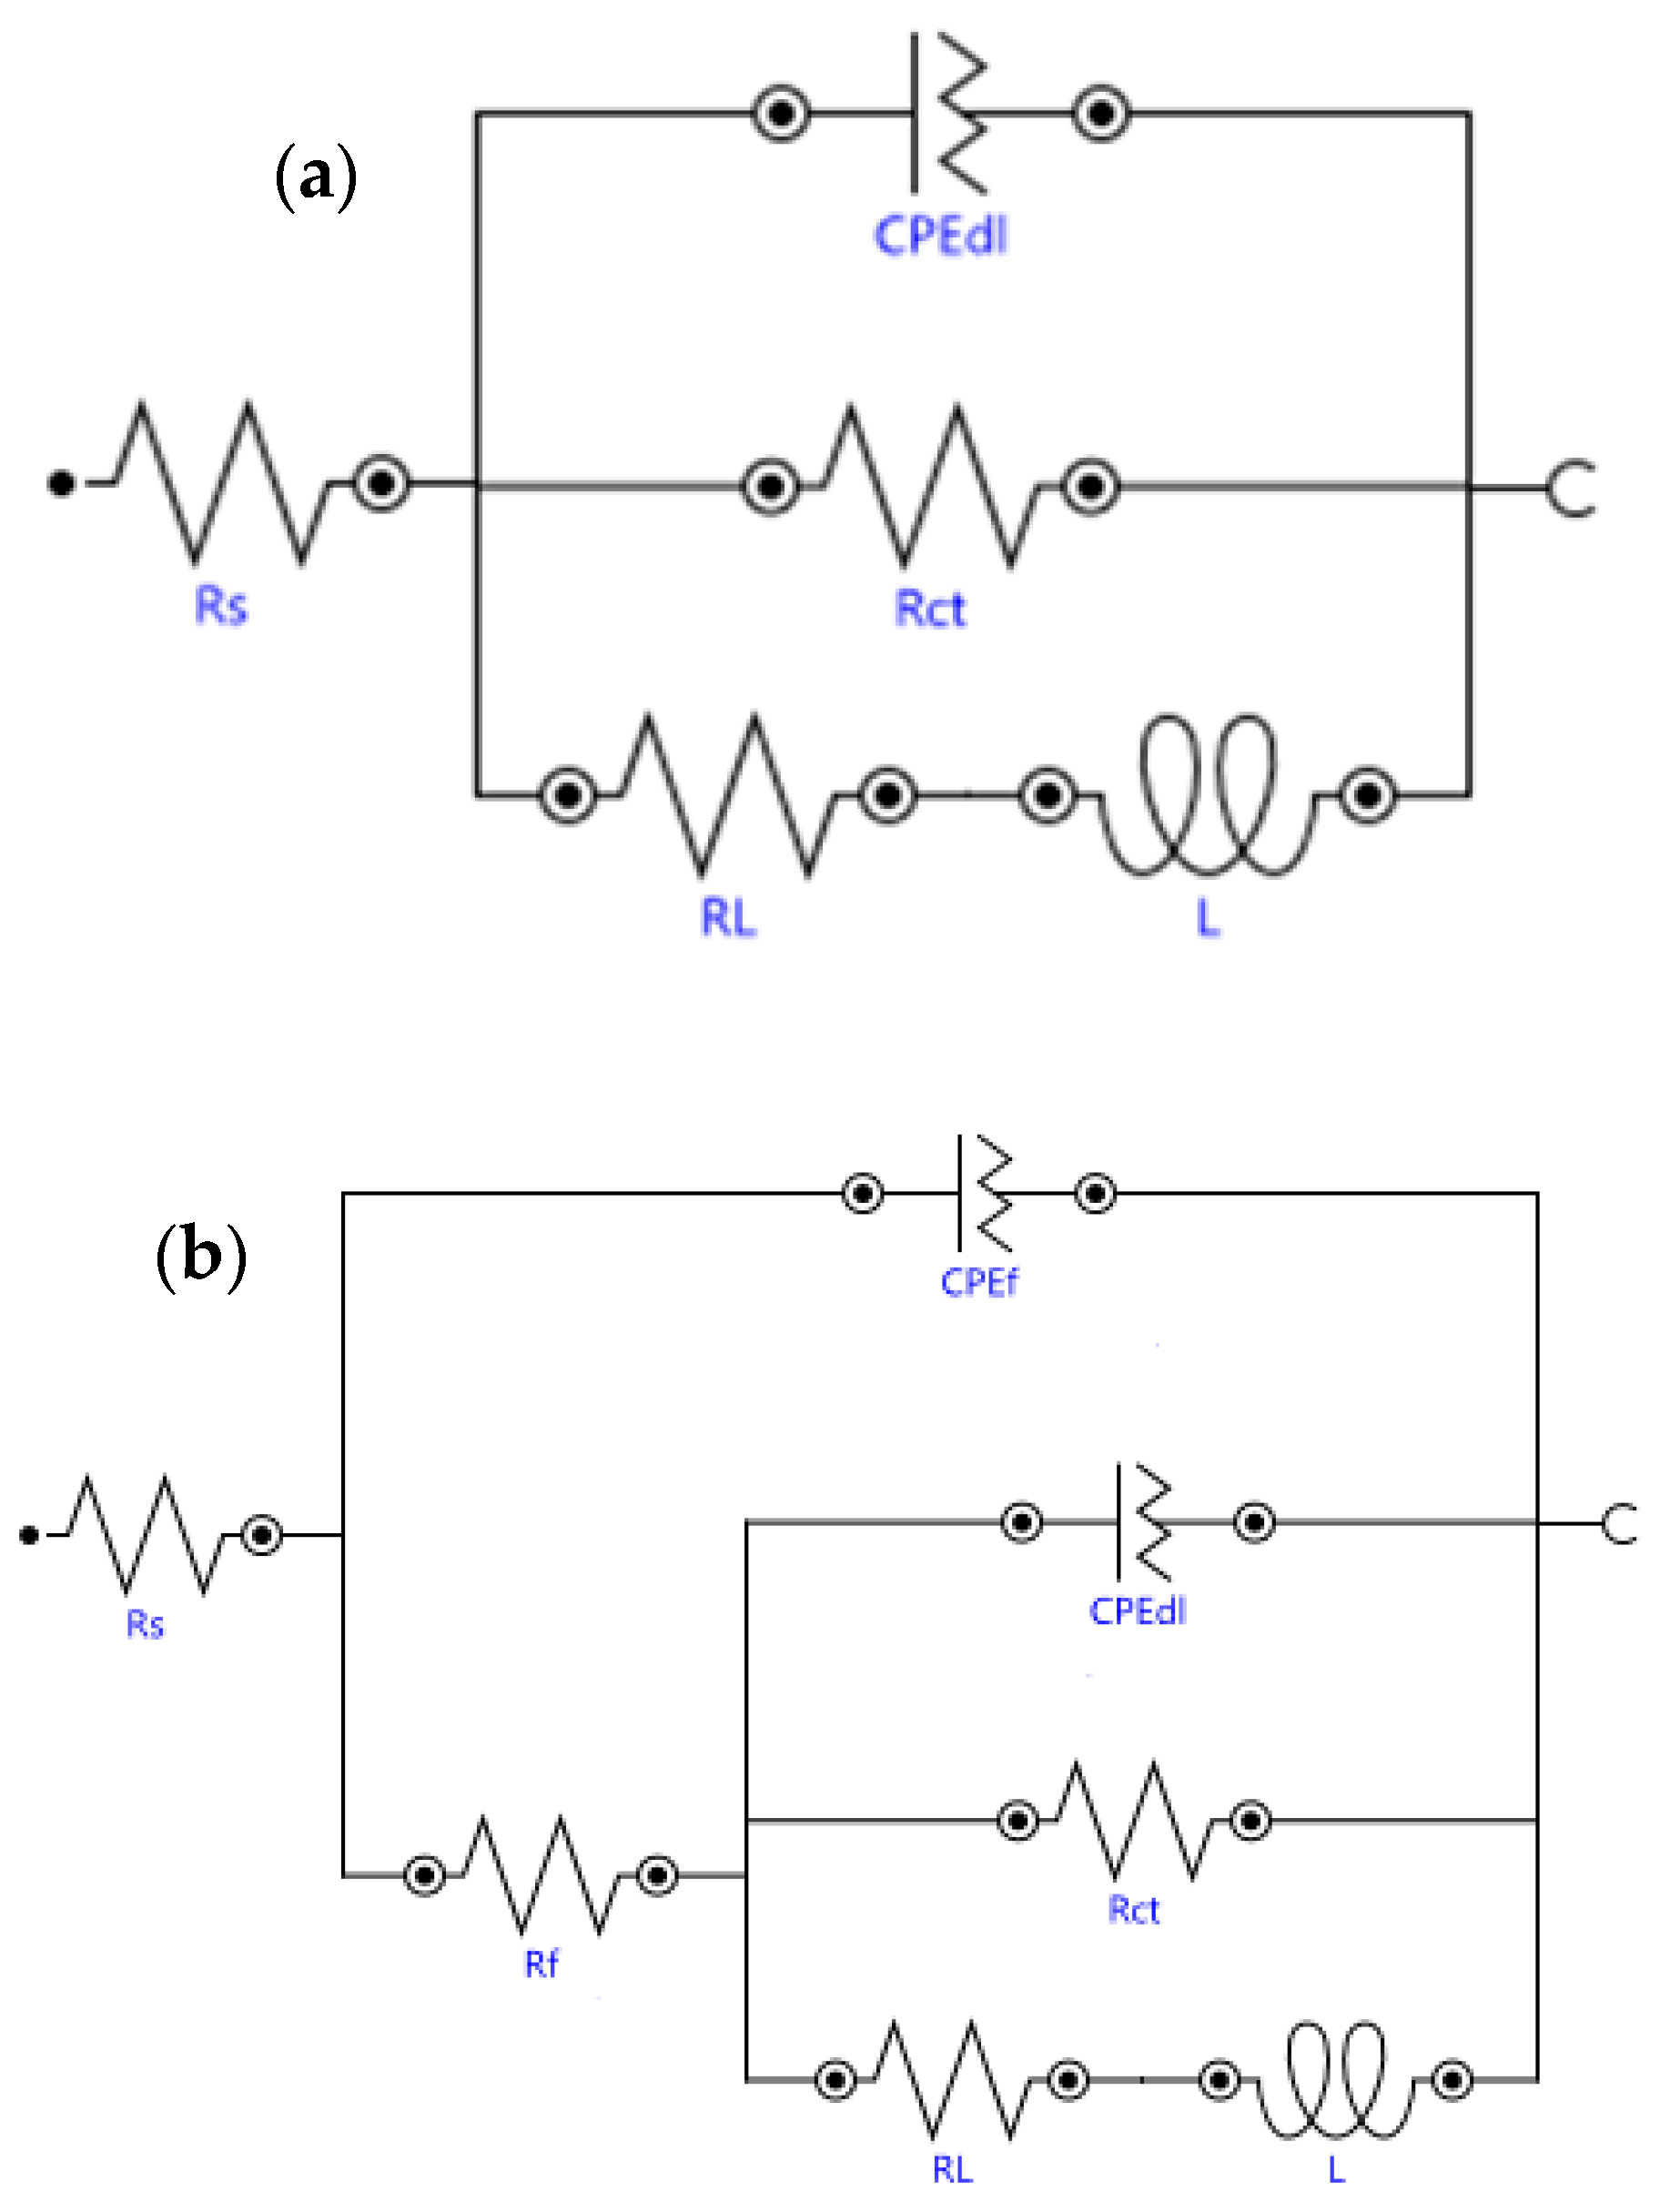
In order to give a quantitative interpretation of the EIS results, equivalent electrical circuits (EECs) were employed to simulate the experimental data. Two different EECs were used to fit the experimental results, as seen in Figure 13. Constant phase elements (CPE) were used instead of pure capacitors due to the heterogeneous nature of the electrode surface [66]. The impedance of a CPE (ZCPE) is expressed as shown in Equation (6), where Q is the CPE magnitude, j is the complex operator, ω is the angular frequency, and n is the CPE exponent (varies between 0 and 1, depending on the capacitive response) [67,68].
Z C P E = 1 Q j ω n
The EEC shown in Figure 13a was used to simulate the EIS response of the AR sample. It consists of the solution resistance (Rs), one high-frequency time constant related to the capacitance of the electrical double layer (CPEdl) and the charge transfer resistance (Rct), and one time constant to model the inductive behavior of the electrode at low frequencies, with the inductive component (L) and its corresponding resistance (RL). This EEC was also proposed by other authors to fit the EIS response of uncoated magnesium alloys in sodium chloride solution [69,70]. One additional time constant was incorporated into the EEC model of the silanized and GO-coated samples to account for the EIS response of the silane and GO layers (Figure 13b), with its capacitance (CPEf) and corresponding resistance (Rf). The other elements have the same physical meaning of those in Figure 13a. This circuit was also employed by other authors to simulate the EIS data of coated Mg alloys [71,72]. The fitted data are displayed in Table 2. The corrosion resistance of the GO-coated samples is mainly due to the resistance of the GO film itself (Rf). The highest Rf value was obtained for the 0.1% 4 h sample, confirming its superior corrosion protection ability, as qualitatively inferred from the Nyquist and Bode plots (Figure 6 and Figure 7). The Rf value of approximately 20 kΩ·cm2 is more than three times higher than that of the second best sample (0.1% 2 h).

3.3.2. Potentiodynamic Polarization Curves

Figure 14 shows the potentiodynamic polarization curves of the different AZ91D samples after 1 h of immersion in 3.5 wt.% NaCl solution at room temperature. The electrochemical parameters determined from these curves are displayed in Table 3. The alloy in the AR condition exhibited active behavior, as denoted by the continuous increase in the current density with the applied potential. The silanized sample also displayed an active behavior, but the polarization curve was shifted to lower current densities, indicating a beneficial role of the APTES layer to slow down the uniform corrosion kinetics of the AZ91D substrate. In these cases, the active dissolution is governed by the corrosion current density (icorr), which was determined by the Tafel extrapolation method, considering only the cathodic branch, as proposed in the literature for Mg alloys [73]. Conversely, all of the GO-coated samples exhibited passive behavior. For these samples, the anodic dissolution is governed by the passive current density (ipass). These values are shown in Table 3, along with the corrosion potential (Ecorr), pitting potential (Epit), and passive range (ΔE = Epit − Ecorr). The values of Ecorr are related to the electrochemical activity of the electrode surface. The pitting potential is associated with the onset of localized corrosion spots. Higher values of Epit denote increased resistance to pitting corrosion, reflecting the stability of the surface film facing chloride-induced localized attack [74]. In the same regard, the passive range (ΔE) is also an indication of the stability of the surface against localized corrosion. High values of ΔE express surface enhancement against the penetration of corrosive species through the coating layer, such as Cl ions [75].
The values of Ecorr varied between −1436 mVAg/AgCl and −1330 mVAg/AgCl, depending on the deposition parameters, which are compatible with other published results for GO-coated Mg alloys and for the uncoated AZ91D alloy in sodium chloride solution [27,71]. Although the Ecorr values were not significantly improved by the GO films, the results shown in Table 3 reveal an evident decrease in the corrosion kinetics of the AZ91D alloy after deposition, as denoted by the lower values of icorr and the passive character of the GO-coated samples. The icorr of the AR condition was found to be 5.6 µA·cm2, which is in the same order of magnitude as the results published by Jiang et al. [76] and Peng et al. [77] for the bare AZ91D alloy in 3.5 wt.% NaCl solution. The corrosion current density was decreased by one order of magnitude after deposition of the GO film. Neupane et al. [27] obtained an icorr of 2.7 µA·cm2 for GO-coated pure Mg. Tong et al. [26], in turn, obtained an icorr of 8.4 µA·cm2 for a Mg-Zn-Ca coated with a GO film combined with an intermediate coupling silane layer. Thus, the results obtained in the present work point to a further improvement with respect to other published data. Moreover, the anodic dissolution was slowed down, as the coated samples exhibited passive behavior. As shown in Table 3, the highest Epit and widest passive range were obtained for the 0.1% 4 h sample. This result is consistent with the EIS data discussed in Section 3.3.1, confirming that the 0.1% 4 h sample maximized the barrier properties of the GO film.

4. Discussion

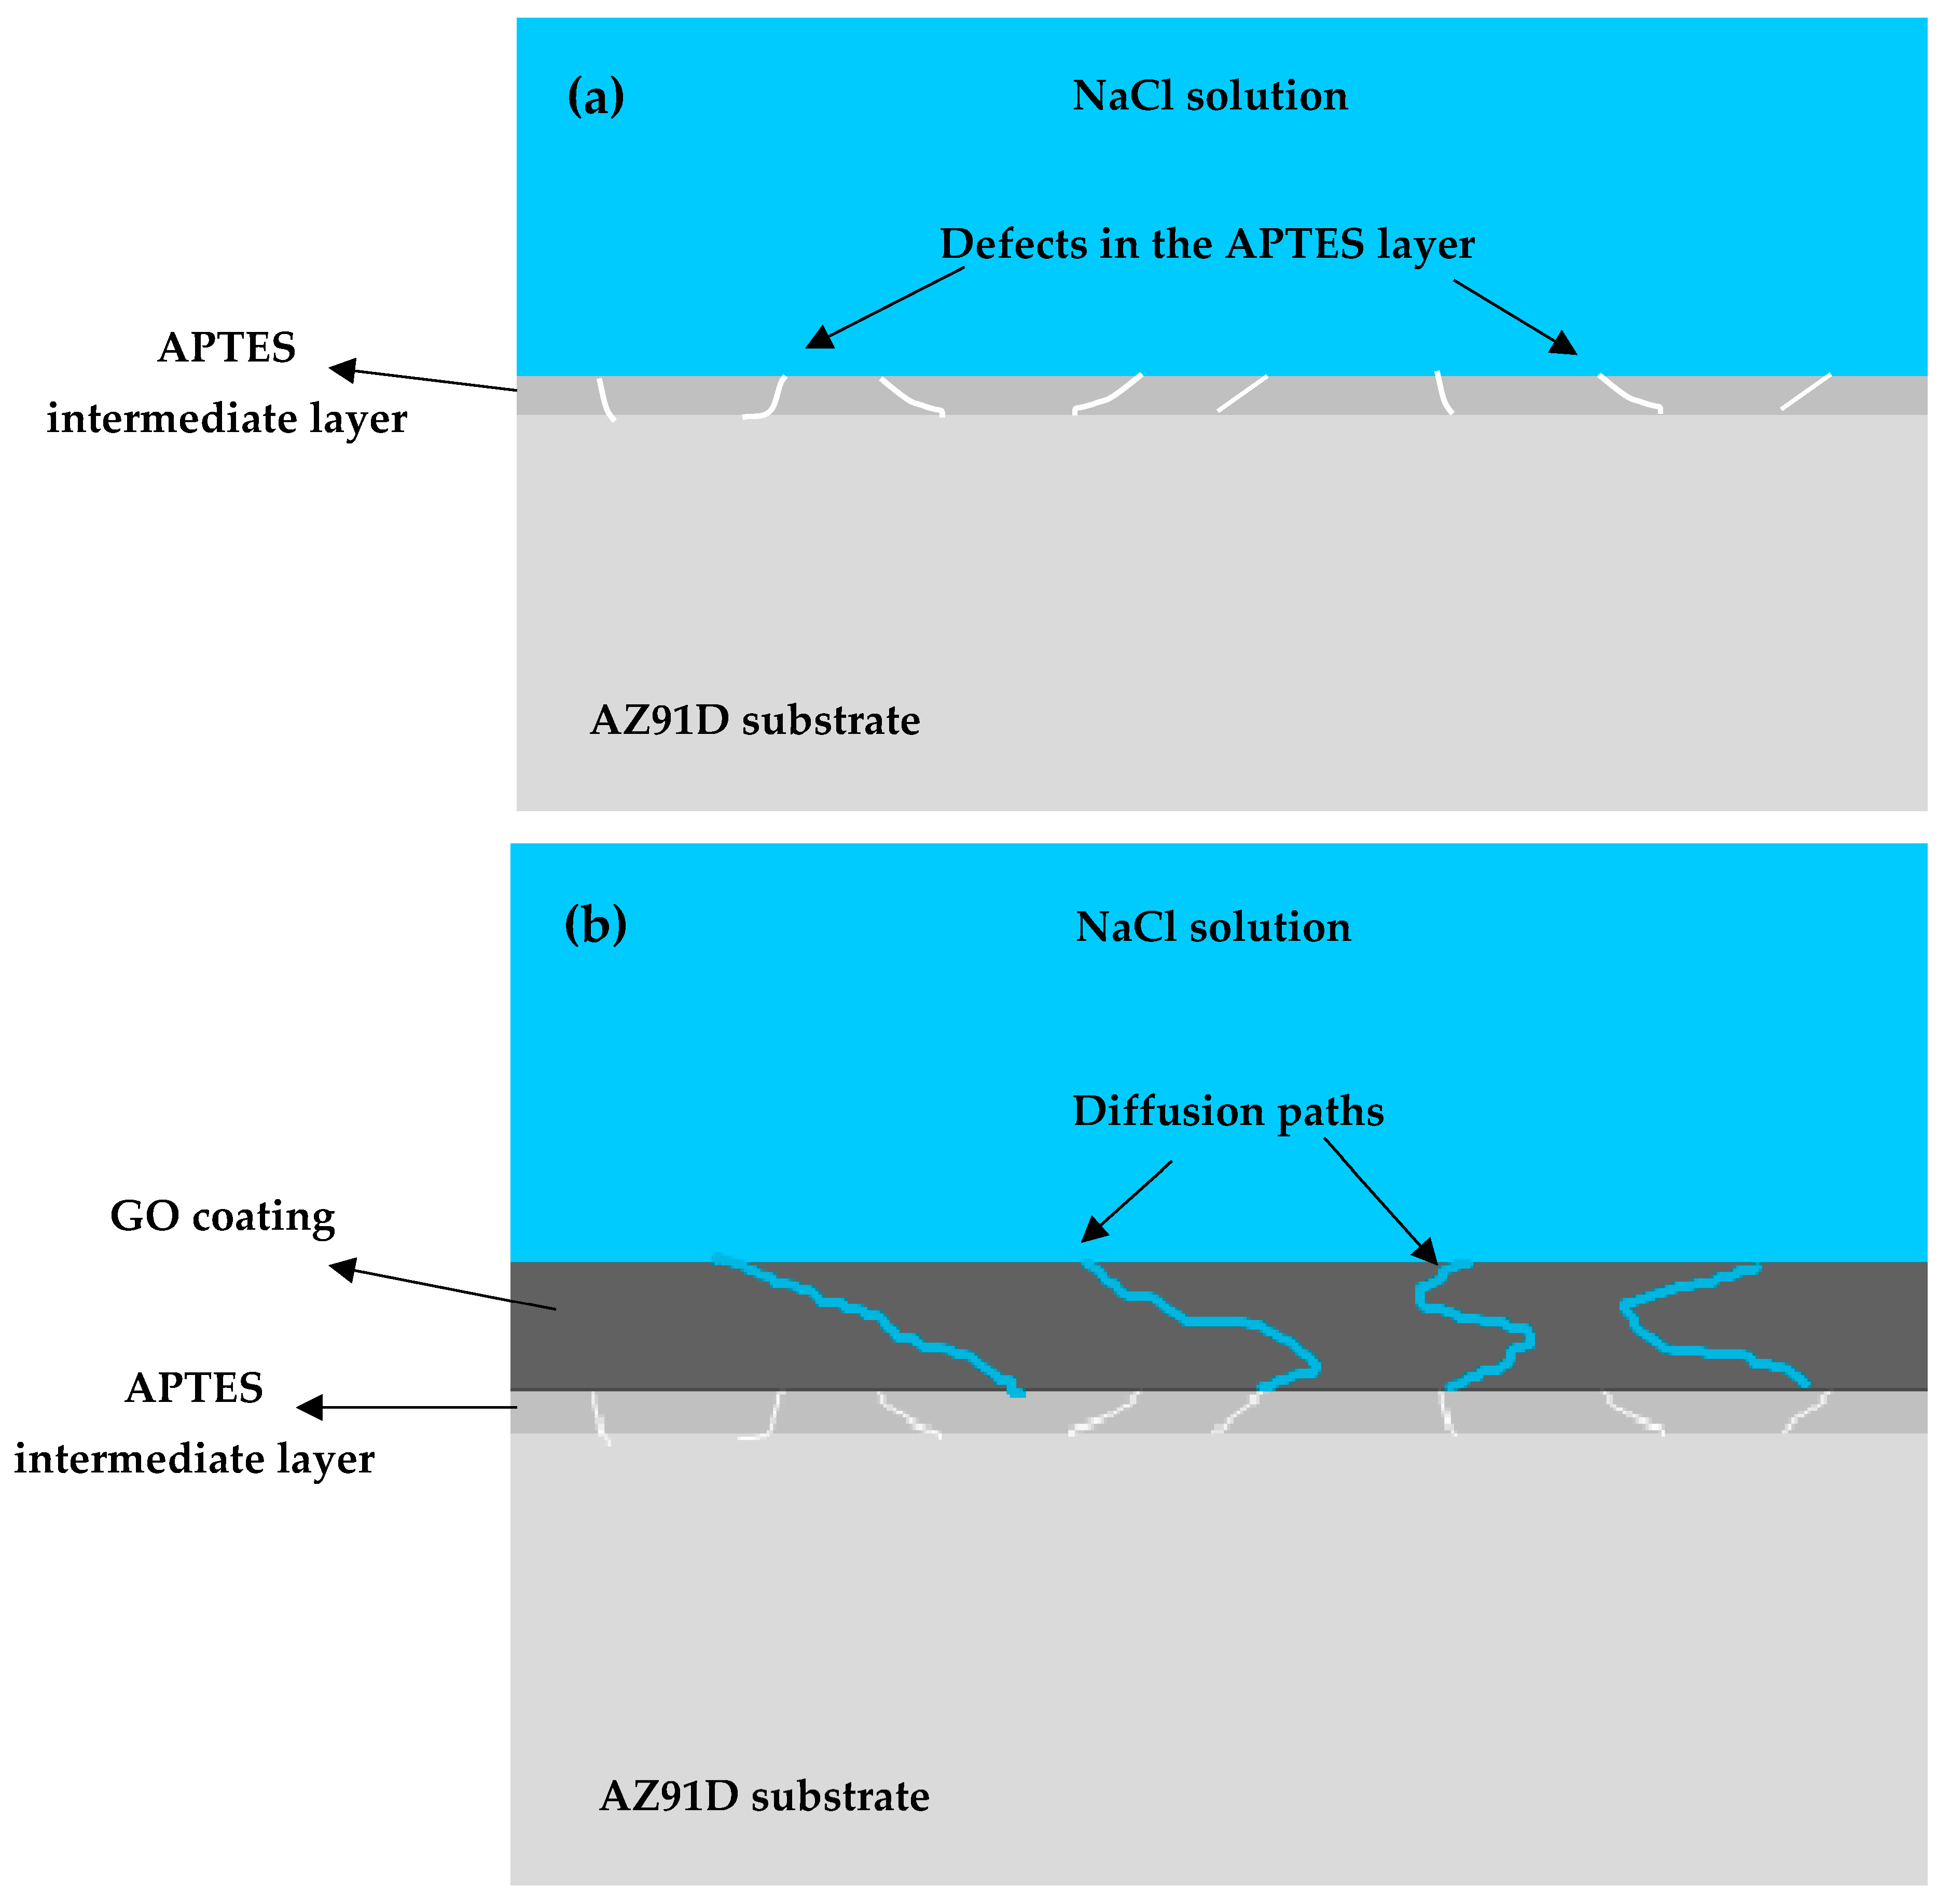
The corrosion protection mechanism of the GO-coated samples can be derived based on the results described in the previous sections, as illustrated in Figure 15.
As inferred from the XPS and FTIR spectra, the silanized sample adhered to the AZ91D substrate through Si-O bonds, forming the intermediate layer. However, the corrosion protection ability of this layer, in spite of showing increased impedance and lower corrosion current density than the magnesium alloy substrate, was relatively weak due to intrinsic defects such as microcracks in the silane layer, as illustrated in Figure 15a.
The GO topcoat increased the diffusion path of the corrosive electrolyte by forming an additional layer over the APTES intermediate film (Figure 15b). The bonding between the silane film and the GO topcoat was observed using FTIR (Section 3.2), as indicating by the presence of amide-type groups arising from the amidation reaction between APTES and GO [26]. As a consequence, the corrosion resistance of the GO-coated samples was improved with respect to either the AZ91D substrate or the silanized layer. The corrosion protection ability of the GO films was higher depending on the compactness of the GO topcoat.
The role of the GO coating was to act a physical separation between the corrosive environment and the AZ91D substrate. Based on the SEM micrographs shown in Section 3.1, the surface morphology of the GO films was enhanced for the 0.1% 4 h sample, as denoted by its smooth and homogeneous topography (Figure 2e). The XPS results discussed in Section 3.2 have also confirmed this result, as suggested by the absence of the NaKLL Auger peak in the O 1s high-resolution spectrum of the 0.1% 4 h sample (Figure 6b) and its presence in the corresponding spectra of the other GO-coated samples (Figure 7). As mentioned before, this peak is due to the initial NaOH surface pretreatment conducted before silanization. Hence, as the deposition time and GO concentration increased, this peak was no longer observed, indicating that the GO film more homogeneously spread over the surface. This is also an indirect indication that coating thickness increased with the deposition time, which also influenced the corrosion resistance of the GO-coated samples. Because of the enhanced surface topography, the corrosion resistance was improved, as the barrier properties of the GO film were optimized.

5. Conclusions

In the present work, graphene oxide (GO) coatings were effectively deposited on the surface of a silanized AZ91D Mg alloy substrate by immersion in aqueous solutions with 0.05 wt.% and 0.1 wt.% of the carbon-based nanometer material. The effects of deposition time and GO concentration on the coating morphology, surface chemistry, and corrosion behavior were investigated.
The surface morphology was improved as the deposition time and GO concentration increased, obtaining less defective and more homogeneously distributed films. The film formed in the solution with a GO concentration of 0.1 wt.% for 4 h exhibited the more compact surface morphology.
The GO films consisted of C=C, C-C, C-OH, C=O, and O-C=O bonds. The O 1s XPS high-resolution spectra were useful to confirm the integrity of the GO coatings. The presence of a NaKLL Auger peak in the O 1s spectrum, which was due to the signal originated from the NaOH pretreatment of the AZ91D substrate, was not observed for the 0.1% 4 h sample, while it was present in the O 1s spectra of all of the other GO-coated samples.
Due to the best surface coverage and film integrity, the 0.1% 4 h sample displayed the best corrosion resistance, as indicated by its high impedance, low corrosion current density, and wide passive range.

Supplementary Materials

The following supporting information can be downloaded at: https://www.mdpi.com/article/10.3390/met14091019/s1, Figure S1: XPS survey spectra of pure GO (a) and GO-coated samples: (b) 0.1% 2 h; (c) 0.05% 4 h; (d) 0.05% 2 h. Figure S2: C 1s high resolution spectra of GO-coated samples: (a) 0.1% 2 h; (b) 0.05% 4 h; (c) 0.05% 2 h. Figure S3. N 1s high resolution spectra of GO-coated samples: (a) 0.1% 2 h; (b) 0.05% 4 h; (c) 0.05% 2 h. Figure S4. Si 2p high resolution spectra of GO-coated samples: (a) 0.1% 2 h; (b) 0.05% 4 h; (c) 0.05% 2 h.

Author Contributions

Conceptualization, R.A.A.; methodology, N.S.d.S., L.A.d.O., A.C.A., J.A.d.S.P. and R.A.A.; validation, N.S.d.S. and R.A.A.; investigation, N.S.d.S., A.C.A., J.A.d.S.P., L.A.d.O. and M.C.L.d.O.; writing—original draft preparation, M.C.L.d.O. and R.A.A.; writing—review and editing, M.C.L.d.O. and R.A.A.; supervision, R.A.A.; project administration, R.A.A. All authors have read and agreed to the published version of the manuscript.

Funding

Brazilian Agency CAPES (Finance Code 001).

Data Availability Statement

The original contributions presented in the study are included in the article/Supplementary Material, further inquiries can be directed to the corresponding author.

Acknowledgments

The authors are grateful to the Multiuser Experimental Facilities (CEM) of the Federal University of the ABC for the infrastructure necessary to develop this work. Rima Industrial Magnésio S/A (Belo Horizonte, Brazil) is acknowledged for kindly providing the AZ91D alloy used in this study.

Conflicts of Interest

The authors declare no conflicts of interest.

References

  1. Castellanos, A.; Altube, A.; Veja, J.M.; García-Lecina, E.; Díez, J.A.; Grande, H.J. Effect of different post-treatments on the corrosion resistance and tribological properties of AZ91D magnesium alloy coated PEO. Surf. Coat. Technol. 2015, 278, 99–107. [Google Scholar] [CrossRef]
  2. Liu, B.; Yang, J.; Zhang, X.; Yang, Q.; Zhang, J.; Li, X. Development and application of magnesium alloy partis for automotive OEMs: A review. J. Magnes. Alloys 2023, 11, 15–47. [Google Scholar] [CrossRef]
  3. Jouini, N.; Ruslan, M.S.M.; Ghani, J.A.; Haron, C.H.C. Sustainable high-speed milling of magnesium alloy AZ91D in dry and cryogenic conditions. Sustainability 2023, 15, 3760. [Google Scholar] [CrossRef]
  4. Gobara, M.; Shamekh, M.; Akid, R. Improving the corrosion resistance of AZ91D magnesium alloy through reinforcement with titanium carbides and borides. J. Magnes. Alloys 2015, 3, 112–120. [Google Scholar] [CrossRef]
  5. Wu, T.; Zhang, K. Corrosion and protection of magnesium alloys: Recent advances and future perspectives. Coatings 2023, 13, 1533. [Google Scholar] [CrossRef]
  6. Jiang, M.; Wu, J.; Zhu, J. One-step preparation of silicate coatings on AZ91D magnesium alloy surface for boosting its corrosion resistance. Silicon 2024, 16, 1147–1159. [Google Scholar] [CrossRef]
  7. Zeng, R.-C.; Zhang, F.; Lan, Z.-D.; Cui, H.-Z.; Han, E.-H. Corrosion resistance of calcium-modified zinc phosphate conversion coatings on magnesium-aluminium alloys. Corros. Sci. 2014, 88, 452–459. [Google Scholar] [CrossRef]
  8. Ashassi-Sorkhabi, H.; Moradi-Alavian, S.; Kazempour, A. Salt-nanoparticle systems incorporated into sol-gel coatings for corrosion protection of AZ91 magnesium alloy. Prog. Org. Coat. 2019, 135, 475–482. [Google Scholar] [CrossRef]
  9. Grimm, M.; Lohmüller, A.; Singer, R.F.; Virtanen, S. Influence of the microstructure on the corrosion behavior of cast Mg-Al alloys. Corros. Sci. 2019, 155, 195–208. [Google Scholar] [CrossRef]
  10. Su, Y.; Lin, J.; Su, Y.; Zai, W.; Li, G.; Wen, C. Investigation on composition, mechanical properties, and corrosion resistance of Mg-0.5Ca-X (Sr, Zr, Sn) biological alloy. Scanning 2018, 2018, 6519310. [Google Scholar] [CrossRef]
  11. Pezzato, L.; Coelho, L.B.; Bertolini, R.; Settimi, A.G.; Brunelli, K.; Olivier, M.; Dabalà, M. Corrosion and mechanical properties of plasma electrolytic oxidation-coated AZ80 magnesium alloy. Mater. Corros. 2019, 70, 2103–2112. [Google Scholar] [CrossRef]
  12. Murakami, K.; Hino, M.; Nakai, K.; Kobayashi, S.; Saijo, A.; Kanadani, T. Mechanism of corrosion protection of anodized magnesium alloys. Mater. Trans. 2008, 49, 1057–1064. [Google Scholar] [CrossRef]
  13. Chen, X.B.; Birbilis, N.; Abbott, T.B. Review of corrosion-resistant conversion coatings for magnesium and its alloys. Corrosion 2011, 67, 035005-1–035005-16. [Google Scholar] [CrossRef]
  14. Khiabani, A.B.; Ghanbari, A.; Yarmand, B.; Zamanian, A.; Mozafari, M. Improving corrosion behavior and in vitro bioactivity of plasma electrolytic oxidized AZ91 magnesium alloy using calcium fluoride containing electrolyte. Mater. Lett. 2018, 212, 98–102. [Google Scholar] [CrossRef]
  15. Hoche, H.; Groβ, S.; Oechsner, M. Development of new PVD coatings for magnesium alloys with improved corrosion properties. Surf. Coat. Technol. 2014, 259, 102–108. [Google Scholar] [CrossRef]
  16. Ding, R.; Li, W.; Wang, X.; Gui, T.; Li, B.; Han, P.; Tian, H.; Liu, A.; Wang, X.; Liu, X.; et al. A brief review of corrosion protective films and coatings based on graphene and graphene oxide. J. Alloys Compd. 2018, 764, 1019–1055. [Google Scholar] [CrossRef]
  17. Zhu, Y.; Murali, S.; Cai, W.; Li, X.; Suk, J.W.; Potts, J.R.; Ruoff, R.S. Graphene and graphene oxide: Synthesis, properties and applications. Adv. Mater. 2010, 22, 3906–3924. [Google Scholar] [CrossRef]
  18. Torrisi, L.; Sllipigni, L.; Cutroneo, M. Radiation effects of IR laser on graphene oxide irradiated in vacum and in air. Vacuuum 2018, 153, 122–131. [Google Scholar] [CrossRef]
  19. Kang, D.; Kwon, J.Y.; Cho, H.; Sim, J.; Hwang, H.S.; Kim, C.S.; Kim, Y.J.; Ruoff, R.S.; Shin, H.S. Oxidation resistance of iron and copper foils coated with reduced graphene oxide multilayers. ACS Nano 2012, 6, 7763–7769. [Google Scholar] [CrossRef]
  20. Medeliene, V.; Stankevic, V.; Griguceviciene, A.; Selskiene, A.; Bikulcius, G. The study of corrosion and wear resistance of copper composite coatings with inclusion of carbon nanomaterials in the copper metal matrix. Mater. Sci. 2011, 17, 132–139. [Google Scholar] [CrossRef]
  21. Mahato, N.; Cho, M.W. Graphene integrated polyaniline nanostructured composite coating for protecting steels from corrosion: Synthesis, characterization, and protection mechanism of the coating material in acidic environment. Constr. Build Mater. 2016, 115, 618–633. [Google Scholar] [CrossRef]
  22. Bakhsheshi-Rad, H.R.; Hamzah, E.; Kasiri-Asgarani, M.; Saud, S.N.; Yaghoubidoust, F.; Akbari, E. Structure, corrosion behavior, and antibacterial properties of nano-silica/graphene oxide coating on biodegradable magnesium alloy for biomedical applications. Vacuum 2016, 131, 106–110. [Google Scholar] [CrossRef]
  23. Ho, C.-H.; Huang, S.-M.; Lee, S.-T.; Chang, Y.-J. Evaluation of synthesized graphene oxide as corrosion protection film coating on steel substrate by electrophoretic deposition. Appl. Surf. Sci. 2019, 477, 226–231. [Google Scholar] [CrossRef]
  24. Li, P.F.; Zhou, H.; Cheng, X.-H. Nano/micro tribological behaviors of a self-assembled graphene oxide nanolayer on Ti/titanium alloy substrates. Appl. Surf. Sci. 2013, 285, 937–944. [Google Scholar] [CrossRef]
  25. Li, P.F.; Zhou, H.; Cheng, X. Investigation of a hydrothermal reduced graphene oxide nano coating on Ti substrate and its nano-tribological behavior. Surf. Coat. Technol. 2014, 254, 298–304. [Google Scholar] [CrossRef]
  26. Tong, L.B.; Zhang, J.B.; Xu, C.; Wang, X.; Song, S.Y.; Jiang, Z.H.; Kamado, S.; Cheng, L.R.; Zhang, H.J. Enhanced corrosion and wear resistances by graphene oxide coating on the surface of Mg-Zn-Ca alloy. Carbon 2016, 109, 340–351. [Google Scholar] [CrossRef]
  27. Neupane, M.P.; Lee, S.J.; Kang, J.Y.; Park, I.S.; Bae, T.S.; Lee, M.H. Surface characterization and corrosion behavior of silanized magnesium coated with graphene for biomedical application. Mater. Chem. Phys. 2015, 163, 229–235. [Google Scholar] [CrossRef]
  28. Sakeye, M.; Smatt, J.-H. Comparison of different amino-functionalization procedures on a selection of metal oxide microparticles: Degree of modification and hydrolytic stability. Langmuir 2012, 28, 16491–16950. [Google Scholar] [CrossRef]
  29. Prasai, D.; Tuberquia, J.C.; Harl, R.R.; Jennings, G.K.; Bolotin, K.I. Graphene: Corrosion-inhibiting coating. ACS Nano 2012, 6, 1102–1108. [Google Scholar] [CrossRef]
  30. Chu, J.H.; Tong, L.B.; Zhang, J.B.; Kamado, S.; Jiang, Z.H.; Zhang, H.J.; Sun, G.X. Bio-inspired graphene-based coatings on Mg alloy surfaces and their integrations of anti-corrosive/wearable performances. Carbon 2019, 141, 154–168. [Google Scholar] [CrossRef]
  31. Lin, L.; Wu, H.; Green, S.J.; Crompton, J.; Zhang, S.; Horsell, W. Formation of tunable graphene oxide coating with high adhesion. Phys. Chem. Chem. Phys. 2016, 18, 5086–5090. [Google Scholar] [CrossRef] [PubMed]
  32. Xu, R.; Yang, X.; Zhang, X.; Wang, M.; Li, P.; Zhao, Y.; Wu, G.; Chu, P.K. Effects of carbon dioxide plasma immersion ion implantation on the electrochemical properties of AZ31 magnesium alloy in physiological enviornment. Appl. Surf. Sci. 2013, 286, 257–260. [Google Scholar] [CrossRef]
  33. Pan, C.-J.; Pang, L.-Q.; Hou, Y.; Lin, Y.-B.; Gong, T.; Liu, T.; Ye, W.; Ding, H.-Y. Improving corrosion resistance and biocompatibility of magnesium alloy by sodium hydroxide and hydrofluoric acid treatments. Appl. Sci. 2017, 7, 33. [Google Scholar] [CrossRef]
  34. Man, C.; Dong, C.; Fang, Y.; Xiao, K.; Guo, C.; He, G.; Li, X. The corrosion behavior of magnesium alloy AZ31 in hot and dry atmospheric environment in Turpan, China. Int. J. Electrochem. Sci. 2015, 10, 8691–8705. [Google Scholar] [CrossRef]
  35. Santamaria, M.; Di Quarto, F.; Zanna, S.; Marcus, P. Initial surface film on magnesium metal: A characterization by X-ray photoelectron spectroscopy (XPS) and photocurrent spectroscopy (PCS). Electrochim. Acta 2007, 53, 1314–1324. [Google Scholar] [CrossRef]
  36. Jönsson, M.; Persson, D.; Thierry, D. Corrosion product formation during NaCl induced atmospheric corrosion of magnesium alloy AZ91D. Corros. Sci. 2007, 49, 1540–1558. [Google Scholar] [CrossRef]
  37. Feliu, S., Jr.; Galván, J.C.; Pardo, A.; Merino, M.C.; Arrabal, R. Native air-formed oxide film and its effect on magnesium alloys corrosion. Open Corros. J. 2010, 3, 80–91. [Google Scholar] [CrossRef]
  38. Lakshimi, R.V.; Aruna, S.T.; Anandan, C.; Bera, P.; Sampath, S. EIS and XPS studies on the self-healing properties of Ce-modified silica-alumina hybrid coatings: Evidence for Ce(III) migration. Surf. Coat. Technol. 2017, 309, 363–370. [Google Scholar] [CrossRef]
  39. López, A.D.F.; Lehr, I.L.; Saidman, S.B. Anodisation of AZ91D magnesium alloy in molybdate solution for corrosion protection. J. Alloys Compd. 2017, 702, 338–345. [Google Scholar] [CrossRef]
  40. Wang, H.; Li, Y.; Wang, F. Influence of cerium on passivity behavior of wrought AZ91 alloy. Electrochim. Acta 2008, 54, 706–713. [Google Scholar] [CrossRef]
  41. Rao, X.; Hassan, A.A.; Guyon, C.; Zhang, M.; Ognier, S.; Tatoulian, M. Plasma polymer layers with primary amino groups for immobilization of nano and microparticles. Plasma Chem. Plasma Process. 2020, 40, 589–606. [Google Scholar] [CrossRef]
  42. Liu, J.; Xi, T. Enhanced anti-corrosion ability and biocompatibility of PLGA coatings on MgZnYNd alloy by BTSE-APTES pretreatment for cardiovascular stent. J. Mater. Sci. Technol. 2016, 32, 845–857. [Google Scholar] [CrossRef]
  43. Lavorgna, M.; Romeo, V.; Martone, A.; Zarrelli, M.; Giordano, M.; Buonocore, G.G.; Qu, M.Z.; Fei, G.X.; Xia, H.S. Silanization and sílica enrichment of multiwalled carbono nanotubes: Synergistic effects on the thermal-mechanical properties of epoxy nanocomposites. Eur. Polym. J. 2013, 49, 428–438. [Google Scholar] [CrossRef]
  44. Zhang, Z.-Q.; Zeng, R.-C.; Lin, C.-G.; Wang, L.; Chen, X.-B.; Chen, D.-C. Corrosion resistance of self-cleaning silane/polypropylene composite coatings on magnesium alloy AZ31. J. Mater. Sci. Technol. 2020, 41, 43–55. [Google Scholar] [CrossRef]
  45. Sánchez-López, L.; Chico, B.; Llorente, I.; Escudero, M.L.; Lozano, R.M.; García-Alonso, M.C. Covalent immobilization of graphene oxide on biomedical grande CoCr alloy by an improved multilayer system assembly via silane/GO bonding. Mater. Chem. Phys. 2022, 287, 126296. [Google Scholar] [CrossRef]
  46. Hu, H.; Zhao, S.; Sun, G.; Zhong, Y.; You, B. Evaluation of scratch resistance of functionalized graphene oxide/polysiloxane nanocomposite coatings. Prog. Org. Coat. 2018, 117, 118–129. [Google Scholar] [CrossRef]
  47. Pei, S.; Meng, H.-M. The reduction of graphene oxide. Carbon 2012, 50, 3210–3228. [Google Scholar] [CrossRef]
  48. Ferrari, I.; Motta, A.; Zanoni, R.; Scaramuzzo, F.A.; Amato, F.; Dalchiele, E.A.; Marrani, A.G. Understanding the nature of graphene oxide functional groups by modulation of the electrochemical reduction: A combined experimental and theoretical approach. Carbon 2023, 203, 29–38. [Google Scholar] [CrossRef]
  49. Lee, Y.S.; Ji, B.C.; Seo, J.-W.; Jeon, D.I.; Kwon, S.B.; Yoo, J.H.; Kang, B.G.; Song, Y.H.; Yang, W.S.; Kang, B.K.; et al. Facile recyclable process of high-quality single layer graphene oxide via waste graphite anode scrap. Ceram. Int. 2023, 49, 34774–34779. [Google Scholar] [CrossRef]
  50. Gnanaseelan, N.; Marasamy, L.; Mantilla, A.; Kamaraj, S.K.; Espinosa-Faller, F.J.; Caballero-Briones, F. Exploring the impact of doping and co-doping with B and N on the properties of graphene oxide and its photocatalytic generation of hydrogen. Int. J. Hydrogen Energy 2022, 47, 40905–40919. [Google Scholar] [CrossRef]
  51. Oliveira, L.A.; Silva, R.M.P.; Rodas, A.C.D.; Souto, R.M.; Antunes, R.A. Surface chemistry, film morphology, local electrochemical behavior and cytotoxic response of anodized AZ31B magnesium alloy. J. Mater. Res. Technol. 2020, 9, 14754–14770. [Google Scholar] [CrossRef]
  52. Guo, S.; Garaj, S.; Bianco, A.; Ménard-Moyon, C. Controlling covalent chemistry on graphene oxide. Nat. Rev. Phys. 2022, 4, 247–262. [Google Scholar] [CrossRef]
  53. Zhong, Y.; Gu, Y.; Yu, L.; Cheng, G.; Yang, X.; Sun, M.; He, B. APTES-functionalized Fe3O4 microspheres supported Cu atom-clusters with superior catalytic activity towards 4-nitrophenol reduction. Colloids Surf. A 2018, 547, 28–36. [Google Scholar] [CrossRef]
  54. Li, L.; Chen, D.; Long, Y.; Wang, F.; Kang, Z. Silane modification of semi-curing epoxy surface: High interfacial adhesion for conductive coatings. Prog. Org. Coat. 2023, 174, 107228. [Google Scholar] [CrossRef]
  55. Iranshahi, F.; Nasiri, M.B.; Warchomicka, F.G.; Sommitsch, C. Corrosion behavior of electron beam processed AZ91 magnesium alloy. J. Magnes. Alloys 2020, 8, 1314–1327. [Google Scholar] [CrossRef]
  56. Liu, W.; Cao, F.; Zhong, L.; Zheng, L.; Jia, B.; Zhang, Z.; Zhang, J. Influence of rare earth element Ce and La addition on corrosion behavior of AZ91 magnesium alloy. Mater. Corros. 2009, 60, 795–803. [Google Scholar] [CrossRef]
  57. Osipenko, M.A.; Kasach, A.A.; Adamiec, J.; Zimowska, M.; Kurilo, I.I.; Kharytonau, D.S. Corrosion inhibition of magnesium alloy AZ31 in chloride-containing solutions by aqueous permanganate. J. Solid State Electrochem. 2023, 27, 1847–1860. [Google Scholar] [CrossRef]
  58. Tang, J.; Chen, L.; Li, Z.; Zhao, G.; Zhang, C. Formation of abnormal coarse grains and its effects on corrosion behaviors of solution treated ZK60 Mg alloy. Corros. Sci. 2021, 180, 109201. [Google Scholar] [CrossRef]
  59. Song, Y.; Shan, D.; Chen, R.; Han, E.-H. Corrosion characterization of Mg-8Li alloy in NaCl solution. Corros. Sci. 2009, 51, 1087–1094. [Google Scholar] [CrossRef]
  60. Feliu, S., Jr. Electrochemical impedance spectroscopy for the measurement of the corrosion rate of magnesium alloys: Brief review and challenges. Metals 2020, 10, 775. [Google Scholar] [CrossRef]
  61. Torbati-Sarraf, H.; Torbati-Sarraf, S.A.; Poursaee, A.; Langdon, T.G. Electrochemical behavior of a magnesium ZK60 alloy processed by high-pressure torsion. Corros. Sci. 2019, 154, 90–100. [Google Scholar] [CrossRef]
  62. Jiao, Z.-J.; Yu, C.; Wang, X.-M.; Zhou, Y.-F.; Guo, L.; Xia, Y.; Zhang, B.-C.; Zeng, R.-C. Corrosion resistance enhanced by an atomic layer deposited Al2O3/micro-arc oxidation coating on magnesium alloy AZ31. Ceram. Int. 2024, 50, 5541–5551. [Google Scholar] [CrossRef]
  63. Nie, L.; Xia, Y.; Zhou, Y.; Zhang, J.; Cao, F.; Zhang, J. Investigation of AZ91D magnesium alloy corrosion behavior under thin electrolyte layer using nondestructive electrochemical techniques. Int. J. Electrochem. Sci. 2016, 11, 259–276. [Google Scholar] [CrossRef]
  64. Guo, C.; Liu, L.; Liu, H.; Qian, F.; Zhou, Y.; Wang, L.; Li, J.; Wang, J. Effect of indium and yttrium on the corrosion behavior of AZ63 magnesium alloy. J. Alloys Compd. 2024, 985, 174068. [Google Scholar] [CrossRef]
  65. Chen, Y.; Li, J.; Wu, L.; Zhang, Y.; Deng, J.; Yao, W.; Wu, J.; Yuan, Y.; Xie, Z.; Atrens, A.; et al. Effect of solution pH value on the corrosion resistance of Co-Fe LDHs coating developed on MAO treated magnesium alloy AZ31. Colloids Surf. A 2024, 694, 134220. [Google Scholar] [CrossRef]
  66. Zhao, X.; Jin, Z.; Zhang, B.; Zhai, X.; Liu, S.; Sun, X.; Zhu, Q.; Hou, B. Effect of graphene oxide on anticorrosion performance of polyelectrolyte multilayer for 2A12 aluminum alloy substrates. Rsc Adv. 2017, 7, 33764. [Google Scholar] [CrossRef]
  67. Samadianfard, R.; Seifzadeh, D.; Dikici, B. Smart sol-gel nanocomposite containing inhibitor-stabilized g-C3N4 nanoplates for corrosion protection of magnesium alloy. Surf. Coat. Technol. 2024, 484, 130764. [Google Scholar] [CrossRef]
  68. Liu, S.; Huang, H.; Huang, G.; Qu, J. Influence of oxalic acid on the corrosion behavior of AZ91D magnesium alloy in deionized water. Vacuum 2023, 215, 112351. [Google Scholar] [CrossRef]
  69. Zhang, W.; Zhang, R.; Xu, D.; Wu, L.; Xie, Z.-H.; Yu, G. Growth mechanism and corrosion resistance of layered double hydroxide film on magnesium alloy without external addition of magnesium and aluminum salts. Colloids Surf. A 2024, 689, 133677. [Google Scholar] [CrossRef]
  70. Bahrampour, S.; Bordbar-Khiabani, A.; Siadati, M.H.; Gasik, M.; Mozafari, M. Improving the inflammatory-associated corrosion behavior of magnesium alloys by Mn3O4 incorporated plasma electrolytic oxidation coatings. Chem. Eng. J. 2024, 483, 149016. [Google Scholar] [CrossRef]
  71. Xu, X.; Qu, J.; Huang, H. Synthesis of a dibenzimidazole compound and its corrosion inhibition behavior on AZ91D Mg alloy in 3.5 wt.% NaCl solution. J. Mol. Struct. 2023, 1291, 136065. [Google Scholar] [CrossRef]
  72. Zhang, Y.; Dai, J.Y.; Zhao, L.; Wu, L.P. Corrosion resistance and biocompatibility of the KMgF3 coated AZ31 magnesium alloy. J. Alloys Compd. 2023, 968, 172210. [Google Scholar] [CrossRef]
  73. Curioni, M. The behaviour of magnesium during free corrosion and potentiodynamic polarization investigated by real-time hydrogen measurement and optical imaging. Electrochim. Acta 2014, 120, 284–292. [Google Scholar] [CrossRef]
  74. Chen, Y.; Ying, T.; Yang, Y.; Wang, J.; Zeng, X. Regulating corrosion resistance of Mg alloys via promoting precipitation with trace Zr alloying. Corros. Sci. 2023, 216, 111106. [Google Scholar] [CrossRef]
  75. Daroonparvar, M.; Helmer, A.; Ralls, A.M.; Khan, M.U.F.; Kasar, A.K.; Gupta, R.K.; Misra, M.; Shao, S.; Menezes, P.L.; Shamsaei, N. Pitting corrosion behavior and corrosion protection performance of cold sprayed double layered noble barrier coating on magnesium-based alloy in chloride containing solutions. J. Magnes. Alloys 2023, 11, 3099–3119. [Google Scholar] [CrossRef]
  76. Jian, S.-Y.; Liu, Y.-C.; Chang, C.-J. Novel green and ecofriendly route for fabricating a robust corrosion protection coating on AZ91D magnesium alloy. Electrochem. Commun. 2024, 160, 107667. [Google Scholar] [CrossRef]
  77. Peng, Y.; Wan, S.; Liao, B.; Guo, X. Preparation and properties of multi-function composite coating on AZ91D magnesium alloy with wave-assimilation and anti-corrosion performance. Surf. Coat. Technol. 2024, 478, 130464. [Google Scholar] [CrossRef]
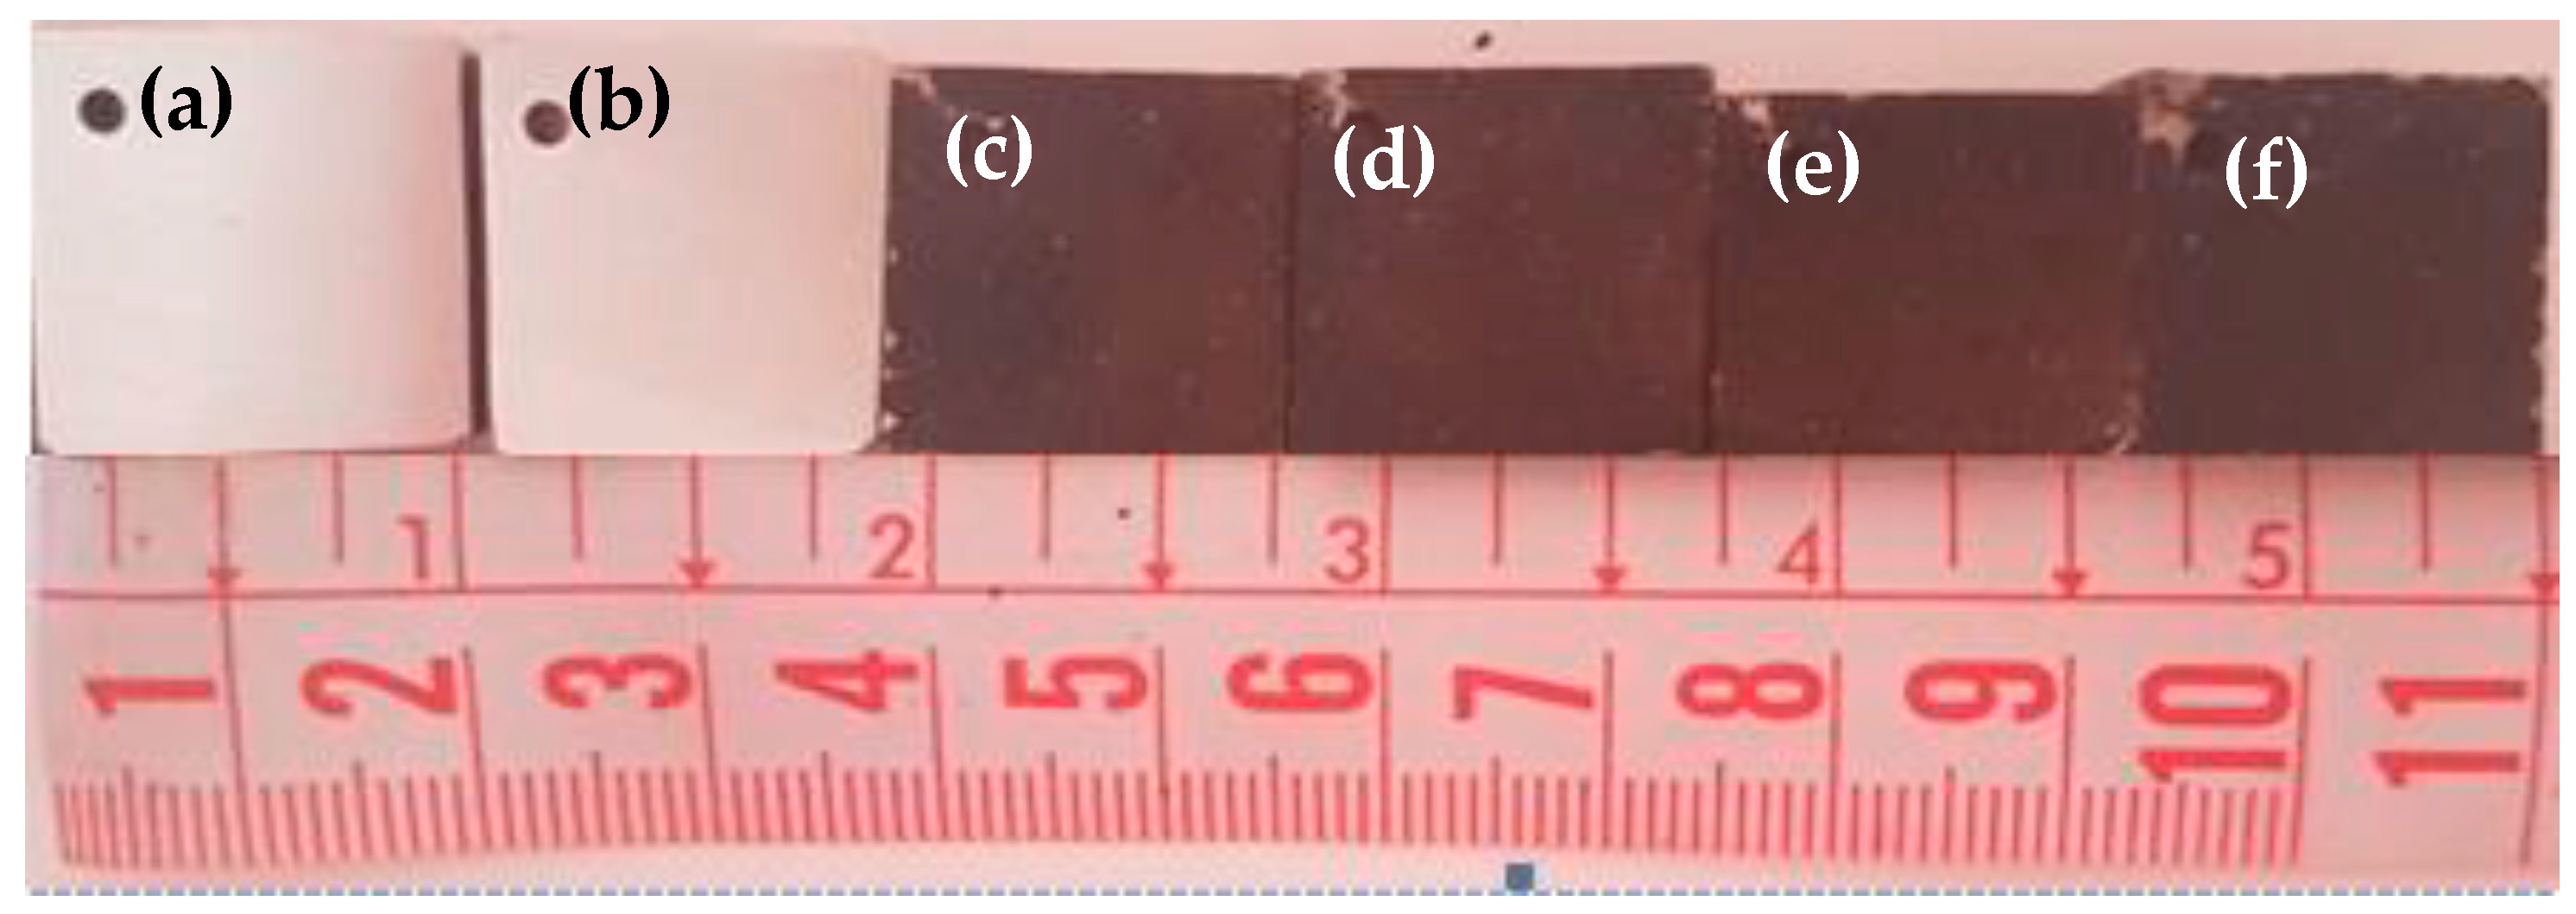
Figure 1. Macroscopic images of the different AZ91D samples: (a) AR; (b) silanized; (c) 0.05% 2 h; (d) 0.05% 4 h; (e) 0.1% 2 h; (f) 0.1% 4 h.
Metals 14 01019 g001
Figure 2. SEM micrographs of the AZ91D alloy samples: (a) AR; (b) 0.05% 2 h; (c) 0.05% 4 h; (d) 0.1% 2 h; (e) 0.1% 4 h.
Metals 14 01019 g002
Figure 3. Representative XPS survey spectra AZ91D samples.
Metals 14 01019 g003
Figure 4. XPS high-resolution spectra of the AR sample (uncoated AZ91D alloy): (a) Mg 1s; (b) O 1s; (c) Al 2p; (d) Zn 2p.
Metals 14 01019 g004
Figure 5. XPS high-resolution spectra of the silanized sample (without GO coating): (a) C 1s; (b) O 1s; (c) Si 2p; (d) N 1s.
Metals 14 01019 g005
Figure 6. XPS high-resolution spectra of the 0.1% 4 h sample: (a) C 1s; (b) O 1s; (c) N 1s; (d) Si 2p.
Metals 14 01019 g006
Figure 7. O 1s high-resolution spectra of GO-coated samples: (a) 0.1% 2 h; (b) 0.05% 4 h; (c) 0.05% 2 h.
Metals 14 01019 g007
Figure 8. XPS high-resolution spectra of the graphene oxide sample: (a) C 1s; (b) O 1.
Metals 14 01019 g008
Figure 9. FTIR spectra of the: (a) 0.1% 4 h and (b) silanized samples.
Metals 14 01019 g009
Figure 10. Open circuit potential curves of the AZ91D samples after 3600 s of immersion in 3.5 wt.% NaCl solution at room temperature.
Metals 14 01019 g010
Figure 11. Nyquist plots of the uncoated and GO-coated AZ91D samples after 1 h of immersion in 3.5 wt.% NaCl solution at room temperature.
Metals 14 01019 g011
Figure 12. Bode plots of the uncoated and GO-coated AZ91D samples after 1 h of immersion in 3.5 wt.% NaCl solution at room temperature: (a) phase angle plots; (b) impedance modulus plots.
Metals 14 01019 g012
Figure 13. Fitted EECs used to simulate the EIS response of the AZ91D samples: (a) AR sample; (b) GO-coated samples.
Metals 14 01019 g013
Figure 14. Potentiodynamic polarization curves of the different AZ91D samples after 1 h of immersion in 3.5 wt.% NaCl solution at room temperature.
Metals 14 01019 g014
Figure 15. Illustration of the corrosion protection mechanism of the AZ91D samples: (a) silanized; (b) GO-coated samples.
Metals 14 01019 g015
Table 1. Samples tested in the present work.
SamplePretreatmentGO Concentration (wt.%)Time (h)
AR------------
SilanizedImmersion in 3 M NaOH solution for 1 h + silanization with APTES--------
0.05% 2 hImmersion in 3 M NaOH solution for 1 h + silanization with APTES0.052
0.05% 4 hImmersion in 3 M NaOH solution for 1 h + silanization with APTES0.054
0.1% 2 hImmersion in 3 M NaOH solution for 1 h + silanization with APTES0.12
0.1% 4 hImmersion in 3 M NaOH solution for 1 h + silanization with APTES0.14
Table 2. EIS fitting results using the EECs shown in Figure 13 for the uncoated AZ91D substrate and the silanized and GO-coated samples.
SampleRs (Ω·cm2)CPEf (10−6 Ω−1·cm−2·sn)Rf (Ω·cm2)nfCPEdl (10−6 Ω−1·cm−2·sn)Rct (Ω·cm2)ndlRL (Ω·cm2)L (H·cm2)χ2
AR24------------8.987000.8827616600.34
Silanized2127.132320.785.822100.887098030.44
0.05% 2 h256.634260.920.220860.6913448560.14
0.05% 4 h5210.251470.884.123560.6811466340.21
0.1% 2 h508.263230.922.131890.708107370.31
0.1% 4 h274.720,2240.924.156170.87113060270.56
Table 3. Electrochemical parameters obtained from the potentiodynamic polarization curves shown in Figure 14.
SampleEcorr (mV vs. Ag/AgCl)icorr (µA·cm−2)Epit (mV vs. Ag/AgCl)ΔE (mV)ipass (µA·cm−2)
AR−1523 + 554.9 ± 0.4------------
Silanized−1380 ± 812.7 ± 0.3 ------------
0.05% 2 h−1335 ± 91----−1170 ± 65211 ± 610.8 ± 0.2
0.05% 4 h−1332 ± 52----−980 ± 140425 ± 246.2 ± 0.7
0.1% 2 h−1408 ± 50----−1151 ± 83259 ± 631.6 ± 0.5
0.1% 4 h−1424 ± 30----−970 ± 101538 ± 520.7 ± 0.2
Disclaimer/Publisher’s Note: The statements, opinions and data contained in all publications are solely those of the individual author(s) and contributor(s) and not of MDPI and/or the editor(s). MDPI and/or the editor(s) disclaim responsibility for any injury to people or property resulting from any ideas, methods, instructions or products referred to in the content.