
Research on the Microstructures and Properties of AA5052 Laser-Welded Joints with the ER4043 Filler Wire

Abstract
1. Introduction
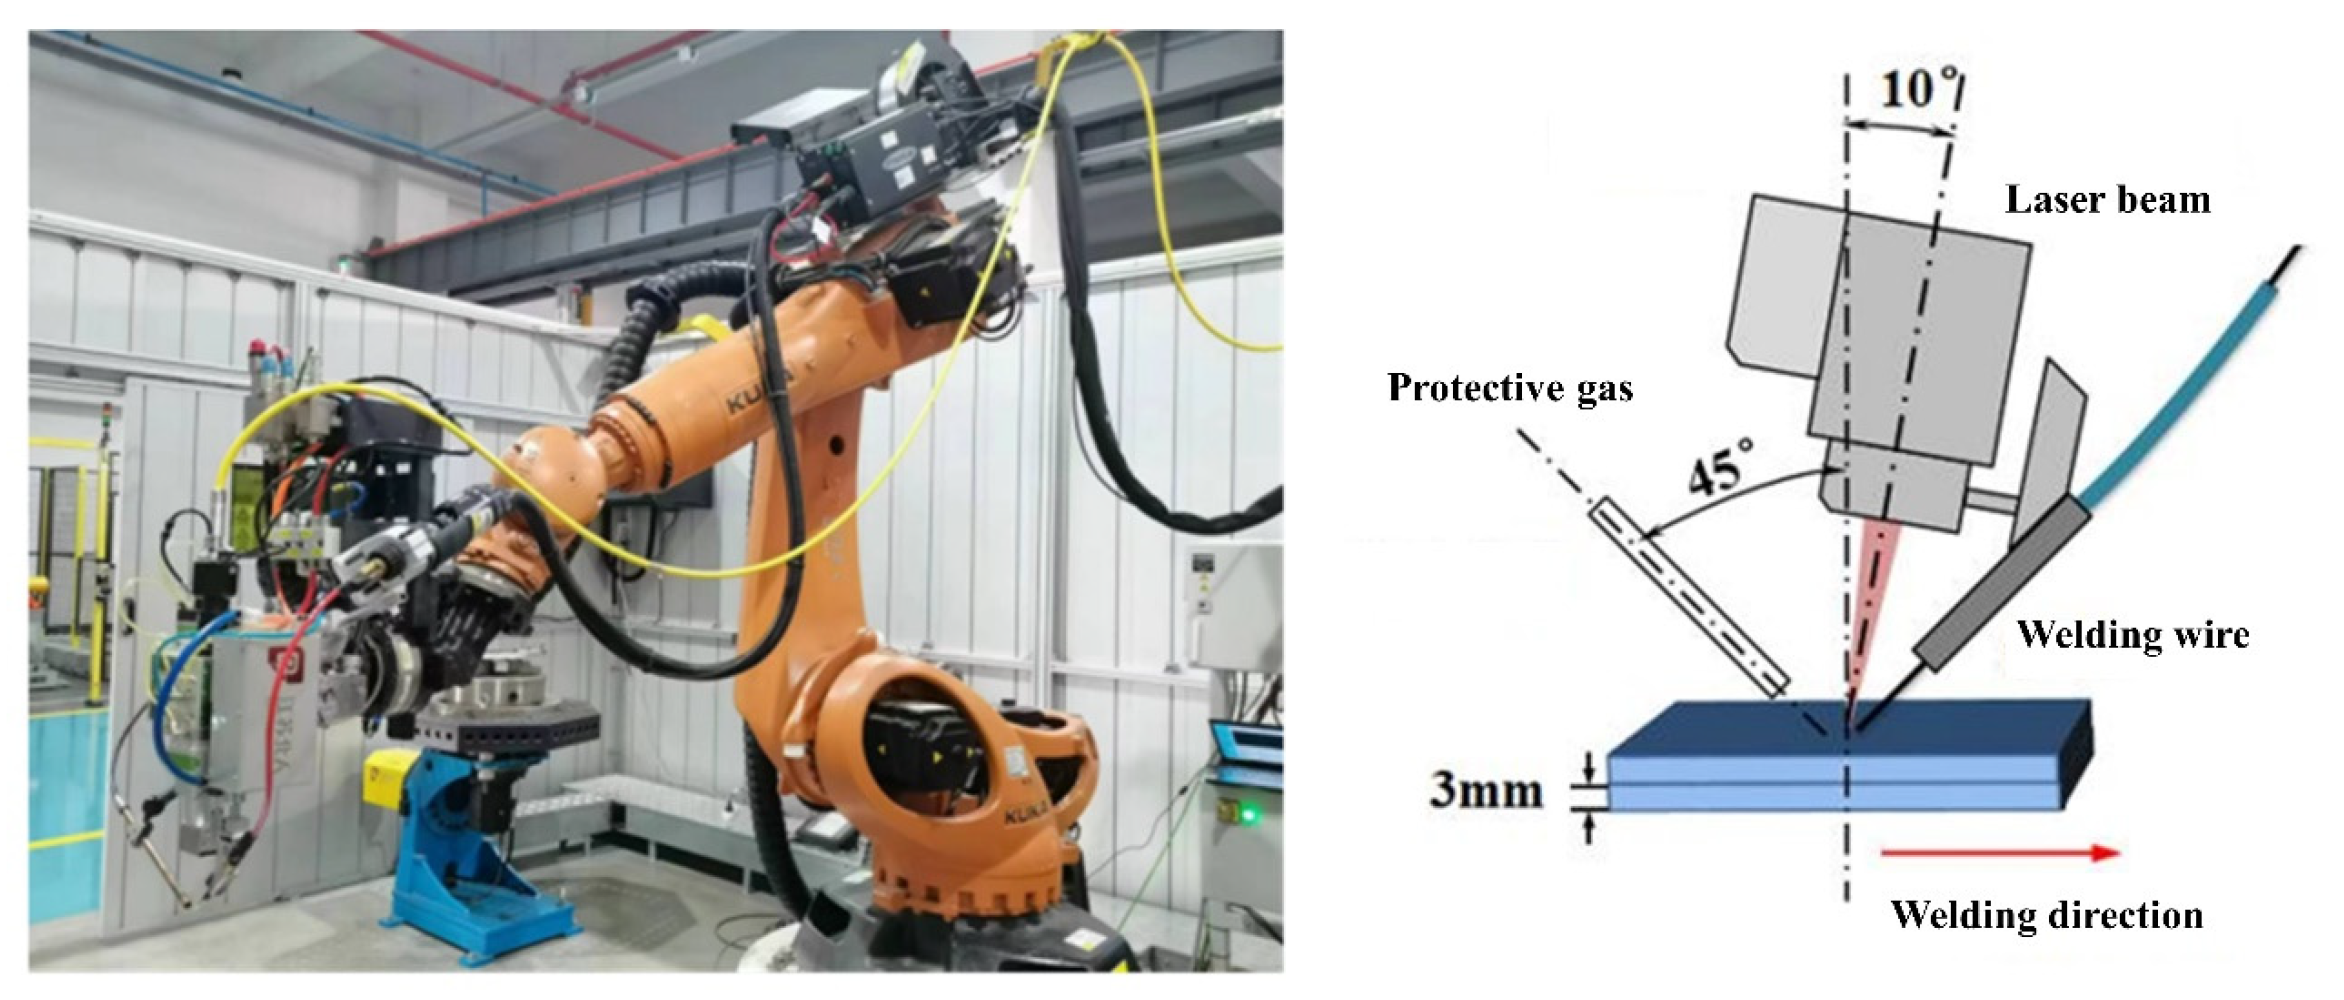
2. Materials and Methods
3. Results and Discussion
3.1. Weld Appearance and Internal Quality
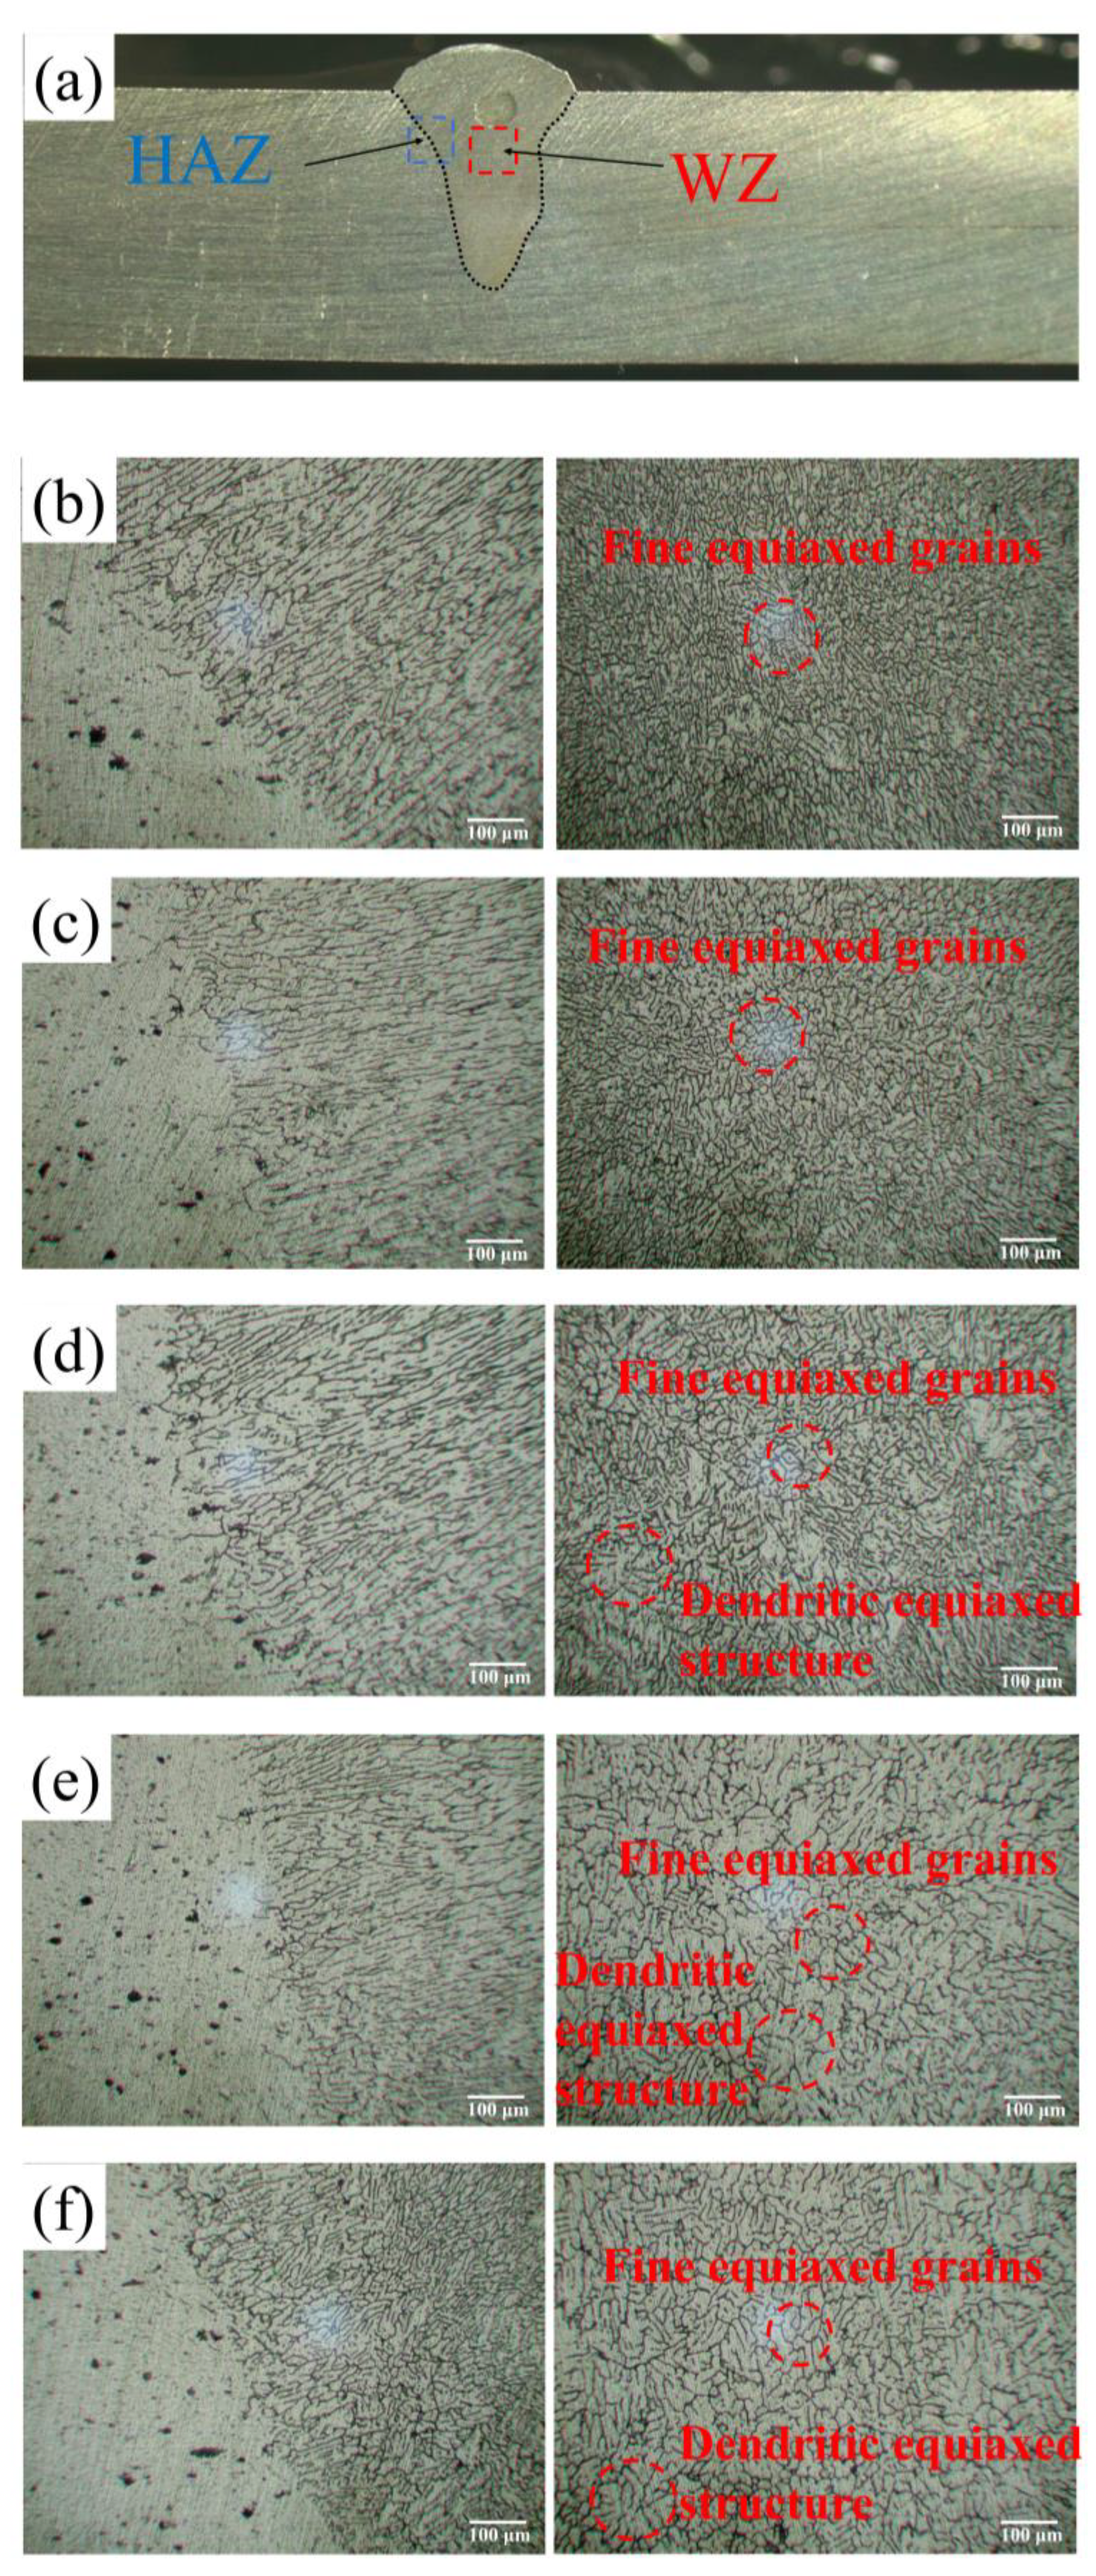
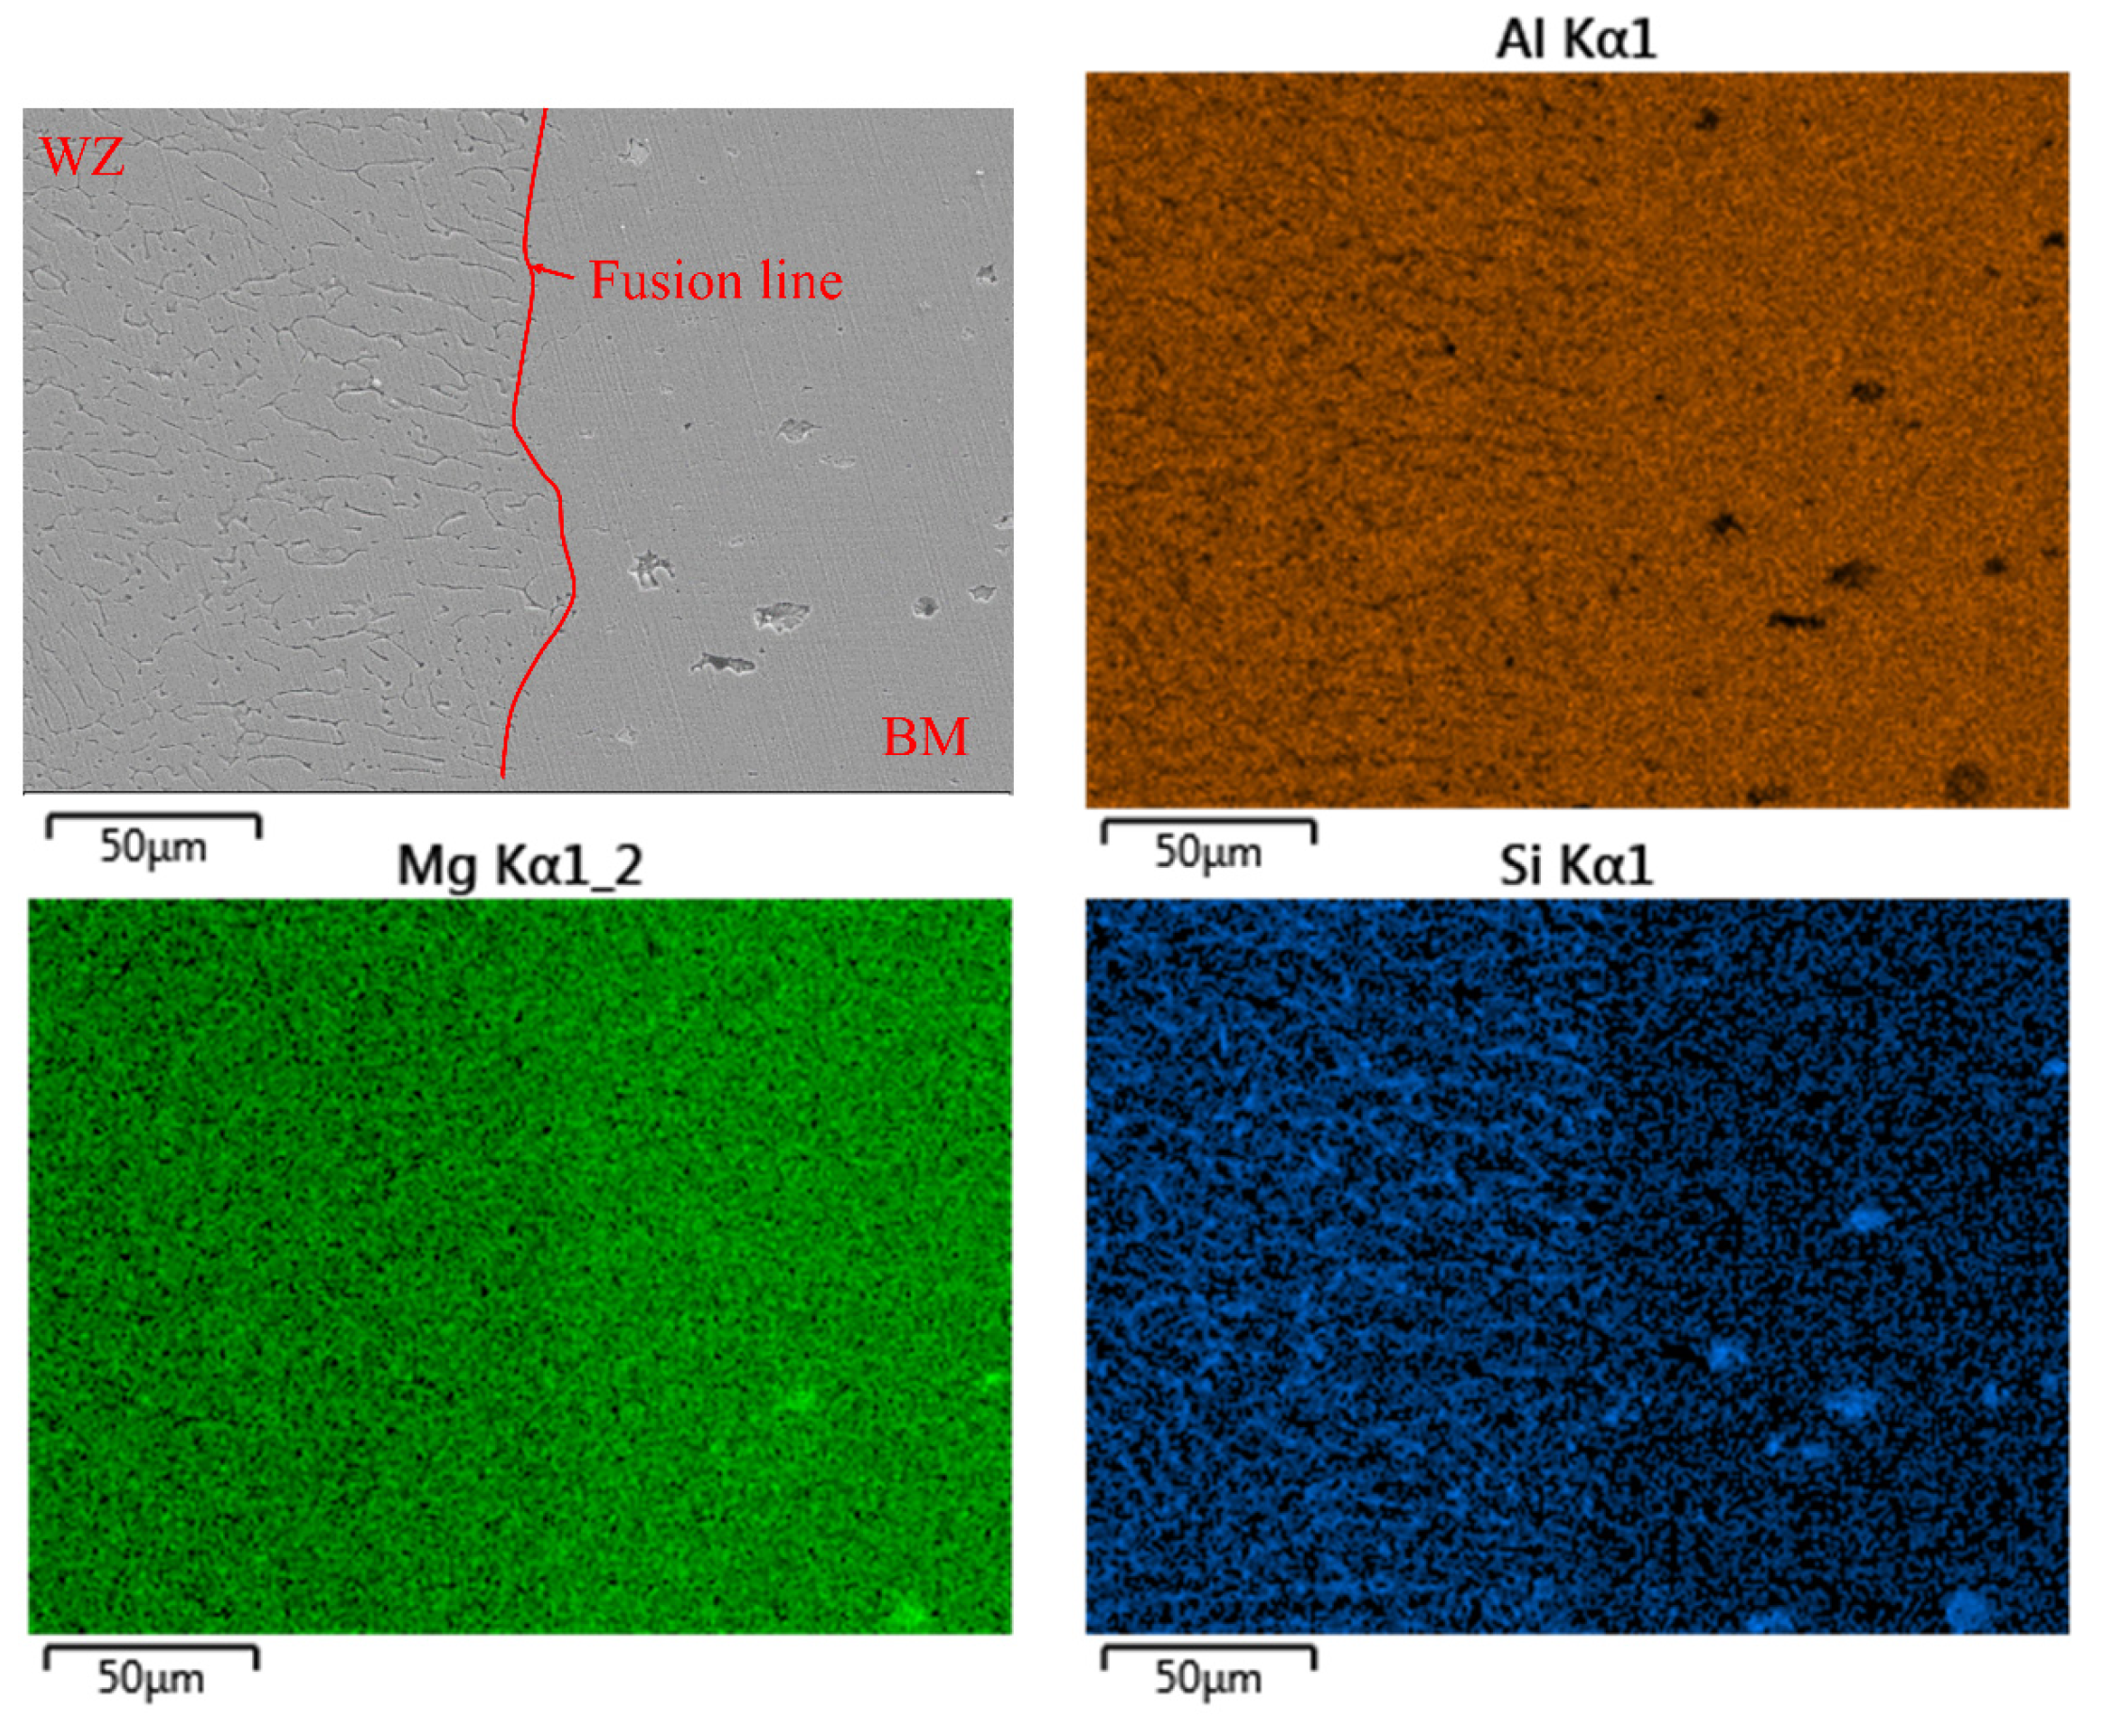
3.2. Microstructures
3.3. Microhardness
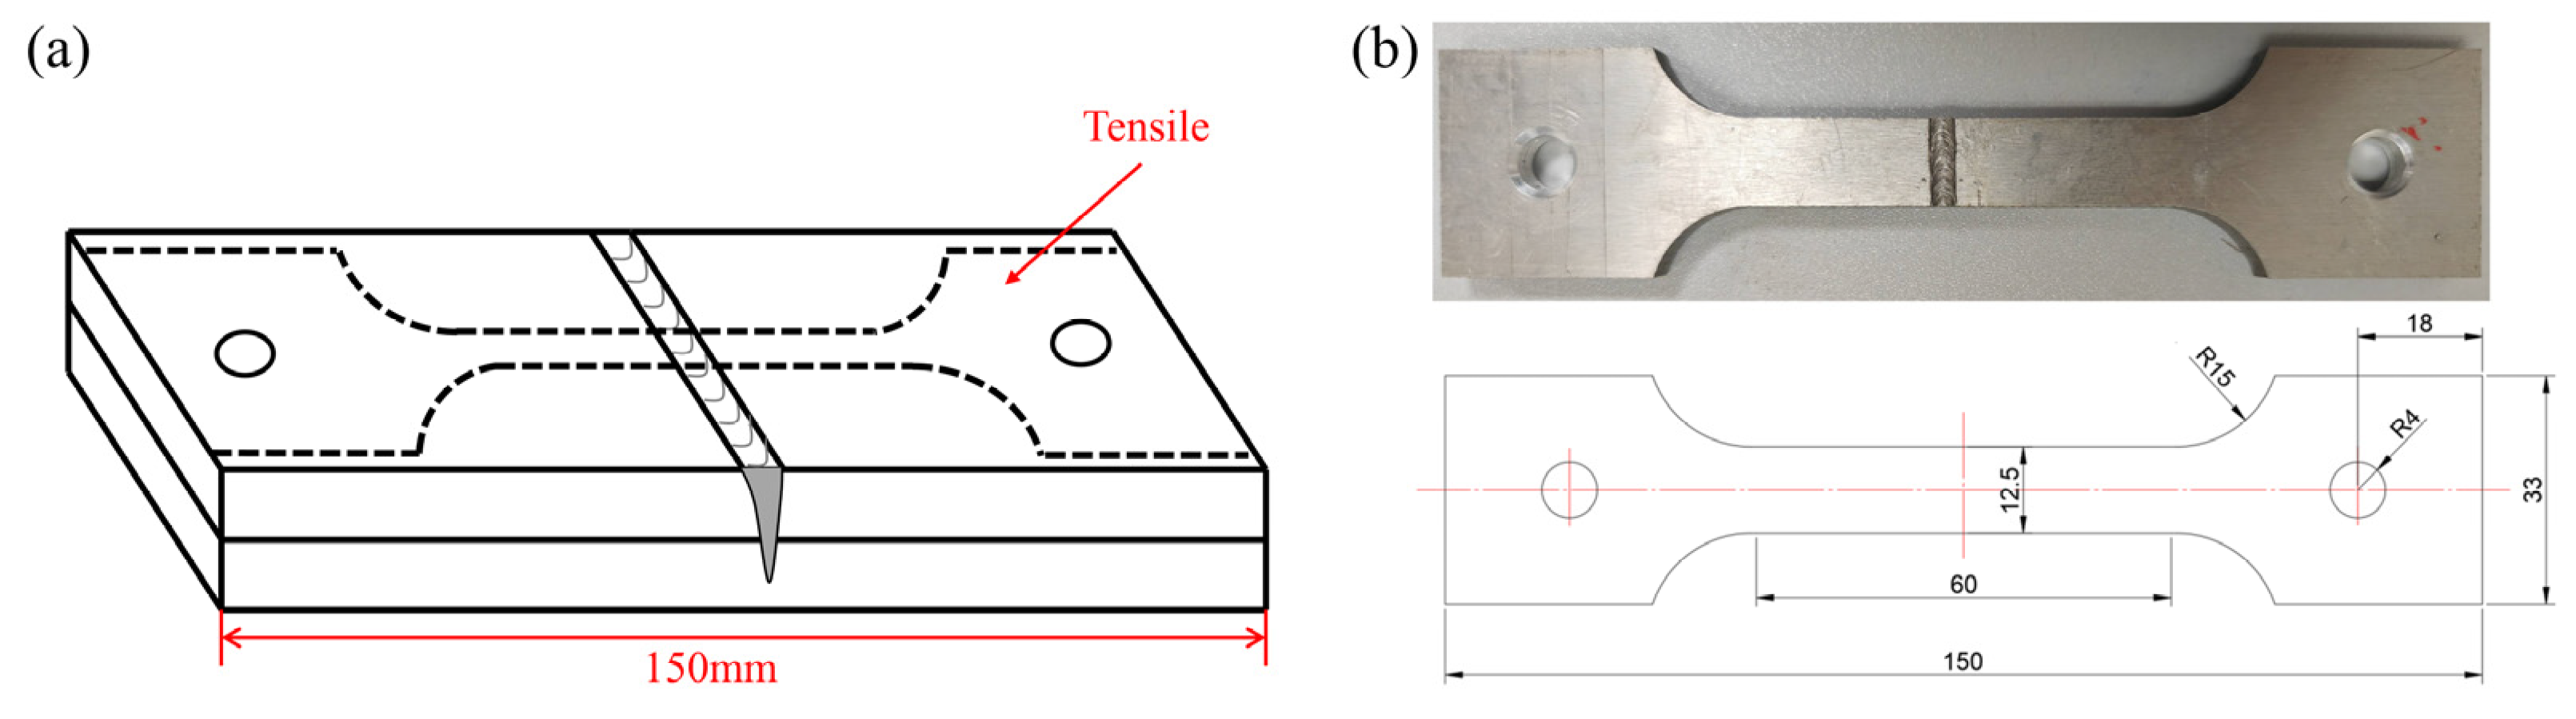
3.4. Tensile Tests
3.5. Electrochemical Corrosion
4. Conclusions
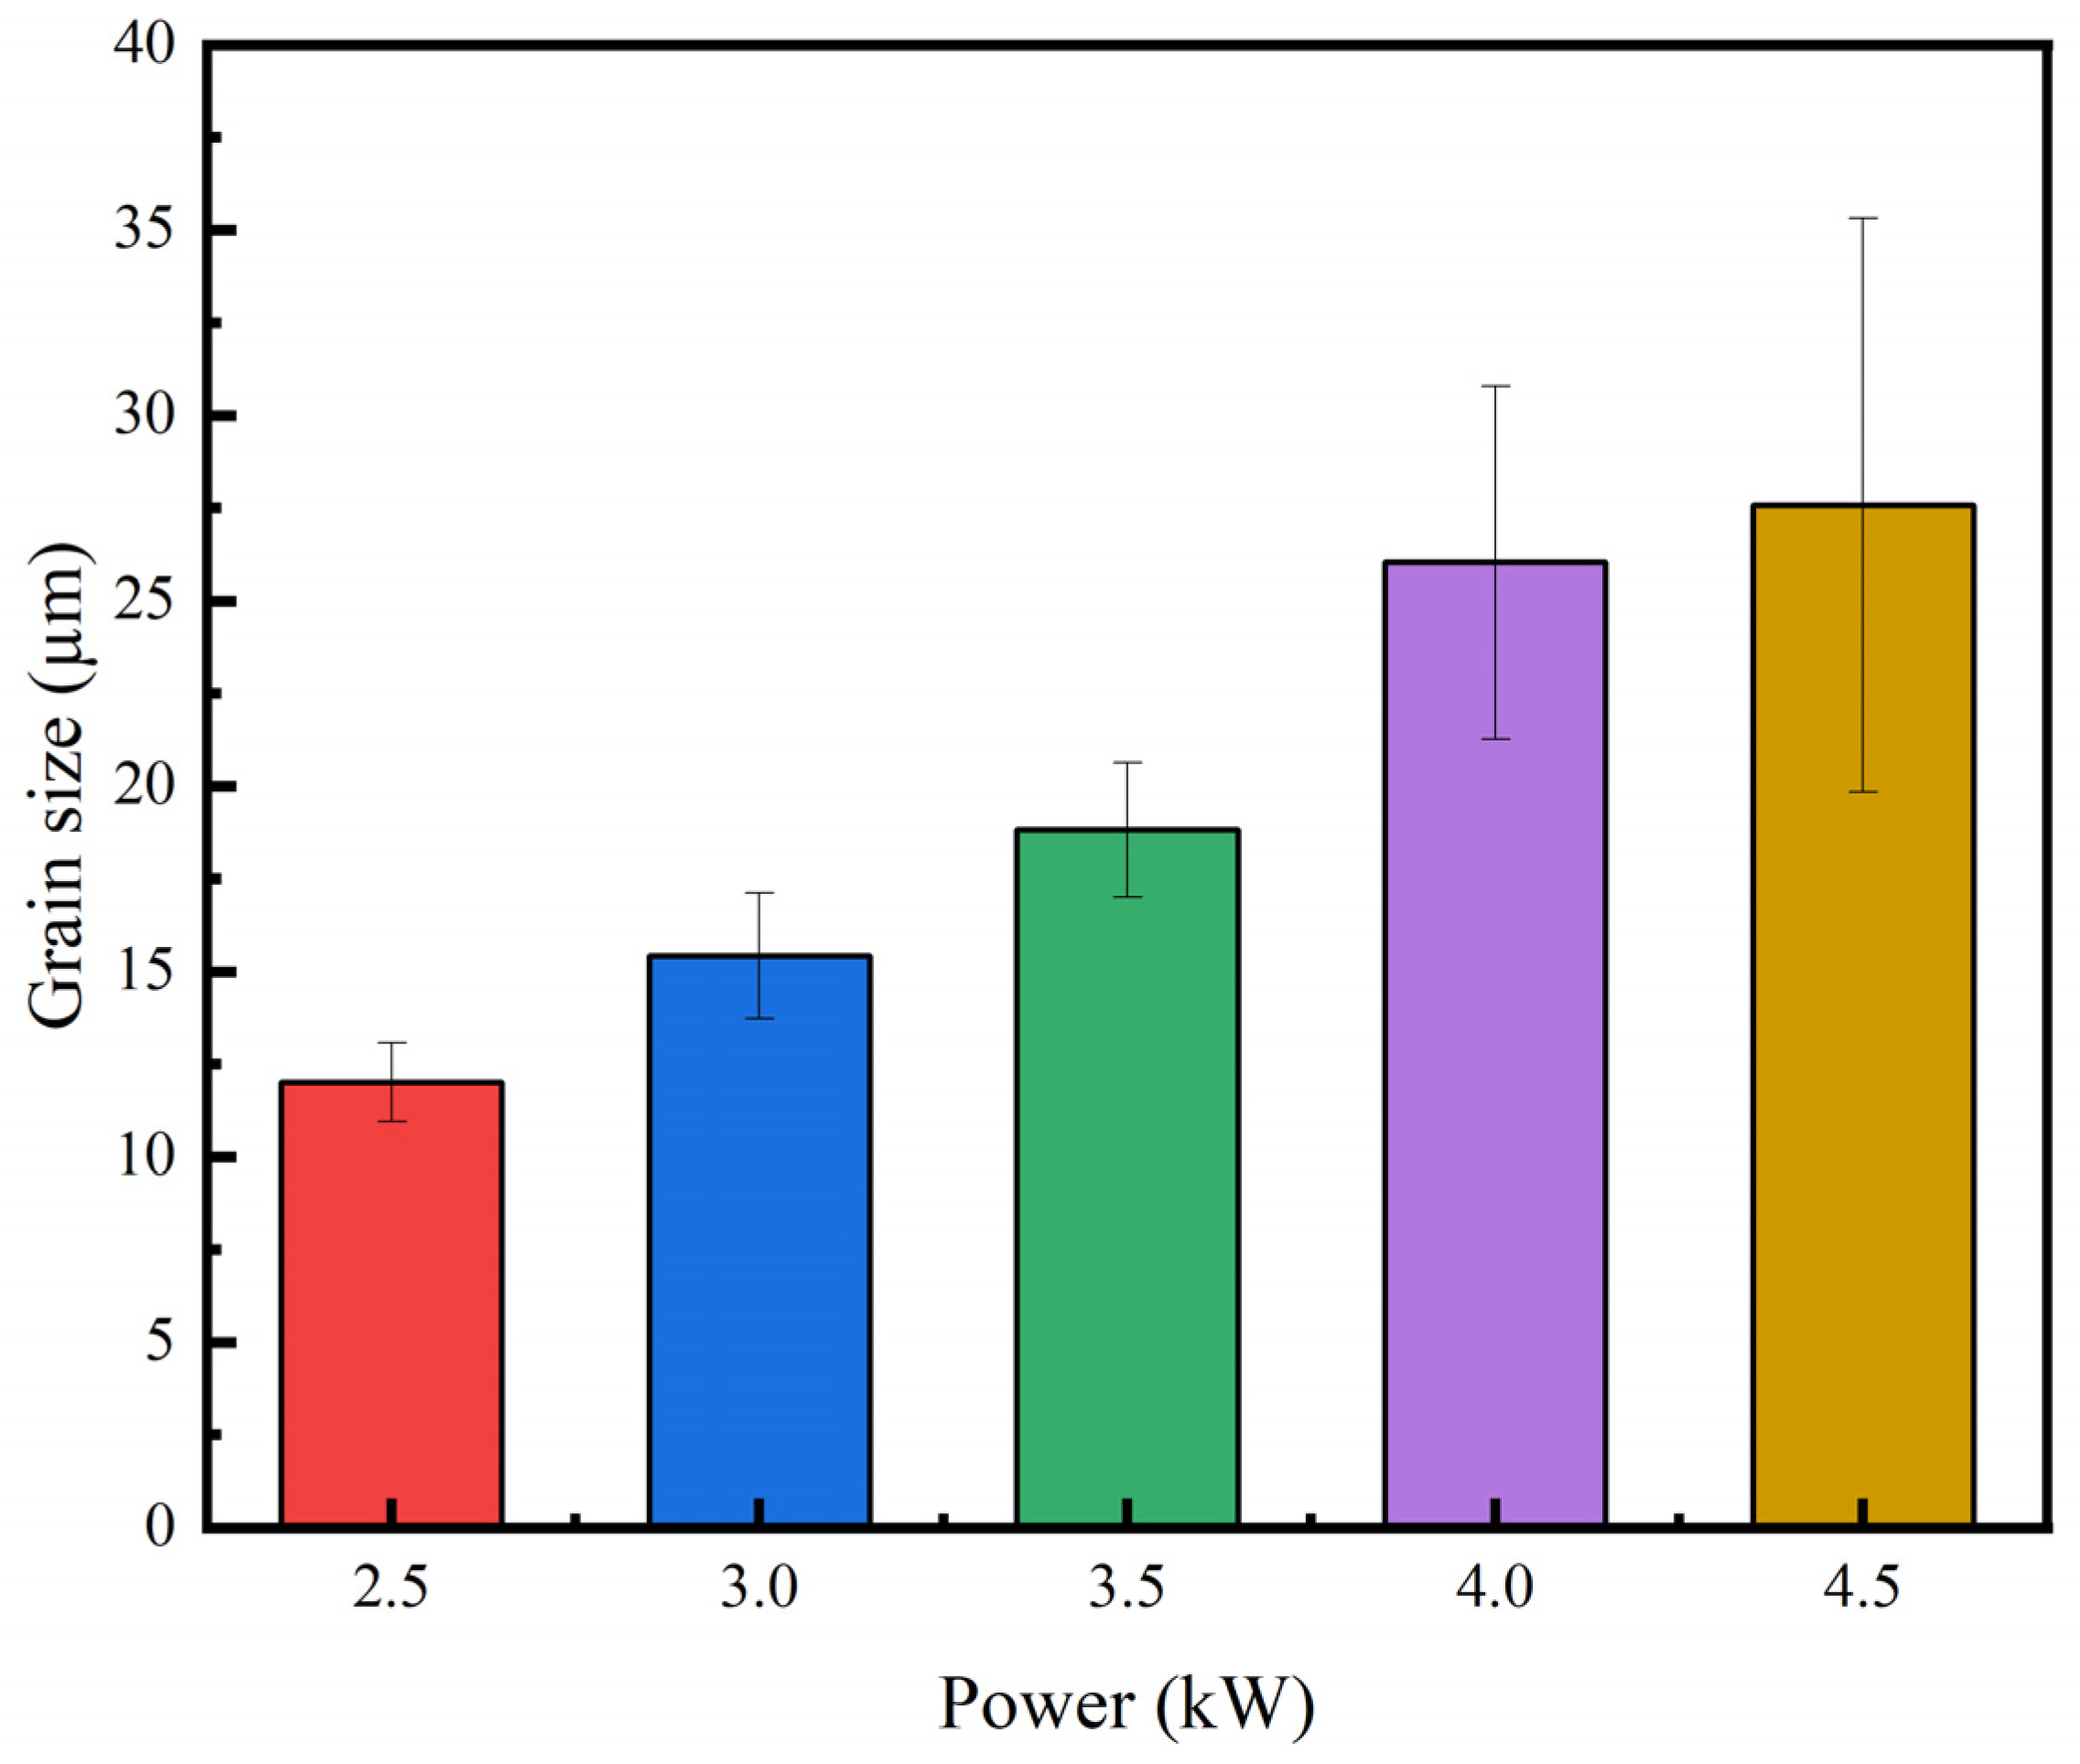
- As the laser power increased, the rise in the heat input resulted in a deeper molten pool and an increased depth of fusion in the weld seam. The addition of filler wire enhanced the instability of the keyhole, leading to the presence of pores in the weld. Metallurgical porosity was primarily caused by hydrogen pores, while process porosity was due to the instability of the keyhole.
- The grain structure at the center of the weld seam was refined, featuring fine equiaxed grains and dendritic equiaxed crystals, while that of the HAZ exhibited a columnar grain structure with coarser grains.
- A significant amount of the Si element from the ER4043 filler wire was incorporated into the weld bead, acting as a strengthening agent. The hardness in the FZ was the highest. The optimal parameter with a laser power of 3.5 kW resulted in a maximum tensile strength of 192.61 MPa and an elongation of 10.1%.
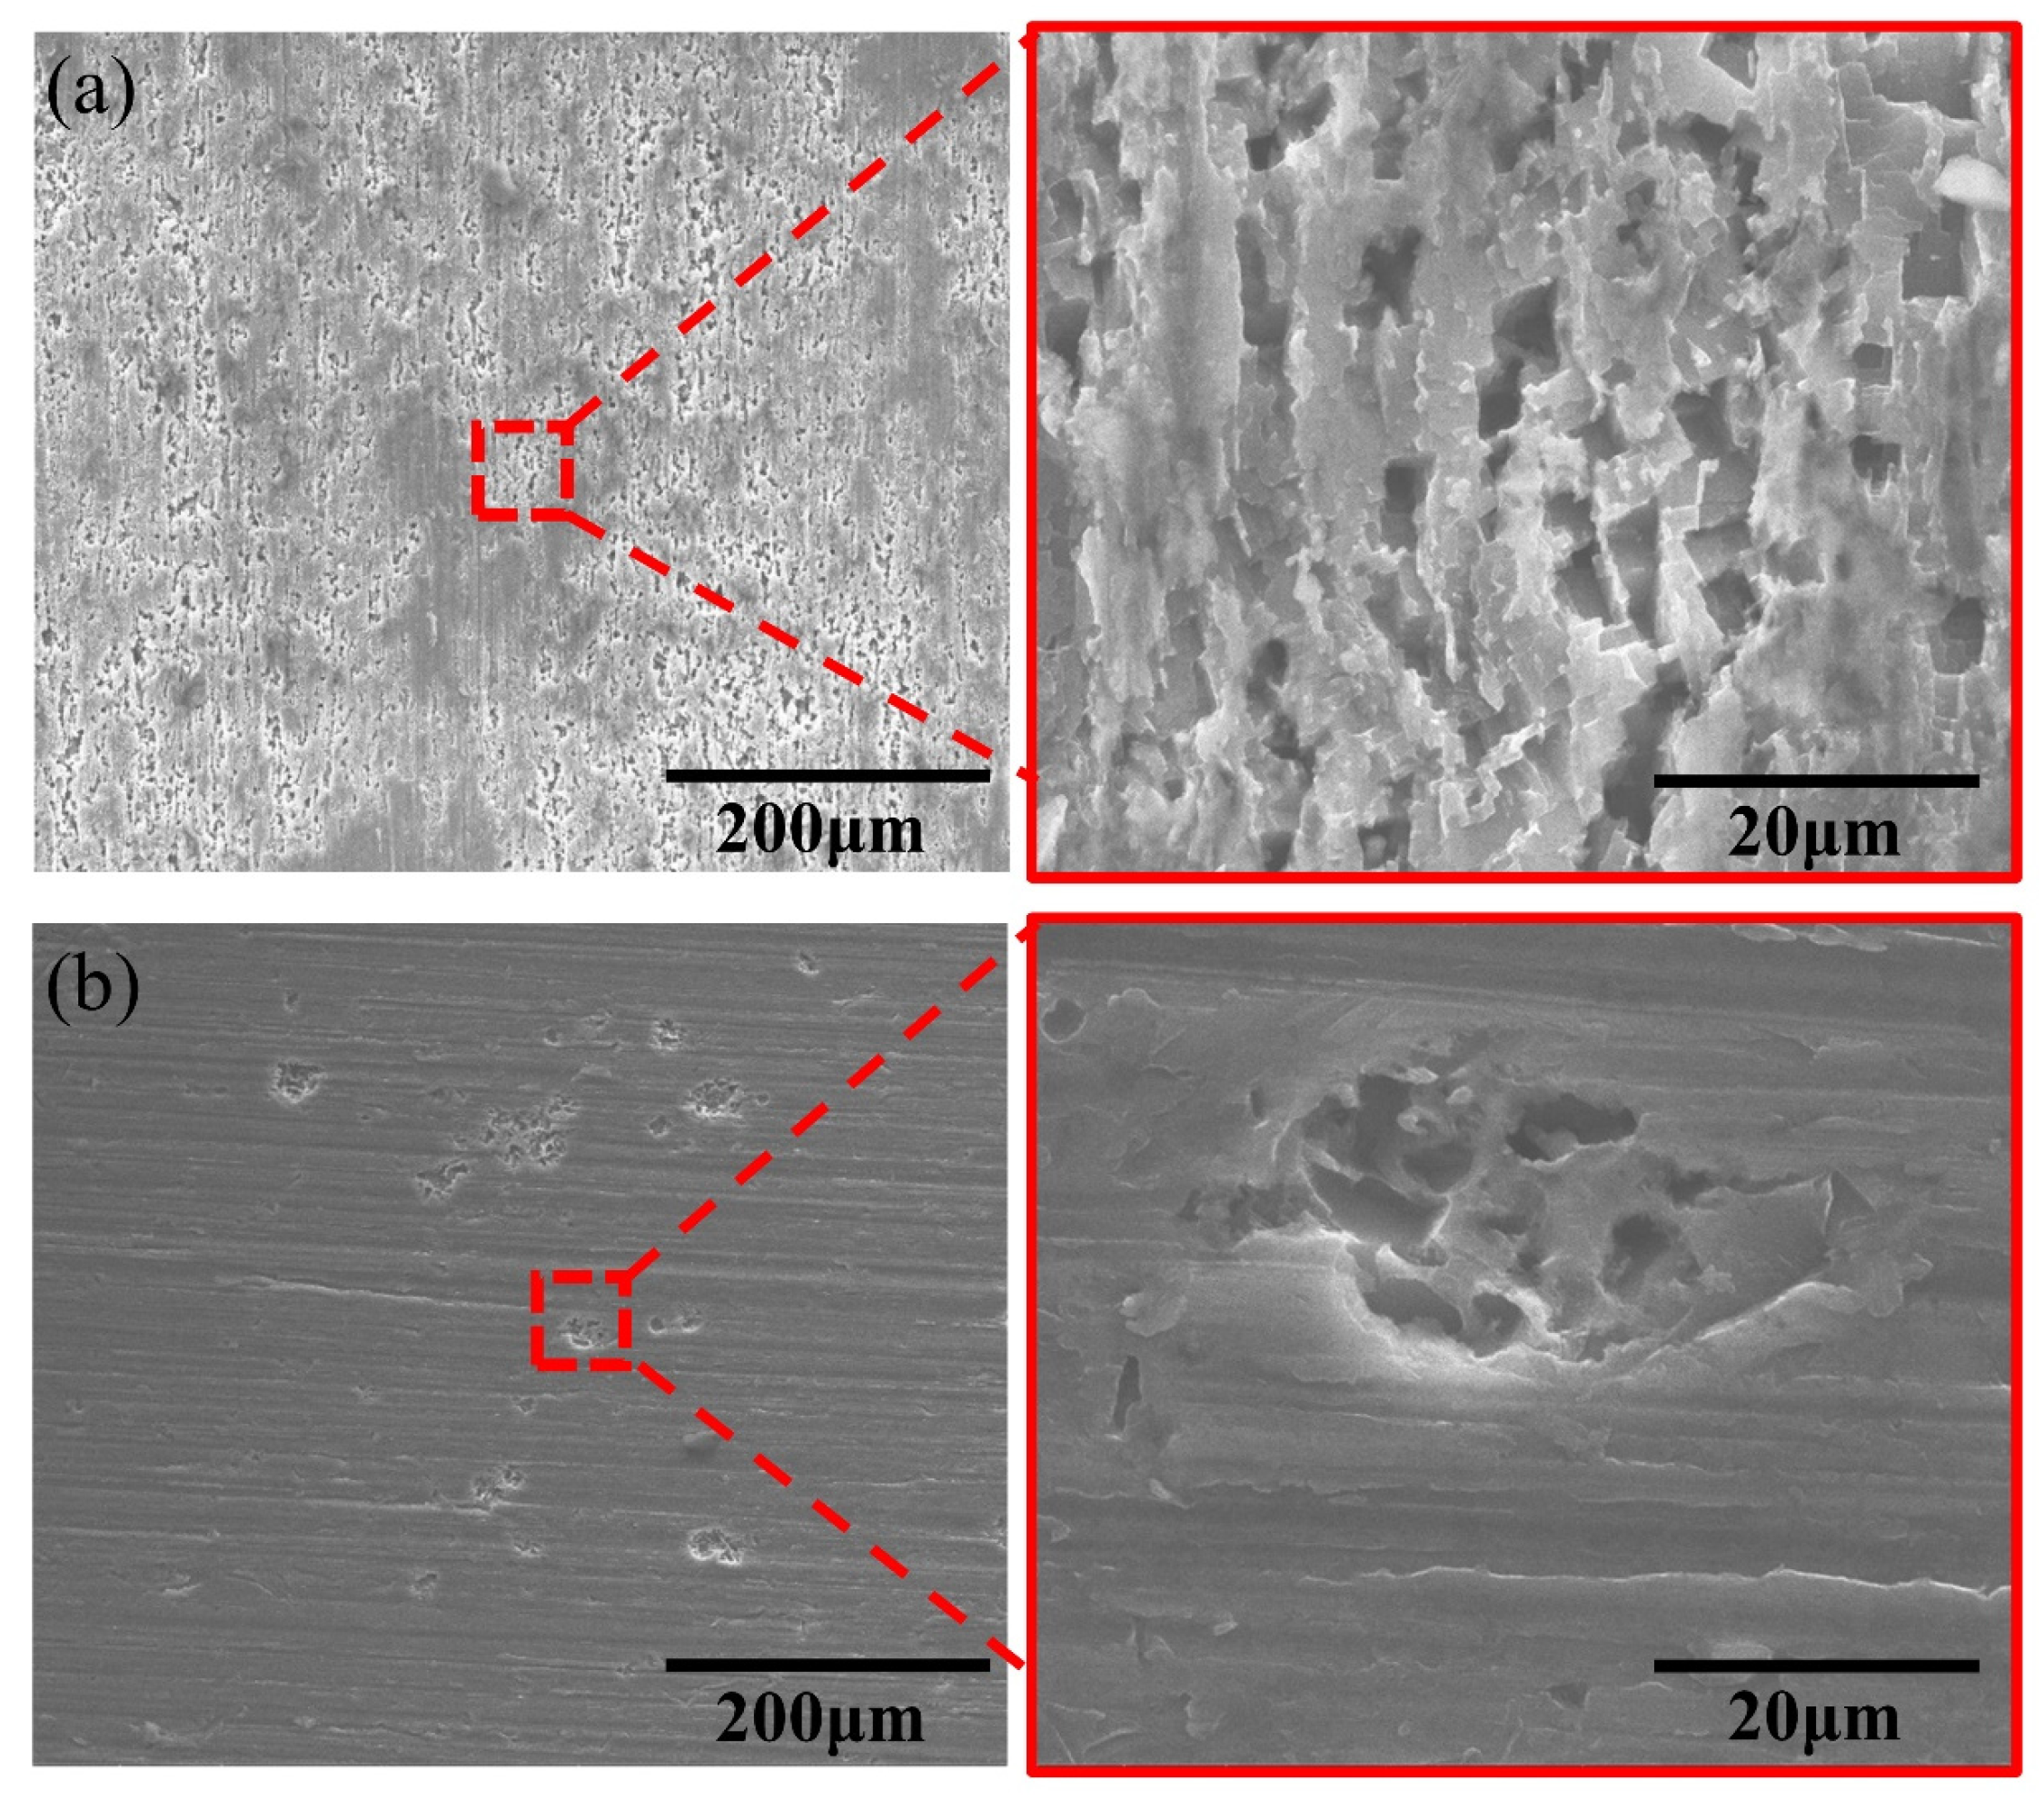
- In the electrochemical corrosion experiments, the center of the weld seam exhibited a higher open-circuit potential and corrosion potential than that of the base material. After corrosion occurred, the base material’s surface had more pitting corrosion pits and presented crystalline tunnels, while the welded area contained fewer corrosion pits. Therefore, the FZ was found to be more corrosion-resistant compared to the BM.
Author Contributions
Funding
Data Availability Statement
Acknowledgments
Conflicts of Interest
References
- Kota, P.K.; Myilsamy, G.; Ramalingam, V.V. Metallurgical Characterization and Mechanical Properties of Solid–Liquid Compound Casting of Aluminum Alloy: Steel Bimetallic Materials. Met. Mater. Int. 2022, 28, 1416–1422. [Google Scholar] [CrossRef]
- Wang, J.L.; Xu, J.; Pan, F. Effect of annealing on microstructure and properties of Er modified 5052 alloy. Results Phys. 2018, 10, 476–480. [Google Scholar] [CrossRef]
- Kang, S.G.; Shin, J. The effect of laser beam intensity distribution on weld characteristics in laser welded aluminum alloy (AA5052). Opt. Laser Technol. 2021, 142, 107239. [Google Scholar] [CrossRef]
- Fu, J.; Zhao, Y.; Zou, J.S.; Liu, X.; Pan, Y.F. Influence of the magnetic field on the melting and solidification behavior of narrow-gap laser welding with filler wire. Int. J. Adv. Manuf. Technol. 2022, 123, 1123–1131. [Google Scholar] [CrossRef]
- Verma, R.P.; Pandey, K.N.; András, K.; Khargotra, R.; Singh, T. Difficulties and redressal in joining of aluminium alloys by GMA and GTA welding: A review. J. Mater. Res. Technol. 2023, 23, 2576–2586. [Google Scholar] [CrossRef]
- Idriss, M.; Mirakhorli, F.; Desrochers, A.; Maslouhi, A. Overlap laser welding of 5052-H36 aluminum alloy: Experimental investigation of process parameters and mechanical designs. Int. J. Adv. Manuf. Technol. 2022, 119, 7653–7667. [Google Scholar] [CrossRef]
- Wang, D.L.; Diao, G.Y.; Liang, Z.M. Comparison of Al-Zn-Mg Alloy P-MIG Welded Joints Filled with Different Wires. High Temp. Mater. Process. 2019, 38, 516–524. [Google Scholar]
- Yan, S.H.; Ma, C.P.; Chen, H. Modifying microstructures and mechanical properties of laser-arc welded joints of dissimilar advanced aluminum alloys. Mater. Charact. 2020, 164, 110331. [Google Scholar] [CrossRef]
- Chen, S.; Zhan, X.; Zhao, Y.; Wu, Y.; Liu, D. Influence of Laser Power on Grain Size and Tensile Strength of 5A90 Al–Li Alloy T-joint Fabricated by Dual Laser-Beam Bilateral Synchronous Welding. Met. Mater. Int. 2021, 27, 1671–1685. [Google Scholar] [CrossRef]
- He, S.; Liu, L.; Zhao, Y.; Kang, Y.; Wang, F.; Zhan, X. Comparative investigation between fiber laser and disk laser: Microstructure feature of 2219 aluminum alloy welded joint using different laser power and welding speed. Opt. Laser Technol. 2021, 141, 107–121. [Google Scholar] [CrossRef]
- Omprakasam, S.; Marimuthu, K.; Yoganandh, J.; Raghu, R. Investigation of hot cracking susceptibility in welding of AA5052 aluminium alloy. Mater. Manuf. Process. 2023, 39, 269–279. [Google Scholar] [CrossRef]
- ISO 6892-1:2009; Metallic Materials—Tensile Testing—Part 1: Method of Test at Room Temperature. ISO: Geneva, Switzerland, 2019.
- Huang, S.; Yang, X.; Chen, H.; Cai, C.; Xu, L. Effect of droplet transfer on pore formation in laser-pulsed metal inert gas hybrid welding of A7N01P aluminum alloy. J. Laser Appl. 2020, 32, 012011. [Google Scholar] [CrossRef]
- Zhou, H.; Fu, F.; Dai, Z.; Qiao, Y.; Chen, J.; Yang, L.; Liu, W. Effect of Laser Power on Hybrid Laser-Gas Metal Arc Welding (GMAW) of a 6061 Aluminum Alloy. J. Korean Phys. Soc. 2020, 77, 991–996. [Google Scholar] [CrossRef]
- Wang, Z.; Cao, H.; Li, H.; Wang, D.; Xia, H.; Butt, H.A.; Li, M.; Liu, D. Effects of laser welding parameters on the porosity and acicular phase in SiCp/6092 aluminum matrix composite welded joints. J. Mater. Res. Technol. 2023, 23, 5127–5141. [Google Scholar] [CrossRef]
- Kang, X.; Yan, T.; Wang, L.; Gao, Q.; Zhan, X. Study on the distribution, element characteristics, and formation mechanism of porosity during laser welding for Ti-6Al-4V bottom-locking joint. Int. J. Adv. Manuf. Technol. 2022, 123, 2691–2701. [Google Scholar] [CrossRef]
- Huang, Y.; Yuan, Y.; Feng, Y.; Liu, J.; Yang, L.; Cui, L. Effect of activating flux Cr2O3 on microstructure and properties of laser welded 5083 aluminum alloys. Opt. Laser Technol. 2022, 150, 107930. [Google Scholar] [CrossRef]
- Wang, L.; Liu, Y.; Yang, C.; Gao, M. Study of porosity suppression in oscillating laser-MIG hybrid welding of AA6082 aluminum alloy. J. Mater. Process. Technol. 2021, 292, 117053. [Google Scholar] [CrossRef]
- Xu, B.; Liu, F.; Lin, D.; Han, X.; Chen, X.; Wu, L.; Chen, B.; Tan, C. Investigation of weld formation and porosity in 5052 aluminium alloy laser-GMA hybrid welding assisted by magnetic field with different orientations. Sci. Technol. Weld. Join. 2022, 27, 672–682. [Google Scholar] [CrossRef]
- Chen, L.; Wang, C.; Xiong, L.; Zhang, X.; Mi, G. Microstructural, porosity and mechanical properties of lap joint laser welding for 5182 and 6061 dissimilar aluminum alloys under different place configurations. Mater. Des. 2020, 191, 108625. [Google Scholar] [CrossRef]
- Farhadipour, P.; Omidi, N.; Barka, N.; Nadeau, F.; Idriss, M.; Ouafi, A.E. Systematic approach to improve overlap laser welding of AA5052-H32 with dissimilar thickness by evaluation of mechanical performance, undercut, and welding penetration. Int. J. Adv. Manuf. Technol. 2024, 130, 3387–3399. [Google Scholar] [CrossRef]
- Chu, Q.; Bai, R.; Jian, H.; Lei, Z.; Hu, N.; Yan, C. Microstructure, texture and mechanical properties of 6061 aluminum laser beam welded joints. Mater. Charact. 2018, 137, 269–276. [Google Scholar] [CrossRef]
- Huang, L.; Wu, D.; Hua, X.; Liu, S.; Jiang, Z.; Li, F.; Wang, H.; Shi, S. Effect of the welding direction on the microstructural characterization in fiber laser-GMAW hybrid welding of 5083 aluminum alloy. J. Manuf. Process. 2018, 31, 514–522. [Google Scholar] [CrossRef]
- Abioye, T.E.; Zuhailawati, H.; Aizad, S.; Anasyida, A.S. Geometrical, microstructural and mechanical characterization of pulse laser welded thin sheet 5052-H32 aluminium alloy for aerospace applications. Trans. Nonferrous Met. Soc. China 2019, 29, 667–679. [Google Scholar] [CrossRef]
- Ramiarison, H.; Barka, N.; Mirakhorli, F.; Nadeau, F.; Pilcher, C. Parameter optimization for laser welding of dissimilar aluminum alloy: 5052-H32 and 6061-T6 considering wobbling technique. Int. J. Adv. Manuf. Technol. 2022, 118, 4195–4211. [Google Scholar] [CrossRef]
- Ramiarison, H.; Barka, N.; Pilcher, C.; Stiles, E.; Larrimore, G.; Amira, S. Weldability improvement by wobbling technique in high power density laser welding of two aluminum alloys: Al-5052 and Al-6061. J. Laser Appl. 2021, 33, 032015. [Google Scholar] [CrossRef]
- Yang, Y.; Zhou, W.; Tong, Z.; Chen, L.; Yang, X.; Larson, E.A.; Ren, X. Electrochemical Corrosion Behavior of 5083 Aluminum Alloy Subjected to Laser Shock Peening. J. Mater. Eng. Perform. 2019, 28, 6081–6091. [Google Scholar] [CrossRef]
- Yadav, V.K.; Gaur, V.; Singh, I.V. Corrosion-fatigue behavior of welded aluminum alloy 2024-T3. Int. J. Fatigue 2023, 173, 107675. [Google Scholar] [CrossRef]
- Yan, S.; Xing, B.; Zhou, H.; Xiao, Y.; Qin, Q.H.; Chen, H. Effect of filling materials on the microstructure and properties of hybrid laser welded Al-Mg-Si alloys joints. Mater. Charact. 2018, 144, 205–218. [Google Scholar] [CrossRef]
- Narsimhachary, D.; Rai, P.K.; Shariff, S.M.; Padmanabham, G.; Mondal, K.; Basu, A. Corrosion Behavior of Laser-Brazed Surface Made by Joining of AA6082 and Galvanized Steel. J. Mater. Eng. Perform. 2019, 28, 2115–2127. [Google Scholar] [CrossRef]


| Mg | Si | Cu | Zn | Mn | Cr | Fe | Al | |
|---|---|---|---|---|---|---|---|---|
| AA5052 | 2.6 | 0.05 | 0.00 | 0.03 | 0.06 | 0.20 | 0.14 | Bal. |
| ER4043 | 0.10 | 4.5 | 0.04 | / | / | / | 0.04 | Bal. |
| Parameters | Value | Units |
|---|---|---|
| Laser power | 2.5~4.5, ∆ = 0.5 | kW |
| Welding speed | 30 | mm/s |
| Wire-feeding speed | 3.2 | m/min |
| Defocus distance | 0 | mm |
| Distance between laser and welding wire | 3 | mm |
| Power (kW) | Weld Surface Morphology | Longitudinal Section | Porosity |
|---|---|---|---|
| 2.5 | 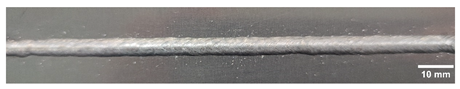 | 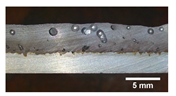 | 9.84% |
| 3.0 | 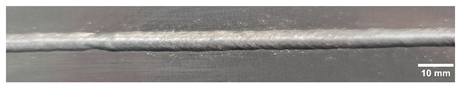 |  | 14.30% |
| 3.5 |  |  | 15.31% |
| 4.0 |  | 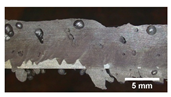 | 6.54% |
| 4.5 | 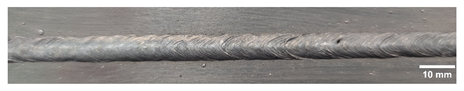 |  | 4.60% |
| Power (kW) | Tensile Strength (MPa) | Elongation (%) |
|---|---|---|
| BM | 232.20 | 14.98 |
| 2.5 | 119.91 | 9.65 |
| 3.0 | 180.00 | 8.44 |
| 3.5 | 192.61 | 10.10 |
| 4.0 | 205.81 | 8.53 |
| 4.5 | 190.84 | 9.02 |
| Region | EOCP (V) | Ecorr (V) | Icorr (A/cm2) |
|---|---|---|---|
| BM | −0.751 | −0.716 | 7.949 × 10⁻⁶ |
| P = 2.5 kW | −0.727 | −0.699 | 1.116 × 10⁻⁷ |
| P = 3.0 kW | −0.725 | −0.676 | 1.377 × 10⁻⁷ |
| P = 3.5 kW | −0.720 | −0.637 | 1.400 × 10⁻⁷ |
| P = 4.0 kW | −0.719 | −0.651 | 2.055 × 10⁻⁶ |
| P = 4.5 kW | −0.675 | −0.677 | 2.669 × 10⁻⁸ |
Disclaimer/Publisher’s Note: The statements, opinions and data contained in all publications are solely those of the individual author(s) and contributor(s) and not of MDPI and/or the editor(s). MDPI and/or the editor(s) disclaim responsibility for any injury to people or property resulting from any ideas, methods, instructions or products referred to in the content. |
© 2024 by the authors. Licensee MDPI, Basel, Switzerland. This article is an open access article distributed under the terms and conditions of the Creative Commons Attribution (CC BY) license (https://creativecommons.org/licenses/by/4.0/).
Share and Cite
Jia, P.; Zhang, S.; Zhou, J.; Liu, F.; Xiao, F. Research on the Microstructures and Properties of AA5052 Laser-Welded Joints with the ER4043 Filler Wire. Metals 2024, 14, 1030. https://doi.org/10.3390/met14091030
Jia P, Zhang S, Zhou J, Liu F, Xiao F. Research on the Microstructures and Properties of AA5052 Laser-Welded Joints with the ER4043 Filler Wire. Metals. 2024; 14(9):1030. https://doi.org/10.3390/met14091030
Chicago/Turabian StyleJia, Panpan, Shuming Zhang, Jiahao Zhou, Fang Liu, and Fei Xiao. 2024. "Research on the Microstructures and Properties of AA5052 Laser-Welded Joints with the ER4043 Filler Wire" Metals 14, no. 9: 1030. https://doi.org/10.3390/met14091030
APA StyleJia, P., Zhang, S., Zhou, J., Liu, F., & Xiao, F. (2024). Research on the Microstructures and Properties of AA5052 Laser-Welded Joints with the ER4043 Filler Wire. Metals, 14(9), 1030. https://doi.org/10.3390/met14091030