Article

Evaluation of Shear-Punched Surface Layer Damage in Ultrahigh-Strength TRIP-Aided Steels with Bainitic Ferrite and/or Martensite Matrix Structure

1
Graduate School of Science and Technology, Shinshu University, Nagano 380-8553, Japan
2
Graduate School of Science and Engineering, Ibaraki University, Hitachi 316-8511, Japan
3
Graduate School of Engineering, Tohoku Gakuin University, Sendai 980-8588, Japan
*
Author to whom correspondence should be addressed.
Metals 2024, 14(9), 1034; https://doi.org/10.3390/met14091034
Submission received: 10 August 2024 / Revised: 6 September 2024 / Accepted: 9 September 2024 / Published: 11 September 2024

Abstract

:
The damage to the shear-punched surface layers such as strain-hardening, strain-induced martensite transformation, and micro-void initiation behaviors was evaluated in the third-generation low-carbon advanced ultrahigh-strength TRIP-aided bainitic ferrite (TBF), bainitic ferrite–martensite (TBM), and martensite (TM) steels. In addition, the surface layer damage was related to (1) the mean normal stress generated during shear-punching and (2) microstructural properties such as the matrix structure, retained austenite characteristics, and second-phase properties. The shear-punched surface layer damage was produced under the mean normal stress between zero and negative in all the steels. The TBM and TM steels achieved relatively small surface layer damage. The small surface layer damage resulted in excellent cold stretch-flangeability, with a high crack-propagation/void-connection resistance on hole expansion.

1. Introduction

Since the 1970s, various first-, second-, and third-generation advanced high-strength steels (AHSSs) have been developed [1,2,3,4]. Recently, the development of new third-generation AHSSs with a high combination of cold formability and tensile strength is required for improving the large weight reduction and crash safety of automobiles. The third-generation AHSSs are classified into the following three groups with different matrix structures.
  • BF group: TRIP-aided bainitic ferrite (TBF) steel [5,6,7,8], carbide-free bainitic steel [9,10,11], and duplex-type medium Mn (D-MMn) steel [12,13,14].
  • BF/PM group: TRIP-aided bainitic ferrite/martensite (TBM) steel [5], quenching and partitioning (Q&P) steel [6,7,8,15,16,17,18], and Q&P-type medium Mn steel [19].
  • PM group: TRIP-aided martensitic (TM) steel [5] and martensite-type medium Mn (M-MMn) steel [20].
In the third-generation AHSSs, BF, BF/PM, and PM groups have the matrix structures of bainitic ferrite (BF), bainitic ferrite–primary martensite (BF/PM), and primary martensite (PM), respectively. The tensile strengths of these AHSSs increase with a volume fraction of primary martensite. Kobayashi et al. [5] found that the TBM steel of the BF/PM group and the TM steel of the PM group possess extremely high cold stretch-formability and stretch-flangeability, as shown in Figure 1.
The high cold stretch-flangeability of the TBM and TM steels is mainly associated with (1) the shear-punched surface layer damage on hole-punching such as strain-hardening, strain-induced martensite transformation, and micro-crack/void initiation behaviors and (2) crack-propagation/void-connection resistance on hole-expanding [5,22]. However, the detailed behaviors in the shear-punched surface layer damage which are mainly controlled by the mean normal stress and microstructural properties such as the matrix structure, retained austenite characteristics, and second-phase properties have not been quantitatively evaluated in TBM and TM steels, as well as TBF steel.
This research investigates the strain-hardening, strain-induced transformation, and micro-void initiation behaviors in the punched surface layers of the low-carbon TBF, TBM, and TM steels. In addition, the behaviors are related to the mean normal stress and microstructural properties. Furthermore, the excellent cold stretch-flangeability of TBM and TM steels is related to the shear-punched surface layer damage on hole-punching and crack-propagation/void-connection resistance on hole expansion.

2. Material and Methods

A 100 kg low-carbon steel slab with a chemical composition shown in Table 1 was prepared by vacuum melting. Then, the slab was heated to 1200 °C and hot-rolled to 13 mm diameter at a finish temperature of 850 °C, followed by air-cooling to room temperature. The martensite-start (Ms) and -finish (Mf) temperatures are shown in Table 1. Tensile specimens (JIS-14A, 25 mm length, 5 mm diameter) parallel to the rolling direction were machined from the hot-rolled bars. Hole punching samples with 10 mm width, 150 mm length, and 1.2 mm thickness were sliced from a 1/2 radius of the hot-rolled bars in the longitudinal direction (Figure 2a) [22].
All the specimens were subjected to the heat treatment of austenitizing and isothermal transformation (IT) process using two salt baths [21]. First, the specimens were heated at 910 °C for 1200 s (>A3). Subsequently, they were cooled to IT temperatures and held for 1000 s, followed by quenching in an oil bath at 50 °C. To produce TBF, TBM, and TM steels, the IT temperatures of TIT = 410 °C (>Ms), 350 °C (between Ms, and Mf), and 200 °C (<Mf) were adopted, respectively. The IT temperatures achieved the maximum retained austenite fraction in each IT temperature range.
The microstructure of the TBF, TBM, and TM steels was observed at a 1/2 radius of the hot-rolled bars by a field-emission scanning electron microscopy (FE-SEM; JSM-6500F, JEOL Ltd., Akishima, Tokyo, Japan) with an electron backscatter diffraction system (EBSD; OIM system, TexSEM Laboratories, Inc., Prova, UT, USA). The EBSD analysis was conducted in an area of 40 × 40 μm2 with a beam diameter of 1.0 μm and a beam step size of 0.15 μm operated at an acceleration voltage of 25 kV. The FE-SEM–EBSD analysis specimens were first ground with alumina powder and colloidal silica, and then were prepared by ion thinning.
The retained austenite characteristics, equivalent plastic strain, hardness, and micro-void initiation characteristics in the shear-punched surface layers were evaluated. The retained austenite characteristics of the steels were evaluated by an X-ray diffractometer (RINT2000, Rigaku Co., Akishima, Tokyo, Japan). The cross-section of the specimen surfaces was electropolished after being ground with emery paper (#1200). The volume fraction of the retained austenite phase (fγ, vol.%) was quantified from the integrated intensity of the (200)α, (211)α, (200)γ, (220)γ, and (311)γ peaks obtained by X-ray diffractometry using Mo-Kα radiation [23]. The carbon concentration in the retained austenite (Cγ, mass%) was estimated from the empirical equation proposed by Dyson and Holmes [24]. To accomplish this, the lattice constant of retained austenite was determined from the (200)γ, (220)γ, and (311)γ peaks of the Cu-Kα radiation.
An equivalent plastic strain ( ε ¯ p) in the shear-punched surface layers was estimated from a half-width (HW) of X-ray (211)α peak using Cu-Kα radiation [25]. In this case, the linear relationships between the HW and ε ¯ p in the present steels deformed in tension, torsion, and compression (Figure 3) previously reported by Sugimoto et al. [21] were applied. The relationships are similar to the Williamson–Hall equation [26,27]. The mean Vickers hardness (HV0.1) measured at three locations was obtained using a Vickers microhardness tester (Shimadzu Co., DUH-201H, Kyoto, Japan) with a load of 0.98 N. The micro-void initiation behavior was observed by the above-mentioned FE-SEM.
Tensile tests were conducted on a tensile testing machine (AD-10TD, Shimadzu Co., Kyoto, Japan) at 25 °C and a crosshead speed of 10 mm/min. (or a mean strain rate of 2.8 × 10⁻³/s). The tensile displacement was measured using a strain gauge extensometer. Shear punching was carried out at 25 °C and a punching rate of 10 mm/minute, with a shearing clearance between the die and punch of 12% (Figure 2b). The punch diameter was 4.76 mm and the hole diameter was 5.00 mm. The dimensions of the die set were made from JIS-SKD61 hot die steel. The tensile and shear-punching tests were carried out using three specimens each.

3. Results

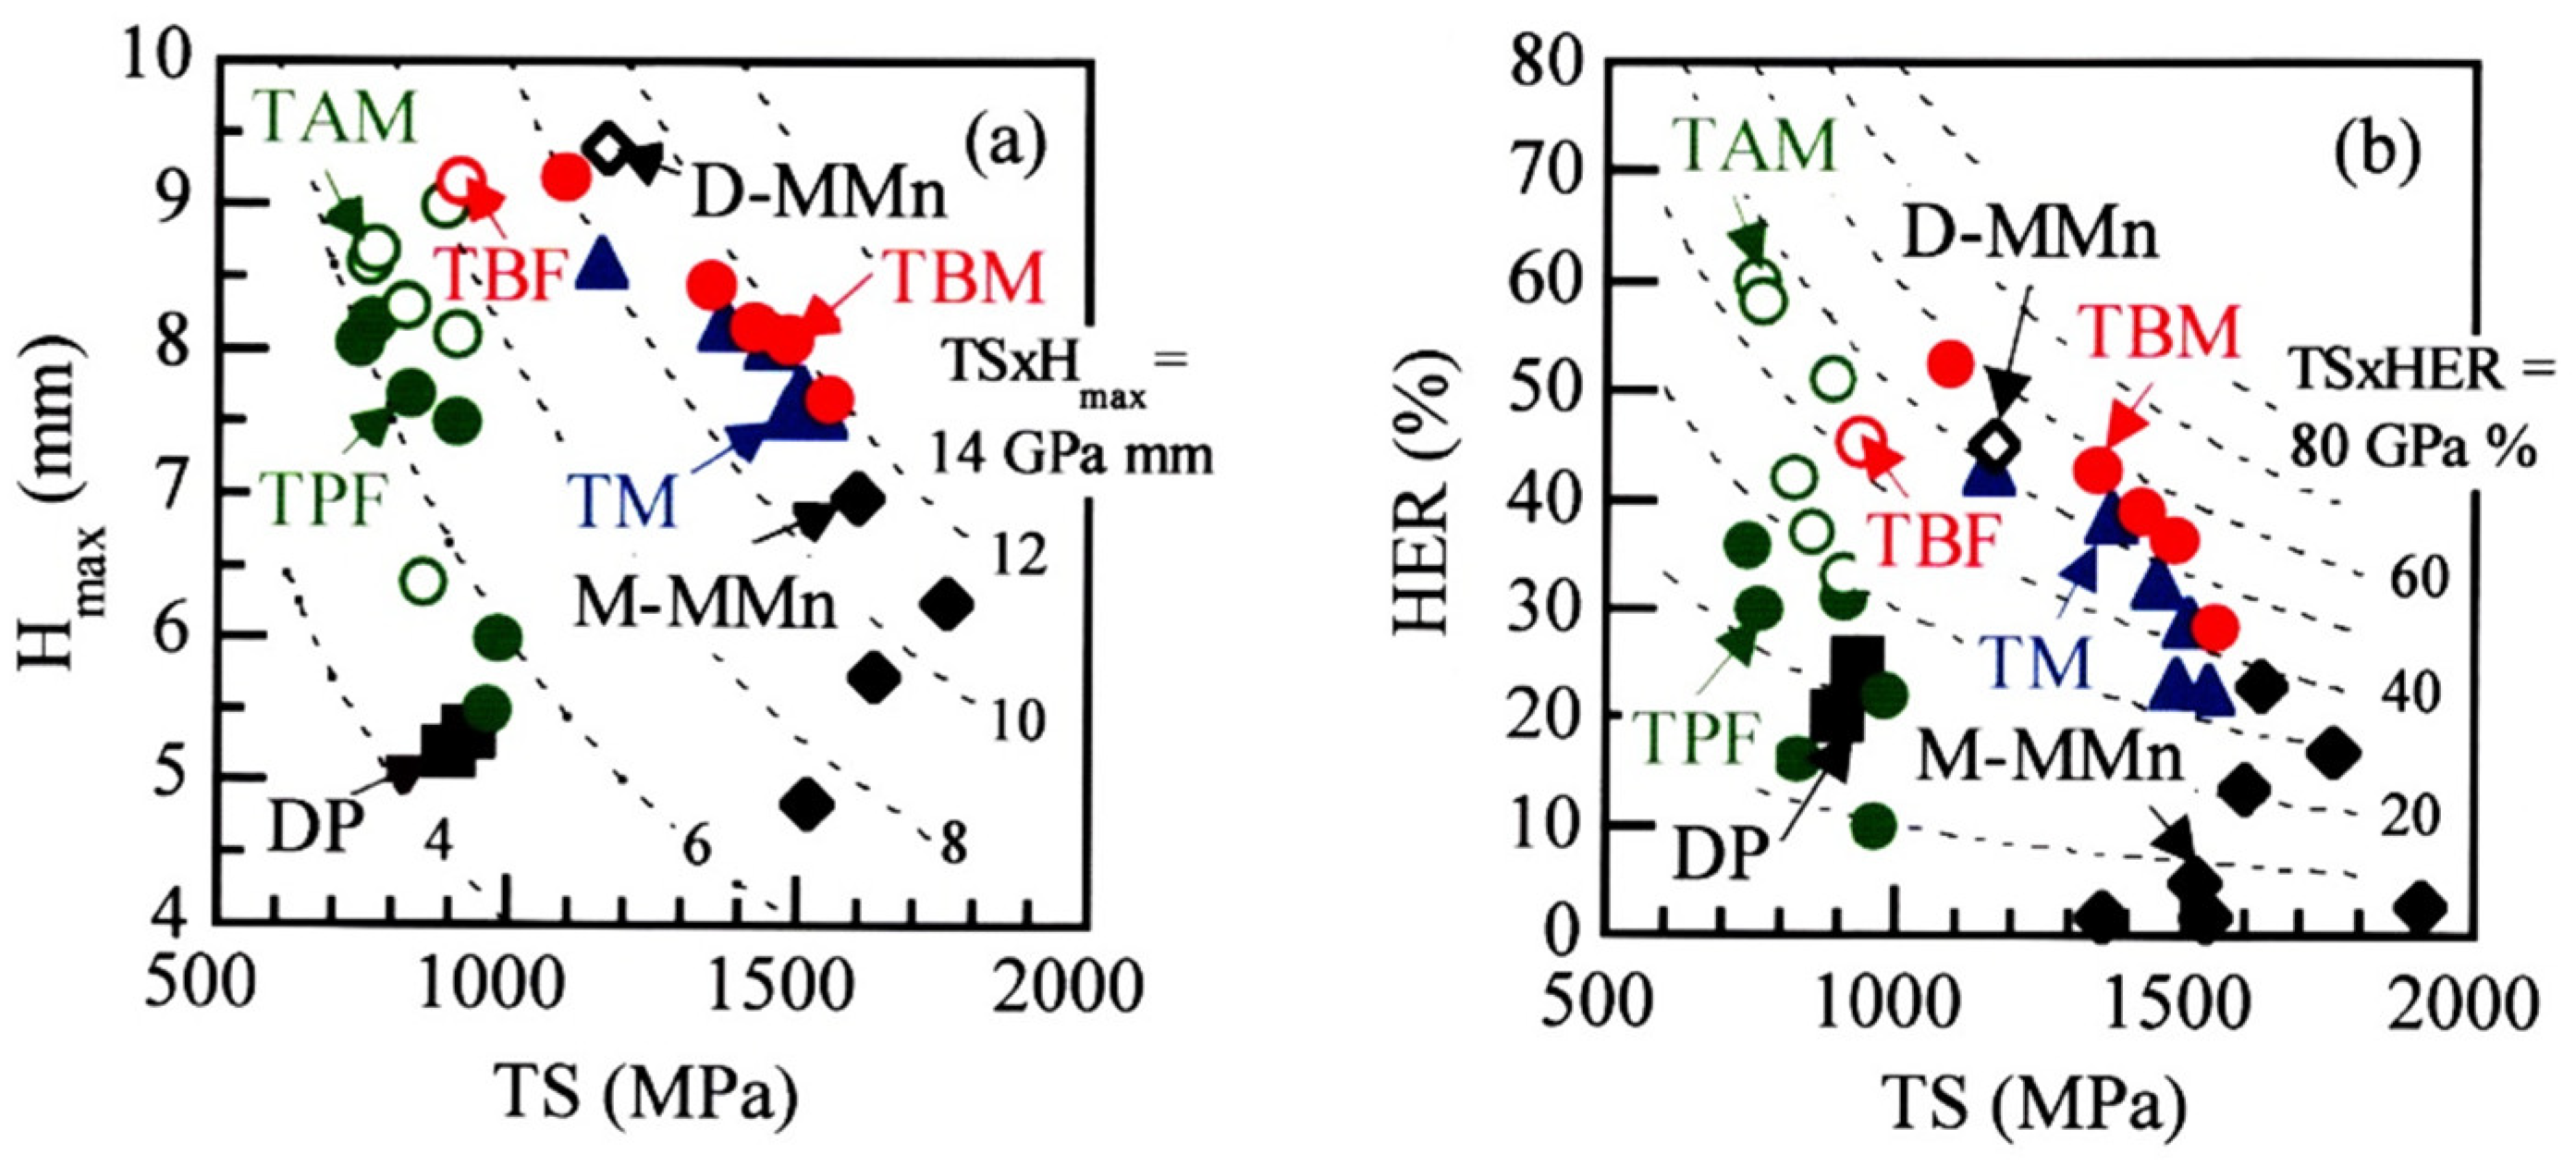
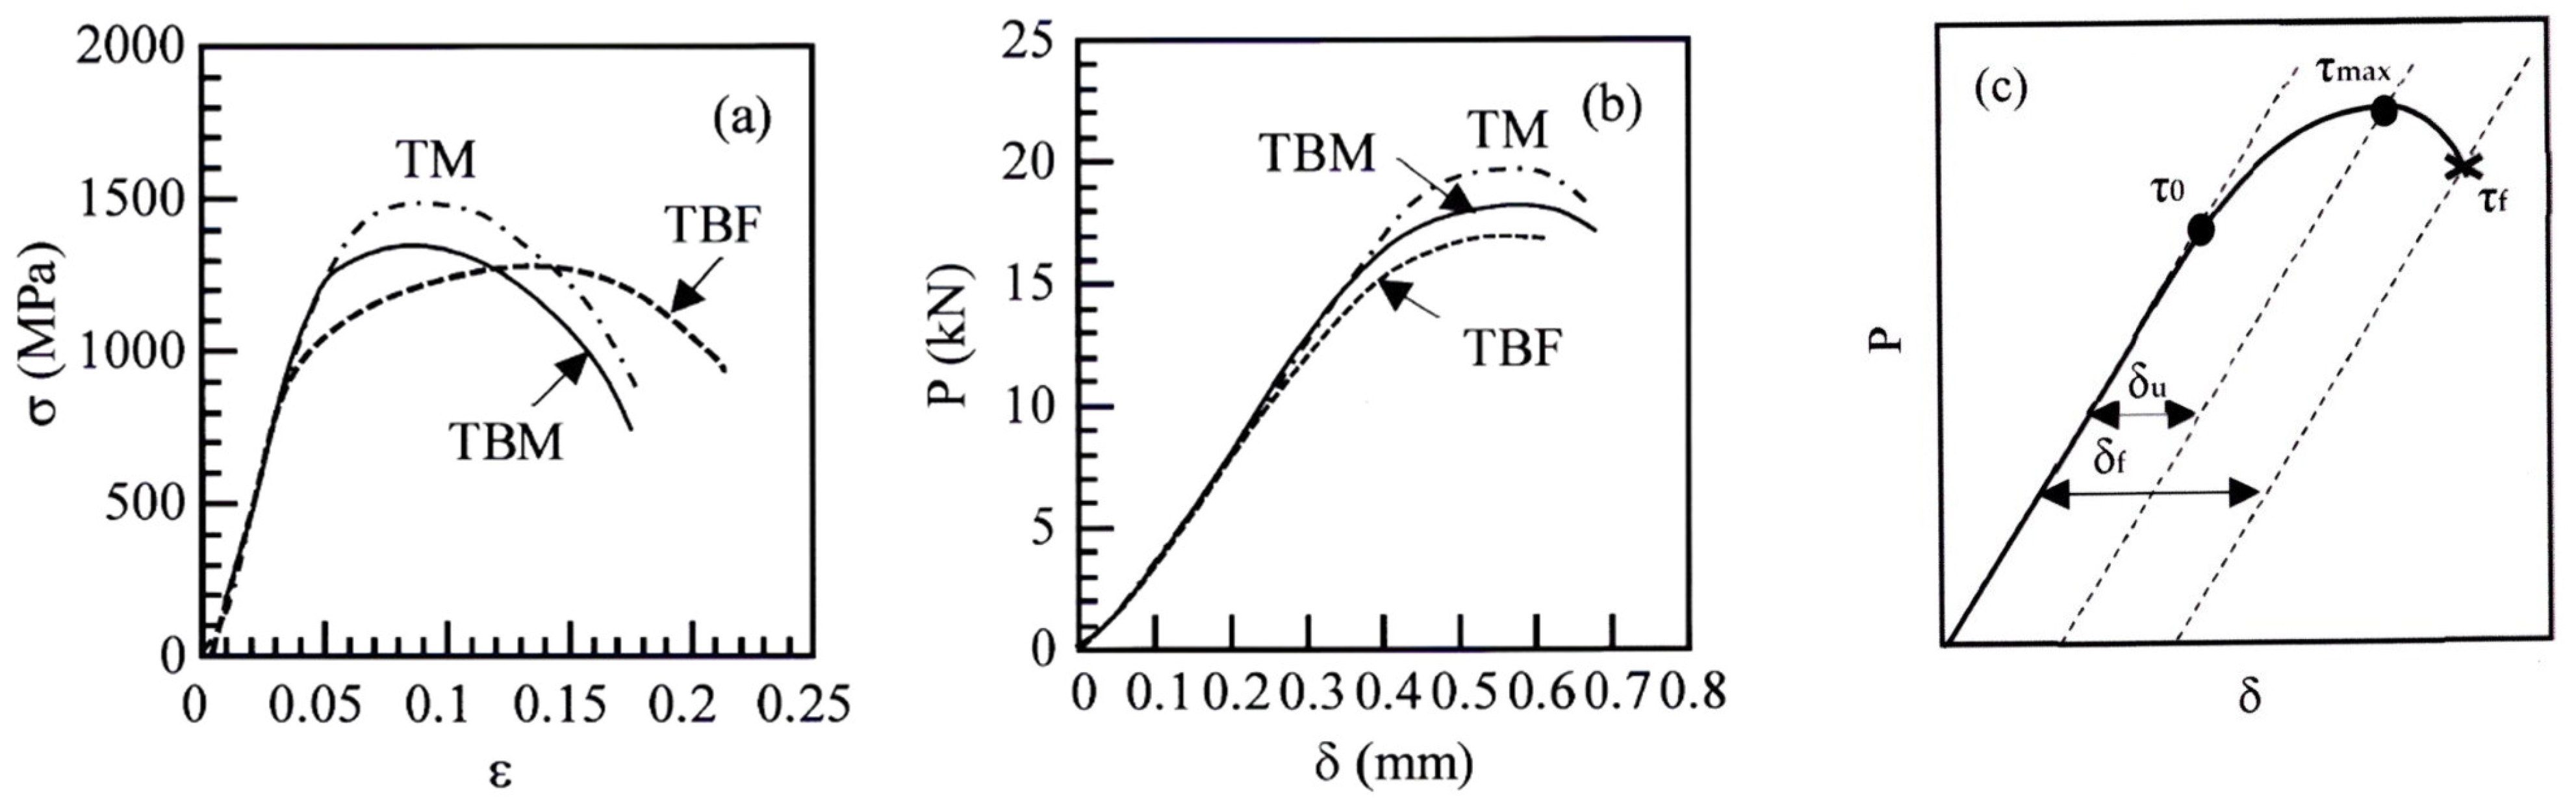
3.1. Microstructure and Tensile Properties

Figure 4 shows the FE-SEM/EBSD images of the TBF, TBM, and TM steels. The matrix structures of the TBF, TBM, and TM steels are bainitic ferrite, bainitic ferrite–primary martensite, and primary martensite, respectively. These steels contain the initial retained austenite fractions of fγ0 = 11.4, 7.2, and 5.5 vol.% with the initial carbon concentrations of Cγ0 = 0.65, 1.08, and 0.45 mass%, respectively (Table 2). The products of fγ0 and Cγ0 (fγ0 × Cγ0) of the TBF, TBM, and TM steels are fγ0 × Cγ0 = 0.074, 0.078, and 0.024 mass%, respectively. Note that the fγ0 × Cγ0 of TM steel is considerably low. Most of the retained austenite is located along the bainitic ferrite and primary martensite lath boundaries, with a small number of isolated ones, in the same way as reported by Kobayashi et al. [5]. The retained austenite size is the smallest in the TM steel.
When the k-value (the strain-induced transformation factor) defined by the following equation was calculated, the k-value of the TM steel was the highest [21] (Table 2).
k = ( ln   f γ 0   ln   f γ ) / ε ¯ p
where fγ is the volume fraction of the retained austenite in the steels subjected to an equivalent plastic strain of ε ¯ p. In this study, the k-values were quantified in an equivalent plastic strain range of ε ¯ P = 0 and 0.6. The high k-value means the low mechanical stability of the retained austenite. Notably, the MA phases (the mixed phases of secondary martensite–retained austenite) of fMA = 2.0, 10.8, and 15.8 vol.% exist along the prior austenitic grain boundary in the TBF TBM, and TM steels, respectively. The TM steel has the largest size of the MA phase (Figure 4f).
Figure 5a shows the engineering tensile stress−strain curves of the TBF, TBM, and TM steels. The tensile properties of these steels are shown in Table 2. The yield stress and tensile strength of the TM steel are higher than those of the TBF and TBM steels. The TBF steel possesses the largest uniform and total elongations, although the true fracture strain is lower than those of the TBM and TM steels. This is associated with the high strain-hardening in a large strain range resulting from the TRIP effect of a large amount of retained austenite.

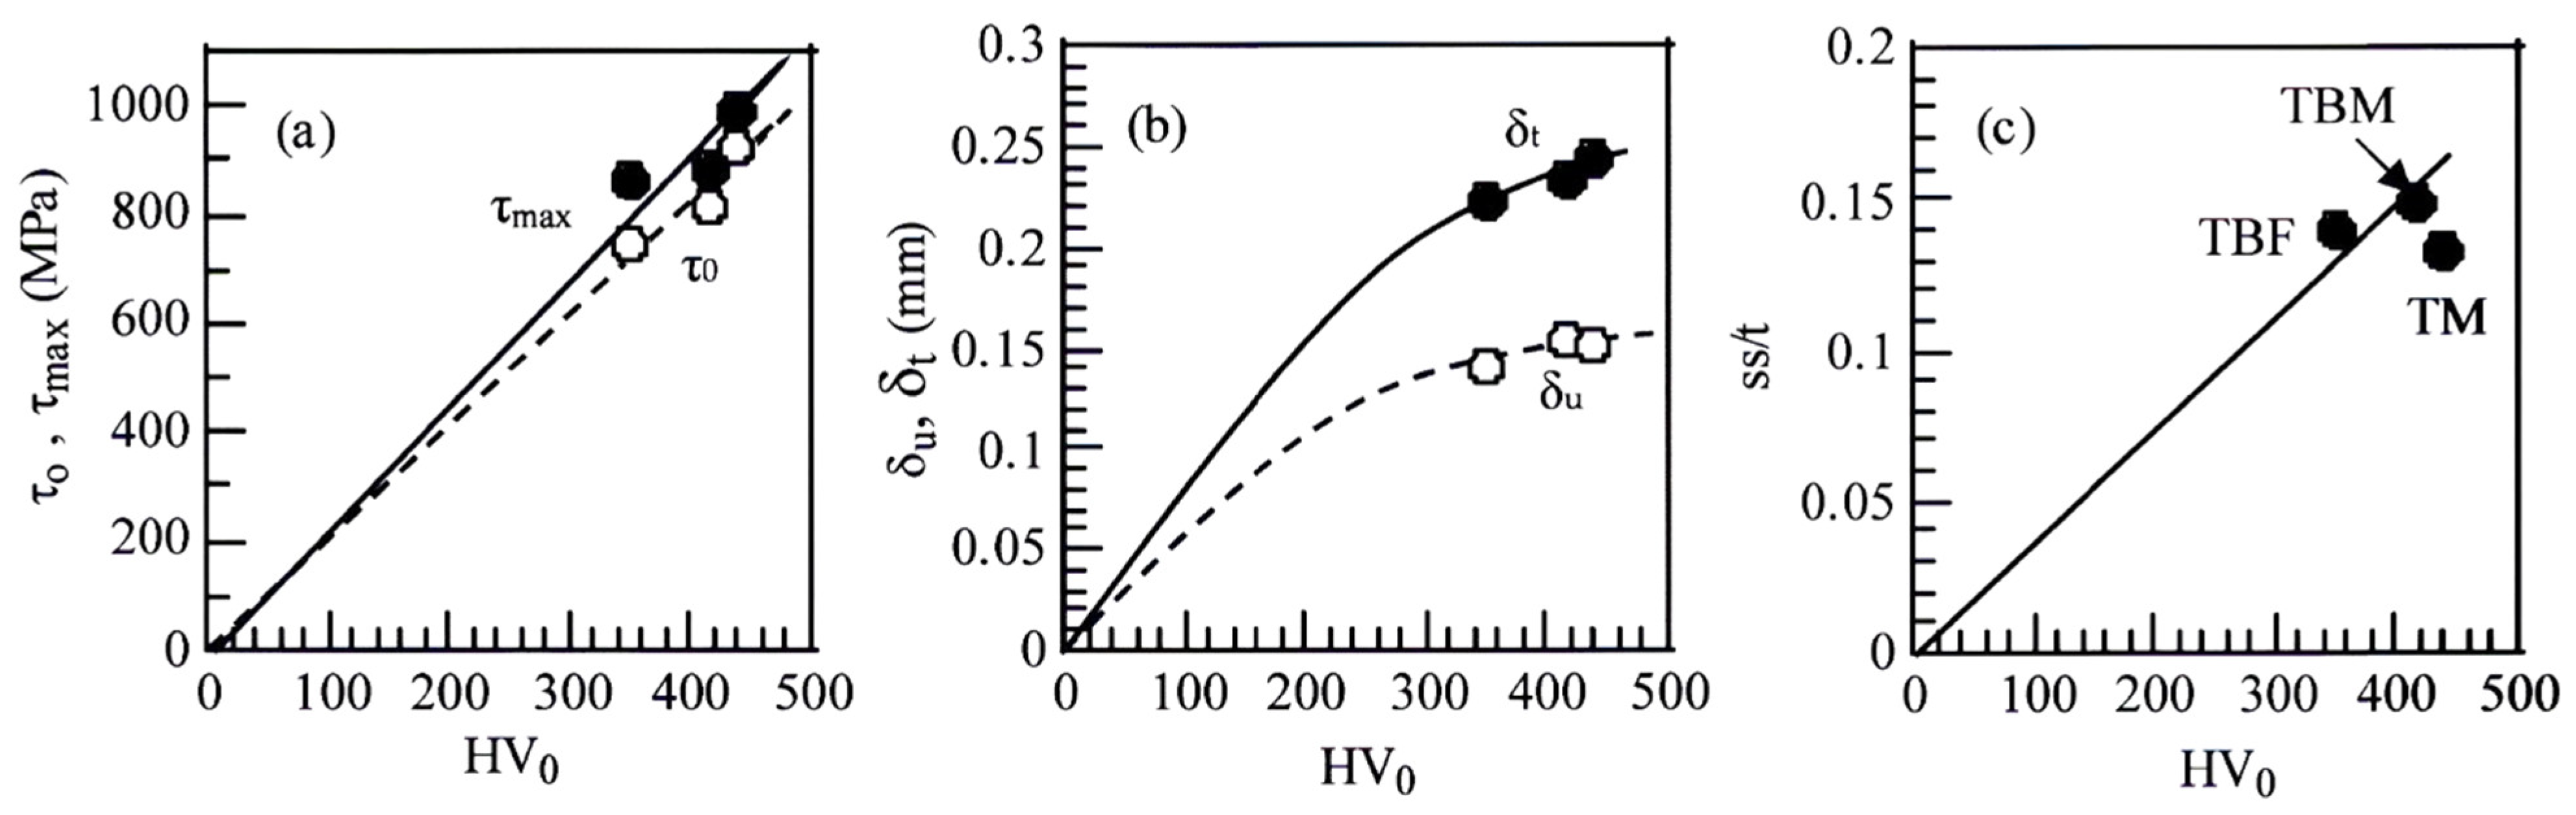
3.2. Shear-Punching Properties

Figure 5b shows the punching load−stroke curves of the TBF, TBM, and TM steels. When the curves were compared to the engineering tensile stress−strain curves of Figure 5a, the punching load exhibited a similar tendency to the engineering tensile stress. However, the total shear displacement or maximum stroke of the TBF steel is lower than those of the TBM and TM steels. The shear-punching properties defined in Figure 5c are shown in Table 3.
Figure 6 shows the appearance of the macroscopic shear-punched hole surfaces of the TBF, TBM, and TM steels. The shear-punched surface region consists of a shear section (ss) and a break section (bs) in all the steels. The round portions of these steels are so small that they can be ignored.
Figure 7 shows the variations in the punching yield shear stress or 0.2% offset proof shear stress (τ0), punching maximum shear stress (τmax), uniform shear displacement (δu), total shear displacement (δt), and the ratio of shear section length to sheet thickness (ss/t) as a function of the original Vickers hardness (HV0). These shear-punching properties defined in Figure 5c [22] are shown in Table 3. All the shear-punching properties increase with increasing original Vickers hardness. As shown in Figure 7c, the ss/ts of the TBF and TBM steels are slightly higher than that of the TM steel.

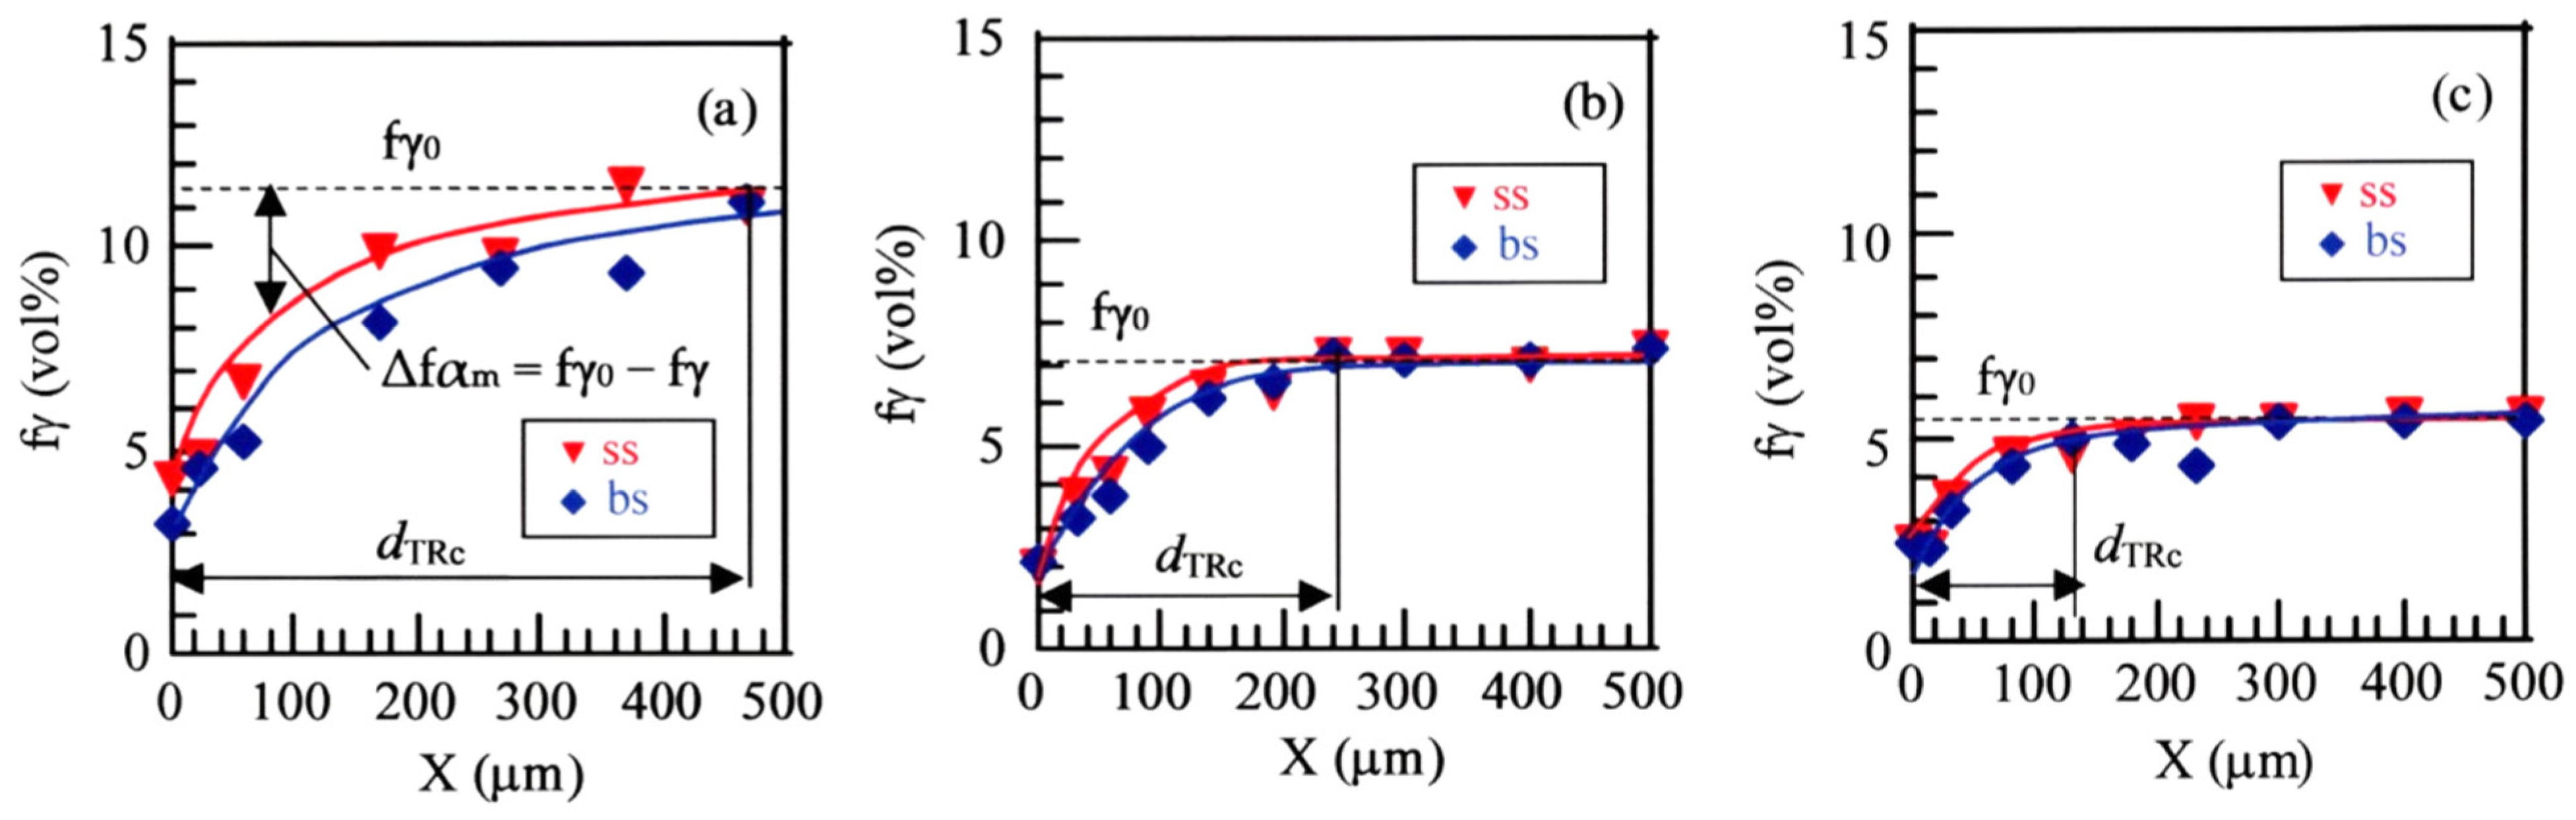
3.3. Strain-Induced Martensite Fraction Distribution

Figure 8 shows the variations in the untransformed retained austenite fraction in the depth direction (X-direction) at the shear and break sections in the TBF, TBM, and TM steels. The retained austenite fraction considerably decreases near the shear-punched surface in all the steels. The largest strain-induced martensite fraction (∆fαm = fγ0fγ) is obtained in the TBF steel, followed in order by the TBM and TM steels. When the critical depth corresponding to non-transformation is defined by “dTRc”, the dTRcs are 470, 240, and 130 μm in the TBF, TBM, and TM steels, respectively. Namely, the dTRc is the smallest in the TM steel. All the steels’ untransformed retained austenite fractions of the break section are lower than those of the shear section. Namely, the strain-induced martensite transformation of the retained austenite is promoted at the break section compared to at the shear section. However, the untransformed retained austenite fraction of the break section is nearly the same or slightly lower than that of the shear section in the TBM and TM steels.

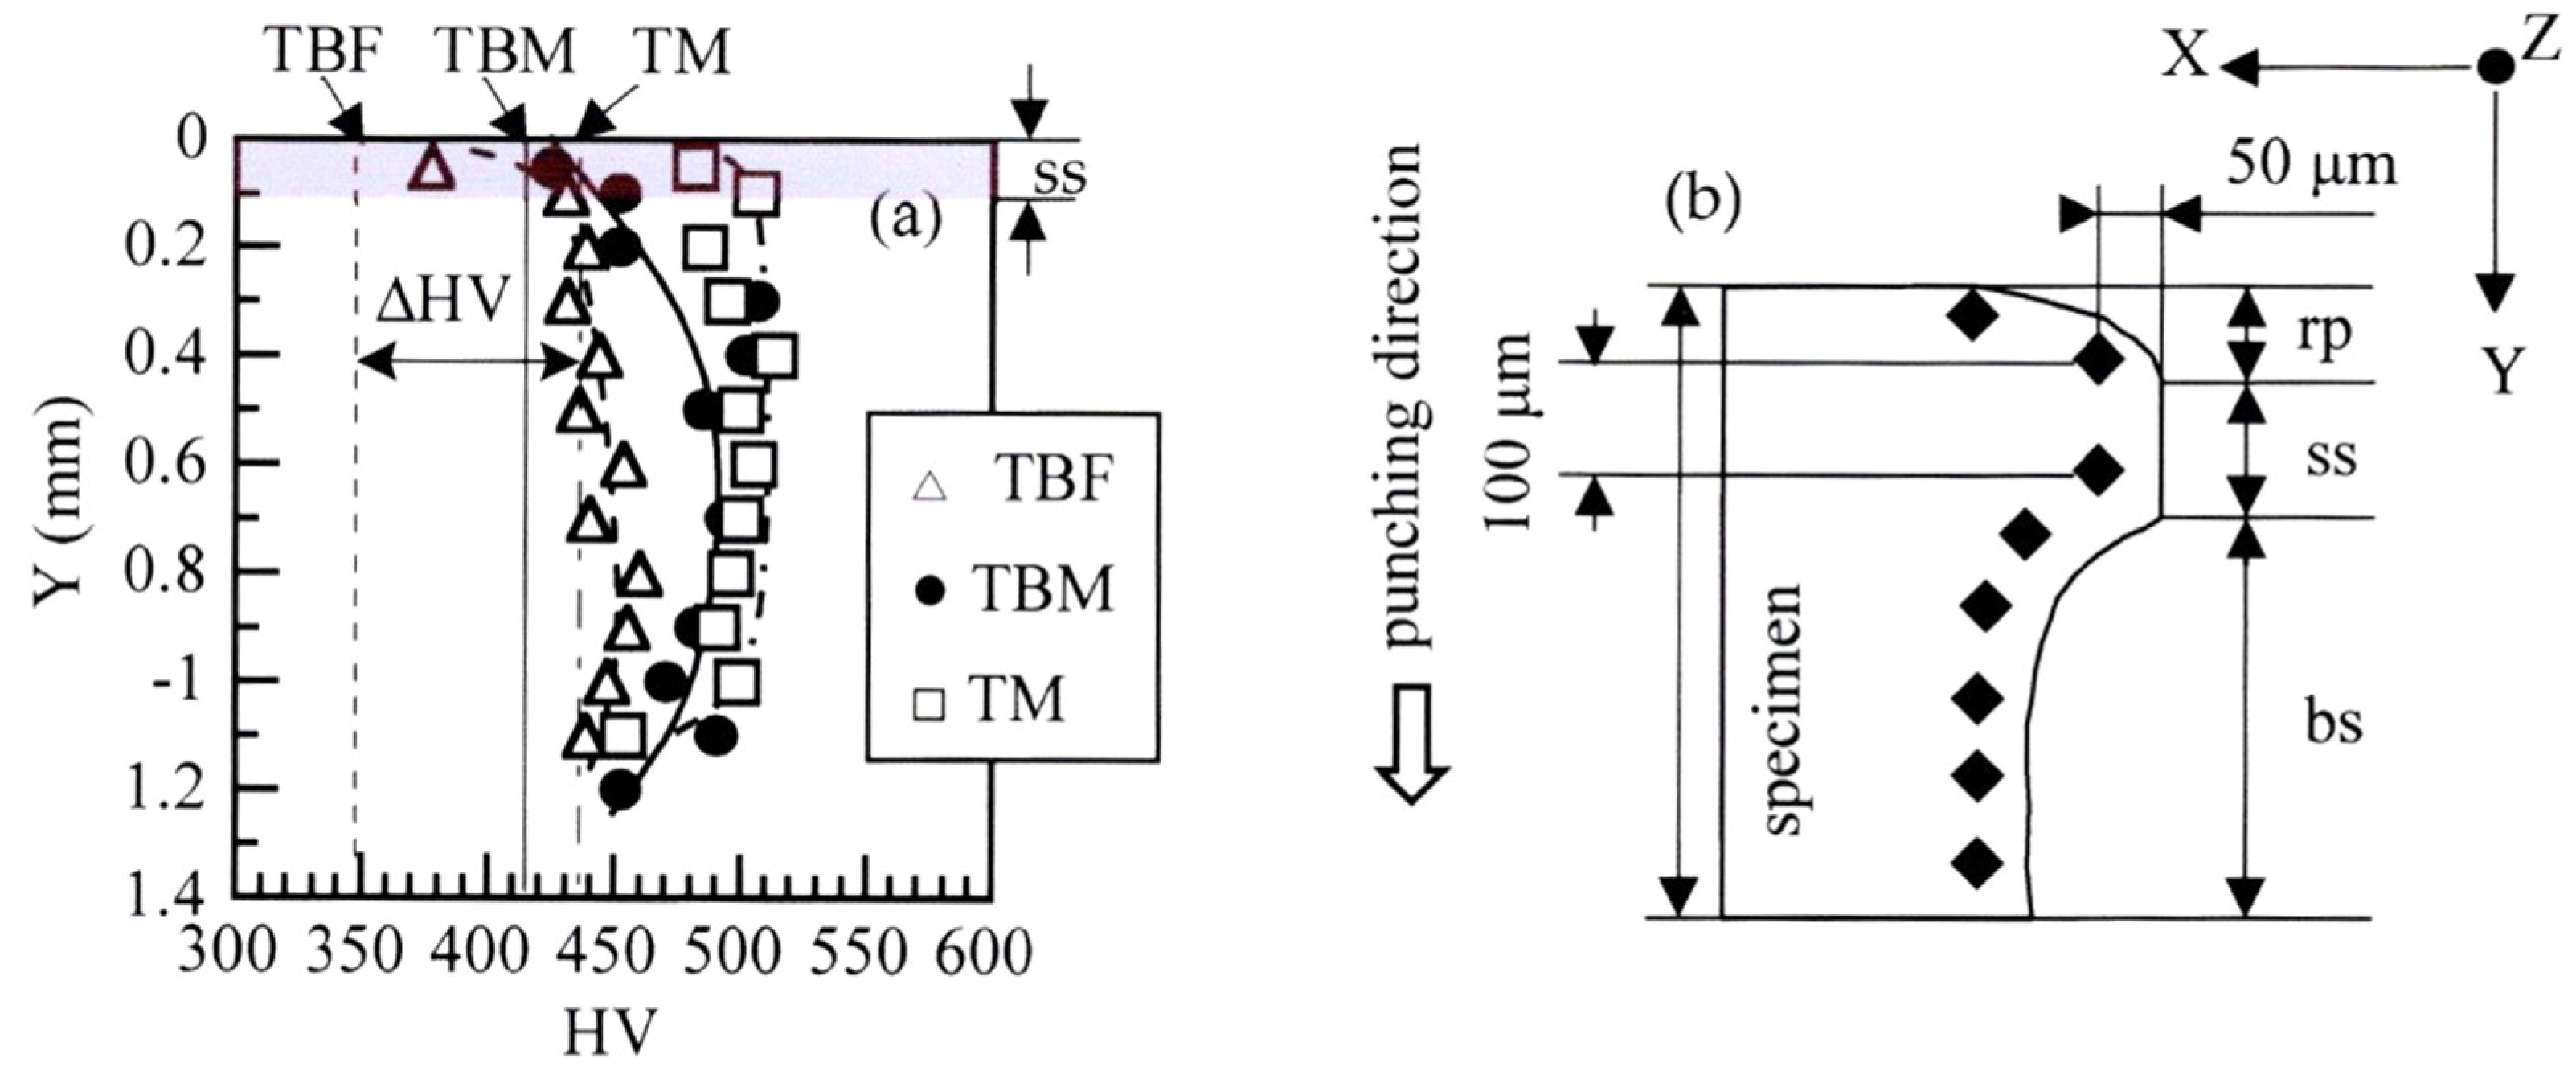
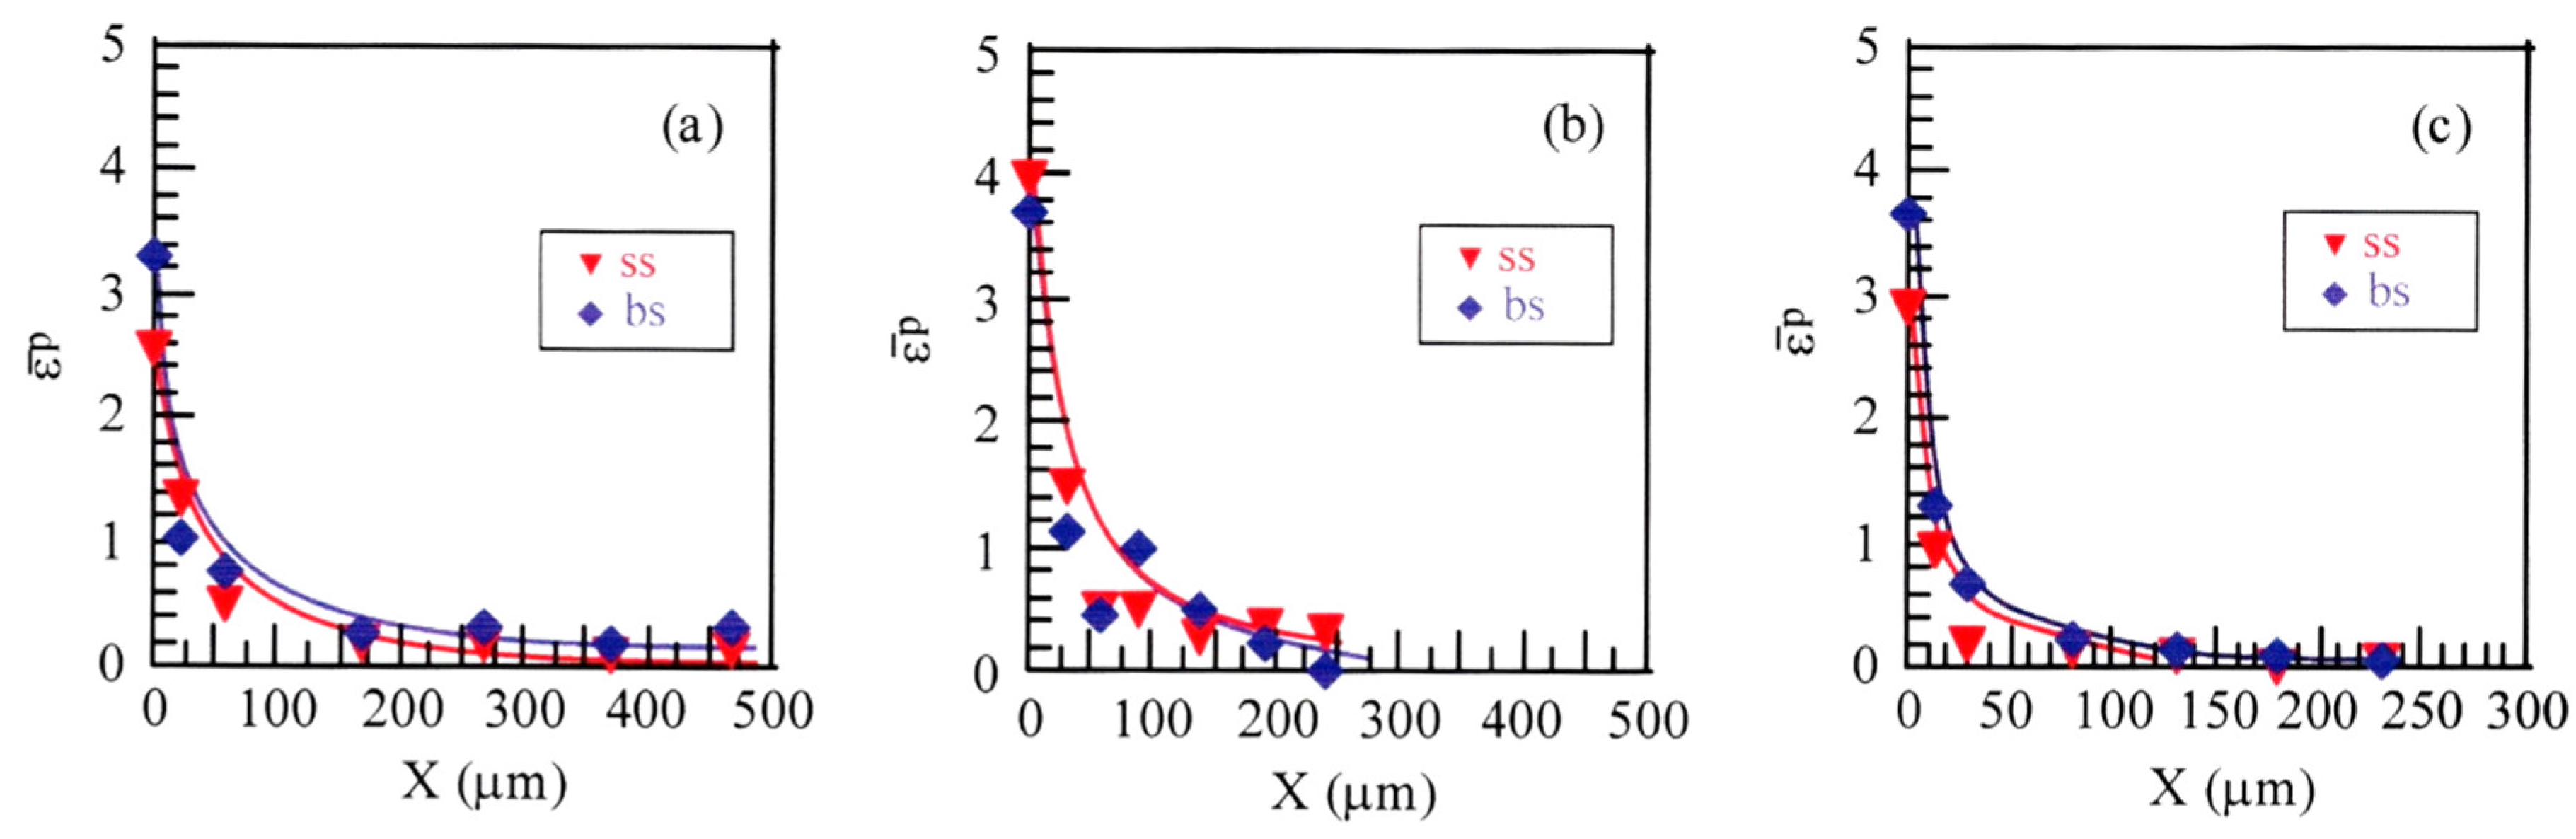
3.4. Vickers Hardness and Plastic Strain Distributions

Figure 9 shows the Vickers hardness distribution of the shear-punched surface layers in the depth direction (X-direction) in the TBF, TBM, and TM steels. The original Vickers hardness of the TBF, TBM, and TM steels are HV0 = 350, 414, and 437, respectively (Table 2). The hardness considerably increases near the shear-punched surface in all the steels, although the hardness at the break section is higher than that at the shear section. The highest maximum Vickers hardness (HVmax) at the shear and break sections is achieved in the TBM steel. On the other hand, the maximum increment of Vickers hardness (ΔHVmax = HVmax − HV0) is obtained in the TBF steel. It is noteworthy that the HVmax and ΔHVmax at the shear and break sections of the TM steel are lower than those of the TBM steels, although the HVmax is nearly the same as those of the TBF steel. When the critical depth corresponding to ΔHV = 0 is defined by “dHVc”, the dHVc = 300, 200, and 120 μm in the TBF, TBM, and TM steels, respectively. Notably, the dHVc of the TM steel is the smallest.
Figure 10a shows the Vickers hardness distribution in the thickness direction (Y-direction). The hardness distribution is measured inside 50 μm from the shear-punched surface (Figure 10b). High ΔHV is achieved at the break section in all the steels in the same way as Δfαm in Figure 8. The ΔHVs of the TBF and TBM steels are larger than that of the TM steel in the same way as Figure 9.
Figure 11 shows the ε ¯ p distribution in the depth direction (X-direction) of the shear-punched surface layer of the TBF, TBM, and TM steels. This ε ¯ p distribution is similar to the Vickers hardness distribution of Figure 9. Namely, the ε ¯ p rapidly decreases near the shear-punched surface, especially in the TM steel. On the other hand, the ε ¯ ps of the TBF and TBM steels gradually decrease with increasing depth. The ε ¯ p at the break section is near the same as that of the shear section or slightly higher than that at the shear section in the same way as the Vickers hardness distribution (Figure 9).

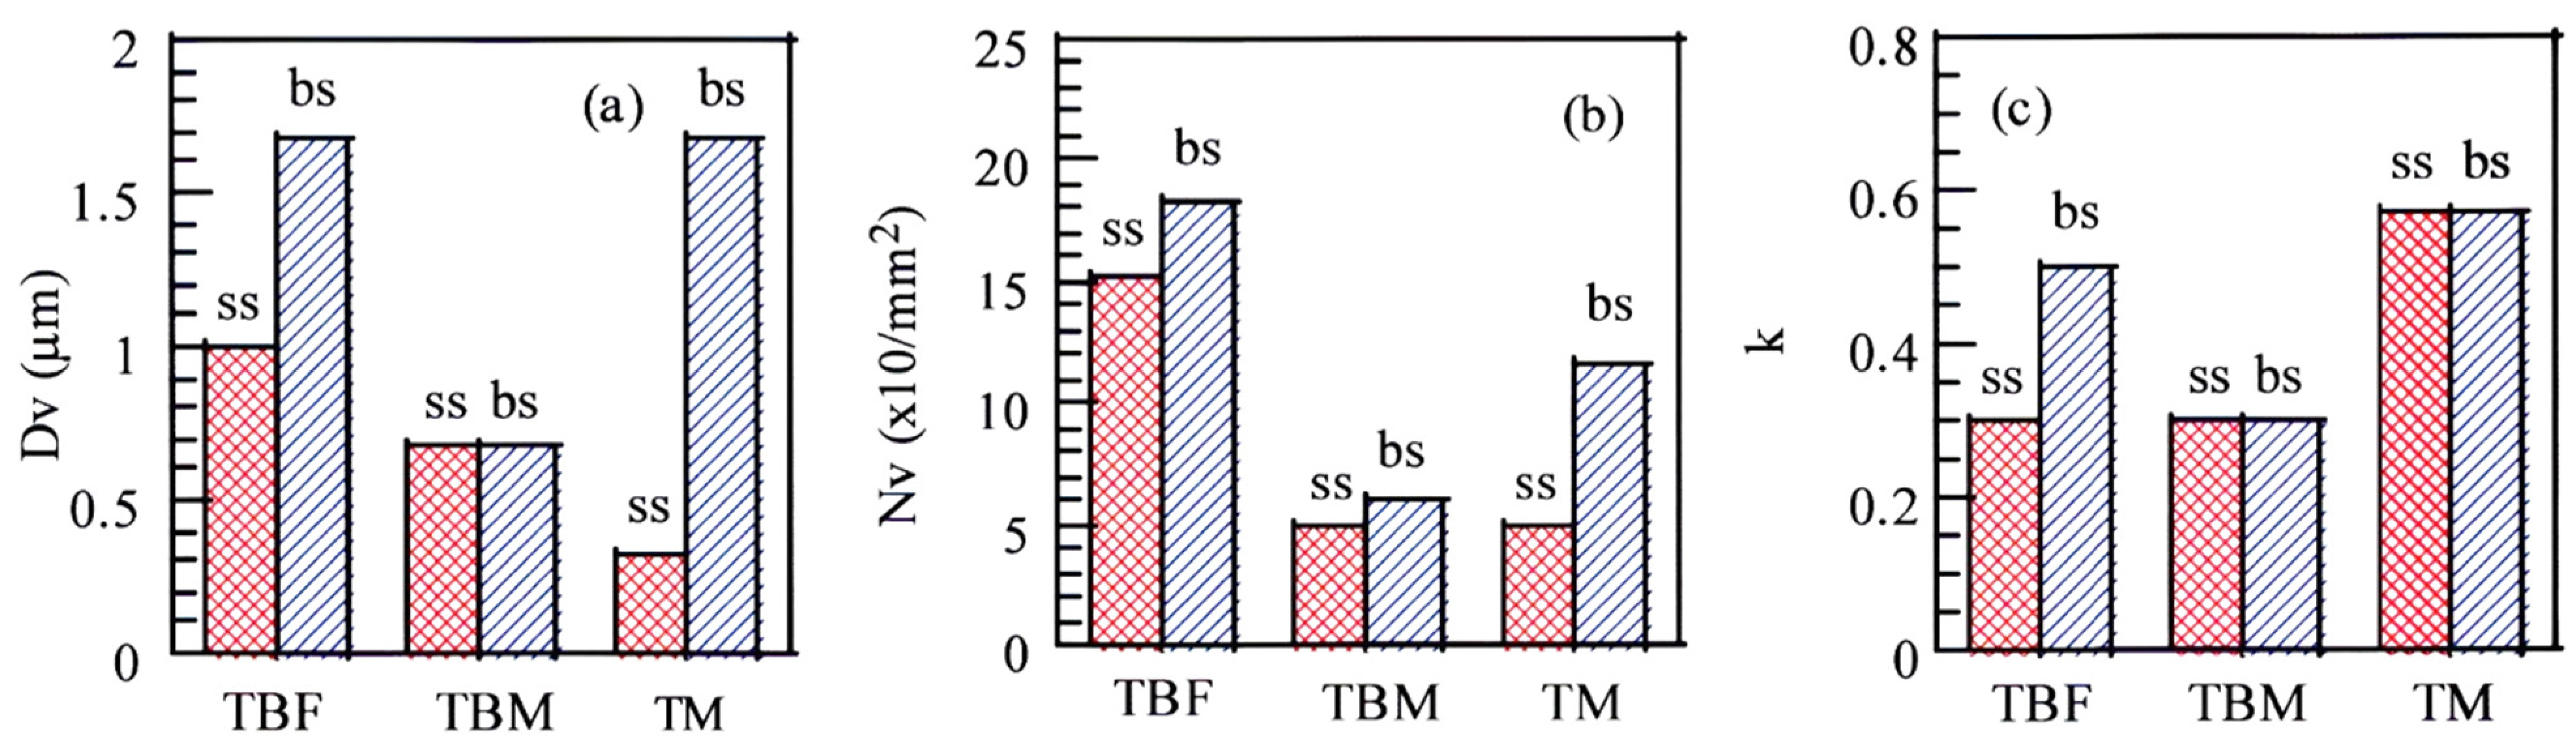
3.5. Initiated Micro-Void Characteristics

Figure 12 shows the FE-SEM images of a cross-section of the shear-punched surface layers in the TBF, TBM, and TM steels. In all the steels, a lot of micro-voids initiate at the break section, although a small number of micro-void also initiates at the shear section. Most of the micro-voids initiate at the lath boundaries and the interface between the matrix structure and the second phase (MA phase, strain-induced martensite, etc.) (Figure 12d,h,i).
Figure 13 shows the mean size and mean number per unit area of micro-voids at the shear and break sections in the TBF, TBM, and TM steels plastically deformed to ε ¯ p = 0.6. When micro-voids larger than 0.5 μm were counted, the mean size and mean number per unit area of micro-voids at the shear and break sections of the TBF steel were much larger than those of the TBM and TM steels. Note that the mean size and mean number per unit area of micro-voids at the break section of the TBM steel are smaller than those of the TM steel, although the mean size at the shear section of the TBM steel is larger than that of the TM steel.

4. Discussion

The stress distribution near the shear-punched region is generally estimated to mainly consist of a negative mean normal stress, except for a part of a positive mean normal stress, as shown in Figure 14 [28]. In the following, the shear-punched surface layer damage is discussed using the data from the previous research [21] investigating the effects of mean normal stress and microstructural properties on the strain hardening, strain-induced martensite transformation, and micro-void initiation behaviors of TBF, TBM, and TM steels with the same chemical composition.

4.1. Strain-Hardening Behavior

As shown in Figure 9, the largest ΔHVmax in the shear-punched surface layers was observed at the shear and break sections of the TBF steel compared to the TM steel. The ΔHVmax of the TBM steel was slightly lower than that of the TBF steel. In addition, the TBF steel had a large critical depth for hardness (dHVc = 300 μm), which was larger than those (dHVc = 200 and 120 μm, respectively) of the TBM and TM steels.
In general, the flow stress and strain-hardening of the TBF, TBM, and TM steels is decided by the sum of the following items (i) to (iv) [5]:
(i)
“Flow stress of matrix structure”, containing strain-hardening.
(ii)
“Long-range internal stress hardening”, resulting from the difference in plastic strain between the matrix structure and second phase (retained austenite, strain-induced martensite, MA phase, etc.) [29].
(iii)
“Strain-induced transformation hardening”, resulting from an increase in strain-induced martensite fraction.
(iv)
“Forest dislocation hardening”, estimated from the Ashby equation [30].
As shown in Figure 11, the ε ¯ p near the shear-punched surface is considerably high in these steels, especially in the TM steel. In Figure 8, the untransformed retained austenite fraction significantly decreased on the punched surface layers and the inside surface layers of these steels. The critical depth for the strain-induced transformation was the largest (dTRc = 470 μm) in the TBF steel and the smallest (130 μm) in the TM steel. The critical depth (240 μm) of the TBM steel was between the TBF and TM steels. In addition, the largest strain-induced martensite fraction (∆fαm) was obtained in the TBF steel, followed in order by the TBM and TM steels. In this case, the dTRc and ∆fαm at the break section were higher than those at the shear section in all the steels. As shown in Figure 5a, the TBF steel exhibited the largest strain-hardening in a large strain stage. Therefore, the largest ΔHVmaxs at the shear and break sections in the shear-punched surface layers of the TBF steel may be caused by the large strain-hardening of the matrix structure and strain-induced transformation hardening (Figure 5a), with a small contribution of the long-range internal stress [29]. On the other hand, the smallest ΔHVmax of the TM steel is associated with low strain-induced martensite hardening in a large strain range due to a small amount of ∆fαm (Figure 8c).

4.2. Strain-Induced Martensite Transformation Behavior

Figure 15 shows the variations in untransformed retained austenite fraction as a function of equivalent plastic strain ( ε ¯ P) at the shear and break sections in the TBF, TBM, and TM steels. When the untransformed retained austenite fractions at the shear and break sections were compared to those deformed in tension, torsion, or compression [21], the strain-induced transformation of the shear and break sections was suppressed compared to the compressive deformation in all the steels, except for at the shear section of the TM steel. The untransformed retained austenite fraction at the shear section was larger than or the same as at the break section in all the steels. This indicates that the shear and break sections are highly deformed under compression or negative mean stress.
In Figure 15, the Δfαms of the shear and break sections of the TBF steel were the largest. This may be mainly associated with a high initial volume fraction of retained austenite.

4.3. Micro-Void Initiation Behavior

Figure 16 shows the mean size and mean number per unit area of the micro-voids at the shear and break sections of the TBF, TBM, and TM steels. These properties are compared to those of the same steels deformed in tension, torsion, and compression. The mean sizes agreed with the mean normal stress of 0 to −500 MPa, except at the break section of the TM steel. On the other hand, the mean number per unit area of the micro-voids was between those in compression and torsion. These results indicate that the micro-voids on shear punching initiated under the mean normal stress from zero to negative.
Notably, the micro-void initiation of the shear and break sections of the TBM steel was suppressed, compared to the TBF steel, in the same way as the TM steel. In general, void formation in low-carbon TRIP-aided steel is mainly controlled by the microstructural properties and the other punched damage properties [22]. First, let us discuss the relationship between the micro-void initiation behavior on the shear-punching and microstructural properties. In general, the micro-void initiation behavior is mainly controlled by the following items (v) to (viii):
(v)
“Microstructural properties” such as size, morphology, etc. [5,6,7,8,17,19].
(vi)
“A strength ratio”, which is defined as a ratio of the strength of the second phase to the matrix [15,31].
(vii)
“Retained austenite characteristics” such as volume fraction, morphology, mechanical stability, etc. [5,7,8,17,19].
(viii)
“Anisotropy” [32].
Considering the items (v) to (viii), the smaller mean size and mean number per unit area of the micro-voids of the TBM steel may be mainly associated with the fine mixed matrix structure and a small strength ratio, as well as the high mechanical stability (low k-value) of the retained austenite relaxing the localized stress concentration through its strain-induced transformation [33] (Figure 13c). Also, at the shear and break sections of the TM steel, the void initiation was suppressed to the same extent as the TBM steel (Figure 12). This may be mainly caused by the uniformly fine matrix structure and a small strength ratio, despite a large amount of MA phase.
Next, let us discuss the relationship between the micro-void initiation behavior and shear-punched surface layer damage properties such as the Δfαm, ΔHV, and ε ¯ P. As shown in Figure 8, Figure 9 and Figure 11, the damage properties at the break section of the TM steel were characterized by smaller Δfαm, ΔHV, and ε ¯ P than those of the TBF steel. This also indicates that the small punched surface layer damage suppressed the micro-void initiation. The micro-void initiation behavior of the TBM steel is believed to be associated with the intermediate punched surface damage between the TBF and TM steels.

4.4. Relationship between Shear-Punched Surface Layer Damage and Stretch-Flangeability

In general, the stretch-flangeability of TRIP-aided steels is controlled by (1) the micro-void initiation behavior on hole punching [5,8] and (2) the subsequent crack growth/void connection behavior on hole expansion [6,13], which are also related to the strain-hardening and strain-induced martensite transformation behaviors [5]. According to Takashima et al. [31], the stretch-flangeability lowers with increasing mean number per unit area of micro-voids and strength ratio in 0.07C-(0.50–1.89)Si-(0.63–1.42)Mn ferrite–martensite DP steels. As shown in Figure 1, the TBM and TM steels have an excellent combination of tensile strength and stretch-flangeability compared to the TBF steel with lower tensile strength. In the TBM steel, the micro-void initiation and strain-induced transformation were considerably suppressed in the shear-punched surface layer as shown in Figure 8 and Figure 13, although moderate strain-hardening (Figure 9b) and strain-induced martensite transformation (Figure 8b) occurred. According to Kobayashi et al. [34], the TBM and TM steels achieved high crack growth/void-connection resistance. Therefore, the suppressed micro-void initiation may bring on high stretch-flangeability with a high crack growth/void-connection resistance in the TBM steel. The same high stretch-flangeability of the TM steel is also considered to be caused by a small mean number of micro-voids on shear punching and a high crack growth/void-connection resistance on hole expansion. A little less stretch-flangeability of the TBF steel may be mainly associated with an easy micro-void initiation on hole punching and lower crack growth/void-connection resistance on hole expansion [34], although the retained austenite fraction was higher than those of the TBM and TM steels.

5. Conclusions

The damage to the shear-punched surface layers such as strain-hardening, strain-induced martensite transformation, and micro-void initiation behaviors was investigated to evaluate the stretch-flangeability in the TBF, TBM, and TM steels. In addition, the damage to the shear-punched surface layers was connected with the mean normal stress and microstructural properties.
(1)
The strain-hardening, strain-induced martensite transformation, and micro-void initiation at the break section were promoted compared to those at the shear section in the same way as an equivalent plastic strain evolution.
(2)
The damage of the shear-punched surface layers at the shear and break sections was produced under the mean normal stress between zero and negative.
(3)
The shear-punched surface damage of the TBM and TM steels was characterized by suppressed micro-void initiation, strain-induced martensite transformation, and strain-hardening behaviors compared to that of the TBF steel. This was mainly associated with a fine matrix structure and a low strength ratio, despite a lot of MA phase.
(4)
The excellent stretch-flangeability of the TBM and TM steels was associated with the relatively small damage of the shear-punched surface layers and high crack growth/void-connection resistance on hole expansion.

Author Contributions

Conceptualization, K.-i.S.; methodology, K.-i.S. and S.S.; formal analysis, K.-i.S., S.S., J.K., and T.H.; investigation, S.S. and J.K.; resources, K.-i.S.; data curation, K.-i.S. and S.S.; writing—original draft preparation, K.-i.S. and S.S.; writing—review and editing, K.-i.S., J.K., and T.H.; visualization, S.S. and J.K.; supervision, K.-i.S. and T.H.; All authors have read and agreed to the published version of the manuscript.

Funding

This research received no external funding.

Institutional Review Board Statement

Not applicable.

Informed Consent Statement

Not applicable.

Data Availability Statement

The original contributions presented in the study are included in the article, further inquiries can be directed to the corresponding author.

Conflicts of Interest

The author declares no conflicts of interest.

References

  1. Matlock, D.K.; Speer, J.G.; De Moor, E.; Gibbs, P.J. Recent developments in advanced high strength sheet steels for automotive applications: An overview. Jestech 2012, 15, 1–12. [Google Scholar]
  2. Uenishi, A. Development of advanced high strength sheet steel for NSafeTM-AutoConcept. Nippon Steel Tech. Rep. 2019, 122, 7–12. [Google Scholar]
  3. Soleimani, M.; Kalhor, A.; Mirzadeh, H. Transformation-induced plasticity (TRIP) in advanced steels: A review. Mater. Sci. Eng. A 2020, 795, 140023. [Google Scholar] [CrossRef]
  4. Meknassi, R.F.; Tisza, M. Recent third generations of advanced high strength sheet steels: Processing routes and properties. In Proceedings of the International Conference on Mathematics, Engineering, Natural & Medical Sciences, Karqak, Jordan, 30–31 January 2021; pp. 148–158. [Google Scholar]
  5. Kobayashi, J.; Pham, D.V.; Sugimoto, K. Stretch-flangeability of 1.5 GPa grade TRIP-aided martensitic cold rolled sheet steels. In Proceedings of the 10th International Conference on Technology of Plasticity (ICTP 2011), Aachen, Germany, 25–30 September 2011; pp. 598–603. [Google Scholar]
  6. Casellas, D.; Lara, A.; Frómeta, D.; Gutiérrez, D.; Molas, S.; Pérez, L.; Rehrl, J.; Suppan, C. Fracture toughness to understand stretch flangeability and edge cracking resistance in AHSS. Metall. Mater. Trans. A 2017, 48, 86–94. [Google Scholar] [CrossRef]
  7. Polatids, E.; Haidemenopoulos, G.N.; Krizan, D.; Aravas, N.; Panzner, T.; Šmíd, M.; Papadioti, I.; Casati, N.; Van Petegem, S.; Van Swygenhoven, H. The effect of stress triaxiality on the phase transformation in transformation induced plasticity steels: Experimental investigation and modeling the transformation kinetics. Mater. Sci. Eng. A 2021, 800, 140321. [Google Scholar] [CrossRef]
  8. Wang, Y.; Hou, X.; Guo, C.; Zhang, J.; Wang, X.; Xu, Y. Achieving an excellent balance of strength, plasticity, and stretch flangeability in a 1000 MPa grade TRIP-assisted bainitic ferrite steel. Mater. Res. Technol. 2024, 32, 2357–2369. [Google Scholar] [CrossRef]
  9. Rana, R.; Chen, S.; Halder, A.; Das, S. Mechanical properties of a bainitic steel producible by hot-rolling. Arch. Metall. Mater. 2017, 62, 2331–2338. [Google Scholar] [CrossRef]
  10. Weiβensteiner, I.; Suppan, C.; Hebesberger, T.; Winkelhofer, F.; Clemens, H.; Maier-Kiener, V. Effect of morphological differences on the cold formability of an isothermally heat-treated advanced high-strength steel. JOM 2018, 70, 1567–1575. [Google Scholar] [CrossRef]
  11. Jiang, H.; He, Y.; Lin, L.; Zhang, Y.; Zheng, W.; Li, L. Microstructures and properties of auto-tempering ultra-high strength automotive steel under different thermal-processing conditions. Metals 2021, 11, 1121. [Google Scholar] [CrossRef]
  12. Zheng, G.; Chang, Y.; Fan, Z.; Li, X.; Wang, C.; Dong, H. Study of thermal forming limit of medium-Mn steel based on finite element analysis and experiments. Int. J. Manuf. Technol. 2018, 94, 133–144. [Google Scholar] [CrossRef]
  13. Chang, Y.; Han, S.; Li, X.; Wang, C.; Zheng, G.; Dong, H. Effect of shearing clearance on formability of the third generation automotive medium-Mn steel with metastable austenite. J. Mater. Process. Tech. 2018, 259, 216–227. [Google Scholar] [CrossRef]
  14. Hernández-Rivera, J.L.; González-Castillo, A.C.; Ramos-Azpeitia, M.O.; Garay-Reyes, C.G. Effect of the intercritical annealing in the formability and microstructure of a medium Mn steel sheet. IOP Conf. Ser. Mater. Sci. Eng. 2023, 1284, 012030. [Google Scholar] [CrossRef]
  15. Heibel, S.; Dettinger, T.; Nester, W.; Clausmeyer, T.; Tekkaya, A.E. Damage mechanism and mechanical properties of high-strength multiphase steels. Materials 2018, 11, 761. [Google Scholar] [CrossRef] [PubMed]
  16. Li, Z.; Chang, Y.; Rong, J.; Min, J.; Lian, J. Edge fracture of the first and third-generation high-strength steels: DP1000 and QP1000. IOP Conf. Ser. Mater. Sci. Eng. 2023, 1284, 012021. [Google Scholar] [CrossRef]
  17. Toji, Y.; Nakagaito, T.; Matsuda, H.; Hasegawa, K.; Kaneko, S. Effect of microstructure on mechanical properties of quenching and partitioning steel. ISIJ Int. 2023, 63, 758–765. [Google Scholar] [CrossRef]
  18. Tedesco, M.M.; De Caro, D.; Rizzi, P.; Baricco, M. Effect of composition and thermal treatments on mechanical properties and applications of quenching and partitioning steels. Metals 2023, 13, 1757. [Google Scholar] [CrossRef]
  19. Kim, J.; Seo, E.; Kwon, M.; Kang, S.; De Cooman, B.C. Effect of quenching temperature on stretch flangeability of a medium Mn steel processed by quenching and partitioning. Mater. Sci. Eng. A 2018, 729, 276–284. [Google Scholar] [CrossRef]
  20. Gu, G.; Kim, J.-H.; Lee, H.-H.; Zargaran, A.; Koo, M.; Kim, S.-H.; Lee, J.-S.; Suh, D.-W. Room temperature quenching and partitioning (RT-Q&P) processed steel with chemically heterogeneous initial microstructure. Mater. Sci. Eng. A 2022, 851, 1436. [Google Scholar]
  21. Sugimoto, K.; Shioiri, S.; Kobayashi, J. Effects of mean normal stress and microstructural properties on ultrahigh-strength TRIP-aided steels with bainitic ferrite and martensite matrix structure. Materials 2024, 17, 3554. [Google Scholar] [CrossRef]
  22. Sugimoto, K.; Shioiri, S.; Kobayashi, J. Evaluation of shear-punched surface layer damage in three types of high-strength TRIP-aided steel. Metals 2024, 14, 531. [Google Scholar] [CrossRef]
  23. Maruyama, H. X-ray measurement of retained austenite. Jpn. Soc. Heat Treat. 1977, 17, 198–204. (In Japanese) [Google Scholar]
  24. Dyson, D.J.; Holmes, B. Effect of alloying additions on the lattice parameter of austenite. J. Iron Steel Inst. 1970, 208, 469–474. [Google Scholar]
  25. Cullity, B.D. Elements of X-Ray Diffraction, 2nd ed.; Addison-Wesley Publishing Company, Inc.: Boston, MA, USA, 1978; p. 287. [Google Scholar]
  26. Williamson, G.K.; Hall, W.H. X-ray line broadening from filed aluminum and wolfram. Acta Metall. 1953, 1, 22–31. [Google Scholar] [CrossRef]
  27. Takebayashi, S.; Kunieda, T.; Yoshinaga, N.; Ushioda, K.; Ogata, S. Comparison of the dislocation density in martensitic steels evaluated by some X-ray diffraction methods. ISIJ Int. 2010, 50, 875–882. [Google Scholar] [CrossRef]
  28. Iwata, K.; Ueda, K.; Yamada, Y. Study of shearing mechanism based on direct SEM observation. J. Jpn. Soc. Technol. Plast. 1979, 20, 437–443. (In Japanese) [Google Scholar]
  29. Mura, T.; Mori, T. Micromechanics; Baifu-kan Co., Ltd.: Tokyo, Japan, 1976; p. 23. (In Japanese) [Google Scholar]
  30. Sakaki, T.; Sugimoto, K.; Fukuzato, T. Role of internal stress for continuous yielding of dual-phase steels. Acta Metall. 1983, 31, 1737–1746. [Google Scholar] [CrossRef]
  31. Ashby, M.F. Work hardening of dispersion-hardened crystals. Philo. Mag. 1966, 14, 1157–1178. [Google Scholar] [CrossRef]
  32. Li, Z.; Chang, Y.; Liu, W.; Lian, J. Predicting edge fracture in dual-phase steels: Significance anisotropy-induced localization. Int. J. Mech. Sci. 2024, 274, 109255. [Google Scholar] [CrossRef]
  33. Takashima, K.; Hasegawa, K.; Toji, Y.; Funakawa, Y. Void generation in cold-rolled dual-phase steel sheet having excellent stretch flange formability. ISIJ Int. 2017, 57, 1289–1294. [Google Scholar] [CrossRef]
  34. Kobayashi, J.; Ina, D.; Futamura, A.; Sugimoto, K. Fracture toughness of an advanced ultrahigh-strength TRIP-aided steel. ISIJ Int. 2014, 54, 955–962. [Google Scholar] [CrossRef]
Figure 1. (a) Cold stretch-formability (maximum stretch height: Hmax) and (b) cold stretch-flangeability (hole expansion ratio: HER)–tensile strength (TS) relations of the first-generation AHSSs such as 0.15C-0.25Si-1.70Mn ferrite–martensite dual-phase (DP) steel, 0.2C-(1.0–2.5)Si-(1.0–2.0)Mn TRIP-aided polygonal ferrite (TPF), and TRIP-aided annealed martensite (TAM) steels; the third-generation AHSSs such as 0.20C-1.5Si-1.5Mn-0.05Nb TBF, TBM, and TM steels; and 0.21C-1.50Si-4.94Mn D-MMn and M-MMn steels (adapted from [21]).
Metals 14 01034 g001
Figure 2. (a) Sampling location of the shear-punching specimens (10 mm width, 50 mm length, and 1.2 mm thickness) and (b) the dimensions of the die set for hole punching. R: a radius of a hot-rolled bar. The die set was made from JIS-SKD61 hot die steel (Reprinted from Ref. [22]).
Metals 14 01034 g002
Figure 3. Relationships between X-ray half-width (HW) and equivalent plastic strain ( ε ¯ p) in (a) TBF, (b) TBM, and (c) TM steels. Open marks: tension; sold marks: torsion; gray solid marks: compression (Reprinted from Ref. [21]).
Metals 14 01034 g003
Figure 4. FE-SEM/EBSD images of heat-treated TBF, TBM, and TM steels. (ac) Phase maps of BCC and FCC and (df) image quality maps of BCC. αbf, αm, αm*, γR, and MA are bainitic ferrite, primary martensite, secondary martensite, retained austenite, and secondary martensite–retained austenite (MA) phases, respectively.
Metals 14 01034 g004
Figure 5. (a) Engineering tensile stress−strain (σε) curves (reprinted from Ref. [21]), (b) punching load–stroke (Pδ) curves of TBF, TBM, and TM steels, and (c) illustration of punching load–stroke (Pδ) curve. In (c), τ0, τmax, τf, δu, and δu are punching yield shear stress or 0.2% offset proof shear stress, punching maximum shear stress, punching fracture shear stress, uniform shear displacement, and total shear displacement, respectively.
Metals 14 01034 g005
Figure 6. Appearance of macroscopic punched hole surface in (a) TBF, (b) TBM, and (c) TM steels. ss: shear section; bs: break section.
Metals 14 01034 g006
Figure 7. Variations in (a) the punching yield shear stress or 0.2% offset proof shear stress (τ0) and punching maximum shear stress (τmax), (b) the uniform shear displacement (δu) and total shear displacement (δt), and (c) the ratio of shear section length to thickness (ss/t) as a function of the original Vickers hardness (HV0) in the TBF, TBM, and TM steels.
Metals 14 01034 g007
Figure 8. Untransformed retained austenite fraction (fγ) distribution of the shear-punched surface layer in the X-direction (depth direction) of the (a) TBF, (b) TBM, and (c) TM steels. “dTRc” is the critical depth at which no strain-induced transformation occurs.
Metals 14 01034 g008
Figure 9. Vickers hardness (HV) distribution in the X-direction (depth direction) in the punched surface layers in the (a) TBF, (b) TBM, and (c) TM steels. “dHVc” is the critical depth corresponding to ΔHV = 0.
Metals 14 01034 g009
Figure 10. (a) Variations in Vickers hardness (HV0.1) in the thickness direction (Y-direction) in the shear-punched TBF, TBM, and TM steels. (b) The measuring points of Vickers hardness. ΔHV = HV− HV0.
Metals 14 01034 g010
Figure 11. Equivalent plastic strain ( ε ¯ p) distribution in X-direction (depth direction) of (a) TBF, (b) TBM, and (c) TM steels.
Metals 14 01034 g011
Figure 12. FE-SEM images of a cross-section of the shear-punching surface layers in (ad) the TBF, (eh) TBM, and (il) TM steels. Arrows denote micro-voids. (d,h,l) are a high magnification at break section plastically deformed to ε ¯ p = 0.6.
Metals 14 01034 g012
Figure 13. (a) The mean size and (b) mean number per unit area of the micro-voids at the shear section (ss) and break section (bs) in the TBF, TBM, and TM steels deformed to ε ¯ p = 0.6. (c) The mean k-value of these steels measured between ε ¯ p = 0 and 0.6.
Metals 14 01034 g013
Figure 14. Maps of mean normal stress distribution (in MPa) on shear punching (reprinted with permission from [28], 2024, Material: JIS-A1100, The Japan Society for Technology of Plasticity). (a) The ratio of shear displacement to sheet thickness: δ = 3.76 %, (b) δ = 25 %. A punch clearance between punch and die: 10%.
Metals 14 01034 g014
Figure 15. Comparison of the volume fraction of the untransformed retained austenite (fγ)-equivalent strain ( ε ¯ p) relations at the shear section (ss) and break section (bs) to those in tension (open marks), torsion (solid black marks), and compression (solid gray marks) (adapted from [21]) in the (a) TBF, (b) TBM, and (c) TM steels.
Metals 14 01034 g015
Figure 16. (a) The mean size of void (Dv) and (b) the mean number per unit area of void (Nv) at the shear section (ss, red lines) and break section (bs, blue lines) in the TBF, TBM, and TM steels, which are measured at the depth subjected to the equivalent plastic strain of ε ¯ p = 0.6. The dotted, solid, and dashed curves in (a) and (b) show the variations in Dv and Nv as a function of the mean normal stress (σm) in the TBF, TBM, and TM steels (adapted from [21]).
Metals 14 01034 g016
Table 1. Chemical composition (mass%) and measured martensite-start (Ms) and -finish (Mf) temperatures (°C) of steels used.
CSiMnPSAlNbCrMoNFeMsMf
0.181.481.490.0040.0030.0430.051.020.200.001bal.407292
Table 2. Microstructural properties, Vickers hardness, and tensile properties of TBF, TBM, and TM steels.
Steelfγ0 (vol.%)Cγ0 (mass%)kfMA
(vol.%)
HV0YS
(MPa)
UTS
(MPa)
UEl
(%)
TEl
(%)
εf
TBF11.4 ± 1.20.65 ± 0.141.64 ± 0.822.0 ± 0.3350 ± 9709 ± 151276 ± 189.0 ± 0.817.7 ± 2.30.68 ± 0.06
TBM7.2 ± 1.41.08 ± 0.222.05 ± 1.2310.8 ± 1.2414 ± 161058 ± 351310 ± 383.8 ± 0.514.7 ± 3.41.20 ± 0.12
TM5.5 ± 1.50.45 ± 0.202.84 ± 1.8515.8 ± 1.8437 ± 181073 ± 461463 ± 524.5 ± 1.014.6 ± 3.81.01 ± 0.12
fγ0: retained austenite fraction; Cγ0: carbon concentration of retained austenite; k: strain-induced transformation. Factor (measured between ε ¯ p = 0 and 0.6), fMA: volume fraction of MA phase; HV0: original HV0.1; YS: tensile yield stress; UTS: ultimate tensile strength; UEl: uniform elongation; TEl: total elongation; εf: true fracture strain.
Table 3. Shear-punching properties of TBF, TBM, and TM steels.
Steelτ0
(MPa)
τmax
(MPa)
δu
(mm)
δt
(mm)
ss/t
TBF749 ± 22860 ± 290.141 ± 0.020.222 ± 0.050.140 ± 0.03
TBM816 ± 34886 ± 450.153 ± 0.030.233 ± 0.060.148 ± 0.05
TM923 ± 52992 ± 640.151 ± 0.030.240 ± 0.070.132 ± 0.05
τ0: punching yield shear stress or 0.2% offset proof shear stress; τmax: punching maximum shear stress; δu: uniform shear displacement; δt: total shear displacement; ss/t: the ratio of shear section length to sheet thickness.
Disclaimer/Publisher’s Note: The statements, opinions and data contained in all publications are solely those of the individual author(s) and contributor(s) and not of MDPI and/or the editor(s). MDPI and/or the editor(s) disclaim responsibility for any injury to people or property resulting from any ideas, methods, instructions or products referred to in the content.

