
The Influence of Absorbing Coating Material on the Efficiency of Laser Shock Peening

 ,
,  , ,
, ,  and
and 
Abstract
:1. Introduction
2. Materials and Methods
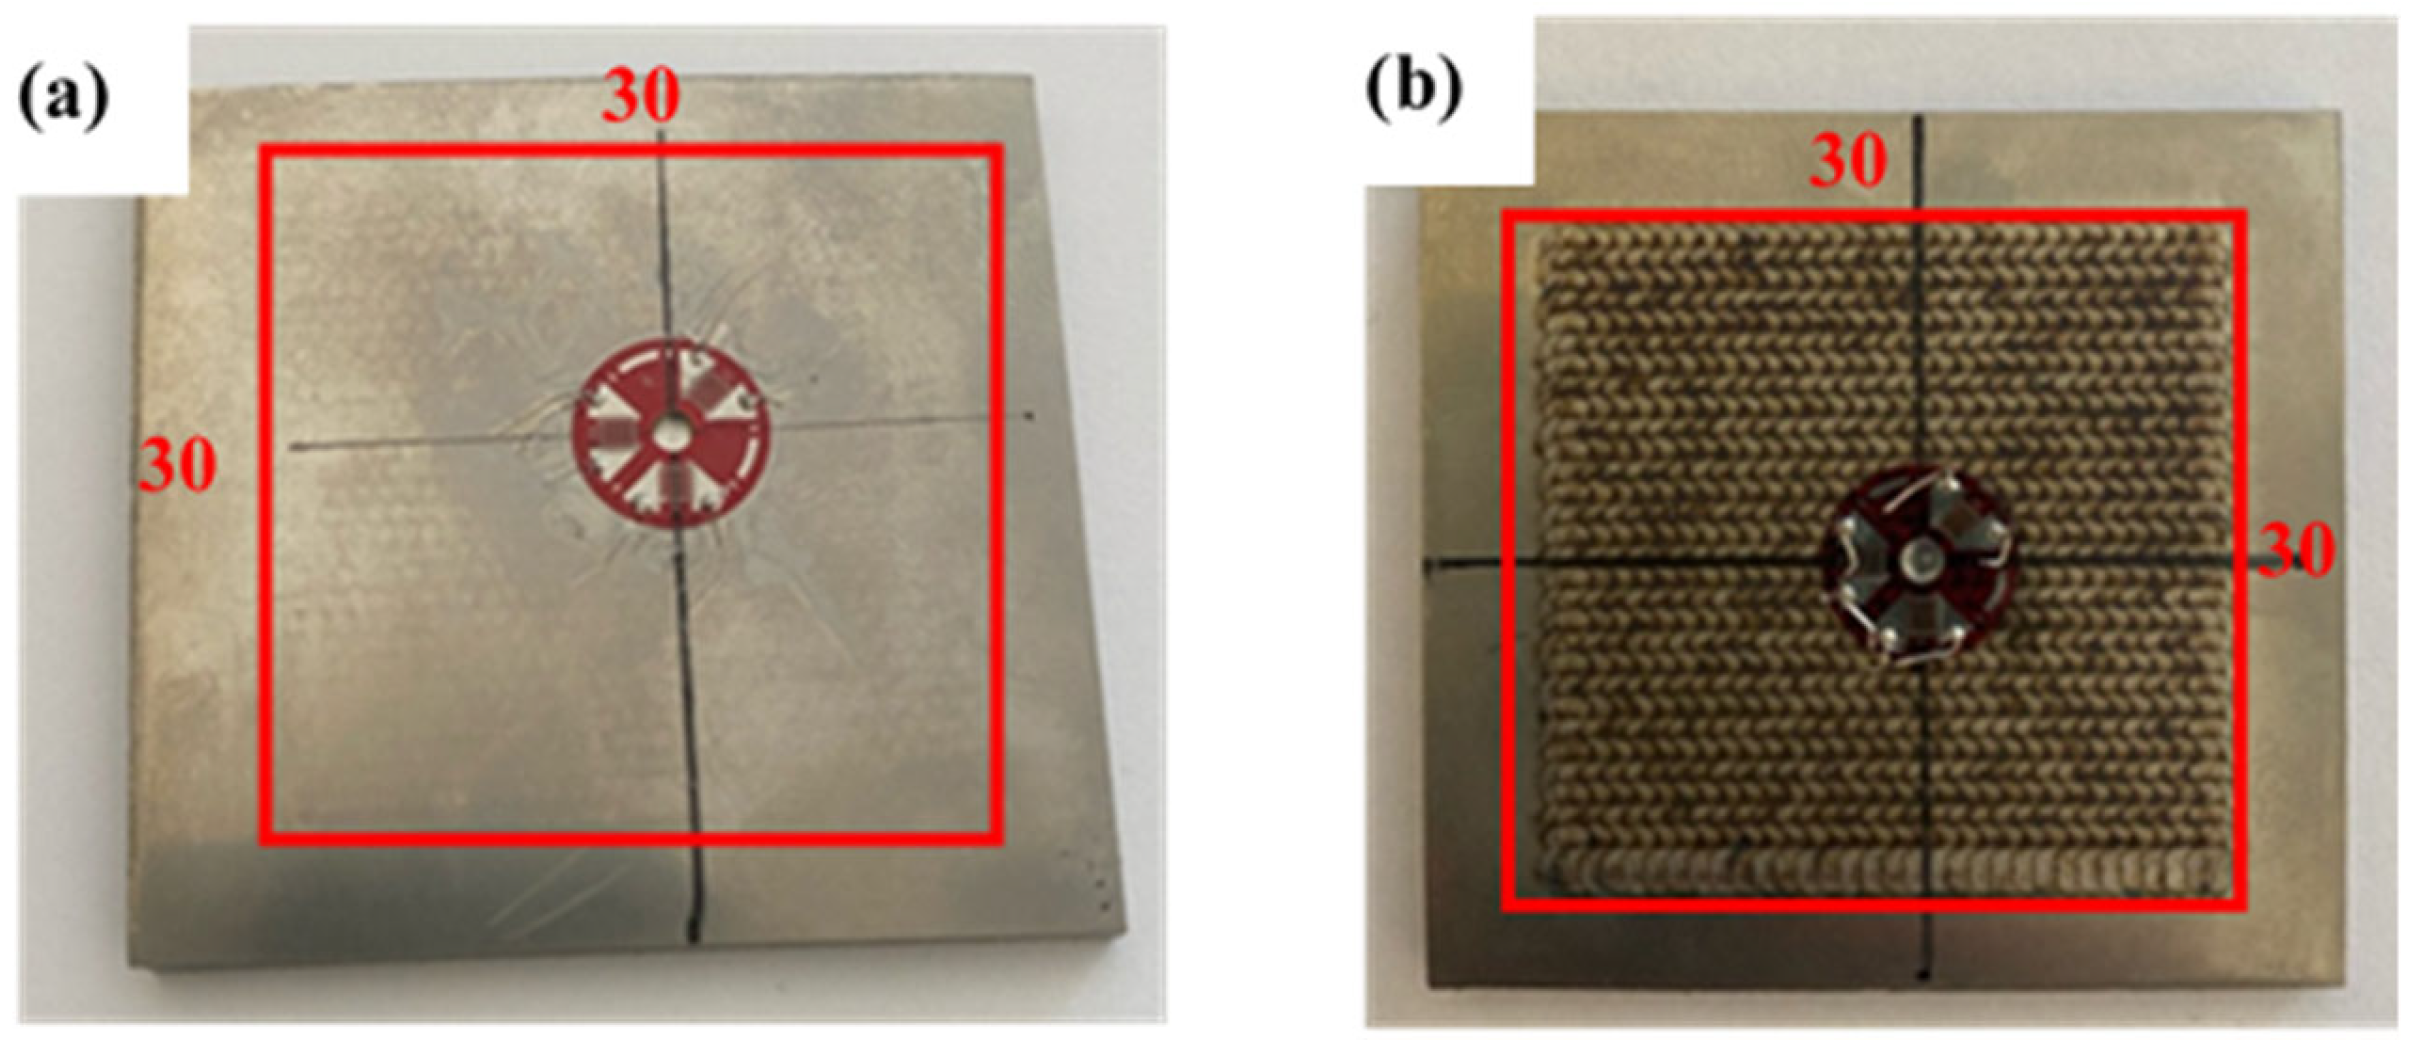
2.1. Laser Shock Peening and Material
2.2. Microstructural Studies
2.3. Residual Stress Measurement
2.4. Microhardness Measurement
3. Results
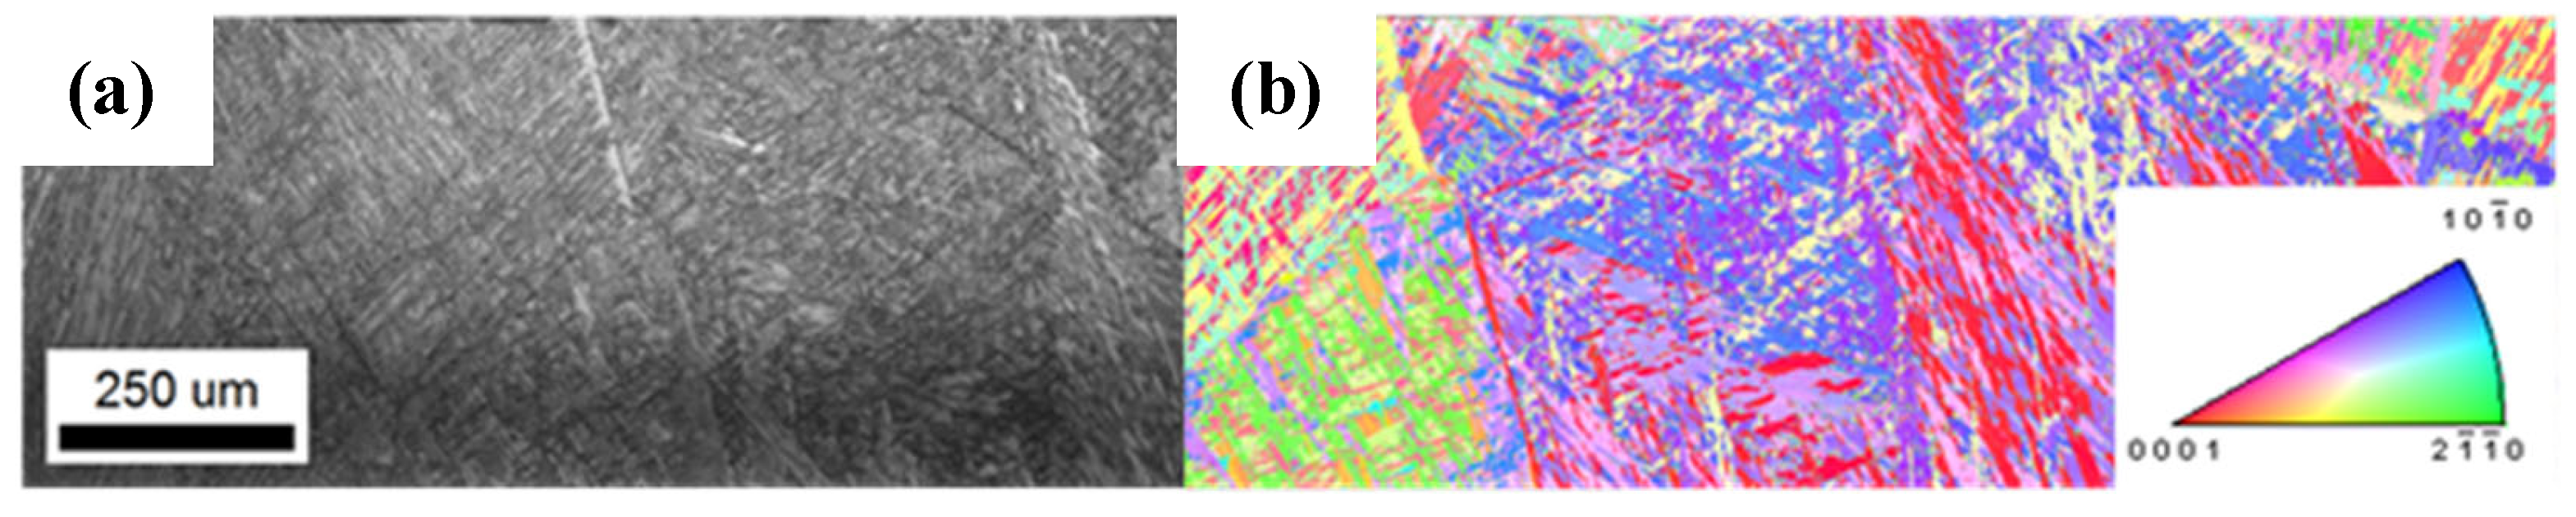
3.1. Initial State
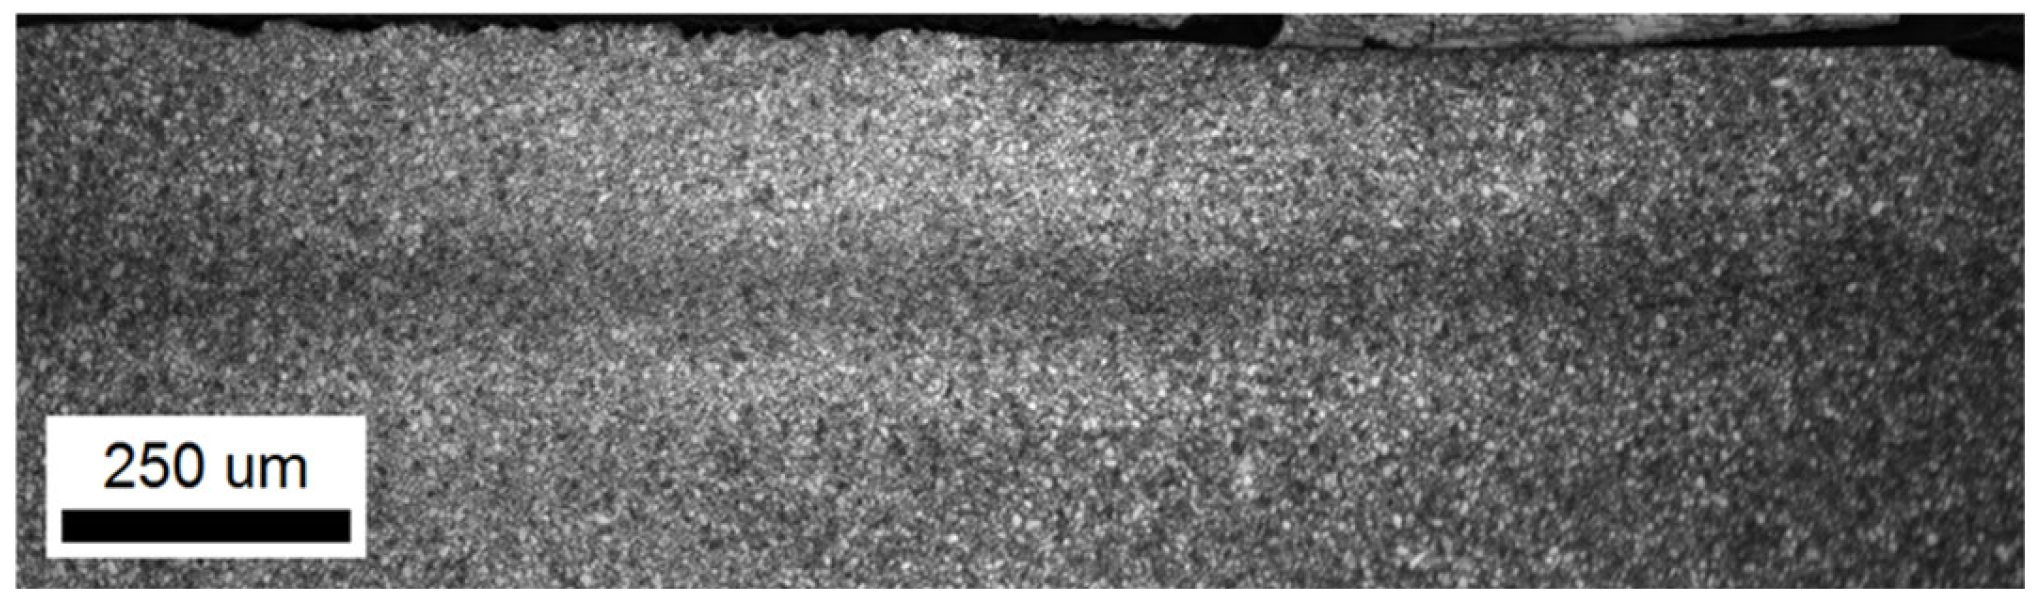
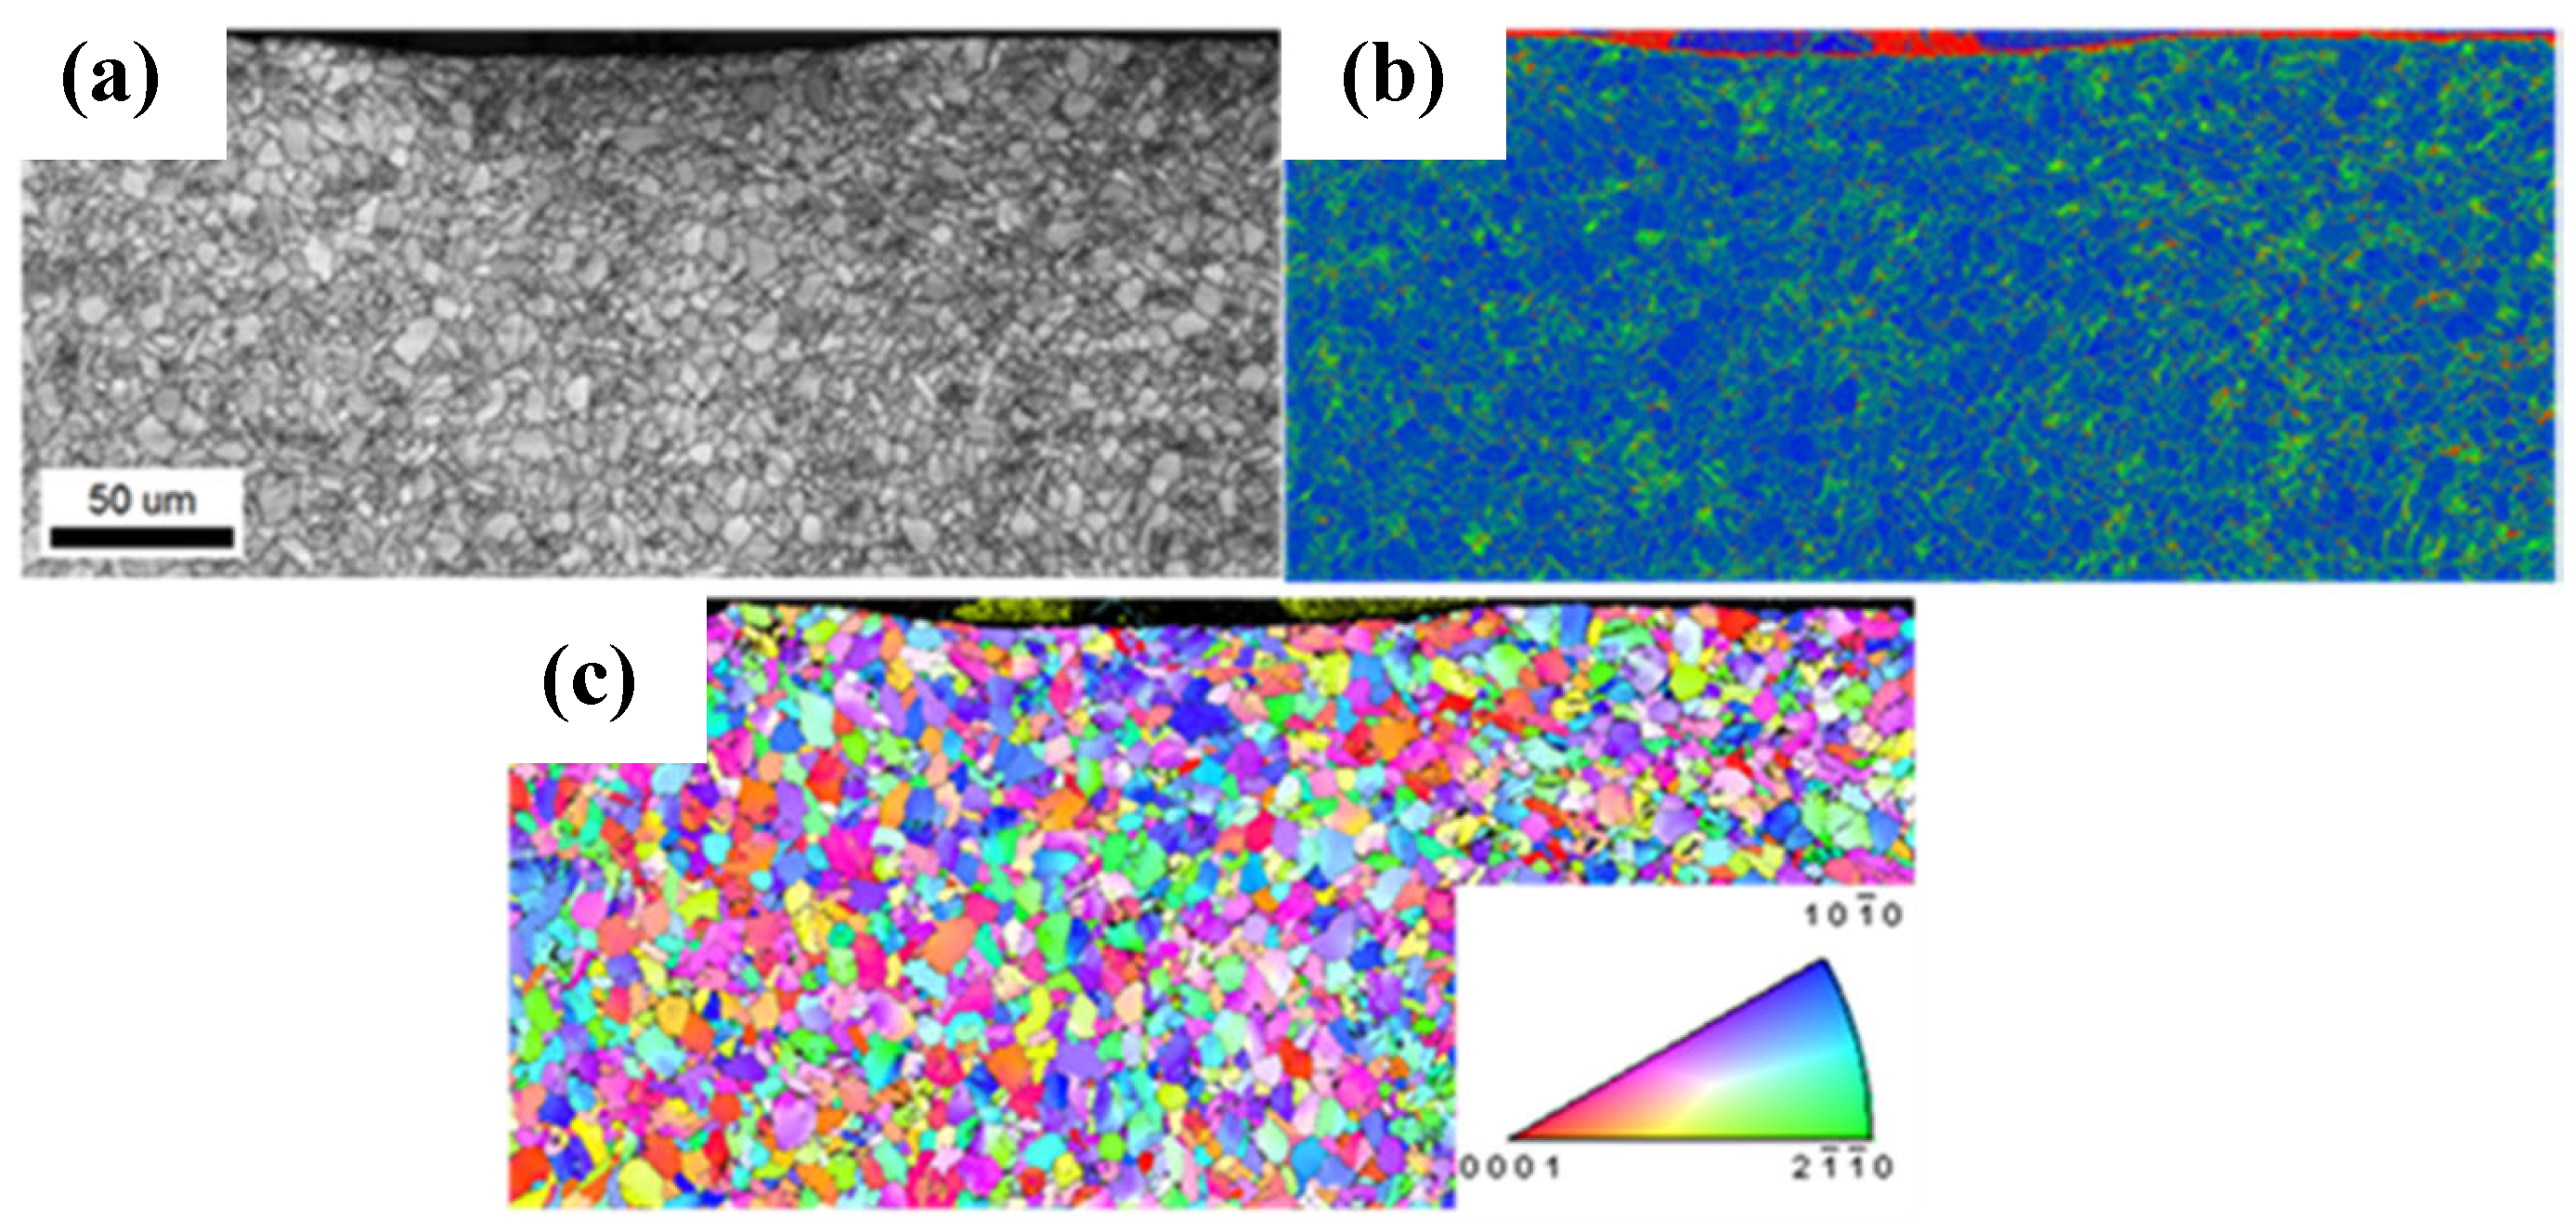
3.2. Structural Studies
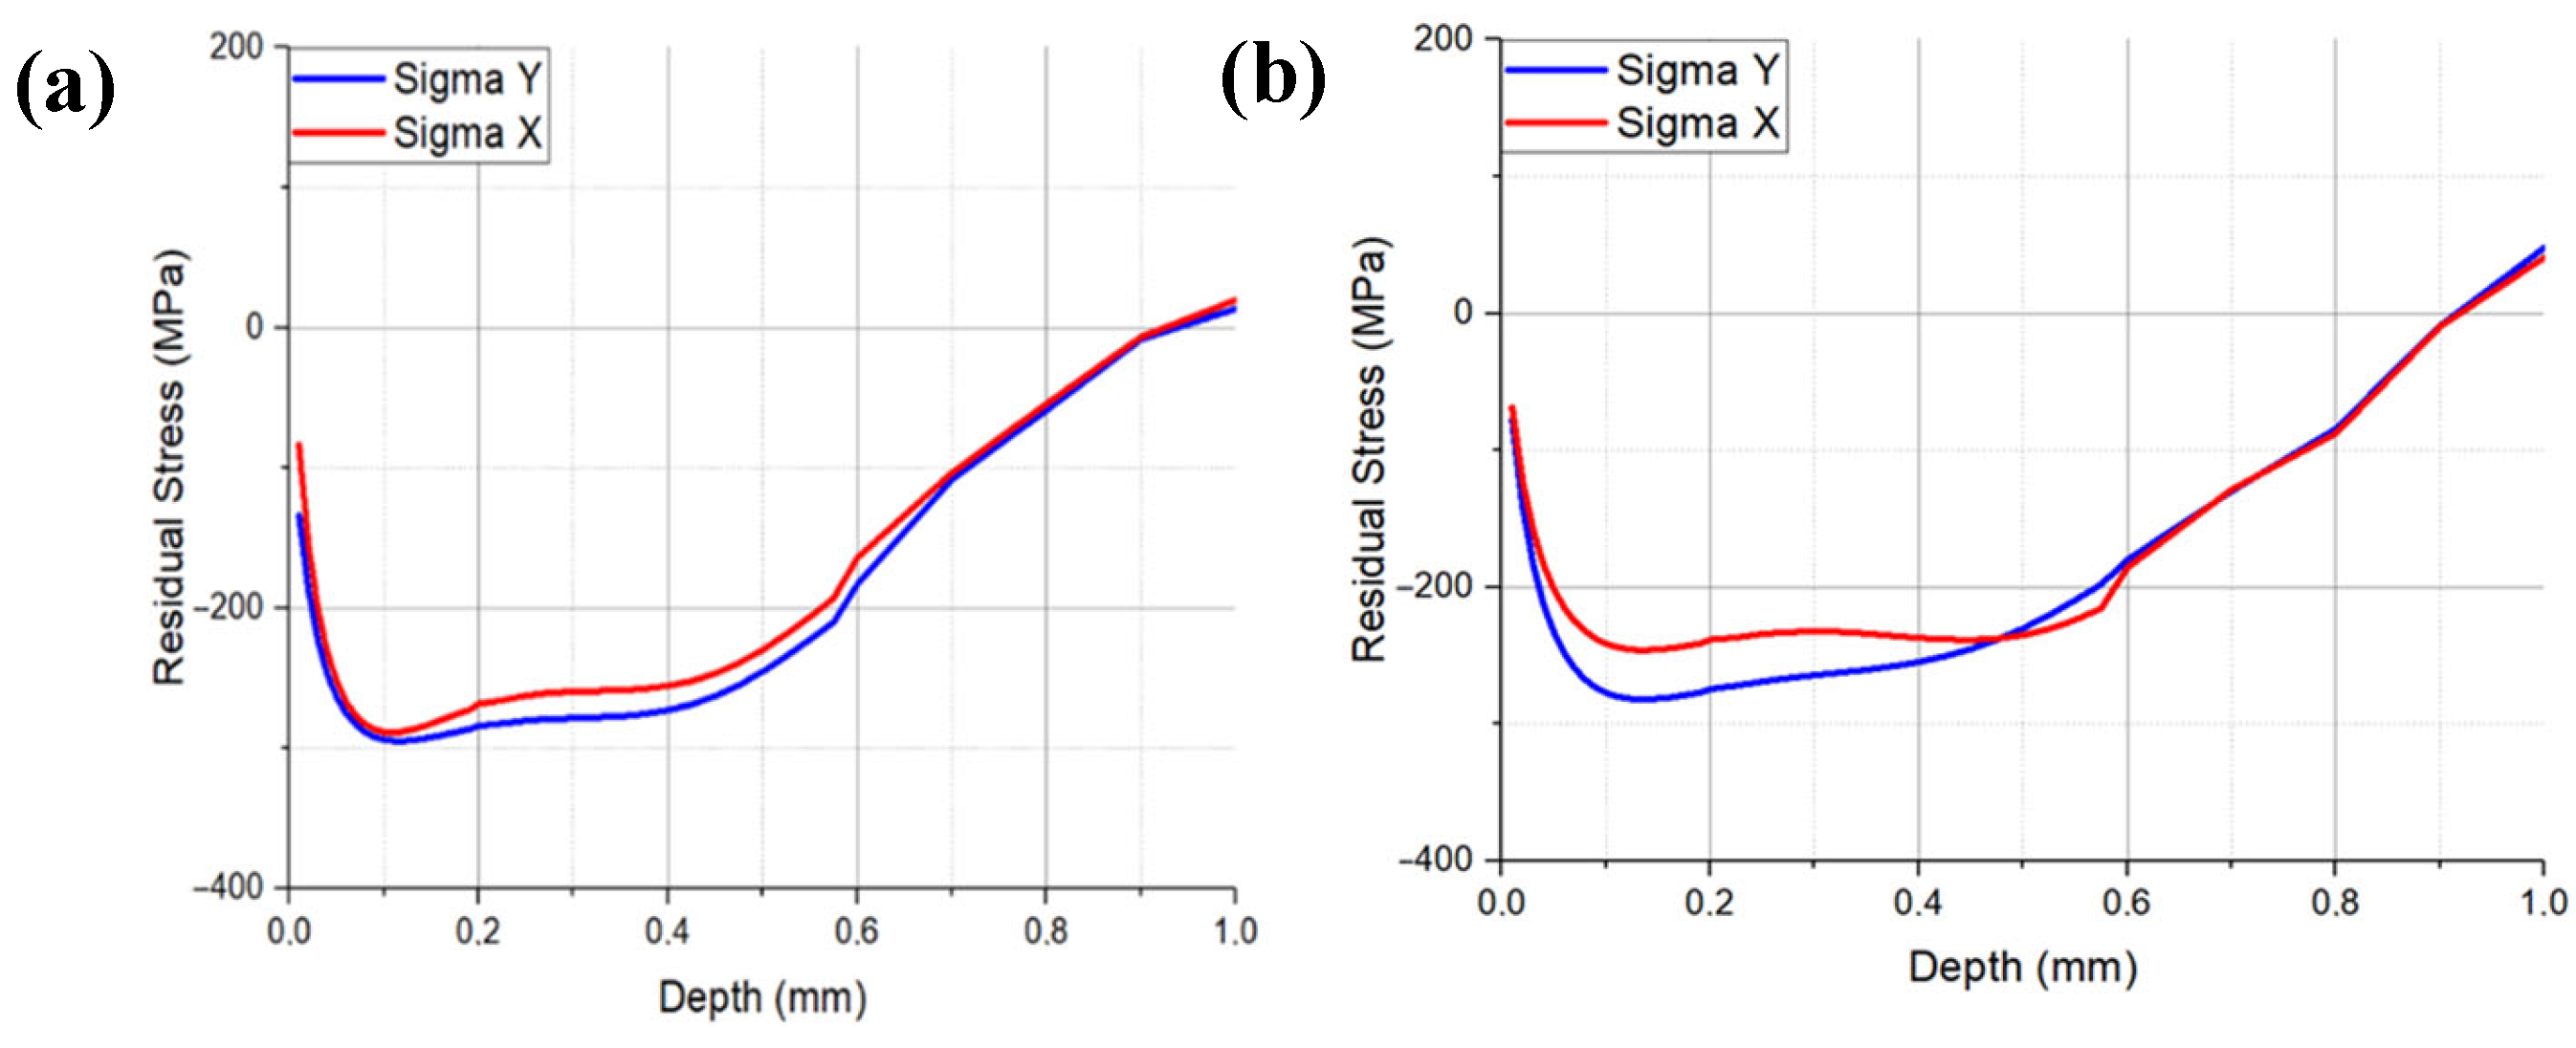
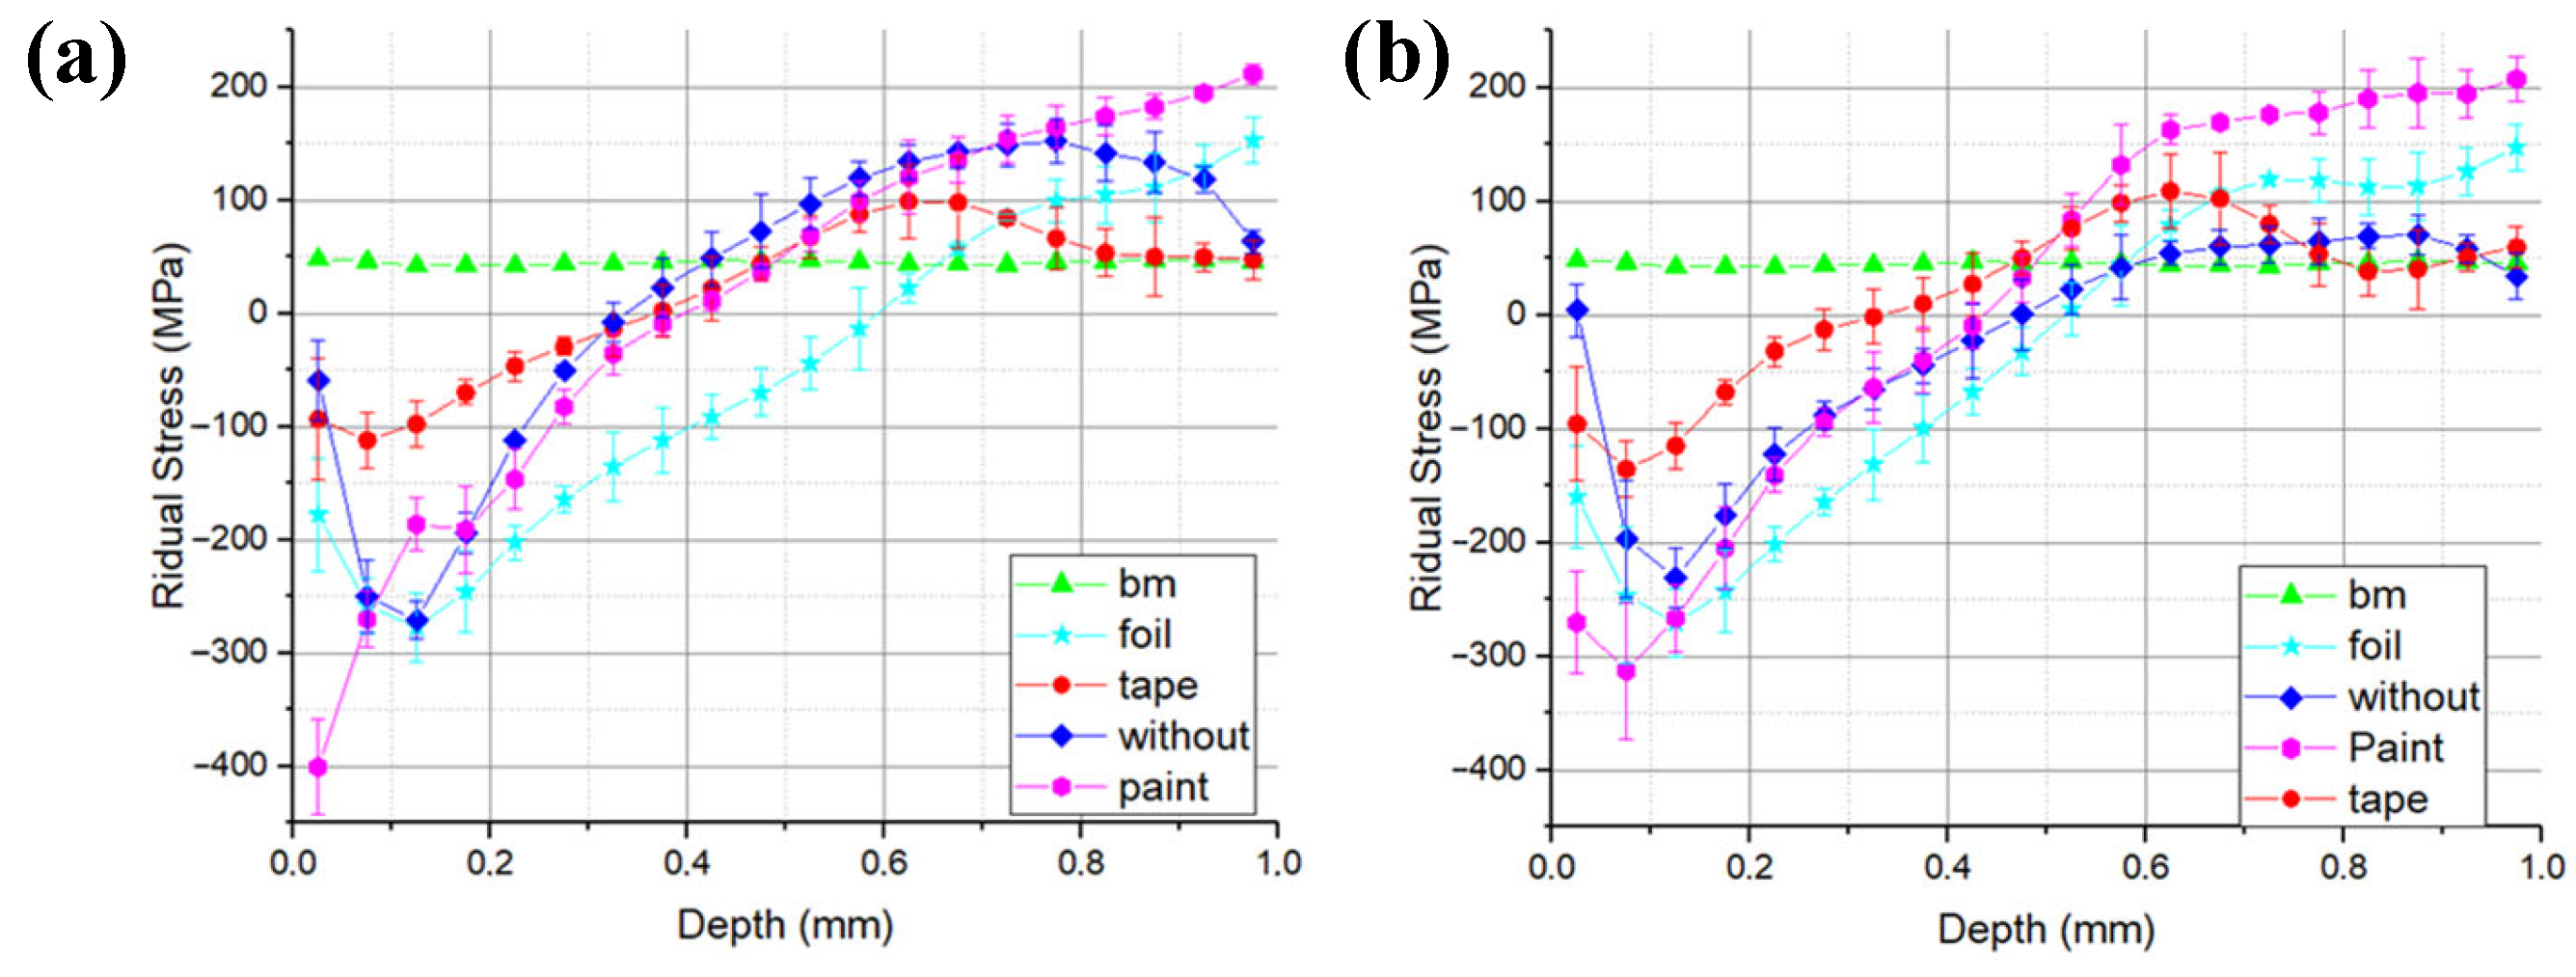
3.3. Measurements of Residual Stresses and Coating Effects
Z(H2O + Al) = 0.27 · 106 g/cm2 s−1,
Z(H2O + Tape) = 0.18 · 106 g/cm2 s−1,
Z(H2O + Paint) = 0.27 · 106 g/cm2 s−1.
P(Al) = 4.4 GPa,
P(Tape) = 3.6 GPa,
P(Paint) = 4.4 GPa.
Den (Ti + Tape) = 0.451,
Den (Ti + Paint) = 0.900;
Damp(Ti + Tape) = 0.204,
Damp(Ti + Paint) = 0.810.
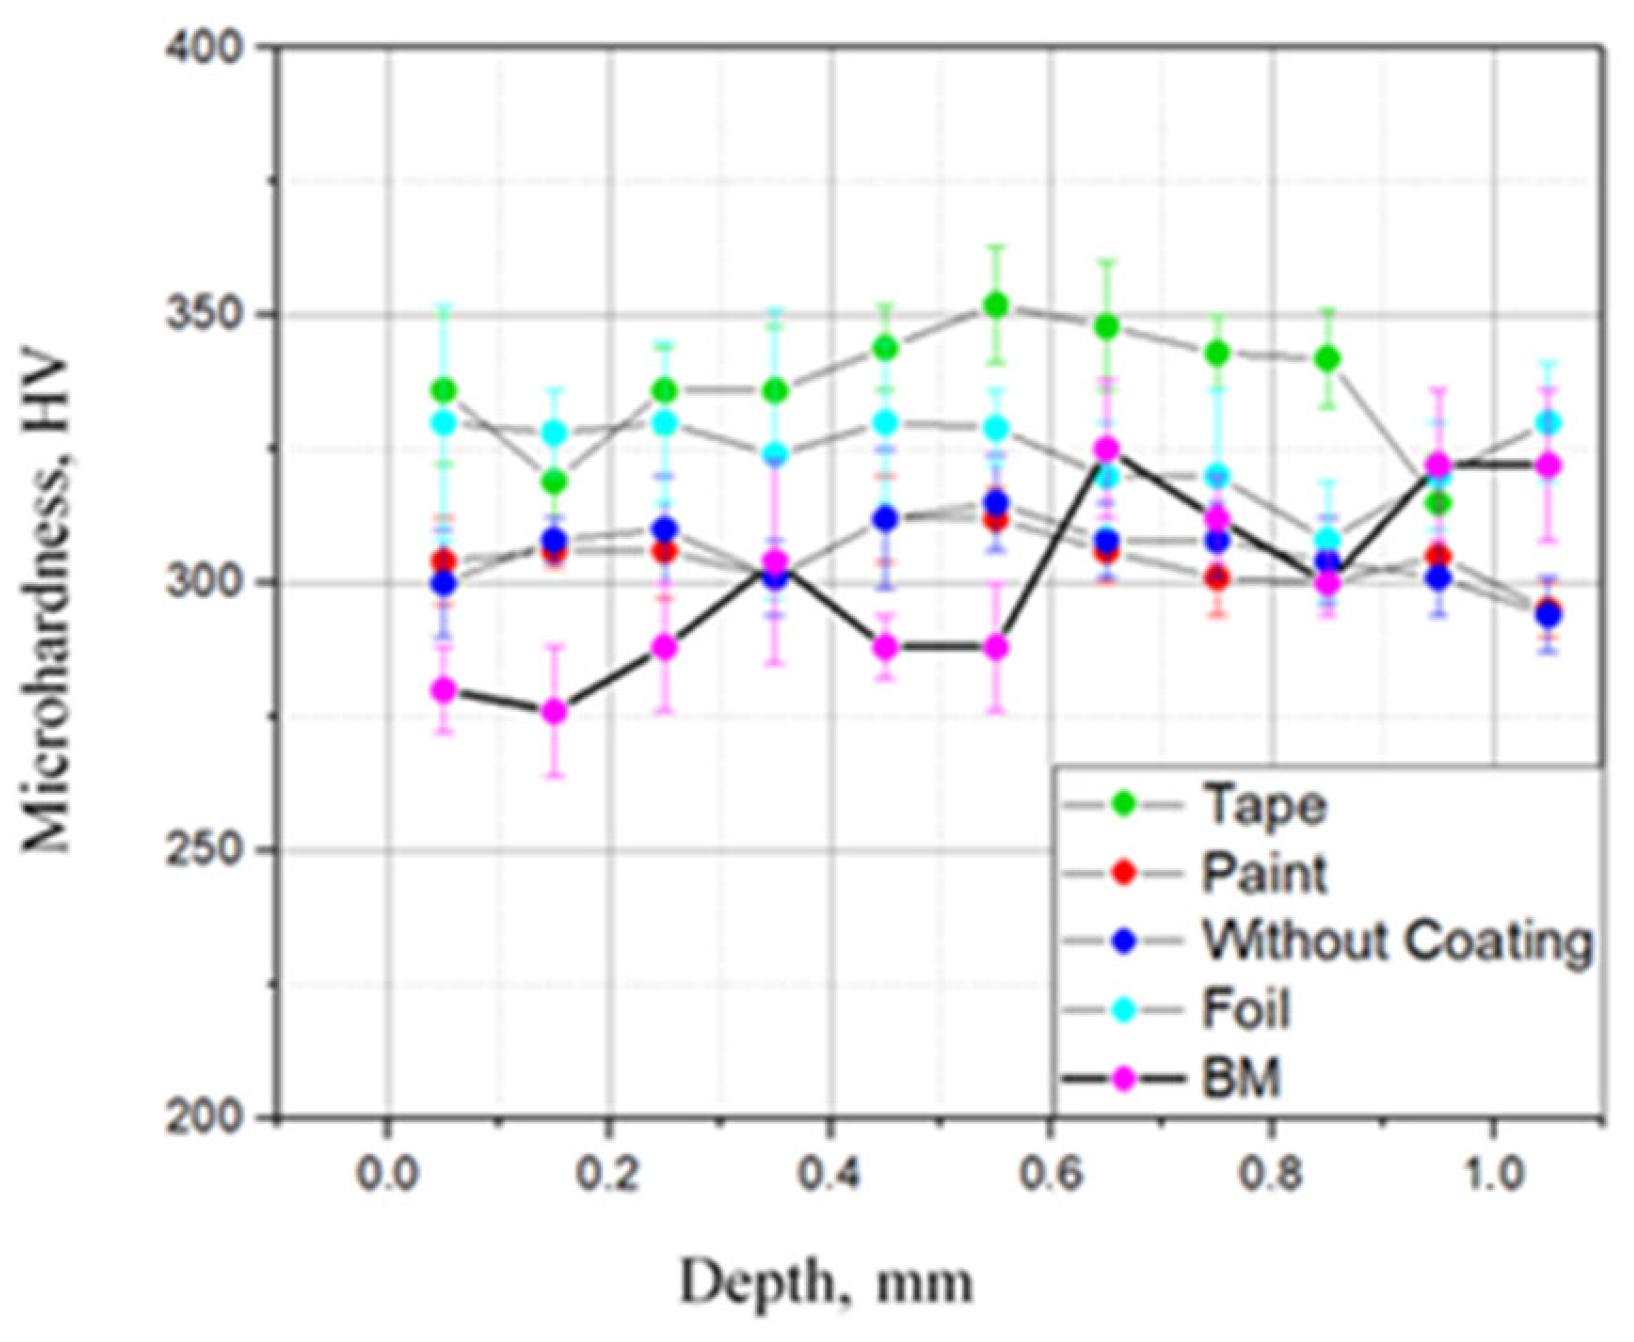
3.4. Measurement of Microhardness after Laser Shock Treatment
4. Conclusions
Author Contributions
Funding
Data Availability Statement
Conflicts of Interest
References
- Clauer, A.H. Laser Shock Peening, the Path to Production by LSP Technologies. Metals 2019, 9, 626. [Google Scholar] [CrossRef]
- Ge, M.Z.; Xiang, J.Y. Effect of laser shock peening on microstructure and fatigue crack growth rate of AZ31B magnesium alloy. J. Alloys Compd. 2016, 680, 544–552. [Google Scholar] [CrossRef]
- Iziumova, A.; Zhelnin, M.Z.M.; Kostina, A.K.A.; Vshivkov, A.V.A.; Gachegova, E.G.E.; Plekhov, O.P.O.; Swaroop, S. Fatigue life investigation of notched TC4 specimens subjected to different patterns of laser shock peening. Frat. Integr. Strutt. 2023, 17, 100–111. [Google Scholar] [CrossRef]
- Sun, R.; Keller, S.; Zhu, Y.; Guo, W.; Kashaev, N.; Klusemann, B. Experimental-numerical study of laser-shock-peening-induced retardation of fatigue crack propagation in Ti-17 titanium alloy. Int. J. Fatigue 2021, 145, 106081. [Google Scholar] [CrossRef]
- Elango, K.; Hoppius, J.S.; Kukreja, L.M.; Ostendorf, A.; Gurevich, E.L. Studies on ultra-short pulsed laser shock peening of stainless-steel in different confinement media. Surf. Coat. Technol. 2020, 397, 125988. [Google Scholar] [CrossRef]
- Lim, H.; Lee, M.; Kim, P.; Park, J.; Jeong, S. Improvement of surface hardness of duplex stainless steel by laser shock hardening for the application to seawater desalination pump. Desalin. Water Treat. 2010, 15, 43–47. [Google Scholar] [CrossRef]
- Jose, B.; Patil, T.; Rajan, S.S.; Praveenkumar, K.; Manivasagam, G.; Swaroop, S. Effect of laser shock peening without coating (LPwC) on a surface and sub-surface characteristics of aged Ti 15 V-3Al-3Cr-3Sn alloy. Mater. Today Proc. 2021, 46, 578–582. [Google Scholar] [CrossRef]
- Maharjan, N.; Ramesh, T.; Wang, Z. High energy laser shock peening of Ti6Al4V alloy without any protective coating. Appl. Surf. Sci. 2023, 638, 158110. [Google Scholar] [CrossRef]
- Correa, C.; Peral, D.; Porro, J.A.; Díaz, M.; De Lara, L.R.; García-Beltrán, A.; Ocaña, J.L. Random-type scanning patterns in laser shock peening without absorbing coating in 2024-T351 Al alloy: A solution to reduce residual stress anisotropy. Opt. Laser Technol. 2015, 73, 179–187. [Google Scholar] [CrossRef]
- Lan, L.; Jin, X.; Gao, S.; He, B.; Rong, Y. Microstructural evolution and stress state related to mechanical properties of electron beam melted Ti-6Al-4V alloy modified by laser shock peening. J. Mater. Sci. Technol. 2020, 50, 153–161. [Google Scholar] [CrossRef]
- Maruschak, P.; Menou, A.; Czausow, M.; Mocharskyi, V. Fractographic analysis of surface and failure mechanisms of nanotitanium after laser shock-wave treatment. Key Eng. Mater. 2014, 592, 346–349. [Google Scholar] [CrossRef]
- Lan, L.; Xin, R.; Jin, X.; Gao, S.; He, B.; Rong, Y.; Min, N. Effects of laser shock peening on microstructure and properties of Ti–6Al–4V titanium alloy fabricated via selective laser melting. Materials 2020, 13, 3261. [Google Scholar] [CrossRef] [PubMed]
- Jin, X.; Lan, L.; Gao, S.; He, B.; Rong, Y. Effects of laser shock peening on microstructure and fatigue behavior of Ti–6Al–4V alloy fabricated via electron beam melting. Mater. Sci. Eng. A 2020, 780, 139199. [Google Scholar] [CrossRef]
- Zhou, W.; Ren, X.; Liu, F.; Ren, Y.; Li, L. Nanocrystallization in the duplex Ti-6Al-4V alloy processed by multiple laser shock peening. Metals 2016, 6, 297. [Google Scholar] [CrossRef]
- Pan, X.; He, W.; Huang, X.; Wang, X.; Shi, X.; Jia, W.; Zhou, L. Plastic deformation behavior of titanium alloy by warm laser shock peening: Microstructure evolution and mechanical properties. Surf. Coat. Technol. 2021, 405, 126670. [Google Scholar] [CrossRef]
- Altenberger, I.; Nalla, R.K.; Sano, Y.; Wagner, L.; Ritchie, R.O. On the effect of deep-rolling and laser-peening on the stress-controlled low- and high-cycle fatigue behavior of Ti–6Al–4V at elevated temperatures up to 550 °C. Int. J. Fatig. 2012, 44, 292–302. [Google Scholar] [CrossRef]
- Zhang, X.C.; Zhang, Y.K.; Lu, J.Z.; Xuan, F.Z.; Wang, Z.D.; Tu, S.T. Improvement of fatigue life of Ti–6Al–4V alloy by laser shock peening. Mater. Sci. Eng. A 2010, 527, 3411–3415. [Google Scholar] [CrossRef]
- Lu, H.; Wang, Z.; Cai, J.; Xu, X.; Luo, K.; Wu, L.; Lu, J. Effects of laser shock peening on the hot corrosion behaviour of the selective laser melted Ti6Al4V titanium alloy. Corr. Sci. 2021, 188, 109558. [Google Scholar] [CrossRef]
- Altenberger, I.; Stach, E.; Liu, G.; Nalla, R.; Ritchie, R. An in situ transmission electron microscope study of the thermal stability of near-surface microstructures induced by deep rolling and laser-shock peening. Scr. Mater. 2003, 48, 1593–1598. [Google Scholar] [CrossRef]
- Clauer, A.H.; Lahrman, D.F. Laser shock processing as a surface enhancement process. Key Eng. Mater. 2001, 197, 121–144. [Google Scholar] [CrossRef]
- Ren, X.D.; Zhou, W.F.; Liu, F.F.; Ren, Y.P.; Yuan, S.Q.; Ren, N.F.; Xu, S.D.; Yang, T. Microstructure evolution and grain refinement of Ti-6Al-4V alloy by laser shock processing. App. Surf. Sci. 2016, 363, 44–49. [Google Scholar] [CrossRef]
- Humphreys, F.J. Review grain and subgrain characterisation by electron backscatter diffraction. J. Mater. Sci. 2001, 36, 3833–3854. [Google Scholar] [CrossRef]
- Íris, C.; Simões, S. Recent advances in EBSD characterization of metals. Metals 2020, 10, 1097. [Google Scholar] [CrossRef]
- Schwartz, A.J.; Kumar, M.; Adams, B.L.; Field, D.P. (Eds.) Electron Backscatter Diffraction in Materials Science; Springer: New York, NY, USA, 2009; Volume 2, pp. 2–9. [Google Scholar]
- Field, D.P. Recent advances in the application of orientation imaging. Ultramicroscopy 1997, 67, 1–9. [Google Scholar] [CrossRef]
- ASTM E837-13a; Standard Test Method for Determining Residual Stresses by the Hole-Drilling Strain-Gage Method. ASTM International: West Conshohocken, PA, USA, 2013.
- Schajer, G.S. Measurement of Non-Uniform Residual Stresses Using the Hole-Drilling Method. Part I—Stress Calculation Procedures. J. Eng. Mater. Technol. 1988, 110, 338–343. [Google Scholar] [CrossRef]
- Corrêa, F.J.; Jahnert, F.A.; Tomás, J.P. Residual stress profile determination by the hole-drilling method with calibration coefficients obtained using FEM. J. Theor. Appl. Mech. 2021, 59, 661–673. [Google Scholar] [CrossRef]
- Documentation for Hardness Testers of the Production Company “METOLAB”/Founder of METOLAB.—Moscow. 2023. Available online: https://metolab.ru/dokumentaciya (accessed on 5 June 2024).
- Borisova, E.A.; Bochvar, G.A.; Brun, M.Y. Titanium alloys: Metallography of titanium alloys. In Metallurgy; Publisher: Moscow, Russia, 1980; p. 464. [Google Scholar]
- Ashby, M.F. The deformation of plastically non-homogeneous materials. Philos. Mag. 1970, 21, 399–424. [Google Scholar] [CrossRef]
- Fabbro, R.; Fournier, J.; Ballard, P.; Devaux, D.; Virmont, J. Physical study of laser-produced plasma in confined geometry. J. Appl. Phys. 1990, 68, 775–784. [Google Scholar] [CrossRef]


| Parameter | Value |
|---|---|
| Power density | 10 GW/cm2 |
| Geometry of the laser beam spot | Square with 1 mm side |
| Overlap | 0% |
| Pulse frequency | 5 Hz |
| Size of the treatment area | 30 × 30 mm |
Disclaimer/Publisher’s Note: The statements, opinions and data contained in all publications are solely those of the individual author(s) and contributor(s) and not of MDPI and/or the editor(s). MDPI and/or the editor(s) disclaim responsibility for any injury to people or property resulting from any ideas, methods, instructions or products referred to in the content. |
© 2024 by the authors. Licensee MDPI, Basel, Switzerland. This article is an open access article distributed under the terms and conditions of the Creative Commons Attribution (CC BY) license (https://creativecommons.org/licenses/by/4.0/).
Share and Cite
Gachegova, E.; Davydov, D.; Mironov, S.; Kalinenko, A.; Ozerov, M.; Zherebtsov, S.; Plekhov, O. The Influence of Absorbing Coating Material on the Efficiency of Laser Shock Peening. Metals 2024, 14, 1045. https://doi.org/10.3390/met14091045
Gachegova E, Davydov D, Mironov S, Kalinenko A, Ozerov M, Zherebtsov S, Plekhov O. The Influence of Absorbing Coating Material on the Efficiency of Laser Shock Peening. Metals. 2024; 14(9):1045. https://doi.org/10.3390/met14091045
Chicago/Turabian StyleGachegova, Elena, Denis Davydov, Sergey Mironov, Alexander Kalinenko, Maxim Ozerov, Sergey Zherebtsov, and Oleg Plekhov. 2024. "The Influence of Absorbing Coating Material on the Efficiency of Laser Shock Peening" Metals 14, no. 9: 1045. https://doi.org/10.3390/met14091045