Article

Effect of Sintering Temperature on the Microstructure and Mechanical and Tribological Properties of Copper Matrix Composite for Brake Pads

1
National United Engineering Laboratory for Advanced Bearing, Henan University of Science and Technology, Luoyang 471023, China
2
Faculty of Engineering, Huanghe Science and Technology University, Zhengzhou 450063, China
3
College of Mechanical and Electrical Engineering, Zhengzhou University of Light Industry, Zhengzhou 450005, China
*
Authors to whom correspondence should be addressed.
Metals 2024, 14(9), 1048; https://doi.org/10.3390/met14091048
Submission received: 26 July 2024 / Revised: 6 September 2024 / Accepted: 11 September 2024 / Published: 14 September 2024

Abstract

:
Copper-based powder metallurgy materials are frequently utilized in fabricating brake pads for high-speed trains. The preparation process involves mixing, ball milling, pressing, and sintering. Among these steps, hot-pressed sintering stands out as a rapid and efficient method that significantly influences the properties and performance of the products. In this study, four samples (S700/S750/S800/S850) were prepared using hot-pressed sintering at various temperatures, as follows: 700 °C, 750 °C, 800 °C, and 850 °C. The mechanical and physical properties of the four samples were tested, and the microstructure and compositions were investigated using scanning electron microscopy, energy dispersive spectroscopy, and X-ray diffraction. The findings highlighted the close relationship between sintering temperature and the mechanical and physical properties of the samples, as it impacts the porosity and interfacial bonding of the particles. Notably, Sample S800 demonstrated superior mechanical and thermal conductivity. Furthermore, the coefficient of friction (COF), friction heat, and wear rate of the four samples were also tested under different braking speeds ranging from 150 km/h to 350 km/h. The results indicated that the COFs of the four samples remained relatively stable below 300 km/h but decreased notably above 300 km/h due to heat fading. Sample S800 displayed consistent and high COF under varied braking speeds and exhibited the lowest wear rate. The observed wear mechanisms included abrasive wear and oxidation wear. Additionally, the friction test results underscored the close correspondence of the COF curve of S800 with the standard of the Ministry of Railways of the People’s Republic of China.

1. Introduction

The operability of high-speed trains, which can reach up to 350 km/h, depends heavily on the brake pads’ ability to ensure reliable emergency braking. With the requirement for the train to come to a complete stop within a safe braking distance of 3800 m, the friction braking system and its corresponding brake pads undergo rigorous testing. During this intense braking process, the brake pads consume significant kinetic energy, resulting in an energy density loss of up to 450 J/mm [1]. Consequently, the friction materials used for high-speed braking must exhibit specific characteristics such as high heat resistance, resistance to adhesion, stable friction coefficient, resistance to thermal fatigue, and sufficient mechanical strength. This has led to copper matrix composites (CMCs) emerging as the most suitable brake disc material for high-speed trains, owing to their advantages of high heat resistance, good mechanical properties, good thermal conductivity, and a stable friction coefficient [2].
The makeup of CMCs is quite intricate, comprised mainly of matrix components like Cu, strengthening components such as Sn, Ni, Al, Cr, and W, lubrication components like graphite, molybdenum disulfide, bismuth, and antimony, and friction components such as Al2O3, SiO2, SiC, and ZrO2. Consequently, powder metallurgy is extensively employed in the production of CMCs [3,4].
In the process of sintering, powder particles gain sufficient energy to undergo physical and chemical changes such as flow, diffusion, melting, and recrystallization [5,6,7]. This leads to increased density and the reduction of most pores [8]. The strength of the sintered material, assuming the composition remains unchanged, is primarily determined by crystal diffusion and grain size, which are in turn influenced by the sintering temperature and duration [9].
As per sintering theory [10], the recommended sintering temperature for sintered products is between two-thirds and four-fifths of the melting point temperature of the main component. However, this temperature can also be affected by factors like composition, particle shape and size [11], sintering method, among others. Hence, the optimal sintering temperature is not fixed, and some researchers have delved into this topic.
Islak S et al. [12] investigated the effect of sintering temperature on the properties of Cu/TiC composites and observed that both hardness and electrical conductivity increased with rising sintering temperature within the range of 600–800 °C. However, they did not explore the effect of sintering temperatures above 800 °C on material properties. Zhou W et al. [13] examined the influence of temperature on nano-WC-reinforced copper MMCs performance and discovered that when the sintering temperature reached 1075 °C, the relative density approached nearly 100%, making tensile strength and hardness maximized; nevertheless, the electrical conductivity attained its maximum at 1100 °C. Ngai T. L. et al. [14] prepared Ti3SiC2/Cu composite materials and found that Ti3SiC2 is unstable at temperatures of 800 °C and above; therefore, its preparation temperature should be limited to 750 °C or lower. Wei H et al. [15] investigated the effects of four sintering temperatures (800, 850, 900, and 950 °C) on copper/graphite/Ti2SnC composites. It was found that the Cu matrix underwent a phase transformation from Cu to Cu5.6Sn to Cu41Sn11 to Cu3Sn with increasing sintering temperature. The relative density, hardness, friction coefficient, and wear rate of the composite material were optimal at a sintering temperature of 900 °C, while the resistivity was optimal at a sintering temperature of 950 °C. Swikker K. R. J. et al. [16] studied the effect of sintering temperature on the copper/graphene nanosheet (Cu/GNS) composite and found that the presence of GNS limits grain growth and prevents abnormal grain growth during sintering. It was discovered that the composite material exhibited maximum hardness and residual stress when sintered at 800 °C, while a further increase in sintering temperature resulted in a decrease in the mechanical properties of the composite material. Su Y et al. [17] discovered that in Ti3AlC2/copper/graphite composites, aluminum atoms begin to diffuse from TiAlC into the copper matrix at around 800 °C, resulting in the in situ formation of TiC and Cu-Al alloy. When the sintering temperature exceeds 850 °C, Ti3AlC2 is essentially completely decomposed.
Based on the aforementioned research, it is evident that the reaction products of different elements in CMCs can vary at distinct sintering temperatures, leading to differing changes in physical and mechanical properties. Hence, a thorough investigation into the influence of sintering temperature on CMCs is essential. Additionally, the composition types of the CMCs examined by the aforementioned scholars are relatively limited, typically encompassing two to three elemental particles. Nonetheless, the composition of copper-based brake pad materials is notably more intricate, characterized by significant variations in melting points among various elements. Hence, it is valuable to examine the impact of powder metallurgy methods on the characteristics and microstructure of CMCs.
This study introduces four distinct sintering temperature profiles and investigates the influence of sintering temperature on the mechanical properties and thermal conductivity of a copper matrix brake pad material, along with the underlying mechanisms of microstructure evolution. The objective is to establish a robust basis for the exploration of high-performance brake materials.

2. Experimental Procedure

2.1. Sample Preparation

The copper-based composite used in this study consisted of Cu, Sn, Fe, Cr3Fe, graphite, MoS2, and Fe3Al(Gripm Advanced Materials Co., Ltd., Beijing, China). Cu served as the matrix component. Sn and Cr3Fe were the components that strengthened the matrix. Cu, graphite, and MoS2 were combined and used as lubrication components. The intermetallic compound (IMC) Fe3Al acted as a friction component because of its better wear resistance [18], corrosion resistance [19], and oxidation resistance [20,21]. The chemical composition of the brake pad is shown in Table 1.
The various powders listed in Table 1 were placed in a vacuum oven(Taisitc Instrument Co., Ltd., Tianjin, China) and dried until a constant weight was achieved. Subsequently, the samples were transferred to a vacuum ball mill(Nanda Instrument, Nanjing, China) for ball grinding at a rate of 250 r/min for 10 h. The resulting powder was then placed in a graphite mold and sintered using an HVRY-3 high-vacuum hot-pressing sintering furnace((Suzhou Hateng Technology Co., Ltd, China). According to the classical sintering theory [22,23], the highest sintering temperature range is 726~866 °C. Consequently, four sintering temperatures of 700, 750, 800, and 850 °C were adopted for this experiment. The holding time was set to 30 min, and the heating and cooling rates were set at 10 °C/min. The maximum applied loading pressure was 40 MPa. The four sintering curves are illustrated in Figure 1. After sintering, the samples were left in the furnace to naturally cool.

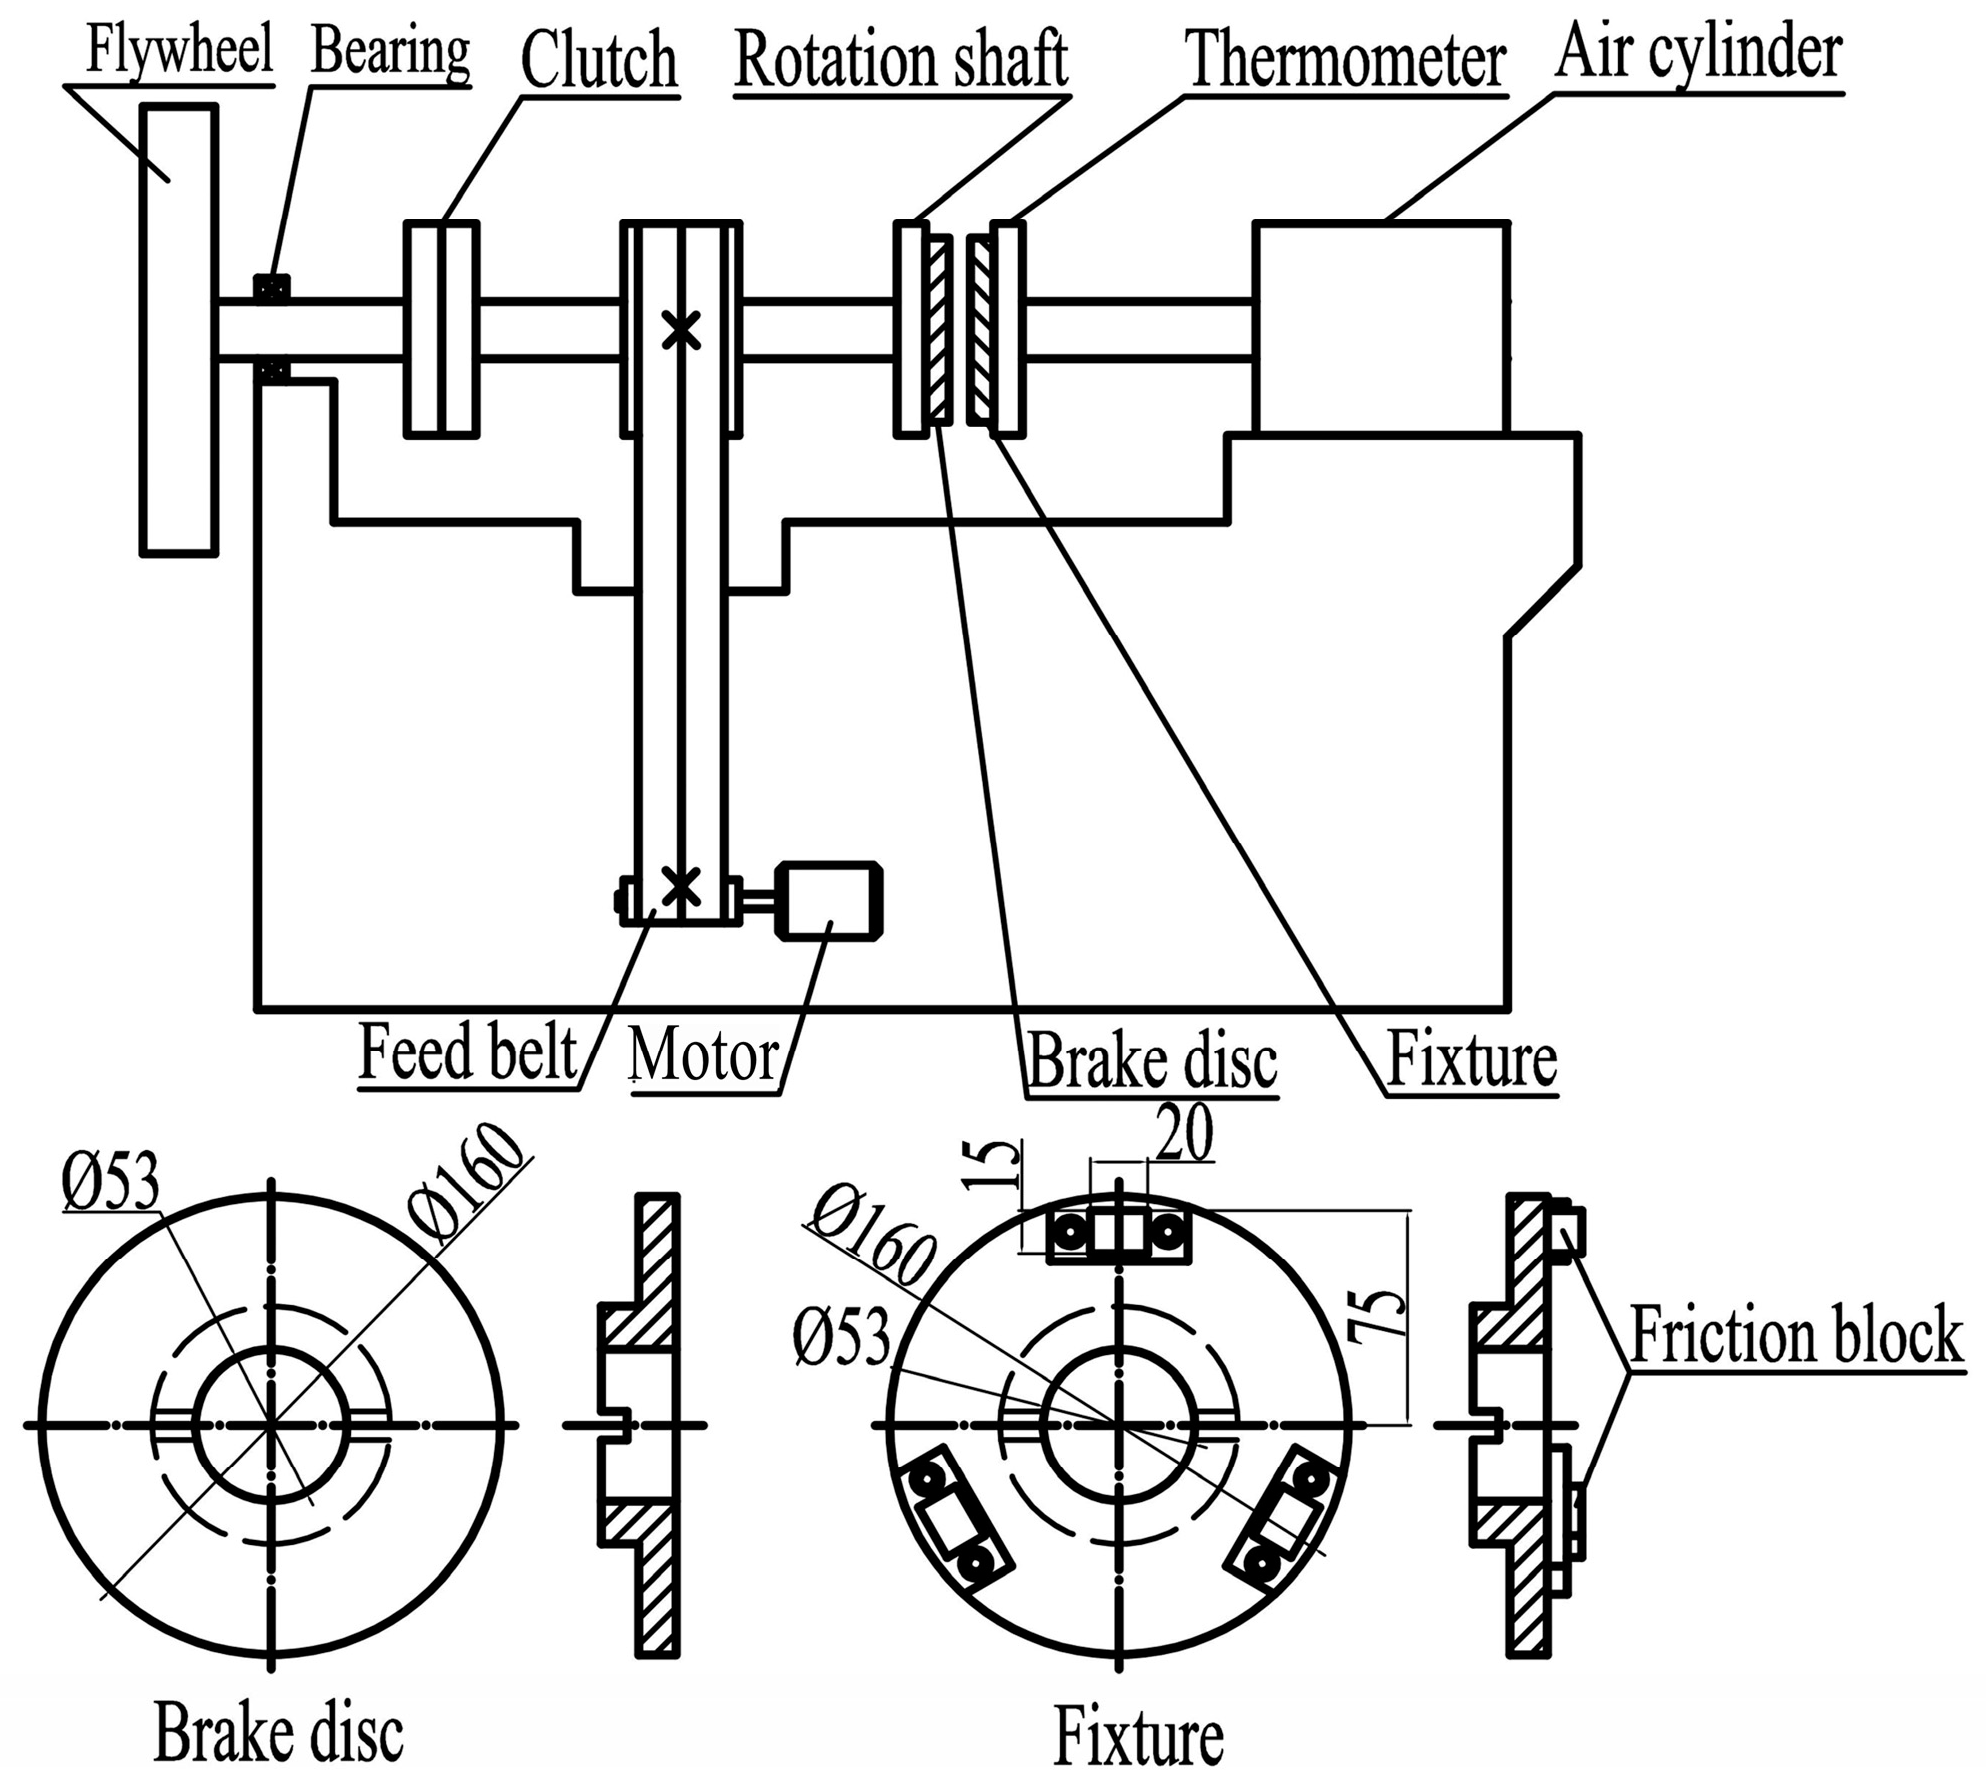
2.2. Performance Test

The four sintered samples were labeled S700, S750, S800, and S850. The density, Vickers hardness, compressive strength, and thermal conductivity of the samples, along with their braking performance, were tested individually. The composition and grain size of the samples were determined using Cu-Kα radiation via a D8 ADNANCEX X-ray diffraction (Bruker Instrument, Billerica, MA, USA) to characterize the main phases of the samples. Subsequently, their braking performance at different speeds was tested. Additionally, field emission scanning electron microscopy (FESEM JSM-7800 F, JEOL Ltd.,Tokyo, Japan) and energy spectrum analysis (EDS, Oxford Instruments, London, UK) were conducted to observe and analyze the microstructures of the samples before and after braking, respectively.
The relative density was measured using the Archimedes method. The Vickers hardness of the four samples was measured using a HVS-1000 digital Vickers hardness tester(Hua Yin test instrument Co., Ltd., Shanghai, China) with a 0.5 kgf load and a loading saturation time of 15 s.
The metallic materials were subjected to a compression test, conducted using a XinSanSi universal tensile testing machine at ambient temperature and a loading rate of 0.1 mm/s. Thermal conductivity was tested by using a TC3000E theromal conductivity meters (Xiatech Electronics Co., Ltd., Xi’an, China) and applying a loading force of 0.5 kgf in the direction of pressing.
Braking performance was evaluated using a MM3000 friction wear testing machine (SHUNTONG TECH, Xi’an, China) under a dry sliding condition, as depicted in Figure 2. The testing system was powered by a belt that transferred kinetic energy from the motor to the brake disk. The brake disk material used was a high-strength steel alloy (30CrSiMoVA) with a diameter of 175 mm and a thickness of 12 mm. The samples prepared in this experiment were installed on a fixture with dimensions of 20 mm (length), 10 mm (width), and 15 mm (height). During the experiment, the fixture first remained stationary while the braking disk rotated at a pre-set speed. Once the brake disk reached the set speed, the power output was disengaged. Simultaneously, positive pressure (0.8 MPa) was applied by a cylinder to bring the fixture disk into contact with the brake disk, generating friction braking torque to brake. Real-time measurement of friction braking torque was conducted using an appropriate sensor. Based on Newton’s friction formula [24], the real-time coefficient of friction can be calculated as follows:
μ = T p A L
where μ is the instant COF, T is the braking torque caused by friction, p is the cylinder pressure, A is the contact area between the samples and the friction disk, and L is the arm of force (distance from the center of the sample to the center of the fixture).
Each braking test was repeated 10 times at various speeds. The subsurface temperature, measured at a depth of 2 mm from the braking surface using a thermocouple, was also tested. Subsequently, the samples were weighed using a precision electronic balance (MS303S/01), and the samples’ abrasion loss after braking was calculated using Equation (2) [25]:
δ = H · A W
where δ is the line wear rate (cm3·N−1·m−1); H is the line wear amount (cm), as determined using a micrometer; A is the contact area between the samples and the friction disk (cm2); and ΣW is the accumulated friction work after ten brake applications at different speeds (N·m).
The friction fluctuation coefficient (β) is used to measure the overall stability performance of the braking process, and its calculation formula is shown in Equation (3) [26]:
β μ m a x μ m i n μ ¯ × 100 %
where μ ¯ is the average COF, μmax is the maximum COF, and μmin is the minimum COF during every test.
X-ray diffraction analysis featuring the use of Cu- radiation was performed using a Bruker D8 ADNANCEX instrument to characterize the main phases of the samples. The crystallite size (D) under different sintering temperature curves was determined via X-ray diffraction using the Scherrer formula [27]:
D = K λ β D C O S θ
where βD is the peak full width at half maximum (FWHM) intensity (after subtracting the instrumental broadening), θ is the diffraction angle, λ is the X-ray wavelength of the Cu- radiation (0.154 nm), and K is the Scherrer constant (0.89). By measuring θ and βD, the crystallite size (D) was calculated. Before and after the friction test, the surfaces of the materials were observed using FESEM and EDS.
A MTT-5000L 3D profiling instrument(Rtec Instrument, San Jose, CA, USA) was employed for the analysis of geometric quality, typical wear characteristics, and surface roughness of the friction surface. Surface roughness was quantified using the mean deviation value of surface height (Sa), calculated using Formula (5).
S a = 1 A A z x , y d x d y

3. Results and Analysis
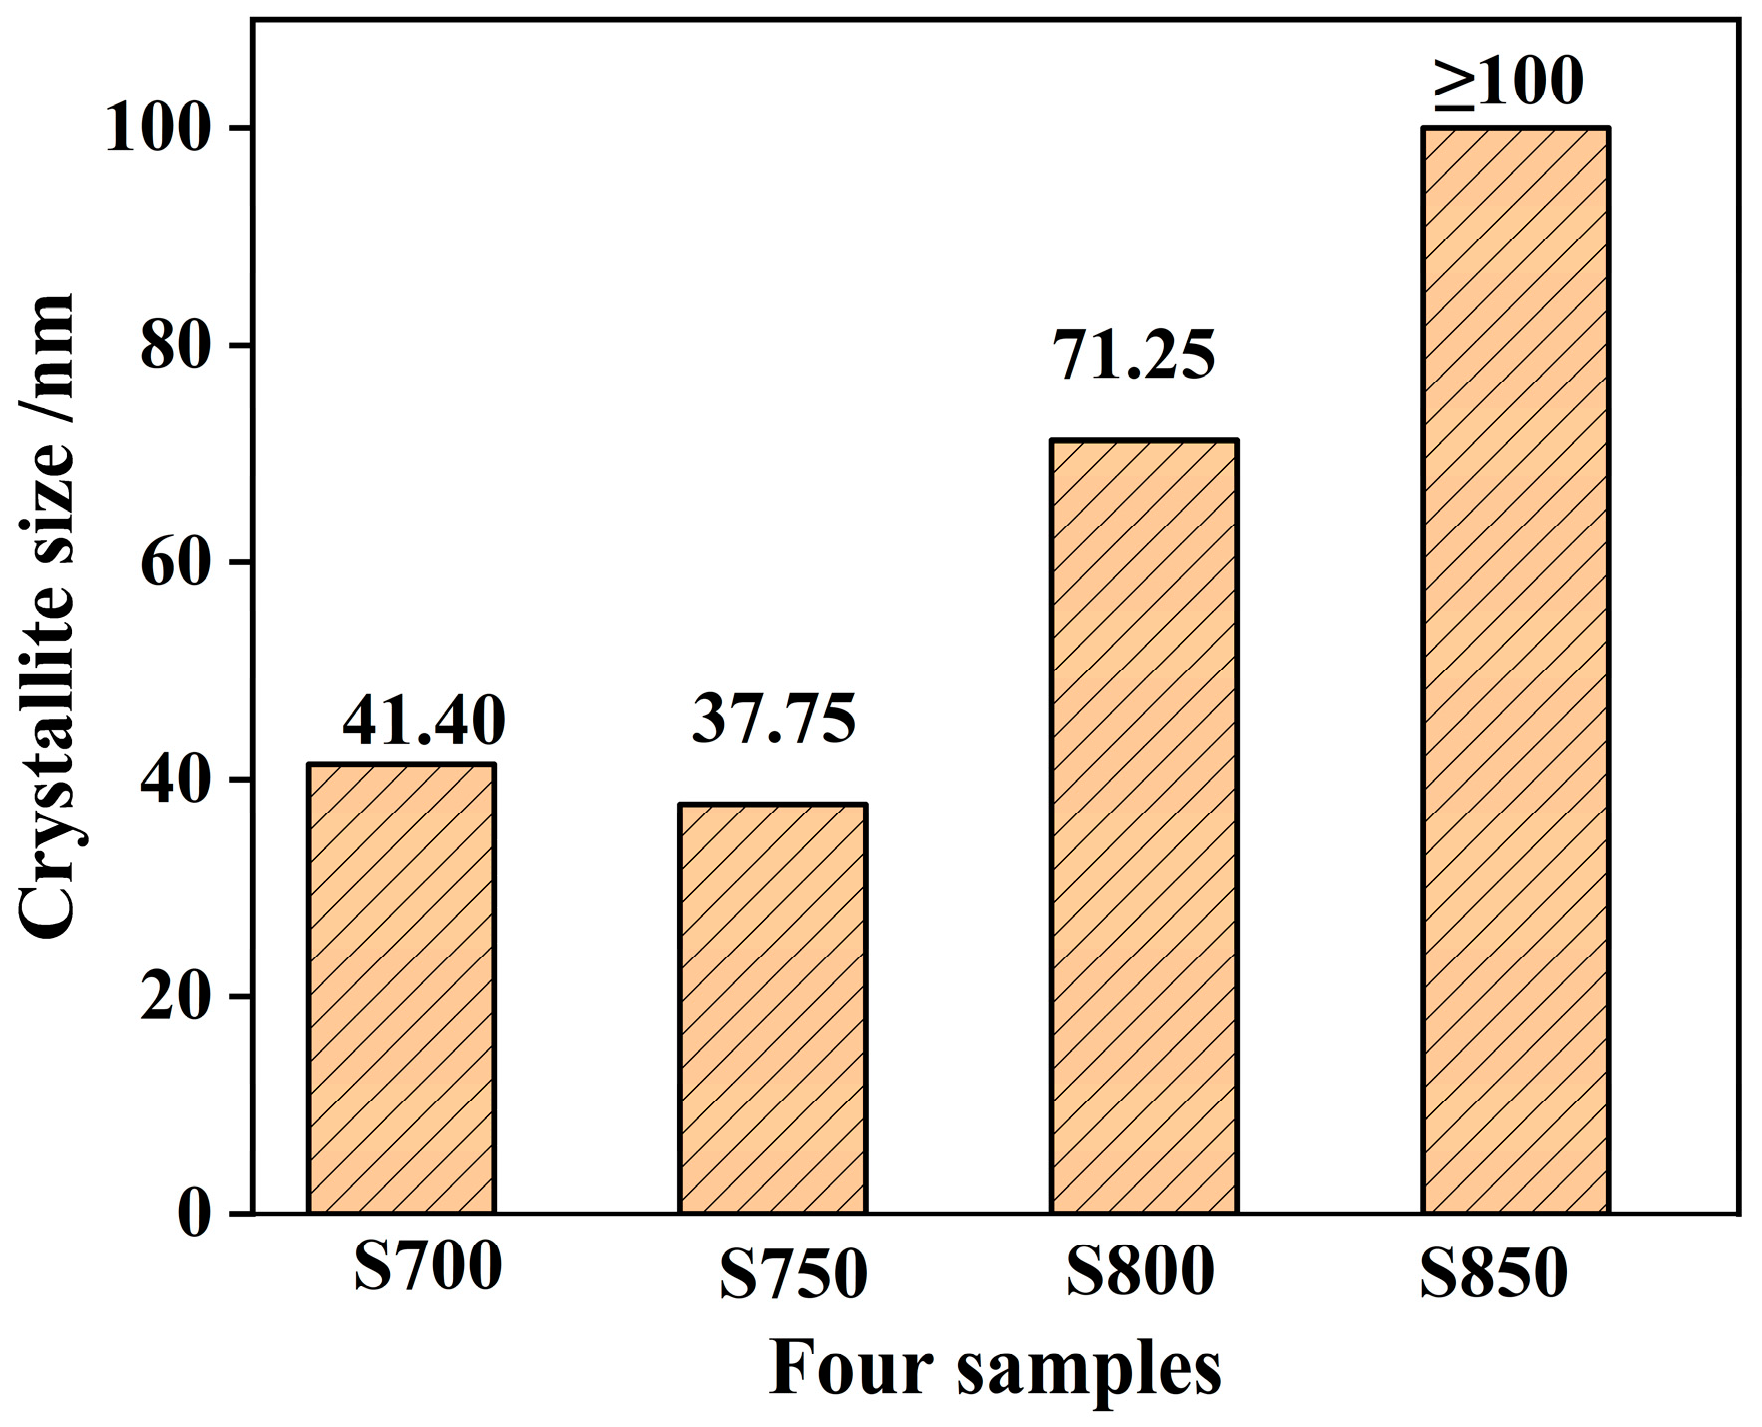
3.1. XRD

Figure 3 displays the results derived from our X-ray analyses of the four samples prepared using different sintering curves. The results of the analysis suggest that the predominant constituents of the four samples are αCu, graphite, and Cr3Fe. Furthermore, it is evident that the primary phase of the sample remains consistent despite variations in sintering temperature. However, the XRD pattern exhibits sharper diffraction peaks as the temperature increases. This suggests that the samples sintered at lower temperatures are not fully crystallized. Additionally, the αCu diffraction peak is slightly shifted to the left due to the dissolution of other metal elements into the copper matrix, causing distortion in the copper lattice and leading to an increase in the interplanar spacing.
Since grain size affects the mechanical and physical properties of a composite material, according to the Hall–Petch formula [28], the yield strength of a polycrystal increases as the grain size decreases, while the thermal conductivity increases as the grain size increases [29]. For brake pad materials, both strength and thermal conductivity need to be considered comprehensively. Therefore, the average grain size of samples S700~S850 was calculated based on the XRD diffraction data, as shown in Figure 4. The average grain sizes of the matrix are similar at 700 °C and 750 °C, measuring 41.4 nm and 37.8 nm, respectively. However, with increasing sintering temperature, the average grain size gradually increased. At 850 °C, the grain size exceeded 100 nm, making calculations using the Scherrer formula less accurate [30].

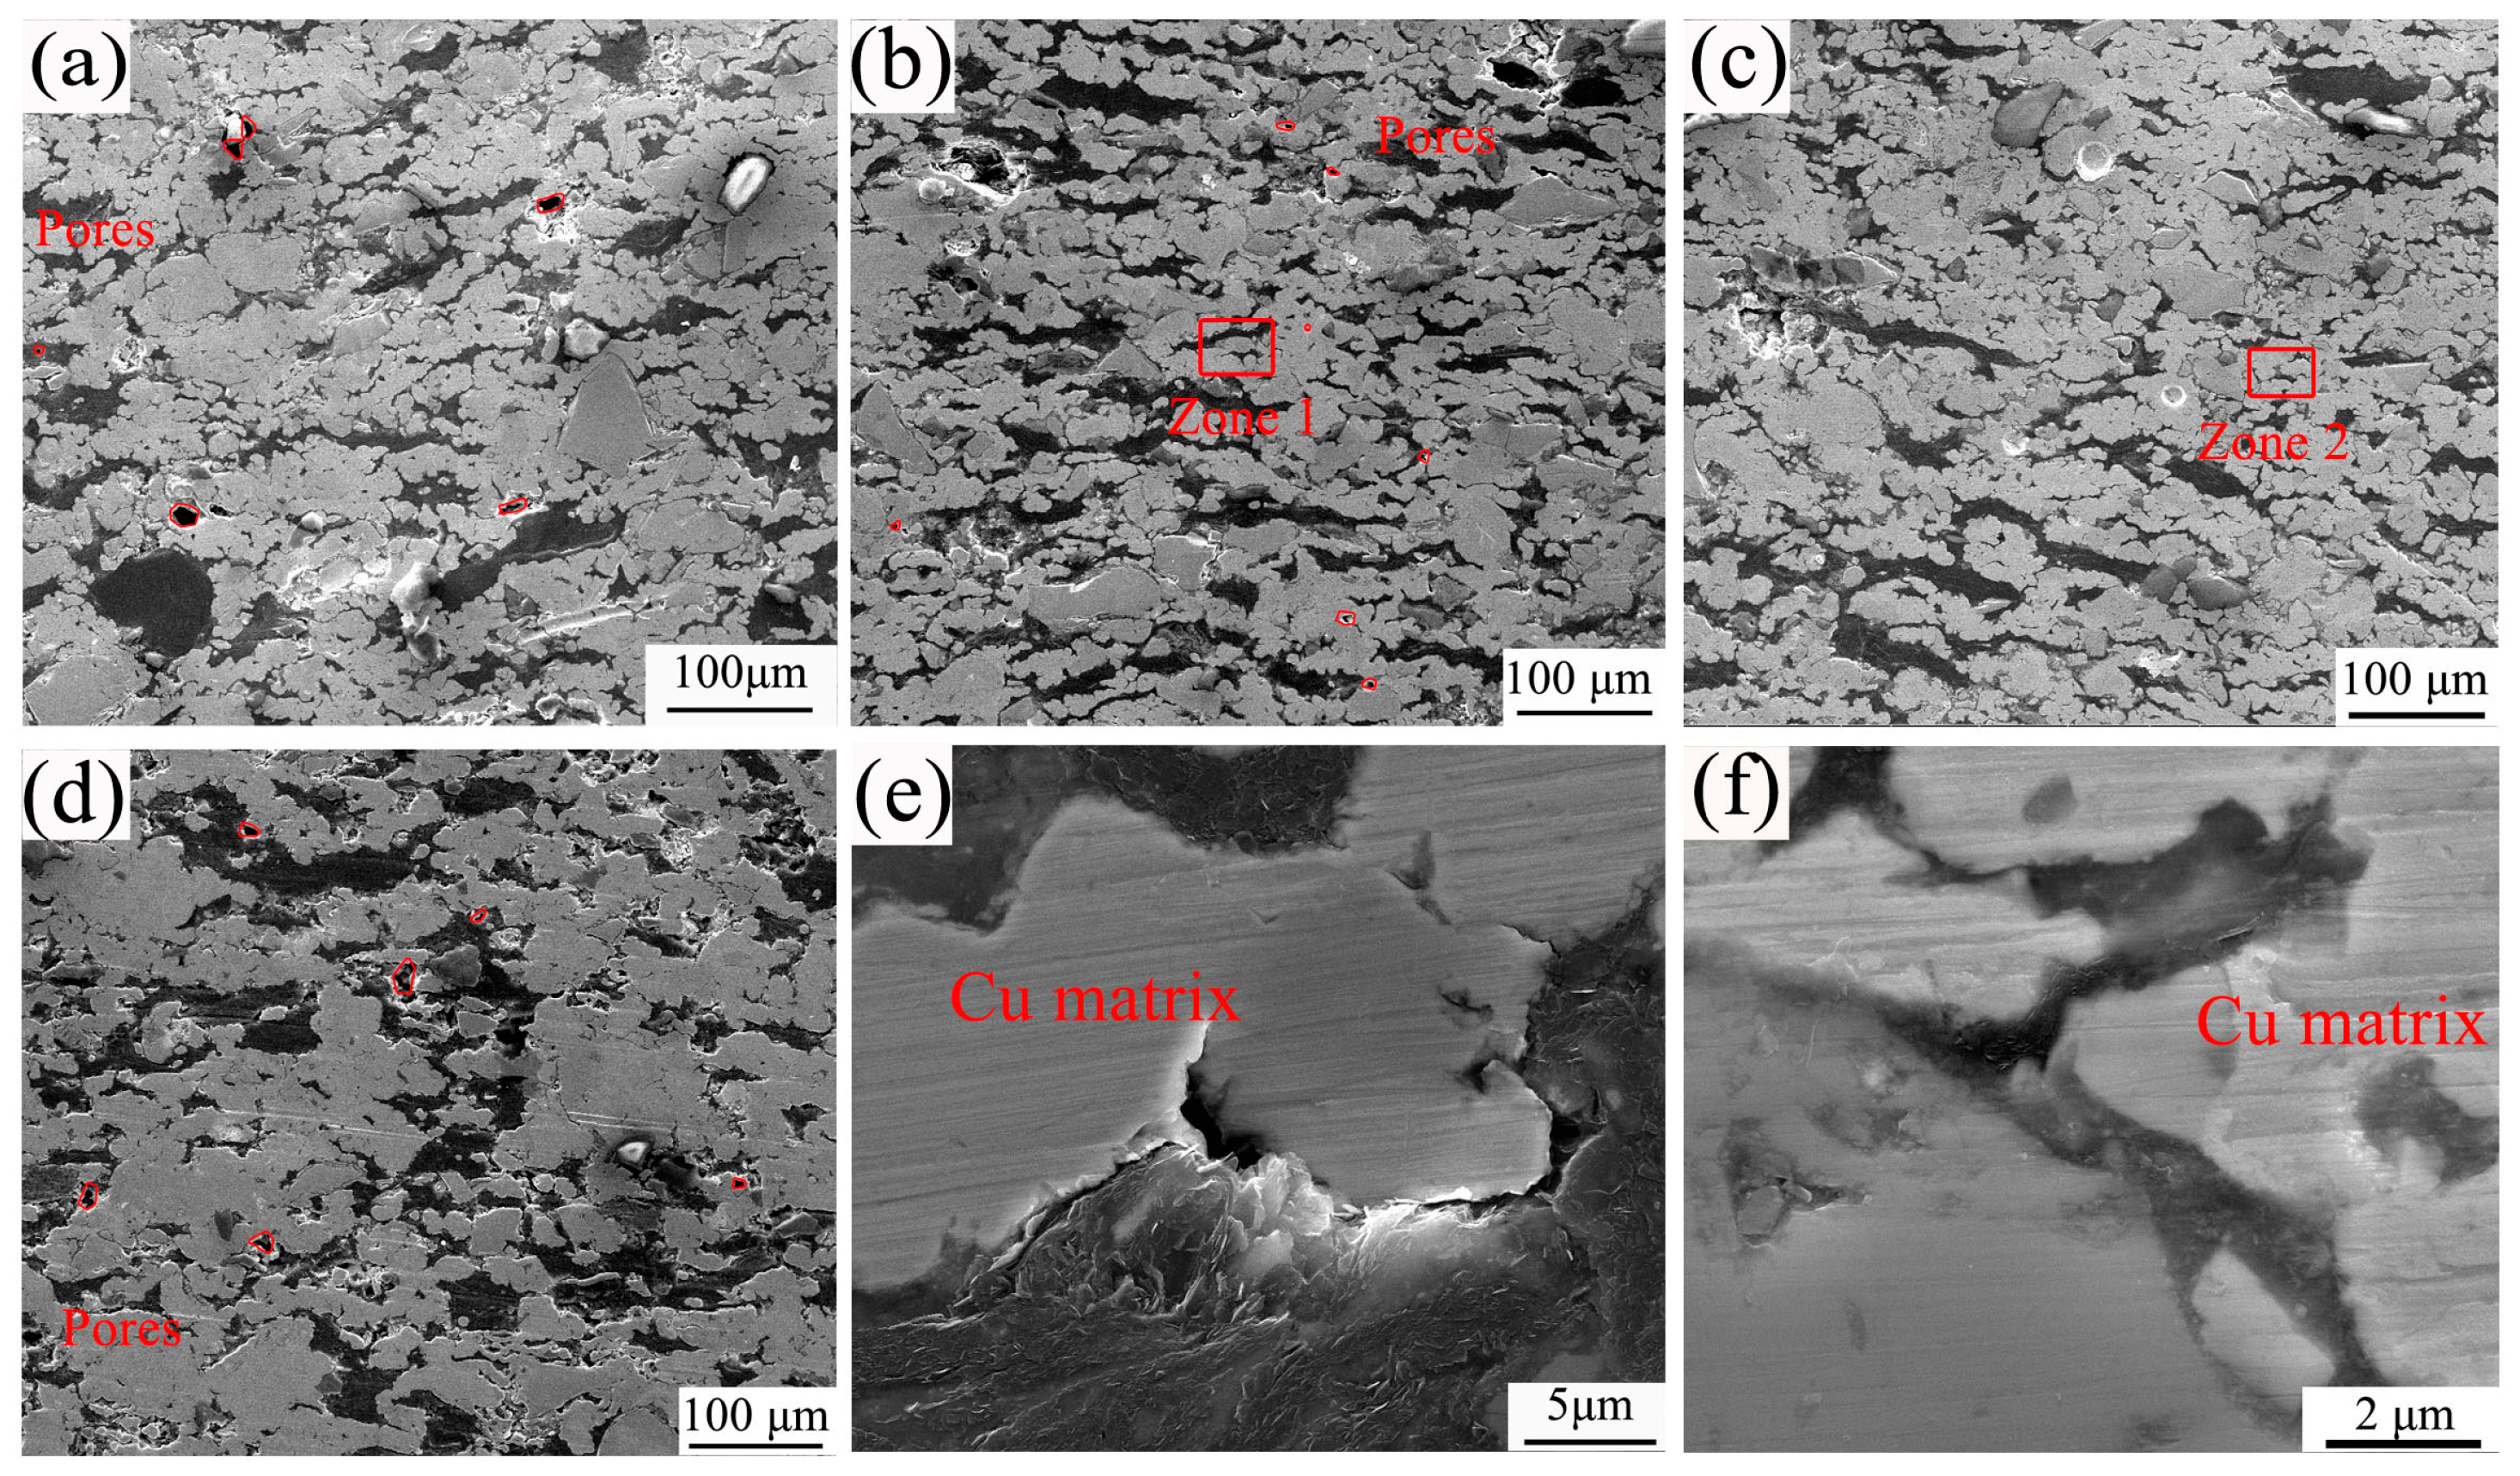
3.2. Microstructure Analysis

Figure 5 shows SEM images of the four samples at different sintering temperatures. It can be observed that there are red pores present in the S700, S750, and S850 specimens. The pores between the particles in S700 are mainly irregular in shape, indicating that there is a closed sintering neck formed through nucleation, crystal growth, and other atomic processes. This means that the original point and/or surface contact between the particles are characterized by crystal bonding [31]. The pores in S750 are circular and approximately smaller than those in S700, and S800 has almost no distinct pores. Regarding S750 and S800, enlarged details can be observed at the sample interface. It is evident that the interface bonding in S800 is superior to that in S750 (Figure 5e), with no clear pores being present at the S800 interface (Figure 5f). Additionally, some pores can be observed in sample S850.
The change in void sharpness and size can be attributed to the increase in the activation energy of the particles with rising sintering temperature. Consequently, the particles gain sufficient energy, leading to grain boundary migration across the pores as temperature increases [32]. This, in turn, promotes the bonding of grains. When the sintering temperature reaches 800 °C, the sintering neck gradually lengthens or merges, the pores between particles become closed holes, and the grain boundaries grow. As a result, the porosity is significantly reduced. However, when the sintering temperature increased to 850 °C, some low-melting-point compounds overflowed from the sample, creating pores.

3.3. Physical and Mechanical Properties

Figure 6 shows the changes in density, Vickers hardness, compressive strength, and thermal conductivity in relation to the sintering temperature. As the sintering temperature increased, the density initially increased and then decreased, with the maximum value being reached at 800 °C. The thermal conductivity, hardness, and compressive strength follow the same trend as the density. This is consistent with the change in porosity in the microstructure of the composites, as mentioned above.

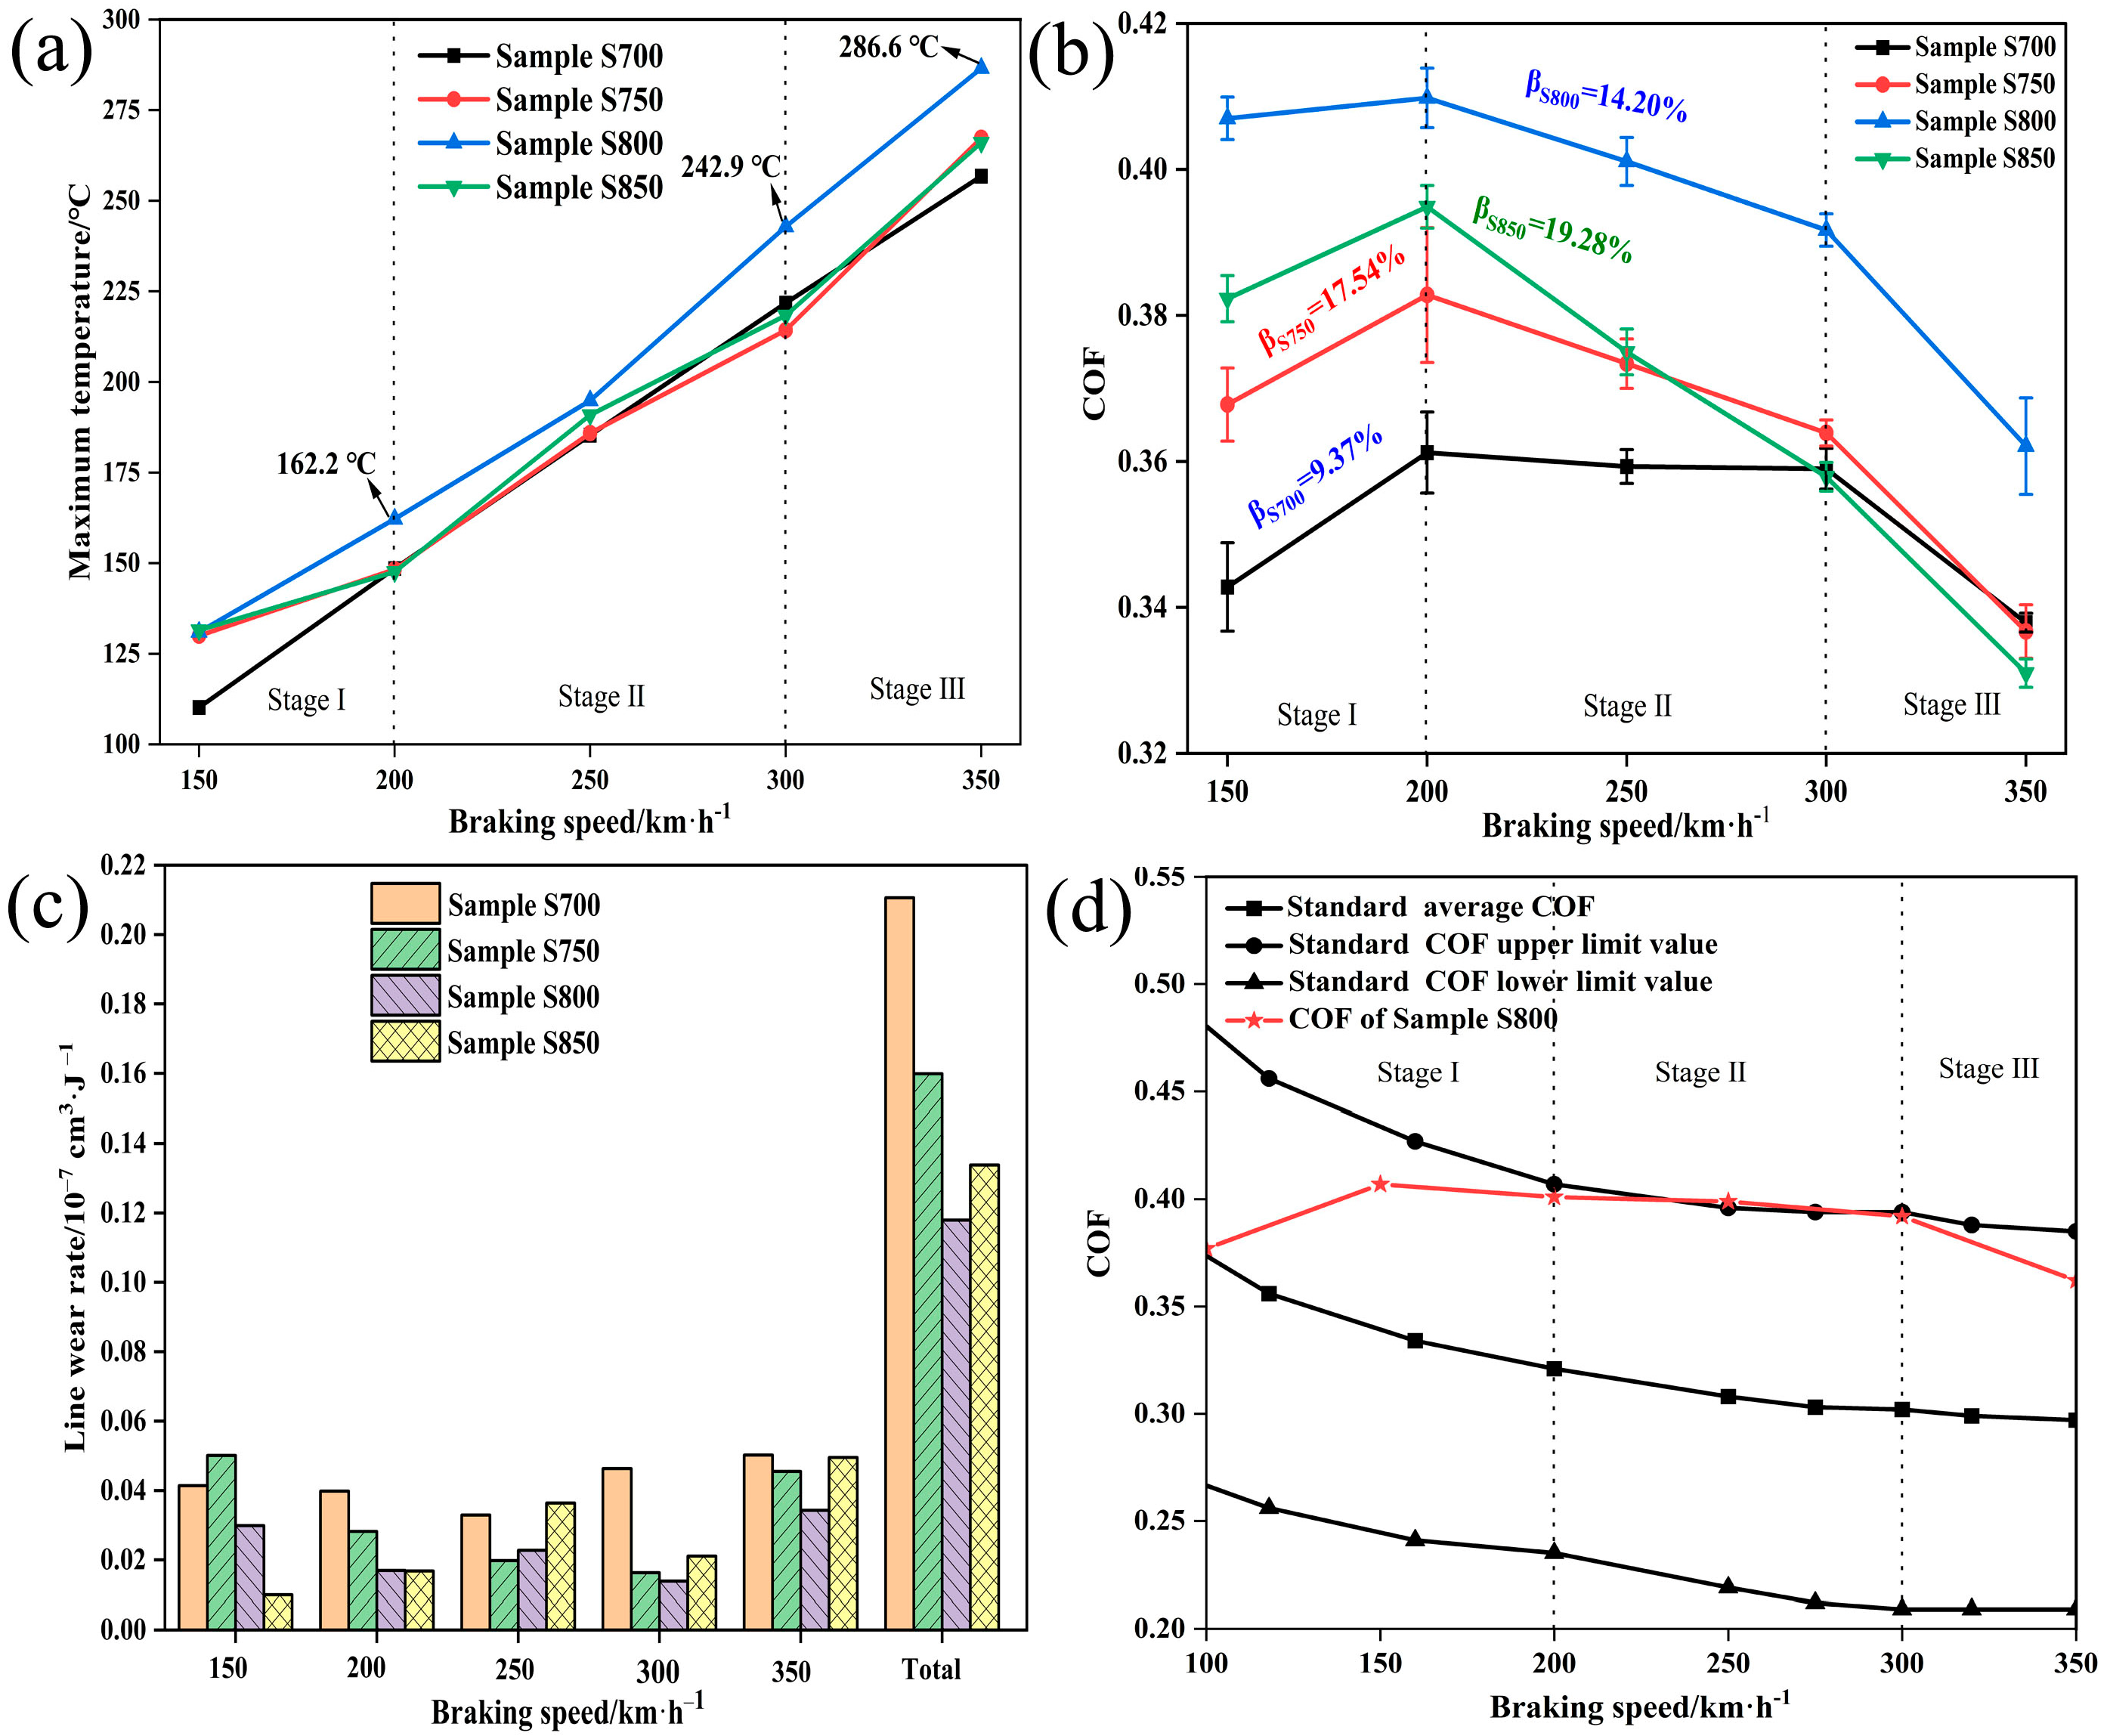
3.4. COF, Friction Temperature, and Line Wear Rate

To observe the influence of friction and wear performance on four different sintering samples, the COF, friction temperature, and line wear rate of the four samples were tested consecutively at different braking speeds ranging from 150 to 350 km/h. We divided the figures into three stages according to the different initial braking speeds. Stage Ⅰ, Ⅱ, and Ⅲ were named the low-speed period (≤200 km/h), middle-speed period (200~300 km/h), and high-speed period (300~350 km/h), respectively. Figure 7 shows the results. Based on Figure 7a, it can be seen that the maximum subsurface temperature increased almost linearly with the increase in initial braking speed. The subsurface temperature increases to nearly 300 °C at 350 km/h. At every stage, the temperature curve of sample S800 exhibits the highest values due to its superior thermal conductivity, enabling more efficient transfer of heat from the friction surface into the subsurface. Figure 7b clearly shows that the COFs of all four samples remain relatively stable at stage Ⅰ and Ⅱ but decrease rapidly at stage Ⅲ. By examining the wear rates of the four samples (see Figure 7c), it can be seen that within the speed range of 150 to 300 km/h, the wear rate remains relatively stable; however, when speeds exceed 300 km/h, the line wear rates of the four samples all increased markedly. This effect is closely related to the reduction in shear strength caused by the softening of the material surface and an increase in temperature.
By observing the four samples at varying sintering temperatures, we found evidence to suggest that the COFs exhibit a gradual increase as the sintering temperature rises. Sample S800 exhibited the highest and relatively stable COF and the lowest linear wear rate, as shown in Figure 7b,c, indicating that its friction and wear conditions were the most stable among the four samples. Considering the powder metallurgy brake pad standard TB/T 3470-2016 [33], standard published by the Ministry of Railways of the People’s Republic of China, S800 fits this standard perfectly, as shown in Figure 7d.

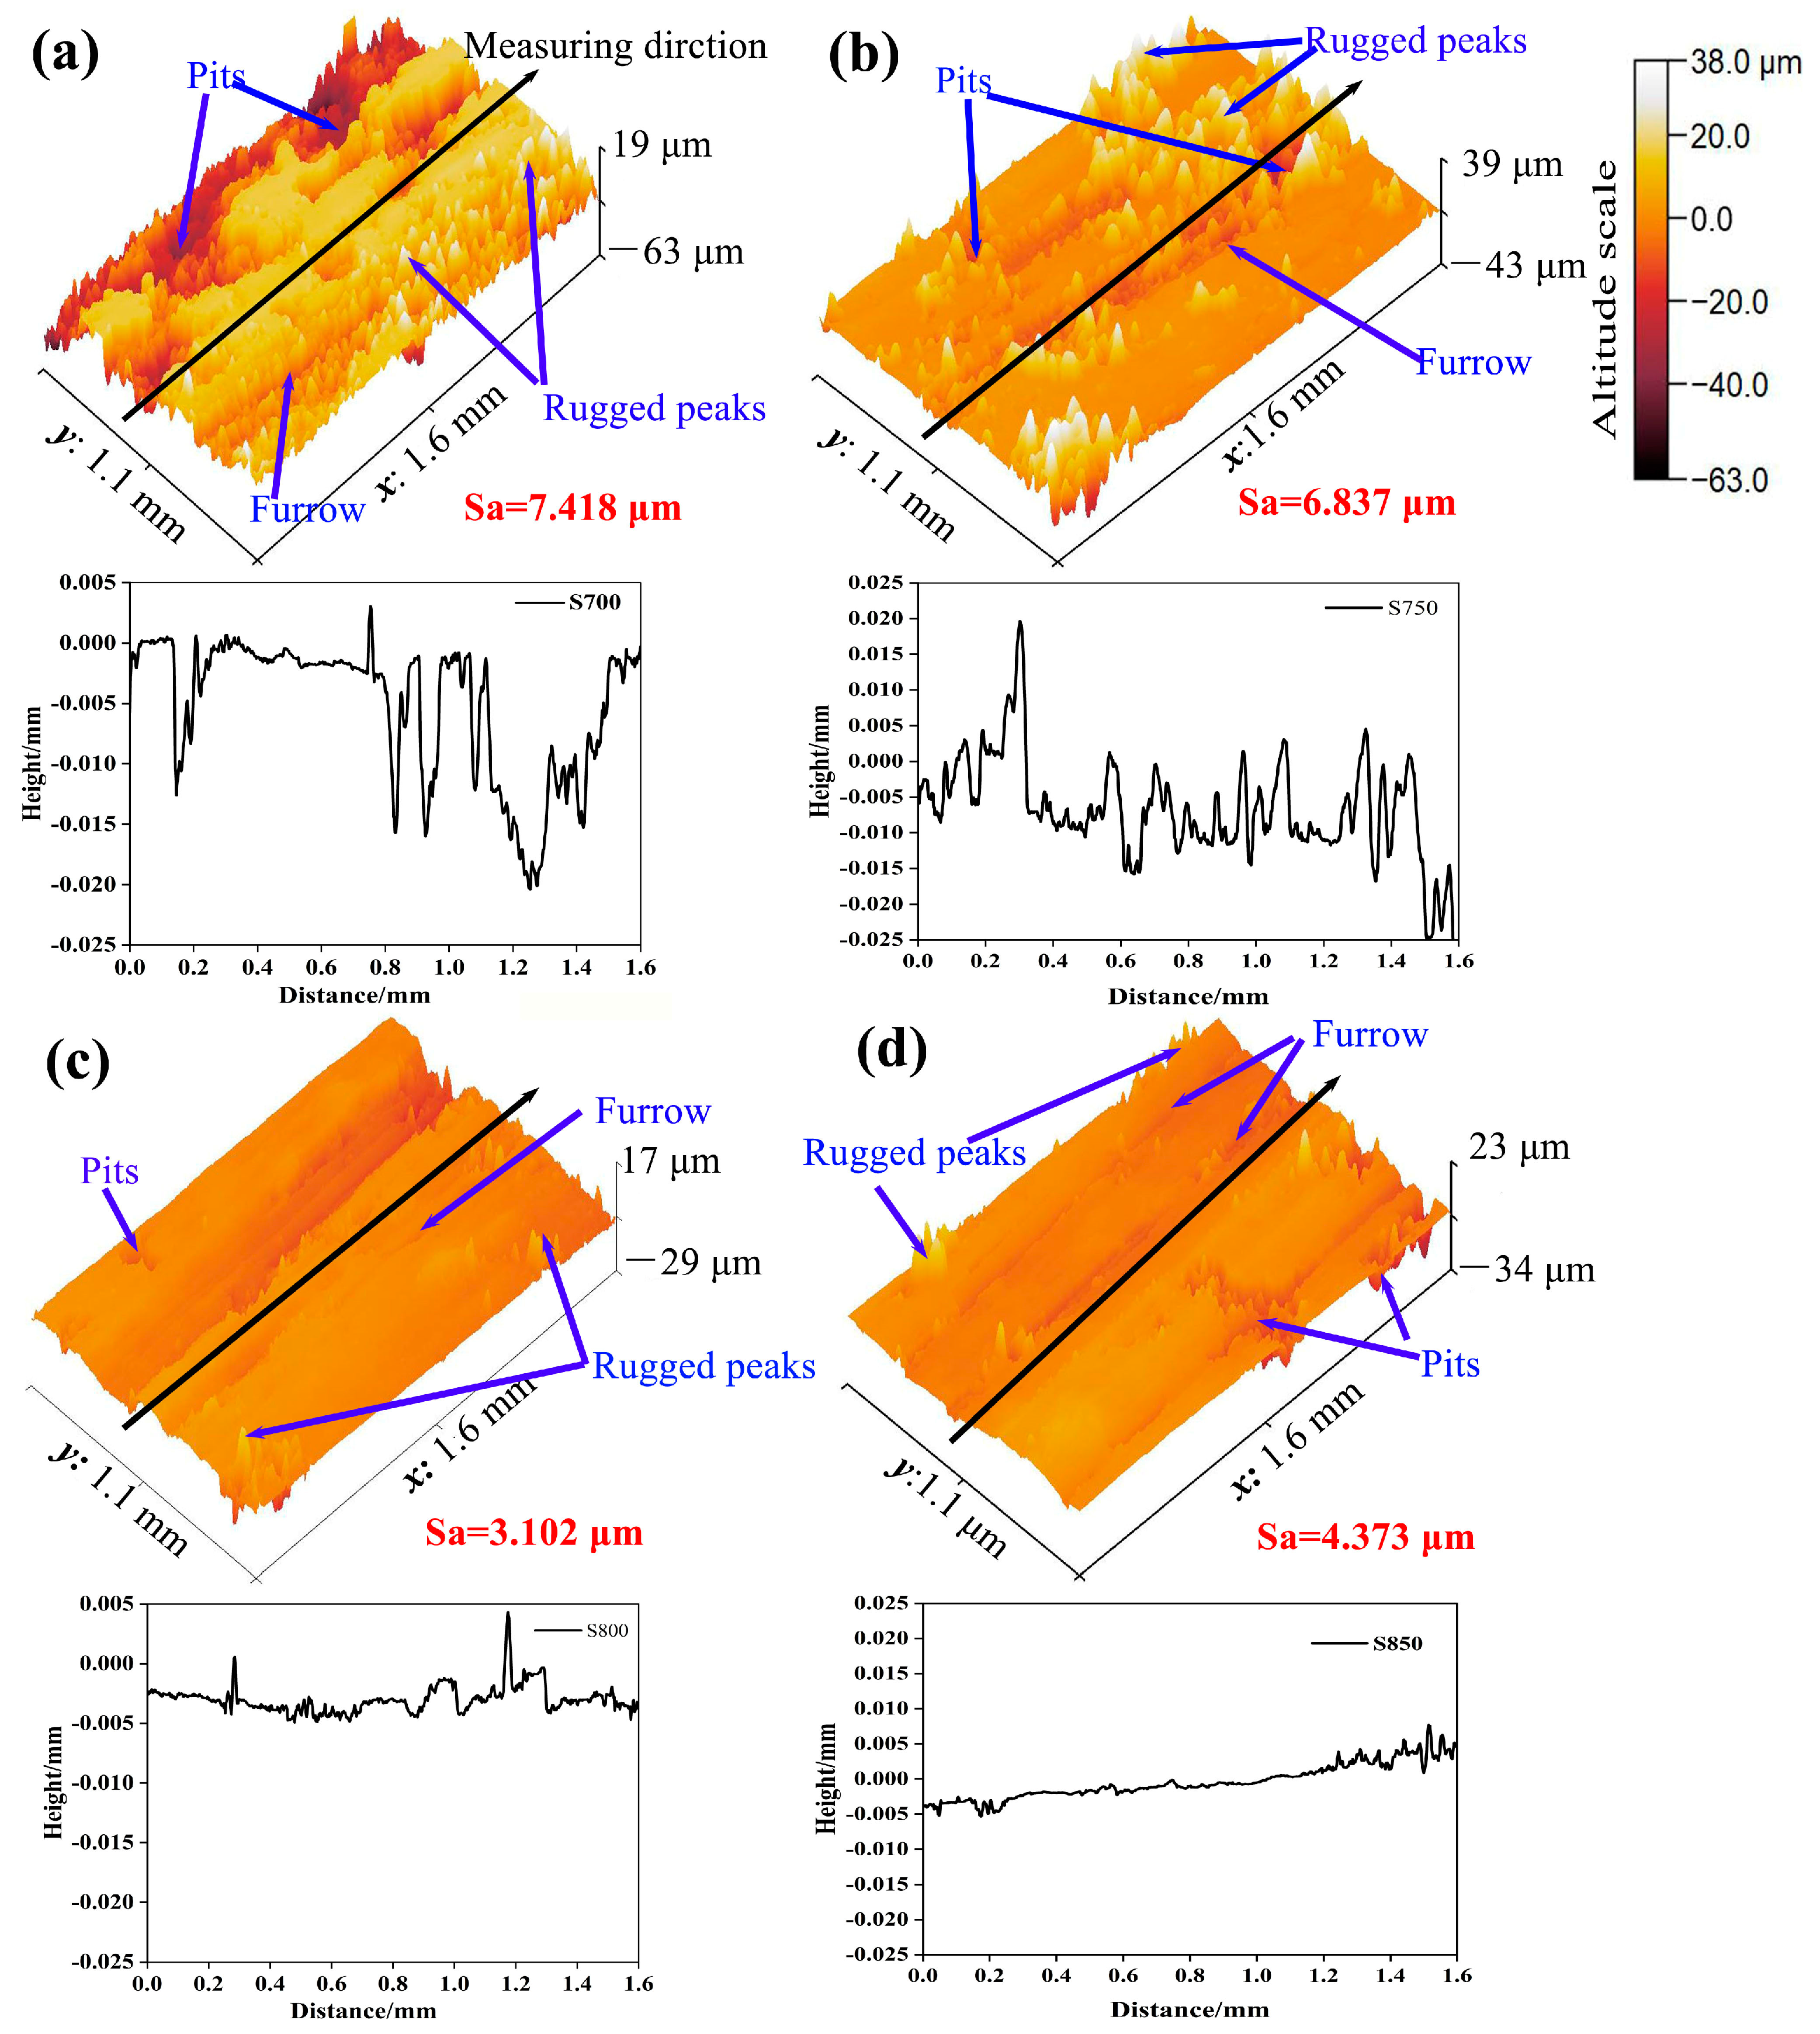
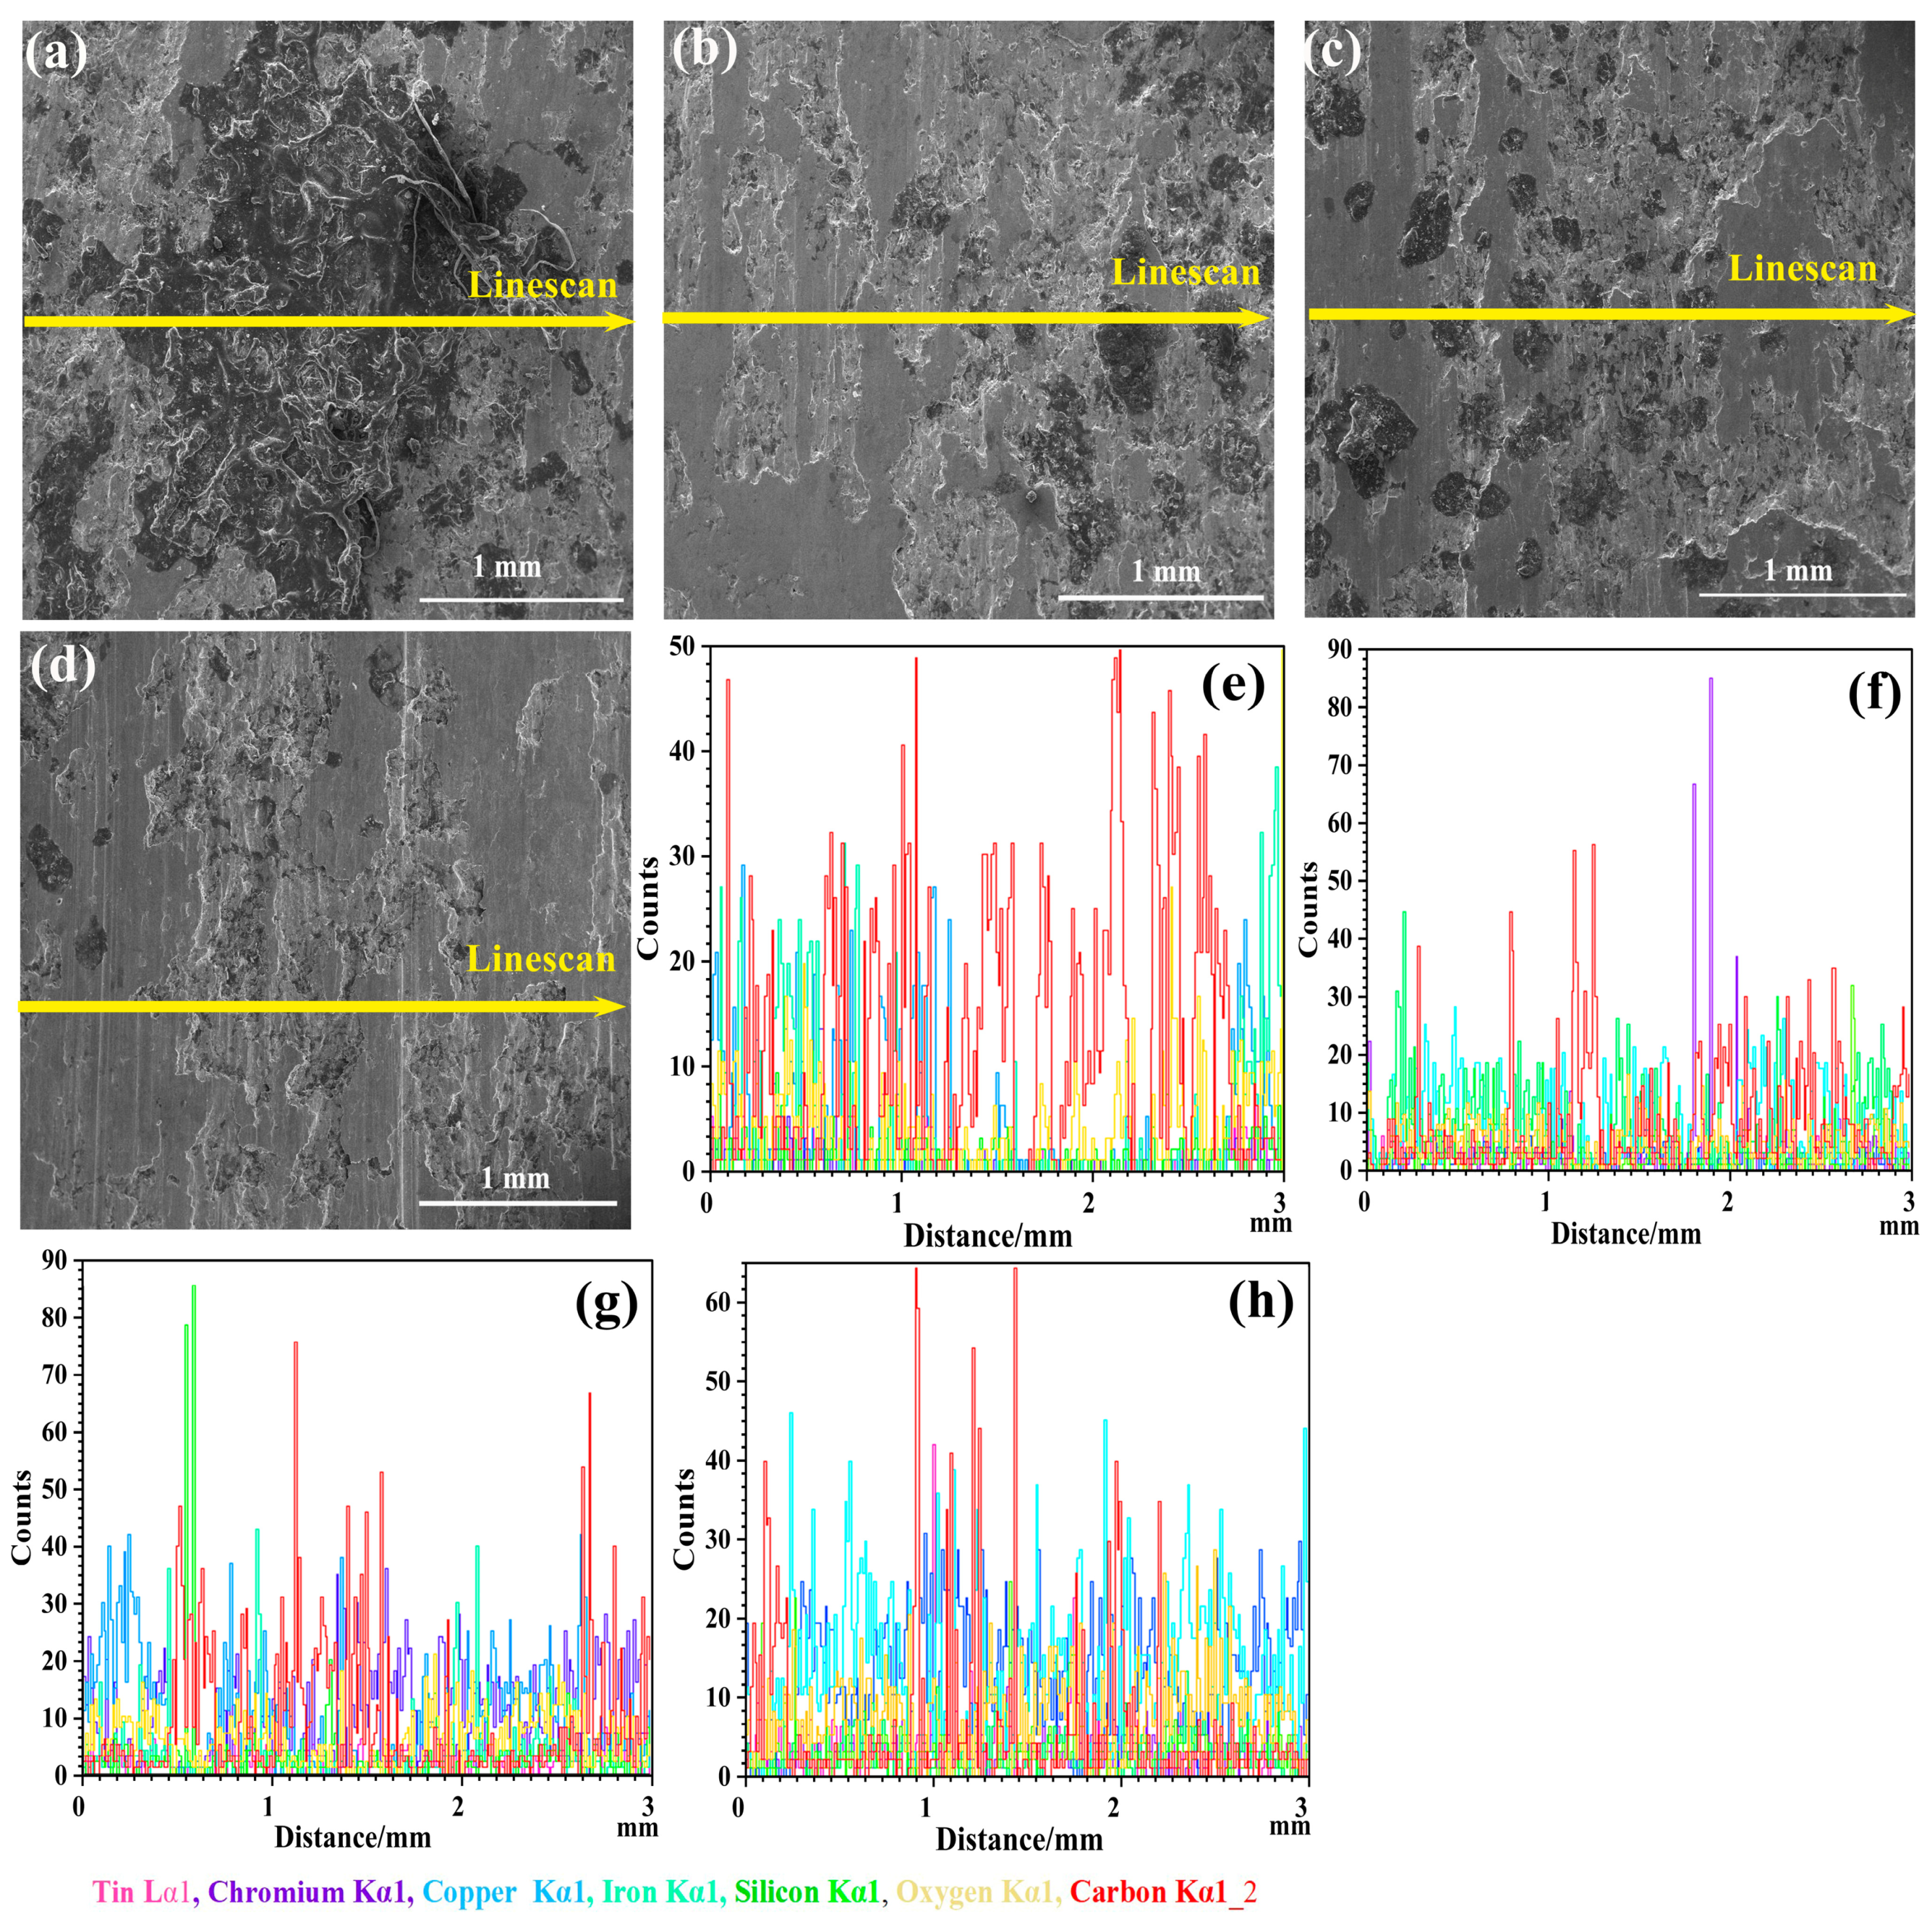
3.5. Worn Surface Morphology and Element Chemistry Configuration

Figure 8 depicts the 3D morphology of the four samples following braking tests conducted at speeds ranging from 150 to 350 km/h. The location indicated by arrows in the middle of each sample is the location at which the roughness was measured. It can be seen that the surfaces of the four samples exhibit certain pits and rugged peaks. Among the four samples, sample S700 exhibits numerous large pits and rugged peaks on its surface, and the furrows on the surface are also deep, meaning this sample has the highest surface roughness (Sa), 7.418 μm, and the maximum height difference is nearly 82 μm (from 19 μm to 63 μm, Figure 8a). In contrast, the friction surface of sample S750 gradually becomes smoother, with smaller pits and peaks, and the furrow depth on the surface is also relatively shallow (Figure 8b). Sample S800 displays the most even surface among all four samples, with Sa 3.102 μm and 46 μm height difference (Figure 8c). Sample S850 also demonstrates relatively smooth characteristics overall; localized pit formations contribute to an increase in average roughness (Figure 8d). The analysis results presented above indicate that, under identical braking friction conditions, the wear rate of S800 is markedly lower than that of the other samples. This is directly related to the strength of the material itself. When the material has greater strength, its wear resistance is better, and, therefore, the surface roughness value is smaller.
Surface element analysis of the four samples was conducted through energy spectrum line scanning, and the results are shown in Figure 9. As shown in Figure 9e–h, the surfaces of the four friction samples were found to be composed of the following elements: Sn, Cr, Cu, Fe, Si, O, and C. Notably, the peak value of the C element in S700 is the highest (indicated by the red line in Figure 9), with C distributed across almost all of the surface. This phenomenon can be attributed to the lower surface diffusion energy at 700 °C and poor sample strength, leading to easier detachment and scattering of graphite along the friction surface during braking. Consequently, S700 exhibits a correspondingly low COF due to graphite lubrication, consistent with findings from Figure 7b. Furthermore, oxygen elements are present in all four samples (as indicated by the yellow line in Figure 9), indicating relatively severe surface oxidation resulting from high-speed braking.

4. Discussion

4.1. Factors Affecting the Mechanical and Physical Properties of Sintered Composite Materials

The mechanical properties of the material are influenced by both grain size and structural composition at different sintering temperatures. According to the Hall–Petch formula [28], a finer grain can enhance mechanical properties by impeding dislocation movement, thus suggesting that as grain size increases, the mechanical properties of samples should decrease. Figure 4 illustrates a gradual increase in average grain diameter with rising sintering temperature; however, due to reduced porosity, all mechanical properties exhibit improvement.
The comprehensive consideration of both strength and thermal conductivity is essential for braking pad materials. Insufficient thermal conductivity in the braking pad can lead to excessive accumulation of friction heat on the brake disk surface, resulting in material softening and brake fade. According to Figure 6, the thermal conductivities of the four samples initially increased and then decreased, reaching their maximum value at 800 °C. Heat conduction is an energy transmission process within a material that primarily involves phonons, electrons, and photons. The samples used in this study consisted of both metal and nonmetal materials, which have different heat transfer mechanisms [34]. Under normal temperatures, alloys predominantly conduct heat through electrons and phonons, while nonmetallic materials primarily rely on phonon conduction [35]. However, the thermal transport behavior of metal matrix composite materials is influenced by interfacial thermal resistance, as well as electron and phonon transfer. Larger grain sizes mean that the heat transport of phonons and electrons is less hindered [29]. Based solely on electron and phonon transfer, it can be inferred that thermal conductivity will continue to increase until peaking at 850 °C. Nevertheless, sample S850 exhibits increased porosity compared to sample S800, which reduces the transmission path for electrons and phonons. Consequently, there is a significant decrease in thermal conductivity for S850 due to increased porosity.
Therefore, despite exhibiting a larger average grain size of S850, the increase in porosity exerts a more significant influence on the thermal resistance of these composite materials, resulting in a substantial reduction in their overall thermal conductivity at that temperature.
Based on the aforementioned, establishing strong interface bonding is of paramount significance in determining both the mechanical and physical properties of sintered materials, while relative density serves as a pivotal indicator for assessing the quality of sintering products.

4.2. The Strengthening Mechanism of Copper Matrix Composites

Micromorphological observation and energy spectrum analysis were conducted on sample S800, with point and line scanning performed in different elemental regions, as depicted in Figure 10a, to determine its composition and morphology, as illustrated in Figure 10b–g. It can be observed that the white areas of spots 1 and 3 in Figure 10a exhibit a copper matrix. The light gray area where spot 2 is located consists predominantly of iron, and spot 3 and spot 5 contain Cr3Fe and Fe3Al, respectively. All metal particles in the brake pad composition are uniformly dispersed within the soft copper matrix, playing a particle-strengthening role, but a small amount also forms solid solution phases due to insufficient diffusion during hot press sintering—a solid or semi-solid sintering process [36]. Figure 10b–d,h show clear evidence of interdiffusion among metal elements, as follows: for instance, traces of Cr/Fe/Al can be observed within the copper matrix (spots 1 and 3), and the Fe particles (spot 2) exhibit traces of Cr, Al, and Cu within their lattices, encapsulated by the copper matrix (spot 1). The solid solution of metal elements Fe, Cr, Sn, and Al in the copper matrix causes distortion of the lattice, thereby achieving a solution-strengthening effect.
According to the Cu-Sn binary alloy phase diagram [37], the Cu-Sn binary alloy phase is highly complex within the 700 °C to 850 °C temperature range. The structure of Cu-Sn alloys and composites may vary due to changes in the time, temperature, element doping method, and preparation method. Under reasonable soldering temperatures and timescales, intermetallic phases such as Cu6Sn5, Cu3Sn, and Cu41Sn11 can be formed through solid or semi-solid diffusion processes within the Cu/Sn system [38,39,40]. In this study, with a copper-to-tin ratio of approximately 97:3 and based on front XRD test results for samples S700/S750/S800/S850, no compound phases were detected. However, given that Sn has a low melting point and remains in a liquid state during the sintering process, it is possible that some copper–tin IMCs exist in composite materials. The morphology and brightness differences observed at spot 4 in Figure 10a indicate the formation of copper–tin compounds, distinct from those observed in the composite. Point scanning conducted on this zone (Figure 10e) only detected the presence of Cu and Sn, with an atomic mass ratio close to 96% being found for Cu, while the value found for Sn was 4%. The peak positions for compounds containing 97% Cu and 3% Sn are very similar to those of α-Cu, making them difficult to distinguish via the use of XRD alone [41]; hence, it can be concluded that spot 4 primarily contains a Cu97Sn3 intermetallic phase. The mass percentage of copper–tin in this study was approximately 94:6, which falls significantly below the maximum solid solubility of tin in copper at 15.8 wt.%. However, due to element doping and non-equilibrium solid-state diffusion, the solid solubility of Sn in the copper matrix is affected, resulting in the formation of Cu97Sn3 IMCs. So, incorporating appropriate amounts of Sn into a copper matrix can reduce porosity while strengthening soft copper matrices via solution strengthening, along with second-phase strengthening.
Based on the above, the strengthening mechanism of copper matrix composites includes solid solution strengthening, second-phase strengthening, and particle strengthening.

4.3. Effect of Surface Temperature on Frictional Properties

The relationship between the maximum surface temperature, wear amount, and friction coefficient with respect to the initial braking velocity is shown in Figure 7. It can be observed that there is a linear relationship between the initial braking velocity and friction temperature, just as in Figure 7a. Therefore, by converting the velocity-independent variable into a temperature-independent variable, similar changes in the dependent variables can be obtained. It can be concluded that the variation of COF and wear rate is highly correlated with the temperature of the friction surface. In stages I and II, where the initial braking speed is relatively low and the subsurface temperature is below 250 °C, the frictional heat does not significantly alter the sample’s surface state. Consequently, the friction surface maintains a relatively stable condition, with only a slight reduction in COF and minimal wear loss. However, during high-speed operation, substantial frictional heat generation elevates the surface temperature. This high temperature weakens strength and hardness properties, leading to a rapid decrease in COF while also inducing fatigue damage on the friction surface, resulting in severe wear. In high-speed braking environments, reducing surface temperature or enhancing the high-temperature strength of braking materials is an issue worthy of attention.

4.4. Wear Mechanism

We randomly selected zones on the surfaces of the four samples and observed the morphologies of pits and grinding chips to compare differences in wear mechanisms, and the results are shown in Figure 11. It is evident that all four samples exhibit numerous oxide layers, but the surface morphology of spalling pits differs. The friction surface of S700 reveals an abundance of granulated and lamellar abrasive particles filling cracks. In contrast, both the S750 and S800 samples demonstrate a significant reduction in granular debris due to their superior strength, with distinct spalling pits surrounded by sheets of graphite resulting from the ejection of hard particles. However, plowing on the S850 sample led to further insights, with noticeable abrasive dust particles being present on the surface. This variation can be attributed to the material’s strength influencing friction layer morphology. When a hard brake disk slides on these samples’ surfaces, microcracks occur beneath due to continuous plastic deformation under stress and temperature fields. Flake chips peel off from the friction surface when cracks reach critical lengths. Crack expansion occurs more easily when the strength is lower. Hence, the wear mechanisms for S700 include severe delamination wear, abrasive wear, and oxidation wear, while those for S750, S800, and S850 mainly include abrasive wear and oxidative wear.

5. Conclusions

This study investigated the effect of sintering temperature on the microstructural evolution of hot-pressed copper matrix composites and its relationship with physical and mechanical properties. Furthermore, the braking performance was tested at various speeds, ranging from 150 km/h to 350 km/h. Based on this study, the following conclusions can be drawn:
(1)
Sintering temperatures between 700 °C and 850 °C resulted in no significant change in the primary phase of the composite, and the change of porosity is the main factor influencing the mechanical properties and friction properties of braking pads produced by powder metallurgy. Due to the change of porosity is mainly affected by sintering temperature, the sintering temperature is one of the crucial parameters for influencing the mechanical properties and friction properties of braking pads produced by powder metallurgy, and 800 °C is the best sintering temperature based on the component of brake pad in this paper.
(2)
The strengthening mechanisms of braking pads in this paper encompass solid solution strengthening, particle strengthening, and second-phase strengthening. Among them, solid solution strengthening and particle strengthening are the main strengthening mechanisms.
(3)
The COFs of four samples under different sintering temperatures remained relatively stable below 300 km/h but decreased notably above 300 km/h due to heat fading caused by friction heat. The braking pad prepared under 800 °C sintering temperature demonstrated a high and stable COF across different braking speeds compared to the other samples, and the predominant wear mechanisms primarily included abrasive wear and oxidation wear.
Additionally, it should be noted that this article only focuses on the study of the effect of sintering temperature on the properties of braking pads based on a fixed formulation. Due to the limited sample quantity, this study serves as just a preliminary study and provides some references for similar copper matrix composites.

Author Contributions

Conceptualization, Y.Z. (Yajun Zhou) and Y.Z. (Yongzhen Zhang); methodology, J.L.; software, Y.Z. (Yajun Zhou); validation, Y.Z. (Yajun Zhou); formal analysis, Y.Z. (Yajun Zhou); investigation, J.L. and M.W.; resources, J.L.; data curation, Y.Z. (Yajun Zhou) and M.W.; writing—original draft preparation, Y.Z. (Yajun Zhou); writing—review and editing, Y.Z. (Yajun Zhou) and X.Z.; visualization, Y.Z. (Yajun Zhou); supervision, X.Z.; project administration, Y.Z. (Yongzhen Zhang); funding acquisition, Y.Z. (Yongzhen Zhang) and Y.Z. (Yajun Zhou). All authors have read and agreed to the published version of the manuscript.

Funding

This research was funded by the National Natural Science Foundation of China (Grant No. 92266205 E0505), the Doctoral Innovation Research Fund of Henan University of Science and Technology (Grant No. B16), and Zhengzhou Basic Research and Applied Basic Research Special Fund Project (Grant No. ZZSZX202105).

Institutional Review Board Statement

Not applicable.

Informed Consent Statement

Not applicable.

Data Availability Statement

The original contributions presented in the study are included in the article, further inquiries can be directed to the corresponding authors.

Conflicts of Interest

The authors declare no conflicts of interest.

References

  1. Zhou, H.; Yao, P.; Xiao, Y.; Fan, K.; Zhang, Z.; Gong, T.; Zhao, L.; Deng, M.; Liu, C.; Ling, P. Friction and wear maps of copper metal matrix composites with different iron volume content. Tribol. Int. 2019, 132, 199–210. [Google Scholar] [CrossRef]
  2. Jamwal, A.; Mittal, P.; Agrawal, R.; Gupta, S.; Kumar, D.; Sadasivuni, K.K.; Gupta, P. Towards sustainable copper matrix composites: Manufacturing routes with structural, mechanical, electrical and corrosion behaviour. J. Compos. Mater. 2020, 54, 2635–2649. [Google Scholar] [CrossRef]
  3. Djouider, F.; Alhawsawi, A.; Elmoujarkach, E.; Banoqitah, E.; Alammari, O.A.; Moustafa, E.B. The Effect of Hybrid B4C and Si3N4 Nanoparticles on the Mechanical and Physical Properties of Copper Nanocomposites. Metals 2023, 13, 1504. [Google Scholar] [CrossRef]
  4. Chai, R.; Zhu, W.; Li, Q.; Zou, H.; Han, Y.; Zhao, Y.; Ran, X. Effect of Basalt Fiber Content on Mechanical and Tribological Properties of Copper-Matrix Composites. Metals 2022, 12, 1925. [Google Scholar] [CrossRef]
  5. Getman, O.I. Application of Skorokhod’s Rheological Theory of Sintering to Analyze the Sintering Kinetics of Tungsten Powders. Powder Metall. Met. Ceram. 2019, 58, 373–398. [Google Scholar] [CrossRef]
  6. Kang, W.; Zheng, Z.; Li, Y.; Zhao, R. The influence of sintering temperature on the microstructures and electrical performances of BCZT ceramics. Mater. Lett. 2020, 265, 127298. [Google Scholar] [CrossRef]
  7. Ashby, M.F.; Bahk, S.; Bevk, J.; Turnbull, D.; Ashby, M.F.; Bahk, S.; Bevk, J.; Turnbull, D. The influence of a dispersion of particles on the sintering of metal powders and wires. Prog. Mater. Sci. 1980, 25, 1–34. [Google Scholar] [CrossRef]
  8. Ji, W.; Wu, X.; Dai, S.; Zhang, G. Effects of Microwave Hybrid Sintering Methods and Nano-HfC Content on Mechanical Properties and Microstructure of TiB2-Based Cermets. J. Mater. Eng. Perform. 2024, 33, 7277–7289. [Google Scholar] [CrossRef]
  9. Kumar, N.; Bharti, A.; Dixit, M.; Nigam, A. Effect of Powder Metallurgy Process and its Parameters on the Mechanical and Electrical Properties of Copper-Based Materials: Literature Review. Powder Metall. Met. Ceram. 2020, 59, 401–410. [Google Scholar] [CrossRef]
  10. Khomenko, E.V.; Minakova, R.V.; Lesnik, N.D. Microstructural evolution of Cr-Cu composites in liquid-phase sintering. Powder Metall. Met. Ceram. 2013, 52, 20–31. [Google Scholar] [CrossRef]
  11. Shongwe, M.B.; Ramakokovhu, M.M.; Diouf, S.; Durowoju, M.O.; Obadele, B.A.; Sule, R.; Lethabane, M.L.; Olubambi, P.A. Effect of starting powder particle size and heating rate on spark plasma sintering of Fe Ni alloys. J. Alloys Compd. 2016, 678, 241–248. [Google Scholar] [CrossRef]
  12. Islak, S.; Kir, D.; Buytoz, S. Effect of sintering temperature on electrical and microstructure properties of hot pressed Cu-TiC composites. Sci. Sinter. 2014, 46, 15–21. [Google Scholar] [CrossRef]
  13. Zhou, W.; Hong, L.; Wang, Y.; Ye, N.; Tang, J. Effect of sintering temperature on microstructure and properties of nano-WC particle reinforced copper matrix composites prepared by hot-pressing sintering. Mater. Res. Express 2020, 7, 126520. [Google Scholar] [CrossRef]
  14. Ngai, T.L.; Zheng, W.; Li, Y. Effect of sintering temperature on the preparation of Cu–Ti3SiC2 metal matrix composite. Prog. Nat. Sci. Mater. Int. 2013, 23, 70–76. [Google Scholar] [CrossRef]
  15. Wei, H.; Zou, J.; Gong, Y.; Li, X.; Zhan, W.; Li, F. Friction and wear behavior of copper/graphite/Ti2SnC composites fabricated by spark plasma sintering (SPS). Wear 2023, 51, 204530. [Google Scholar] [CrossRef]
  16. Swikker, K.R.J.; Kanagasabapathy, H.; Manickam, I.N.; Nadar, N.V.P.; Alwin, S. Effect of sintering temperature on grain growth and mechanical properties of copper/graphene nanosheet composite. Diam. Relat. Mater. 2020, 110, 108111. [Google Scholar] [CrossRef]
  17. Su, Y.; Jiang, F.; Wu, F.; Long, M. Effect of sintering temperature on microstructure and tribological properties of copper/graphite composites doped with Ti3AlC2 particles. Mater. Today Commun. 2024, 38, 108136. [Google Scholar] [CrossRef]
  18. Xia, J.; Li, C.X.; Dong, H. Thermal oxidation treatment of B2 iron aluminide for improved wear resistance. Wear 2005, 258, 1804–1812. [Google Scholar] [CrossRef]
  19. Palm, M.; Stein, F.; Dehm, G. Iron Aluminides. Annu. Rev. Mater. Res. 2019, 49, 297–326. [Google Scholar] [CrossRef]
  20. Alman, D.E.; Hawk, J.A.; Tylczak, J.H.; Doğan, C.P.; Wilson, R.D. Wear of iron–aluminide intermetallic-based alloys and composites by hard particles. Wear 2001, 251, 875–884. [Google Scholar] [CrossRef]
  21. Nowak, K.; Kupka, M.; Maszybrocka, J.; Barylski, A. Effect of thermal oxidation process on wear resistance of B2 iron aluminide. Vacuum 2015, 114, 221–225. [Google Scholar] [CrossRef]
  22. German, R. Sintering Theory and Practice; John Wiley & Sons: Hoboken, NJ, USA, 1996. [Google Scholar]
  23. Rahaman, M.N. Sintering Theory and Fundamentals. In Powder Metallurgy; ASM International: Almere, The Netherlands, 2015; pp. 205–236. [Google Scholar]
  24. Jellett, J.H. A Treatise on the Theory of Friction; Hodges Foster and Company: Dublin, Ireland, 1872. [Google Scholar]
  25. Kraghelsky, I.V. Calculation of Wear Rate. J. Basic Eng. 1965, 87, 785–790. [Google Scholar] [CrossRef]
  26. Peng, T.; Yan, Q.; Zhang, X. Stability of Metal Matrix Composite Pads During High-Speed Braking. Tribol. Lett. 2018, 66, 1–13. [Google Scholar] [CrossRef]
  27. Zhang, L.; Ukai, S.; Hoshino, T.; Hayashi, S.; Qu, X. Y2O3 evolution and dispersion refinement in Co-base ODS alloys. Acta Mater. 2009, 57, 3671–3682. [Google Scholar] [CrossRef]
  28. Cordero, Z.C.; Knight, B.E.; Schuh, C.A. Six decades of the Hall–Petch effect—A survey of grain-size strengthening studies on pure metals. Int. Mater. Rev. 2016, 61, 495–512. [Google Scholar] [CrossRef]
  29. Gottstein, G. Physical Foundations of Materials Science; Springer: Berlin/Heidelberg, Germany, 2004; pp. 303–356. [Google Scholar]
  30. Zenoozi, S.; Agbolaghi, S.; Poormahdi, E.; Hashemzadeh-Gargari, M.; Mahmoudi, M. Verification of Scherrer formula for well-shaped poly(3-hexylthiophene)-based conductive single crystals and nanofibers and fabrication of photovoltaic devices from thin film coating. Macromol. Res. 2017, 25, 826–840. [Google Scholar] [CrossRef]
  31. Zhang, Z.; Wang, S.; Pang, X.; Liu, J.; Zhu, L.; Feng, Z.; Du, S.; Yang, J.; Zhang, Y. Strengthening Mo2BC ceramic by a two-step sintering process. J. Alloys Compd. 2023, 965, 171335. [Google Scholar] [CrossRef]
  32. Upadhyaya, G.S. Powder Metallurgy Technology; Cambridge Int Science Publishing: Cambridge, UK, 1997. [Google Scholar]
  33. TB/T 3470-2016; Powder Metallurgy Brake Pad for EMU/DMU. China Railway Publishing House: Beijing, China, 2017.
  34. Ordonez-Miranda, J.; Alvarado-Gil, J.J.; Yang, R. The effect of the electron-phonon coupling on the effective thermal conductivity of metal-nonmetal multilayers. J. Appl. Phys. 2011, 109, 094310. [Google Scholar] [CrossRef]
  35. Suleiman, B.M. Effective thermal conduction in composite materials. Appl. Phys. A 2010, 99, 223–228. [Google Scholar] [CrossRef]
  36. Zhevnenko, S.N.; Gershman, E.I. Grain boundary phase transformation in Cu–Co solid solutions. J. Alloys Compd. 2012, 536, S554–S558. [Google Scholar] [CrossRef]
  37. Okamoto, H.; Massalski, T. Binary Alloy Phase Diagrams; ASM International: Materials Park, OH, USA, 1990; Volume 12, pp. 3528–3531. [Google Scholar]
  38. Han, P.; Li, W.; Peng, J.; Zou, W. Influence of Sn and Bi Additions on the Structures and Wear Properties of Cu–Sn–P–Ce cBN Tools. J. Superhard Mater. 2018, 40, 47–51. [Google Scholar] [CrossRef]
  39. Li, J.F.; Agyakwa, P.A.; Johnson, C.M. Interfacial reaction in Cu/Sn/Cu system during the transient liquid phase soldering process. Acta Mater. 2011, 59, 1198–1211. [Google Scholar] [CrossRef]
  40. Lee, B.S.; Yoon, J.W. Cu-Sn Intermetallic Compound Joints for High-Temperature Power Electronics Applications. J. Electron. Mater. 2018, 47, 430–435. [Google Scholar] [CrossRef]
  41. Li, J.; Yin, Y.; Ma, H. Preparation and properties of Fe3Al-based friction materials. Tribol. Int. 2005, 38, 159–163. [Google Scholar] [CrossRef]
Figure 1. Four sintering process curves.
Metals 14 01048 g001
Figure 2. Scheme of the MM3000 friction wear testing machine.
Metals 14 01048 g002
Figure 3. X-ray analyses of samples S700~S850.
Metals 14 01048 g003
Figure 4. Crystallite size of the four samples.
Metals 14 01048 g004
Figure 5. SEM images of the four samples: (a) S700, (b) S750, (c) S800, and (d) S850. (e) Close-up of zone 1 in S750; (f) close-up of zone 2 in S800.
Metals 14 01048 g005
Figure 6. Physical and mechanical properties of four samples.
Metals 14 01048 g006
Figure 7. Results of friction and wear tests conducted under different initial braking speeds. Shown are data corresponding to (a) maximum subsurface temperature, (b) average COF curves, (c) line wear rate, and (d) COF of sample S950 compared with industrial standard.
Metals 14 01048 g007
Figure 8. The three-dimensional morphologies of the four samples after the braking test. Shown are the results for (a) sample S700, (b) sample S750, (c) sample S800, and (d) sample S850.
Metals 14 01048 g008
Figure 9. Surface morphology (ad) and EDS line scanning (e,f) of the four samples after the braking test. Shown are the results for (a,e) sample S700, (b,f) sample S 750, (c,g) sample S800, and (d,h) sample S850.
Metals 14 01048 g009
Figure 10. SEM image and EDS spectra of S800. Shown are data corresponding to (a) S800, specifically, (b) spot 1, (c) spot 2, (d) spot 3, (e) spot 4, (f) spot 5, (g) spot 6, and (h) line 1.
Metals 14 01048 g010
Figure 11. Chipping pit morphologies of the four samples after the braking test. Shown are the results for (a) sample S700, (b) sample S750, (c) sample S800, and (d) sample S850.
Metals 14 01048 g011
Table 1. Chemical composition of the friction materials.
ElementTypeParticle Size (μm)Purity (%)Content (wt.%)
CuElectrolysis Powder75>99.057
SnAtomized Powder75>99.04
FeElectrolysis Powder50>99.016
Cr3FeHigh Carbon150>98.56
GraphitePowder180>99.09
MoS2Powder75>99.52
Fe3AlDO345~150>99.06
Disclaimer/Publisher’s Note: The statements, opinions and data contained in all publications are solely those of the individual author(s) and contributor(s) and not of MDPI and/or the editor(s). MDPI and/or the editor(s) disclaim responsibility for any injury to people or property resulting from any ideas, methods, instructions or products referred to in the content.

