
A Comprehensive Evaluation of Electrochemical Performance of Aluminum Hybrid Nanocomposites Reinforced with Alumina (Al2O3) and Graphene Oxide (GO)


Abstract
:1. Introduction
2. Experimental
2.1. Material Specifications
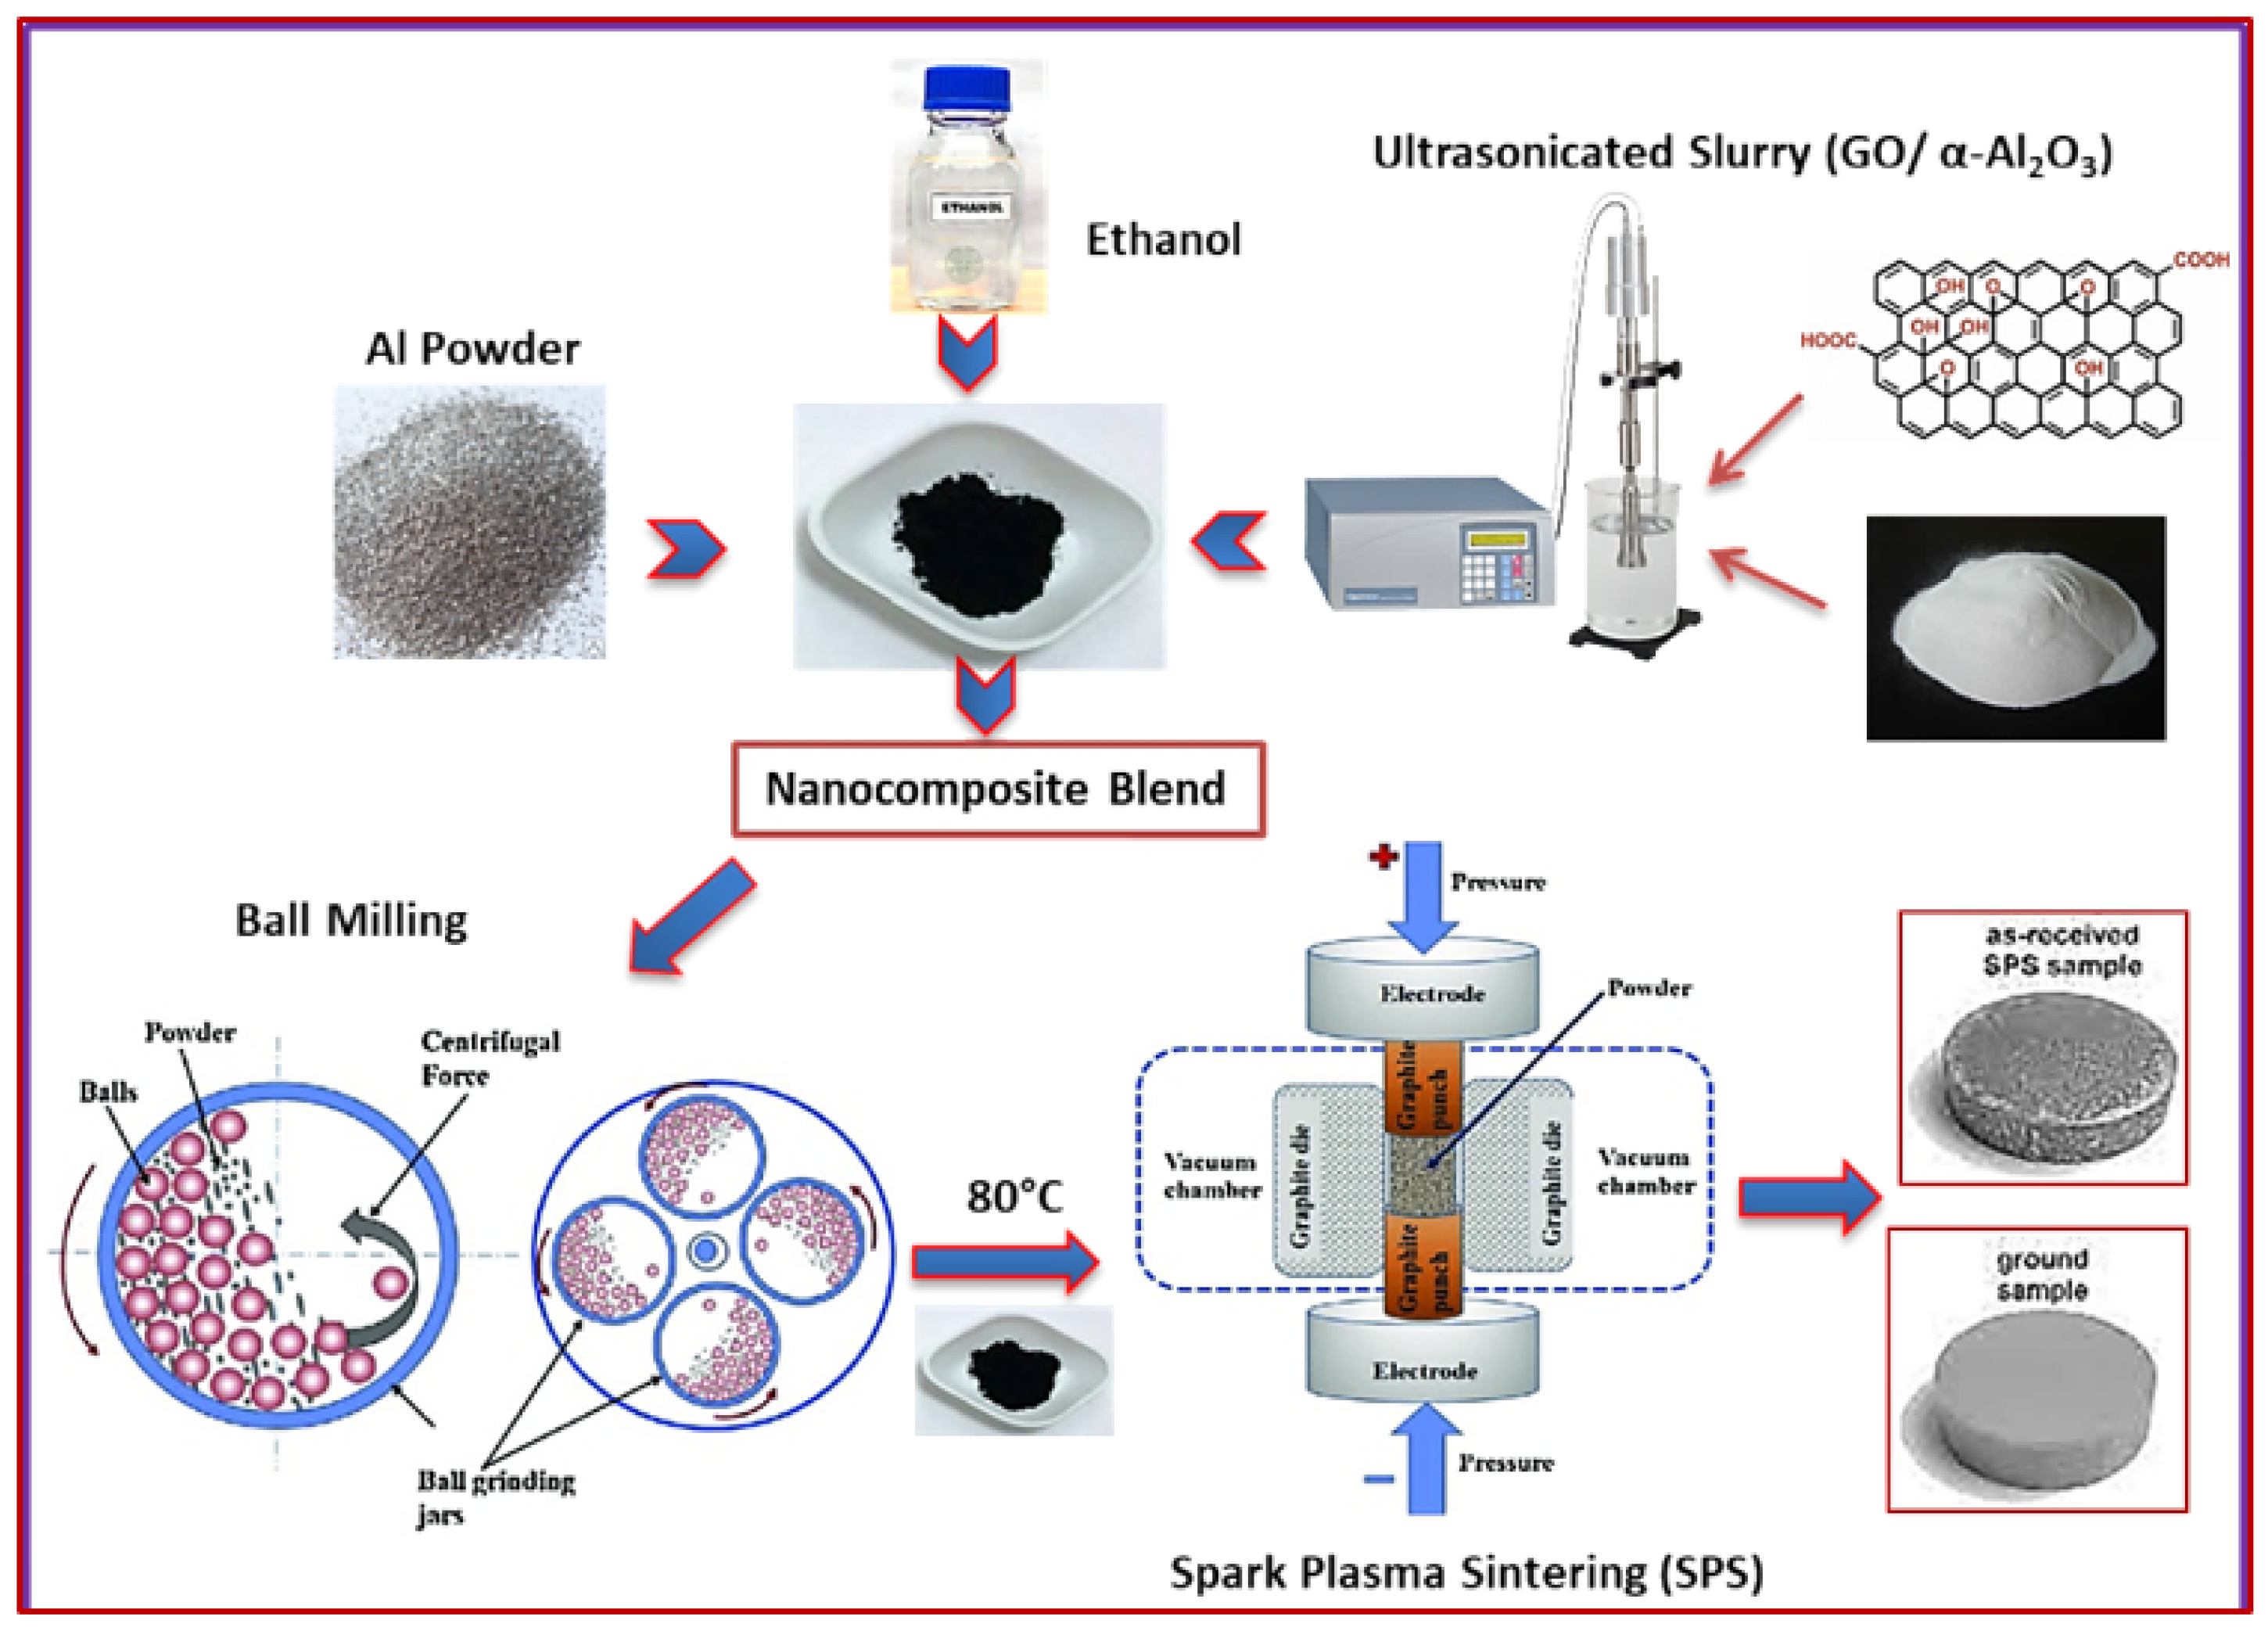
2.2. Material Processing
2.2.1. Ultrasonication of Al2O3 and GO Powders
2.2.2. Ball-Milling Procedure
2.2.3. Spark Plasma Sintering (SPS) Procedure
2.3. Material Characterization
2.3.1. Sample Preparation
2.3.2. Characterization and Imaging
2.3.3. Electrochemical Evaluation
3. Results and Discussion
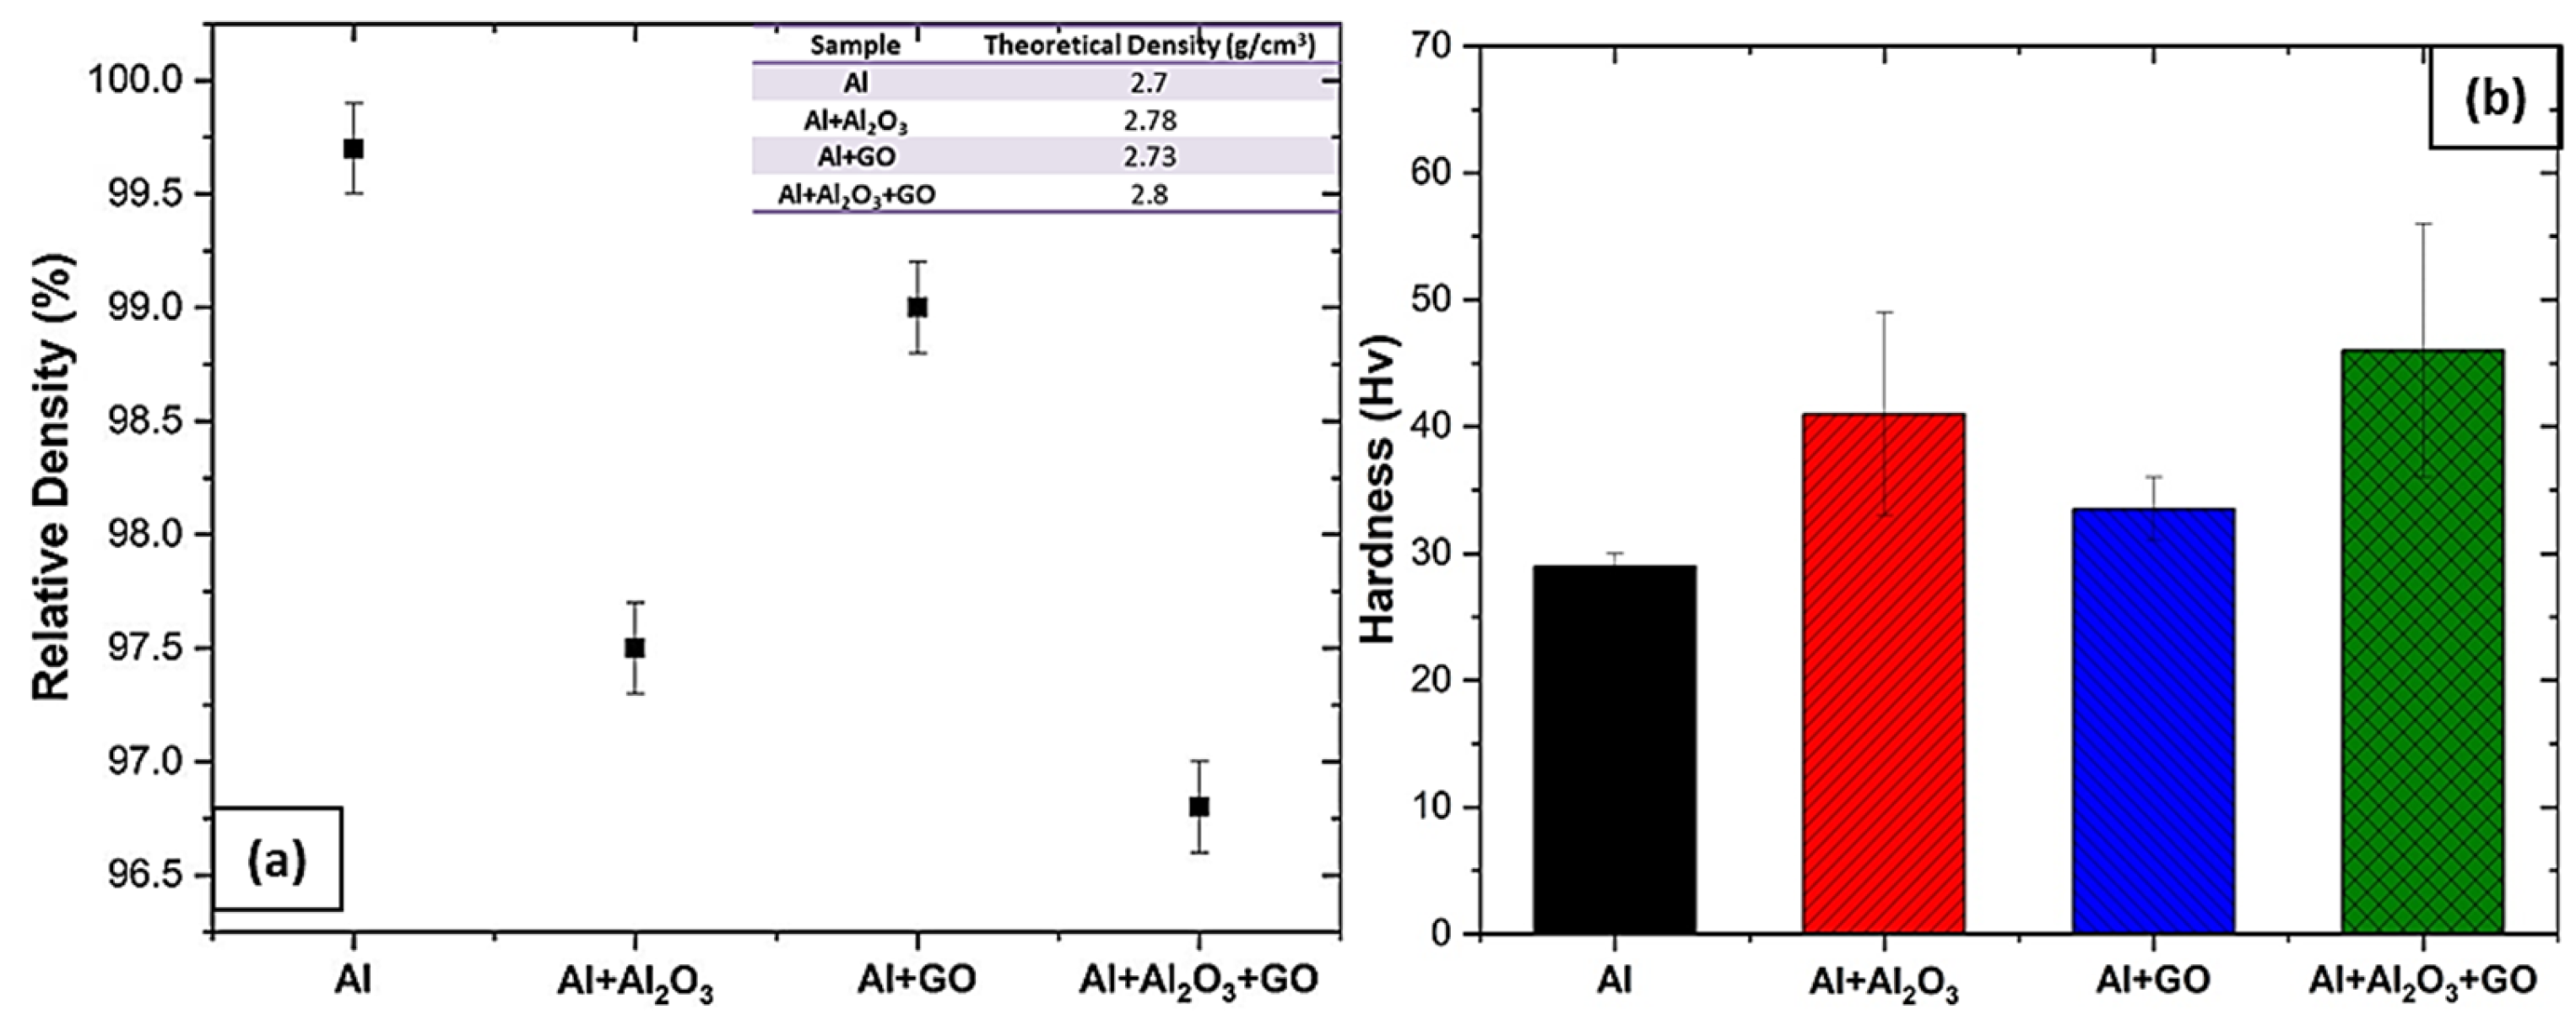
3.1. Density and Hardness
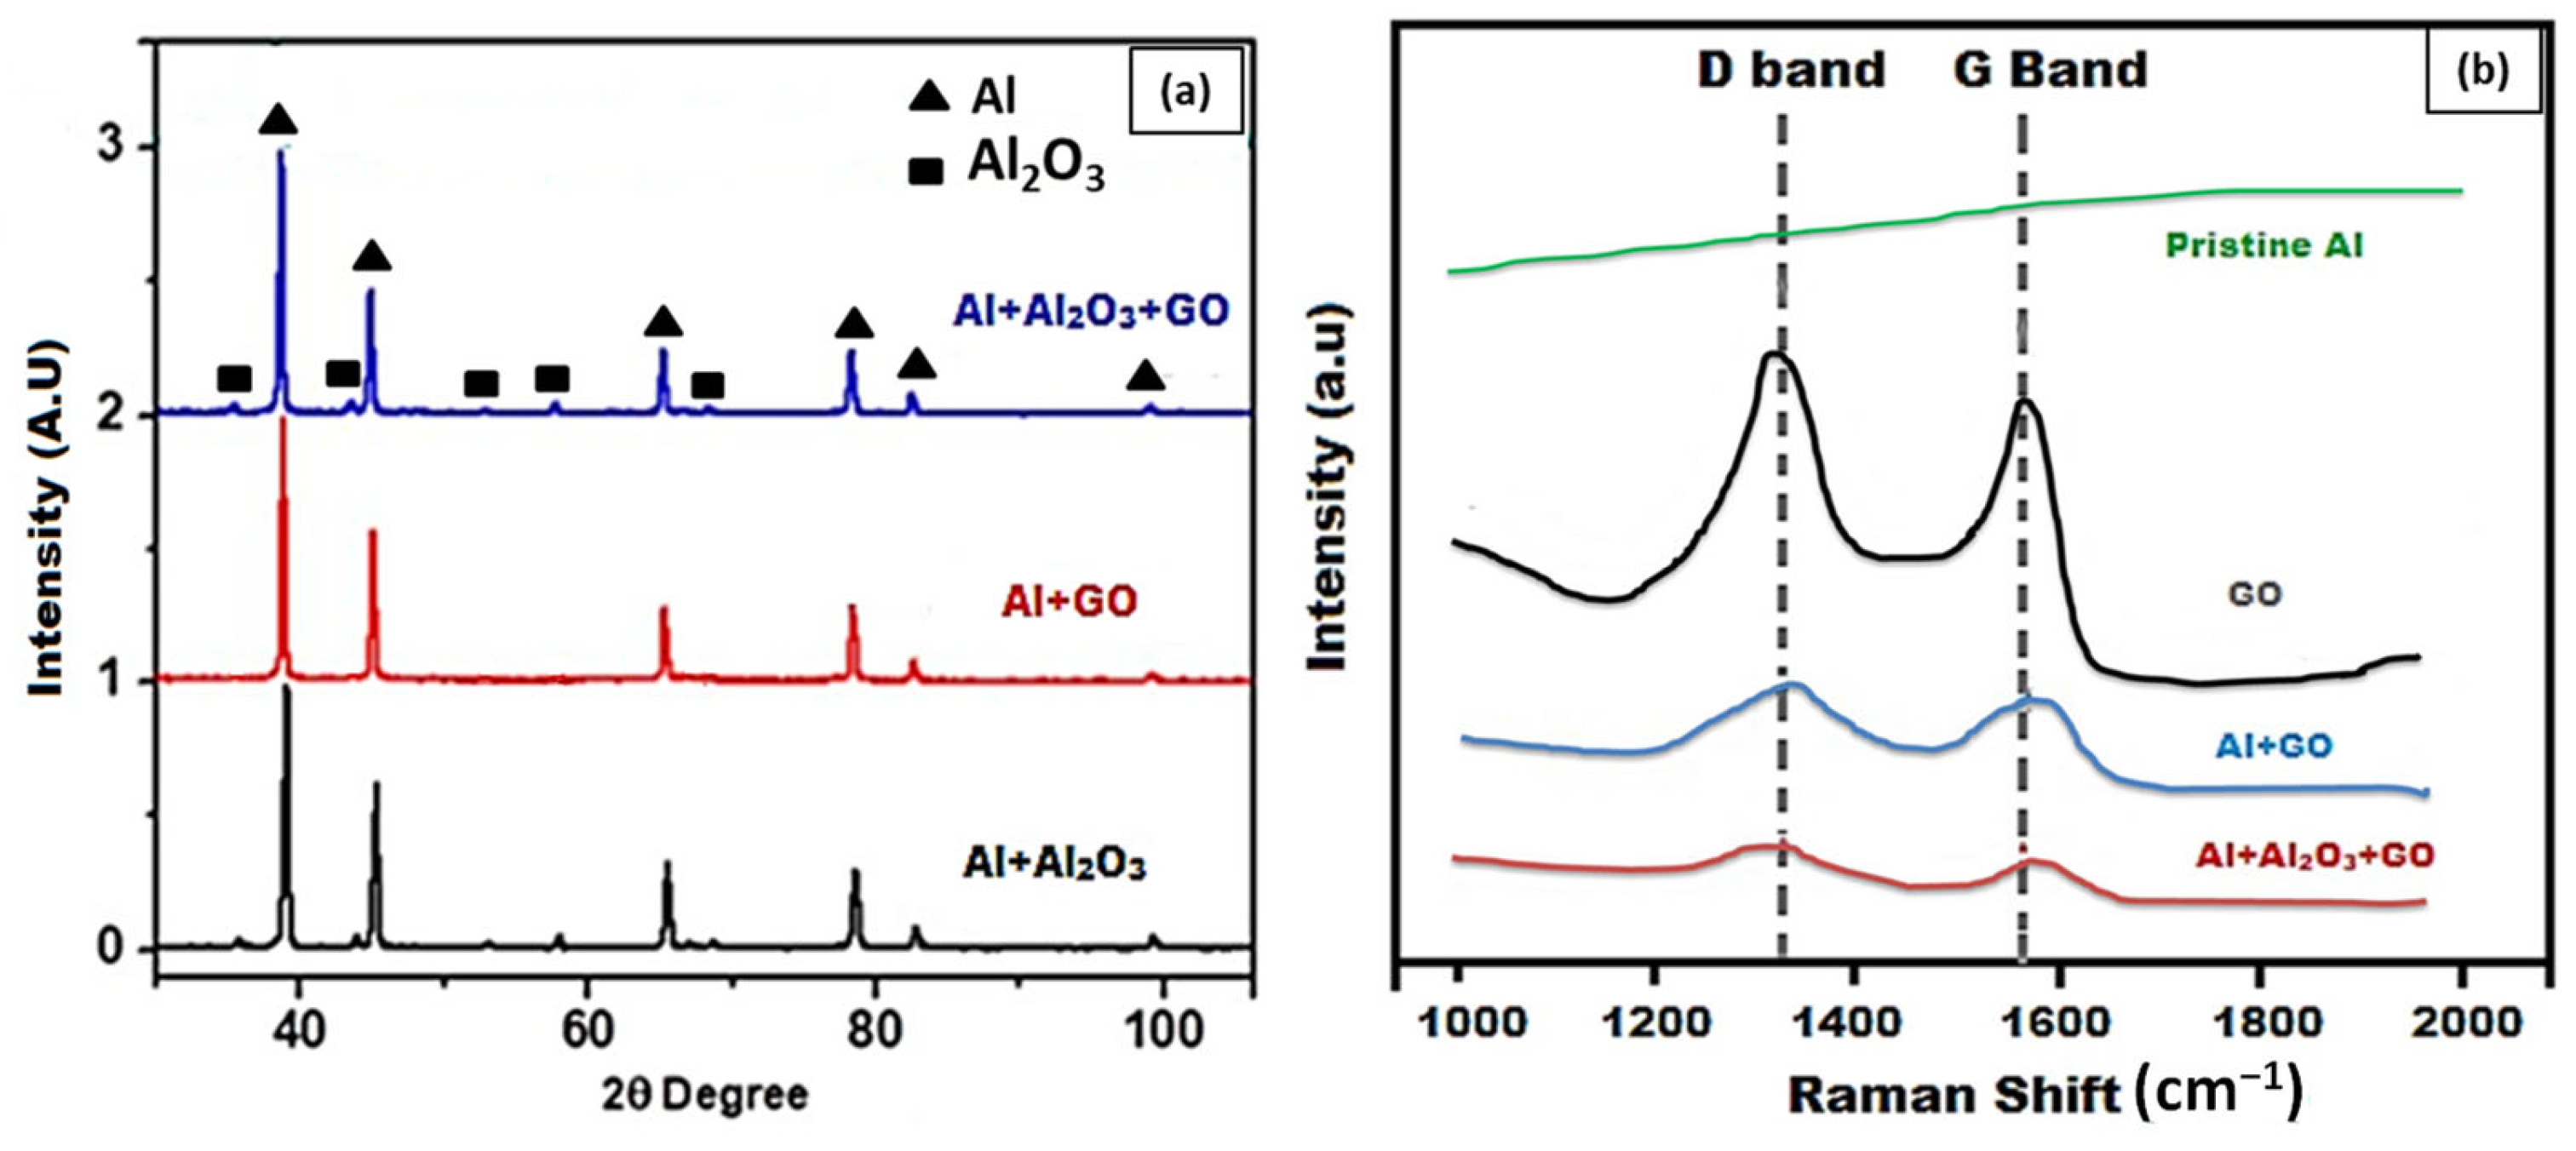
3.2. Characterization
3.3. Surface Analysis
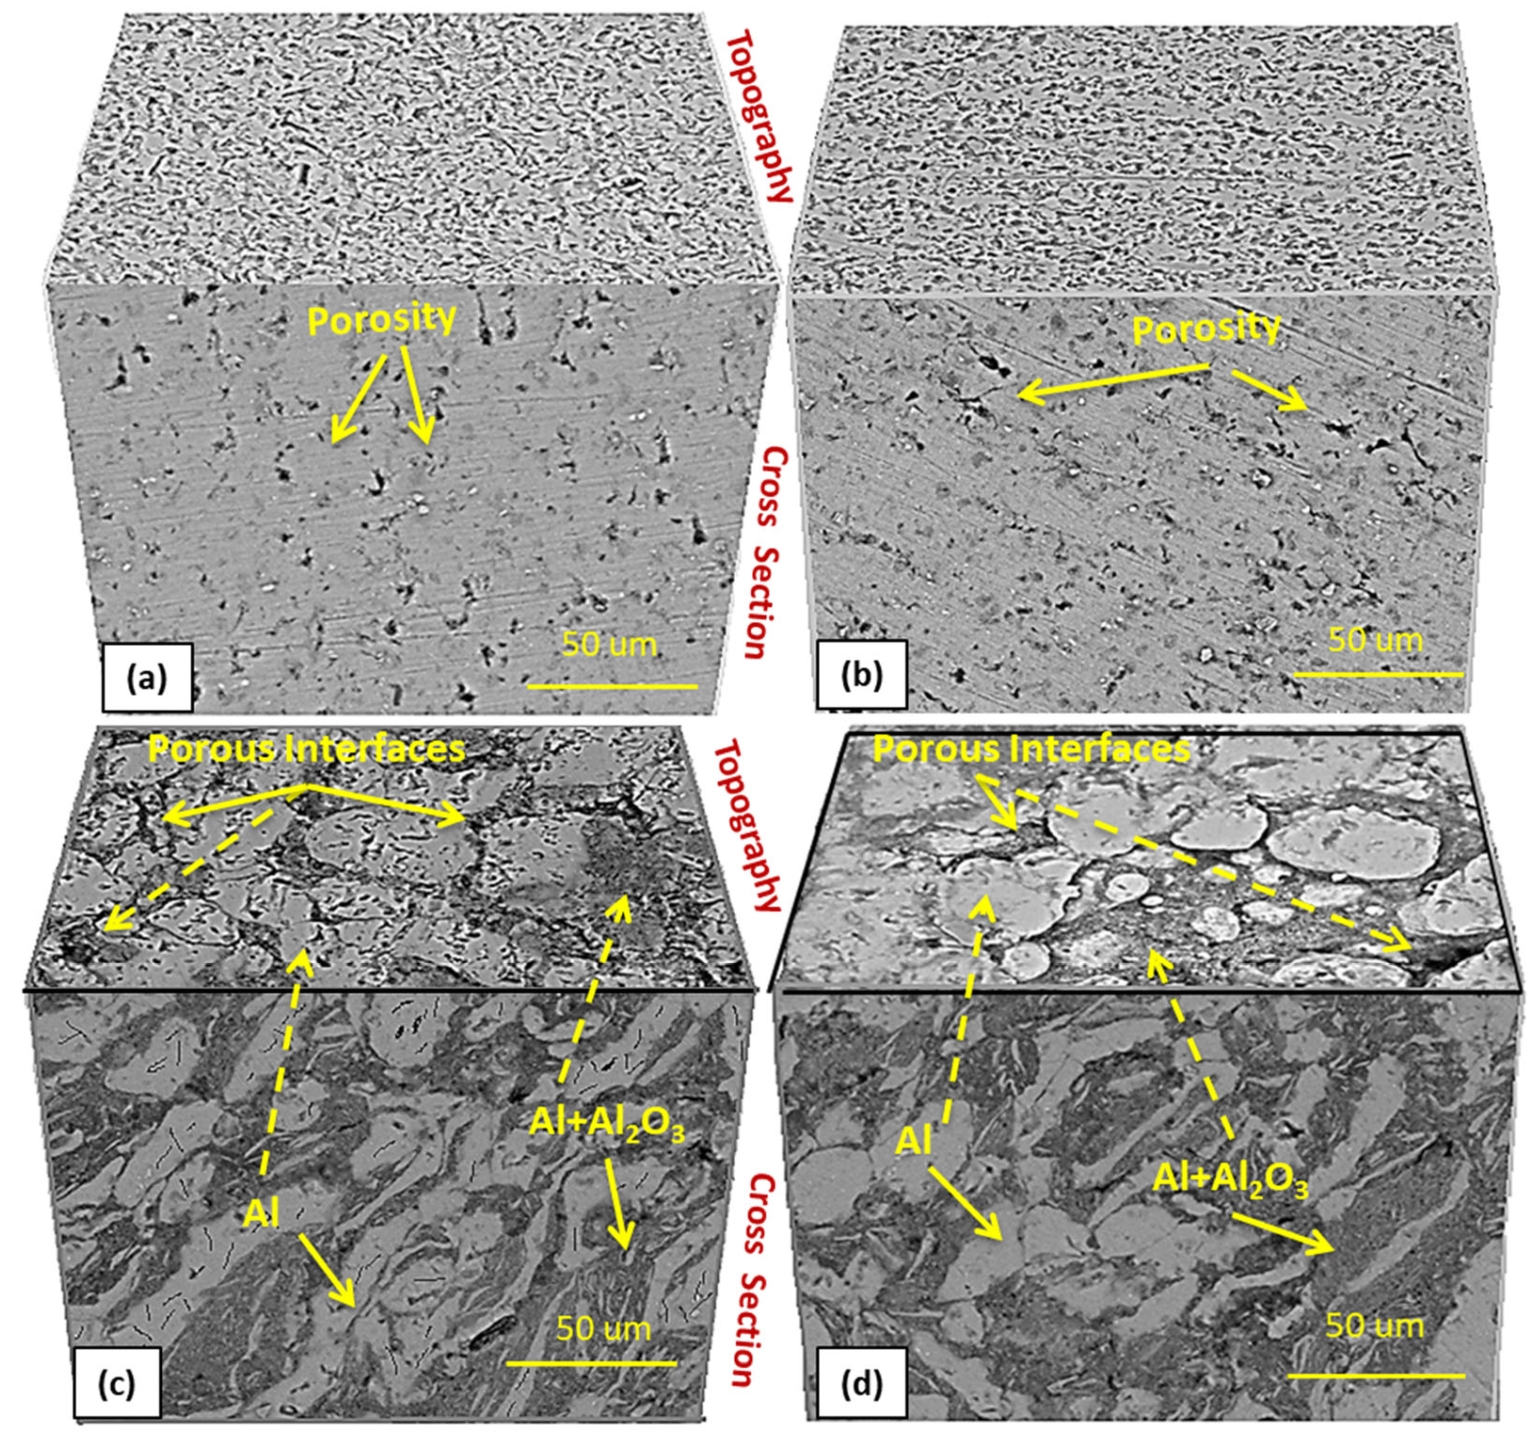
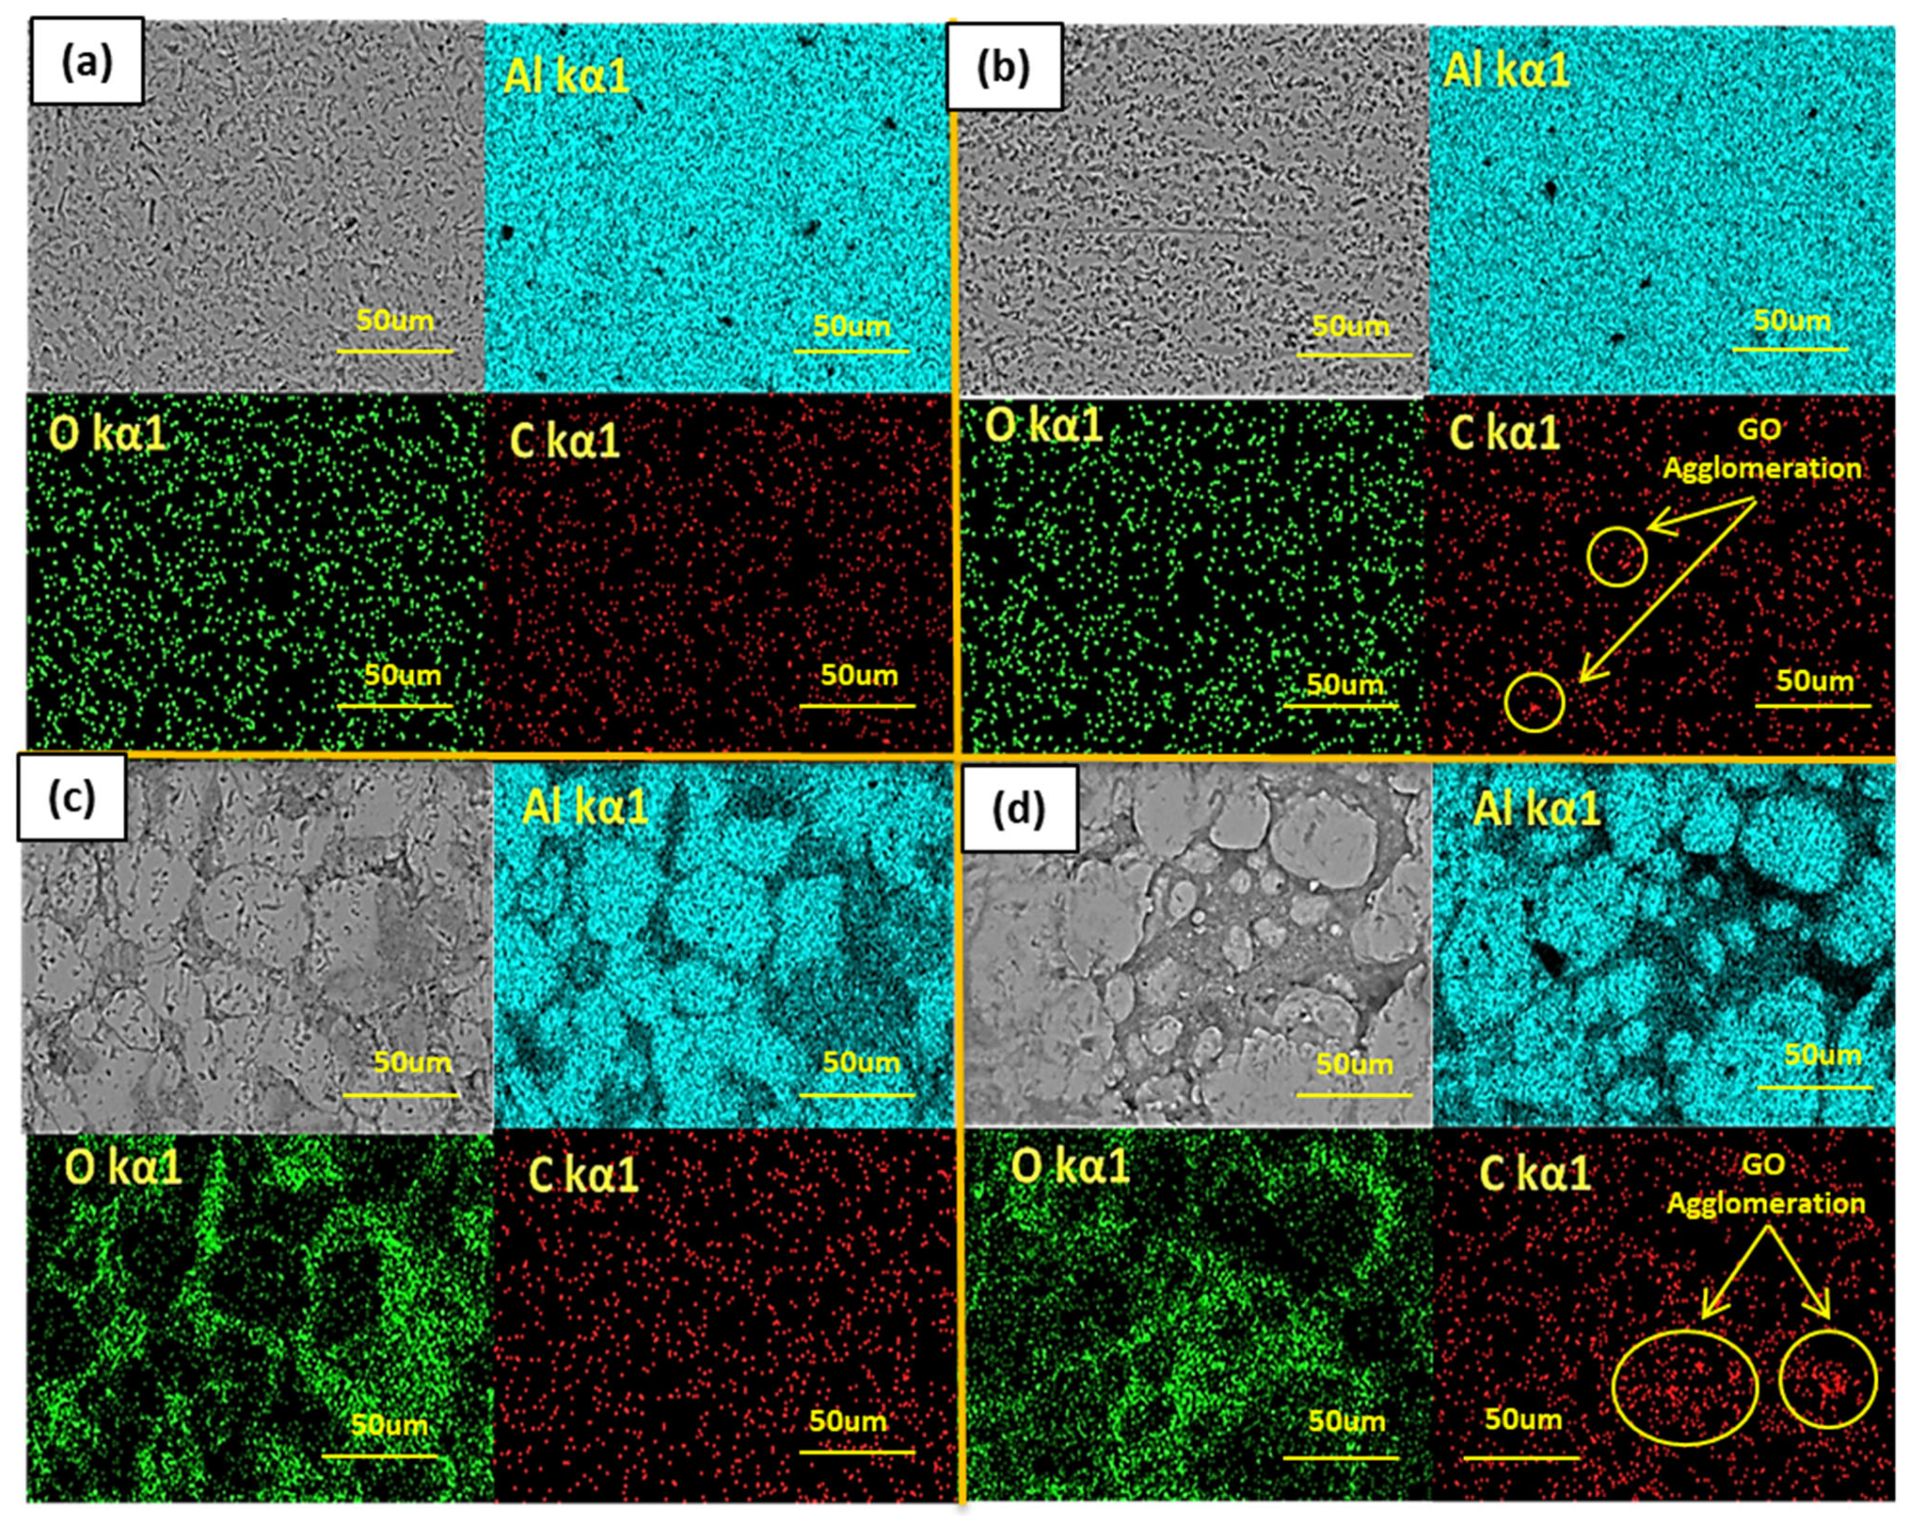
3.3.1. Morphology and Elemental Analysis
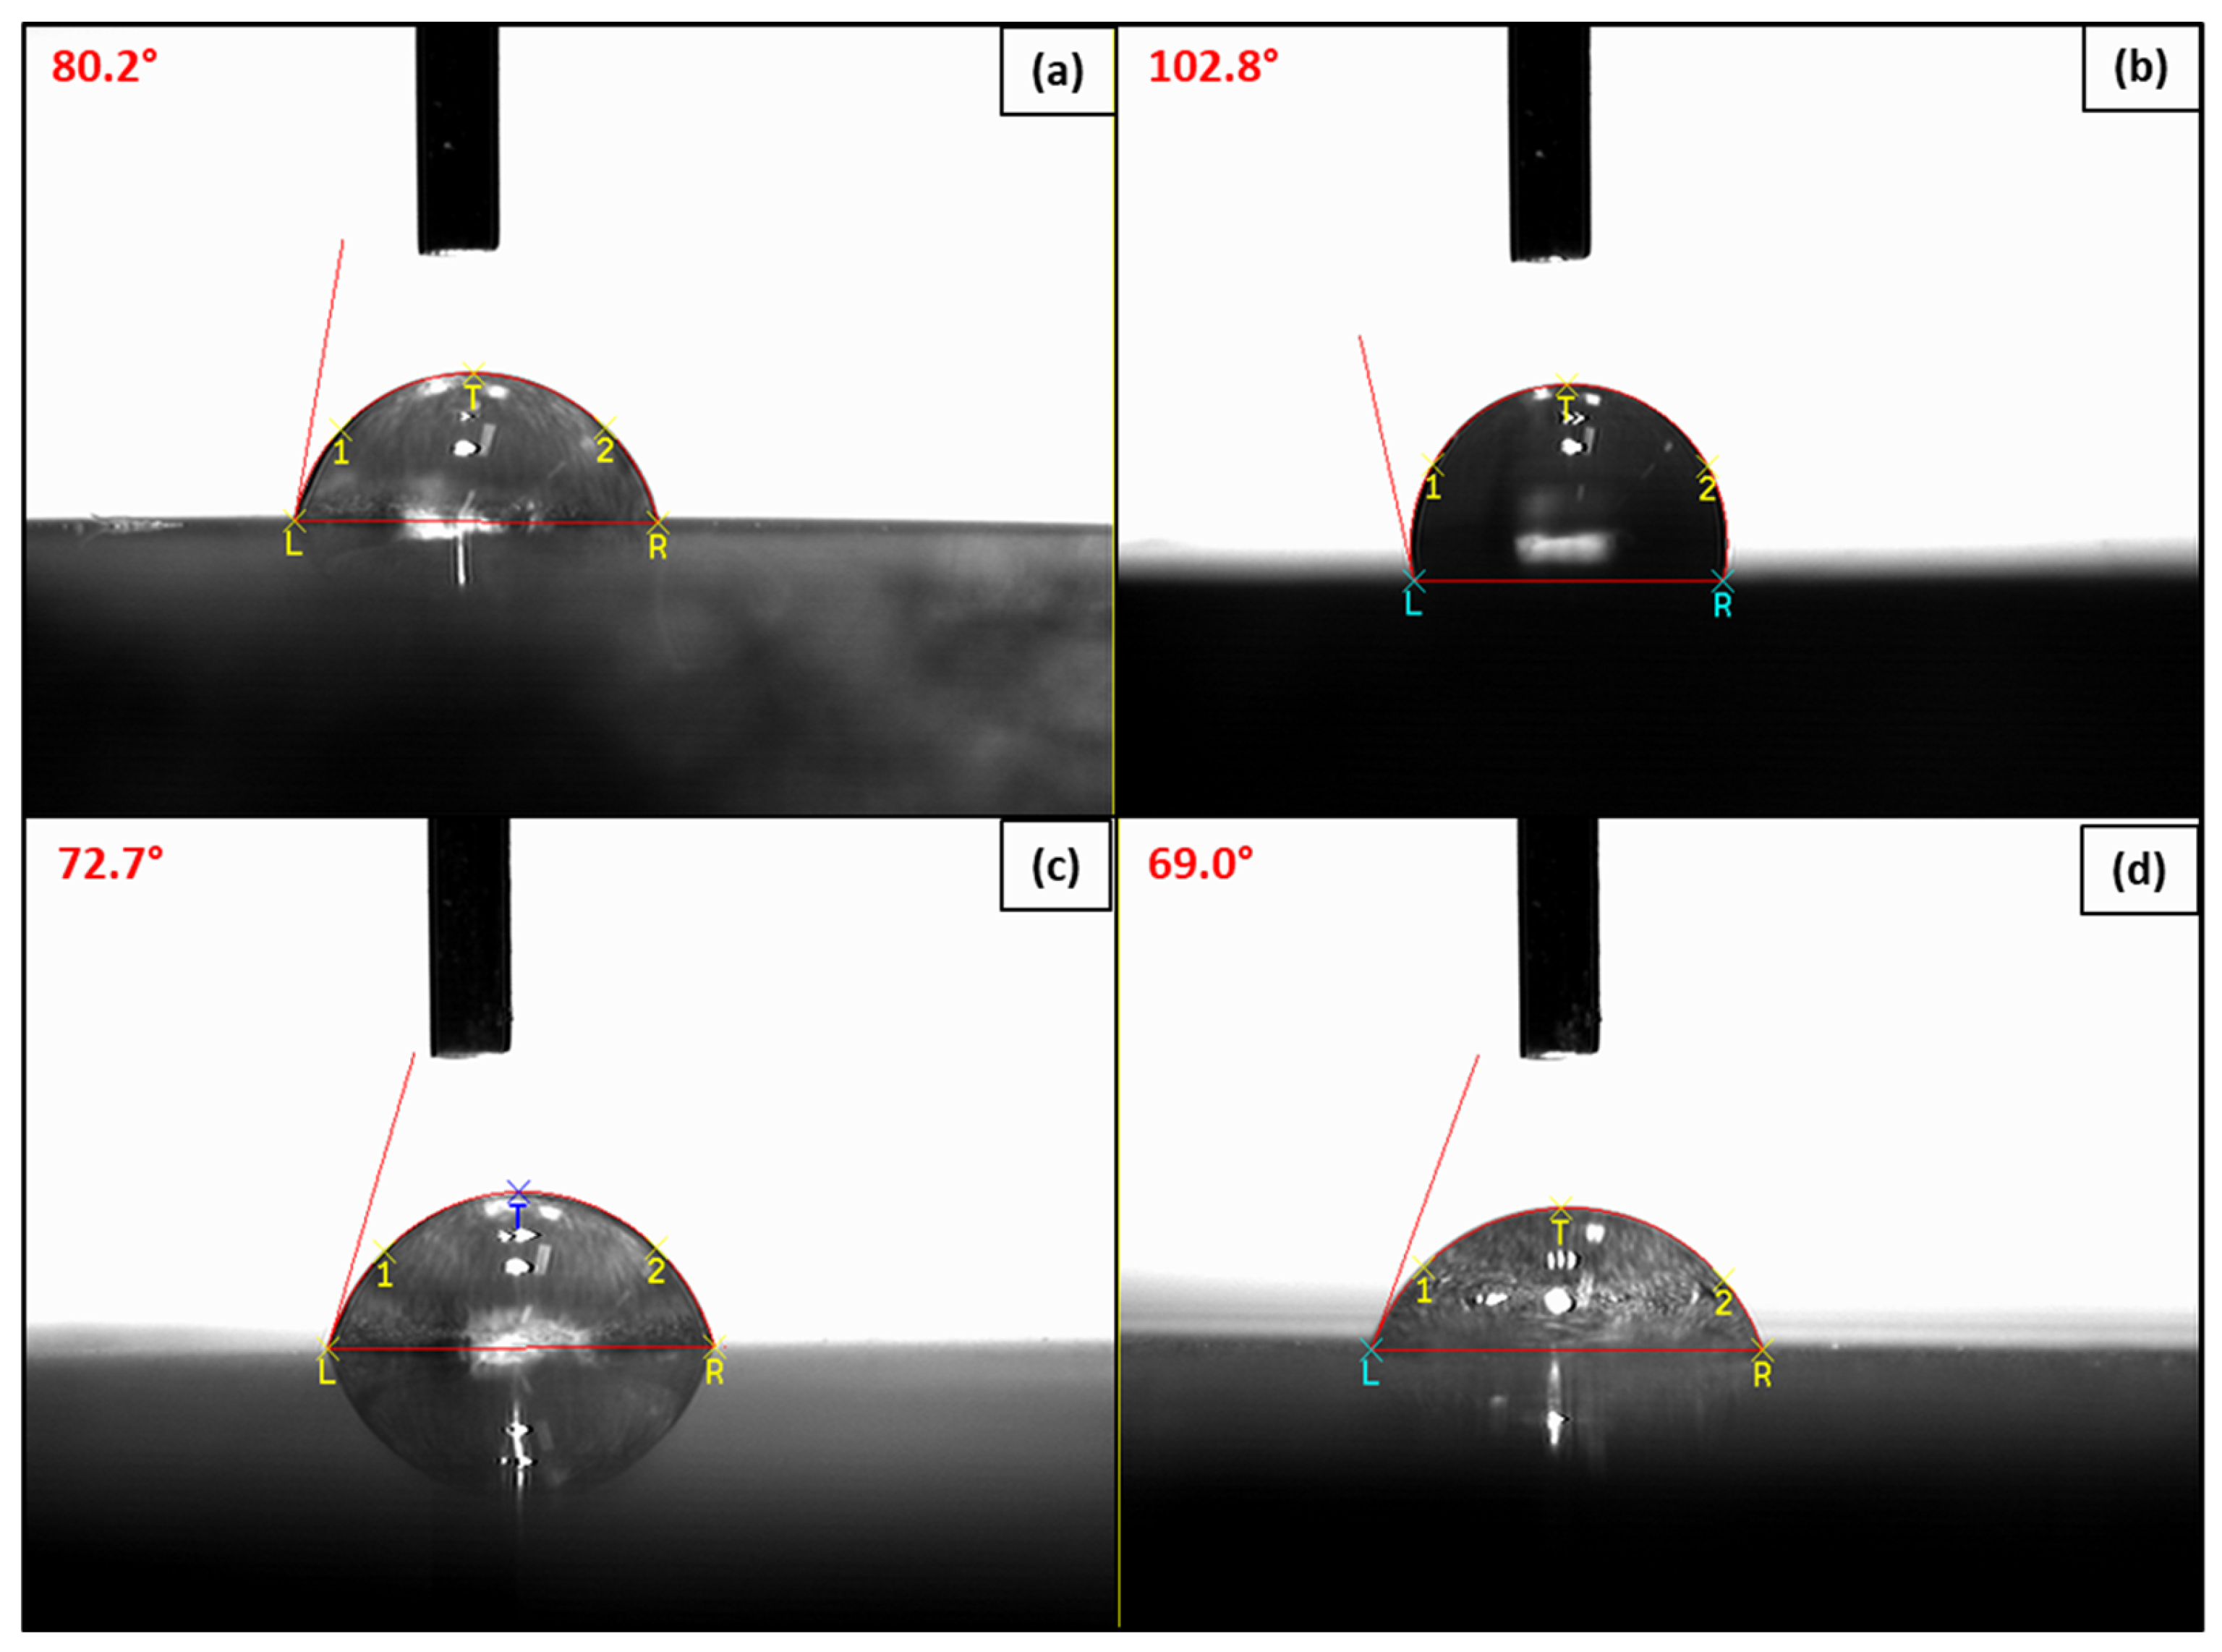
3.3.2. Wettability
3.4. Electrochemical Evaluation
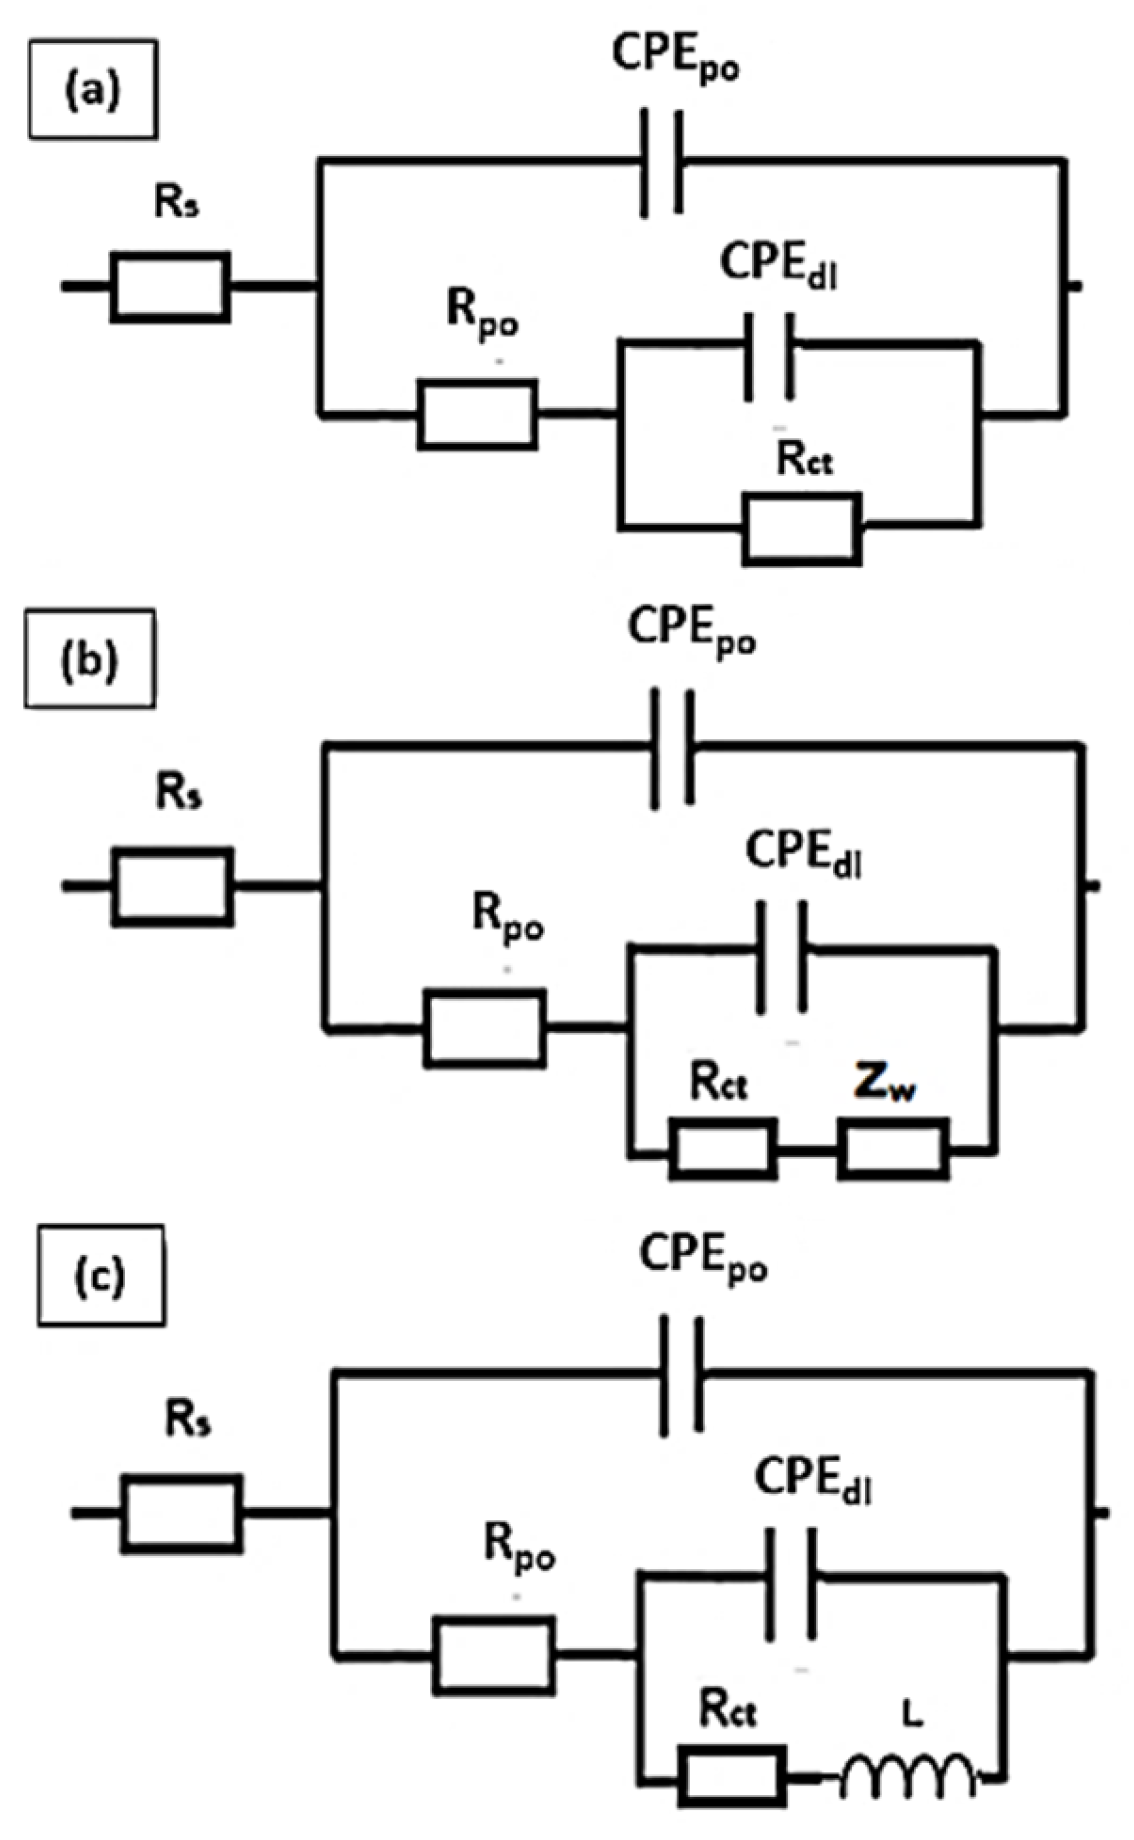
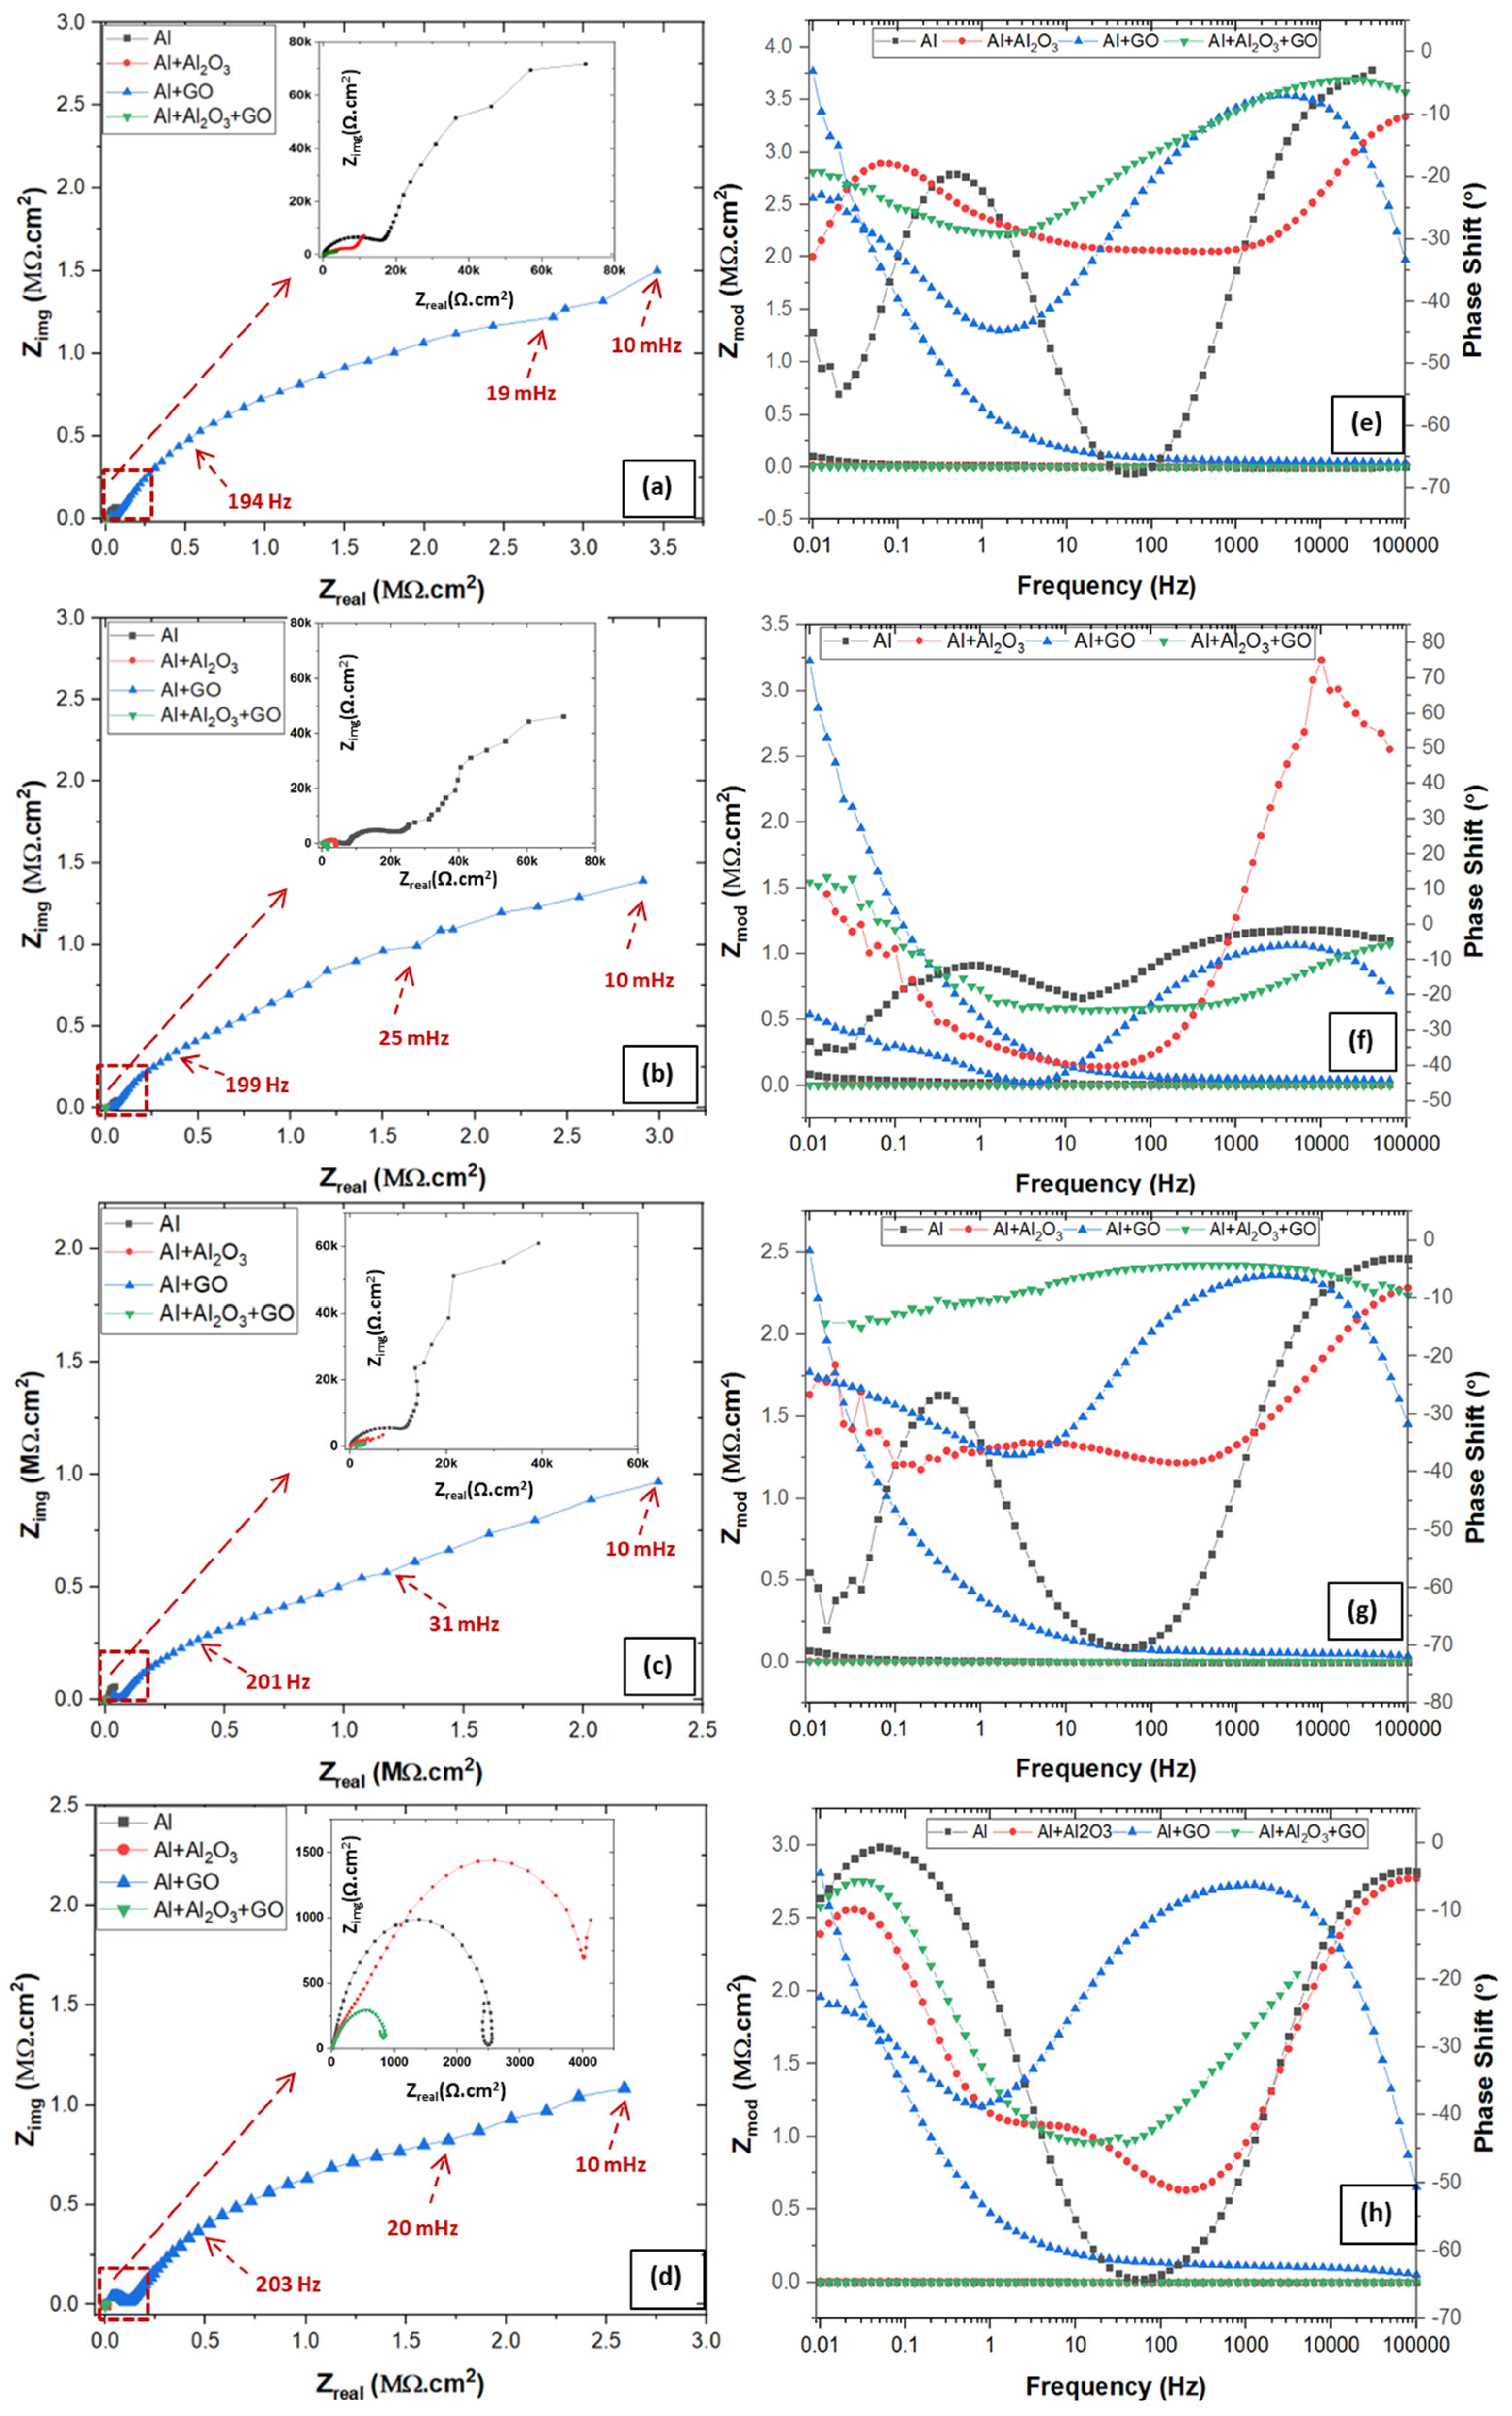
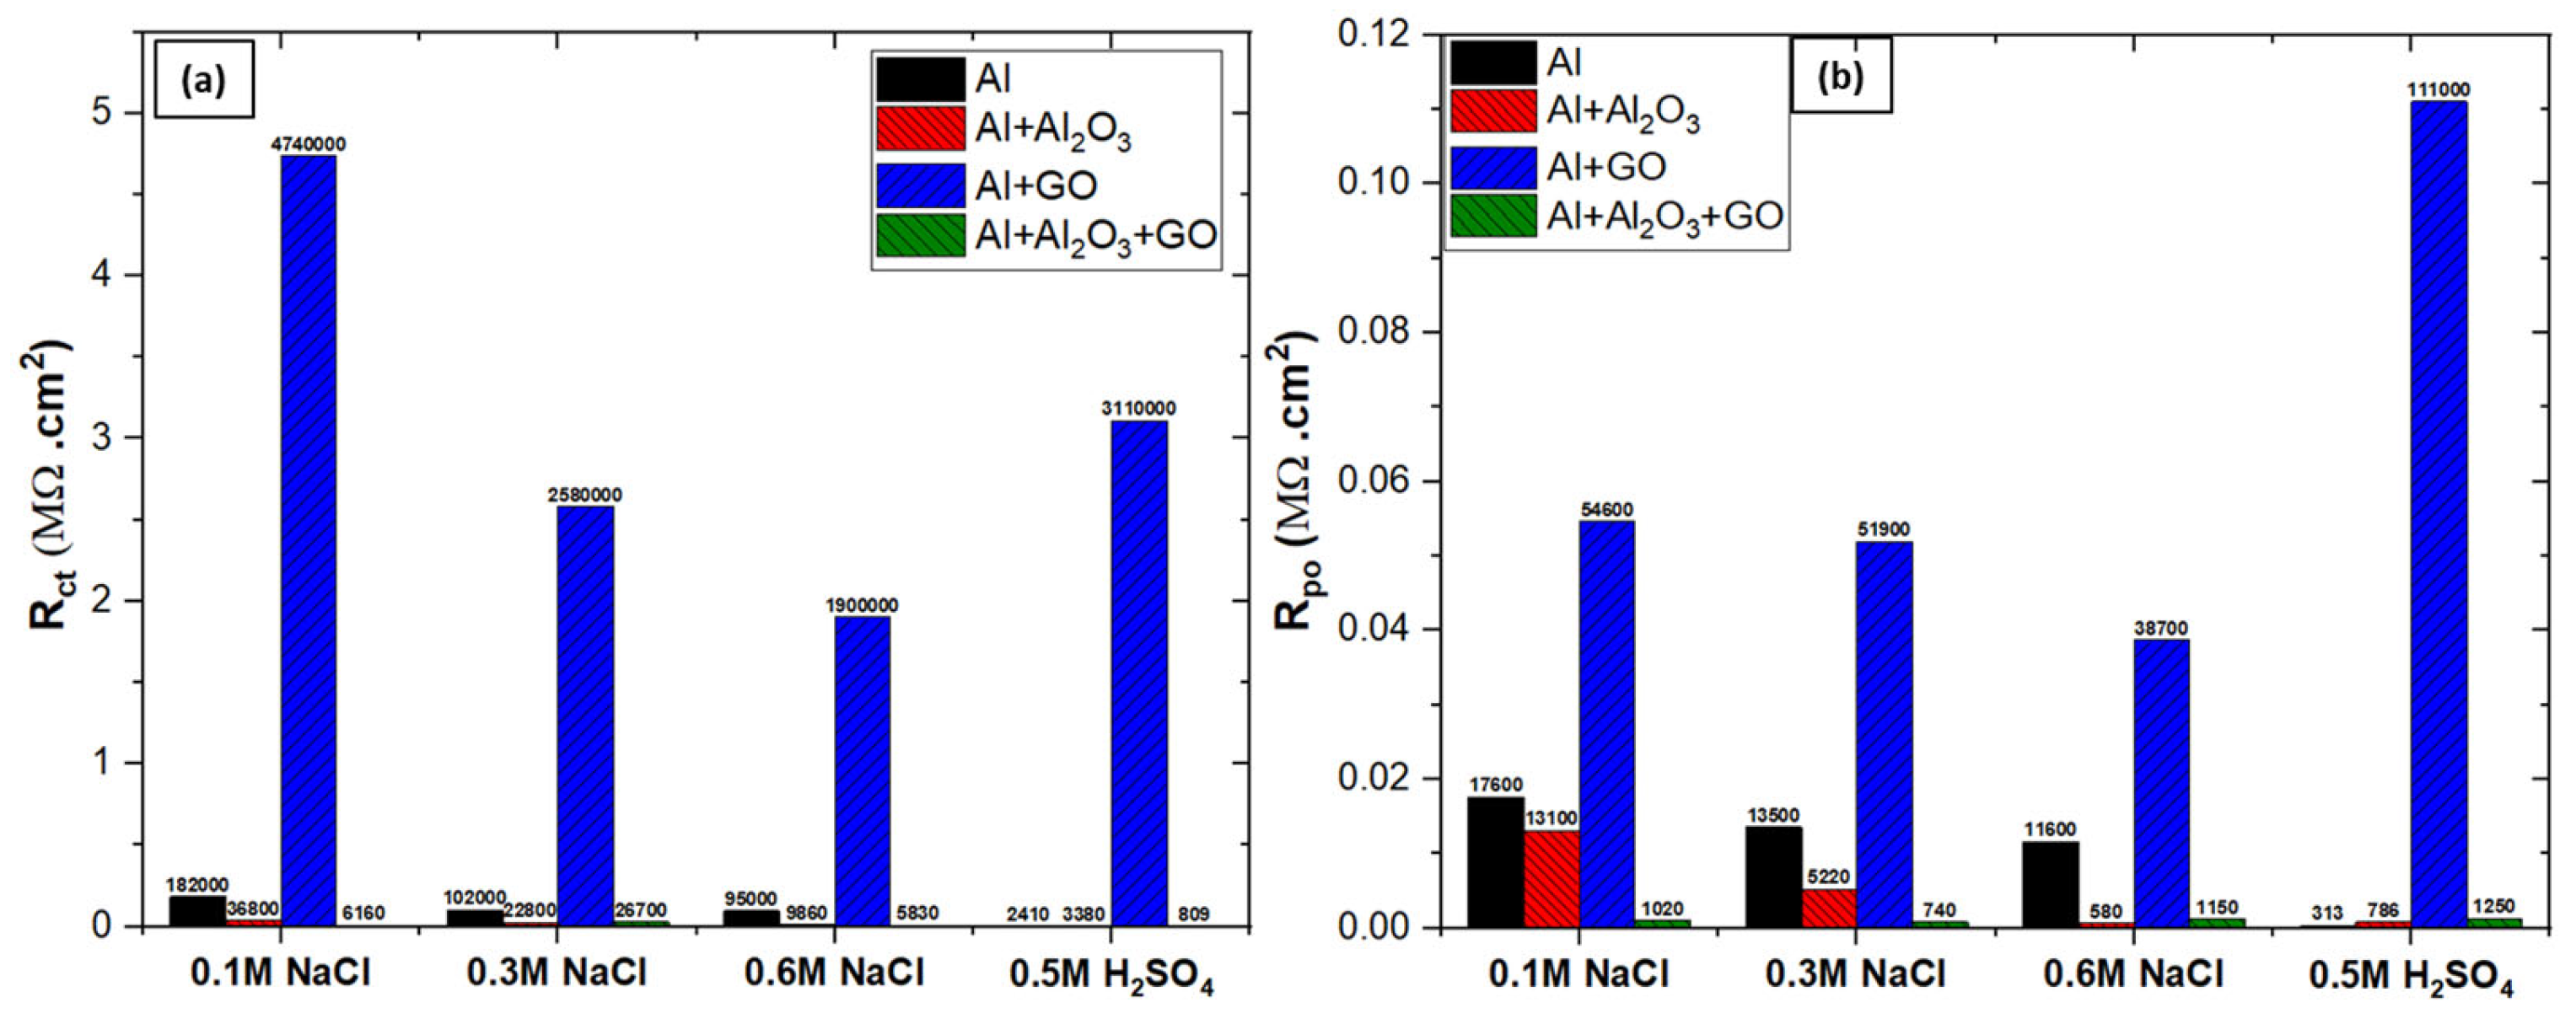
3.4.1. Electrochemical Impedance Spectroscopy (EIS)
3.4.2. Electrochemical Noise Analysis (ENA)
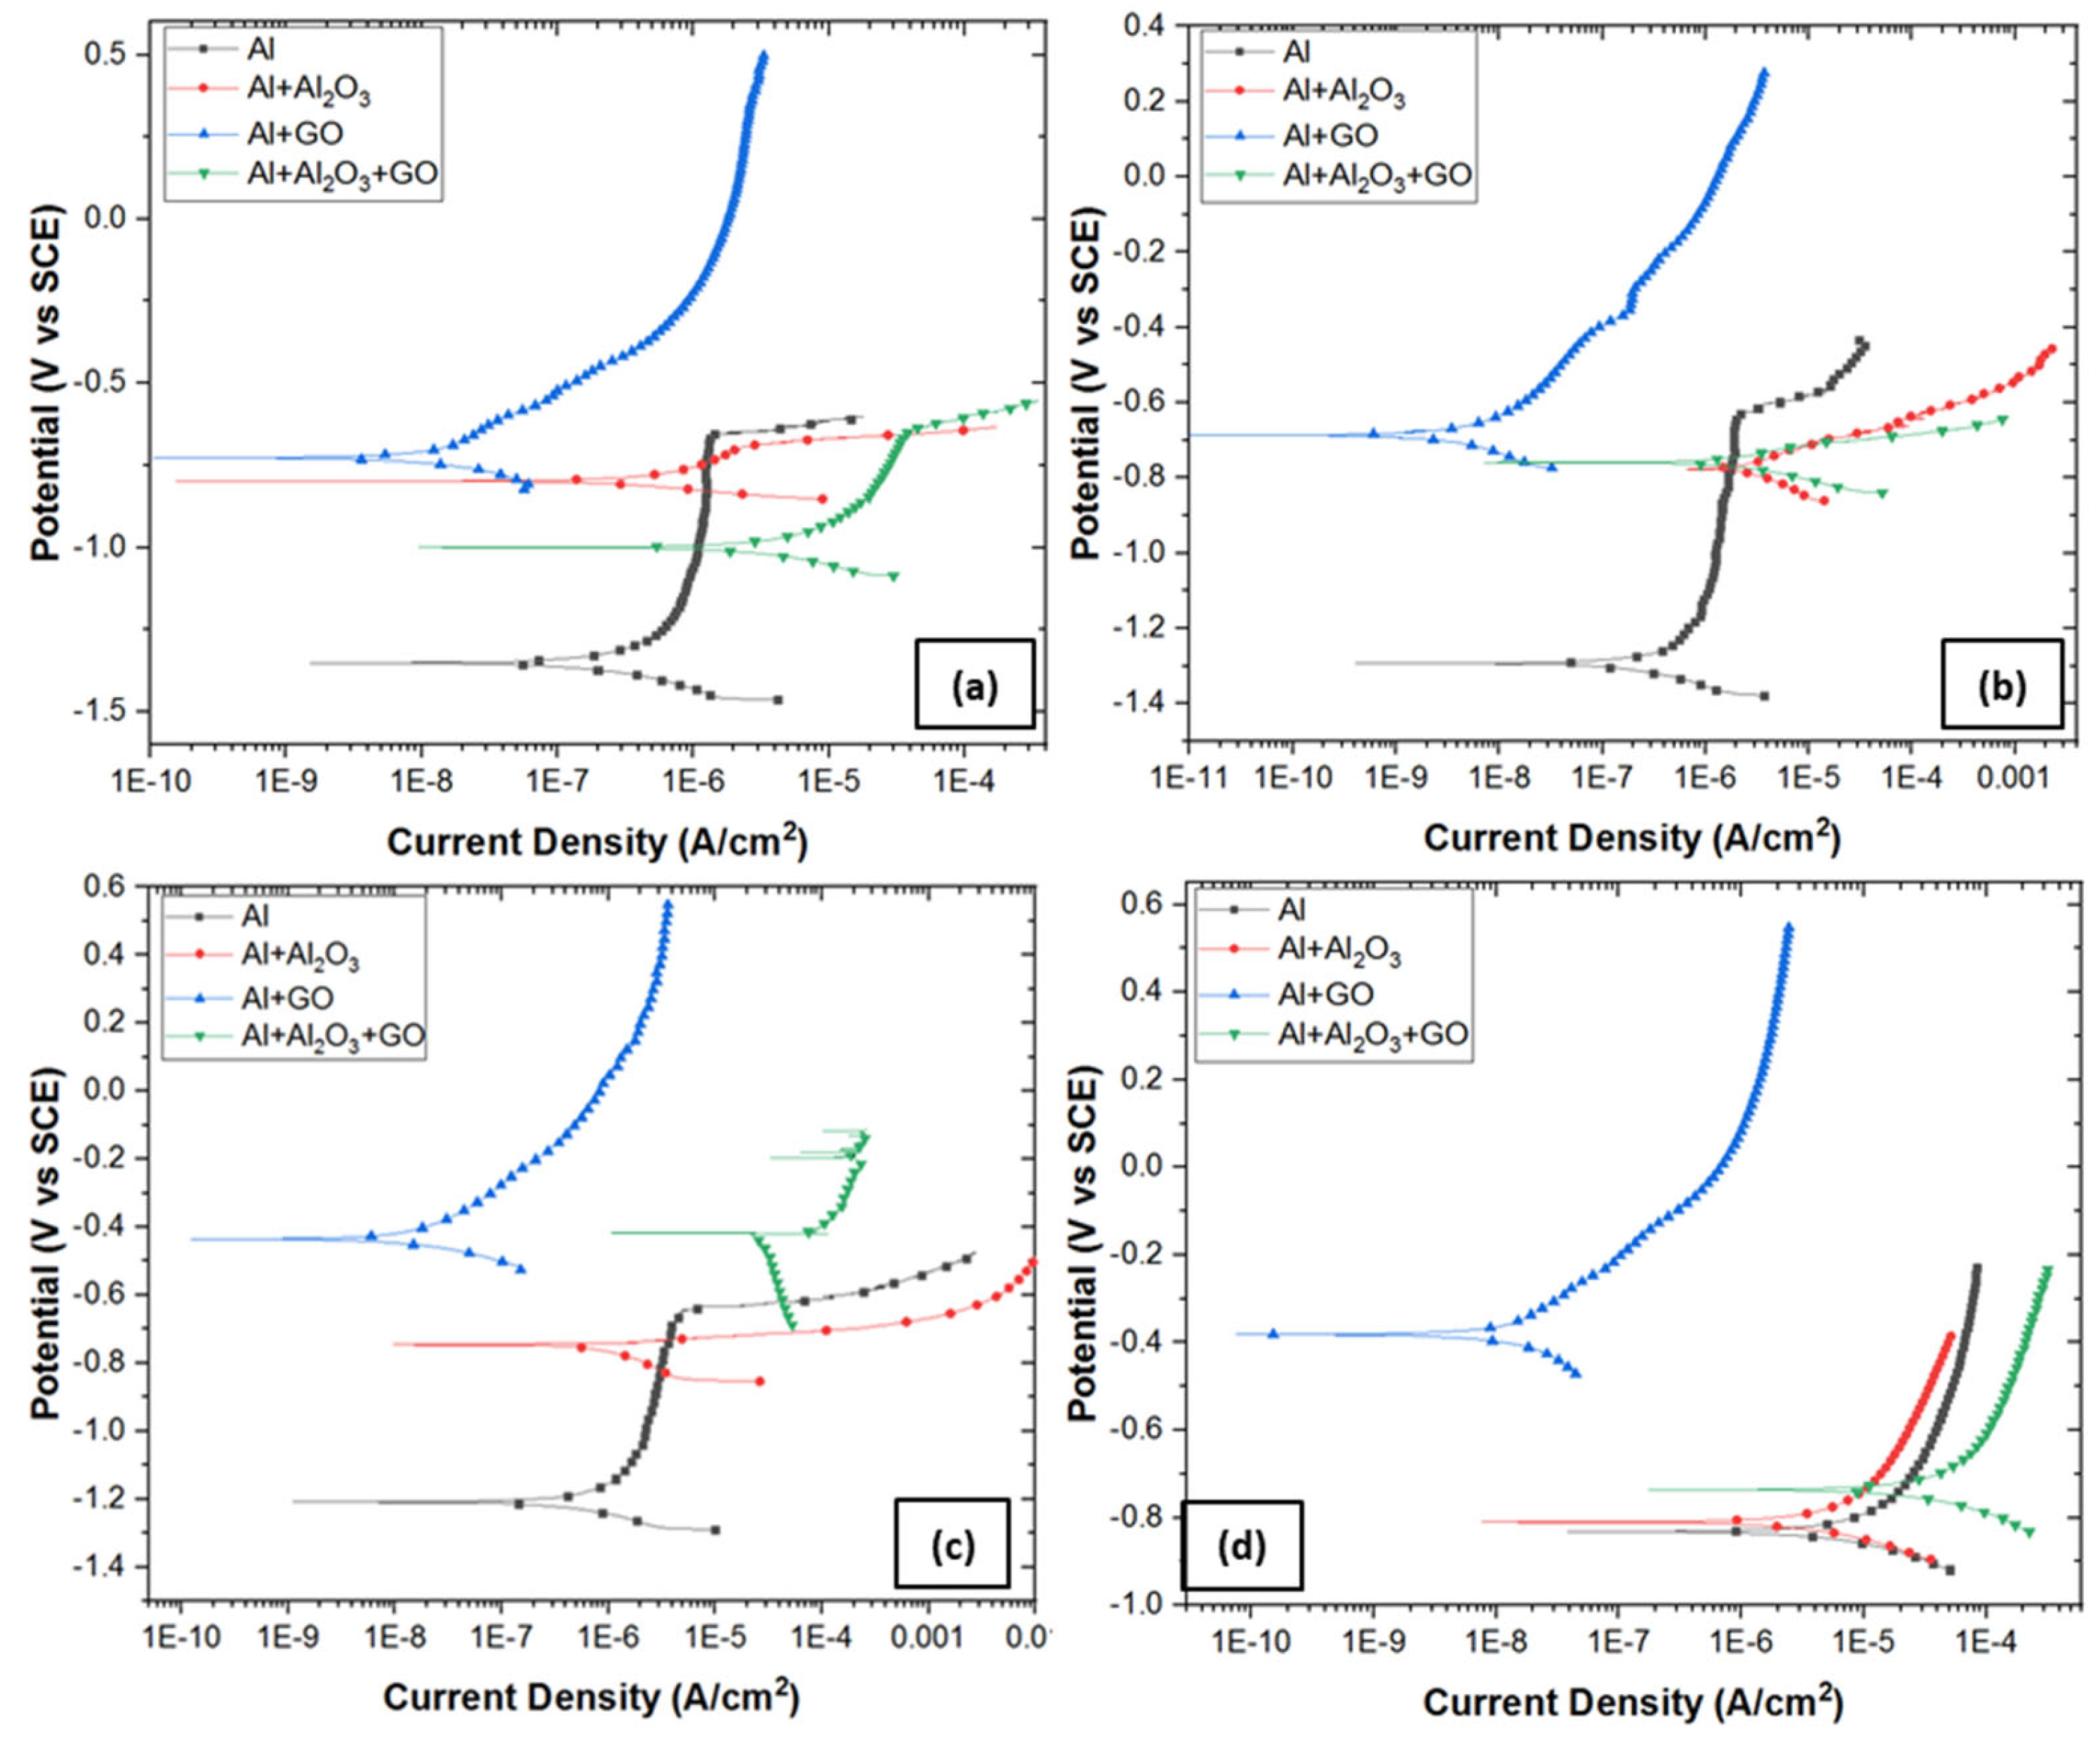
3.4.3. Potentiodynamic Polarization (PDP)
4. Post-Corrosion Analysis
4.1. Increased Corrosion Resistance of GO-Reinforced Al-MMC
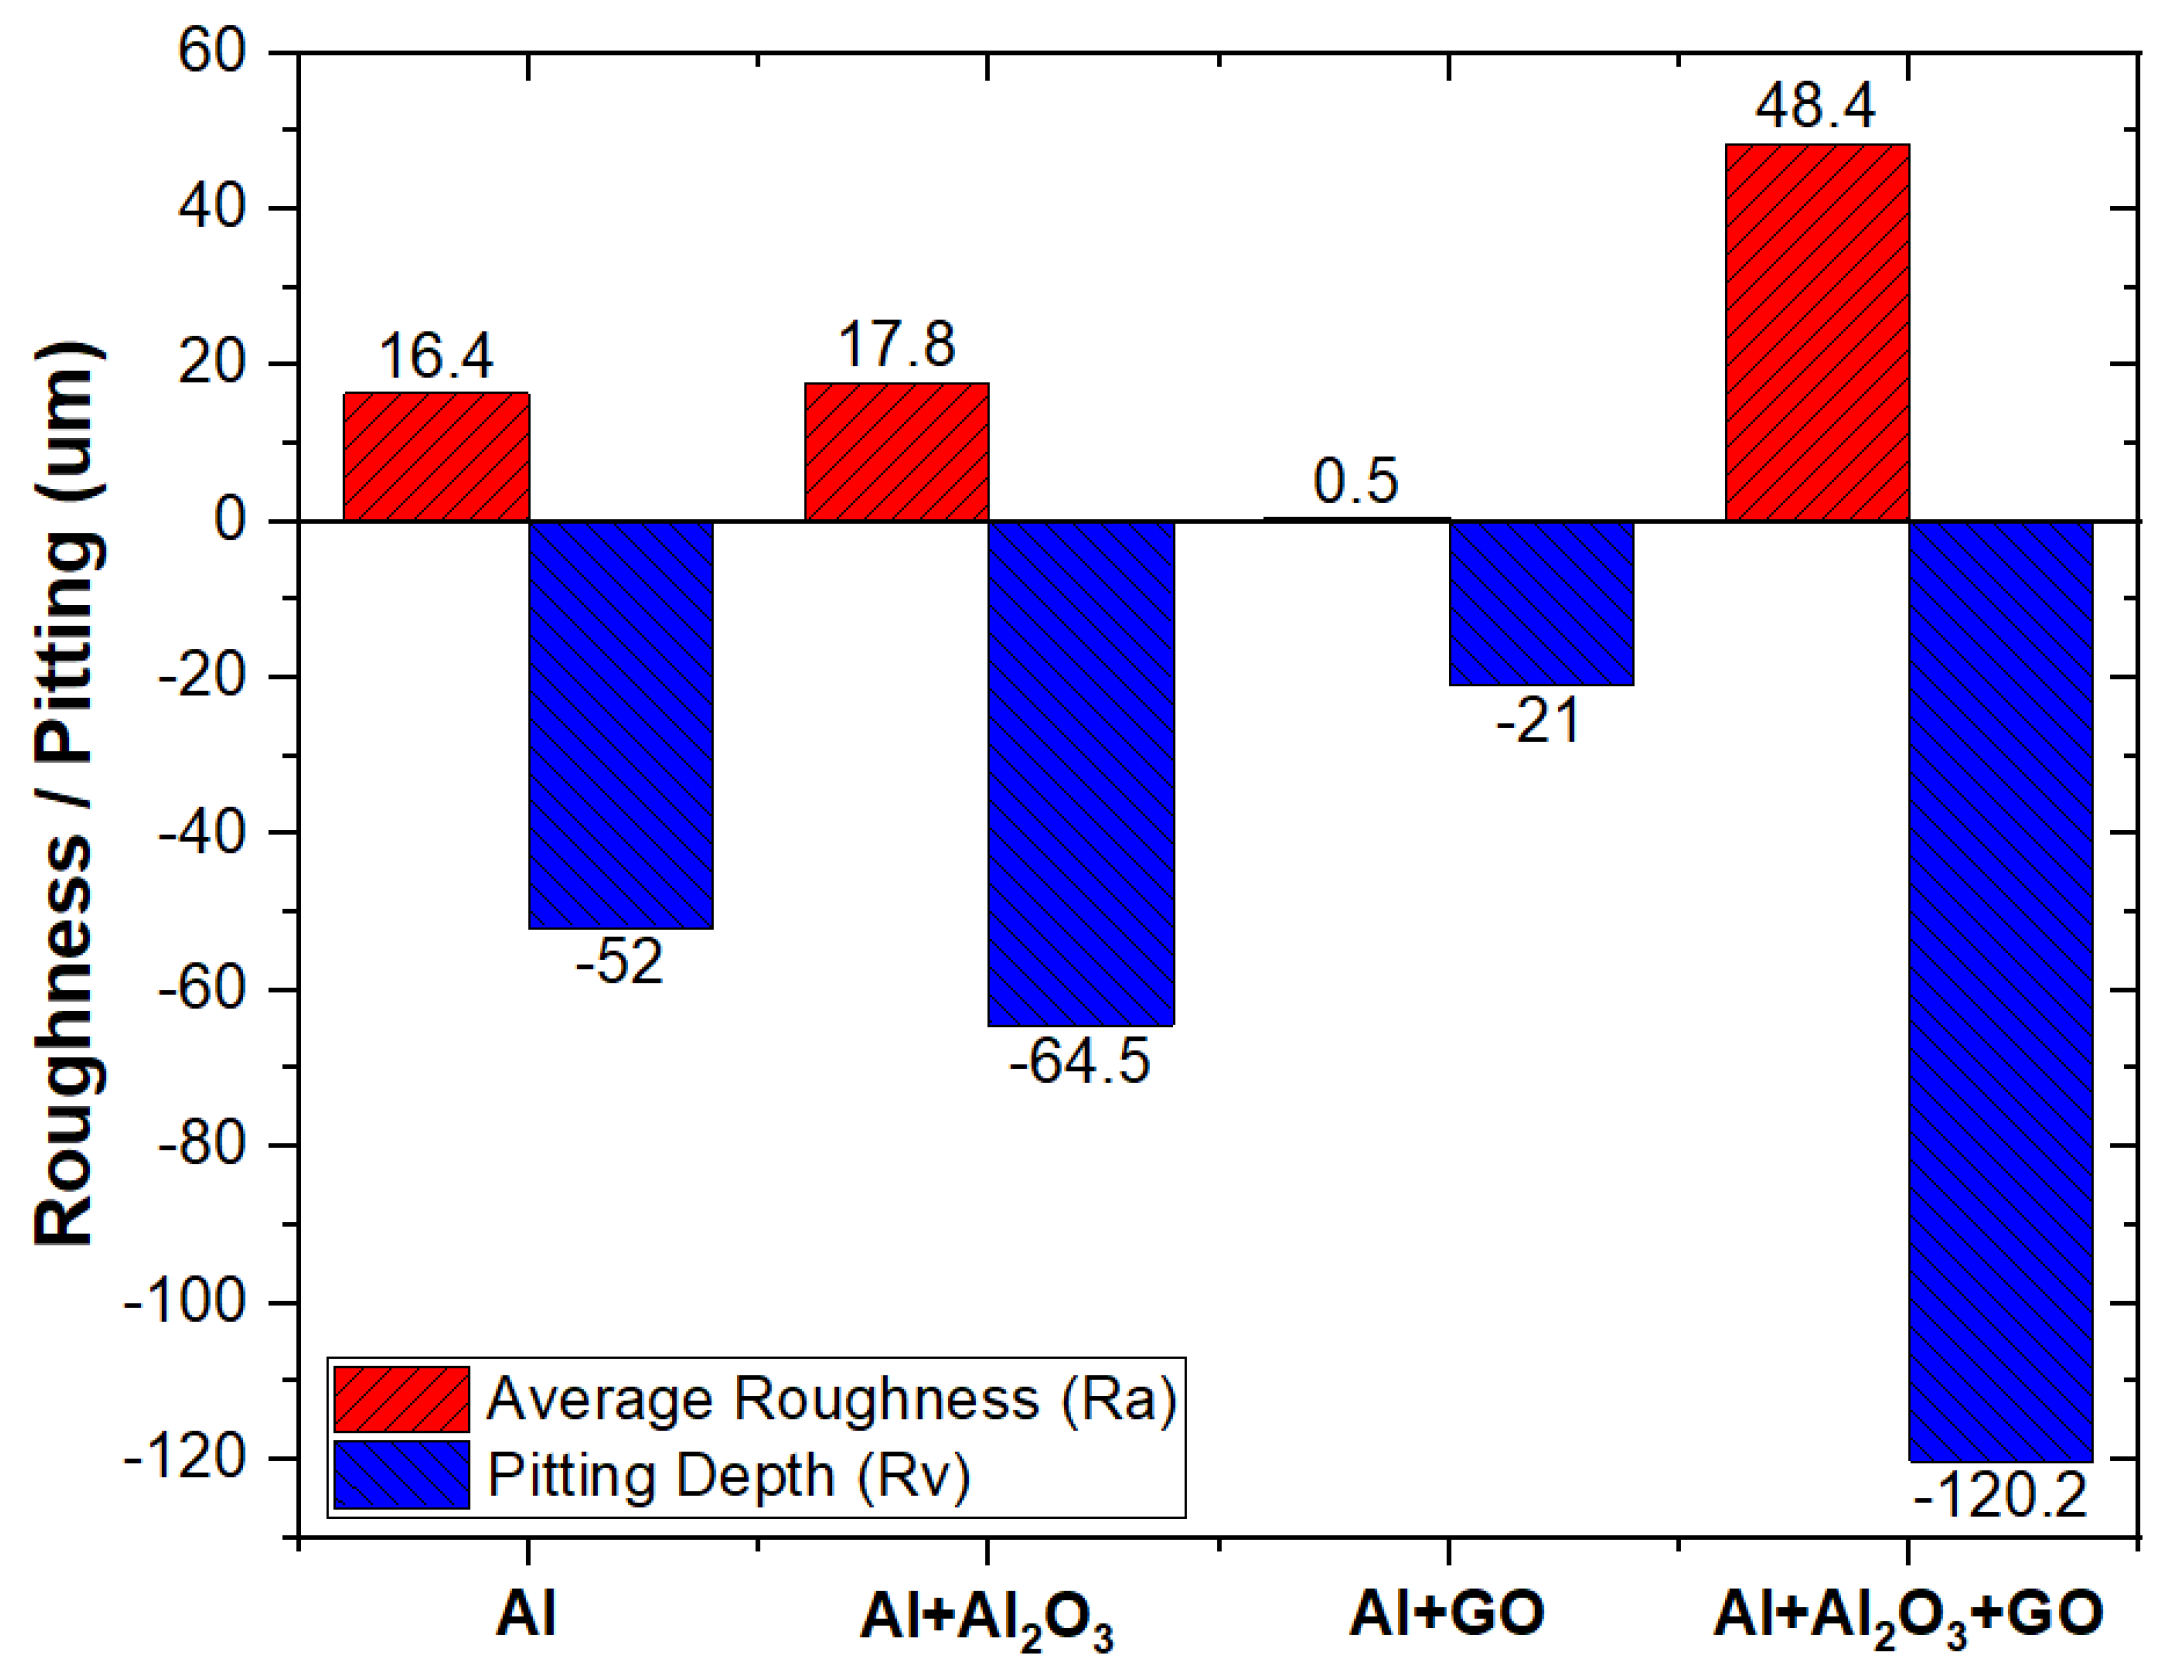
4.2. Surface Topography
5. Conclusions
- (1)
- The metallic Al phase was noted to be segregated from the composite phase of Al-Al2O3 due to the poor wettability, thus forming the porous interface regions.
- (2)
- The possible galvanic coupling effect between Al matrix and Al2O3 reinforcement became dominant with the diffusion of chlorides (Cl−) or sulfates (SO4−2) through the available open sites, leading to aggressive pitting and dealuminization of Al2O3-reinforced Al MMC.
- (3)
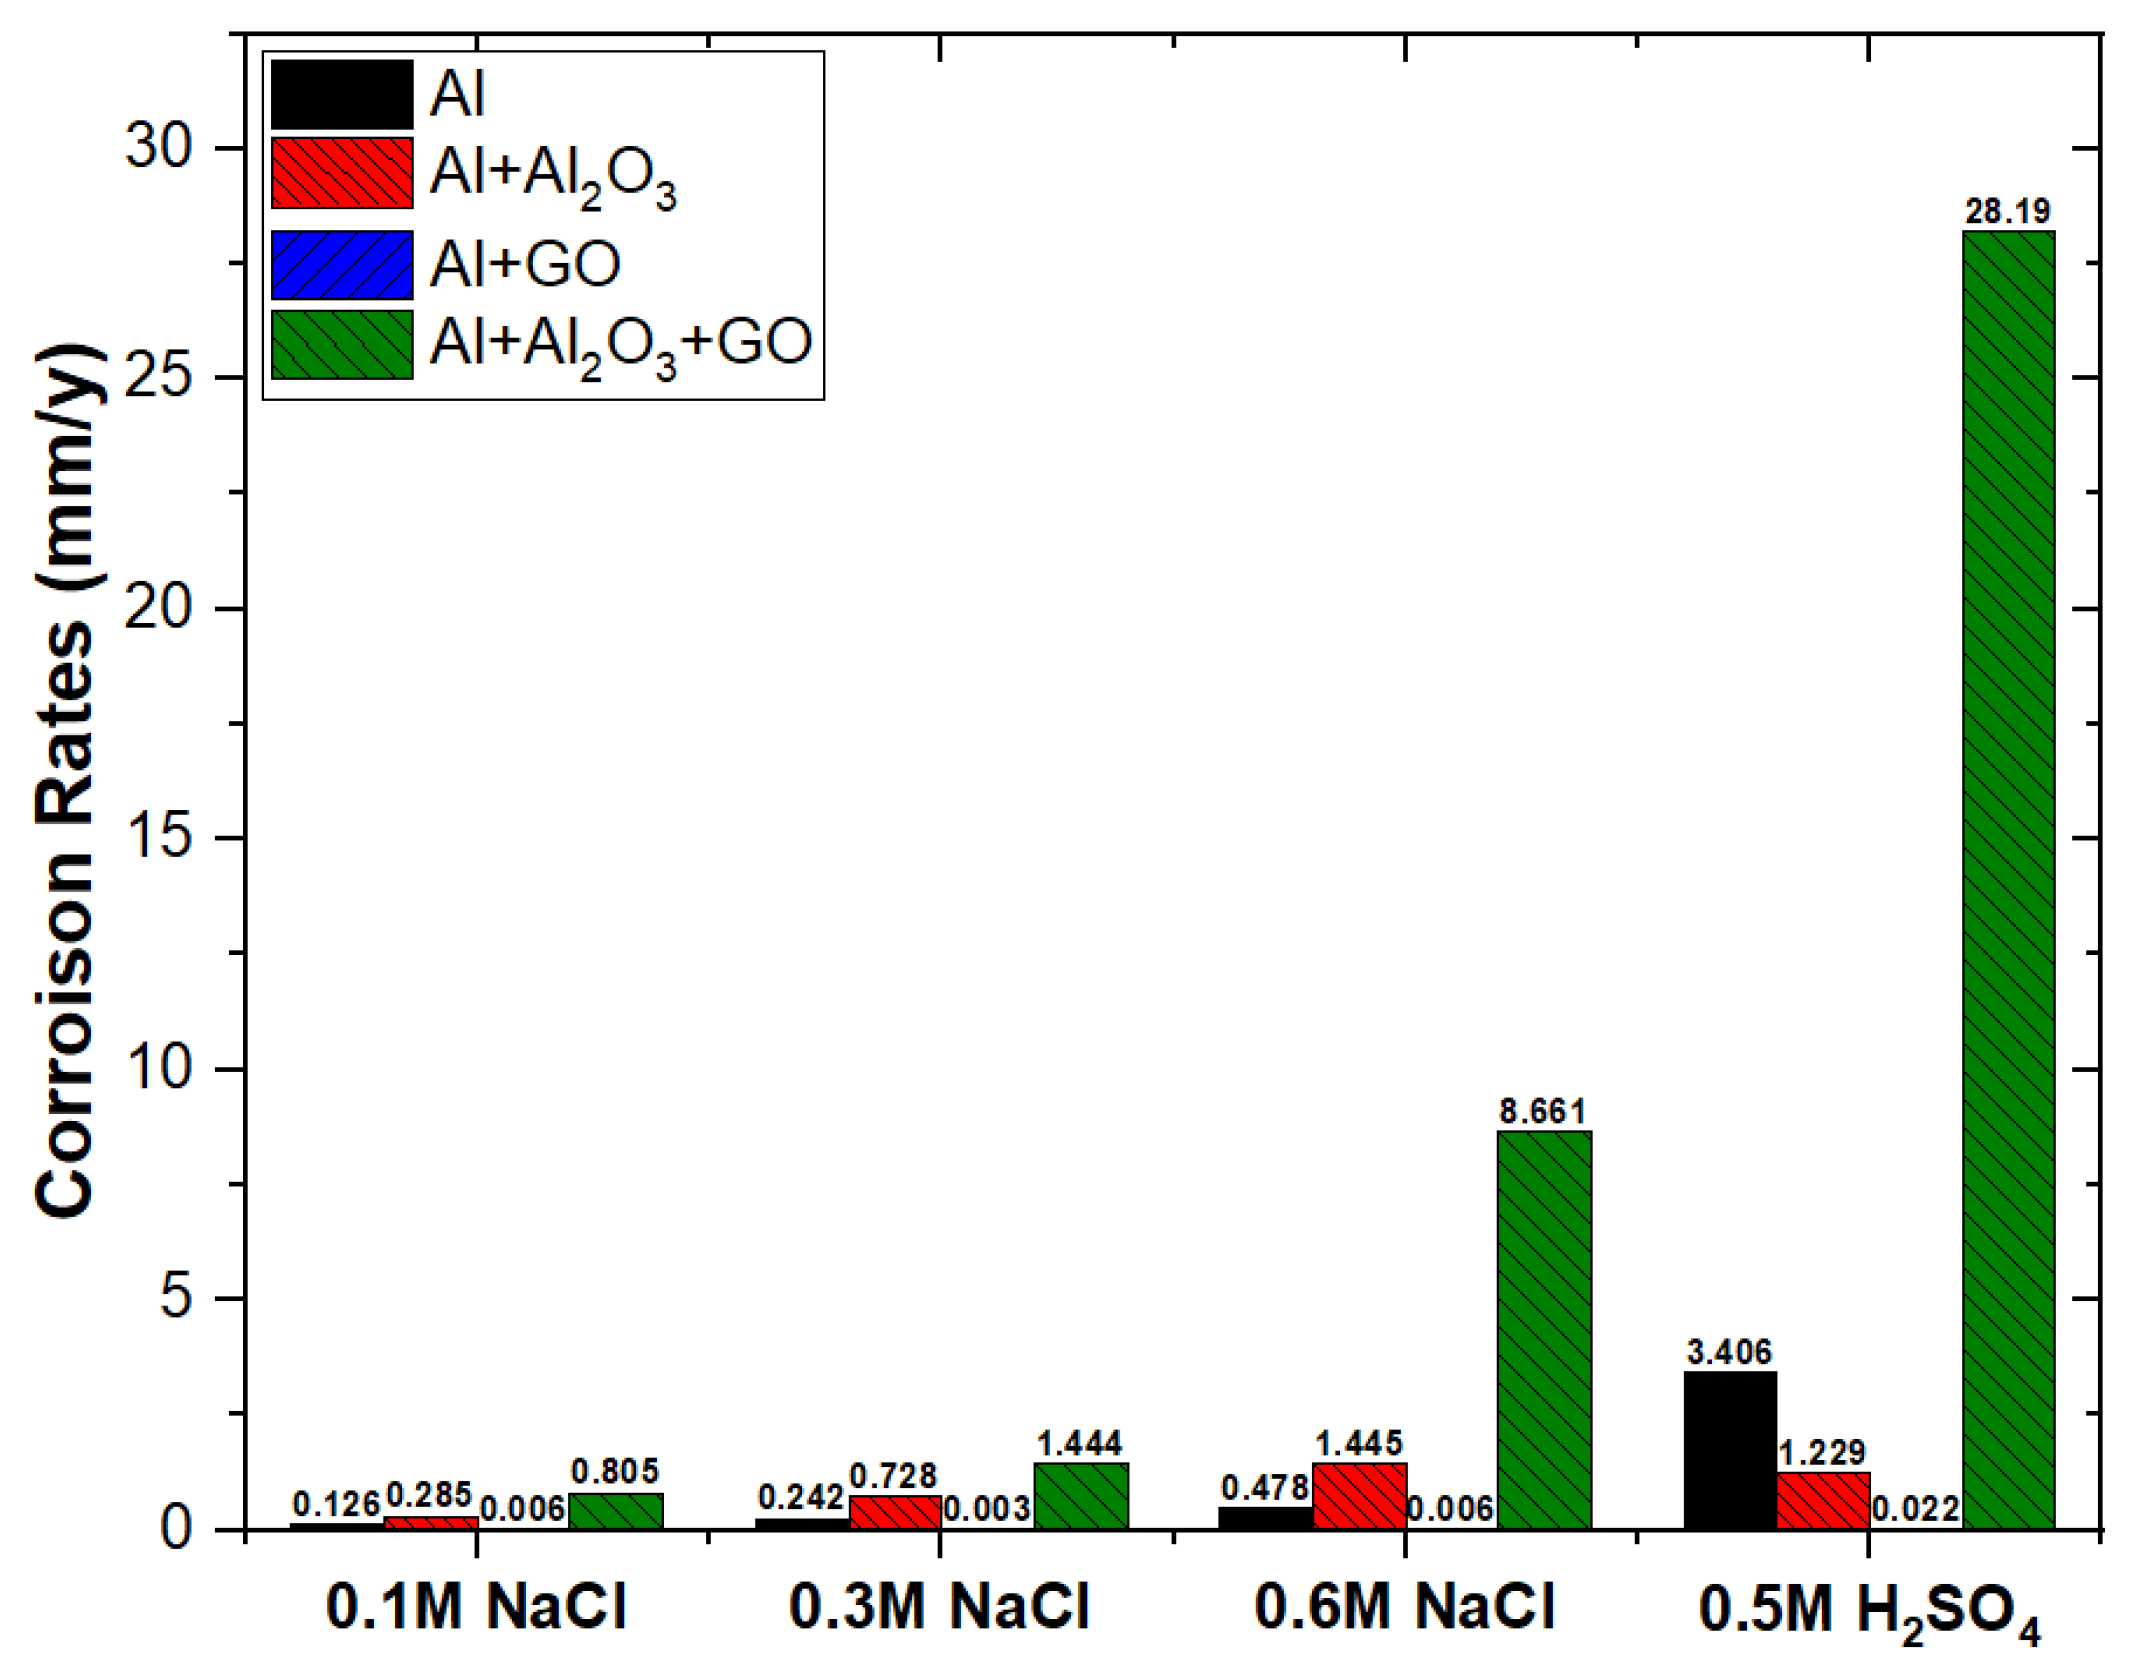
- Absence of a double layer and the formation of a very thin oxide film over Al2O3-reinforced nanocomposite provided low charge transfer resistance, and thus the corrosion rate in 0.6 M NaCl was increased from 0.48 to 1.45 mm/y.
- (4)
- Contrarily, reinforcement of just 0.25% graphene oxide (GO) in the Al matrix did not cause any agglomeration in between intergranular regions of the Al matrix. The honeycomb-like structure of GO blocked the open sites of the Al matrix by hindering the chloride (Cl−) or sulfate (SO4−2) diffusion, thus compelling them to take a long drive through the available pin-holes.
- (5)
- Significantly thickened double layer and oxide film formation over GO-reinforced Al MMC provided a robust charge transfer resistance, and thus, the corrosion rate in 0.6 M NaCl was decreased from 0.48 to 0.006 mm/y.
- (6)
- The combined reinforcement of Al2O3 and GO in the Al matrix (hybrid MMC) provided poor wettability in between the Al matrix and Al2O3-GO reinforcements thus, the formation of voids allowed the aggressive diffusion of corrosive species through the open sites, which results in an increased corrosion rate from 0.48 to 8.66 mm/y.
- (7)
- Electrochemical noise (EN) analysis revealed that highest and lowest pitting resistances were achieved for the Al-GO and Al-Al2O3-GO nanocomposites, respectively.
- (8)
- Optical profilometry results confirmed that GO-reinforced Al-MMC was found to be pitting resistant, unlike its counterparts, as the lowest surface roughness (Ra) of 0.5 um was observed for GO-reinforced Al-MMC.
Author Contributions
Funding
Data Availability Statement
Conflicts of Interest
References
- Chakrapani, P.; Suryakumari, T.S.A. Mechanical properties of aluminium metal matrix composites—A review. Mater. Today Proc. 2021, 45, 5960–5964. [Google Scholar] [CrossRef]
- Kar, A.; Sharma, A.; Kumar, S. A Critical Review on Recent Advancements in Aluminium-Based Metal Matrix Composites. Crystals 2024, 14, 412. [Google Scholar] [CrossRef]
- Prakash, S.; Suresh, P.; Sasikumar, R.; Suresha, B. Superior Mechanical Properties of Aluminium Matrix Composites Fabricated through Modified Matrix Encapsulated Feeding Method. Trans. Indian Inst. Met. 2024, 77, 707–716. [Google Scholar] [CrossRef]
- Fakrudeen, S.P.; Murthy, H.C.A.; Raju, V.B. Corrosion inhibition of AA6061 and AA6063 alloy in hydrochloric acid media by Schiff base compounds. J. Chil. Chem. Soc. 2012, 57, 1364–1370. [Google Scholar] [CrossRef]
- Seah, K.; Krishna, M.; Vijayalakshmi, V.; Uchil, J. Effects of temperature and reinforcement content on corrosion characteristics of LM13/albite composites. Corros. Sci. 2002, 44, 761–772. [Google Scholar] [CrossRef]
- Garg, P.; Gupta, P.; Kumar, D.; Parkash, O. Structural and mechanical properties of graphene reinforced aluminum matrix composites. J. Mater. Environ. Sci. 2016, 7, 1461–1473. [Google Scholar]
- Ghasali, E.; Sangpour, P.; Jam, A.; Rajaei, H.; Shirvanimoghaddam, K.; Ebadzadeh, T. Microwave and spark plasma sintering of carbon nanotube and graphene reinforced aluminum matrix composite. Arch. Civ. Mech. Eng. 2018, 18, 1042–1054. [Google Scholar] [CrossRef]
- Bian, Y.; Gao, T.; Liu, G.; Ma, X.; Ren, Y.; Liu, X. Design of an in–situ multi–scale particles reinforced (Al2O3+ZrB2+AlN)/Al composite with high strength, elasticity modulus and thermal stability. Mater. Sci. Eng. A 2020, 775, 138983. [Google Scholar] [CrossRef]
- El-Kady, O.; Fathy, A. Effect of SiC particle size on the physical and mechanical properties of extruded Al matrix nanocomposites. Mater. Des. 2014, 54, 348–353. [Google Scholar] [CrossRef]
- Saberi, Y.; Zebarjad, S.; Akbari, G. On the role of nano-size SiC on lattice strain and grain size of Al/SiC nanocomposite. J. Alloys Compd. 2009, 484, 637–640. [Google Scholar] [CrossRef]
- Baghel, A.S.; Tiwari, A.; Rana, R.S.; Warudkar, V. A Short Review on Effect of Heat Treatment on Microstructure and Mechanical Properties of ADC12/SiC Metal Matrix Composite. Appl. Mech. Mater. 2015, 813–814, 3–8. [Google Scholar] [CrossRef]
- Prabu, S.B.; Karunamoorthy, L.; Kathiresan, S.; Mohan, B. Influence of stirring speed and stirring time on distribution of particles in cast metal matrix composite. J. Mater. Process. Technol. 2006, 171, 268–273. [Google Scholar] [CrossRef]
- Baradeswaran, A.; Perumal, A.E. Study on mechanical and wear properties of Al 7075/Al2O3/graphite hybrid composites. Compos. Part B Eng. 2014, 56, 464–471. [Google Scholar] [CrossRef]
- Song, M. Effects of volume fraction of SiC particles on mechanical properties of SiC/Al composites. Trans. Nonferrous Met. Soc. China 2009, 19, 1400–1404. [Google Scholar] [CrossRef]
- Ozben, T.; Kilickap, E.; Çakır, O. Investigation of mechanical and machinability properties of SiC particle reinforced Al-MMC. J. Mater. Process. Technol. 2008, 198, 220–225. [Google Scholar] [CrossRef]
- Tham, L.; Gupta, M.; Cheng, L. Effect of limited matrix–reinforcement interfacial reaction on enhancing the mechanical properties of aluminium-silicon carbide composites. Acta Mater. 2001, 49, 3243–3253. [Google Scholar] [CrossRef]
- Zakaria, H. Microstructural and corrosion behavior of Al/SiC metal matrix composites. Ain Shams Eng. J. 2014, 5, 831–838. [Google Scholar] [CrossRef]
- Ahmad, Z.; Farzaneh, A.; Abdul Aleem, B.J. Corrosion Behavior of Aluminium Metal Matrix Composite. In Recent Trends in Processing and Degradation of Aluminium Alloys; IntechOpen: London, UK, 2011. [Google Scholar] [CrossRef]
- Bodunrin, M.O.; Alaneme, K.K.; Chown, L.H. Aluminium matrix hybrid composites: A review of reinforcement philosophies; mechanical, corrosion and tribological characteristics. J. Mater. Res. Technol. 2015, 4, 434–445. [Google Scholar] [CrossRef]
- Alaneme, K.K.; Bodunrin, M.O. Corrosion Behavior of Alumina Reinforced Aluminium (6063) Metal Matrix Composites. J. Miner. Mater. Charact. Eng. 2011, 10, 1153–1165. [Google Scholar] [CrossRef]
- Nanjan, S.; Muralia, J.G. Analysing the Mechanical Properties and Corrosion Phenomenon of Reinforced Metal Matrix Composite. Mater. Res. 2020, 23, 2. [Google Scholar] [CrossRef]
- Kargul, M.; Borowiecka-Jamrozek, J.; Konieczny, M. The effect of reinforcement particle size on the properties of Cu-Al2O3 composites. IOP Conf. Ser. Mater. Sci. Eng. 2018, 461, 012035. [Google Scholar] [CrossRef]
- Kumar, N.; Chittappa, H.C.; Ezhil Vannan, S. Development of Aluminium-Nickel Coated Short Carbon Fiber Metal Matrix Composites. Mater. Today Proc. 2018, 5, 11336–11345. [Google Scholar] [CrossRef]
- Wang, S.; Zhang, Y.; Sun, P.; Cui, Y.; Wu, G. Microstructure and Flexural Properties of Z-Pinned Carbon Fiber-Reinforced Aluminum Matrix Composites. Materials 2019, 12, 174. [Google Scholar] [CrossRef] [PubMed]
- Sharma, P.; Sharma, S.; Khanduja, D. Effect of graphite reinforcement on physical and mechanical properties of aluminum metal matrix composites. Part. Sci. Technol. 2016, 34, 17–22. [Google Scholar] [CrossRef]
- Schrecengost, T.R.; Shaw, B.A.; Wendt, R.G.; Moshier, W.C. Nonequilibrium Alloying of Graphite-Reinforced Aluminum Metal Matrix Composites. Corrosion 1993, 49, 842–849. [Google Scholar] [CrossRef]
- Jagannatham, M.; Chandran, P.; Sankaran, S.; Haridoss, P.; Nayan, N.; Bakshi, S.R. Tensile properties of carbon nanotubes reinforced aluminum matrix composites: A review. Carbon 2020, 160, 14–44. [Google Scholar] [CrossRef]
- Sridhar, I.; Narayanan, K.R. Processing and characterization of MWCNT reinforced aluminum matrix composites. J. Mater. Sci. 2009, 44, 1750–1756. [Google Scholar] [CrossRef]
- Munir, K.; Wen, C.; Li, Y. Graphene nanoplatelets-reinforced magnesium metal matrix nanocomposites with superior mechanical and corrosion performance for biomedical applications. J. Magnes. Alloys 2020, 8, 269–290. [Google Scholar] [CrossRef]
- Seyed Pourmand, N.; Asgharzadeh, H. Aluminum Matrix Composites Reinforced with Graphene: A Review on Production, Microstructure, and Properties. Crit. Rev. Solid State Mater. Sci. 2020, 45, 289–337. [Google Scholar] [CrossRef]
- Lian, W.; Mai, Y.; Wang, J.; Zhang, L.; Liu, C.; Jie, X. Fabrication of graphene oxide-Ti3AlC2 synergistically reinforced copper matrix composites with enhanced tribological performance. Ceram. Int. 2019, 45, 18592–18598. [Google Scholar] [CrossRef]
- Dasari, B.L.; Morshed, M.; Nouri, J.M.; Brabazon, D.; Naher, S. Mechanical properties of graphene oxide reinforced aluminium matrix composites. Compos. Part B Eng. 2018, 145, 136–144. [Google Scholar] [CrossRef]
- Wang, J.; Li, Z.; Fan, G.; Pan, H.; Chen, Z.; Zhang, D. Reinforcement with graphene nanosheets in aluminum matrix composites. Scr. Mater. 2012, 66, 594–597. [Google Scholar] [CrossRef]
- Bartolucci, S.F.; Paras, J.; Rafiee, M.A.; Rafiee, J.; Lee, S.; Kapoor, D.; Koratkar, N. Graphene–aluminum nanocomposites. Mater. Sci. Eng. A 2011, 528, 7933–7937. [Google Scholar] [CrossRef]
- Sreeprasad, T.S.; Maliyekkal, S.M.; Lisha, K.P.; Pradeep, T. Reduced graphene oxide–metal/metal oxide composites: Facile synthesis and application in water purification. J. Hazard. Mater. 2011, 186, 921–931. [Google Scholar] [CrossRef] [PubMed]
- Li, Z.; Guo, Q.; Li, Z.; Fan, G.; Xiong, D.-B.; Su, Y.; Zhang, J.; Zhang, D. Enhanced Mechanical Properties of Graphene (Reduced Graphene Oxide)/Aluminum Composites with a Bioinspired Nanolaminated Structure. Nano Lett. 2015, 15, 8077–8083. [Google Scholar] [CrossRef] [PubMed]
- Gao, X.; Yue, H.; Guo, E.; Zhang, H.; Lin, X.; Yao, L.; Wang, B. Preparation and tensile properties of homogeneously dispersed graphene reinforced aluminum matrix composites. Mater. Des. 2016, 94, 54–60. [Google Scholar] [CrossRef]
- Zhang, H.; Xu, C.; Xiao, W.; Ameyama, K.; Ma, C. Enhanced mechanical properties of Al5083 alloy with graphene nanoplates prepared by ball milling and hot extrusion. Mater. Sci. Eng. A 2016, 658, 8–15. [Google Scholar] [CrossRef]
- Ahmad, K.; Pan, W. Hybrid nanocomposites: A new route towards tougher alumina ceramics. Compos. Sci. Technol. 2008, 68, 1321–1327. [Google Scholar] [CrossRef]
- Wang, Y.; Monetta, T. Systematic study of preparation technology, microstructure characteristics and mechanical behaviors for SiC particle-reinforced metal matrix composites. J. Mater. Res. Technol. 2023, 25, 7470–7497. [Google Scholar] [CrossRef]
- Rajmohan, T.; Palanikumar, K.; Ranganathan, S. Evaluation of mechanical and wear properties of hybrid aluminium matrix composites. Trans. Nonferrous Met. Soc. China 2013, 23, 2509–2517. [Google Scholar] [CrossRef]
- Ravindran, P.; Manisekar, K.; Rathika, P.; Narayanasamy, P. Tribological properties of powder metallurgy—Processed aluminium self lubricating hybrid composites with SiC additions. Mater. Des. 2013, 45, 561–570. [Google Scholar] [CrossRef]
- Mohammed, A.S.; Aljebreen, O.S.; Hakeem, A.S.; Laoui, T.; Patel, F.; Ali Baig, M.M. Tribological Behavior of Aluminum Hybrid Nanocomposites Reinforced with Alumina and Graphene Oxide. Materials 2022, 15, 865. [Google Scholar] [CrossRef] [PubMed]
- Adib, M.H.; Abedinzadeh, R. Study of mechanical properties and wear behavior of hybrid Al/(Al2O3+SiC) nanocomposites fabricated by powder technology. Mater. Chem. Phys. 2023, 305, 127922. [Google Scholar] [CrossRef]
- Petrović, J.; Mladenović, S.; Marković, I.; Dimitrijević, S. Characterization of hybrid aluminum composites reinforced with Al2O3 particles and walnut-shell ash. Mater. Technol. 2022, 56, 115–122. [Google Scholar] [CrossRef]
- Ravikumar, M.; Reddappa, H.; Suresh, R.; Reddy, M.S.; Babu, E.R.; Reddy, N.C.; Ravikumar, C.; Murthy, H.A. Evaluation of Corrosion Properties of Al2O3 and SiC Reinforced Aluminium Metal Matrix Composites Using Taguchi’s Techniques. J. Sci. Res. 2021, 65, 253–259. [Google Scholar] [CrossRef]
- Siddesh Kumar, N.M.; Sadashiva, M.; Monica, J.; Praveen Kumar, S. Investigation on Corrosion Behaviour of Hybrid Aluminium Metal Matrix Composite Welded by Friction Stir Welding. Mater. Today Proc. 2022, 52, 2339–2344. [Google Scholar] [CrossRef]
- Zasadzińska, M.; Strzępek, P.; Mamala, A.; Noga, P. Reinforcement of Aluminium-Matrix Composites with Glass Fibre by Metallurgical Synthesis. Materials 2020, 13, 5441. [Google Scholar] [CrossRef]
- Gupta, M.K. Mechanical behaviors of Al 6063/TiB2 composites fabricated by stir casting process. Mater. Today Proc. 2023, 82, 222–226. [Google Scholar] [CrossRef]
- Licheri, R.; Mario, A.; Cincotti, A.; Cao, G.; Orru, R. Consolidation/synthesis of materials by electric current activated/assisted sintering. Mater. Sci. Eng. R Rep. 2009, 63, 127–287. [Google Scholar] [CrossRef]
- Mohammed, A.S.; Alahmari, T.S.; Laoui, T.; Hakeem, A.S.; Patel, F. Mechanical and Thermal Evaluation of Aluminum Hybrid Nanocomposite Reinforced with Alumina and Graphene Oxide. Nanomaterials 2021, 11, 1225. [Google Scholar] [CrossRef]
- Md Ali, A.; Omar, M.Z.; Hashim, H.; Salleh, M.S.; Mohamed, I.F. Recent development in graphene-reinforced aluminium matrix composite: A review. Rev. Adv. Mater. Sci. 2021, 60, 801–817. [Google Scholar] [CrossRef]
- Dudina, D.V.; Georgarakis, K.; Olevsky, E.A. Progress in aluminium and magnesium matrix composites obtained by spark plasma, microwave and induction sintering. Int. Mater. Rev. 2022, 68, 225–246. [Google Scholar] [CrossRef]
- Murthy, B.V.; Auradi, V.; Nagaral, M.; Vatnalmath, M.; Namdev, N.; Anjinappa, C.; Patil, S.; Razak, A.; Alsabhan, A.H.; Alam, S.; et al. Al2014–Alumina Aerospace Composites: Particle Size Impacts on Microstructure, Mechanical, Fractography, and Wear Characteristics. ACS Omega 2023, 8, 13444–13455. [Google Scholar] [CrossRef] [PubMed]
- Kim, E.; Kim, D.; Kwak, K.; Nagata, Y.; Bonn, M.; Cho, M. Wettability of graphene, water contact angle, and interfacial water structure. Chem 2022, 8, 1187–1200. [Google Scholar] [CrossRef]
- Khan, M.F.; Kumar, A.M.; Ul-Hamid, A.; Al-Hems, L.M. Achieving non-adsorptive anodized film on Al-2024 alloy: Surface and electrochemical corrosion investigation. Surf. Interfaces 2019, 15, 78–88. [Google Scholar] [CrossRef]
- Brug, G.J.; Van Den Eeden, A.L.G.; Sluyters-Rehbach, M.; Sluyters, J.H. The analysis of electrode impedances complicated by the presence of a constant phase element. J. Electroanal. Chem. Interfacial Electrochem. 1984, 176, 275–295. [Google Scholar] [CrossRef]
- Hsu, C.H.; Mansfeld, F. Concerning the Conversion of the Constant Phase Element Parameter Y0 into a Capacitance. Corrosion 2001, 57, 747–748. [Google Scholar] [CrossRef]
- Chen, X.; Tian, W.; Li, S.; Yu, M.; Liu, J. Effect of temperature on corrosion behavior of 3003 aluminum alloy in ethylene glycol–water solution. Chin. J. Aeronaut. 2016, 29, 1142–1150. [Google Scholar] [CrossRef]
- Pardo, A.; Merino, M.C.; Merino, S.; Viejo, F.; Carboneras, M.; Arrabal, R. Influence of reinforcement proportion and matrix composition on pitting corrosion behaviour of cast aluminium matrix composites (A3xx.x/SiCp). Corros. Sci. 2005, 47, 1750–1764. [Google Scholar] [CrossRef]
- Berkeley, D.W.; Sallam, H.E.M.; Nayeb-Hashemi, H. The effect of pH on the mechanism of corrosion and stress corrosion and degradation of mechanical properties of AA6061 and Nextel 440 fiber-reinforced AA6061 composite. Corros. Sci. 1998, 40, 141–153. [Google Scholar] [CrossRef]
- Winkler, S.L.; Flower, H.M. Stress corrosion cracking of cast 7XXX aluminium fibre reinforced composites. Corros. Sci. 2004, 46, 903–915. [Google Scholar] [CrossRef]
- Hatel, R.; El Majdoub, S.; Bakour, A.; Khenfouch, M.; Baitoul, M. Graphene oxide/Fe3O4 nanorods composite: Structural and Raman investigation. J. Phys. Conf. 2018, 1081, 012006. [Google Scholar] [CrossRef]


| Material | Speed (RPM) | BPR | Mixing Time (h) | PCA | Atmosphere |
|---|---|---|---|---|---|
| Al-10V% Al2O3 | 200 | 10:1 | 24 | Ethanol | Argon |
| Al-0.25wt% GO | 200 | 10:1 | 24 | Ethanol | Argon |
| Al-10V% Al2O3-0.25wt% GO | 200 | 10:1 | 48 | Ethanol | Argon |
| Specimen | Rsoln (Ω.cm2) | Rct (Ω.cm2) | Rpo (Ω.cm2) | Dbl Layer Capacitance (µF/cm2) | Dbl Layer Thickness (δ = nm) | Film Capacitance (µF/cm2) | Film Thickness (δ = nm) | W (S×s1/2) |
|---|---|---|---|---|---|---|---|---|
| Al | 7.6 | 1.82 × 10⁵ | 1.76 × 10⁴ | 7.1 × 101 | 11.27 | 3.64 × 101 | 21.85 | - |
| Al + Al2O3 | 8.9 | 3.68 × 10⁴ | 1.31 × 10⁴ | 1.6 × 10³ | 0.51 | 5.94 × 101 | 13.42 | - |
| Al + GO | 5.4 | 4.74E × 106 | 5.46 × 10⁴ | 3.1 × 101 | 25.81 | 8.65 × 100 | 92.11 | 2.91 × 10⁻⁶ |
| Al + Al2O3 + GO | 6.6 | 6.16E × 103 | 1.02 × 10³ | 4.1 × 10³ | 0.19 | 1.28 × 10² | 6.23 | - |
| Specimen | Rsoln (Ω.cm2) | Rct (Ω.cm2) | Rpo (Ω.cm2) | Dbl Layer Capacitance (µF/cm2) | Dbl Layer Thickness (δ = nm) | Film Capacitance (µF/cm2) | Film Thickness (δ = nm) | W (S×s1/2) |
|---|---|---|---|---|---|---|---|---|
| Al | 7.2 | 1.02 × 10⁵ | 1.16 × 10⁴ | 1.5 × 10² | 5.20 | 5.76 × 101 | 13.83 | - |
| Al + Al2O3 | 8.1 | 2.28 × 10⁴ | 5.22 × 10³ | 2.5 × 10³ | 0.32 | 1.55 × 10² | 5.13 | - |
| Al + GO | 4.5 | 2.58 × 10⁶ | 5.19 × 10⁴ | 4.7 × 101 | 16.89 | 2.04 × 101 | 39.06 | 2.69 × 10⁻⁶ |
| Al + Al2O3 + GO | 8.5 | 2.67 × 10⁴ | 7.40 × 10² | 5.9 × 10³ | 0.13 | 2.90 × 10² | 2.74 | - |
| Specimen | Rsoln (Ω.cm2) | Rct (Ω.cm2) | Rpo (Ω.cm2) | Dbl Layer Capacitance (µF/cm2) | Dbl Layer Thickness (δ = nm) | Film Capacitance (µF/cm2) | Film Thickness (δ = nm) | W (S×s1/2) |
|---|---|---|---|---|---|---|---|---|
| Al | 4.3 | 9.95 × 10⁴ | 1.35 × 10⁴ | 2.8 × 10² | 2.85 | 9.04 × 101 | 8.81 | |
| Al + Al2O3 | 8.6 | 9.86 × 10³ | 5.80 × 10² | 4.4 × 10³ | 0.18 | 2.04 × 10² | 3.91 | - |
| Al + GO | 6.7 | 1.90 × 10⁶ | 3.87 × 10⁴ | 5.5 × 101 | 14.40 | 3.57 × 101 | 22.30 | 3.67 × 10⁻⁶ |
| Al + Al2O3 + GO | 6.9 | 5.83 × 10³ | 1.15 × 10³ | 7.2 × 10³ | 0.11 | 4.47 × 101 | 17.81 | - |
| Specimen | Rsoln (Ω.cm2) | Rct (Ω.cm2) | Rpo (Ω.cm2) | Dbl Layer Capacitance (µF/cm2) | Dbl Layer Thickness (δ = nm) | Film Capacitance (µF/cm2) | Film Thickness (δ = nm) | W (S×s1/2) | L (H) |
|---|---|---|---|---|---|---|---|---|---|
| Al | 5.3 | 2.41 × 10³ | 3.13 × 10² | 2.0 × 10² | 3.93 | 3.55 × 101 | 22.47 | - | 567.7 |
| Al + Al2O3 | 8.2 | 3.38 × 10³ | 7.86 × 10² | 3.7 × 10² | 2.17 | 1.12 × 10² | 7.14 | 6.37 × 10⁻³ | - |
| Al + GO | 9.1 | 3.11 × 10⁶ | 1.11 × 10⁵ | 4.3 × 101 | 18.70 | 1.00 × 101 | 79.50 | 6.47 × 10⁻⁶ | - |
| Al + Al2O3 + GO | 9.7 | 8.09 × 10² | 1.25 × 10³ | 3.6 × 10² | 2.20 | 2.33 × 10² | 3.42 | - | 102.4 |
| Potential (V) | Fourier Transformation | ||||||
| Sample | Mean | RMS | Skewness | Kurtosis | Resistance (Ω.cm2) | Slope (m) | y-Intercept |
| Al | −2.9 × 10⁻² | 5.2 × 10⁻² | −5.1 × 10⁻¹ | −1.7 × 100 | 2.8 × 10³ | −1.1 × 100 | −1.3 × 100 |
| Al + Al2O3 | 3.4 × 10⁻¹ | 4.1 × 10⁻¹ | −4.8 × 10⁻¹ | −1.8 × 100 | 2.4 × 10² | −3.2 × 10⁻¹ | −1.3 × 100 |
| Al + GO | −1.4 × 10⁻¹ | 2.2 × 10⁻¹ | −2.1 × 10⁻¹ | −1.9 × 100 | 9.7 × 10⁸ | −4.4 × 10⁻¹ | −1.3 × 100 |
| Al + Al2O3 + GO | −7.0 × 10⁻¹ | 7.0 × 10⁻¹ | 1.5 × 10⁻² | −1.1 × 100 | 4.6 × 10⁻² | −2.4 × 100 | −3.4 × 100 |
| Current (A/cm2) | Fourier Transformation | ||||||
| Sample | Mean | RMS | Skewness | Kurtosis | Resistance (Ω.cm2) | Slope (m) | y-Intercept |
| Al | 1.2 × 10⁻⁵ | 2.0 × 10⁻⁵ | 5.2 × 10⁻¹ | −1.7 × 100 | 2.8 × 10³ | −4.5 × 100 | −1.3 × 100 |
| Al + Al2O3 | 7.5 × 10⁻⁴ | 1.2 × 10⁻³ | 5.0 × 10⁻¹ | −1.7 × 100 | 2.4 × 10² | −2.7 × 100 | −1.3 × 100 |
| Al + GO | 3.6 × 10⁻¹⁰ | 4.0 × 10⁻¹⁰ | −2.1 × 10⁻¹ | −1.9 × 100 | 9.7 × 10⁸ | −9.4 × 100 | −1.3 × 100 |
| Al + Al2O3 + GO | 6.1 × 10⁻⁴ | 6.1 × 10⁻⁴ | −3.8 × 10⁻¹ | −1.6 × 100 | 4.6 × 10⁻² | −4.2 × 100 | −1.8 × 100 |
Disclaimer/Publisher’s Note: The statements, opinions and data contained in all publications are solely those of the individual author(s) and contributor(s) and not of MDPI and/or the editor(s). MDPI and/or the editor(s) disclaim responsibility for any injury to people or property resulting from any ideas, methods, instructions or products referred to in the content. |
© 2024 by the authors. Licensee MDPI, Basel, Switzerland. This article is an open access article distributed under the terms and conditions of the Creative Commons Attribution (CC BY) license (https://creativecommons.org/licenses/by/4.0/).
Share and Cite
Khan, M.F.; Mohammed, A.S.; Toor, I.-u.-H. A Comprehensive Evaluation of Electrochemical Performance of Aluminum Hybrid Nanocomposites Reinforced with Alumina (Al2O3) and Graphene Oxide (GO). Metals 2024, 14, 1057. https://doi.org/10.3390/met14091057
Khan MF, Mohammed AS, Toor I-u-H. A Comprehensive Evaluation of Electrochemical Performance of Aluminum Hybrid Nanocomposites Reinforced with Alumina (Al2O3) and Graphene Oxide (GO). Metals. 2024; 14(9):1057. https://doi.org/10.3390/met14091057
Chicago/Turabian StyleKhan, Muhammad Faizan, Abdul Samad Mohammed, and Ihsan-ul-Haq Toor. 2024. "A Comprehensive Evaluation of Electrochemical Performance of Aluminum Hybrid Nanocomposites Reinforced with Alumina (Al2O3) and Graphene Oxide (GO)" Metals 14, no. 9: 1057. https://doi.org/10.3390/met14091057