Abstract
AISI 316L austenitic stainless steel is utilized in various processing industries, due to its abrasion resistance, corrosion resistance, and excellent properties over a wide temperature range. The physical and mechanical properties of a material change during the manufacturing process and plastic deformation, e.g., bending. During the combined tensile and bending loading of a structural component, the stress state changes due to the residual stresses and the loading range. To characterize the component’s stress state, the billet was bent to induce residual stress, but a phase transformation to martensite also occurred. The bent billet was subjected to combined tensile–bending and fatigue loading. The experimentally measured the load vs. displacement of the bent billet was compared with the numerical simulations. The results showed that during fatigue loading of the bent billet, both the initial stress state at the critical point and the stress state during the dynamic loading itself must be considered. Analysis was demonstrated only for one single critical point on the surface of the bent billet. The residual stresses due to the phase transformation of austenite to martensite affected the range and ratio of stress. The model for the stress–strain behaviour of the material was established by comparing the experimentally and numerically obtained load vs. displacement curves. Based on the description of the stress–strain behaviour of the pre-deformed material, guidelines have been provided for reducing residual tensile stresses in pre-deformed structural components.
1. Introduction
Modern materials in the automotive industry require a high load-bearing capacity, which enables weight reduction and thus lowers fuel consumption [1]. Also, these materials must have good deformation capabilities and high strength, and thus resistance to the formation and growth of fatigue cracks [2,3,4]. Since, due to the need to change the shape, the material must be cold-formed, residual stresses are generated in the transformation zone, which are also the result of the phase transformation of metastable austenite into martensite, which was reported by Chanani et al. [5]. As a result of residual stresses, the amplitude of stress changes, as well as the load ratio, which can deviate significantly from the design-planned load of the component. Knowledge of the actual load conditions is decisive for determining the service life of the constructed component. The article presents a model for determining the actual amplitude of stress and the actual loading ratio, based on the numerical simulation and experimental testing of pre-deformed components with combined tensile–bending loading.
The objective of this work was to establish a procedure for determination of the opening range of stress, based on numerical simulations and the experimentally measured force and displacement in the elastic–plastic loading regime of metastable austenitic steel.
The different magnitudes of strain governed different martensite fractions, especially in the case of the bent billet, where the compression–tension strain gradient played a significant role in the martensitic transformation. A model for such a case is given, based on the experimental and numerical results, from which the range of load and stress can be determined. The description of the stress–strain behaviour of pre-deformed material under combined tensile–bending fatigue loading provides guidelines for reducing residual tensile stresses in pre-deformed structural components.
2. Experimental Procedures
2.1. Material AISI 316L and Tensile Test
The article is about AISI 316L steel with a high corrosion resistance, which is used to manufacture pressure vessels in the pharmaceutical industry It is highly corrosion-resistant steel, because it forms a thin chromium-rich passive surface film. The chemical analysis of AISI 316L is C ≤ 0.03%, Si ≤ 1%, Mn ≤ 2%, Cr = 16.5%, Mo = 2% Ni = 11% Ni, P < 0.035%, and N < 0.09%. Metastable austenite stainless steel AISI 316L (W. Nr. 1.4404) is applied in the automotive industry, also including in areas requiring abrasion resistance, ductility, non-magnetic properties, and low thermal conductivity, such as pressure vessels and heat exchangers.
Austenitic stainless steels are metastable, due to the change in the microstructure from austenite to martensite. The degree of martensite induction is dependent on the temperature, the chemical composition of the material, the type of plastic deformation (tensile, bending, buckling, or a combination), and the grains’ size and orientation. However, other authors [6,7] have concluded that martensite is due mainly to plastic deformation at room temperature. The deformation process induces the transformation of austenite γ into two types of martensitic microstructures [8,9], namely martensite ε, with a hexagonal close-packed phase, and martensite α, with a body-centred cubic structure. Martensite ε is only the intermediate stage and it is present in negligible amounts, and it transforms almost completely to martensite α. A body-centred cubic structure is a structure with a high strength body which produces residual stresses due to its higher hardness and higher volume than an austenite face-centred cubic structure. This fact is significant for determining the stress state in the deformed component during fatigue loading, as the mechanical properties are changed from the component’s initial state [10].
The fatigue limits of a material depend on factors such as the mechanical properties, temperature, applied stress, stress ratio, corrosion, notching, surface finish, and type of loading [11,12,13,14]. In a metastable austenite stainless steel, the type of loading and plastic deformation correlates with the various levels of austenite to martensite phase transformation. Therefore, different types of loading induce different magnitudes of strain, governed by different martensite fractions and stress–strain states [6].
2.2. Tensile Test
The tensile mechanical properties were obtained by tensile testing in accordance with Standard DIN 50125 at room temperature and corresponding to the general mechanical properties of AISI 316L austenitic stainless steel. Tensile probes with a round diameter of Ø3.8 mm were prepared from commercial sheet material in an annealed condition [15]. The tensile span distance was 5 times the diameter of the specimen. The stress–strain curve was plotted as an engineering tensile curve and a true stress–strain curve, as shown in Figure 1. The engineering obtained yield values were Rp0,2 = 365 ± 8 MPa, tensile strength Rm = 680 ± 4 MPa, Young’s modulus E = 185 ± 3 GPa, and Poisson = 0.3. Figure 1 shows an engineering curve with decreasing stress; however, the specimen was not broken at the last measurement point. The true stress–strain curve was calculated from the engineering stress (R) and strain (e) by using Equations (1) and (2) [15,16] until the ultimate tensile strength Rm could not be obtained.
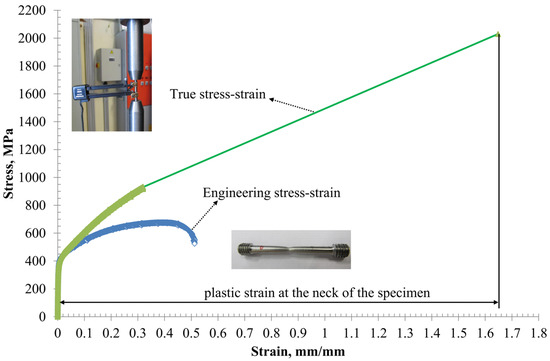
Figure 1.
Experimentally obtained engineering and true stress–strain curves.
The point of maximum strain for the round tensile specimen was calculated using Equation (3)
where d0 is the initial diameter of the specimens and da is the smallest diameter of the specimen at the neck of the specimen’s failure. The true stress value at Rm was extrapolated linearly to the maximum values of true stress σA and εA, where σA was calculated by
where da is the smallest diameter of the specimen, and Fa is the measured load at the failure point of the experiment.
2.3. Bending of the Billet
To develop the model stress–strain behaviour of material and evaluate residual stresses, the bending process was considered to be a strain-controlled process of 3-point bending with a bending range of 10 mm, as shown in Figure 2a. The billet for bending was prepared from a commercial sheet according to EN 10028-7 in the annealed condition, the same as in the tensile test. The dimensions of the billet are shown in Figure 2b. The bending diameter of the piston was 5 mm. Bending was performed at room temperature (T = +23.5 °C) by stroke control at 5 mm/min, until the required deflection range of 10 mm was achieved, as shown in Figure 3. During the bending loading, the load vs. stroke curve was recorded, as shown in Figure 4. At a compression force Fmax of 24.2 kN, marked as Point A in Figure 4, the maximum total deflection (elastic and plastic) was 10 mm, and the yield strength of the material was exceeded, resulting in permanent deformation of the bending billet. The material’s maximum resistance against bending was not exceeded, indicating that the force did not decrease with increasing displacement. The holes in Figure 2b were prepared before bending in order to make it possible to fix the bent billet to the apparatus for combined loading.
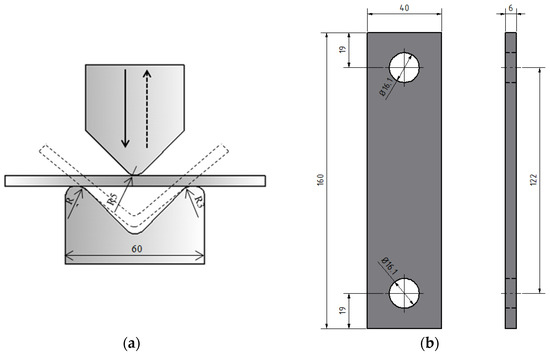
Figure 2.
Procedure of the bending process (a) and dimensions of the bending billet (b).
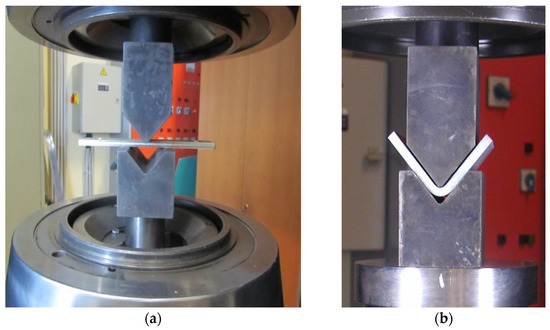
Figure 3.
Apparatus for bending the billet at the start of bending (a) and end of bending (b).
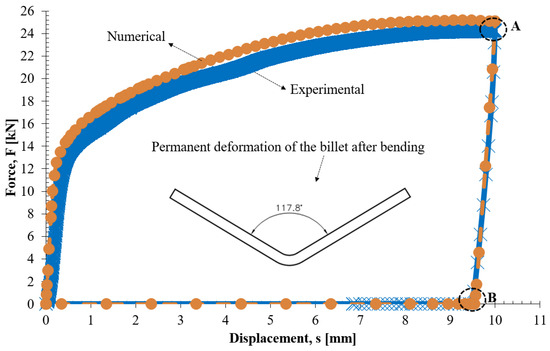
Figure 4.
Force displacement loop during the 10 mm bending process, experimental and numerical.
2.4. Cyclic Loading of the Bent Billet
The bent billets were subjected to combined tensile and bending loading by using a single-axis INSTRON 1255 servo-hydraulic machine (INSTRON Ltd., High Wycombe, Buckinghamshire, UK), as shown in Figure 5. The single-axial force generated by the Instron actuator in the two freely rotating pins was decomposed into the tensile and bending force components. The separation of the tensile and bending force components considered the actual distances and angles between the force grip and the critical bent section of the specimen, as shown in Figure 5. The change in the angles and distances between the start and end of fatigue loading was reflected by the change in the distance between the pins of the single-axis load.
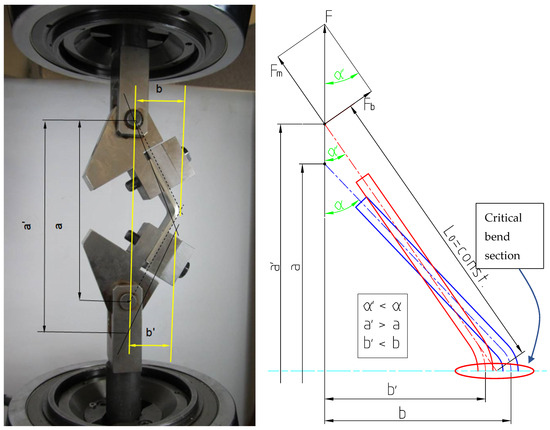
Figure 5.
Apparatus for combined loading of the bent billet with the distribution of forces and displacements.
The total stress applied to the bent billet was obtained by superposition of the membrane and bending stress. Similar approach has been applied in multiaxial loading [17]. The bending equation (Equation (7)) and the membrane stress equation (Equation (8)) depend on the total force F at the actuator’s pin and the corresponding angle α, considering the constant distance L0 between the actuator’s force gripping point and the billet’s tip.
The bending moment is defined as
and tensile force as
In Equation (7), W is the section’s modulus, and in Equation (8), A is the cross-section’s area.
The change in the membrane and bending stress as a function of the relative displacement of the bent billet is shown in Figure 6. The stress that caused the bent billet to open during fatigue loading was bending stress, which was nearly the total stress. This indicated that the bent billet was heavily influenced by its displacement and degree of deformation during fatigue loading, showing that the bending moment dominated the fatigue loading.
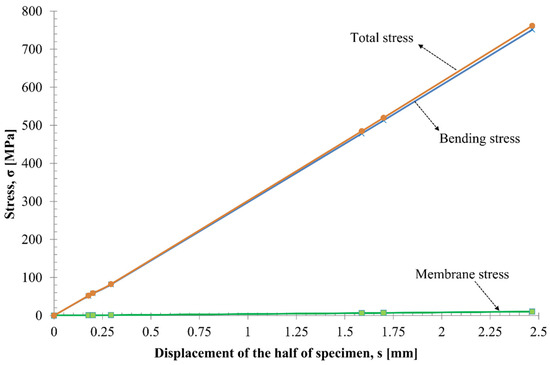
Figure 6.
Decompensation of stress based on the displacement of the bent billet.
2.5. Schematic Prediction of the Stress Range
Since tensile residual stresses occurred after bending of the billet, the actual stress loading ratio R did not correspond to the force loading ratio on the testing machine. A simple description is shown schematically in Figure 7. The geometry and displacement of the bent billet changed during fatigue loading. The loading force varied linearly from minimum to maximum displacement. The force–displacement curve that presents the loading curve of the bent billet is shown in Figure 7, but the opening stress σ displacement started at the σRS point. Additional plastification could occur if the displacement overcame the elastic point of the material. Actual stress, increasing in line with the strain on the σ–e true stress–strain diagram, is shown in Figure 1. The schematic change in the stress ratio due to residual stresses in the elastic–plastic range is given for two cases, namely loading with total unloading (Figure 7a) with R = Fmin/Fmax = 0, and loading with partial unloading with R > 0 (Figure 7b), starting with the same initial opening residual stresses. Loading with total unloading started (Figure 7a) at the initial displacement, resulting in a force of F = 0, and rose to the prescribed displacement smax, which was the displacement at the maximum force loading Fmax, and returned to the initial displacement smin = 0. During the loading stage, the stress at smin = 0 was the initial residual stress σRS after bending, which was the starting point, and rose from elastic to plastic at the maximum displacement smax and force Fmax, resulting in the material’s elasto-plastic stress σmax according to the tensile elastic–plastic behaviour of the material, as shown in Figure 1. The force–displacement curve represents the loading curve of the bent billet, as shown in Figure 7a, but the opening stress σ vs. displacement graph showed that stress started at the σRS point. If displacement could overcomes the elastic part of displacement, the plastification would continue where the force vs. displacement still increased linearly. Increasing stress in the plastic range corresponded to the true strain at the most critical point, and from the corresponding strain, the stress was determined from the true stress–strain diagram, as given in Figure 1. Therefore, for the force ratio RF = 0, the stress ratio is Rσ > 0, as shown in Figure 7a. The force loading ratio RF was also different from the stress ratio Rσ in the case when the bent billet was not unloaded completely, e.g., in the case for cyclic loading, as shown in Figure 7b. Therefore, the actual range of stress Δσ = σmax−σmin, should be determined by numerical simulation, in order to determine the low cyclic points.
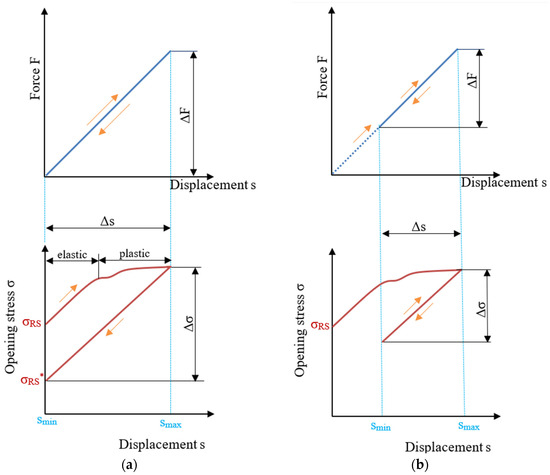
Figure 7.
Schematic prediction of the model for determination of the range of stress for loading with total unloading (RF = 0) (a) and loading with partial unloading (RF > 0) (b).
Loading with partial unloading (Figure 7b) represents the determination of the range of stress during fatigue loading with the loading ratio RF > 0. Loading started at the initial displacement of the bent billet and rose to the prescribed displacement smax, which was the displacement at maximum force Fmax, and unloading occurred at the prescribed displacement smin and force Fmin > 0, which were different from the initial (starting) displacement and force. During the loading stage, the stress changed in the same way as for loading with total unloading (Figure 7a), from the initial residual stress σRS as the starting point to the maximum stress σmax at the maximum displacement smax and force Fmax. The path of unloading and loading of stress with the same elastic slope as the initial elastic part was created with the minimum stress σmin at a displacement of smin and a force of Fmin. This slope depended on the geometry and size of the bent billet. This showed that stress ratio Rσ was different from the loading ratio RF, as in the case of RF = 0, Rσ > 0, and in the case of RF > 0, the stress loading ratio Rσ was >RF. It is obvious that effective stress can be based on determination of the range of stress Δσ, which is based on the range of loading force ΔF.
3. Numerical Modelling, Simulation, and Analysis
Numerical simulation was performed using the finite element method with the software package ABAQUS (version 6.14-2, ABAQUS Dassault Systems Simulia, Providence RI, USA) [18] as the pre-and post-processor CAE. Non-linear elasto-plastic analysis was conducted in two steps without disconnection, similar to the method in [19,20]. The first step was bending of the billet with the same deflection as in the experimental analysis, to induce permanent deformation and residual stress. The second step was fatigue loading of the bent billet with the initial residual stress from the bending and loading range, the same as in the experimental part. The aim was to conduct numerical analysis under the same conditions as the experimental part, to characterize the bent billet’s stress–strain behaviour during and after bending, and to evaluate the initial residual stress and stress–strain state during fatigue loading. Recent results of experimental investigations and numerical simulations in [21,22,23,24,25] have shown the specific behaviour of metastable austenitic steel and its complexity in numerical models regarding the area of stress concentration.
3.1. Bending of the Billet by Numerical Simulation
To develop the modelled stress–strain behaviour of the material and evaluate the residual stresses, a 3-point bending process with a 10 mm range of bending deflection was conducted as a strain-controlled process (Figure 8). The finite element bending model comprised the same-sized die, punch, and billet as the experimental part (Figure 2). In order to reduce the calculation time, only a quarter of the billet was modelled using x and z symmetry boundary conditions, as shown in Figure 8. The punch and die were modelled as analytical rigid parts, while the billet was modelled as a deformable solid. Surface-to-surface contact was considered between the punch and billet, and between the billet and die, with a friction coefficient of 0.05 between the mating surfaces. The model consisted of approximately 25,000 standard quadratic 3D hex elements, known as C3D20 (a 20-node quadratic brick), as shown in Figure 9. Different densities of the mesh were implemented. The highest mesh density was in the middle of the billet, where the deformation and residual stress were at the maximum values. Convergence was established by remeshing of the critical areas described and rerunning the numerical simulations (bending and fatigue to Step 10) until the results stabilized within 3%. The experimentally obtained stress–strain behaviour and properties of the material presented in Figure 1 were applied in the finite element analysis.
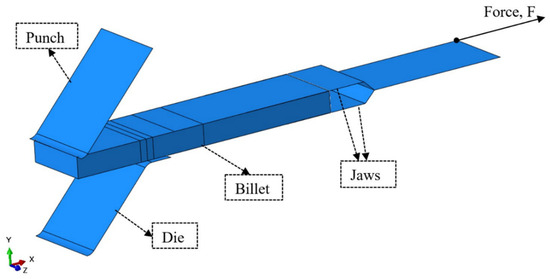
Figure 8.
Finite element model for bending and cyclic loading.
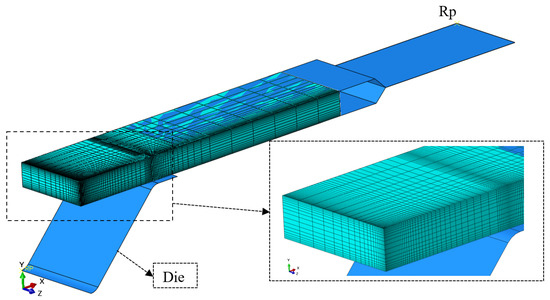
Figure 9.
Mesh strategy for the finite element model.
The true stress–strain curve was inputted to describe the material’s non-linear elasto-plastic behaviour. The material’s elastic behaviour (the elastic part of the true stress–strain curve) was characterized with Young’s modulus E and Poisson’s ratio ν, with the values given in Section 2.1. The stress–strain points starting from the yield stress were used in the form of true stress and plastic strain to describe the material’s plasticity from the true stress–strain curve.
The material’s behaviour was governed by the incremental theory and the von Mises yield criterion. In addition, the isotropic deformation behaviour of the material was assumed during the bending process.
During numerical analysis of the bending, the reaction force between the punch and billet was recorded to obtain a numerical load vs. stroke curve. Figure 4 shows the force–displacement loop for the experimental and numerical data obtained during the 10 mm bending process. In the numerical analysis, the maximum deflection point (Point A) was achieved at Fmax = 25.1 kN, slightly higher than the experimentally obtained maximum bending point, as shown in Figure 4. It can be concluded that the numerical analysis was performed correctly, because both curves showed similar behaviour. Numerical simulation of the change in stress through the thickness was presented at different stages of loading of the billet, as was shown experimentally (Figure 4). The controlled numerical bending procedure consisted of two stages: the loading and unloading stages. During the loading stage, the area most distant from the neutral bending zone underwent permanent plastic deformation. In the unloading stage, the elastic portion of the material wanted to return to its initial state. However, the remaining plastically deformed portion of material prevented this, resulting in residual stresses.
On the force–displacement loop recorded during bending (Figure 4), the maximum deflection corresponds to the maximum force at the loading stage (Point A). Point B in Figure 4 is the unloading point, where there is no bending force on the billet. Both points were analysed to determine the distribution of stress, S11 (Figure 10), and the equivalent plastic strain, PEEQ (Figure 11). The S11 stress was in the direction of cyclic loading and exerted the most influence on the opening of a bent billet. The numerical path was analysed in the middle of the bent billet at 20 mm through the thickness. The starting point was on the side of the die (the large radius of the bent billet) and the endpoint on the punch’s side (the small radius of the bent billet). As shown in Figure 10, at the point of maximum deflection, the tensile stresses (max. 946 MPa) were on the exterior of the bent billet (large radius) at a thickness of 0 mm, while the compressive stresses (max. −1074 MPa) were on the interior (the small radius) at a thickness of 6 mm. The peak tensile and compressive stress at the maximum deflection (Point A in Figure 4) exceeded the material’s yield stress and strength values. At a thickness of 3.7 mm (the neutral zone), stresses in both cases (loading and unloading) changed from tensile to compression. After unloading the bent billet at a force of F = 0 (Point B in Figure 4), the stresses were redistributed according to the new equilibrium state of stress in the billet. The stresses on the exterior of the bent billet (0 mm) converted to compressive, and those in the interior of the bent billet (6 mm) converted to tensile stresses. After bending, the compressive residual stresses were in the range of −170 MPa (at 0 mm), and the tensile residual stresses were 825 MPa (at 6 mm). The residual stresses were measured by a non-destructive X-ray device PULSTEC μ-X360n (Pulstec Industrial Co., Ltd., Hamamatsu, Japan), as shown in Appendix A. The results showed that the maximum tensile stresses measured on the inner side were +798 MPa, with a standard deviation of ±23 MPa. On the outside, the compressive residual stresses were –151 MPa, with a standard deviation of ±31 MPa. Therefore, the measured residual stresses at the characteristic points were of the same order of magnitude as the stresses calculated by the numerical simulation.
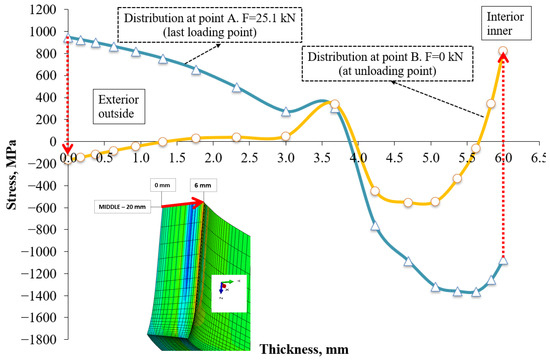
Figure 10.
Distribution of stress through the middle cross-section of the bent billet.
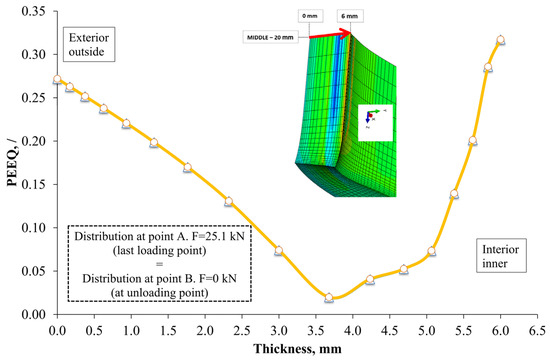
Figure 11.
Equivalent distribution of plastic strain through the middle cross-section of the bent billet.
As shown in Figure 11, the distribution of the equivalent plastic strain PEEQ was identical for the loading stage (at Point A in Figure 4) and the unloading stage (at Point B in Figure 4). Figure 11 shows that the lowest PEEQ was achieved at a thickness of 3.7 mm, in an amount of 2%. During unloading of the bent billet, the elastic portion of the material tried to return to its initial state; however, the plastically deformed portion of the material prevented this, resulting in a permanently deformed position.
The punch side of the bent billet, which represents the site of tensile stress after bending, underwent more significant plastic strain than the die side. The maximal plastic strain of 31.7% was at the thickness of 6 mm. Therefore, the most critical point was the inner interior point at the middle of the billet (punch side), and this point was considered for determination of the relevant amplitude of stress–strain.
3.2. Analysis of Residual Stress and Strain after Bending
Residual stresses are essential in the fatigue life of the bent billet and affect the initial stress state at fatigue loading. The distribution of residual stress on the bent billet is shown in Figure 12 as the equivalent von Mises stress (yield criterion) and S11 stress, which opens the bent billet and initiates a fatigue crack during fatigue loading. The stresses were distributed throughout the cross-section of the bending billet. The highest level of residual stresses was located in the middle of the specimen, where the punch and billet, and the die and billet came into contact. The area inside the specimen (a small radius) contained the maximum strain and, consequently, the maximum residual stresses. After location of the maximum residual stress levels on the bent billet, the stresses were analysed along three paths through the middle cross-section, as shown in Figure 13. The first path was on the edge of the bent billet at 0 mm, the second path was at 10 mm from the edge (quarter of the width), and the third path was in the middle (at 20 mm). All the paths began on the die side (0 mm thickness) and went through the thickness of the bent billet to the punch side (6 mm thickness).
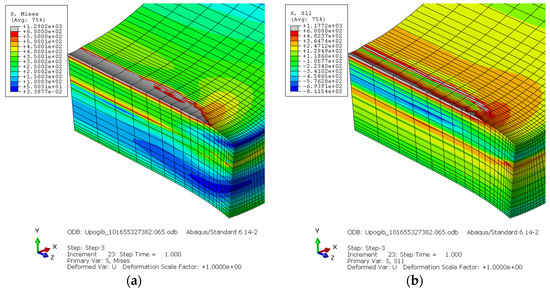
Figure 12.
Distribution of von Mises (a) and S11 (b) residual stress on the bent billet.
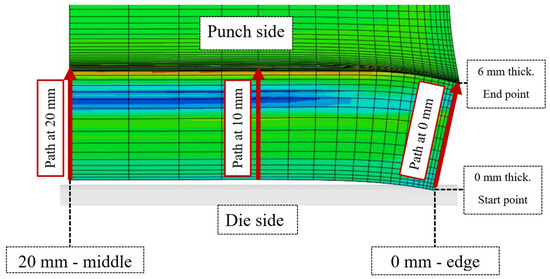
Figure 13.
Analysed paths through the middle cross-section of the bent billet.
Figure 14 shows the results of residual stresses and strains along the three analysed paths. The punch side of the bent billet was subjected to more significant strain than the die side. In addition, the middle path at 20 mm had its peak strain at a thickness of 6 mm, due to the constraining deformation along the width of the bent billet that occurred during bending. The distribution of the von Mises stresses correlated with the distribution of the equivalent plastic strain, with the maximum stress on the punch side (the paths at 10 and 20 mm) and relaxation of the stress at the edge (the path at 0 mm) of the bent billet because of spatial deformation. The S11 stresses, which are stresses in the direction of fatigue loading that can initiate a fatigue crack, changed sign and transformed from compressive to tensile residual stress at the neutral zone with a thickness of 3.7 mm. The compressive residual stresses were on the die side and the tensile at the punch side. The paths at 10 mm and 20 mm (the middle of the bent billet) had comparable S11 stress throughout the distribution of thickness. The peak tensile residual stress occurred in the middle of the bent billet at a thickness of 6 mm, representing the critical point of the inner billet’s surface. Based on the distribution of residual stress and strain, it could be concluded that different microstructures were distributed through the critical cross-section of the bent billet [6]. The austenite microstructure, which was the initial state of the material, remained only in the neutral zone’s region after bending. The increased equivalent plastic deformation caused different fractions of martensite and, consequently, the achievement of different mechanical properties throughout the cross-section.
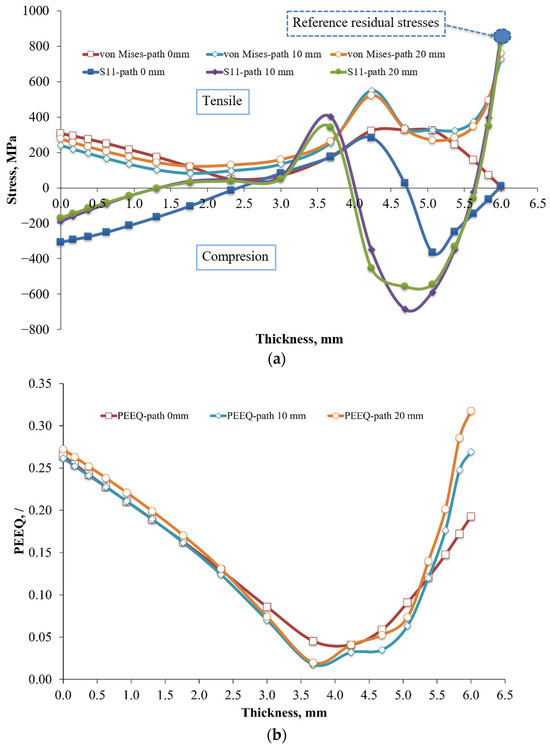
Figure 14.
Distribution of residual stress (a) and PEEQ equivalent plastic strain (b) throughout the middle cross-section.
3.3. Numerical Simulation of Fatigue Loading
After the numerical bending simulation had been completed, the numerical simulation with fatigue loading continued uninterrupted, with the initial residual stress and loading range being the same as in the experimental part. Since the simulation of loading continued with the same finite element model, the same mesh was used as shown in Figure 9. After bending, the surface-to-surface contact was deactivated between the punch and billet, and between the billet and die. Surface-to-surface contact was established between the jaws, as an analytical rigid part, and the billet as a deformable solid, with formulation of rough friction and hard contact. The jaws had the same dimension as the jaws in the experimental fatigue loading with the INSTRON servo-hydraulic machine. The INSTRON actuator’s pin was simulated by applying force to the jaws, as shown in Figure 9, in the direction of the x-axis, fixed at the current position to enable the displacement U1 and the rotation UR3. The numerical bending simulations concluded with Step 3, and the simulation continued with fatigue loading in Step 4, as shown in Figure 15. Fatigue loading was performed with the same load ratio R = 0.1 and range, namely ΔF1 = 1.58 kN (Fmax = 1.759 kN), ΔF2 = 1.69 kN (Fmax = 1.893 kN), and ΔF3 = 2.54 kN (Fmax = 2.834 kN), as in the experimental part.
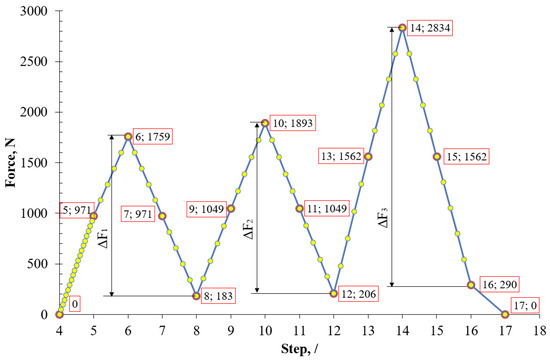
Figure 15.
Characteristics of applied force vs. steps of cyclic loading.
First, cyclic loading was carried out by loading to a mean force at Step 5, then to a maximum force at Step 6, unloading to a mean force at Step 7, and continuing unloading to a minimum force at Step 8. After finishing the first loading cycle, the remaining load cycles were carried out in the same way and ended with complete unloading to 0 N at Step 17.
For each cyclic load (range), the distributions of the S11 stress along the internal bending line of the bent billet (the place with the highest stresses and strains) are shown in Figure 16. The region where the stresses are at their highest values was in the middle of the bent billet, which correlated with the fracture surface and the initiation of fatigue cracks. According to these findings, it can be concluded that the stress governed the initiation of fractures in a narrow area of the bent billet, which was in the middle at a thickness of 6 mm. For this critical point, the stress state was determined on the basis of the residual stress and combined tensile–bending cyclic loading under plane strain conditions.
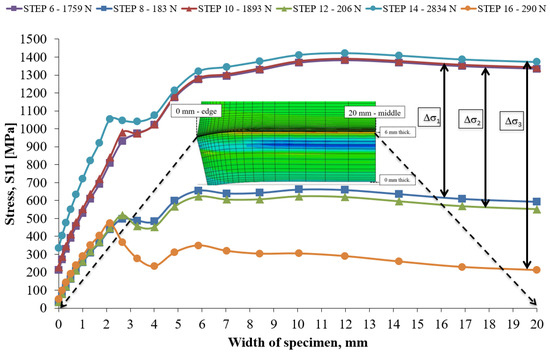
Figure 16.
Distribution of stresses along the inner bending line of the specimen.
The stress state during fatigue loading with the initial residual stress at the critical point on the bent billet is shown in Figure 17. The left-hand ordinate in the figure shows the applied force, and that on the right shows the opening S11 stress relative to the bent billet’s displacement on the abscissa. The force–displacement (F-s) curve was a characteristic of the load (green line) that began with the force value from the origin of the coordinates. Simultaneously, the correlation between the stress (S11) and the displacement (s) is shown, beginning with the displacement at 0 mm and the force at 0 N, with 907 MPa as the initial value of residual stress.
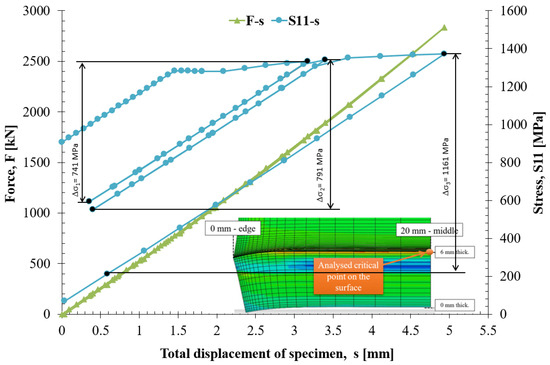
Figure 17.
State of stress at the critical point during cyclic loading with the initial residual stress.
Figure 17 shows that, during loading, the stress increased linearly from the initial residual stress of 907 MPa at 0 mm displacement to 1283 MPa at a displacement of 1.46 mm. At a displacement of 1.46 mm, the opening and plastic deformation of the bent billet occurred in the plastic regime without a significant increase in stress, up to the final point of 4.93 mm and a stress of 1372 MPa. The almost linear correlation between force and displacement also indicated that with increasing force, opening and plastic deformation of the bent billet occurred without a significant increase in stress after exceeding the linearly increasing portion of the curve. It can be concluded that, during loading, the bent billet was influenced heavily by its displacement and degree of deformation, showing that the bending moment dominated fatigue loading, as supported by the results in Figure 6.
Figure 17 shows that, during the unloading stages, displacement and stress decreased linearly for all three cycles, with the same inclination as the initial loading path from 0 mm up to 1.46 mm. After the first loading cycle was complete, the second loading cycle continued along the same path until the maximum displacement of the first loading cycle was exceeded. At that point, the bent billet achieved a new degree of deformation, and a new loading–unloading path with the same inclination was created with an increased range of displacement. As the range of loading increased (Figure 15), the range of displacement also increased, with a new stress state in the bent billet. It can be concluded that each range had a different magnitude of strain and different martensite fractions [6]. If complete unloading is achieved after the first loading cycle (range), the initial residual stress 907 MPa will be reduced below 592 MPa. The residual stresses were reduced to 69 MPa after unloading at s = 0 by the last (third) loading cycle (range). It can be concluded that the initial residual stresses can be reduced and almost eliminated by flattening (achieving a new level of deformation) and restoring the bent billet to its initial state. This can be a procedure to reduce the initial residual stresses on industrial components with metastable austenite which undergo cold plastic deformation.
Fatigue loading was carried out with the applied load ratio R = 0.1, but as we have demonstrated in Figure 7, it was governed by displacement and the corresponding values of stress. The maximum stress remained almost a constant throughout all the loading cycles; however, the minimum stress decreased with each cycle, resulting in an increased range of stress. The increased range of stress caused a change in the stress ratio, which was distinct from the force–load ratio R = 0.1. As shown in Figure 17, the first cycle had a range of stress of Δσ1 = 741 MPa and a stress ratio Rσ of 0.444, while the second cycle had a range of stress of Δσ2 = 791 MPa and a stress ratio of Rσ = 0.411, and the third cycle had a range of stress of Δσ3 = 1161 MPa and a stress ratio of Rσ = 0.154. With increasing loading and displacement, the range of stress increased while the stress ratio decreased. It can be concluded that, during fatigue loading, it is necessary to include the initial residual stress at the critical point and the state of stress during fatigue loading itself to describe the state of stress in the bent billet.
However, due to the residual stresses, a linear increase in the tensile force governed by the Instron testing machine caused a non-linear increase in the S11 stresses at the most critical point of the bent billet. Therefore, determination of the amplitude of stress loading was possible only by following the linear path of force vs. total displacement (the green line in Figure 17) and by reading the stress vs. displacement path. For experimental verification of fatigue resistance, the same range of force should be applied on the Instron testing machine.
4. Determination of the Range of Stress during Fatigue Loading
The experimental and numerical parts of fatigue loading were conducted under the same geometrical and loading conditions (range and ratio of loading). This enabled correlations between them and a description of the loading and stress state during fatigue loading. The findings of the experimental and numerical analysis indicated that the loading and stress state of the bent billet were influenced heavily by its displacement and degree of deformation (opening angle α), as shown in Figure 5, indicating that the bending moment and bending stress dominated fatigue loading. Figure 6 shows that bending stress was nearly the total stress on the bent billet, meaning that the bending component of the total applied load, which was a part of the bending moment, initiated the fatigue crack.
Even though the bending stress represented the maximum value, the stress state was determined on the basis of the determination of the range of forces to which the sample was subjected. The main reason is that, both in the numerical simulation and in experimental testing, the value of the sample’s opening force was a direct input.
Combined tensile and bending cyclic loading was carried out at room temperature with a load ratio of R = 0.1 at a frequency of 5 Hz. Three sets of tests were carried out, with load ranges of ΔF1 = 1.58 kN (Fmax = 1.759 kN), ΔF2 = 1.69 kN (Fmax = 1.893 kN), and ΔF3 = 2.54 kN (Fmax = 2.834 kN), as shown in Figure 18. For each bent billet, the maximum and minimum displacements in relation to the force (load) and cycle were recorded during testing. The bent billet’s geometry changed during cyclic loading and was governed by the force and displacement of the actuator. Additionally, the geometry of a bent billet varied, depending on the set of fatigue loadings. With an increase in the maximal load and, consequently, the load’s range, the range of fatigue loading displacement of the bent billet increased (Δs), becoming tougher with the initial displacement of the actuator (a), as shown in Figure 19. Each fatigue loading set had a new starting point of loading for the actuator (a), a new displacement range (Δs), and a different starting angle of the bent billet. The third loading set had a significantly greater range of fatigue loading and a greater maximum load than the previous two loading sets, resulting in a large displacement of the actuator and consequent flattening of the bent billet. Increasing the actuator’s displacement at the third path of loading was a result of additional plastic deformation, which led to a reduction in the stiffness of the bent billet and increased the tensile stress.
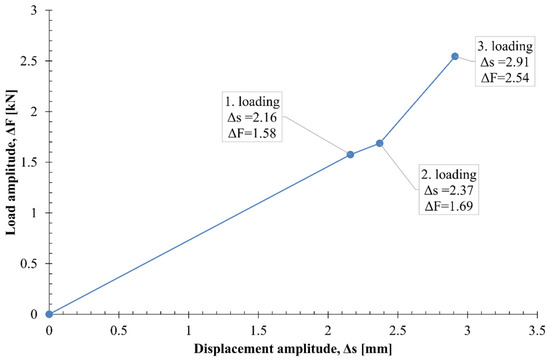
Figure 18.
Loading characteristics of the bent billet.
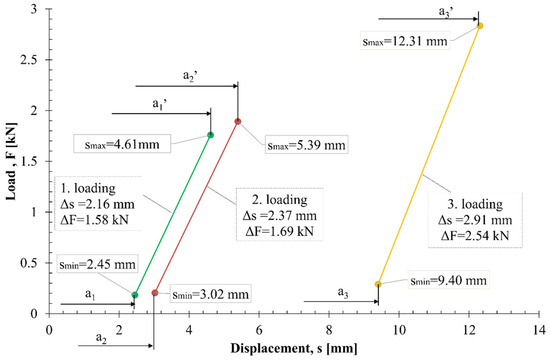
Figure 19.
Load–displacement characteristics for each case of loading.
Fatigue loading testing was performed with intermittent stops at specific intervals to perform heat tinting, from which the potential formation of fatigue cracks could be detected. After heat tinting, the specimens were again subjected to fatigue loading with the same range and ratio of loading. The fatigue loading test of each bent billet was stopped when the maximum displacement exceeded a pre-determined value, or when a fatigue crack was observed. After the fatigue loading tests, the bent billets were heated and ruptured in half without damaging the fatigued surface to indicate the size of the area with fatigue cracks, as shown in Figure 20. There were various different shades on the specimen’s fatigued surface due to repeated heating. The initial area was darker, indicating that a fatigue crack formed in the middle of the specimen on the surface, where the residual tensile stresses were the highest. The crack initially progressed with an uneven front in the central part of the curved pattern and then gradually coalesced. The first darker front appeared on a bent specimen with a range of stress of 740 MPa with thermal tinting after 75,000 cycles (Point A in the diagram) and on the same specimen with the same load after 112,000 cycles (Point B in the diagram). The final failure occurred at 152,845 cycles.
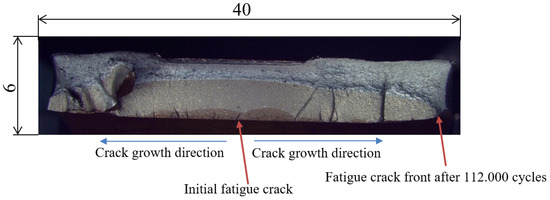
Figure 20.
Fractured surface of the bent billet after fatigue loading.
The experimental force vs. displacement path and numerical simulations showed a quite linear correlation between force and displacement, and between moment and displacement, as presented in Figure 21. Therefore, on the basis of these findings, it is possible to determine the opening stresses’ amplitude in the most critical point of the bent billet, as shown in Figure 22.
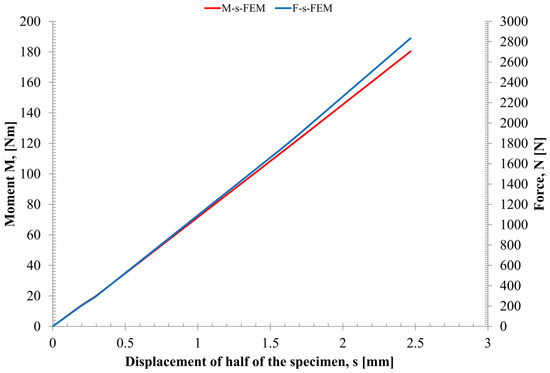
Figure 21.
Characteristics of moment and force.
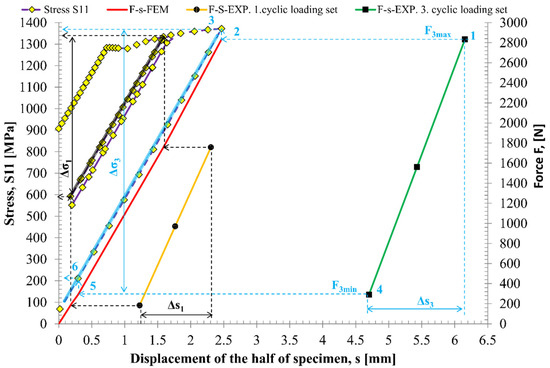
Figure 22.
Determination of the range of loading stress via the maximum and minimum stress obtained by FEM, and by combining the experimental displacement with the numerical simulation of the moment.
Figure 22 shows the determination of the opening range of stress in the elastic–plastic regime of loading under the influence of residual stresses. The numerically obtained results of force vs. displacement are represented by the red line in Figure 22. This line corresponds to a particular apparatus and specimen geometry. The numerically calculated residual stresses of the bent billet provide the initial point in Figure 22. The strain at the point at the middle of the specimen at the point with the lowest radius was calculated by a numerical FEM simulation. The path of the range of displacement of stable fatigue loading shifted differently relative to the origin at different ranges of loading (force), because the displacement path is related to the opening of the whole specimen. Figure 22 shows only the stable fatigue loading path for the first and third loading regimes. When the range of displacement Δs1 had been established, the linear dependency between force and displacement was obtained. The maximum and minimum forces from the loading path shifted to the red line parallel with the x-axis to the red FEM line, and the corresponding points of the stress–strain curve lay above the red line’s points. The vertical difference between the maximum and minimum stress represents the applied range of stress Δσ 1 at opening. The loading ratio of the applied opening stress could be determined, since the maximum and minimum applied range of stress was known. The same approach was applied for the second and third sets of specimens. Figure 22 also shows the determination for the third set of bent billets (green line) and the determination of Δσ3.
The results of the maximum and minimum opening stresses for all three cases are summarised in Table 1. Table 1 shows that in spite of the fact that the ratio of force and moment for the loading was RF = 0.1, the ratio of opening stress was much higher.

Table 1.
Loading and stress for each set of fatigue loadings obtained by numerical simulation from Figure 22.
5. Experimental Testing of the Bent Billet
Experimental testing of the bent billet with bending displacement was performed at three different ratios of opening stress, namely Rσ = 0.154, Rσ = 0.411, and Rσ = 0.444, where the opening range of stress was determined by the procedure described above. Figure 23 shows that lowest ratio of opening stress, Rσ = 0.154, appeared at the highest range of opening stress. The highest ratio of opening stress Rσ = 0.444 appeared at the lowest range of opening stress.
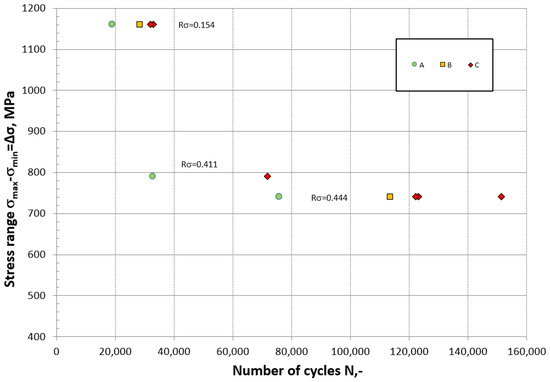
Figure 23.
Fatigue S–N results for the pre-deformed bent billet under three different regimes.
Fractographic analysis was performed after fatigue testing of the bent billets. Green marks the first round of heat tinting, and no fatigue cracking was observed. Fatigue loading was continued with the same amplitude of force loading. Yellow marks the second round of heat tinting (a fatigue crack was observed), and red means fatigue failure (a fatigue crack grew between the second and third round of heat tinting). If a fatigue crack had already appeared in the first step of heat tinting, it was recognized if we had a more coloured fatigue surface, as shown in Figure 20, where we have three fatigue crack surfaces with three different colours. It is hard to compare these results with the available S–N curve because, usually, S–N curves are obtained only for a constant loading ratio (e.g., R = 0.1 or R = 0, or R = −1) [26]. The results show the low fatigue behaviour of all the pre-deformed billets, where the lowest number of cycles was achieved at the lowest effective range of stress, Rσ = 0.154. However, it was possible to recognise that the fatigue behaviour corresponded to low fatigue with respect to the number of cycles and a higher stress ratio R with a lower range of opening S11 stress provided a higher number of cycles to fatigue failure.
6. Conclusions
The aim of the study was to establish a procedure for determination of the range of opening stress, based on numerical simulations and experimentally measured force and displacement in the elastic–plastic loading regime of metastable austenitic steel.
- The model material was based on the experimentally obtained true tensile stress–strain behaviour of metastable austenitic steel.
- The model was applied on bent pre-deformed billets with residual stresses introduced at the middle inside point of the bent billet.
- On the basis of numerical FEM simulations of the bending deformation process and combined tensile–bending simulation of loading, the calibration curves in terms of force vs. displacement and a true tensile stress–strain plot were established with respect to the residual stress.
- The maximum and minimum force vs. displacement on the calibration curve provided the maximum and minimum opening stresses at the most critical point of the billet.
- Due to residual stress (introduced by bending deformation of the billet) and the fatigue loading in the elasto-plastic range of the material, the opening stress ratio was different from the ratio of applied force or moment (e.g., RF = 0.1).
- At the same time, with respect to the actual fatigue process, the ratio of opening stress was higher (e.g., Rσ = 0.444), which meant that the fatigue threshold of the pre-deformed specimen was lower and, consequently, the fatigue limit [26,27] was lower. It is important to stress that, during combined loading, a linear relationship was obtained between the applied force and the moment. This would make it simpler to determine the range of opening stress and the actual stress ratio Rσ.
- The results show low fatigue behaviour of all the pre-deformed billets, where the lowest number of cycles was achieved at the lowest effective range of stress Rσ = 0.154.
The fatigue behaviour of forged or rolled AISI 315L in the range of the fatigue limit depends on the presence of inclusions, which are much smaller than pores or unmelted dust particles [28,29,30]. Because of this, the plastic fatigue before deformation of materials manufactured by additive technology [31] can be significantly different from that of rolled or forged materials, for which the model is given in this article.
The model’s schematic prediction is the basis for describing the stress–strain behaviour of pre-deformed material, reduction in the residual stress, and determination of the range of stress during fatigue loading. This was described and explained by using the experimental and numerical results.
Author Contributions
Conceptualization, D.J. and N.G.; methodology, D.J.; software, D.J.; validation, D.J. and N.G.; formal analysis, D.J.; investigation, D.J. and N.G.; resources, N.G.; data curation, D.J.; writing—original draft preparation, N.G.; writing—review and editing, N.G.; visualization, D.J.; supervision, N.G.; project administration, N.G.; funding acquisition, N.G. All authors have read and agreed to the published version of the manuscript.
Funding
Slovenian Research Agency (P2-0137) “Numerical and experimental analysis of nonlinear mechanical systems”.
Data Availability Statement
The original contributions presented in the study are included in the article, further inquiries can be directed to the corresponding author.
Conflicts of Interest
The authors declare no conflict of interest.
Appendix A. Non-Destructive Measurement of Residual Stresses
The model’s schematic prediction was the basis for describing the stress–strain behaviour of pre-deformed material, reduction in the residual stress, and determination of the range of stress during fatigue loading. This was described and explained by using the experimental and numerical results.
Measurements of the residual stress were performed on bent specimens on the inner and outer surfaces of the most bent part of the specimen. In order to prevent the impact of the contact of the mandrel with the radius R5 on the inside, the sample was electropolished to a depth of 0.1 mm; on the outside, due to the effect of rolling, the sample was also electropolished to a depth of 0.1 mm. Measurements of residual stress were performed using the X-ray method with a PULSTEC μ-X360n device (Pulstec Industrial Co., Ltd., Hamamatsu, Japan), as shown in Figure A1. The results of the measurements for the outer and inner points in the direction of the longitudinal stresses superimposed on the loading stresses are shown in Figure A2 and Figure A3, respectively. The results showed that the maximum tensile stresses measured on the inner side were +798 MPa, with a standard deviation of ±23 MPa. On the outside, the compressive residual stresses were –151 MPa, with a standard deviation of ±31 MPa. It can be seen from both figures that the shear stresses on the surface were much lower than the longitudinal ones. Therefore, the measured residual stresses at characteristic points were of the same order of magnitude as the stresses calculated by numerical simulation. Deviations occurred due to the large stress gradient from tensile to compressive throughout the thickness of the billet.

Figure A1.
The PULSTEC μ-X360n device used for measurement of the residual stresses.
Figure A1.
The PULSTEC μ-X360n device used for measurement of the residual stresses.


Figure A2.
Results of measuring the residual stresses at the inside point.
Figure A2.
Results of measuring the residual stresses at the inside point.


Figure A3.
Results of measuring the residual stresses at the outside point.
Figure A3.
Results of measuring the residual stresses at the outside point.

References
- Martelo, D.F.; Mateo, A.M.; Chapetti, M.D. Fatigue Crack Growth of a Metastable Austenitic Stainless Steel. Int. J. Fatigue 2015, 80, 406–416. [Google Scholar] [CrossRef]
- Pineau, A.G.; Pelloux, R.M. Influence of Strain-Induced Martensitic Transformations on Fatigue Crack Growth Rates in Stainless Steels. Metall. Trans. 1974, 5, 1103–1112. [Google Scholar] [CrossRef]
- Mei, Z.; Morris, J.W. Influence of Deformation-Induced Martensite on Fatigue Crack Propagation in 304-Type Steels. Metall. Trans. A 1990, 21, 3137–3152. [Google Scholar] [CrossRef]
- Biswas, S.; Sivaprasad, S.; Narasaiah, N.; Tarafder, S.; Chakraborti, P. Load History Effect on FCGR Behaviour of 304LN Stainless Steel. Int. J. Fatigue 2007, 29, 786–791. [Google Scholar] [CrossRef]
- Chanani, G.R.; Antolovich, S.D.; Gerberich, W.W. Fatigue Crack Propagation in Trip Steels. Metall. Trans. 1972, 3, 2661–2672. [Google Scholar] [CrossRef]
- Jagarinec, D.; Kirbiš, P.; Predan, J.; Vuherer, T.; Gubeljak, N. Analysis of Deformation Induced Martensite in AISI 316L Stainless Steel. Mater. Test. 2016, 58, 547–552. [Google Scholar] [CrossRef]
- Solomon, N.; Solomon, I. Deformation Induced Martensite in AISI 316 Stainless Steel. Rev. Metal. 2010, 46, 121–128. [Google Scholar] [CrossRef]
- de Abreu, H.F.G.; de Carvalho, S.S.; de Lima Neto, P.; dos Santos, R.P.; Freire, V.N.; de Silva, P.M.O.; Tavares, S.S.M. Deformation Induced Martensite in an AISI 301LN Stainless Steel: Characterization and Influence on Pitting Corrosion Resistance. Mater. Res. 2007, 10, 359–366. [Google Scholar] [CrossRef]
- Tourki, Z.; Ktari, Z.; Sidhom, H.; Gahbiche, A. Investigations Expérimentales Autour de la Transformation Martensitique Induite par Déformation Plastique dans les Aciers Inoxydable Austensitiques AISI 304—Archive Ouverte HAL. Available online: https://hal.archives-ouvertes.fr/hal-03362517 (accessed on 5 June 2022).
- Milad, M.; Zreiba, N.; Elhalouani, F.; Baradai, C. The Effect of Cold Work on Structure and Properties of AISI 304 Stainless Steel. J. Mater. Process Technol. 2008, 203, 80–85. [Google Scholar] [CrossRef]
- Huang, J.-Y.; Yeh, J.-J.; Jeng, S.-L.; Chen, C.-Y.; Kuo, R.-C. High-Cycle Fatigue Behavior of Type 316L Stainless Steel. Mater. Trans. 2006, 47, 409–417. [Google Scholar] [CrossRef]
- Shrestha, R.; Simsiriwong, J.; Shamsaei, N. Fatigue Behavior of Additive Manufactured 316L Stainless Steel under Axial versus Rotating-Bending Loading: Synergistic Effects of Stress Gradient, Surface Roughness, and Volumetric Defects. Int. J. Fatigue 2021, 144, 106063. [Google Scholar] [CrossRef]
- Topic, M.; Tait, R.; Allen, C. The Fatigue Behaviour of Metastable (AISI-304) Austenitic Stainless Steel Wires. Int. J. Fatigue 2007, 29, 656–665. [Google Scholar] [CrossRef]
- Pessoa, D.F.; Kirchhoff, G.; Zimmermann, M. Influence of Loading Frequency and Role of Surface Micro-Defects on Fatigue Behavior of Metastable Austenitic Stainless Steel AISI 304. Int. J. Fatigue 2017, 103, 48–59. [Google Scholar] [CrossRef]
- M4P 316L Datasheet, M4P, Krefeld, Germany. Available online: https://www.metals4printing.com/wp-content/uploads/datasheets/de/Fe-Basis/m4p_Datenblatt_316L_DE.pdf (accessed on 12 June 2024).
- ISO 6892-1:2019; Metallic Materials—Tensile Testing—Part 1: Method of Test at Room Temperature. International Organization for Standardization: Geneva, Switzerland, 3 January 2020.
- Van, K.D. Multiaxial Fatigue Criteria Based on a Multiscale Approach. In Handbook of Materials Behavior Models; Elsevier: Amsterdam, The Netherlands, 2001; pp. 457–463. [Google Scholar] [CrossRef]
- Abaqus 6.14 Documentation. Available online: http://62.108.178.35:2080/v6.14/index.html (accessed on 9 May 2023).
- Vosniakos, G.-C.; Pipinis, G.; Kostazos, P. Numerical Simulation of Single Point Incremental Forming for Asymmetric Parts. Facta Univ. Ser. Mech. Eng. 2021, 19, 719. [Google Scholar] [CrossRef]
- Lamprecht, M.; Leonhartsberger, M. Tool Stiffness Calculation in Roll Forming. Int. J. Simul. Model. 2021, 20, 40–51. [Google Scholar] [CrossRef]
- Panov, D.; Kudryavtsev, E.; Naumov, S.; Klimenko, D.; Chernichenko, R.; Mirontsov, V.; Stepanov, N.; Zherebtsov, S.; Salishchev, G.; Pertcev, A. Gradient Microstructure and Texture Formation in a Metastable Austenitic Stainless Steel during Cold Rotary Swaging. Materials 2023, 16, 1706. [Google Scholar] [CrossRef]
- Liu, X.; Zhang, S.; Bao, Y.; Zhang, Z.; Yue, Z. Strain-Controlled Fatigue Behavior and Microevolution of 316L Stainless Steel under Cyclic Shear Path. Materials 2022, 15, 5362. [Google Scholar] [CrossRef]
- Deng, B.; Yang, D.; Wang, G.; Hou, Z.; Yi, H. Effects of Austenitizing Temperature on Tensile and Impact Properties of a Martensitic Stainless Steel Containing Metastable Retained Austenite. Materials 2021, 14, 1000. [Google Scholar] [CrossRef]
- Sterpin Valic, G.; Cukor, G.; Jurkovic, Z.; Brezocnik, M. Multi-Criteria Optimization of Turning of Martensitic Stainless Steel for Sustainability. Int. J. Simul. Model. 2019, 18, 632–642. [Google Scholar] [CrossRef]
- Wu, R.; Xu, Y.; Li, K. Role of Metastable Austenite on Crack Resistance of Quenching and Partitioning Sheet Steels. Met. 2023, 13, 762. [Google Scholar] [CrossRef]
- Chapetti, M.D. Fracture Mechanics for Fatigue Design of Metallic Components and Small Defect Assessment. Int. J. Fatigue 2022, 154, 106550. [Google Scholar] [CrossRef]
- Avanzini, A. Fatigue Behavior of Additively Manufactured Stainless Steel 316L. Materials 2022, 16, 65. [Google Scholar] [CrossRef] [PubMed]
- D’Andrea, D. Additive Manufacturing of AISI 316L Stainless Steel: A Review. Metals 2023, 13, 1370. [Google Scholar] [CrossRef]
- Morgan, R.; Sutcliffe, C.J.; O’neill, W. Density analysis of direct metal laser re-melted 316L stainless steel cubic primitives. J. Mater. Sci. 2004, 39, 1195–1205. [Google Scholar] [CrossRef]
- Murakami, Y. Effects of Small Defects and Nonmetallic Inclusions on the Fatigue Strength of Metals. JSME Int. Journal. Ser. 1 Solid Mech. Strength Mater. 1989, 32, 167–180. [Google Scholar] [CrossRef]
- Pelegatti, M.; Benasciutti, D.; De Bona, F.; Lanzutti, A.; Magnan, M.; Novak, J.S.; Salvati, E.; Sordetti, F.; Sortino, M.; Totis, G.; et al. On the factors influencing the elastoplastic cyclic response and low cycle fatigue failure of AISI 316L steel produced by laser-powder bed fusion. Int. J. Fatigue 2022, 165, 107224. [Google Scholar] [CrossRef]


Disclaimer/Publisher’s Note: The statements, opinions and data contained in all publications are solely those of the individual author(s) and contributor(s) and not of MDPI and/or the editor(s). MDPI and/or the editor(s) disclaim responsibility for any injury to people or property resulting from any ideas, methods, instructions or products referred to in the content. |
© 2024 by the authors. Licensee MDPI, Basel, Switzerland. This article is an open access article distributed under the terms and conditions of the Creative Commons Attribution (CC BY) license (https://creativecommons.org/licenses/by/4.0/).