Article

Effect of Process Parameters on Superelasticity of LPBF Ni-Rich Ni51.3Ti48.7 Shape Memory Alloy

Institute of Machinery Manufacturing Technology, China Academy of Engineering Physics, Mianyang 621000, China
*
Authors to whom correspondence should be addressed.
Metals 2024, 14(9), 961; https://doi.org/10.3390/met14090961 (registering DOI)
Submission received: 2 July 2024 / Revised: 16 August 2024 / Accepted: 22 August 2024 / Published: 25 August 2024
(This article belongs to the Section Additive Manufacturing)

Abstract

:
Laser powder bed fusion (LPBF) presents both opportunities and challenges with regard to the customisation of NiTi alloy properties. This paper presents a systematic study of the influence of process parameters on the superelasticity of LPBF Ni-rich Ni51.3Ti48.7 shape memory alloy. The findings demonstrate that NiTi alloys produced through disparate process parameters exhibit disparate phase transformation behaviours and microstructures, which in turn result in varying degrees of superelasticity. At an energy density of 166.7 to 233.3 J/mm3, LPBFed Ni-rich Ni51.3Ti48.7 is predominantly in the martensite phase at room temperature due to the high phase transition temperature caused by a large amount of Ni evaporation loss, and exhibits almost no superelasticity. At an energy density of 66.7 to 116.7 J/mm3, LPBFed Ni-rich Ni51.3Ti48.7 has less Ni evaporation loss and lower phase transition temperature. It is primarily austenite phase at room temperature, and contains nano-precipitated phases internally, thereby exhibiting excellent superelasticity. The recovery rate is in excess of 5.5% at the initial compression (up to 5.7%) and in excess of 5.0% following ten cycles (up to 5.3%). Furthermore, the lower the energy density, the smaller the stress–strain hysteresis of LPBFed Ni-rich Ni51.3Ti48.7, with a variation range of 1.8–3.9 mJ/mm3.

1. Introduction

NiTi shape memory alloys have been employed extensively in a range of fields, including solid-state refrigeration, aerospace, biomedical engineering, and beyond, due to their distinctive superelasticity, exemplary elastic thermal properties, corrosion resistance, and biocompatibility [1,2,3,4,5]. In recent years, there has been a notable advancement in the field of additive manufacturing technology. Laser powder bed fusion is a particularly noteworthy technique, whereby powder is melted according to a predetermined path and solidified layer by layer. This method effectively circumvents the difficulties associated with traditional cutting and welding processing when working with NiTi alloys. Furthermore, this method allows for the preparation of NiTi alloys with high quality, excellent mechanical properties, and functional characteristics, which has attracted significant attention in the academic community [6,7,8,9,10]. The superelasticity of the NiTi alloy is derived from the mutual transformation of the internal austenite (B2) and martensite (B19′) phases. The relative ratio of these two phases at room temperature is dependent on the phase transition temperatures (TTs). TTs are highly sensitive to the Ni content, with an increase of 0.1 at.% in Ni content resulting in a decrease of approximately 10 °C in TTs. It can thus be concluded that the Ni content has a significant effect on the superelasticity of the NiTi alloy [11,12,13,14,15]. Furthermore, the evaporation enthalpy and boiling point of Ni (374.8 kJ/mol, 2913 °C) are smaller than those of Ti (425.5 kJ/mol, 3287 °C), resulting in an inherent selective evaporation loss of Ni in LPBFed NiTi. This loss is significantly influenced by process parameters, including laser power, scanning speed, and scanning spacing [16,17,18,19]. In order to regulate the superelasticity of NiTi alloy, it is possible to design the initial chemical composition of the NiTi powder raw materials. This involves using a Ni-rich NiTi powder to compensate for the Ni evaporation loss that occurs during the LPBF process. This results in a lower phase transition temperature for the NiTi alloy, which in turn achieves better superelasticity without the need for heat treatment [20]. Alternatively, the LPBF process parameters can be finely modified, such as the adoption of low energy density to curtail the evaporation loss of Ni, regulate the microstructure, and consequently enhance the superelasticity [21].
The superelasticity of LPBF NiTi alloys has been the subject of extensive study. In a separate study, Ren et al. [22] investigated the impact of laser power and scanning speed on the characteristics of the Ni50.7Ti49.3 alloy at a consistent energy density. It was discovered that samples prepared with a lower laser power and scanning speed exhibited an enhanced stability of the austenite phase, superior compressive mechanical properties, and augmented superelasticity. Saedi et al. [23] investigated the influence of laser power and scanning speed on the microstructure and superelasticity of the Ni50.8Ti49.2 alloy, identifying the optimal processing window. The resulting Ni50.8Ti49.2 alloy exhibited a strain recovery rate of 5.77% during the initial compression and a strain recovery rate of 5.5% after 10 cycles. Shen et al. [24] conducted a study of the microstructure, precipitation, and chemical composition of the Ni51.0Ti48.0 alloy at varying energy densities, with a view to analysing the relationship between these factors and the phase transition temperature and superelasticity. It is assumed that the alteration in phase transition temperature and superelasticity between samples is a consequence of the competition between alloying elements involved in the processes of evaporation, condensation, and precipitation during the LPBF process. Xue et al. [20] prepared a defect-free, highly textured Ni51.2Ti48.8 alloy by optimising the LPBF process parameters, demonstrating a tensile superelasticity of 6%. The sample also exhibited the presence of nano-sized oxide particles and Ni-rich precipitates, which enhanced the superelasticity by inhibiting the inelastic adjustment mechanism of martensitic transformation. The aforementioned research demonstrates that process control is an effective method for enhancing the superelasticity of LPBF NiTi alloys. However, the precise relationship between process parameters and superelasticity remains to be fully established.
The objective of this study is to elucidate the influence and mechanism of process parameters on the superelasticity of LPBF Ni-rich NiTi alloy. Accordingly, a bespoke Ni-rich Ni51.3Ti48.7 (at.%) powder was employed for LPBF forming via a range of process parameters. The microstructure and phase transformation behaviour of different NiTi samples were examined, and the impact of process parameters on their superelasticity and stress–strain hysteresis was elucidated in depth. This research offers a foundation for the regulation and customisation of the superelastic properties of LPBF NiTi alloy.

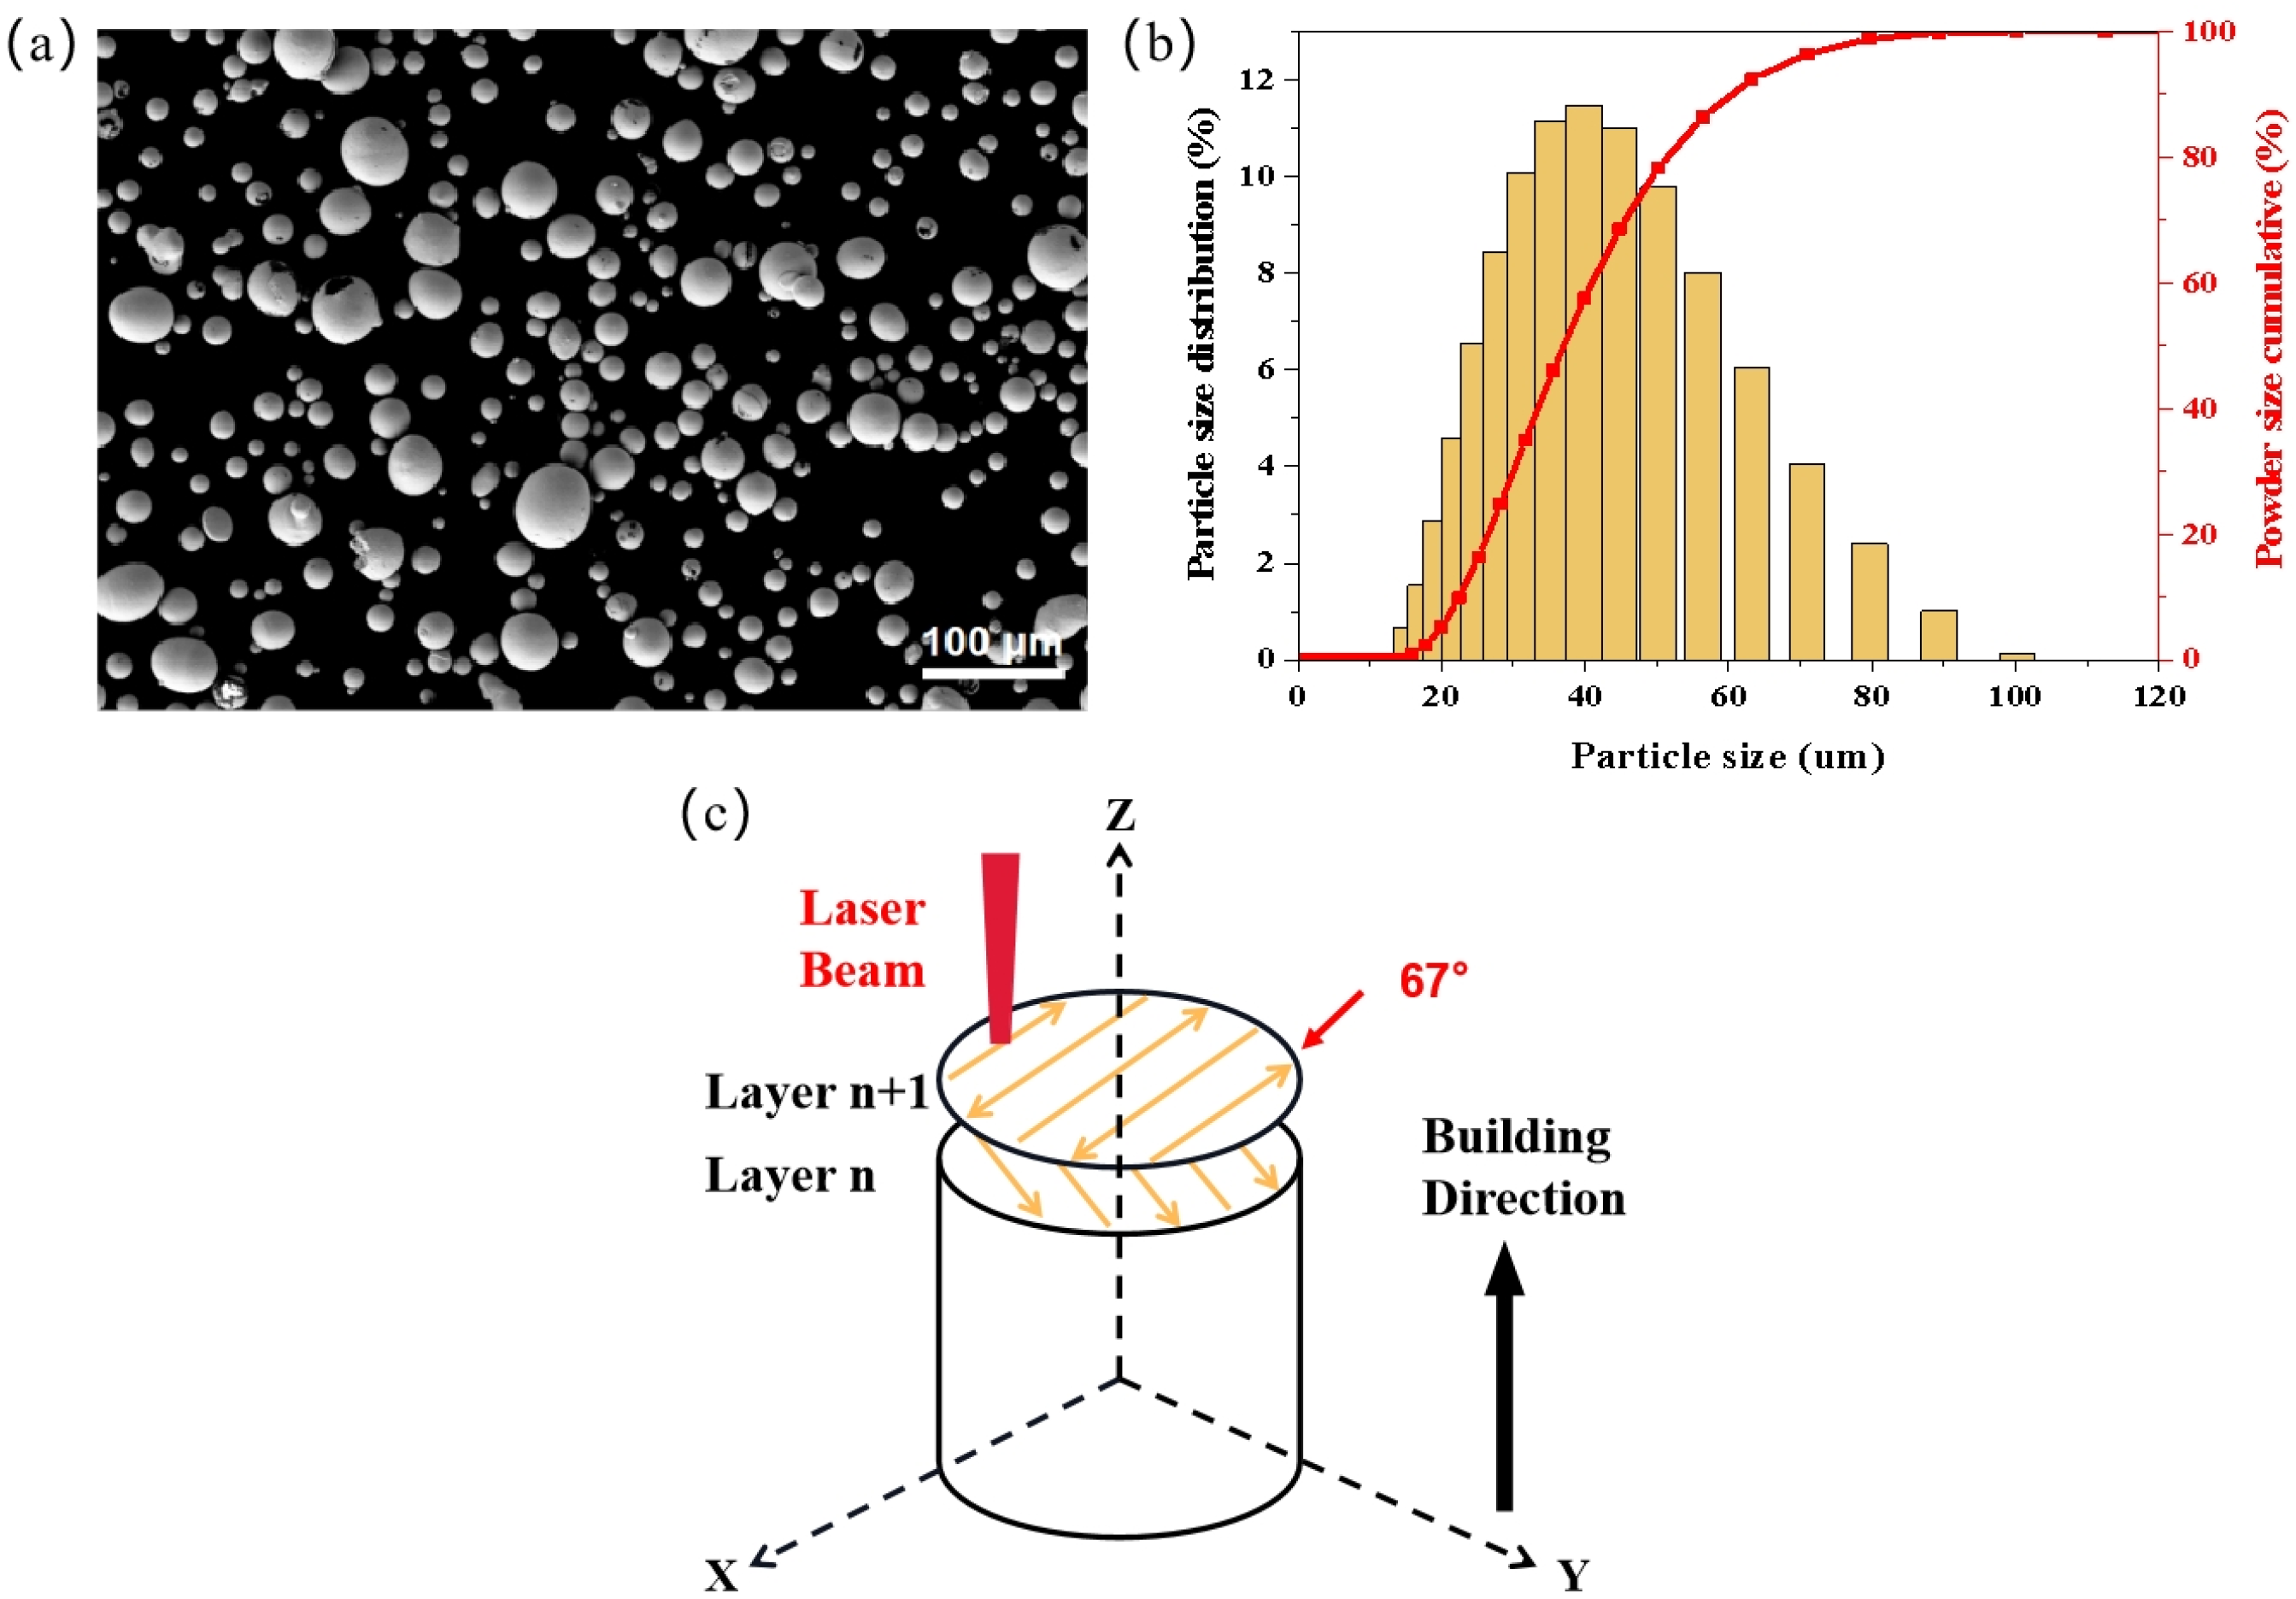
2. Materials and Methods

The Ni51.3Ti48.7 (at.%) shape memory alloy powder, produced by Shenzhen Micro-Nano Additive Technology Co., Ltd. (Shenzhen, China), was employed as the raw material. The powder was prepared by electrode gas atomisation, resulting in a smooth surface and good fluidity, which met the requirements of the LPBF process. The particle size distribution of the powder, as determined by laser scattering particle size analysis (Microtrac Inc., Largo, FL, USA), is predominantly within the range of 15 to 57 micrometres. The microstructure and particle size distribution of the powder are illustrated in Figure 1a and 1b, respectively. The samples were prepared using the SLM-100B selective laser melting metal 3D printer (Nanjing University of Aeronautics and Astronautics, Nanjing, China), which is equipped with a German IPG 200 W single-mode fibre laser (IPG Photonics, Oxford, MA, USA) and has a spot size of 0.06 mm. The printing parameters of different combinations of laser power (80–140 W, increment 20 W) and scanning speed (400–1000 mm/s, increment 200 mm/s) were designed and expressed as A1–A4, B1–B4, C1–C4, and D1–D4, respectively. The specific settings are presented in Table 1, where the energy density is calculated using the formula E = P/(v × h × t). In the aforementioned formula, the variables are defined as follows: P represents the laser power, v denotes the laser scanning speed, h signifies the laser scanning spacing, and t stands for the powder layer thickness. Furthermore, a 67° inter-layer rotation scanning strategy was employed, as illustrated in Figure 1c. The NiTi substrate was employed in the printing process, and 99.99% high-purity argon was introduced to ensure that the oxygen content was less than 70 ppm. The NiTi samples printed in this study include square samples (side length of 5 mm, height of 10 mm) for microstructure characterisation and phase composition analysis, and cylindrical samples (diameter of 4.5 mm, height of 10 mm) for mechanical properties and superelasticity tests.
In order to ascertain the forming quality of the samples, a density test was conducted using the Archimedes drainage method, with the average value of each sample determined on three occasions. In order to characterise the microstructure of the samples, C1, C3, B3, A2, and A4, which exhibited differing energy densities, were selected. After mechanical polishing, 8 S were etched in a mixed solution of hydrofluoric acid/nitric acid/water = 1 vol.%/4 vol.%/5 vol.%. The morphology of the molten pool was observed using an optical microscope. Moreover, the microstructure of the C1, B3, and A4 samples was examined using a scanning electron microscope (SEM, back-scattering mode, Zeiss, Oberkochen, Germany), and the Ni content was determined by an energy dispersive spectrometer (EDS, surface scanning, Oxford Instruments, Oxford, UK). In order to characterise the phase transition behaviour of the samples, the phase transition temperature was tested by differential scanning calorimetry (DSC, Netzsch, Selb, Germany) at a heating/cooling rate of 10 °C/min in an argon atmosphere, and the temperature range was −100 °C to 100 °C. Subsequently, the X-ray diffractometer (XRD, Empyrean, Almelo, The Netherlands) was employed to ascertain the phase of the C1, B3, and A4 samples at room temperature (20 °C). The 2θ scanning range was set to 20–110°, with a scanning speed of 5°/min. In order to ascertain the mechanical properties of the samples, an electronic universal testing machine (Instron, Norwood, MA, USA) was adopted to perform compression tests at room temperature. The strain rate employed in the test was 1 × 10⁻⁴, and the sample was compressed until it broke. Additionally, a superelasticity test was conducted at room temperature utilising an electronic universal testing machine. The strain was compressed at a strain rate of 1 × 10⁻⁴ and unloaded after reaching 6% strain, with the cycle repeated 10 times.

3. Results

3.1. Forming Quality

Figure 2a shows the NiTi samples that were produced using different process parameter. It can be observed that for the D1 (E = 53.3 J/mm3) sample with the lowest energy density, there are macroscopic interlaminar cracks visible to the naked eye. For the A3 (E = 200 J/mm3) and A4 (E = 233.3 J/mm3) samples with higher energy density, there are yellow and purple oxide layers on the surface. Samples within the energy density range of 66.7 to 166.7 J/mm3 exhibit favourable forming quality and an absence of discernible macroscopic manufacturing defects. Figure 2b illustrates the variation in relative density of LPBF NiTi samples as a function of energy density, as determined by the Archimedes drainage method. It can be observed that, with the exception of the A4 sample, the relative density of the remaining samples is above 98%. When the energy density is between 53.3 and 133.3 J/mm3, the relative density can reach above 99%. As the energy density increases, the relative density of the sample decreases overall.

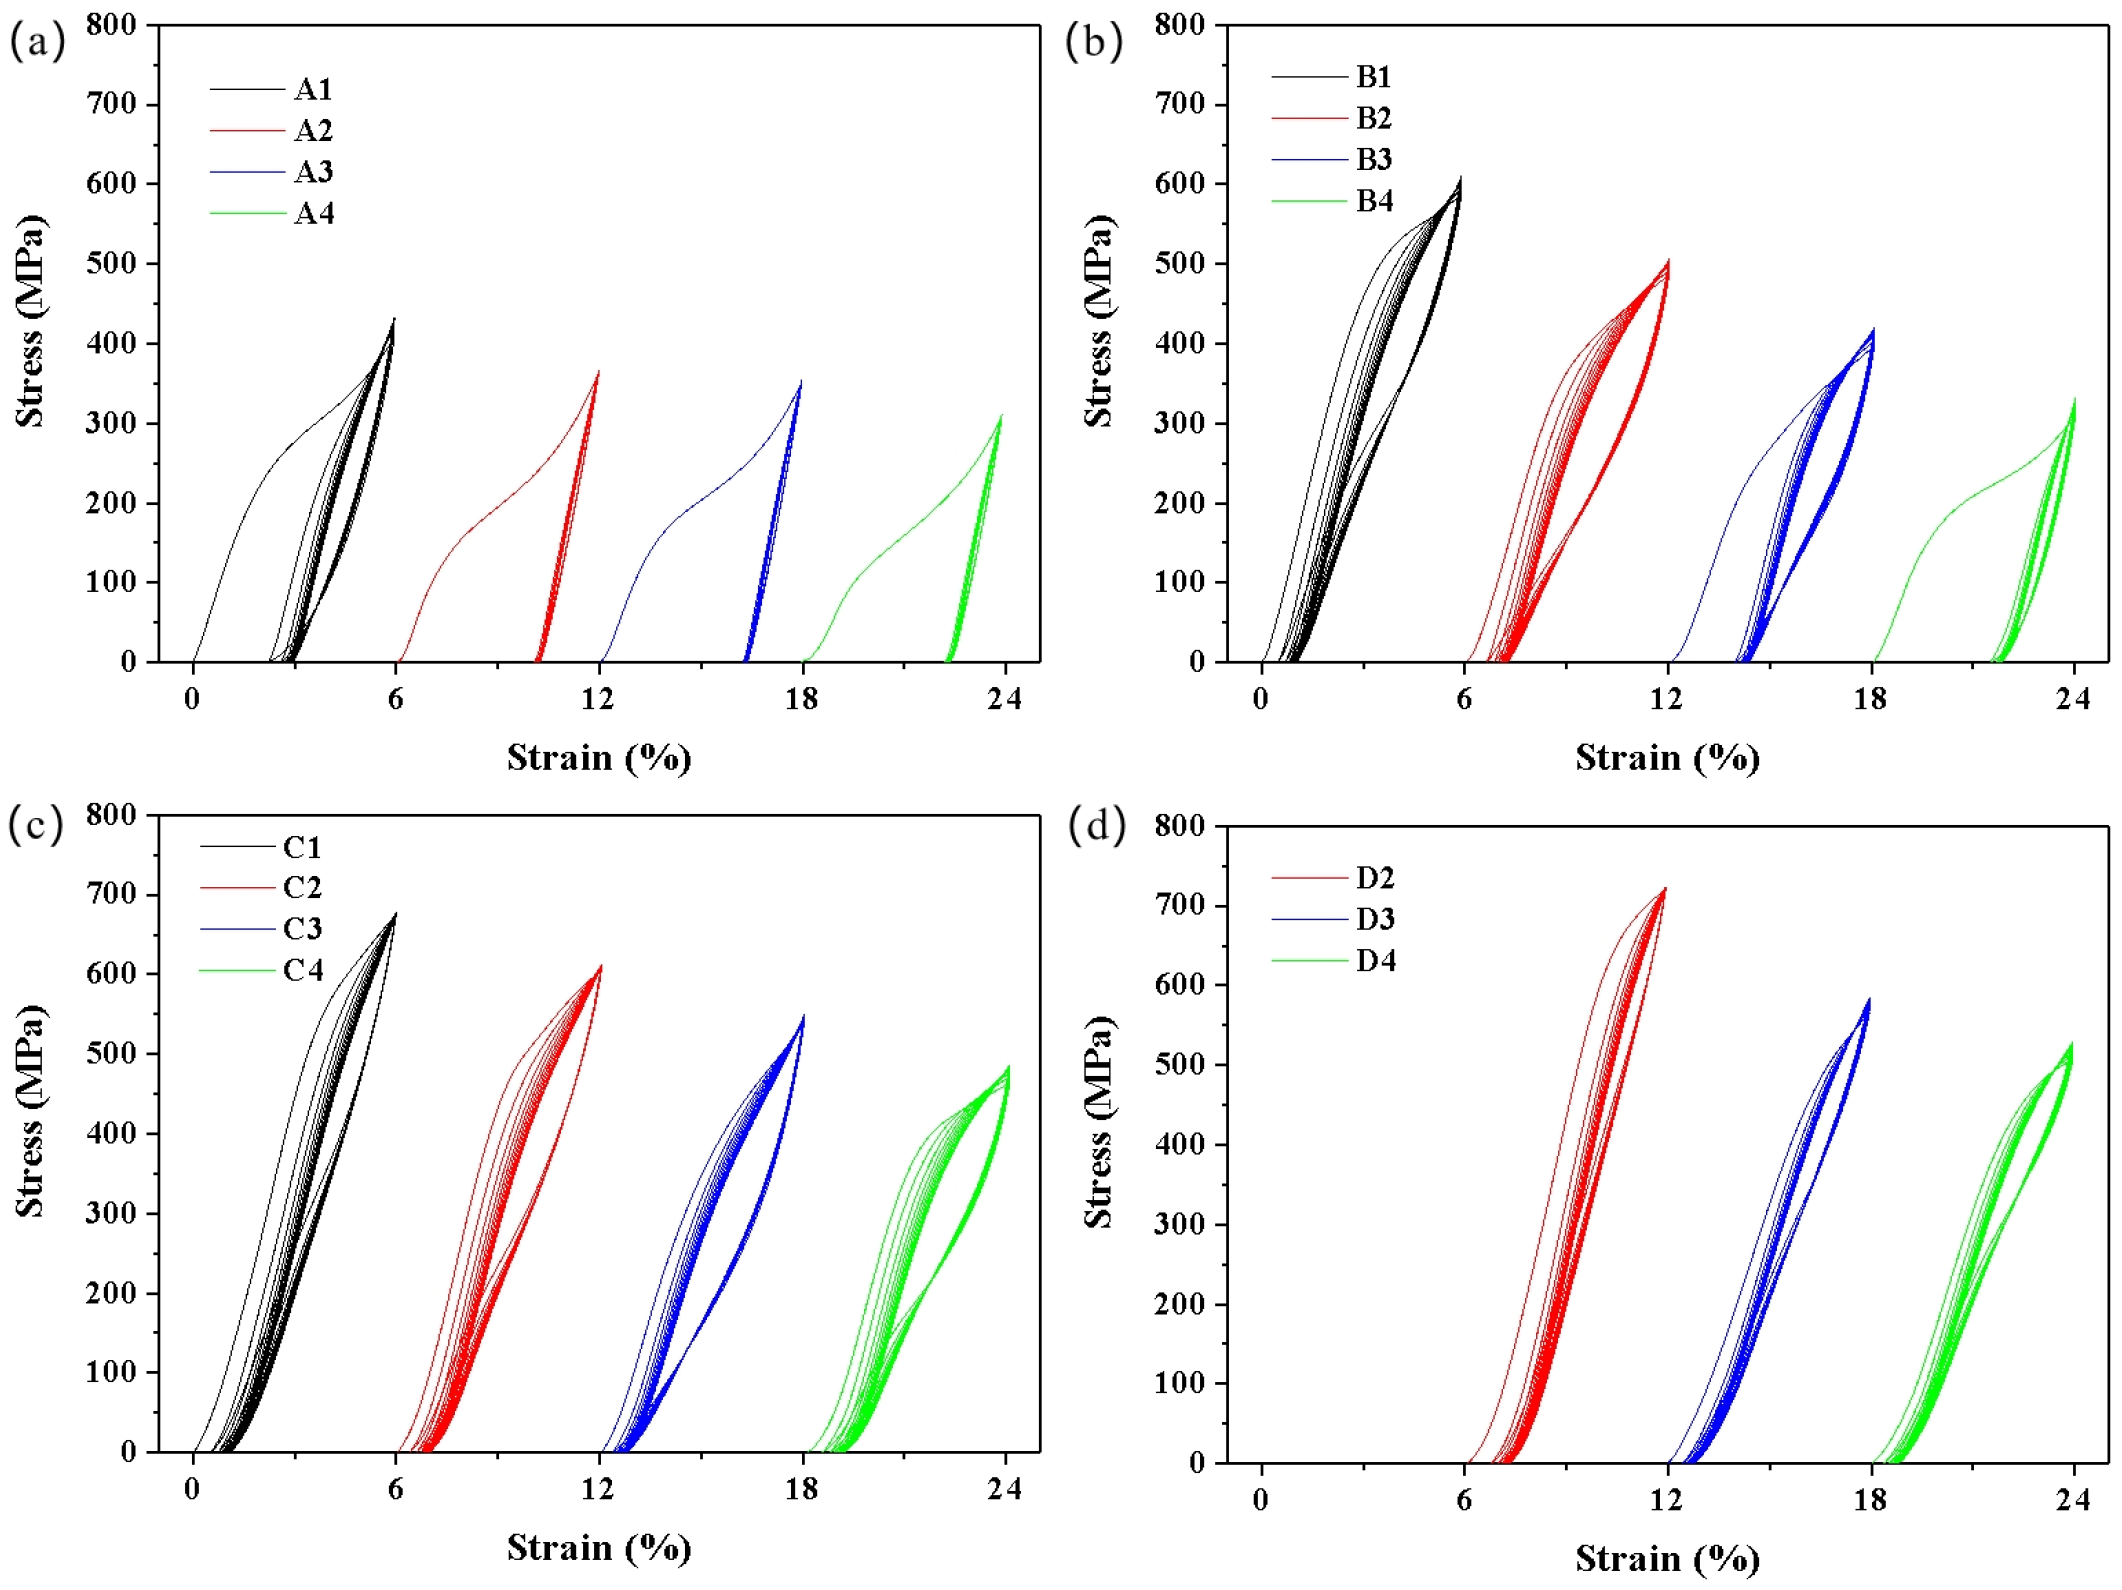
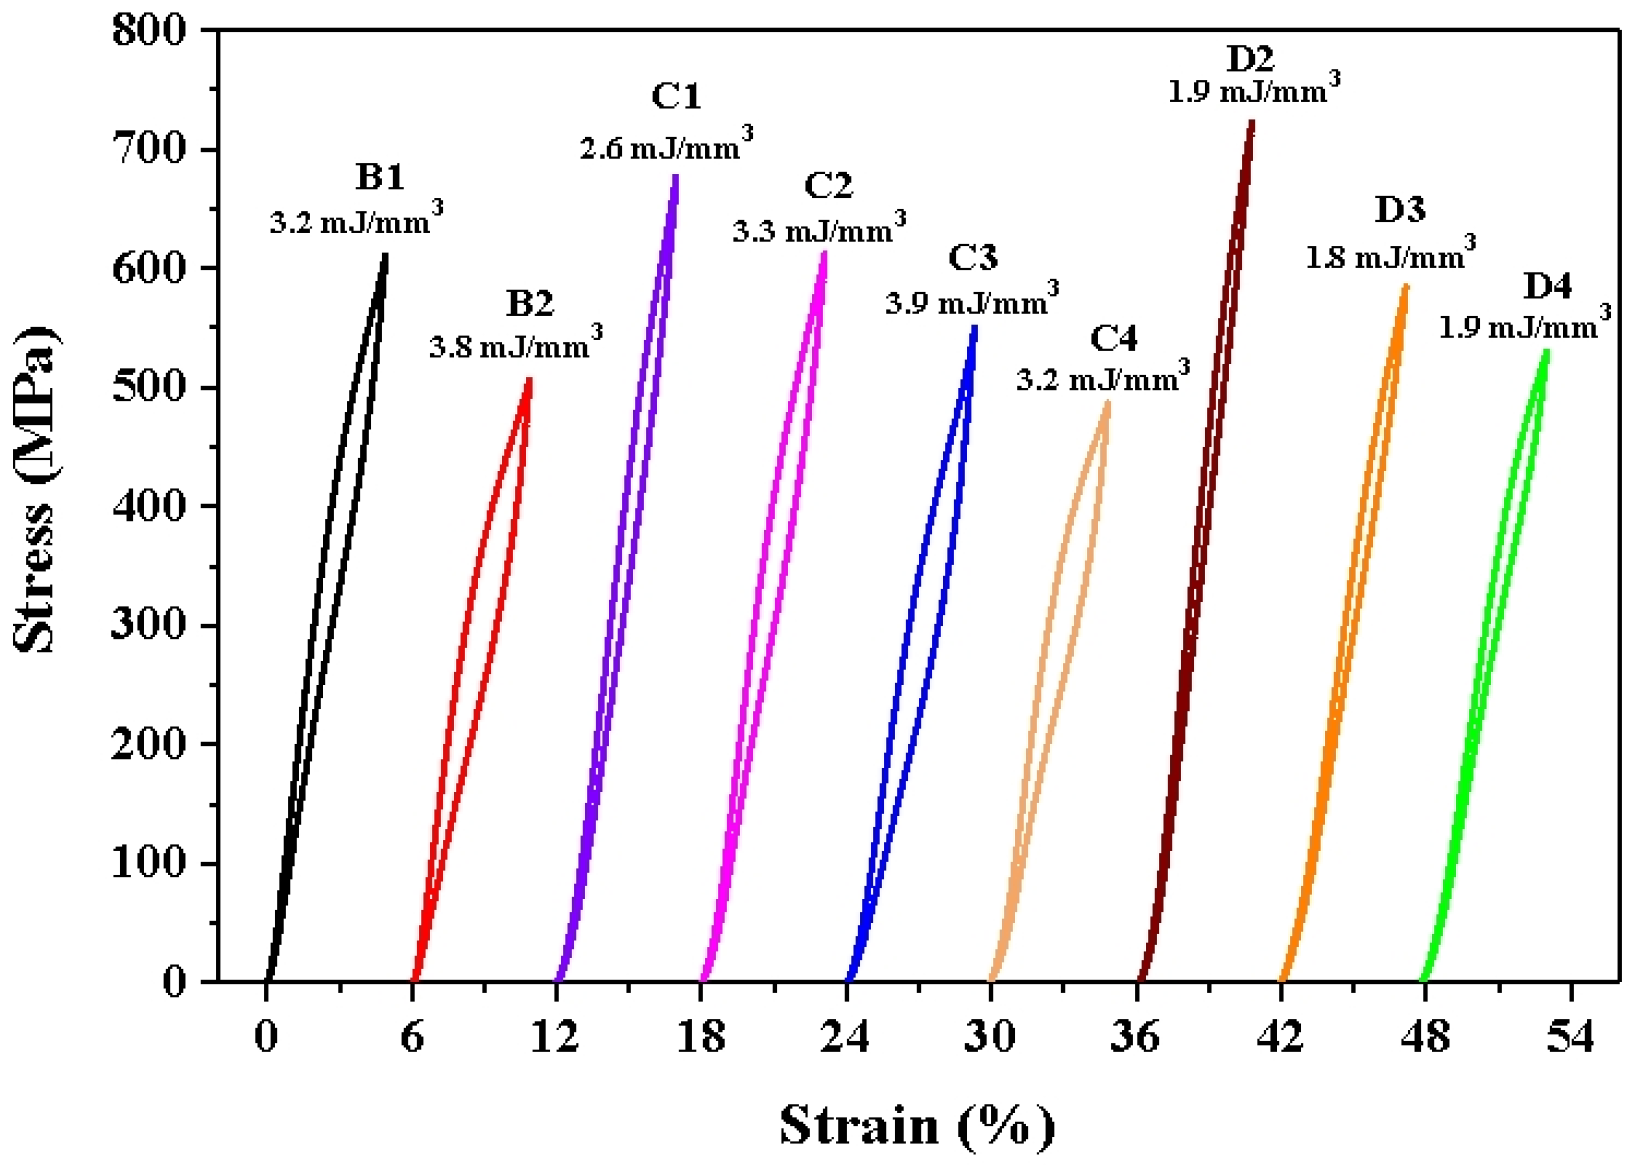
3.2. Compression Property and Superelasticity

In order to investigate the compressive mechanical behaviour of different NiTi samples, the compression test was carried out at room temperature and the stress–strain curve is shown in Figure 3. It should be noted that the D1 sample was not subjected to testing due to the presence of macroscopic cracks. It has been shown that the stress–strain curve of LPBFed NiTi samples exhibits two stress platforms, which can be subdivided into four distinct stages [25]. In the initial stage of loading, the NiTi alloy exhibits elastic deformation, which occurs in stage I. In stage II, the initial stress platform emerges with an increase in strain, marking the onset of stress-induced martensitic transformation or martensitic reorientation in the NiTi alloy. In stage III, the stress-induced martensitic transformation or martensitic reorientation process reaches its conclusion, and the NiTi alloy undergoes elastic deformation of detwinned martensite. In stage IV, a second stress platform emerges as the strain continues to increase, at which point the NiTi alloy begins to yield plastically and ultimately reaches its breaking point.
Furthermore, in order to investigate the superelastic properties of various NiTi samples, cyclic compression tests at 6% strain were conducted at room temperature. The resulting stress–strain curves are presented in Figure 4. The D1 sample was not subjected to this testing either. It can be observed that the stress–strain response of the samples demonstrates a gradual tendency towards stability with the increase in the number of cycles. The stress–strain response of the samples differs significantly. Among them, the A2–A4 samples exhibit minimal superelasticity, with residual strains of 4.3%, 4.2%, and 4.2% after 10 cycles, respectively. Samples A1, B3, and B4 exhibited partial superelasticity, with a recovery rate of 3.1%, 3.7%, and 2.2% after ten cycles, respectively. The B1, B2, C1–C4, and D2–D4 samples display excellent superelasticity, with a recovery rate of over 5.5% at the initial compression, up to 5.7%, and after 10 cycles, they still exhibit a recovery rate of over 5.0%, up to 5.3%.
In order to facilitate a comparative analysis of the mechanical properties exhibited by disparate NiTi samples, the tangent method was employed to calculate the change in phase transition stress and yield stress with energy density, as shown in Figure 5a. It can be observed that within the energy density range of 53.3 to 233.3 J/mm3 there is a considerable degree of variation in the phase transformation stress of the sample, with values ranging from 111.6 to 653.8 MPa. Similarly, the yield stress varies between 1022.7 and 1308.0 MPa. With the increase in energy density, both the phase transformation stress and yield strength demonstrate a gradual downward trend. The A4 sample, which has the highest energy density, displays the lowest phase transformation stress (111.6 MPa), whereas the D2 sample, which has the lowest energy density, displays the highest phase transformation critical stress (653.8 MPa).
Moreover, in order to facilitate a comparative analysis of the superelasticity of different NiTi samples, the changes in residual strain and recovery strain with energy density after 10 cycles are calculated and presented in Figure 5b. It can be observed that the recoverable strain is less than 1.8% when the energy density is within the range of 166.7 to 233.3 J/mm3. As the energy density decreases, the recoverable strain of the sample increases gradually. At an energy density of 66.7 to 116.7 J/mm3, the recoverable strain is observed to be essentially stable at approximately 5.0%. Furthermore, the samples with an energy density of 66.7–116.7 J/mm3 (B1, B2, C1–C4, D2–D4) demonstrate comparable recovery rates. However, the corresponding stress–strain hysteresis exhibits a notable disparity, as illustrated in Figure 6. It can be observed that the stress–strain hysteresis increases with the increase in energy density, with a variation range of 1.8 to 3.9 mJ/mm3.

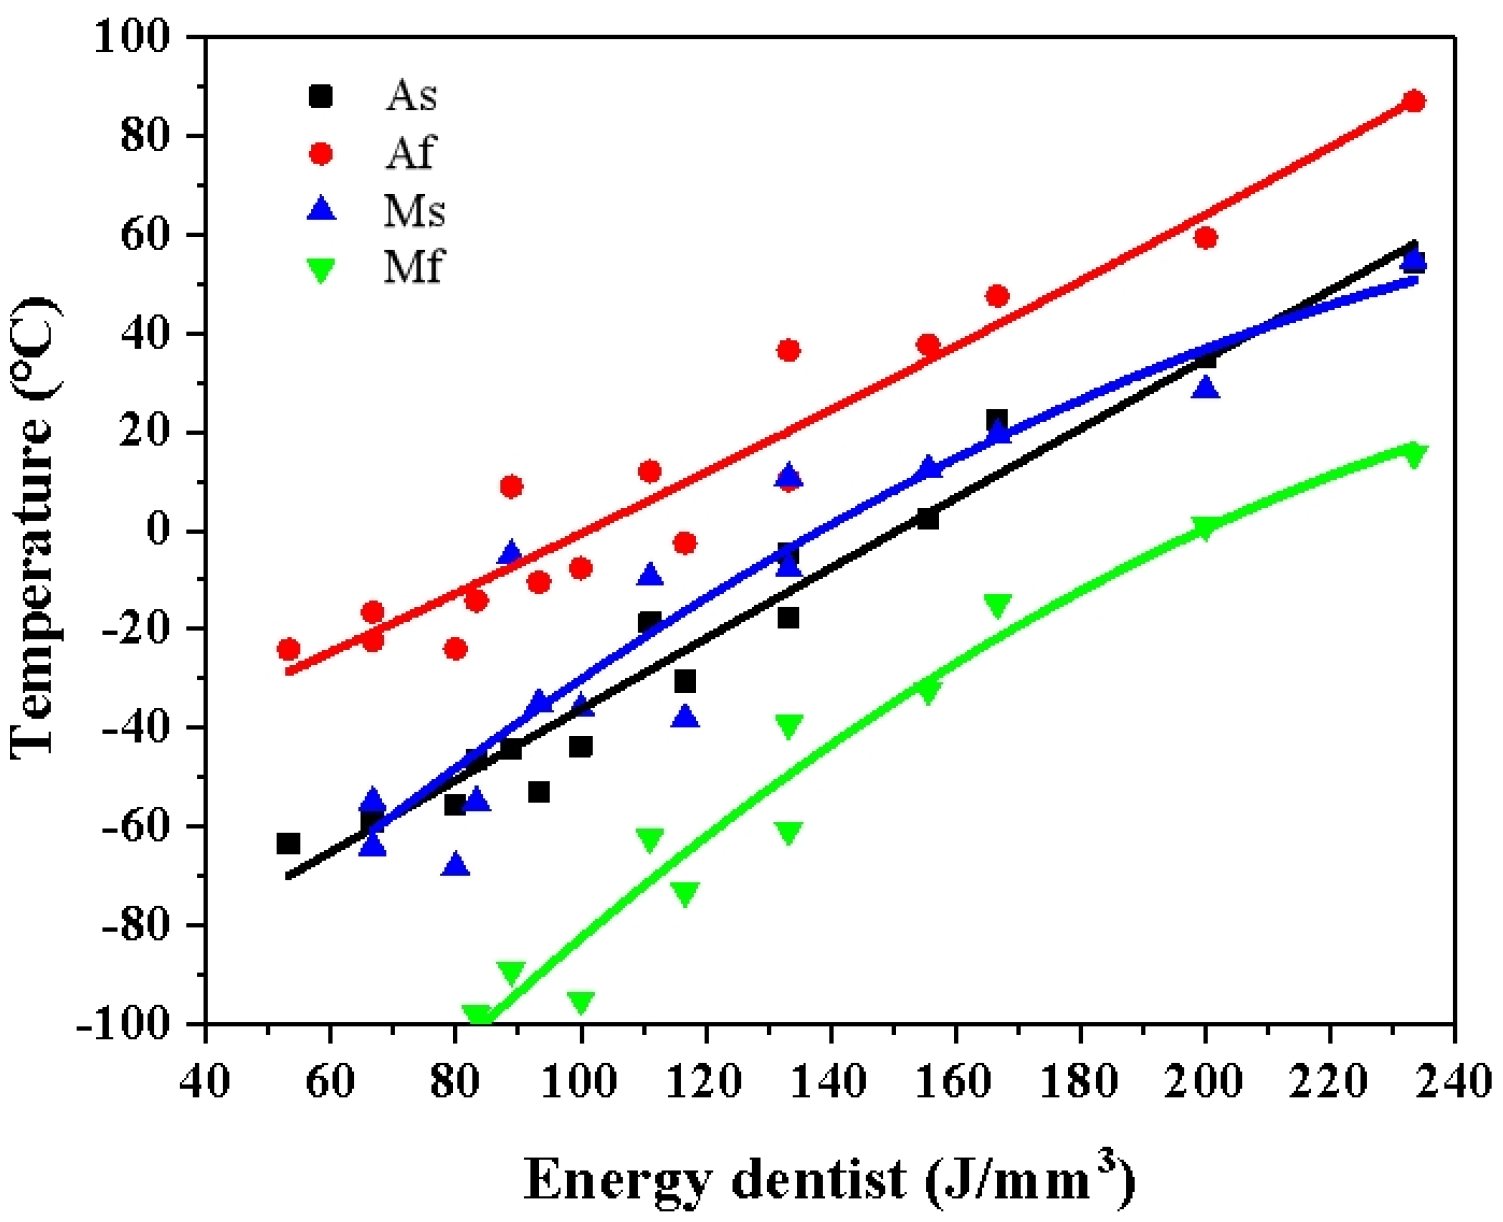
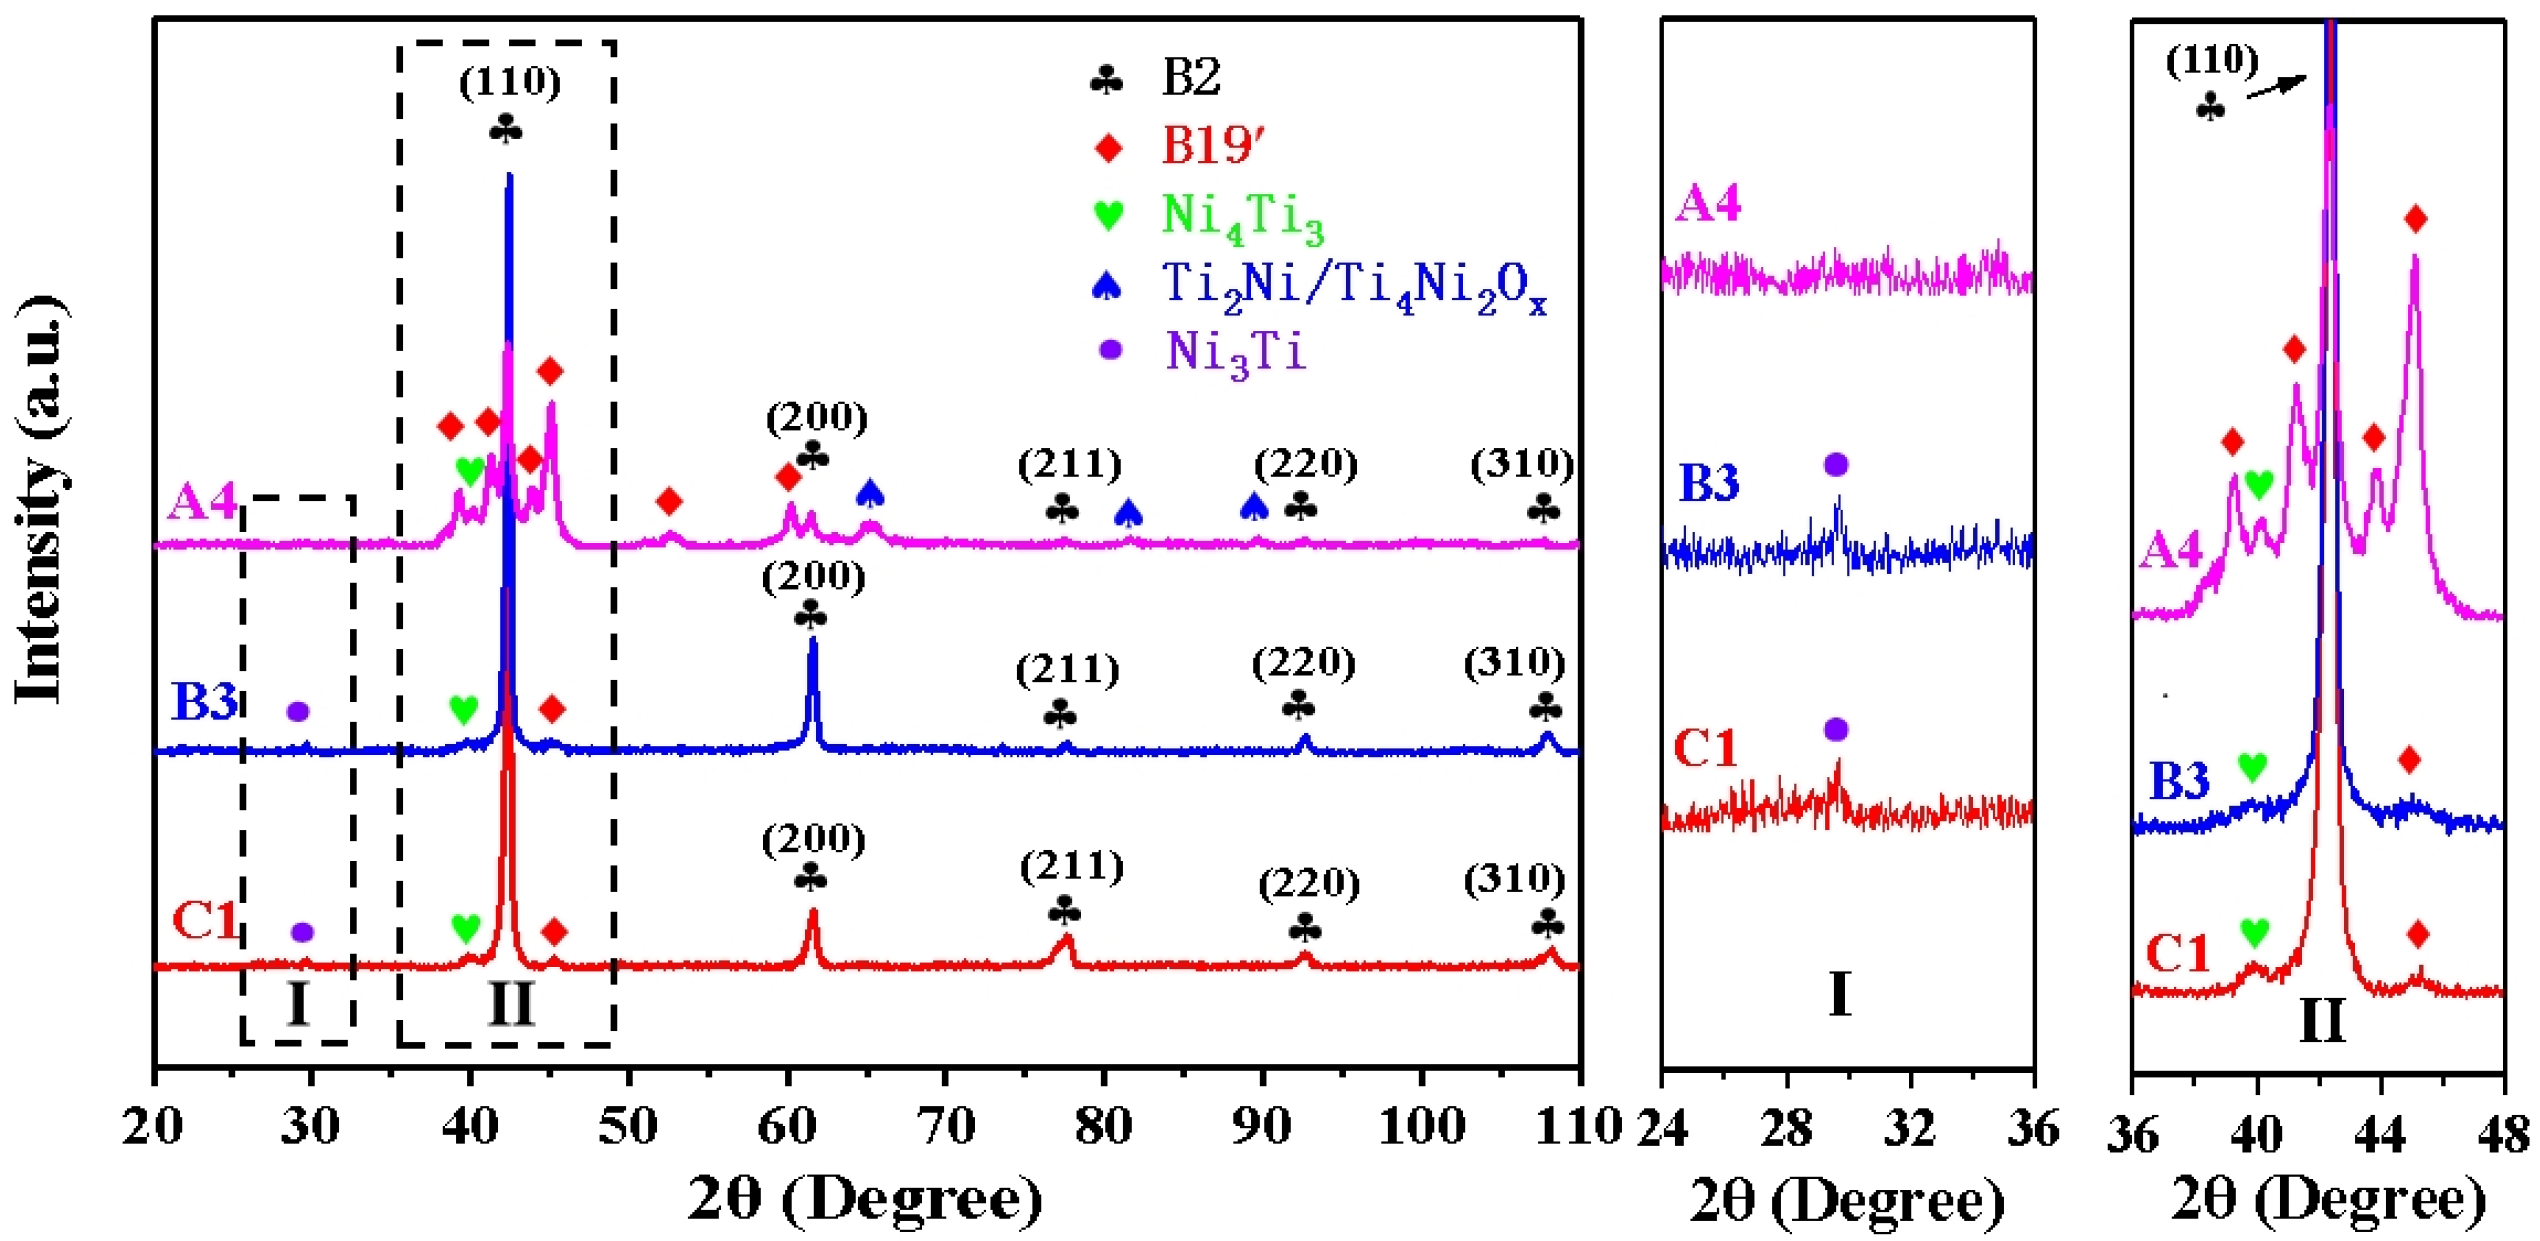
3.3. Phase Transition Behaviour
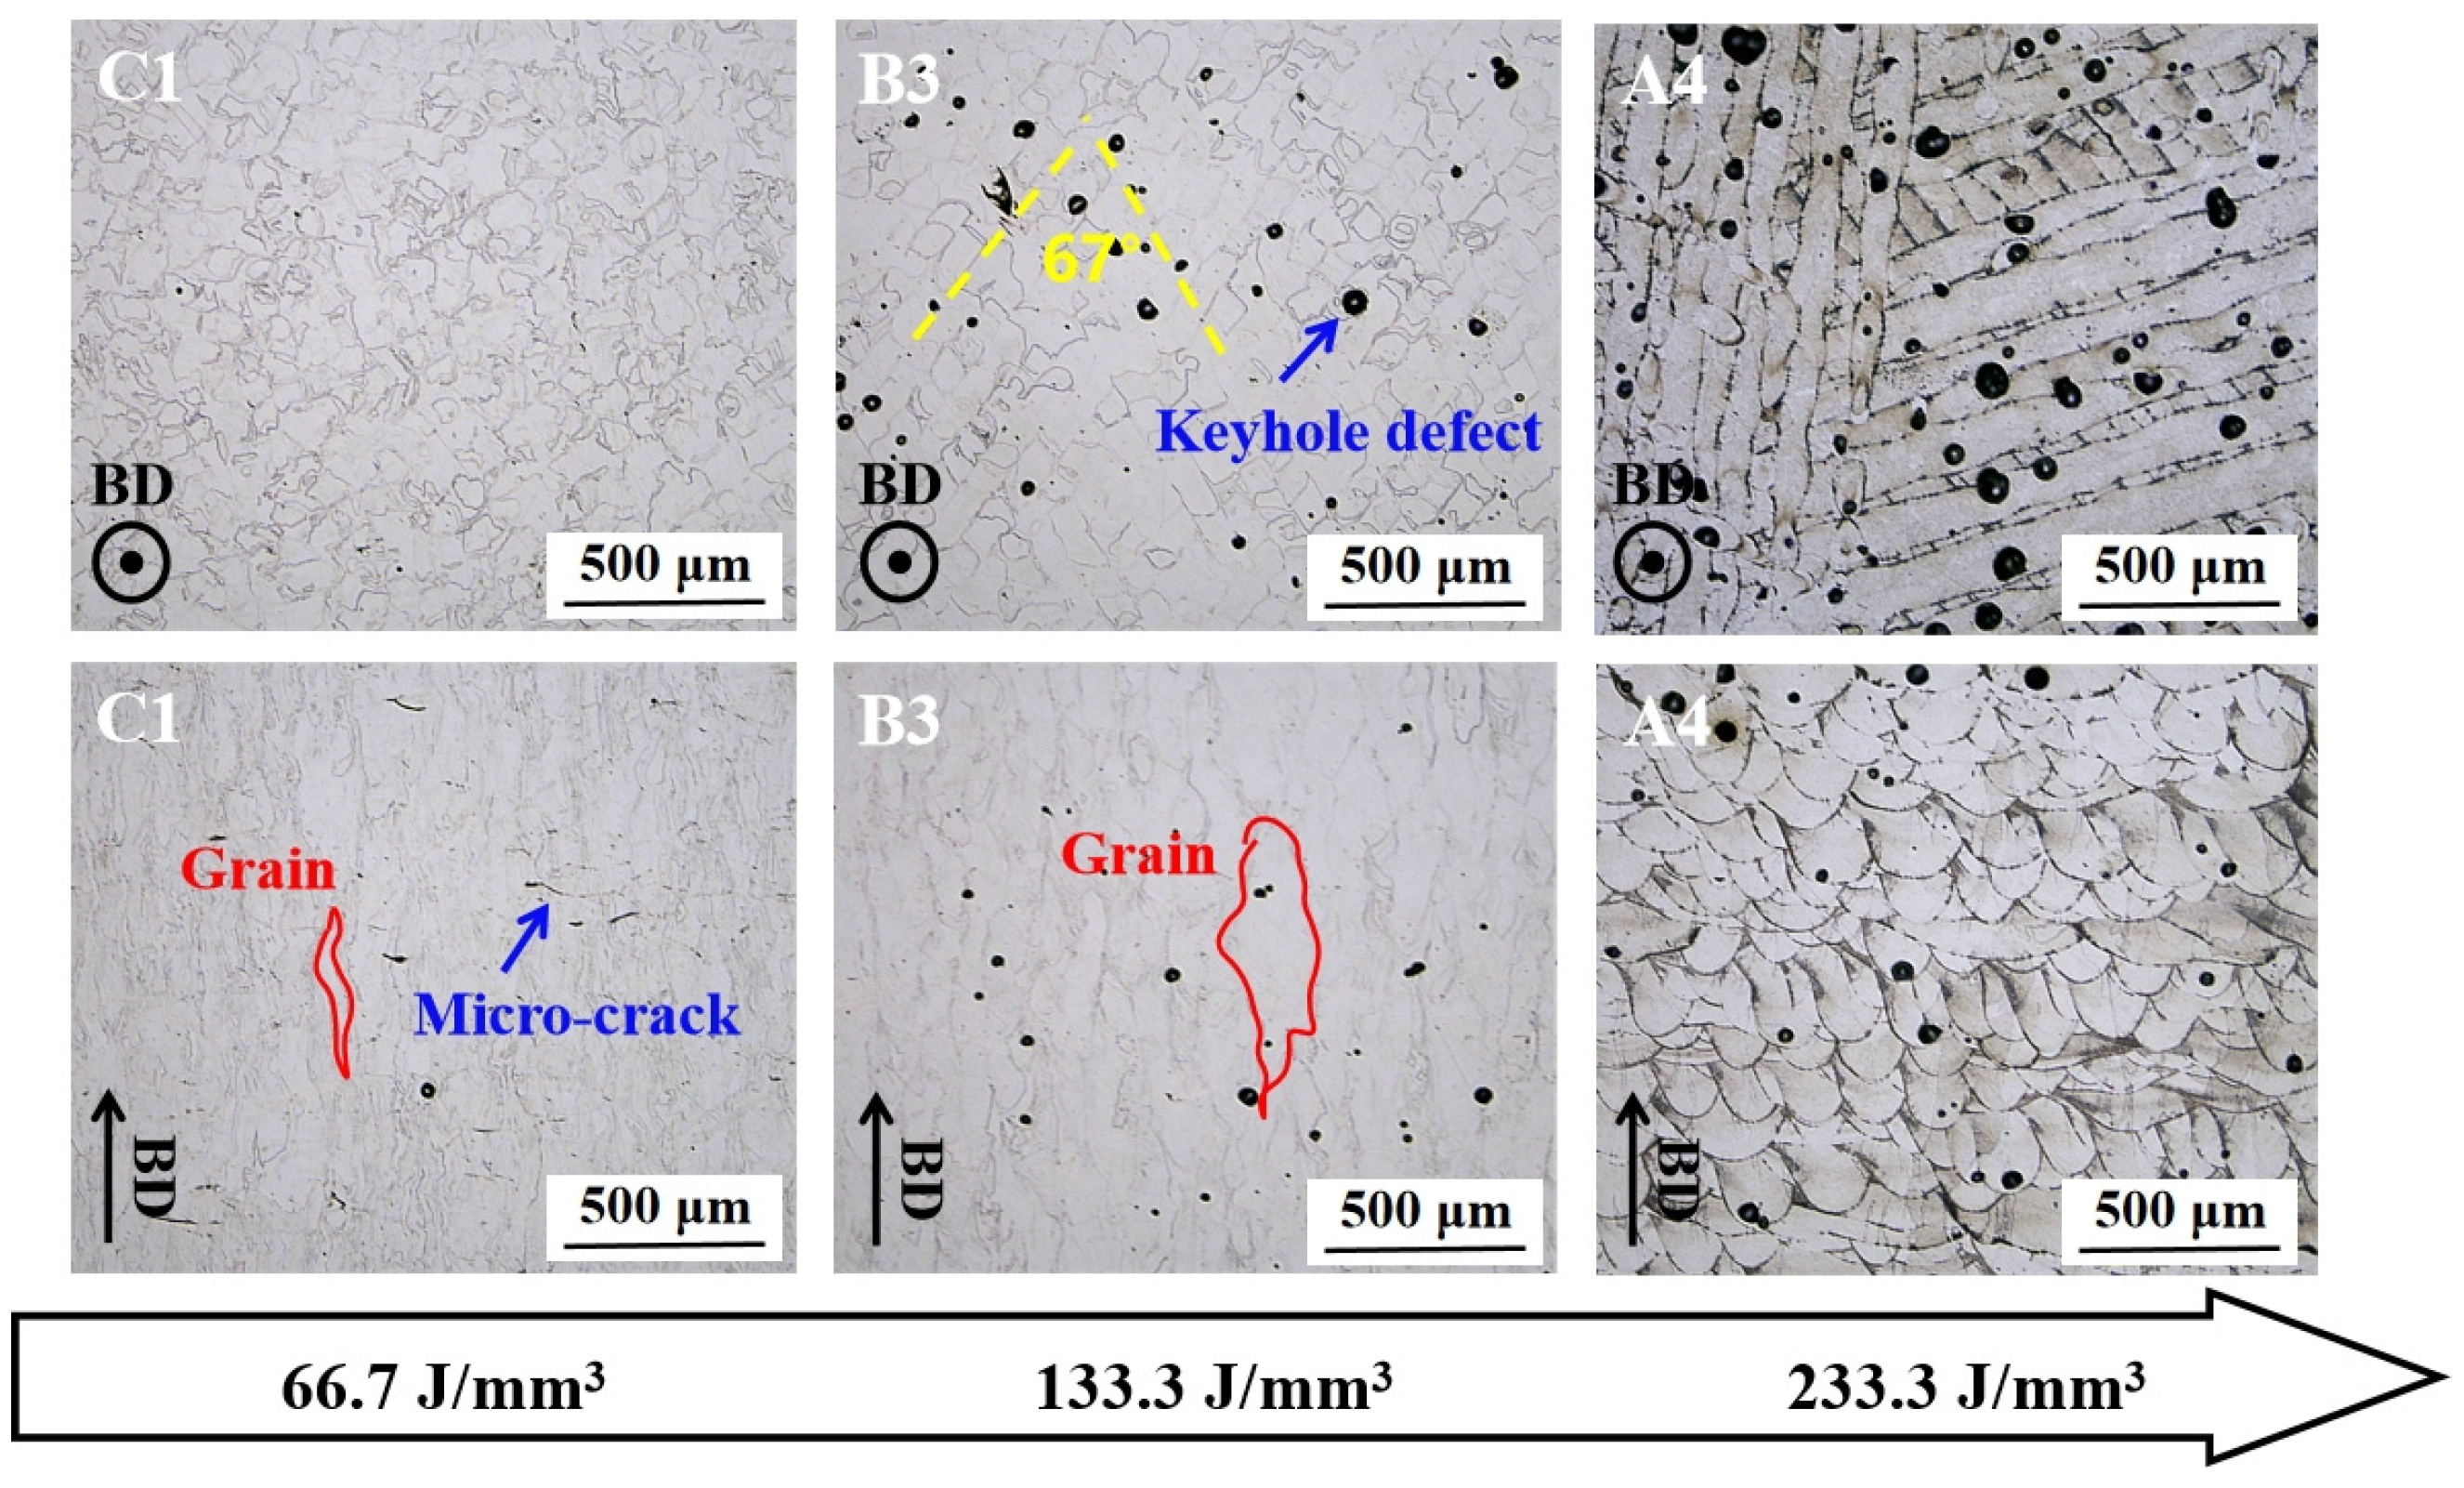
The phase transformation behaviour exerts a direct influence on the mechanical and functional properties of NiTi alloys. Consequently, the phase transformation temperatures of different samples were subjected to testing. Figure 7 illustrates the DSC curves of various NiTi samples during the heating and cooling processes. Figure 8 illustrates the variation trends of the austenite start temperature (As), the austenite finish temperature (Af), the martensite start temperature (Ms), and the martensite finish temperature (Mf) in relation to energy density. It can be observed that all NiTi samples undergo a first-order martensite–austenite transformation, with the phase transition temperature of the samples increasing in line with the rise in energy density. The temperature ranges of As, Af, Ms, and Mf are −63.3 °C to 54.1 °C, −24.1 °C to 86.9 °C, −68.1 °C to 54.9 °C, and 98 °C to 15.4 °C, respectively. The Mf temperature of the C1 and D1–D4 samples is below −100 °C, which is outside the specified measurement range. It is noteworthy that the Ms and Mf values of the A1, B1–B3, C1–C4, and D1–D3 samples are lower than the room temperature (20 °C). This indicates that these samples are predominantly in the austenite phase at room temperature, exhibiting primarily superelasticity and have high recoverable strain after compression. The Ms values of the A2–A4 and D4 samples are higher than room temperature, while the Mf is lower than room temperature, indicating that these samples retain the martensite phase at room temperature. Consequently, they exhibit shape memory effects and have low recoverable strain after compression. The DSC results are consistent with the trend of superelasticity (Figure 4 and Figure 5).
Given the considerable number of samples, C1 (66.7 J/mm3), B3 (133.3 J/mm3), and A4 (233.3 J/mm3) were selected for XRD phase identification, as they were produced using different printing process parameters and exhibited notable differences in superelasticity. This was done with a view to providing further proof of the phase composition of the various NiTi samples at room temperature. Figure 9 illustrates the XRD outcomes of the C1, B3, and A4 samples at room temperature. It can be observed that the diffraction peaks of the C1 and B3 samples predominantly correspond to those of the B2 austenite phase, exhibiting a distinct orientation along the (110) and (200) planes. This indicates that the C1 and B3 samples are primarily in the austenite phase at room temperature, a conclusion that is supported by the DSC results (Figure 7 and Figure 8). It is noteworthy that the diffraction peaks of Ni3Ti and Ni4Ti3 Ni-rich phases were also identified in the C1 and B3 samples. In the case of the A4 sample, the intensity of the diffraction peak associated with the austenite phase is observed to decrease, while a considerable number of B19′ martensite diffraction peaks emerge. This indicates that the A4 sample is a composite phase comprising both austenite and martensite at room temperature, which is also corroborated by the DSC results. It is noteworthy that the Ni3Ti phase was not identified in the A4 sample, but the Ni4T3 Ni-rich phase and the Ti2Ni/Ti4Ni2Ox Ti-rich phase were identified. As Ni3Ti and Ti2Ni/Ti4Ni2Ox do not contribute to superelasticity, they will not be the subject of further detailed discussion in this context.

3.4. Microstructure

The microstructure is another significant factor influencing the macroscopic properties of NiTi alloys. Similarly, the C1, B3, and A4 samples, which had been printed at different energy densities, were selected for metallographic observation under an optical microscope. Figure 10 depicts the optical microscopic image of the corresponding samples in both the horizontal section (perpendicular to the building direction) and the vertical section (parallel to the building direction). It can be observed that the C1 sample, which was printed with a lower energy density, exhibited minimal hole defects, although some microcracks were present. The B3 and A4 samples, which were printed with a higher energy density, exhibited a considerable number of circular keyhole defects. Furthermore, an increase in energy density was accompanied by a gradual increase in the size and number of pores. The results align with the observed trend of relative density decreasing with energy density, as illustrated in Figure 2b. Additionally, the laser-scanned melting channel and the interlayer rotation angle of 67° are clearly discernible in the horizontal section. In the vertical section, the columnar crystal grains epitaxially grown along the building direction are evident, and the grain size increases with the increase in energy density.
Figure 11 illustrates the SEM micrographs of the C1, B3, and A4 samples in the vertical direction. It is evident that the C1 sample exhibits defects resulting from incomplete fusion, which are reflected in the microcracks observed in Figure 10. Furthermore, the C1 sample displays the presence of columnar crystals aligned in the building direction. No discernible grains were observed in the B3 and A4 samples. However, the A4 sample exhibited the presence of needle-like black stripes. In light of the DSC and XRD results for the A4 sample, which indicated the formation of martensite, it can be postulated that the aforementioned needle-like stripes may be indicative of martensite bands (Figure 11d). It is noteworthy that black nano-precipitates (illustrated by yellow arrows in Figure 11e,f) were observed in the high-resolution SEM images of the C1 and A4 samples. The C1 sample exhibited a relatively higher number of black precipitates with a relatively smaller size, whereas the A4 sample displayed a relatively lower number of black precipitates with a relatively larger size. The XRD results indicate the presence of Ni4Ti3 precipitates in both the C1 and A4 samples, which allows for inferring reasonably that the black precipitate is Ni4Ti3.

4. Discussion

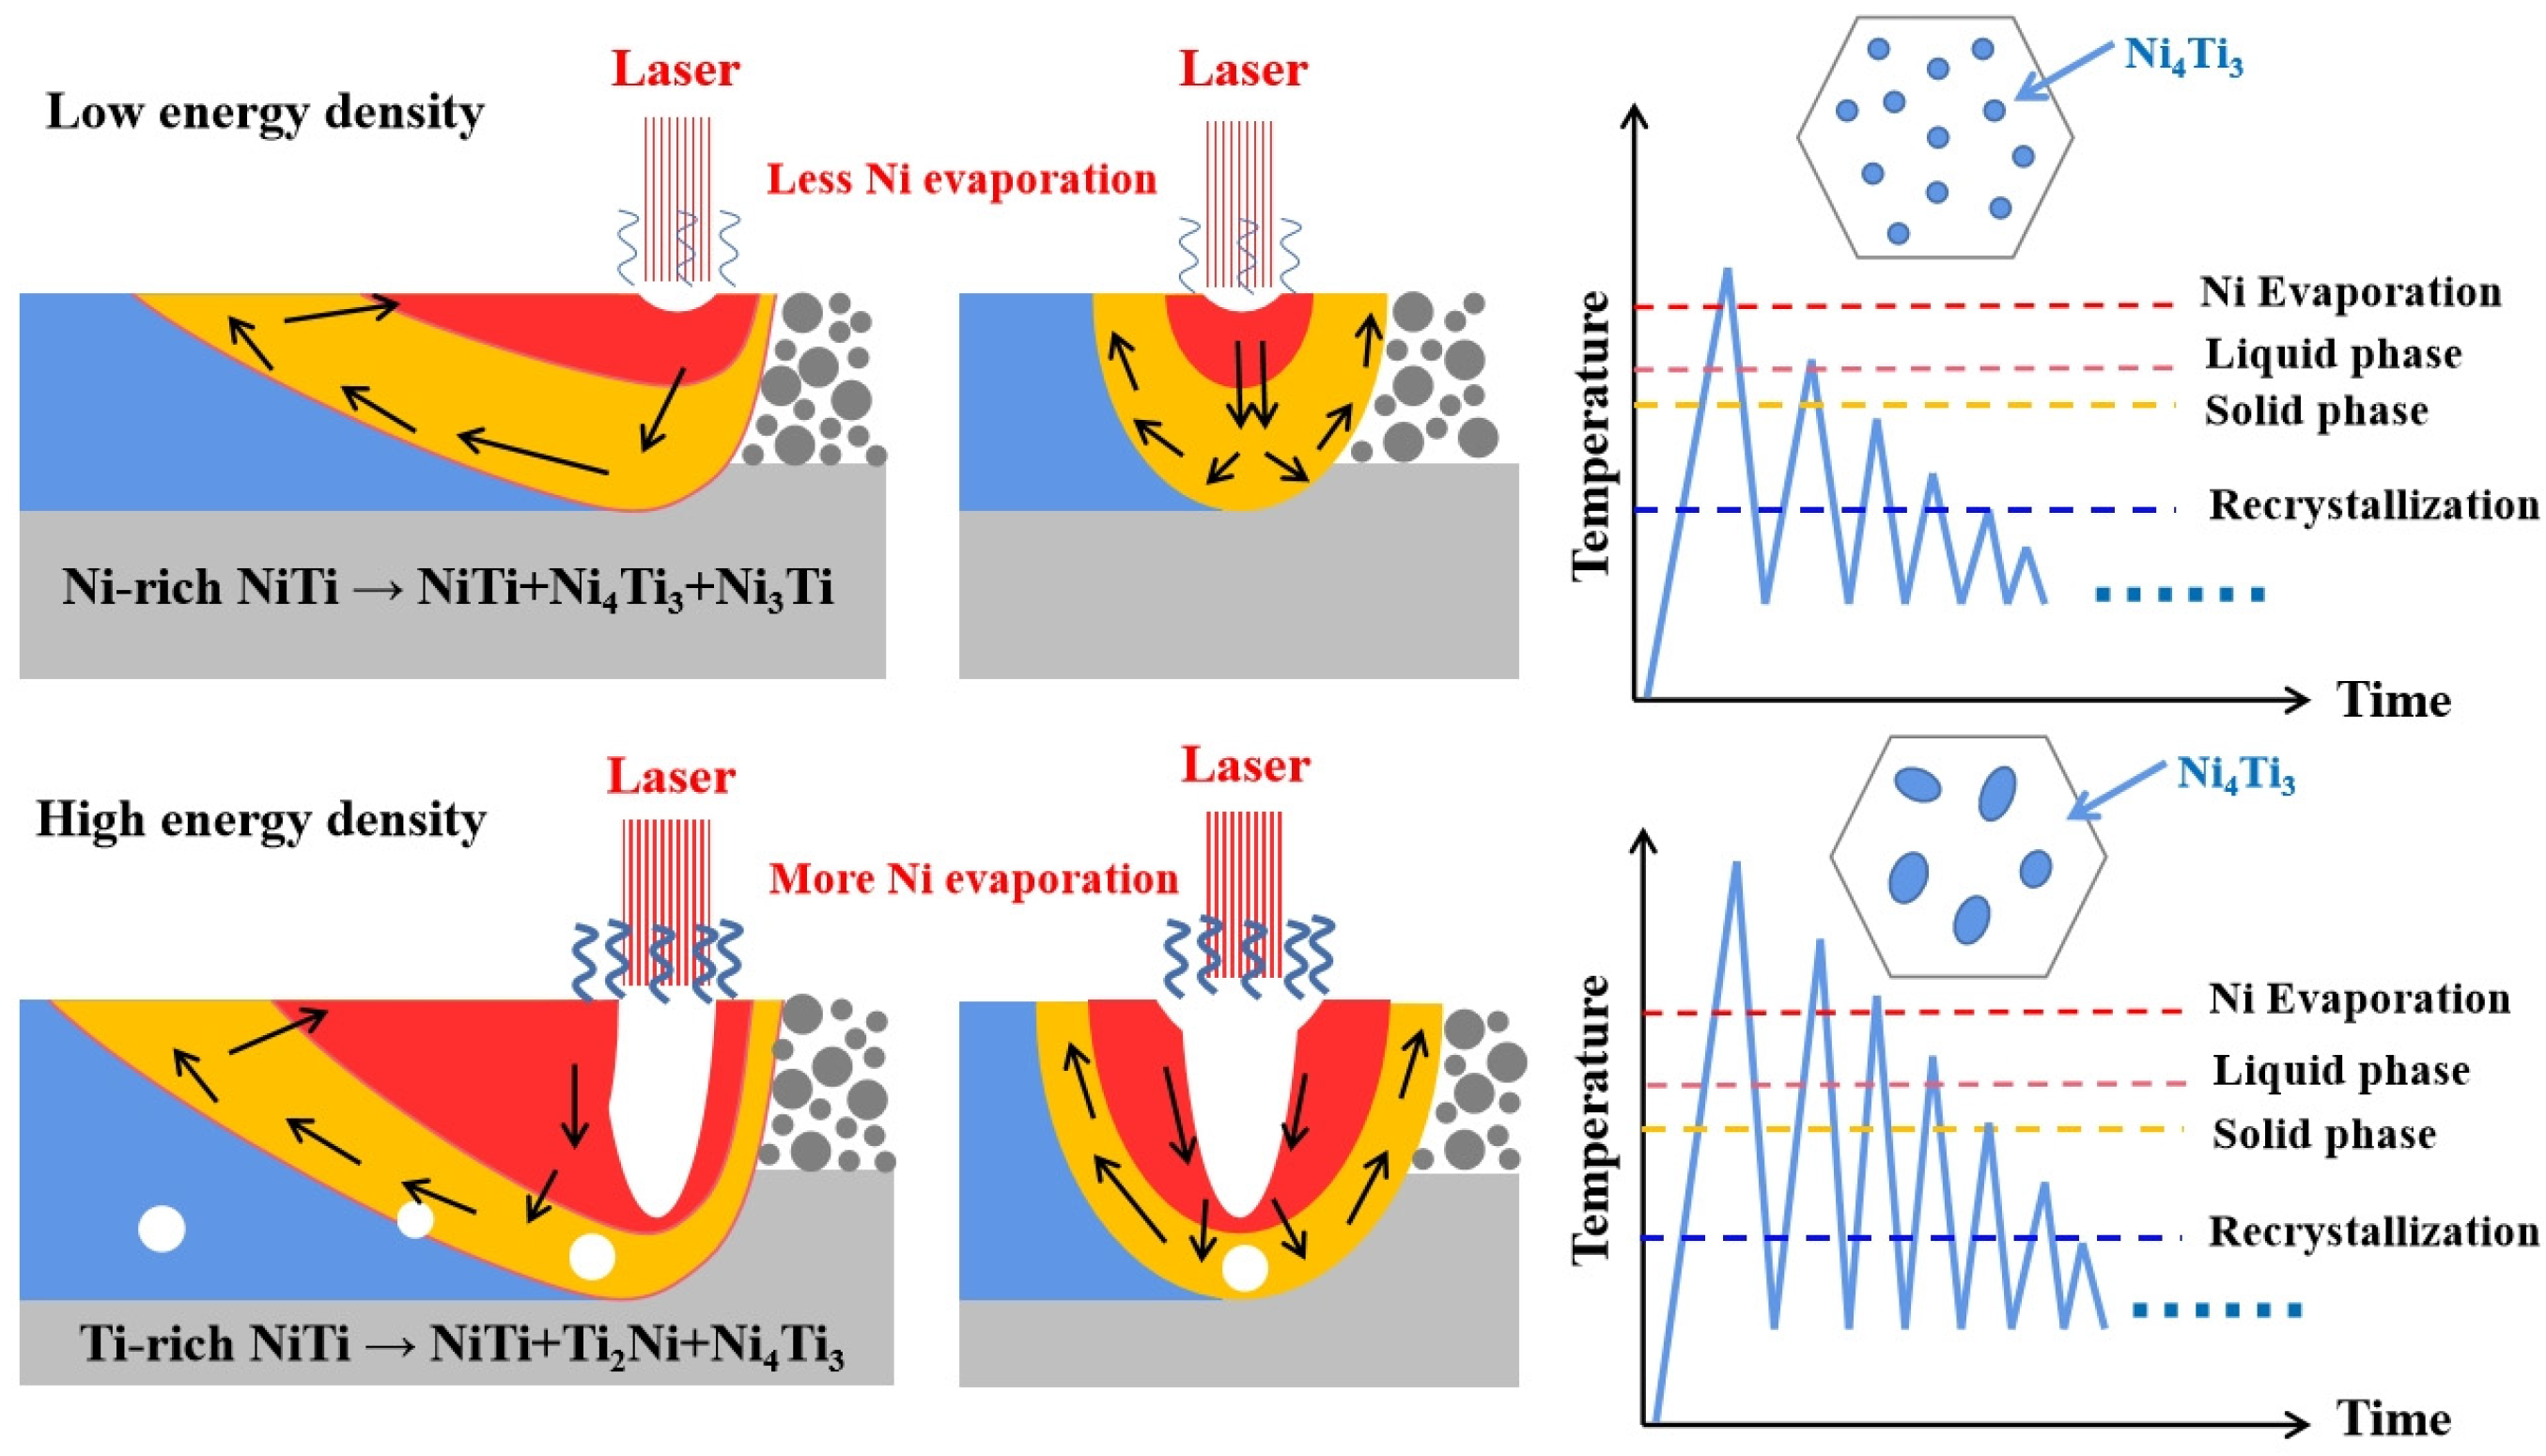
4.1. Phase Transformation Behaviour and Microstructure Evolution

The thermal history of the molten pool of NiTi alloy varies depending on the specific LPBF process parameters employed, as a consequence of the varying degrees of laser energy absorption. This, in turn, gives rise to disparate phase transformation behaviours and microstructures. The phase transformation behaviour of the NiTi alloy is contingent upon the phase transformation temperature, which is markedly influenced by the Ni content. Figure 12 illustrates the Ni content of the C1, C3, B3, A2, and A4 samples, as determined by EDS surface scanning. It can be observed that the Ni content in the samples decreases gradually with an increase in the energy density input. The Ni contents of the C1, C3, and B3 samples were found to be 50.67%, 50.68%, and 50.21%, respectively, indicating that these samples remained Ni-rich. In contrast, the Ni contents of the A2 and A4 samples decreased to 49.80% and 49.54%, respectively, indicating that these samples had undergone a transformation into Ti-rich. This is due to the fact that the evaporation enthalpy and boiling point temperature of Ni element (374.8 kJ/mol, 2913 °C) are smaller than that of Ti element (425.5 kJ/mol, 3287 °C). As the energy density increases, the temperature and size of the molten pool rise, the solidification time lengthens, the selective evaporation loss of Ni is greater, and the ratio of Ni/Ti decreases [26,27]. This results in an elevated phase transition temperature (Figure 8).
With regard to microstructure, it has been observed that when the energy density exceeds 133.3 J/mm3, the LPBF NiTi alloy exhibits distinct keyhole defects (Figure 10). This phenomenon can be attributed to the fact that an elevated energy density causes the molten pool to transition from a conduction mode to a keyhole mode during the laser scanning process. As the energy input increases, the molten pool undergoes a change from a stable, shallow concave state to an unstable, deep concave keyhole state, driven by the action of an evaporation recoil force [28,29]. The combined effects of convection, the Marangoni effect, and surface tension resulted in the gradual closure of the keyhole, which remained inside the molten pool and ultimately formed a substantial volume of keyhole defects [30]. Furthermore, LPBF NiTi exhibits columnar crystals aligned with the building direction, with an increase in grain size observed with elevated energy input (Figure 10). The formation of oriented columnar crystals is a consequence of the pronounced temperature gradient present within the molten pool during laser scanning. The grains invariably exhibit a tendency to grow in the direction of the largest temperature gradient (i.e., the building direction). At elevated energy densities, the molten pool temperature is elevated, resulting in a reduced solidification rate and an extended growth period for the grain, which in turn leads to an increase in grain size.
It is noteworthy that, in addition to the NiTi matrix, LPBFed Ni-rich NiTi alloys under different process parameters exhibit different precipitates. The lower energy density C1 and B3 samples exhibit Ni3Ti and Ni4Ti3 Ni-rich precipitates, whereas the higher energy density A4 sample displays both Ni4Ti₃ Ni-rich precipitates and Ti₂Ni/Ti₄Ni₂Ox Ti-rich precipitates (Figure 9). Figure 13 illustrates the evolution of the NiTi molten pool and precipitated phase in response to varying energy density inputs. During LPBF laser scanning, the molten pool undergoes a series of processes, including powder melting, melt flow, and solidification. These processes occur successively, and the molten pool is subjected to cyclic heat under subsequent multi-channel and multi-layer scanning [31]. At low energy density, the molten pool is of a smaller size, the temperature is lower, the solidification rate is faster, the Ni element evaporates to a lesser extent, and the melt is consistently in the Ni-rich state. Furthermore, the Ni3Ti and Ni4Ti3 phases precipitate during the subsequent non-equilibrium solidification process under the influence of cyclic heat. At this point in the process, the majority of the Ni element present in the matrix is consumed by the precipitation of Ni-rich phases. In the event of a high energy density input, the dimensions of the molten pool increase, the temperature of the molten pool rises, and the rate of solidification decelerates. The temperature of the molten pool remains above the Ni evaporation temperature line for an extended period, resulting in the evaporation of a considerable quantity of Ni. At this point, the majority of the Ni element in the matrix is lost through evaporation, resulting in a transformation of the melt into a Ti-rich state. During the subsequent solidification process, the precipitation of the Ti2Ni/Ti4Ni2Ox Ti-rich phase occurs. Furthermore, the precipitation of the Ti-rich phase in Ti2Ni/Ti4Ni2Ox will also result in an increase in the proportion of Ni element in the matrix, as well as the self-ageing precipitation of the Ni4Ti3 phase under the subsequent cyclic heat action. A number of studies have demonstrated that the size and distribution of Ni4Ti3 precipitates in LPBF NiTi alloys are significantly influenced by the laser energy density. In particular, the formation of a fine and uniformly distributed Ni4Ti3 phase is readily achieved under low energy density input. As the energy density input is increased, Ni4Ti3 agglomerates and the particle size increases gradually, while its distribution in the NiTi matrix decreases significantly [32,33]. The black nano-precipitates in Figure 11e,f exhibit a similar change rule, which can be reasonably inferred to be the Ni4Ti3 phase.

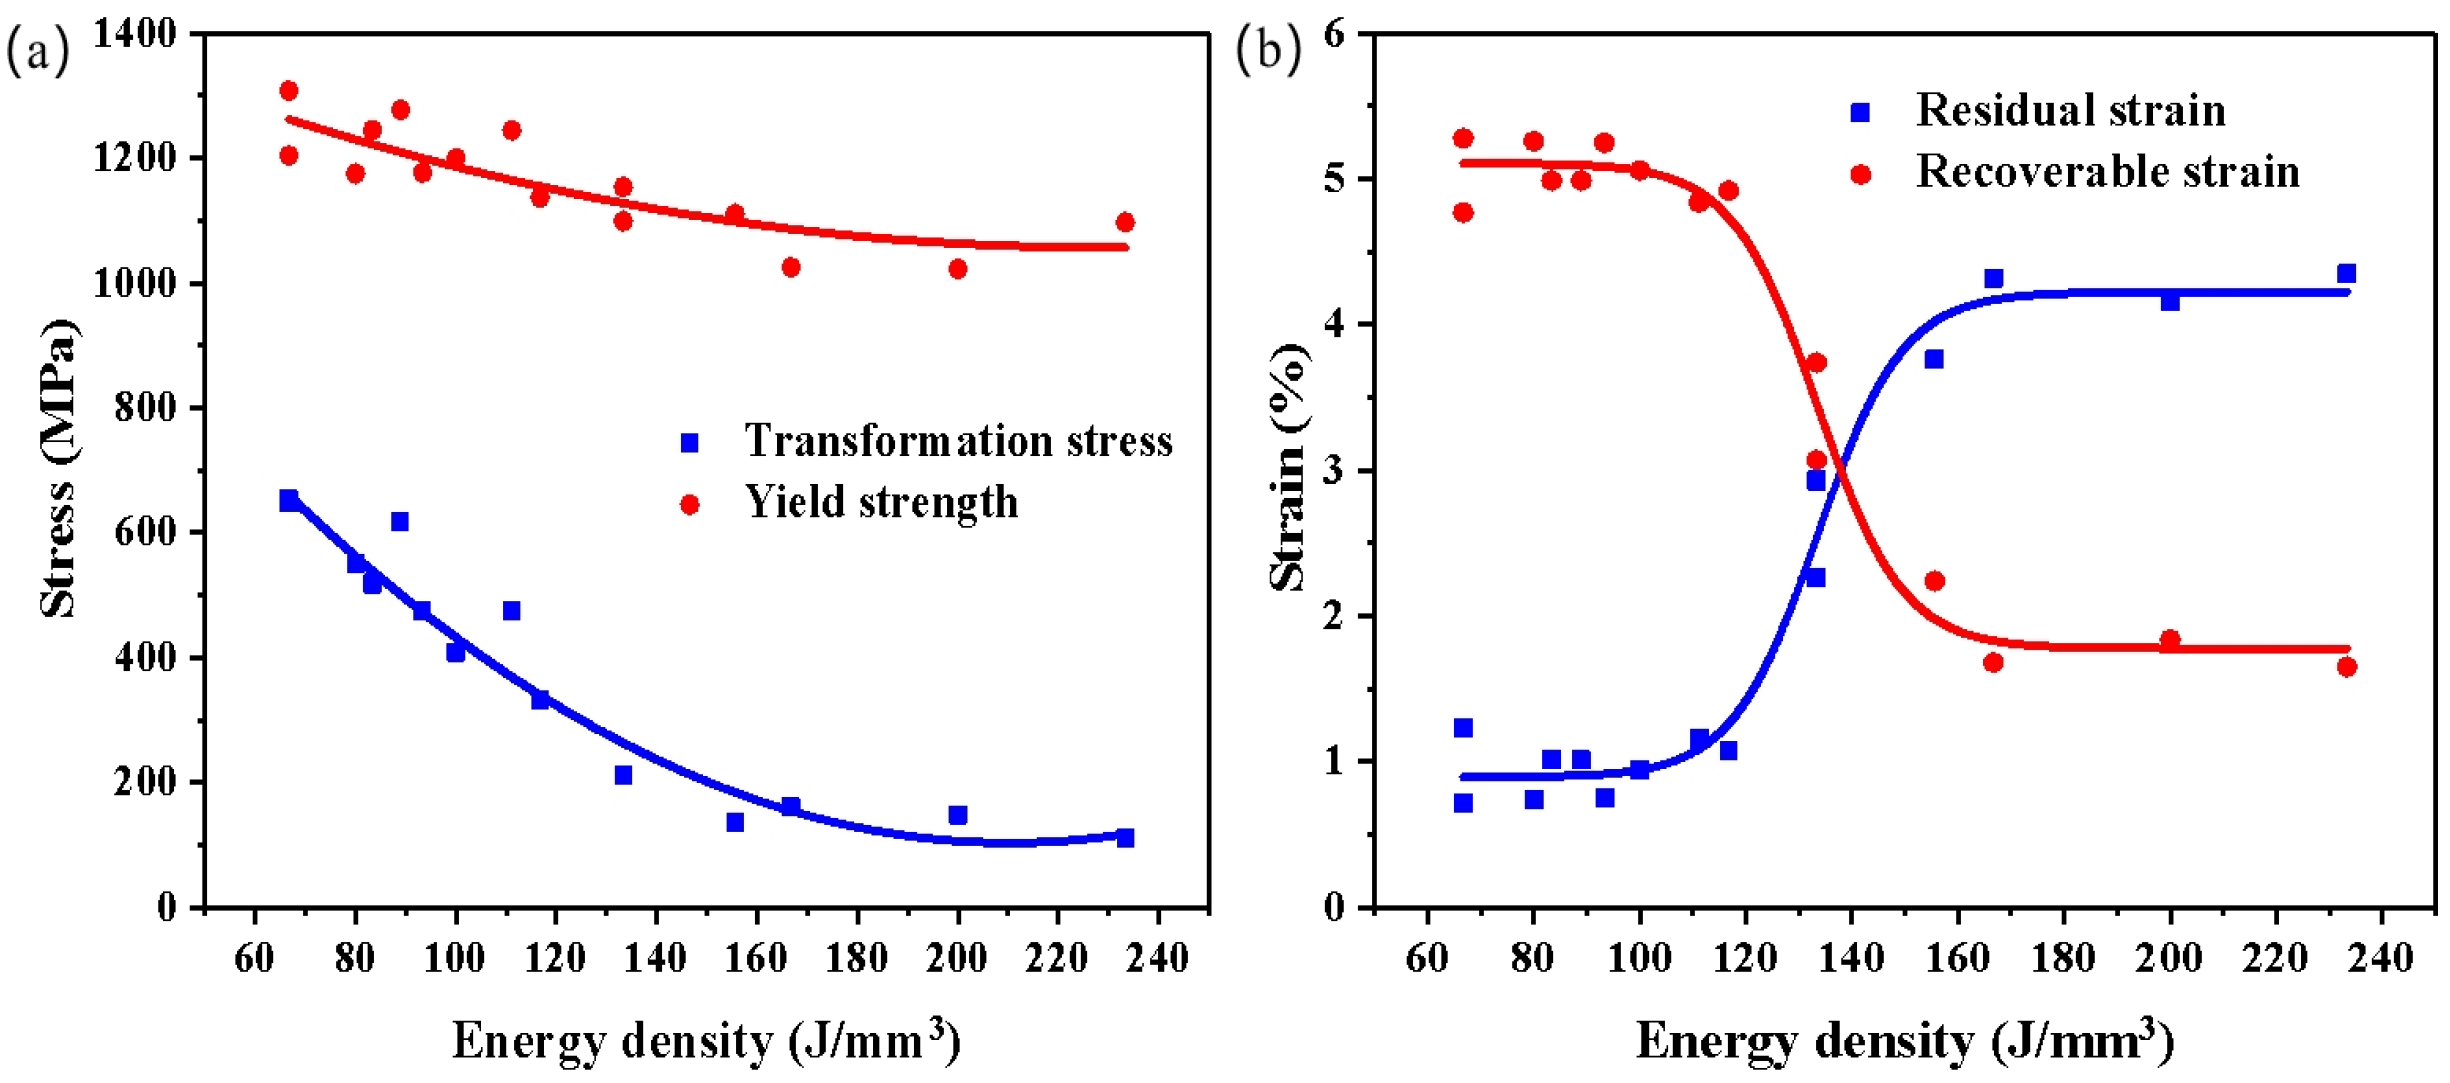
4.2. Effect of Process Parameters on Superelasticity

The phase transformation behaviours and microstructures of LPBF NiTi alloys are found to vary with different energy densities, exerting a pronounced influence on their superelasticity. Samples with lower energy density (66.7–116.7 J/mm3) exhibit a reduced phase transition temperature (Figure 8) and a diminished grain size (Figure 10). In accordance with the Clausius–Clapeyron equation [34,35] and the Hall–Petch relationship [36], the phase transition stress and matrix strength are higher (Figure 5), and the capacity to resist plastic deformation is superior. Moreover, the samples with low energy density display the presence of fine Ni4Ti3 nano-precipitates. The uniform and fine coherent Ni4Ti3 nano-precipitates contribute to the stability of the B2 austenite phase. On the one hand, this facilitates the nucleation of martensite [20]. On the other hand, the strain field surrounding it effectively impedes dislocation movement [33,37]. Consequently, in an LPBF Ni-rich NiTi alloy with lower energy density, the combined effect of matrix strengthening and fine Ni4Ti3 precipitates results in less stable martensite and plastic slip after compression, thereby enhancing superelasticity. For samples with high energy density (166.7–233.3 J/mm3), the phase transition temperature increases, the grain structure becomes coarser, the volume and number of defects increase, and the Ni4Ti3 particles expand and lose coherence, which results in a reduction in superelasticity. It is noteworthy that the stress–strain hysteresis of the LPBF Ni-rich NiTi sample exhibits a decrease with the reduction in the energy density (Figure 6). This phenomenon may be attributed to the fact that the NiTi alloy prepared with low energy density exhibits a greater prevalence of dislocation defects due to the local thermal deformation of the molten pool. This results in a nanodomain structure with an adequate local stress field, which impedes the nucleation and twinning/detwinning of long-range martensite, thereby reducing the hysteresis [38,39].

5. Conclusions

The Ni-rich Ni51.3Ti48.7 alloy was prepared by LPBF with varying process parameters. The phase transformation behaviour and microstructure evolution were analysed, and the influence of process parameters on superelasticity was discussed. This study provides a reference for the customisation of the superelasticity of LPBF NiTi alloy. The relevant summary is as follows:
(1) As the energy density increased from 53.3 J/mm3 to 233.3 J/mm3, the phase transition temperature of LPBF Ni-Rich Ni51.3Ti48.7 increased due to the increase in Ni evaporation (Ms from −68.1 °C to 54.9 °C, Af from −24.1 °C to 86.9 °C). The phase composition undergoes a transition from austenite to a mixed phase comprising both austenite and martensite. The C1 (66.7 J/mm3) and B3 (133.3 J/mm3) samples exhibit the presence of Ti3Ni and Ni4Ti3 Ni-rich precipitates. In contrast, the A4 (233.3 J/mm3) samples display the presence of both Ni4Ti3 Ni-rich precipitates and Ti2Ni/Ti4Ni2Ox Ti-rich precipitates;
(2) As the energy density of the material increases, the grain size of the LPBF Ni-rich Ni51.3Ti48.7 alloy also increases, as do the size and number of keyhole defects. Black nanoprecipitates are present in both the C1 samples with low energy density and the A4 samples with high energy density. Nevertheless, the precipitated phase in the C1 sample is of a smaller size and in a greater quantity;
(3) When the energy density is low (66.7–116.7 J/mm3), LPBF Ni-rich Ni51.3Ti48.7 alloy exhibits enhanced superelasticity, attributable to a combination of factors including a lower phase transition temperature, a smaller grain size, and the presence of fine nano-precipitates. The recovery rate following the initial compression is in excess of 5.5% (up to 5.7%), while the recovery rate after ten cycles is in excess of 5.0% (up to 5.3%). Furthermore, the stress–strain hysteresis of the sample demonstrates a reduction with a decrease in energy density (the change range is 1.8 to 3.9 mJ/mm3).

Author Contributions

Conceptualization, Z.X. and S.H.; methodology, Z.X. and Q.Y.; validation, Z.X., J.C. and X.S.; formal analysis, Z.X. and T.Z.; investigation, Q.Y. and X.S.; resources, X.S. and J.C.; data curation, Z.X.; writing—original draft preparation, Z.X.; writing—review and editing, S.H. and J.C.; visualization, Z.X. and T.Z.; supervision, S.H.; project administration, Q.Y.; funding acquisition, S.H. All authors have read and agreed to the published version of the manuscript.

Funding

This research was funded by NSAF, grant number U2130201.

Data Availability Statement

The data presented in this study are available on request from the corresponding author.

Conflicts of Interest

The authors declare no conflicts of interest.

References

  1. Biesiekierski, A.; Wang, J.; Gepreel, M.A.; Wen, C. A new look at biomedical Ti-based shape memory alloys. Acta Biomater. 2012, 8, 1661–1669. [Google Scholar] [CrossRef]
  2. Jani, J.M.; Leary, M.; Subic, A.; Gibson, M.A. A review of shape memory alloy research, applications and opportunities. Mater. Des. 2014, 56, 1078–1113. [Google Scholar] [CrossRef]
  3. Zhang, Y.; Attarilar, S.; Wang, L.; Lu, W.; Yang, J.; Fu, Y. A Review on Design and Mechanical Properties of Additively Manufactured NiTi Implants for Orthopedic Applications. Int. J. Bioprinting 2021, 7, 340–342. [Google Scholar] [CrossRef] [PubMed]
  4. Safaei, K.; Abedi, H.; Nematollahi, M.; Kordizadeh, F.; Dabbaghi, H.; Bayati, P.; Javanbakht, R.; Jahadakbar, A.; Elahinia, M.; Poorganji, B. Additive Manufacturing of NiTi Shape Memory Alloy for Biomedical Applications: Review of the LPBF Process Ecosystem. JOM-US 2021, 73, 3771–3786. [Google Scholar] [CrossRef]
  5. Gangil, N.; Siddiquee, A.N.; Maheshwari, S. Towards applications, processing and advancements in shape memory alloy and its composites. J. Manuf. Process. 2020, 59, 205–222. [Google Scholar] [CrossRef]
  6. Elahinia, M.; Shayesteh Moghaddam, N.; Taheri Andani, M.; Amerinatanzi, A.; Bimber, B.A.; Hamilton, R.F. Fabrication of NiTi through additive manufacturing: A review. Prog. Mater. Sci. 2016, 83, 630–663. [Google Scholar] [CrossRef]
  7. Dadbakhsh, S.; Speirs, M.; Van Humbeeck, J.; Kruth, J. Laser additive manufacturing of bulk and porous shape-memory NiTi alloys: From processes to potential biomedical applications. MRS Bull. 2016, 41, 765–774. [Google Scholar] [CrossRef]
  8. Wei, S.; Zhang, J.; Zhang, L.; Zhang, Y.; Song, B.; Wang, X.; Fan, J.; Liu, Q.; Shi, Y. Laser powder bed fusion additive manufacturing of NiTi shape memory alloys: A review. Int. J. Extrem. Manuf. 2023, 5, 032001. [Google Scholar] [CrossRef]
  9. Mohamed, O.A.; Masood, S.H.; Xu, W. Nickel-titanium shape memory alloys made by selective laser melting: A review on process optimisation. Adv. Manuf. 2022, 10, 24–58. [Google Scholar] [CrossRef]
  10. Chekotu, J.C.; Groarke, R.; Toole, K.O.; Brabazon, D. Advances in Selective Laser Melting of Nitinol Shape Memory Alloy Part Production. Materials 2019, 12, 809. [Google Scholar] [CrossRef]
  11. Frenzel, J.; Wieczorek, A.; Opahle, I.; Maaß, B.; Drautz, R.; Eggeler, G. On the effect of alloy composition on martensite start temperatures and latent heats in Ni–Ti-based shape memory alloys. Acta Mater. 2015, 90, 213–231. [Google Scholar] [CrossRef]
  12. Otsuka, K.; Ren, X. Physical metallurgy of Ti–Ni-based shape memory alloys. Prog. Mater. Sci. 2005, 50, 511–678. [Google Scholar] [CrossRef]
  13. Lee, J.; Shin, Y.C. Effects of Composition and Post Heat Treatment on Shape Memory Characteristics and Mechanical Properties for Laser Direct Deposited Nitinol. Lasers Manuf. Mater. Process. 2019, 6, 41–58. [Google Scholar] [CrossRef]
  14. Wen, S.; Liu, T.; Zhou, Y.; Zhao, A.; Yan, C.; Shi, Y. Effect of Ni content on the transformation behavior and mechanical property of NiTi shape memory alloys fabricated by laser powder bed fusion. Opt. Laser Technol. 2021, 134, 106653. [Google Scholar] [CrossRef]
  15. Frenzel, J.; George, E.P.; Dlouhy, A.; Somsen, C.; Wagner, M.F.X.; Eggeler, G. Influence of Ni on martensitic phase transformations in NiTi shape memory alloys. Acta Mater. 2010, 58, 3444–3458. [Google Scholar] [CrossRef]
  16. Wang, X.; Yu, J.; Liu, J.; Chen, L.; Yang, Q.; Wei, H.; Sun, J.; Wang, Z.; Zhang, Z.; Zhao, G.; et al. Effect of process parameters on the phase transformation behavior and tensile properties of NiTi shape memory alloys fabricated by selective laser melting. Addit. Manuf. 2020, 36, 101545. [Google Scholar] [CrossRef]
  17. Jamshidi, P.; Panwisawas, C.; Langi, E.; Cox, S.C.; Feng, J.; Zhao, L.; Attallah, M.M. Development, characterisation, and modelling of processability of nitinol stents using laser powder bed fusion. J. Alloys Compd. 2022, 909, 164681. [Google Scholar] [CrossRef]
  18. Safdel, A.; Elbestawi, M.A. New insights on the laser powder bed fusion processing of a NiTi alloy and the role of dynamic restoration mechanisms. J. Alloys Compd. 2021, 885, 160971. [Google Scholar] [CrossRef]
  19. Tan, C.; Li, S.; Essa, K.; Jamshidi, P.; Zhou, K.; Ma, W.; Attallah, M.M. Laser Powder Bed Fusion of Ti-rich TiNi lattice structures: Process optimisation, geometrical integrity, and phase transformations. Int. J. Mach. Tool. Manu. 2019, 141, 19–29. [Google Scholar] [CrossRef]
  20. Xue, L.; Atli, K.C.; Zhang, C.; Hite, N.; Srivastava, A.; Leff, A.C.; Wilson, A.A.; Sharar, D.J.; Elwany, A.; Arroyave, R.; et al. Laser Powder Bed Fusion of Defect-Free NiTi Shape Memory Alloy Parts with Superior Tensile Superelasticity. Acta. Mater. 2022, 229, 117781. [Google Scholar] [CrossRef]
  21. Zhan, J.; Wu, J.; Ma, R.; Li, K.; Huang, T.; Lin, J.; Murr, L.E. Effect of microstructure on the superelasticity of high-relative-density Ni-rich NiTi alloys fabricated by laser powder bed fusion. J. Mater. Process Tech. 2023, 317, 117988. [Google Scholar] [CrossRef]
  22. Ren, Q.; Chen, C.; Lu, Z.; Wang, X.; Lu, H.; Yin, S.; Liu, Y.; Li, J.; Wang, j.; Ren, Z. Effect of a constant laser energy density on the evolution of microstructure and mechanical properties of NiTi shape memory alloy fabricated by laser powder bed fusion. Opt. Laser Technol. 2022, 152, 108182. [Google Scholar] [CrossRef]
  23. Saedi, S.; Moghaddam, N.S.; Amerinatanzi, A.; Elahinia, M.; Karaca, H.E. On the effects of selective laser melting process parameters on microstructure and thermomechanical response of Ni-rich NiTi. Acta Mater. 2018, 144, 552–560. [Google Scholar] [CrossRef]
  24. Shen, F.L.; Li, H.Q.; Guo, H.; Guo, N.N.; Fang, X.Y. Effect of energy density on the superelastic property of Ni-rich NiTi alloy fabricated by laser powder bed fusion. Mater. Sci. Eng. A 2022, 854, 143874. [Google Scholar] [CrossRef]
  25. Liu, Y.; Xie, Z.; Humbeeck, J.V.; Delaey, L. Asymmetry of stress-strain curves under tension and compression for NiTi shape memory alloys. Acta Mater. 1998, 46, 4325–4338. [Google Scholar] [CrossRef]
  26. Ranaiefar, M.; Honarmandi, P.; Xue, L.; Zhang, C.; Elwany, A.; Karaman, I.; Schwalbach, E.J.; Arroyave, R. A differential evaporation model to predict chemistry change of additively manufactured metals. Mater. Des. 2022, 213, 110328. [Google Scholar] [CrossRef]
  27. Liu, J.; Wen, P. Metal vaporization and its influence during laser powder bed fusion process. Mater. Des. 2022, 215, 110505. [Google Scholar] [CrossRef]
  28. Guo, Q.; Zhao, C.; Qu, M.; Xiong, L.; Escano, L.I.; Hojjatzadeh, S.M.H.; Parab, N.D.; Fezzaa, K.; Everhart, W.; Sun, T.; et al. In-situ characterization and quantification of melt pool variation under constant input energy density in laser powder bed fusion additive manufacturing process. Addit. Manuf. 2019, 28, 600–609. [Google Scholar] [CrossRef]
  29. Cunningham, R.; Zhao, C.; Parab, N.; Kantzos, C.; Pauza, J.; Fezzaa, K.; Sun, T.; Rollett, A.D. Keyhole threshold and morphology in laser melting revealed by ultrahigh-speed X-ray imaging. Science 2019, 363, 849–852. [Google Scholar] [CrossRef]
  30. Kiss, A.M.; Fong, A.Y.; Calta, N.P.; Thampy, V.; Martin, A.A.; Depond, P.J.; Wang, J.; Matthews, M.J.; Ott, R.T.; Tassone, C.J.; et al. Laser-Induced Keyhole Defect Dynamics during Metal Additive Manufacturing. Adv. Eng. Mater. 2019, 21, 1900455. [Google Scholar] [CrossRef]
  31. Lu, H.Z.; Liu, L.H.; Luo, X.; Ma, H.W.; Cai, W.S.; Lupoi, R.; Yin, S.; Yang, C. Formation mechanism of heterogeneous microstructures and shape memory effect in NiTi shape memory alloy fabricated via laser powder bed fusion. Mater. Des. 2023, 232, 112107. [Google Scholar] [CrossRef]
  32. Gan, J.; Duan, L.; Li, F.; Che, Y.; Zhou, Y.; Wen, S.; Yan, C. Effect of laser energy density on the evolution of Ni4Ti3 precipitate and property of NiTi shape memory alloys prepared by selective laser melting. J. Alloys Compd. 2021, 869, 159338. [Google Scholar] [CrossRef]
  33. Lu, H.Z.; Ma, H.W.; Cai, W.S.; Luo, X.; Wang, Z.; Song, C.H.; Yin, S.; Yang, C. Stable tensile recovery strain induced by a Ni4Ti3 nanoprecipitate in a Ni50.4Ti49.6 shape memory alloy fabricated via selective laser melting. Acta Mater. 2021, 219, 117261. [Google Scholar] [CrossRef]
  34. Liu, Y.; Yang, H. Strain dependence of the Clausius–Clapeyron relation for thermoelastic martensitic transformations in NiTi. Smart Mater. Struct. 2007, 16, S22–S27. [Google Scholar] [CrossRef]
  35. Liu, Y.; Mahmud, A.; Kursawe, F.; Nam, T. Effect of pseudoelastic cycling on the Clausius–Clapeyron relation for stress-induced martensitic transformation in NiTi. J. Alloys Compd. 2008, 449, 82–87. [Google Scholar] [CrossRef]
  36. Hansen, N. Hall–Petch relation and boundary strengthening. Scr. Mater. 2004, 51, 801–806. [Google Scholar] [CrossRef]
  37. Lu, H.Z.; Ma, H.W.; Yang, Y.; Cai, W.S.; Luo, X.; Yan, A.; Kang, L.M.; Yin, S.; Yang, C. Tailoring phase transformation behavior, microstructure, and superelasticity of NiTi shape memory alloys by specific change of laser power in selective laser melting. Mater. Sci. Eng. A 2023, 864, 144576. [Google Scholar] [CrossRef]
  38. Liu, T.; Wu, Z.; Zhou, W.; Zhong, M.; Lin, J.; Yang, Y. Quasilinear pseudoelasticity and small hysteresis in SLM-fabricated NiTi. J. Alloys Compd. 2023, 933, 167694. [Google Scholar] [CrossRef]
  39. Hua, P.; Xia, M.; Onuki, Y.; Sun, Q. Nanocomposite NiTi shape memory alloy with high strength and fatigue resistance. Nat. Nanotechnol. 2021, 16, 409–413. [Google Scholar] [CrossRef]
Figure 1. (a) SEM micrograph of NiTi powder. (b) Powder particle size distribution. (c) Scanning strategy of 67° inter-layer rotation angle.
Metals 14 00961 g001
Figure 2. (a) Samples obtained with different printing parameters. (b) Variation of relative density of samples with energy density.
Metals 14 00961 g002
Figure 3. Compression stress–strain curves of NiTi samples: (a) A1–A4, (b) B1–B4, (c) C1–C4, and (d) D2–D4.
Metals 14 00961 g003
Figure 4. Stress–strain curves of NiTi samples under 10 cycles of compression: (a) A1–A4, (b) B1–B4, (c) C1–C4, and (d) D2–D4.
Metals 14 00961 g004
Figure 5. (a) Transformation stress and yield strength versus energy density. (b) Recoverable strain and residual strain versus energy density.
Metals 14 00961 g005
Figure 6. Stress–strain hysteresis area of B1, B2, C1–C4, D2–D4 NiTi samples after 10 cycles.
Metals 14 00961 g006
Figure 7. DSC curves of different samples: (a) A1–A4, (b) B1–B4, (c) C1–C4, and (d) D1–D4.
Metals 14 00961 g007
Figure 8. Variation of phase transition temperature with energy density.
Metals 14 00961 g008
Figure 9. XRD images of C1, B3, and A4 samples.
Metals 14 00961 g009
Figure 10. Optical microscopy images of C1, B3, and A4 samples.
Metals 14 00961 g010
Figure 11. SEM images of NiTi samples: (a) C1, (b) B3, (c) A4, (d) Needle-like stripes of A4, (e) Precipitates of C1 and (f) Precipitates of A4.
Metals 14 00961 g011
Figure 12. Ni content of C1, C3, B3, A2, and A4 samples.
Metals 14 00961 g012
Figure 13. The evolution of molten pool and precipitated phase of LPBF NiTi alloy at different energy densities.
Metals 14 00961 g013
Table 1. The printing process parameters.
SampleLaser Power
P (W)
Scanning
Velocity
v (mm/s)
Hatch Space
h (mm)
Layer
Thickness
t (mm)
Energy
Density
E (J/mm3)
A1804000.050.03133.3
A21004000.050.03166.7
A31204000.050.03200
A41404000.050.03233.3
B1806000.050.0388.9
B21006000.050.03111.1
B31206000.050.03133.3
B41406000.050.03155.6
C1808000.050.0366.7
C21008000.050.0383.3
C31208000.050.03100
C41408000.050.03116.7
D18010000.050.0353.3
D210010000.050.0366.7
D312010000.050.0380
D414010000.050.0393.3
Disclaimer/Publisher’s Note: The statements, opinions and data contained in all publications are solely those of the individual author(s) and contributor(s) and not of MDPI and/or the editor(s). MDPI and/or the editor(s) disclaim responsibility for any injury to people or property resulting from any ideas, methods, instructions or products referred to in the content.

