Article

Influence of Processing Routes to Enhance the Mechanical Properties of Mg–6Zn–1Y–3.5CeMM (wt.%) Alloy

Departamento de Metalurgia Física, Centro Nacional de Investigaciones Metalúrgicas (CENIM-CSIC), Avenida Gregorio del Amo 8, 28040 Madrid, Spain
*
Author to whom correspondence should be addressed.
Metals 2024, 14(9), 968; https://doi.org/10.3390/met14090968
Submission received: 29 July 2024 / Revised: 23 August 2024 / Accepted: 25 August 2024 / Published: 27 August 2024

Abstract

:
The microstructure and mechanical properties were investigated for Mg–6Zn–1Y–3.5CeMM (wt.%) alloy processed by extrusion at 400 °C of as-cast ingots (ACE alloy) or cold-compacted atomized powders (PME alloy). The use of fine-grained atomized powders results in a refinement of the microstructure, manifested by a reduced grain size and a smaller particle size with respect to the alloy processed by casting. The second-phase particles are the same for both W-phase (Mg3Zn3Y2) and T-phase (MgZnCeMM compound) particles, regardless of the processing route. The yield stress of the PME alloy at room temperature is not only increased by almost 40% compared with that of the ACE alloy (307 and 224 MPa, respectively), but the elongation to failure also increases to twice as much for the PME alloy. This differing mechanical behavior is related to the smaller grain size and the homogeneous distribution of the second-phase particles in the PME alloy. Up to 200 °C, both alloys maintain high mechanical strength, with UTS values remaining above 120 MPa. At high temperatures and low strain rates, deformation is controlled by grain boundary sliding, improving the ductility at the expense of a significant decrease in the yield strength of the ACE and PME alloys.

1. Introduction

Since magnesium is one of the lightest structural metals, the development of magnesium alloys has been increasing in recent decades from the perspective of implementing their use in industries such as aerospace, aeronautics and automotive, where weight reduction is crucial. Magnesium alloys have a high strength-to-weight ratio, good castability and excellent electromagnetic shielding properties, and are non-toxic and recyclable [1,2,3,4,5]. However, their low corrosion resistance, poor ductility and insufficient strength at room and elevated temperatures make it necessary to develop new magnesium alloys to overcome these drawbacks. One strategy to improve the mechanical properties of magnesium alloys is to modify the composition through the addition of appropriate amounts of different elements to the magnesium matrix. In this regard, recently developed magnesium alloys belonging to the Mg–Zn–Y and Mg–Zn–RE families with rare earth additions are promising for increasing mechanical strength [6,7,8,9,10,11,12]. The addition of rare earth elements, with very low solubility in the magnesium lattice such as yttrium, cerium or lanthanum, allows for the formation of intermetallic compounds that strengthen the alloy [7,8,9,12]. Especially the addition of cerium, with almost no solubility in the magnesium matrix, results in the formation of a high-volume fraction of hardener second-phase particles [13]. In addition, it has been shown that the addition of cerium to magnesium alloys is very favorable for decreasing grain size [8,14]. In this research, we opted for the addition of a rare earth mixture in the form of mischmetal (MM), which has a lower cost than the addition of pure elements. It has been shown that the rare earth mixture provides similar benefits to the addition of pure elements and even superior properties in terms of grain refinement [14,15]. The mechanical properties can also be improved by changing the microstructure, which can be achieved by controlling thermomechanical processing [16,17,18,19]. In recent years, several processing techniques have been introduced in the manufacture of Mg–RE series alloys, with the aim of achieving grain refinement and homogeneous distribution of the second phases. Among them, high-pressure die casting and squeeze casting are two challenging casting techniques that can be used in the preparation of Mg–RE alloy components, leading to grain refinement [20]. Extrusion, forging and their combination also allow grain refinement accompanied by fragmentation and dispersion of second-phase particles [21]; the same applies to powder metallurgy processes [17]. Finally, additive manufacturing, also known as 3D printing, which uses fine powders to manufacture components layer by layer, provides grain refinement through ultra-fast solidification [22,23]. The main goal of this research is to improve the mechanical properties of the Mg–6Zn–1Y–3.5CeMM (wt.%) alloy in the range from room temperature up to 350 °C. For this purpose, the alloy was processed following two ways: a conventional casting and extrusion route (ACE alloy) and cold compact extrusion from atomized powders (PME alloy).

2. Materials and Methods

The studied alloy with a nominal composition of Mg–6Zn–1Y–3.5CeMM (wt.%) was prepared starting from the master alloy Mg–6Zn–1Y (wt.%) after the addition of 3.5 (wt.%) cerium-rich mischmetal. The master alloy was prepared by melting pure magnesium, zinc and yttrium in an electric resistance furnace. The CeMM has rare earth content, determined by X-ray fluorescence, that is distributed as follows: 51.9 wt.% Ce, 26.5 wt.% La, 16.4 wt.% Nd and 5.2 wt.% Pr. It was added to the melt that was held at 800 °C until complete dissolution. The melt was cast in cylindrical steel molds 42 mm in diameter. The alloy billets were ground to 41mm and then extruded at 400 °C using an extrusion ratio of 18:1.
On the other hand, spherical rapidly solidified powders less than 100 μm in diameter were obtained from as-cast ingots, employing the electrode induction melting gas atomization (EIGA) technique by TLS Technik GmbH (Niedernberg, Germany). The powders were isostatically cold pressed into 40 mm diameter compacts and extruded at 400 °C at the 18:1 extrusion ratio.
Microstructural characterization of materials was carried out via scanning electron microscopy (SEM) using a Hitachi S-4800 microscope (Hitachi High-Tech Corporation, Ibaraki, Japan), and transmission electron microscopy (TEM) was carried out employing a Jeol-2010 microscope (Jeol, Tokyo, Japan) at 200 kV. Both microscopes were provided with an energy-dispersive X-ray microanalysis (EDS) system. Specimens for SEM observations were prepared by conventional metallographic techniques, including grinding with 320-, 600-, 1200- and 2000-grit SiC paper, polishing with alumina and colloidal silica, and finally chemical etching with picric and nitric acids. Samples for TEM observations were prepared by electrolytic jet polishing, employing a mixture of 75% methanol and 25% nitric acid at −20 °C and 20 V. In order to remove the thin oxide film formed on samples during the electrolytic polishing, the samples were subjected to a final clean up with ion milling (Fischione 1010 (E.A. Fischione Instruments, Inc., Pennsylvania, Export, PA, USA)) at liquid nitrogen temperature. Measurements of the volume fractions of second phases, particles and grain sizes were calculated using the ImageJ (1.51j) image processing program.
The XRD technique was used to identify the different phases as well as to perform macrotextural measurements. It was carried out in a Siemens D5000 X-ray diffractometer (Siemens, Houston, TX, USA) using Cu Kα radiation, with a step size of 0.03 degrees and a time step of 3 s.
Mechanical properties were evaluated using uniaxial tensile tests from room temperature up to 350 °C at an initial strain rate of 10−4 s−1, in a universal tensile machine (Instron model 1362 (Instron, Norwood, MA, USA)) equipped with a parabolic furnace and load cell of 10 kN. Cylindrical samples of 6 mm diameter and 10 mm gauge length were machined from the extruded bars, with the longer dimension parallel to the extrusion direction. Additional tests from 200 to 350 °C and strain rates from 10−1 to 10−5 s−1 were used to determine the stress exponent. At least two tests were carried out to verify the reproducibility of the results, with the error below 1%.

3. Results and Discussion

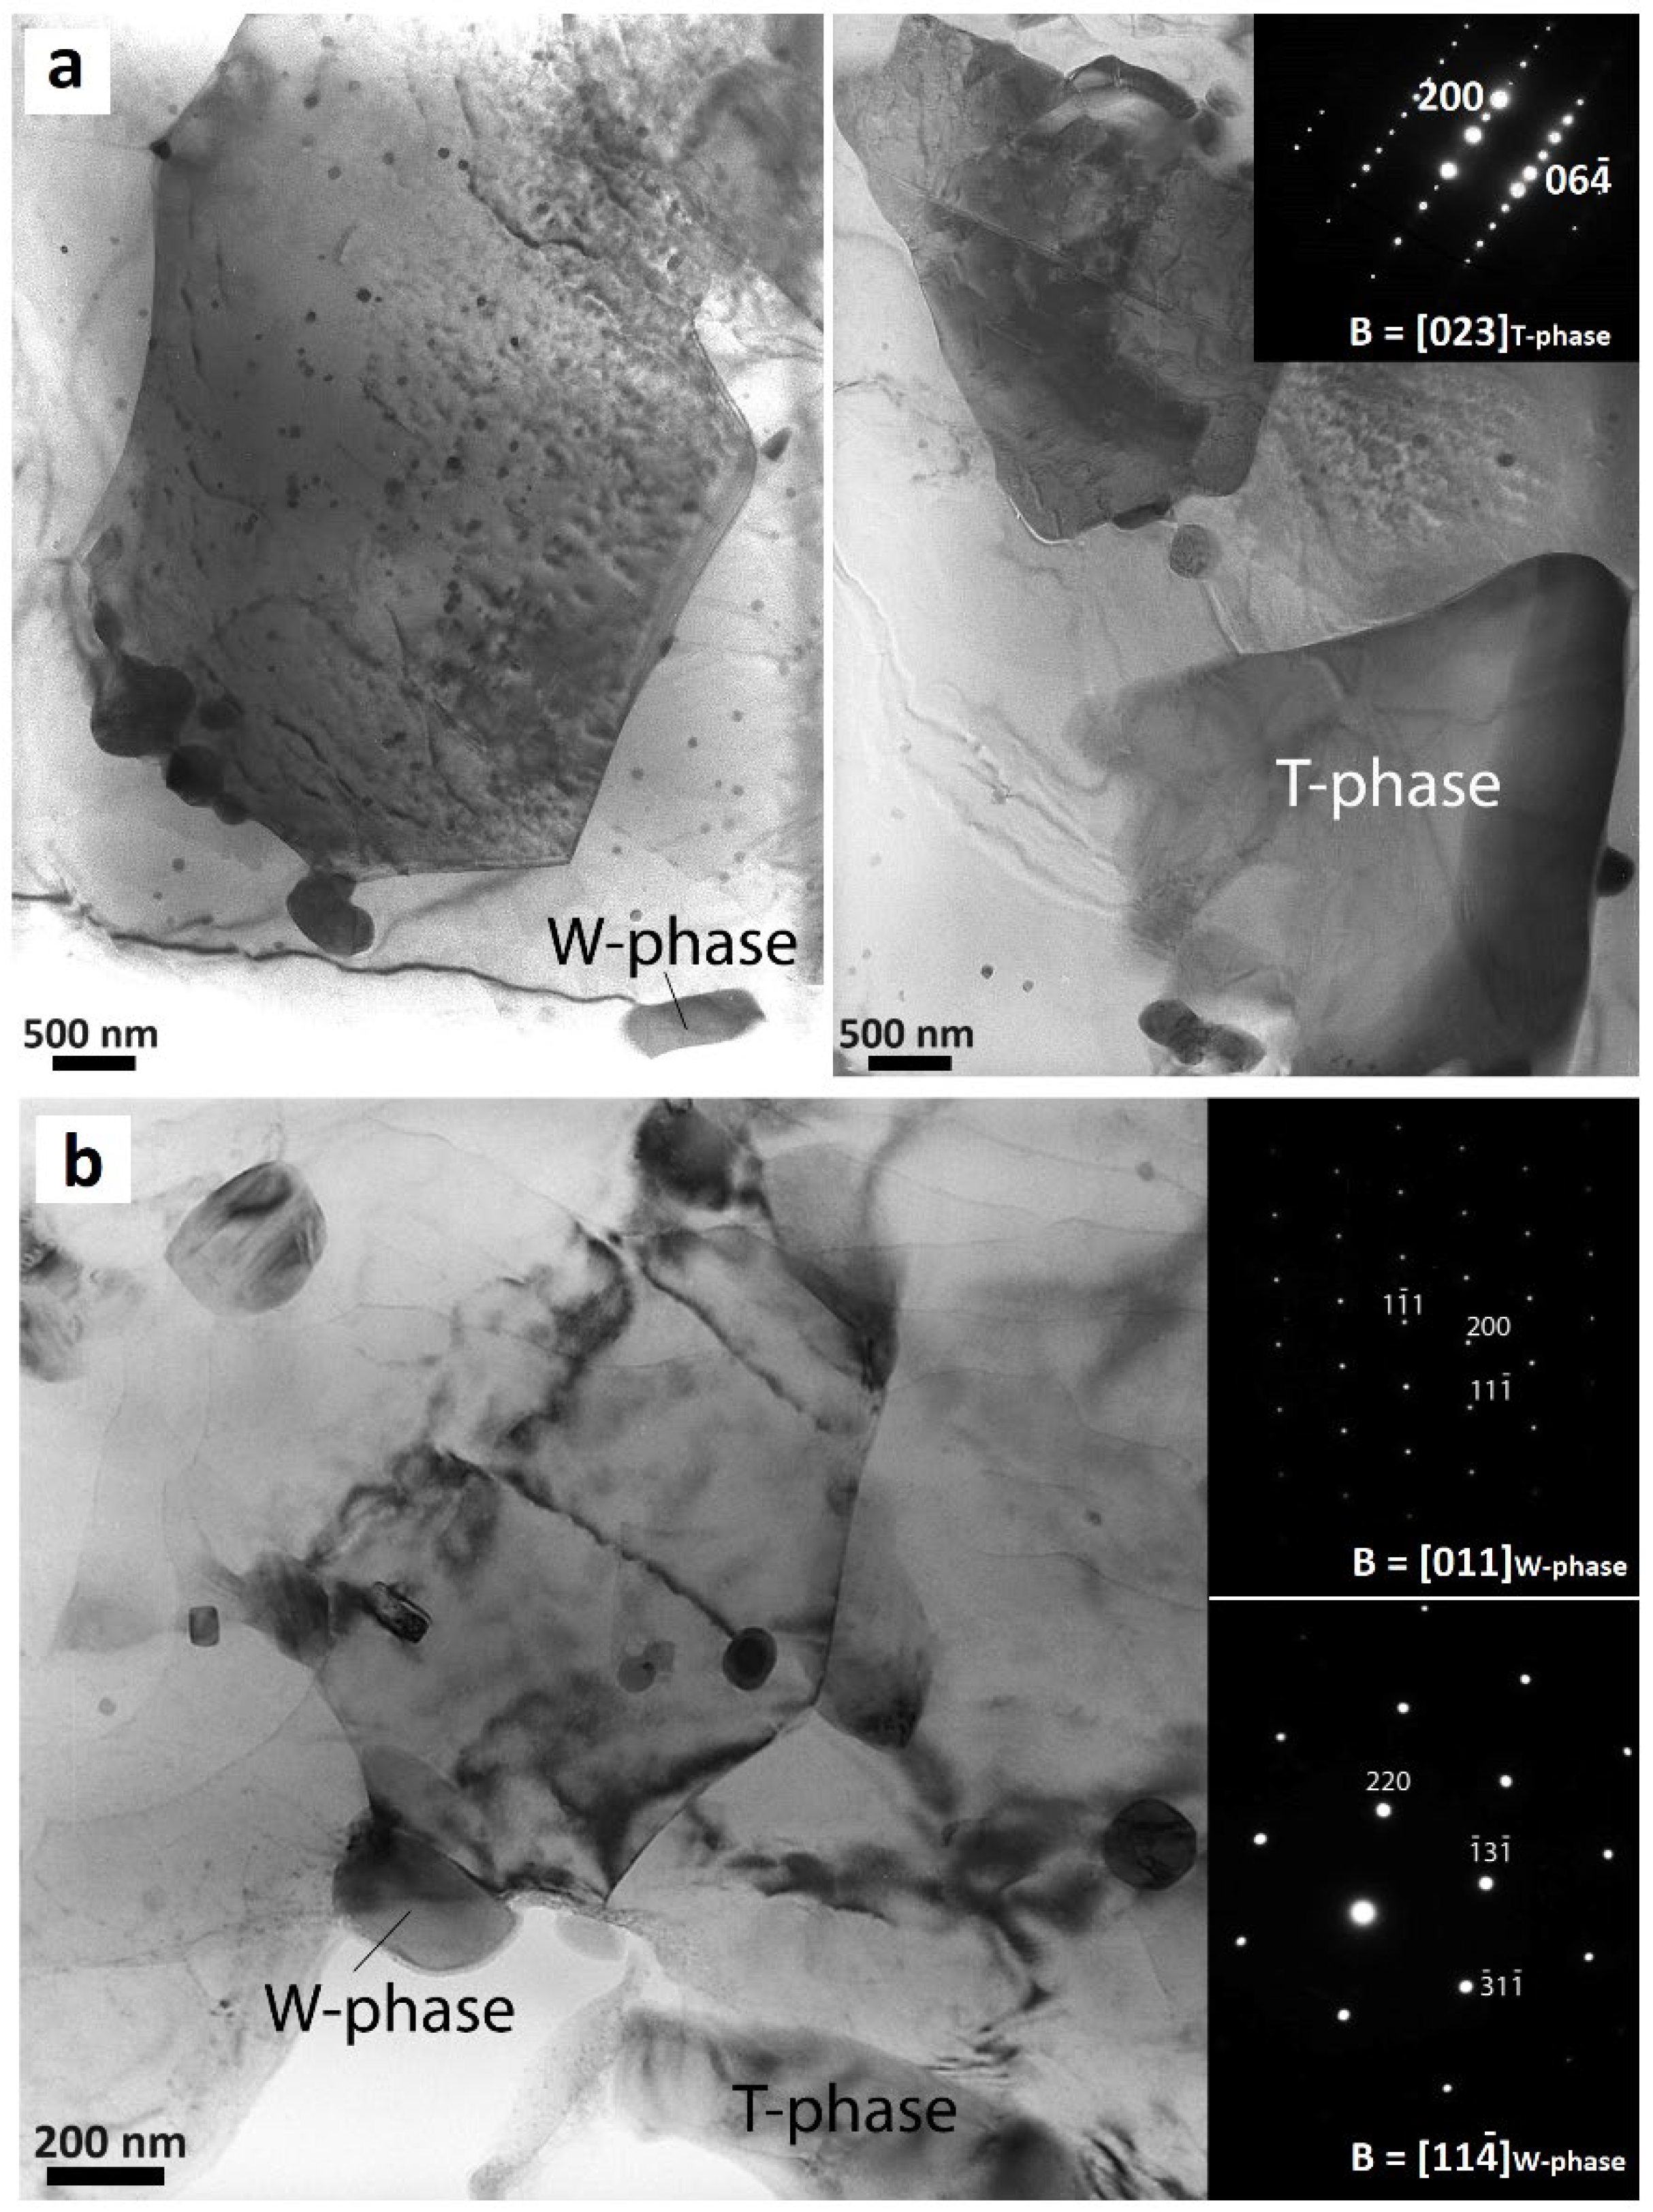
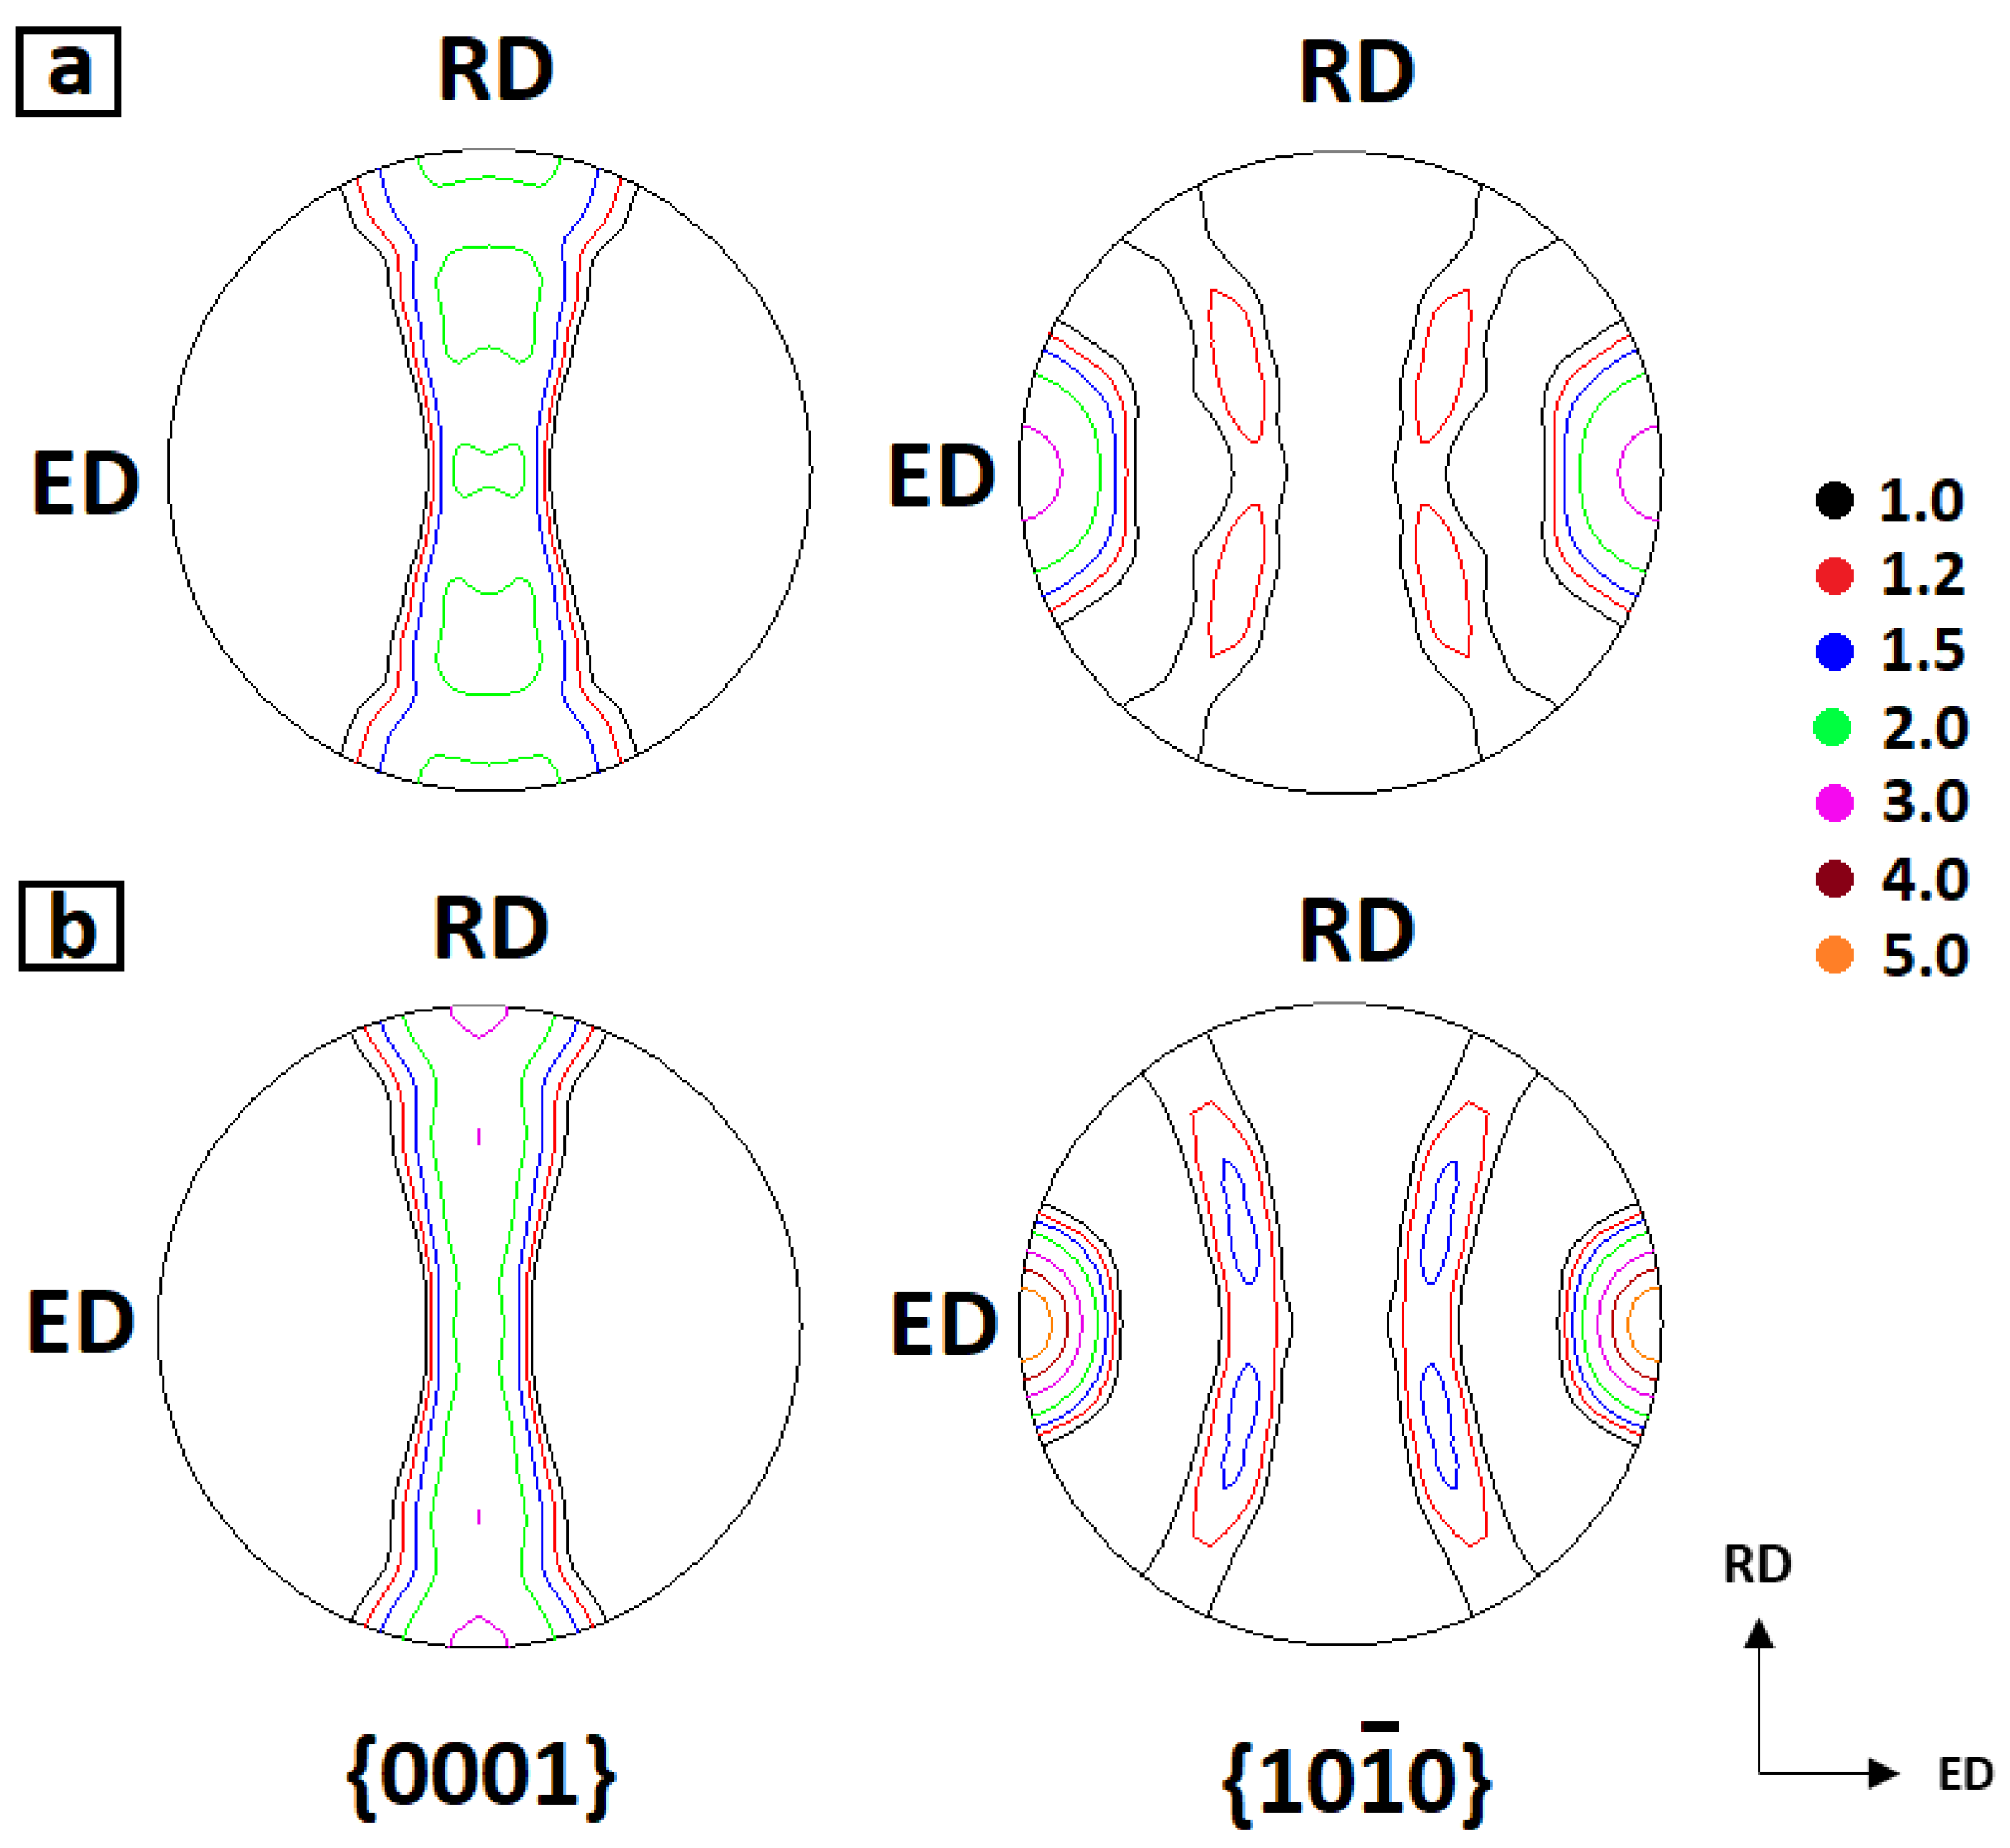
3.1. Microstructural Characterization

The Mg–6Zn–1Y–3.5CeMM (wt.%) as-cast alloy exhibit a characteristic dendritic solidification structure consisting of magnesium dendrites, whose sizes range between 50 and 80 μm, and intermetallic second phases placed at the interdendritic regions (see Figure 1a). During the solidification process, after the formation of the magnesium dendrites, the remaining liquid, enriched in all the alloying elements, is disposed at the interdendritic space where second phases are finally located. At higher magnification in the backscattered electron image of Figure 1a, two phases of different contrast can be distinguished within the interdendritic region. A semi-quantitative composition determined by EDS microanalysis listed in Table 1 indicates that the bright phase contains Mg, Zn and Y with an atomic composition close to that of the W phase (Mg3Zn3Y2) [24,25], while the predominant dark grey phase is composed of Mg, Zn and Ce, whose composition coincides with that reported for the T-phase in Mg–Zn–RE system alloys. This phase exists in a wide range of compositions: the zinc content varies from 12 to 43 at.% while the cerium content remains around 7–8 at.% [26,27].
Figure 1c shows rapidly solidified powders in the as-received condition. Their morphology is spherical with different sizes, always smaller than 100 microns. The dendritic microstructure resembles that found for the as-cast alloy, but the dendrite size and the thickness of the interdendritic spaces are considerably much lower. Thus, the dendrite size usually ranges between 2 and 6 μm whereas interdendritic arms seems to constitute an almost continuous network whose wall thickness is between 100 and 700 nm. EDS microanalyses in the interdendritic regions reveal high contents of all alloying elements in concentrations two times higher than those measured in the dendrites (see Table 1).
The refinement of the microstructure is remarkable, as well as the high content of alloying elements in solid solution within the magnesium dendrites of rapidly solidified powders compared to the as-cast alloy. This is due to the fact that the high cooling rate attained during the solidification of the powders allows the alloying elements Zn, Y and CeMM to be embedded in the magnesium lattice as a solid solution, resulting in a supersaturated metastable dendritic structure.
The microstructure of the extruded alloys is presented in Figure 1b,d. During the extrusion process at 400 °C, the magnesium matrix is constrained by the harder interdendritic spaces until the load reaches a critical value, at which point the brittle second phases located at the interdendritic regions are broken. As can be seen in Figure 1b, the second-phase particles of the extruded ACE alloy are now perfectly aligned as long strings along the extrusion direction, bordering the original magnesium dendrites. These regions are essentially free of coarse second phases. In the case of the PME alloy, however, fracture of thin interdendritic arms existing in the powders leads to uniform dispersion of second phases in the magnesium matrix (see Figure 1d).
The considerable refinement of the microstructure in both materials is manifested by the small grain size of the magnesium matrix (2.4 and 6.8 μm, respectively for the PME and ACE alloy and second phases (0.4 and 2.0 μm, respectively for the PME and ACE alloy). The homogeneously distributed second-phase particles in the PME magnesium matrix act as pinning points during the extrusion process, hindering grain growth. This results in a grain size almost three times smaller than that of the ACE alloy. In addition, fine precipitates are also observed inside the magnesium matrix, which were absent in the initial materials (as-cast billets and atomized powders), indicating that certain precipitation occurs during the holding time at 400 °C before the extrusion process.
On the other hand, during the extrusion process, the metastable phases of the PME alloy evolve towards a composition similar to that of the as-cast alloy. Thus, two different phases can be distinguished: the bright particles with a composition closed to the W phase (Mg3Zn3Y2) and the dark grey particles, whose composition coincides rather well with that reported for the T phase (MgZnCeMM compound) (see details in Figure 1b,d). It is interesting to note the appreciable difference in the CeMM content: about 7% for the ACE alloy and 2% for the PME alloy, as listed in Table 1.
TEM micrographs of extruded alloys, shown in Figure 2, present a more detailed view of the microstructure. It can be observed how the extrusion process for both materials facilitates the appearance of small spherical and, in a smaller amount, blocky-shaped precipitates in the magnesium matrix. The chemical composition of the precipitates could not be obtained with accuracy due to their small size, but semiquantitative EDS microanalysis indicates that these particles contain Mg and Zn with a total absence of rare earths. The calculated volume fraction of finer particles in the ACE alloy was twice that in the PME alloy, 0.20% and 0.38%, respectively, with their average sizes being 36 and 122 nm for the ACE and PME alloys, respectively. The higher concentration of alloying elements in solid solution in the Mg matrix of the atomized powders material favors subsequent precipitation during the extrusion process, which is accompanied by the coarsening of the precipitates. Semi-quantitative microanalyses of coarse second phases for both alloys (see Table 2) confirm that T-phase and W-phase particles are present in both alloys, in agreement with the SEM results. The selected area electron diffraction (SAED) pattern taken in the coarse second-phase particle of about 2 microns in Figure 2a was identified as T phase having c-centered orthorhombic structure with a = 0.999 nm, b = 1.146 nm and c = 0.976 nm lattice parameters [28]. The SAED patterns taken in the rectangular particle of Figure 2b was identified as the [011] and [11 4 ¯ ] zone axes of the W phase with an FCC structure and lattice parameter a = 0.6848 nm [29].
These results are supported by the X-ray diffraction patterns presented in Figure 3. Three different phases are distinguished: higher intensity peaks correspond to the magnesium matrix, while minor peaks correspond to the W phase and T phase. It should be noted that T-phase peaks for the ACE alloy appear slightly shifted to lower angles with respect to the PME alloy. The higher content of cerium atoms constituting the T phase, whose radius (1.82 Å) is larger than that of Mg and Zn (1.60 and 1.39 Å, respectively), make the lattice parameters of the c-centered orthorhombic structure in the ACE alloy larger than those of the T phase in the PME alloy, and therefore the T-phase peaks appear at smaller 2Ɵ values. Also, it is interesting to mention that the peak of highest intensity located at 2Ɵ = 32.2° corresponds to the magnesium { 10 1 ¯ 0 } planes. As the X-ray measurements were taken on the cross section of the extruded bars, this indicates that after extrusion, some texture may develop in both alloys where the basal planes lie parallel to the extrusion direction.
To confirm this assumption, a macrotextural analysis was carried out using XRD measurements. The calculated pole figures for the basal {0001} and prismatic { 10 1 ¯ 0 } planes for both alloys are shown in Figure 4. Pole figures indicate two discrete components. A preferential orientation was observed with a maximum intensity equal to 3 for the ACE alloy (Figure 4a) and intensity of 5 for the PME alloy (Figure 4b), where the basal planes are parallel to the extrusion direction (ED). Minor contributions of intensities 1.2 and 1.5 also appear for the ACE and PME alloys, respectively, where the basal planes are perpendicular to the ED. This indicates that both alloys indeed develop a slight fibrous texture typical of extruded magnesium alloys [30,31], which is somewhat more noticeable for the powder metallurgy alloy.
According to the microstructural analysis performed, the second-phase particles of the cast alloy, whose sizes are much larger than those of the PM alloy particles, can act as nucleation sites for recrystallization through the particle-stimulated nucleation (PSN) mechanism during the extrusion process [30,32,33]. On the contrary, as in the case of the PME alloy, the main effect of fine second phases dispersed in the magnesium matrix is impeding grain growth, since they act as effective obstacles for boundary migration [34]. Thus, recrystallized grains without preferential orientation contribute to weaken the overall texture.

3.2. Mechanical Characterization

Mechanical properties were evaluated through tensile tests. Figure 5 shows the true stress–true strain curves at a strain rate of 10−4 s−1 from room temperature (RT) to 350 °C for ACE (solid line) and PME (dashed line) Mg–6Zn–1Y–3.5CeMM alloys. Values of yield stress, ultimate strength and elongation to failure are listed in Table 3.

3.2.1. Mechanical Behavior from Room Temperature up to 200 °C

The mechanical behavior of both alloys can be divided into two temperature ranges. In the first interval (from RT up to 200 °C), the PME alloy exhibits higher values of yield strength, UTS and elongation to failure than the ACE alloy. Throughout this temperature range, both alloys present a continuous hardening in the plastic regime, attaining a maximum strength close to 400 MPa for the PME alloy and a value higher than 300 MPa for the ACE alloy at room temperature. This hardening at the beginning of the plastic regime is common in composite materials reinforced with second phases [35,36] and is related to the load transfer from the magnesium matrix towards the harder second-phase particles. According to Figure 5, in this temperature range, the load transfer mechanism at the beginning of the plastic deformation seems to be very effective for both alloys. The effect of the coarse second-phase particles, mainly T phase, results in increasing the yield strength of the alloy and hardening the material in the early stages of plastic deformation. However, as deformation progresses, damage in the reinforcement phases rapidly reduces the effectiveness due to this mechanism. This can be observed in the fracture surface presented in Figure 6.
Both alloys show a multitude of cavities characteristic of ductile fracture, containing embedded second-phase particles. In the case of the ACE alloy (Figure 6a,b), the coarse T-phase particles appear fractured but barely penetrate into the magnesium matrix. This indicates that the load transfer from the magnesium matrix towards the coarse second-phase particles takes place. The brittle nature of the T phase causes particle cracking once a critical load is exceeded, so the load they have been bearing returns to the magnesium matrix. Since the cracks do not penetrate into the magnesium matrix, this indicates that the matrix can withstand a sudden increase in load and even transfer the load back to the second-phase particles. Failure will occur after successive cracking. In the case of the PME alloy, however, the smaller particles do not appear fractured and the elongation to failure is almost twice as high as that of the ACE alloy. This could be related to the different size of the second phases and their distribution in the magnesium matrix. In the case of the ACE alloy, the second phases are much coarser than in the case of the PME alloy and are only present in the string alignments (see Figure 1b), not inside the recrystallized grains. The efficiency of load transfer is optimized for coarse particles, especially if they are fibers or elongated particles. Thus, load transfer will be maximized in the case of the ACE alloy, although such a mechanism could only release stress in those grains/regions close to the coarse particles. On the other hand, in the case of the PME alloy, second phases are homogeneously dispersed not only at grain boundaries but also inside the magnesium grains (see Figure 1c). As a result of this homogeneous dispersion, all of the magnesium matrix could transfer some load to the particles. Thus, it could be expected that the stress assumed by small second phases in the PME alloy is smaller than that assumed by coarse particles in the ACE alloy. The latter should favor the premature cracking of coarse particles, leading to the fracture of the material, as observed in the fracture surfaces of Figure 6.
The ductility of both alloys improves as the temperature increases but the values of the yield stress and UTS decrease, although the UTS values remain always above 120 MPa at 200 °C. It should be noted that for the PME alloy, an apparent yield stress is observed at the onset of plastic deformation (see Figure 5). This effect is associated with the initial pinning of the dislocations by the precipitates inside the magnesium matrix, which are much more abundant in the PME alloy than in the ACE alloy, and results in an increase in the yield strength. When a critical load is reached, the applied stress is sufficient to release the dislocations, and they are free to slip through the magnesium matrix. As shown in Figure 5, this results in a sudden decrease in stress in the tensile curves. This behavior has been also reported for Mg–Zn–Y and Mg–Ni–Y–CeMM alloys processed through a PM route [17,37]. As the temperature rises, the yield point phenomenon becomes less pronounced due to the fact that the pinning due to precipitates turns out to be less effective.
To further examine in detail how the different microstructural features contribute to the strengthening of the alloys at room temperature, it is necessary to separately evaluate their contribution to the alloy reinforcement. For this purpose, the effects of grain size, the presence of coarse second-phase particles and the existence of precipitates and small particles in the matrix were analyzed. These microstructural characteristics alloys are listed in Table 4.
According to the mixing rule, the contribution of different microstructural features to the yield strength could be expressed as follows:
σ0.2 = Vvm·σm + Vvpar·σpar
where σ0.2 is the yield stress of the alloy, σm and σpar are the yield strengths corresponding to the magnesium matrix and the second-phase particles, respectively, and Vvm and Vvpar are the volume fractions of the Mg matrix and coarse second-phase particles. In turn, the contribution of the σm matrix can be divided into three separate contributions; the first is related to grain size (σHP), the second is associated with the hardening due to the precipitates (σOR) and the third comes from solid solution of certain alloying elements in the magnesium matrix (σSS). Each contribution will be examined separately as follows:
σm = σHP + σOR + σss
At low temperature, the grain boundaries are very effective barriers to dislocation motion. The strengthening due to grain size refinement σHP was calculated using the Hall–Petch equation:
σHP = σ0 + KHP/D−½
where σ0 is the friction stress and KHP is the grain boundary strengthening coefficient, with both values taken for a randomly oriented magnesium alloy (17.7 MPa and 0.25 MPa m−1/2, respectively) [38], while D is the average grain size of the alloy. The calculated values for both alloys result in a contribution of 98 MPa for the ACE alloy and 154 MPa for the PME alloy. As expected, the contribution of the PME alloy is higher as a consequence of its smaller grain size (almost three times smaller than the grain size of the ACE alloy).
Reinforcement induced by fine particles and precipitates distributed within the Mg grains lead to additional reinforcement by hindering dislocation motion. This reinforcement can be calculated using the following equation proposed by Kocks and Ashby [39]:
σ O R e d g e = 1.69 M G b 2 4 π . 1 λ . l n d 2 b   for edge dislocations
σ O R s c r e w = σ O R e d g e 0.66   for screw dislocations
where d is the average diameter of the small particles, λ is the spacing between them on the relevant slip plane, b is the magnitude of the Burgers vector of the slip dislocations (0.3196 nm) [40]), G the shear modulus for Mg (17.3 GPa [41]) and M is the Taylor’s factor (6.5 for Mg [42]). The total contribution to the yield stress increase associated with the Orowan process could be determined using the average value of hardening due to edge and screw dislocations:
σ O R = σ O R s c r e w + σ O R e d g e 2
Calculated values for the ACE and PME alloys were 8.6 ad 18.7 MPa, respectively. The high volume fraction of fine particles in the PME alloy is about twice that of the ACE alloy (see Table 4). In any case, the contribution due to the Orowan mechanism is almost negligible, below 10% for both materials.
Solid solution hardening originates from the interaction of solute atoms with dislocations and can be estimated by the power-law relationship following the Labusch’s approach [43]:
ΔσS = 3μiε4/3. Xi2/3
where μ is the shear modulus of Mg, Xi is the atomic fraction of the solute element and ε is a function that represents two contributions: one induced by the size misfit between solute and matrix atoms, δ, and another contribution due to local alterations of the interatomic binding energies near the solute atoms, which are characterized by the modulus misfit, η. Thus, we have the following:
ε = (η2 + α2 δi2)1/2
With
η i = η i 1 + η i / 2
According these equations, the hardening effect induced by solid solution of 1 at.% of Zn would contribute with 2 MPa to the yield stress. Approximately 1 and 2.5 at% of Zn are dissolved in the magnesium matrix for the ACE and PME alloys, respectively (see Table 1): Consequently, additional hardenings of 1.7 and 4.3 MPa for the ACE and PME alloys, respectively, are conferred by Zn in solid solution. This clearly evidences the negligible strengthening due to elements in solid solution within the magnesium lattice.
The strengthening due to coarse second phases located at grain boundaries, given by the second term of Equation (1), was calculated from the hardness of the main phase (T phase) using the following expression [44]:
σ p a r = H v c
where Hv is the Vickers hardness of second phases and c is the elastic constraint factor whose value for a pyramid indenter is 0.3. Hv was considered as the hardness of the majority of the T phase in both alloys calculated for the as-cast alloy, due to the difficulty of computing the volume fraction of both phases separately, especially in the powder metallurgy alloy, taking a value of 767 MPa [9]. Since the volume fraction is similar, the contribution of second-phase particles to the yield stress is around 107 MPa for both alloys. Nevertheless, it must also be considered that in the PME alloy, the particles are not only located at the grain boundary but also inside the grains, and probably this value was overestimated.
Figure 7 illustrates the contribution in MPa of each individual reinforcement mechanism to the yield stress, as well as the cumulative percentage graphs of each individual strengthening.
It can be seen that the main strengthening mechanisms are achieved through the contribution of the grain size refinement and the reinforcement provided by the second-phase particles whose contributions constitute 92 and 85% for the ACE and PME alloys, respectively. For the ACE alloy, the major contribution to strengthening is given by the reinforcement of the second phases, with this contribution being slightly higher than that due to the grain size. The coarse second-phase particles of the T phase contribute almost 48% (107 MPa) to the hardening of the alloy, indicating the strong reinforcing character of these high-hardness phases [9,45]. For the powder metallurgy alloy, however, the most important contribution is given by the grain size refinement of the magnesium matrix, which provides 50% of the reinforcement (154 MPa). At low temperatures, a smaller grain size implies having a larger number of grain boundaries that act as effective barriers for dislocations and contribute to strengthening the material [20,46]. The hardening induced by the Orowan mechanism is also present in both alloys, although the contributions are only 4 and 6% in ACE and PME, respectively. Even though higher hardening was expected to be associated with the higher volume fraction of fine precipitates present in the magnesium matrix for the powder metallurgy alloy, maintenance at the relatively high extrusion temperature of 400 °C caused particle coarsening (mainly of MgZn composition with an average size around 125 nm), to the detriment of the fine particles that gradually dissolved; consequently, the interparticle distance increased. The same is applicable to the contribution of solid solution hardening. Despite the fact that initially more elements were detected in solid solution in the PM alloy (see Table 1), the exposure time at 400 °C caused a decrease in the concentration of these elements in the magnesium matrix, resulting in practically negligible hardening contributions (1% and 2% for the ACE and PME alloys, respectively).
The total strengthening σ0.2 achieved in the ACE and PME alloys was computed by substituting each individual contribution into Equation (1). Thus, the obtained values are 217 and 283 MPa, respectively. If these values are compared with the experimental yield strength results presented in Table 3, it can be seen that both values for the ACE alloy are in good agreement, while for the PME alloy there is a non-negligible difference of 24 MPa.
The difference between the experimental value of the yield strength and the calculated value as the sum of the contributions in the PM alloy must be associated with two factors: (i) There is underestimation of the volume fraction of the W phase. Since in the PME alloy the composition of the W phase differs from the equilibrium stoichiometry (see Table 1) and there are more elements in solid solution, it is conceivable that during the extrusion process these elements precipitate and form the W phase with a stoichiometry somewhat different from the equilibrium condition. The W phase, like the T phase, is also a hardening phase that would contribute to strengthening the alloy [47]. (ii) An additional contribution regarding texture is a factor that has not yet been considered. According to the microstructural study carried out in the present study, as can be deduced from the pole figures (Figure 4), the ACE alloy presents a smoothed basal texture of intensity I = 3 while the PME alloy exhibits a more pronounced basal texture of intensity 5, which reveals the existence of grains located with the basal planes parallel to the extrusion direction. In these regions, basal slip is hindered and could therefore contribute to the missing additional hardening.

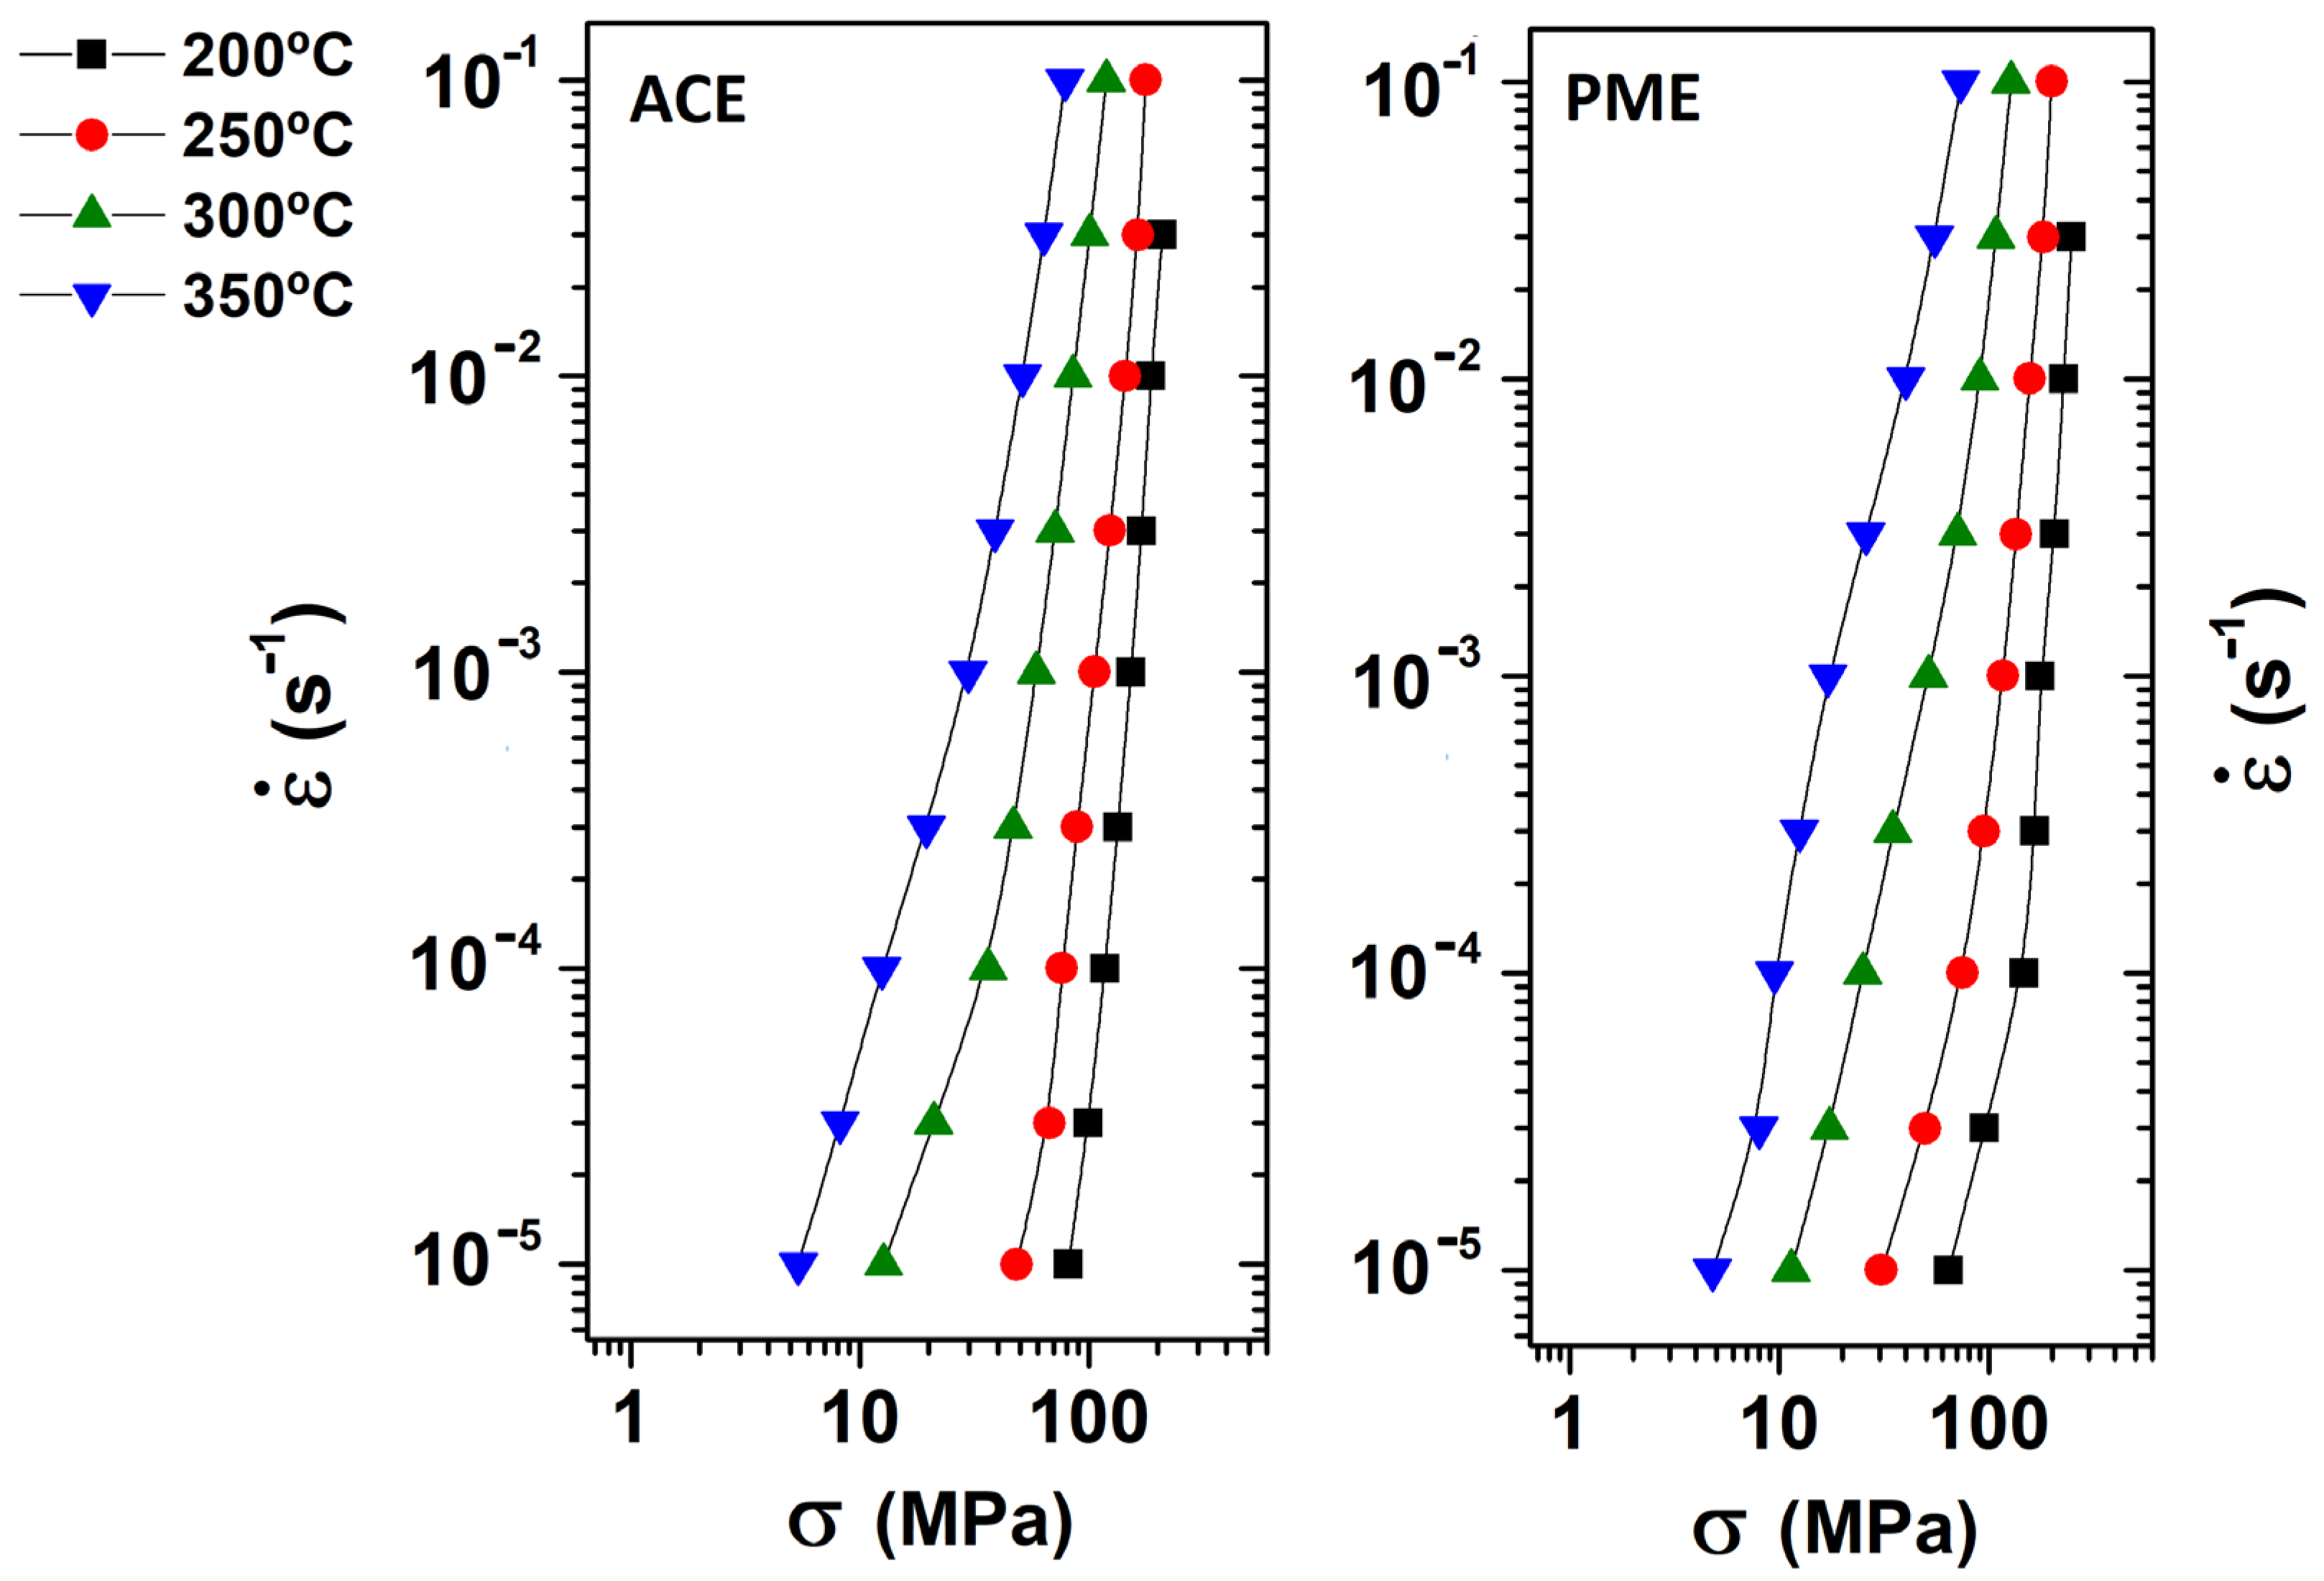
3.2.2. Mechanical Behavior from 200 °C up to 350 °C

According to Figure 5, in the second interval above 200 °C, both alloys experience considerable softening. Thus, yield stress and UTS values drop to very low stresses (below 35 MPa) and high elongations. In any case, the tensile curves are almost identical for both alloys, which are mainly characterized by the appearance of a long steady state once the yield stress is attained.
Deformation in magnesium alloys generally takes place at room temperature by basal slip ({0001} plane in the <11 2 ¯ 0> directions), and under certain conditions, twinning can also be activated. As the temperature increases, prismatic { 10 1 ¯ 0 } and pyramidal { 10 1 ¯ 1 } and { 10 2 ¯ 2 } slip planes can also be activated [1], leading to an improvement in ductility. In this case, above 250 °C, large elongations of more than 250% were observed in both alloys.
To determine deformation mechanisms operating in the temperature range 200–350 °C, tensile tests were performed with changes in strain rate (jumps) at constant temperature, varying the initial strain rate from 10−1 s−1 to 10−5 s−1. The strain rate versus true stress is represented in logarithmic scale in Figure 8.
From these curves, the characteristic parameters of the deformation mechanism were obtained: the apparent stress exponent napp, calculated from the following power-law constitutive creep equation:
ε ˙ = k σ n a p p e Q a p p R T
and the apparent activation energy Qapp, calculated as follows:
Q a p p = R   ( l n ε ˙ 1 T ) σ
where ε ˙ is the strain rate, k is the creep constant, σ is the flow stress, R is the universal gas constant and T is the absolute temperature.
As shown in Figure 8, for the ACE alloy, for each temperature two regions are distinguished in which the stress exponent napp takes different values (see Table 5), suggesting a change in the mechanism controlling the deformation. The transition between the two regions tends to shift towards higher strain rates as the test temperature increases.
At high strain rates (above 10−4 s−1) over the entire temperature range, napp varies between values of 4 and 10, indicating that the deformation mechanism is caused by dislocation motion. The activation energy determined at high strain rates was 182 kJ/mol, whose value is considerably higher than the activation energy of grain boundary diffusion- (92 kJ/mol) or lattice diffusion (135 kJ/mol)-controlled mechanisms in magnesium [48].
Otherwise, at low strain rates and high temperature (300–350 °C), napp takes values close to 2 and grain boundary sliding (GBS) must be the mechanism controlling plastic deformation for ACE alloy. This is in agreement with the large elongations obtained for the ACE alloy at high temperatures. The calculated activation energy is 138 kJ/mol, which is very close to the corresponding magnesium lattice self-diffusion energy.
The stress exponent analysis for the PME alloy in the temperature range 200–350 °C indicates that deformation is also controlled by basically two mechanisms: dislocation motion and GBS. At high strain rates, no significant differences were found with respect to the ACE alloy at 200–350 °C; the stress exponent napp ranges with values between 3 and 10, and the calculated activation energy was 180 kJ/mol, with dislocation motion being the mechanism governing deformation. At low strain rates, napp is close to 2. This value is associated with GBS and the activation energy of 95 kJ/mol matches rather well with the activation energy for grain boundary diffusion. It is interesting to note that GBS tends to occur at progressively higher strain rates with increasing temperature. Thus, GBS would act at low strain rates in the temperature interval 200–300 °C and at high strain rates at 350 °C.
In summary, the stress exponent analysis depending on the strain rate for both alloys indicates that plastic deformation is controlled by two different mechanisms. At high strain rates, the deformation is controlled by dislocation motion. The deviation in the stress exponent napp towards high values (from 4 to 10) could be indicative of the interaction between dislocations and second-phase particles during deformation. At low strain rates, generally, the mechanism that controls deformation is GBS, which is in agreement with the large elongations observed in Figure 5. The calculated activation energies (138 kJ/mol and 95 kJ/mol for ACE and PME alloys, respectively) suggest that the GBS mechanism is controlled by diffusion along the grain boundary for the PME alloy due to the its fine grain size of the alloy, while the larger grain size of the ACE alloy favors GBS being controlled by lattice self-diffusion. Similar behavior has been reported for coarse-grained and fine-grained magnesium alloys belonging to the Mg–Zn–TR system [49,50].

4. Conclusions

In this study, we investigated the microstructure and mechanical properties of Mg–6Zn–1Y–3.5CeMM (wt.%) processed by two different routes, extrusion at 400 °C of cast ingots and rapidly solidified powders, leading us to the following conclusions:
  • The nature of the second phases does not change with the processing route. The use of the powder metallurgy route results in a refinement of the microstructure that is manifested by a reduced grain size (2.4 vs. 6.8 μm), smaller particle size (0.4 vs. 2.0 μm) and higher volume fraction of precipitates within the magnesium grains.
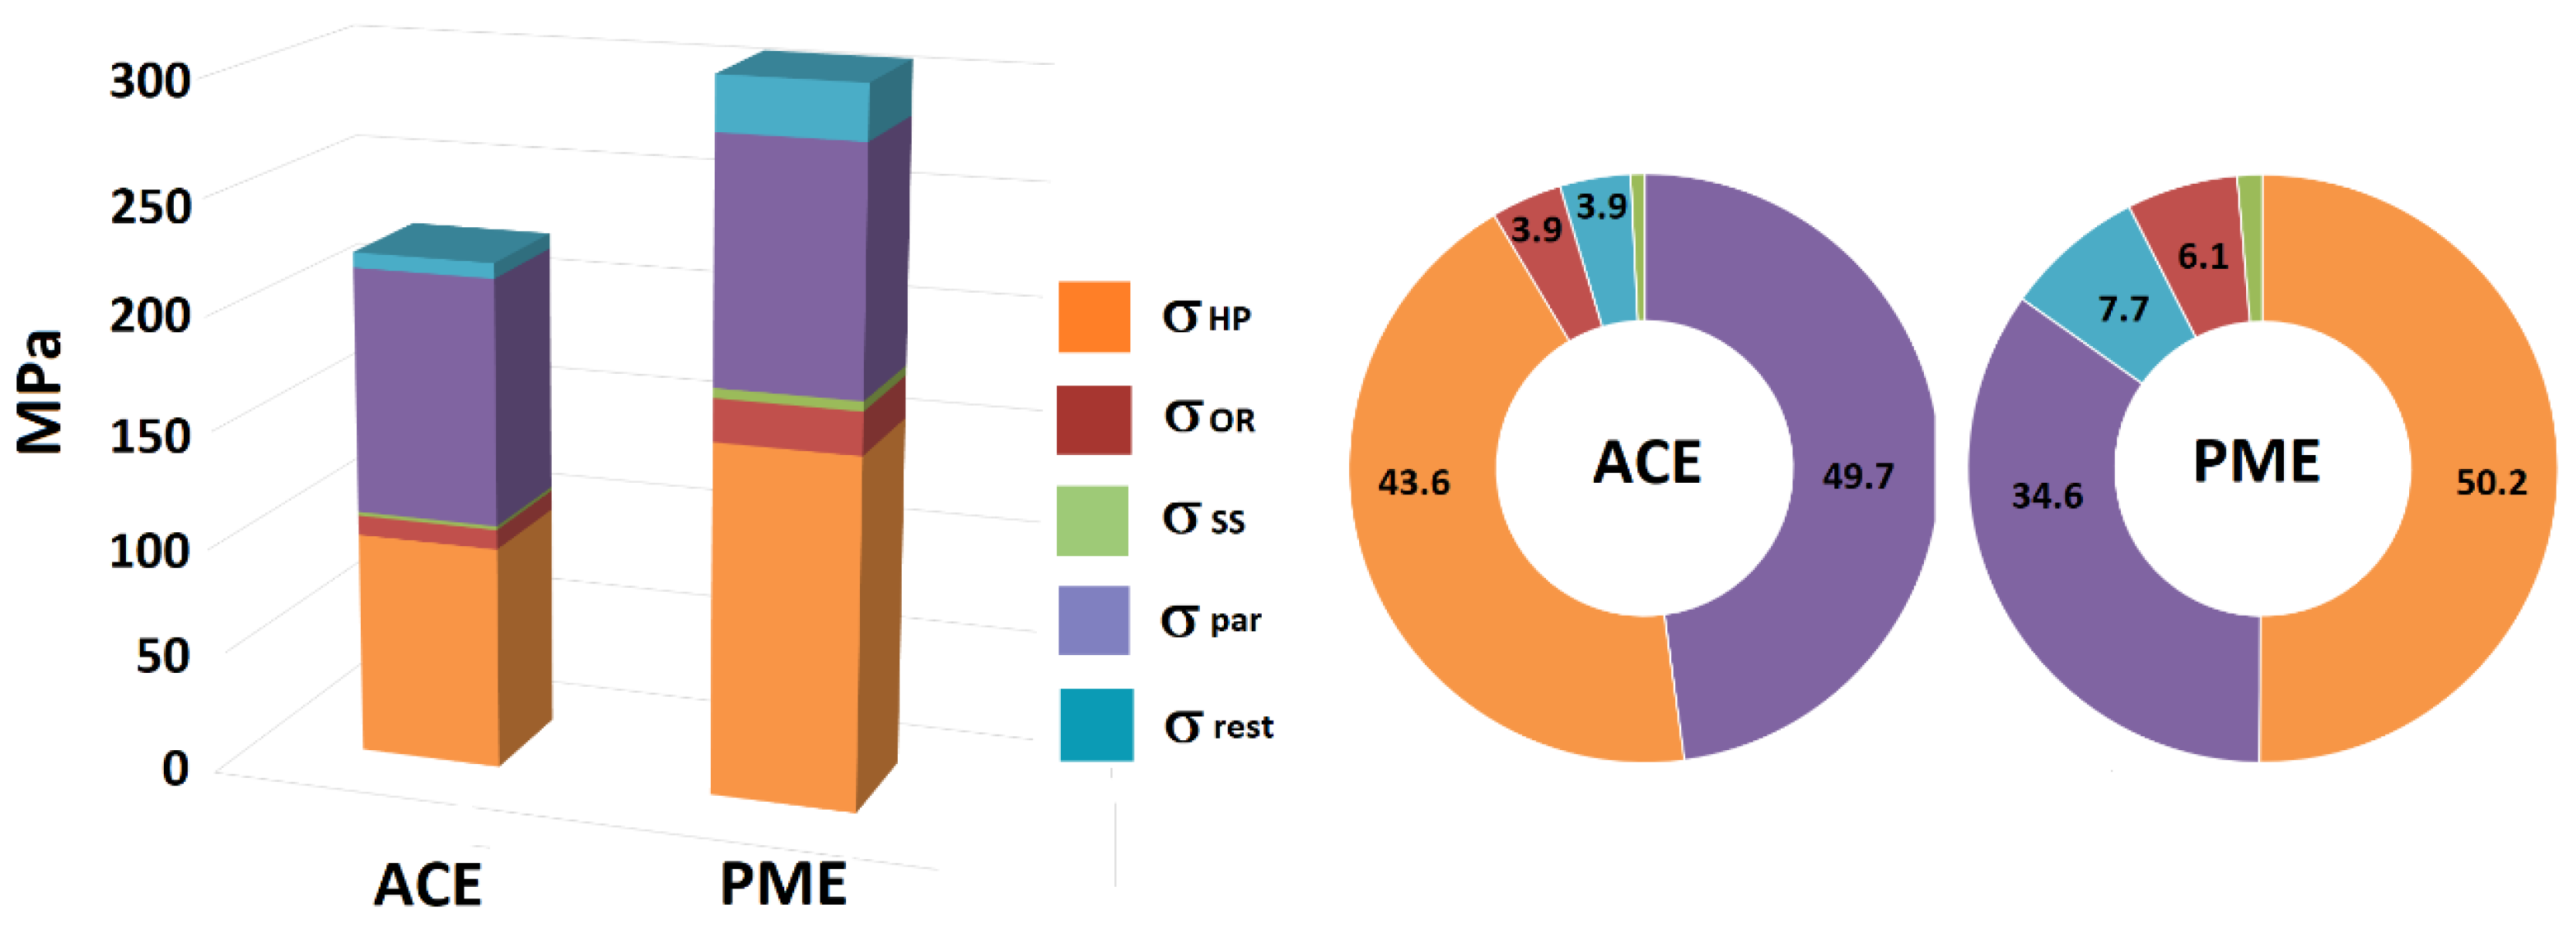
  • The yield stress of the PME alloy at room temperature is almost 40% higher than that of the ACE alloy (307 and 224 MPa, respectively), mainly due to strengthening by grain refinement and particle strengthening caused by load transfer. Hardening due to the Orowan mechanism and solid solution are quite low in both alloys. Mechanical strength values up to 200 °C also remain higher for the PME alloy.
  • At intermediate temperatures (200–350 °C) and low strain rates, deformation is controlled by grain boundary diffusion (GBS), improving the ductility of both alloys at the expense of sharp drops in the yield stress.
Based on the obtained results, and in order to increase knowledge of the powder metallurgy alloy that resulted in improved mechanical properties, it would be essential to consider the following aspects for future research:
-
Further improving the mechanical properties of the PME alloy by reducing the extrusion temperature.
-
Evaluating tension/compression asymmetries in the PME alloy.
-
Carrying out a comparative life cycle assessment of the two processing routes.

Author Contributions

Conceptualization, J.M. and P.P.; data curation, J.M.; formal analysis, J.M., P.P. and P.A.; funding acquisition, P.P.; investigation, J.M., P.P., G.G. and P.A.; methodology, J.M., P.P. and P.A.; project administration, P.P.; resources, J.M., P.P., G.G. and P.A.; software, J.M.; supervision, P.P. and P.A.; validation, J.M. and P.P.; visualization, J.M.; writing—original draft, J.M.; writing—review and editing, J.M., P.P., G.G. and P.A. All authors have read and agreed to the published version of the manuscript.

Funding

This research was funded by the Spanish Ministry of Science and Innovation under project MAT2012-34135.

Data Availability Statement

The data presented in this study are available on request from the corresponding author. The data are not publicly available due to they are part of an ongoing study.

Acknowledgments

We would like to acknowledge the expert support of A. Tomás and A. García for assistance with the TEM and SEM at the Microscopy Laboratory of CENIM. The authors would like to thank the reviewers for their comments aimed at improving the quality of the manuscript.

Conflicts of Interest

The authors declare no conflicts of interest.

References

  1. Avedesian, M.M.; Baker, H. Magnesium and Magnesium Alloys; ASM International: Materials Park, OH, USA, 1999. [Google Scholar]
  2. Kainer, K.U. Magnesium Alloys and Technology; Wiley-VCH Verlag GmbH & Co. KGaA: Weinheim, Germany, 2003. [Google Scholar]
  3. Polmear, I. Light Alloys, 4th ed.; Butterworth-Heinemann: Oxford, UK, 2005. [Google Scholar]
  4. Friedrich, H.E.; Mordike, B.L. Magnesium Technology; Springer: Berlin, Germany, 2006. [Google Scholar]
  5. Kulekci, M.K. Magnesium and Its Alloys Applications in Automotive Industry. Int. J. Adv. Manuf. Technol. 2008, 39, 851–865. [Google Scholar] [CrossRef]
  6. Luo, A.A. Recent Magnesium Alloy Development for Elevated Temperature Applications. Int. Mater. Rev. 2004, 49, 13–30. [Google Scholar] [CrossRef]
  7. Zhang, J.; Yu, P.; Liu, K.; Fang, D.; Tang, D.; Meng, J. Effect of Substituting Cerium-Rich Mischmetal with Lanthanum on Microstructure and Mechanical Properties of Die-Cast Mg-Al-RE Alloys. Mater. Des. 2009, 30, 2372–2378. [Google Scholar] [CrossRef]
  8. Zhang, D.F.; Qi, F.G.; Lan, W.; Shi, G.L.; Zhao, X.B. Effects of Ce Addition on Microstructure and Mechanical Properties of Mg6Zn1Mn Alloy. Trans. Nonferrous Met. Soc. China 2011, 21, 703–710. [Google Scholar] [CrossRef]
  9. Medina, J.; Pérez, P.; Garcés, G.; Adeva, P. Effects of Calcium, Manganese and Cerium-Rich Mischmetal Additions on the Mechanical Properties of Extruded Mg-Zn-Y Alloy Reinforced by Quasicrystalline I-Phase. Mater. Charact. 2017, 129, 195–206. [Google Scholar] [CrossRef]
  10. Calado, L.M.; Carmezim, M.J.; Montemor, M.F. Rare Earth Based Magnesium Alloys—A Review on WE Series. Front. Mater. 2022, 8, 804906. [Google Scholar] [CrossRef]
  11. Meng, S.; Xiao, H.; Luo, Z.; Zhang, M.; Jiang, R.; Cheng, X.; Yu, H. A New Extruded Mg-6Bi-3Al-1Zn Alloy with Excellent Tensile Properties. Metals 2022, 12, 1159. [Google Scholar] [CrossRef]
  12. Rong, J.; Xiao, W.; Ye, F.; Fu, Y.; Zhao, X.; Ma, C. The effects of substitution of yttrium for Ce-rich mischmetal on the mechanical properties and thermal conductivity of Mg–4Al–4Zn–4RE alloy. Mater. Charact. 2024, 212, 113959. [Google Scholar] [CrossRef]
  13. Medina, J.; Pérez, J.; Garces, G.; Tolnai, D.; Stark, A.; Schell, N.; Adeva, P. Microstructural changes in an extruded Mg-Zn-Y alloy reinforced by quasicrystalline I-phase by small additions of calcium, manganese and cerium-rich mischmetal. Mater. Charact. 2016, 118, 186–198. [Google Scholar] [CrossRef]
  14. Zhang, J.; Guo, W.; Bai, Q.; Liu, X.; Li, Z.; Sun, Z.; Jin, Y.; Zhao, Z. Effect of rare earth Ce and Y on microstructure and viscosity of ZL114A alloy. J. Alloys Compd. 2024, 1004, 175755. [Google Scholar] [CrossRef]
  15. Silva, E.P.; Marques, F.; Nossa, T.S.; Alfaro, U.; Pinto, H.C. Impact of Ce-base mischmetal on the microstructure and mechanical behavior of ZK60 magnesium casting alloys. Mater. Sci. Eng. A 2018, 723, 306–313. [Google Scholar] [CrossRef]
  16. Mordike, B.L.; Ebert, T. Materials Science and Engineering A-Structural Materials Properties. Microstruct. Process. 2001, 302, 37–45. [Google Scholar] [CrossRef]
  17. González, S.; Pérez, P.; Garcés, G.; Adeva, P. Influence of the Processing Route on the Mechanical Properties at High Temperatures of Mg-Ni-Y-RE Alloys Containing LPSO-Phases. Mater. Sci. Eng. A 2016, 673, 266–279. [Google Scholar] [CrossRef]
  18. Tang, C.; Wang, X.; Liu, W.; Feng, D.; Wu, K.; Zhang, C.; Miao, G.; Liang, W.; Li, J.; Liu, X.; et al. Effects of thermomechanical processing on the microstructure, texture and mechanical properties of a Mg-Gd-based alloy. Mater. Sci. Eng. A 2019, 759, 172–180. [Google Scholar] [CrossRef]
  19. Zhang, J.; Han, S.; Sun, Y.; Chen, X.; Chen, P.; Li, Z.; Huang, G.; Pan, F. Enhanced Strength of WE43 Magnesium-Rare Earth Alloy via Combining Extrusion and Aging. Mater. Sci. Eng. A 2023, 880, 145329. [Google Scholar] [CrossRef]
  20. Wu, G.; Tong, X.; Wang, C.; Jiang, R.; Ding, W. Recent advances on grain refinement of magnesium rare-earth alloys during the whole casting processes: A review. J. Magnes. Alloys 2023, 11, 3463–3483. [Google Scholar] [CrossRef]
  21. Maleki, M.; Berndorf, S.; Mohammadzehi, S.; Mirzadeh, H.; Emamy, M.; Ullmann, M.; Prahl, U. Grain refinement and improved mechanical properties of Mg-4Zn-0.5Ca0.5RE magnesium alloy by thermomechanical processing. J. Alloys Compd. 2023, 954, 170224. [Google Scholar] [CrossRef]
  22. Jiang, Y.; Tang, H.; Li, Z.; Zheng, D.; Tu, Y. Additive manufactured Mg-Gd-Y-Zr alloys: Effects of Gd content on microstructure evolution and mechanical properties. Addit. Manuf. 2022, 59, 103136. [Google Scholar] [CrossRef]
  23. Zhang, X.R.; Li, A.; Li, X.Z.; Zhang, D.D.; Bi, G.L.; Fang, D.Q.; Ding, X.D.; Sun, J. Fully equiaxed grain structure and isotropic mechanical properties in wire arc additive manufactured Mg–Al-RE alloy. J. Mater. Res. Technol. 2024, 31, 3998–4011. [Google Scholar] [CrossRef]
  24. Lee, J.Y.; Kim, D.H.; Lim, H.K.; Kim, D.H. Effects of Zn/Y Ratio on Microstructure and Mechanical Properties of Mg-Zn-Y Alloys. Mater. Lett. 2005, 59, 3801–3805. [Google Scholar] [CrossRef]
  25. Luo, S.; Tang, A.; Pan, F.; Song, K.; Wang, W. Effect of Mole Ratio of Y to Zn on Phase Constituent of Mg-Zn-Zr-Y Alloys. Trans. Nonferrous Met. Soc. China 2011, 21, 795–800. [Google Scholar] [CrossRef]
  26. Wei, L.Y.; Dunlop, G.L.; Westengen, H. Solidification Behaviour and Phase Constituents of Cast Mg-Zn-Misch Metal Alloys. J. Mater. Sci. 1997, 32, 3335–3340. [Google Scholar] [CrossRef]
  27. Mostafa, A.; Medraj, M. Phase Equilibria of the Ce-Mg-Zn Ternary System at 300 °C. Metals 2014, 4, 168–195. [Google Scholar] [CrossRef]
  28. Huang, M.L.; Li, H.X.; Ding, H.; Bao, L.; Ma, X.B.; Hao, S.M. Intermetallics and Phase Relations of Mg-Zn-Ce Alloys at 400 °C. Trans. Nonferrous Met. Soc. China 2012, 22, 539–545. [Google Scholar] [CrossRef]
  29. Padezhnova, E.M.; Mel’nik, E.V.; Miliyevskiy, R.A.; Dobatkina, T.V.; Kinzhibalo, V.V. Investigation of the Mg-Zn-Y System. Russ. Metall. 1982, 4, 185–188. [Google Scholar]
  30. Stanford, N. Micro-alloying Mg with Y, Ce, Gd and La for Texture Modification—A Comparative Study. Mater. Sci. Eng. A 2010, 527, 2669–2677. [Google Scholar] [CrossRef]
  31. Yamasaki, M.; Hashimoto, K.; Hagihara, K.; Kawamura, Y. Effect of Multimodal Microstructure Evolution on Mechanical Properties of Mg–Zn–Y Extruded Alloy. Acta Mater. 2011, 59, 3646–3658. [Google Scholar] [CrossRef]
  32. Ball, E.A.; Prangnell, P.B. Tensile-Compressive Yield Asymmetries in High Strength Wrought Magnesium Alloys. Scripta Metall. Mater. 1994, 31, 111–116. [Google Scholar] [CrossRef]
  33. Mackenzie, L.W.F.; Pekguleryuz, M.O. The Recrystallization and Texture of Magnesium-Zinc-Cerium Alloys. Scripta Mater. 2008, 59, 665–668. [Google Scholar] [CrossRef]
  34. Robson, J.D.; Henry, D.T.; Davis, B. Particle Effects on Recrystallization in Magnesium Manganese Alloys: Particle Pinning. Mater. Sci. Eng. A 2011, 528, 4239–4247. [Google Scholar] [CrossRef]
  35. Johannesson, B.; Ogin, S.L. Internal stresses in planar random fibre aluminium composites—I. Tensile tests and cyclic bauschinger experiments at room temperature and 77 k. Acta Metall. Mater. 1995, 43, 4337. [Google Scholar] [CrossRef]
  36. Lee, J.Y.; Lim, H.K.; Kim, D.H.; Kim, W.T.; Kim, D.H. Effect of Volume Fraction of Quasicrystal on the Mechanical Properties of Quasicrystal-Reinforced Mg–Zn–Y Alloys. Mater. Sci. Eng. A 2007, 449–451, 987–990. [Google Scholar] [CrossRef]
  37. Mora, E.; Garcés, G.; Oñorbe, E.; Pérez, P.; Adeva, P. High-Strength Mg–Zn–Y Alloys Produced by Powder Metallurgy. Scripta Mater. 2009, 60, 776–779. [Google Scholar] [CrossRef]
  38. Andersson, P.; Cáceres, C.H.; Koike, J. Hall-Petch Parameters for Tension and Compression in Cast Mg. Mater. Sci. Forum 2003, 419, 123–128. [Google Scholar] [CrossRef]
  39. Morris, M.A.; Morris, D.G. An Analysis of the Thermal and Mechanical Stability of Rapidly Solidified Cu-Mn-B Alloys. Acta Metall. 1988, 36, 1187–1199. [Google Scholar] [CrossRef]
  40. Cáceres, C.H.; Lukáč, P. Strain Hardening Behaviour and the Taylor Factor of Pure Magnesium. Philos. Mag. 2008, 88, 977–989. [Google Scholar] [CrossRef]
  41. Kaufman, J.G.; Ready, A.S.M. Reference: Properties and Units for Engineering Alloys; ASM International: Materials Park, OH, USA, 1997; p. 168. [Google Scholar]
  42. Bhattacharya, B.; Niewczas, M. Work-Hardening Behaviour of Mg Single Crystals Oriented for Basal Slip. Philos. Mag. 2011, 91, 2227–2247. [Google Scholar] [CrossRef]
  43. Toda-Caraballo, I.; Galindo-Nava, E.I.; Rivera-Díaz-delCastillo, P.E.J. Understanding the Factors Influencing Yield Strength on Mg Alloys. Acta Mater. 2014, 75, 287–296. [Google Scholar] [CrossRef]
  44. Cáceres, C.H.; Griffiths, J.R.; Pakdel, A.R.; Davidson, C.J. Microhardness Mapping and the Hardness-Yield Strength Relationship in High-Pressure Diecast Magnesium Alloy AZ91. Mater. Sci. Eng. A 2005, 402, 258–268. [Google Scholar] [CrossRef]
  45. Yang, J.; Wang, J.; Wang, L.; Wu, Y.; Wang, L.; Zhang, H. Microstructure and Mechanical Properties of Mg–4.5Zn–xNd (x = 0, 1 and 2, wt%) Alloys. Mater. Sci. Eng. A 2008, 479, 339–344. [Google Scholar] [CrossRef]
  46. Liu, Y.; Song, Y.; Li, N.; Sha, X.; Xu, M.; Chen, B.; Gao, B.; Xiao, L.; Zhou, H. Mechanical Properties and Microstructure Evolution of Mg-Gd Alloy During Aging Treatment. Metals 2022, 12, 39. [Google Scholar] [CrossRef]
  47. Yang, K.; Zhang, J.; Zong, X.; Wang, W.; Xu, C.; Cheng, W.; Nie, K. Effect of microalloying with boron on the microstructure and mechanical properties of Mg–Zn–Y–Mn alloy. Mater. Sci. Eng. A 2016, 669, 340–343. [Google Scholar] [CrossRef]
  48. Frost, H.J.; Ashby, M.F. Deformation Mechanism Maps; Pergamon Press: Oxford, UK, 1982. [Google Scholar]
  49. Kim, W.J.; Chung, S.W.; Chung, C.S.; Kum, D. Superplasticity in Thin Magnesium Alloy Sheets and Deformation Mechanism Maps for Magnesium Alloys at Elevated Temperatures. Acta Mater. 2001, 49, 3337–3345. [Google Scholar] [CrossRef]
  50. Watanabe, H.; Mukai, T.; Mabuchi, M.; Higashi, K. Superplastic Deformation Mechanism in Powder Metallurgy Magnesium Alloys and Composites. Acta Mater. 2001, 49, 2027–2037. [Google Scholar] [CrossRef]
Figure 1. Backscattered electron images and details of the second phases in Mg–6Zn–1Y–3.5CeMM alloys: (a) as-cast, (b) as-cast and extruded (ACE) at 400 °C, (c) rapidly solidified powders (RS) and (d) extruded powders (PME) at 400 °C.
Metals 14 00968 g001
Figure 2. Bright-field TEM images of (a) ACE and (b) PME Mg–6Zn–1Y–3.5CeMM alloys showing second-phase particles and precipitates and SAED patterns of the T phase and W phase, respectively.
Metals 14 00968 g002
Figure 3. XRD patterns corresponding to ACE and PME Mg–6Zn–1Y–3.5Cemm alloys (■ Mg, ▲T phase and ● W phase).
Metals 14 00968 g003
Figure 4. Calculated pole figures in the basal plane {0001} and prismatic plane { 10 1 ¯ 0 } for (a) ACE and (b) PME alloys.
Metals 14 00968 g004
Figure 5. True stress–true strain curves of extruded Mg–6Zn–1Y–3.5CeMM alloys (ACE and PME).
Metals 14 00968 g005
Figure 6. Secondary (a,c) and backscattered (b,d) electron images of fracture surfaces of ACE (a,b) and PME (c,d) alloys tested at room temperature at 10−4 s−1.
Metals 14 00968 g006
Figure 7. Yield stress (σ0.2) contributions by the different hardening mechanisms for ACE and PME alloys.
Metals 14 00968 g007
Figure 8. Strain rate–true stress dependence, plotted in a double logarithmic scale, for the extruded Mg–6Zn–1Y–3.5CeMM alloys (ACE and PME, respectively) in the temperature range 200–350 °C.
Metals 14 00968 g008
Table 1. Chemical composition (at.%) of the phases found in the as-cast, RS powders (PM), as-cast and extruded (ACE), and PM and extruded (PME) Mg–6Zn–1Y–3.5CeMM alloys.
AlloyPhaseMgZnYCeMM
As-castmatrix98.71.30.00.0
Grey phase (W phase)45.036.517.01.5
Bright phase (T phase)76.816.10.46.7
RS powdersmatrix96.72.40.30.6
Interdendritic region93.74.70.51.1
ACEmatrix99.10.90.00.0
Grey phase (W phase)57.528.211.92.4
Bright phase (T phase)72.719.90.27.2
PMEmatrix97.52.10.20.2
Grey phase (W phase)92.15.12.40.4
Bright phase (T phase)87.99.10.52.5
Table 2. Chemical composition (at.%) determined by EDS microanalysis in TEM.
AlloyPhaseMgZnYCeMM
ACEW phase88.98.52.30.3
T phase67.823.20.38.7
PMEW phase90.48.11.20.3
T phase90.18.10.71.1
Table 3. Yield stress (YS), ultimate tensile strength (UTS) and elongation to failure (ε) values of the Mg–6Zn–1Y–3.5CeMM alloys (ACE and PME) tested from room temperature to 350 °C.
Temperature (°C)YS (MPa)UTS (MPa)ε (%)YS (MPa)UTS (MPa)ε (%)
ACEPME
252243051330739022
1001762362222929233
1501251873218621934
200881243813414551
2506381664577127
30024341032032272
350720251714233
Table 4. Main microstructural parameters for ACE and PME alloys: volume fraction of second phases, size of second phases, volume fraction of precipitates, size of precipitates, grain size and maximum intensity of texture (I).
AlloyVolume Fraction Second Phases (%)Size Second Phases (μm)Volume Fraction Precipitates (%)Size Precipitates (nm)Grain Size (μm)I
ACE14.002.00.20366.83
PME13.840.40.381222.45
Table 5. Stress exponent napp values of the Mg–6Zn–1Y–3.5CeMM alloy (ACE and PME) from room temperature to 350 °C and different strain rates.
Temperature (°C) ε ˙ n ε ˙ n
ACEPME
20010−5–10−4510−5–10−42
10−4–3 × 10−21010−4–10−110
25010−5–10−4310−5–10−42.5
10−4–10−1810−4–10−17
30010−5–3 × 10−4210−5–3 × 10−43
3 × 10⁻⁴–10−163 × 10−4–10−14
35010−5–10−32.510−5–10−34
10−3–10−1410−3–10−13
Disclaimer/Publisher’s Note: The statements, opinions and data contained in all publications are solely those of the individual author(s) and contributor(s) and not of MDPI and/or the editor(s). MDPI and/or the editor(s) disclaim responsibility for any injury to people or property resulting from any ideas, methods, instructions or products referred to in the content.

