Article

Realization of Bio-Coal Injection into the Blast Furnace

1
Swerim AB, Box 812, 971 25 Luleå, Sweden
2
Minerals and Metallurgical Engineering, Luleå University of Technology, 971 87 Luleå, Sweden
3
SSAB EMEA AB, SSAB Special Steels Division, Aspaleden 2, 613 31 Oxelosund, Sweden
*
Author to whom correspondence should be addressed.
Metals 2024, 14(9), 969; https://doi.org/10.3390/met14090969
Submission received: 9 July 2024 / Revised: 18 August 2024 / Accepted: 21 August 2024 / Published: 27 August 2024

Abstract

:
The steel industry accounts, according to the International Energy Agency, for ~6.7% of global CO2 emissions, and the major portion of its contribution is from steelmaking via the blast furnace (BF) route. In the short term, a significant reduction in fossil CO2 emissions can be achieved through the introduction of bio-coal into the BF as part of cold bonded briquettes, by injection, or as part of coke. The use of bio-coal-containing residue briquettes was previously demonstrated in industrial trials in Sweden, whereas bio-coal injection was only tested on a pilot scale or in one-tuyere tests. Therefore, industrial trials replacing part of the pulverized coal (PC) were conducted. It was concluded that the grinding, conveying, and injection of up to 10% of charcoal (CC) with PC can be safely achieved without negative impacts on PC injection plant or BF operational conditions and without losses of CC with the dust. From a process point of view, higher addition is possible, but it must be verified that grinding and conveying is feasible. Through an experimentally validated computational fluid flow model, it was shown that a high moisture content and the presence of oversized particles delay devolatilization and ignition, lowering the combustion efficiency. By using CC with similar heating value to PC, compositional variations in the injected blend are not critical.

1. Introduction

Data from the World Steel Association [1] show a general trend of increasing steel consumption and the need for primary steel production. In 2021, approximately 67% of the metallic units for steel production comprised pig iron produced in a blast furnace (BF) and close to 6% consisted of directly reduced iron (DRI), of which around one-third was carbon (C)-based. About 54% of the globally produced steel originates from China, which mainly uses the BF/BOF route. The steel industry accounts, according to the International Energy Agency, for ~6.7% of global CO2 emissions; on average, 1.9 tons of CO2 is released for every ton of produced steel [2]. Presently, the steel industry faces great challenges due to changing raw material qualities and the need to lower CO2 emissions, which is especially important in the still dominant coal- and coke-based production process via the BF/BOF route.
The EU 2030 Energy Strategy seeks to reduce greenhouse gas (GHG) emissions by 40%, and the EU 2050 energy roadmap states a long-term goal of reducing GHG emissions by 80–95% by 2050, both relative to 1990 levels [3]. Steel companies are striving to reduce CO2 emissions, e.g., through the use of hydrogen (H2) to produce DRI [4] to be smelted together with scrap in an electric arc furnace (EAF), i.e., the Swedish initiative HYBRIT [5] or H2 Green Steel [6]. Also, the pilot project by ArcelorMittal’s Hamburg, Germany [7], aims for a reduction in H2. The new routes require investments in infrastructure for steel production, but also a stable supply of large amounts of renewable electricity and high-quality ferrous ore, both of which are available in Sweden. The main source of H2 is presently natural gas (75% of global production), and less than 0.1% is produced via electrolysis [8]. Further, smelting reduction processes are under development, like HIsarna (initially part of ULCOS) at TATA Steel in the Netherlands. HIsarna operates on oxygen (O2), which enables CCU/CCS, can use fines of ore, coal, and residues directly, and can supply hot metal treatable in the BOF process. An H2 plasma smelting reduction process was developed by voestalpine, Austria, in their SuSteel project [9]. Furthermore, alkaline iron electrolysis initiated in ULCOS and further developed in the RFCS project IERO [10] and in the EU project SIDERWIN [11] is experiencing up-scaling by ArcelorMittal in France. Other steelmakers like thyssenkrupp [12] and Japanese steelmakers in the project Course 50 [13] study the use of H2 in the BF.
The possible replacement of fossil coal with biobased reducing agents to realize C savings in the short to medium term has been investigated for example in Brazil [14], Australia [15], Sweden, and Finland. Through the tuyere injection of pre-treated biomass (bio-coal) or by adding bio-coal as part of a residue briquette, the need for fossil coals can be significantly lowered. This can countermeasure CO2 emissions during the period when breakthrough technologies are implemented. In Sweden, the addition of bio-coal into the BF as part of residue briquettes was demonstrated in industrial trials [16], and also, bio-coal injection trials (~23.6% torrefied sawdust (TS) mixed with pulverized coal (PC)) have been conducted at an experimental BF [17] and in one-tuyere tests (up to 40% of TS, or hydro-char produced from food residue) performed at SSAB in Oxelösund [18]. Recent research has aimed to reach higher bio-coal inputs via briquettes [19], to use bio-coal as a substitute for coking coals [20] and, in the present study, to realize the injection of bio-coal into the BF. By combining bio-coal’s introduction into the BF via briquettes, as part of coke and via injection, the fossil CO2 emissions can be significantly lowered, and with CCS/CCU, more CO2 than that generated by the fossil reducing agents can be captured. C captured from BF, BOF, and coke oven gas can be used as a feed for the production of chemicals such as methanol, ammonia, and urea, as studied in the projects FReSMe (methanol) [21], Initiate, Carbon2Chem (ammonia) [22], STEELANOL (BF gas reacts with biomass to produce bioethanol) [23], and INITIATE (ammonia) [24].
Previously, the top-charging [25] and injection [26] of charcoal (CC) have been conducted in small-sized BFs in Brazil. An industrial trial on the injection of CC together with PC and natural gas was conducted at BF A at ArcelorMittal Monlevade in Brazil [14]. In these trials, the CC and injection coal were ground separately due to their significant difference in hard grove indexes (HGIs). To study the possibility of reducing fossil CO2 emissions in the short and medium term, the input of bio-coal into an industrial BF using existing equipment was investigated in the Bio4BF project funded by the Swedish Energy Agency. Based on theoretical evaluation, the researchers decided to demonstrate the injection of bio-coal. The feasibility of co-grinding and co-injecting bio-coal with fossil coal has rarely been studied before; therefore, trials were prepared and conducted at BF4 at SSAB Oxelösund, Sweden. The co-grinding and co-injection of CC and PC enables rapid implementation, as investments in additional equipment are not needed. The effect of bio-coal addition on the PC injection (PCI) plant, the BF process, the combustion behavior in the raceway, and the fossil CO2 emissions related to ironmaking are evaluated in this study and presented in this paper.

2. Materials and Methods

2.1. Materials

Several different bio-coals were evaluated based on their properties (ash content, chemical composition, moisture content, particle size distribution (PSD), etc.), availability, cost, and delivery. The effect on the BF process was evaluated by means of heat and mass balance modeling and computational fluid flow (CFD) modeling for raceway conditions for TS pellets and one type of CC (CCPre); see Table 1 for their properties. CCPre from Noireco in Finland was selected for the trials due to its ability to supply the needed amount of CC with the desired properties according to the evaluation result. The actual CCs used during the trial periods when mixing 7.5% or 10% of CC into the injection coal, namely CC7.5% and CC10%, were also evaluated. Due to variations in the moisture content and the PSD of the received CC, it was concluded that mixing with raw coal and co-grinding before conveying to the BF were necessary.
The higher heating values (HHV, MJ/kg) of the used PCs and CCs varied between approximately 30 and 32 MJ/kg. The contents of C, O, and quartzite differed significantly between samples of CC7.5% and CC10% collected during the BF trials, c.f. Table 1. BF flue dust was injected, and the top-charged materials used were similar during the reference and trial operations. The ferrous layers consisted of olivine pellets with 66.5% Fe present as hematite, residue briquettes, some scrap, basic fluxes (BOF slag and limestone), and nut coke.

2.2. Methods

2.2.1. BF Operational Trials

The industrial trials consisted of reference (Ref.) and test periods with a stepwise increased ratio of CC (5%, 7.5% and 10%) mixed with PC. Constant operational conditions were aimed for during the whole test. BF No. 4 operates at ambient top pressure and has a bell-less top with a rotating chute for burden distribution. The PC or the mix of PC and CC was injected through swirl-tip oxy-coal lances at all 20 tuyeres. Additionally, every other tuyere was equipped with a straight lance for BF flue dust injection. The indicative process parameters are stated in Table 2.
Stable operational periods with only minor changes in the process parameters were selected for evaluation. The CC was mixed with the injection coal at the coal yard using a tractor equipped with a scale, and the blend was introduced into the PCI plant. During the trials, samples of CC, PC, coke, and dust were collected, analyzed, and evaluated.

2.2.2. Dust Sampling and Characterization

Iso-kinetic dust sampling was performed during the reference and each of the test periods. Figure 1 and Figure 2 show the iso-kinetic sampling probe and its installation above the dust cyclone, respectively. Fine dust was collected on the filter, while coarse dust was collected in the cyclone. Based on results from previous studies, the fractions were combined before most of the analysis. Collected dust was analyzed for chemical composition at D-lab using X-ray fluorescence (XRF) analysis with a Thermo ARL 9900 XRF instrument (Thermo Fisher Scientific Inc., Waltham, MA, USA) operating a rhodium tube at 50 kV 50 mA. XRF measurements were conducted on pressed dust sample briquettes produced from pulverized samples with cellulose as binder. The C and sulfur (S) content for each composite was determined by combustion analysis using a LECO CS-444 (LECO Corporation, Lakeview Ave, St. Joseph, MI, USA). To verify if part of the injected CC is carried out with the top-gas, the amounts and chemical compositions of dust were determined. Changes in the dust properties may affect its recycling via injection or in cold-bonded briquettes.
The phases and the ratios of hematite and magnetite were analyzed using an XRD Panalytical Empyrean X-ray diffractometer equipped with copper Kα radiation of 45 kV and 40 mA (Malvern Panalytical, Almeo, The Netherlands). The data were evaluated in the software HighScorePlus ver. 4.9 with a Rietveld refinement tool provided by the same supplier as the XRD instrument. For identifying the phases, the Crystallography Open Database (COD) and the Inorganic Crystal Structures Database were used [27].
The origin of C was determined by thermogravimetric analyses (TGA) using a Netzsch STA 409 instrument (sensitivity ±1 μg) attached to a Quadruple Mass Spectrometer (QMS, Netzsch, Selb, Germany). Samples of PC, CC (samples from the 7.5% and 10% periods), and coke were used for calibration, while the dust samples were analyzed as unknowns. All samples were heated at a rate of 5 °C/min up to 1000 °C in air (200 mL/min). Approximately 1000 mg of each sample was placed in a crucible with low edges to avoid the accumulation of CO or CO2. Based on the temperature and rate for reaction between C and O2 in air, the type and amount of C in the dust were deduced.

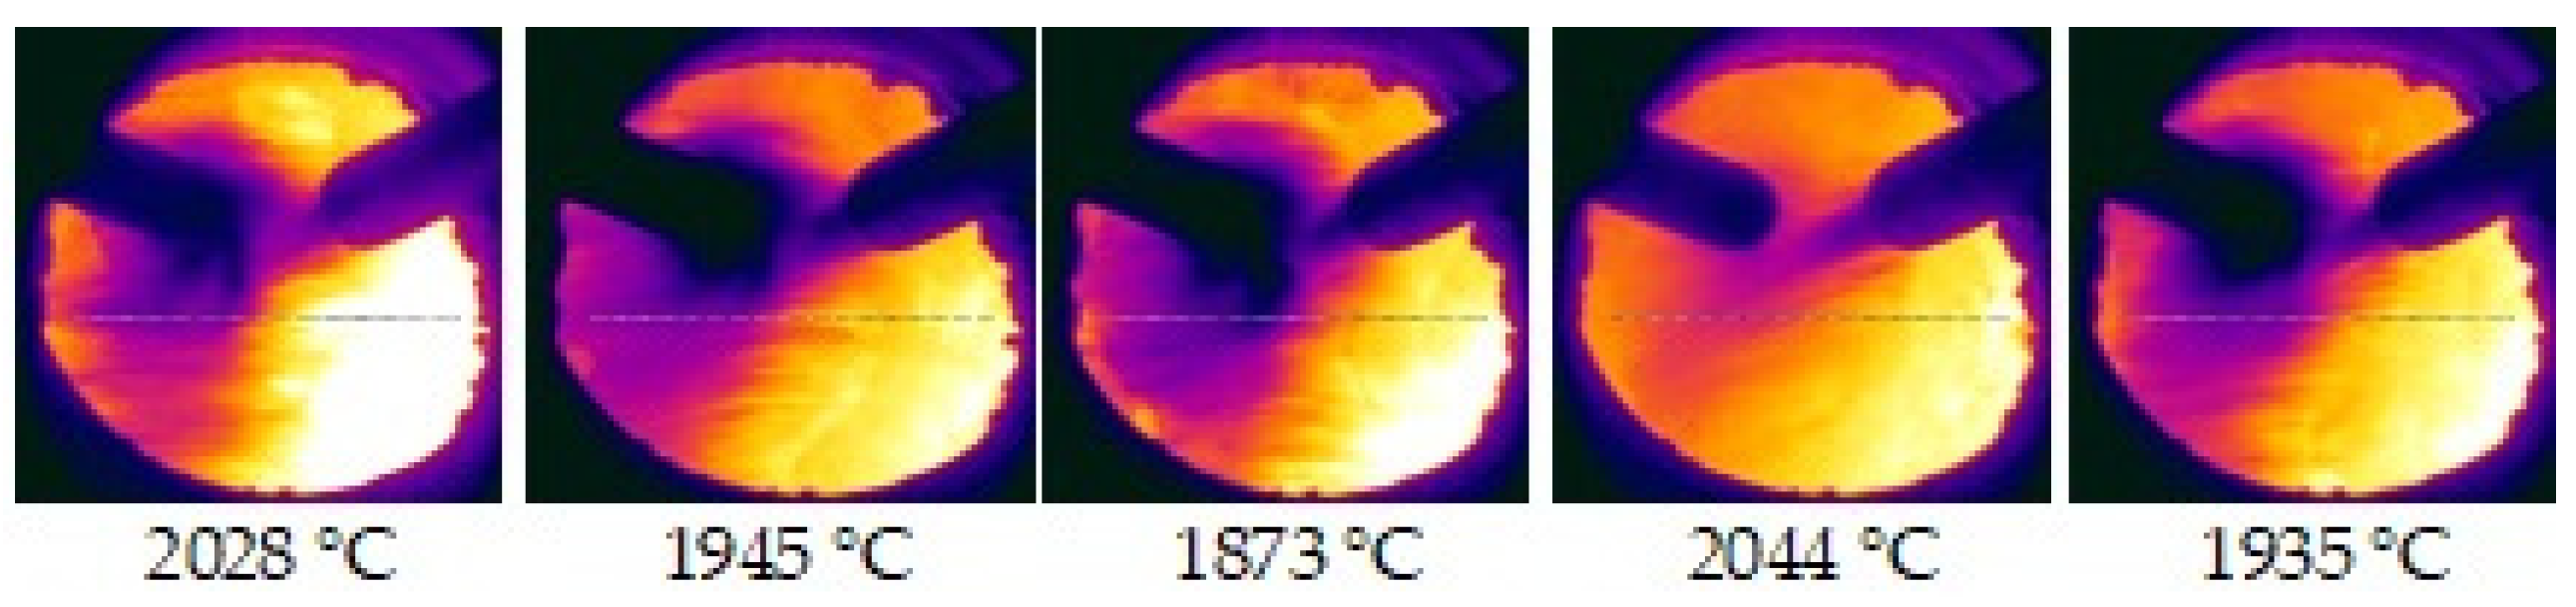
2.2.3. Raceway Monitoring

The raceway was monitored through a 38 mm diameter glass window mounted in the lid of the blowpipe of four out of the 20 tuyeres using a thermal imagining camera from Dias (Dresden, Germany). The aim was to assess the impact on the raceway conditions when injecting the blends of CC and PC compared to PC alone, and to validate the CFD model.

2.2.4. BF Trial Evaluation and Theoretical Prediction of the Effects of Bio-Coal Injection

MASMOD, a 1-dimensional heat and mass balance model [28] including a burden model, was used for the BF trial evaluation, c.f. Figure 3. The BF is divided into an upper and a lower zone connected via the thermal reserve zone (TRZ) where gaseous CO/CO2 and H2/H2O are in equilibrium with the wustite (FeO1.056) in the burden at the TRZ temperature (TRZT). The deviation of actual data from this equilibrium is represented by the shaft efficiency, which is deduced by closing heat and mass balances at the TRZT. In closing the mass balances, the amounts and compositions of inputs (such as raw materials and blast volume) and outputs (including HM, slag, top-gas, off-gas dust as well as measured and calculated values for blast volume and heat losses per time unit) were considered. The fossil CO2 emissions were calculated for stable reference and trial periods. Averages of operational data corresponding to stable operational periods were used as the input.
MASMOD was calibrated with data from the reference period, with the blast moisture adjusted to 13 g/Nm3. The model was then used to estimate the relative effects on process characteristics and fossil CO2 emission when injecting the bio-coals listed in Table 1. Bio-coal was assumed to replace PC at rates of 10%, 20%, and 100% with a total injection rate of 113 kg/tHM. The BF characteristic data and selected operational settings, including the shaft efficiency, TRZT, heat losses, and their distribution between the upper and lower part of the BF, HM heat level, the elemental distribution between HM and slag, EtaH2  ( H 2 H 2 + H 2 O × 100 % ) , production rate, and slag basicity were kept constant. The calculations focused on the coke consumption, the need for basic fluxes, and the slag rate and composition, as well as total and fossil CO2 emissions.

2.2.5. Reaction Modelling of Carbonaceous Materials

The reaction kinetics of dried samples of the carbonaceous injection material and coke were evaluated using TGA data. After devolatilization in argon at a flow rate of 100 mL/min, the samples were subjected to either gasification in CO2 or oxidation in synthetic air, each with a flow rate of 200 mL/min. The temperature profiles used for these tests are shown in Figure 4.
Kinetic parameters were determined according to their definition in the CFD software ANSYS FLUENT, 18.2 by applying the “single kinetic rate model” [29] for devolatilization, gasification, and combustion. The PSD was described with a mathematical representation according to Rosin–Rammler distribution. The devolatilization rate, R VM , was assumed to follow a first-order reaction depending on the remaining mass of VM in the particle, m VM , as shown in Equation (1). In Equation (1), d m V M represents the mass change of VM, d t represents the time change, and k is the kinetic rate constant defined by the Arrhenius Equation (2). In Equation (2), A is the pre-exponential factor, E the activation energy, R is the universal gas constant, and T is the temperature in Kelvin. The procedure for deducing A and E in Equation (2) through linear regression is exemplified in Figure 5.
R V M = d m V M d t = k m V M
k = A e - E RT
A surface reaction model describes the reactions of C with O2 in air or CO2 according to the reactions R7 and R8 listed in Table 3. The surface rate reaction constant in Equation (3), RC, is defined either by the kinetic reaction rate, RK, or by the diffusion rate, RD. Here, Ap represents the surface area of the particle, fs is the mass fraction of reacted solid species (C) in the particle, and pg is the bulk partial pressure of the reacting gas. If the kinetic reaction rate is limiting the reaction (i.e., R K <<   R D ), Equation (3) simplifies to Equation (4).
R C = A p f s p g R K R D R K + R D
R C = A p f s p g R K

2.2.6. CFD Modelling on Pulverized Injection of Bio-Coal with PC

A three-dimensional, multiphase numerical raceway model for injection and combustion in ANSYS FLUENT, 18.2 was used to explore combustion efficiency, gas composition, and temperature distribution when injecting PC and bio-coal. The raceway model, developed for one single tuyere as described in [17], was applied to BF No. 4 at SSAB in Oxelösund using typical operational data. Modelling was initially carried out to evaluate various bio-coals, and later it was employed to assess trial results and validate the raceway model, in order to achieve a deeper understanding of how different bio-coal types affect the combustion behavior.
The kinetics of the reactions [29] described in Table 3 by Equations (R1)–(R4) were incorporated into the model calculations. The notations a–d in R2 are material-specific and depend on VM content and composition. To prevent reactions from occurring before the flame, the minimum of calculated Arrhenius or eddy dissipation model [30] reaction rates was used as the reaction rate. Once the flame was ignited, the eddy dissipation rate was typically smaller than the Arrhenius rate, and reactions were constrained by a mixed regime.
The kinetic parameters for devolatilization, combustion, and gasification deduced from TGA are stated in Table 4. Parameters related to homogenous reactions and diffusion, based on [29] and CFD modelling software, are found in Table 5. Table 6 shows the modelled cases 1–6 for which the injection of TS or CC along with PC are assumed to predict the impact on raceway conditions. Cases 7–11 correspond to operational conditions during the reference and trials injecting either CC7.5% or CC10%.

3. Results

3.1. BF Operational Trials Results

As seen in Table 7, the main difference between the periods is the blast moisture content, which was lower during the 7.5% CC and 10% CC periods than during the Ref. and 5% CC periods. The production rate was slightly lower during 10% CC, while the blast- and top-gas temperatures (TGT) were slightly higher in the Ref. period compared to in the other periods. The Si content, HM temperature, and slag basicity were relatively equal during all periods. The basicity was controlled by adjusting the limestone addition.

3.2. Effect on the PCI Plant

The co-grinding and co-injection of CC and coal were possible without any notable negative effects on the PCI plant. To more accurately estimate when a new mix of CC and PC would reach the BF, the weight in the raw coal silo was allowed to drop before a new mix was loaded. Other settings in the PCI plant were unchanged, and no significant differences in operational behavior were observed when examining the PCI plant data.

3.3. Dust Formation and Characteristics

The off-gas dust generation was not affected by the injection of CC up to 10%. As seen in Figure 6, the total amount of dust in g/Nm3 was similar for the Ref., 5% CC, and 7.5% CC injection trial periods. The production rate was slightly lower during the 10% CC period, and thus the total dust amount was lower. The wt.% of solids in manually collected sludge samples correlates well with the total dust, with an R2 value of 75%.
When comparing the Ref. and trial periods, no significant differences in the chemical composition of the total iso-kinetically collected dust are found (see Table 8). The injected CC has higher contents of CaO, MgO, K2O, and P than the PC (see Table 1). Correspondingly, the CaO content in the dust was slightly higher during the periods with the highest replacements of PC with CC (7.5% CC and 10% CC).
The phases detected by XRD were hematite (Fe2O3), magnetite (Fe3O4), and calcite (CaCO3), c.f. Figure 7. The relative contents of Fe2O3 and Fe3O4 were on average ~89% and ~11%, respectively. Ctot analyzed for combined fine and coarse dust ranged from roughly 35.8% to 43.1%. Of this, Ccoke constituted 27.4 to 31.0%, while the char originating from injected PC varied from 7.2% to 9.7%. The amount of char from PC was equal in fine and coarse dust fractions, whereas the C originating from coke was six to seven times higher in the coarse dust fraction. Char originating from CC or soot was not detected in the iso-kinetically collected dust samples.

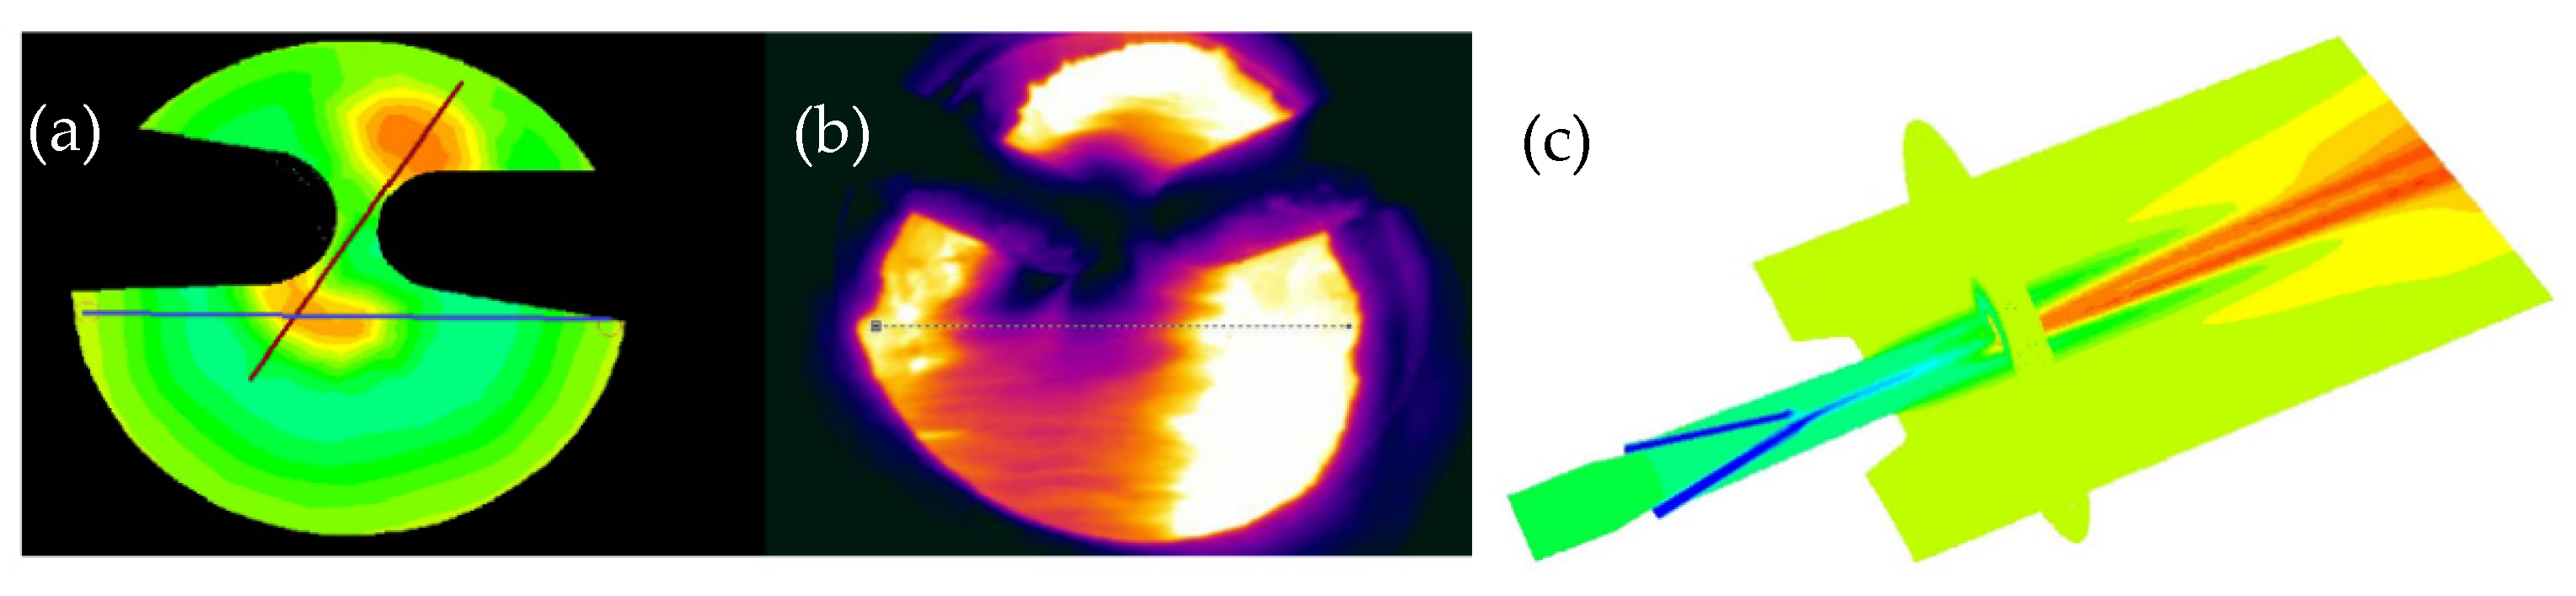
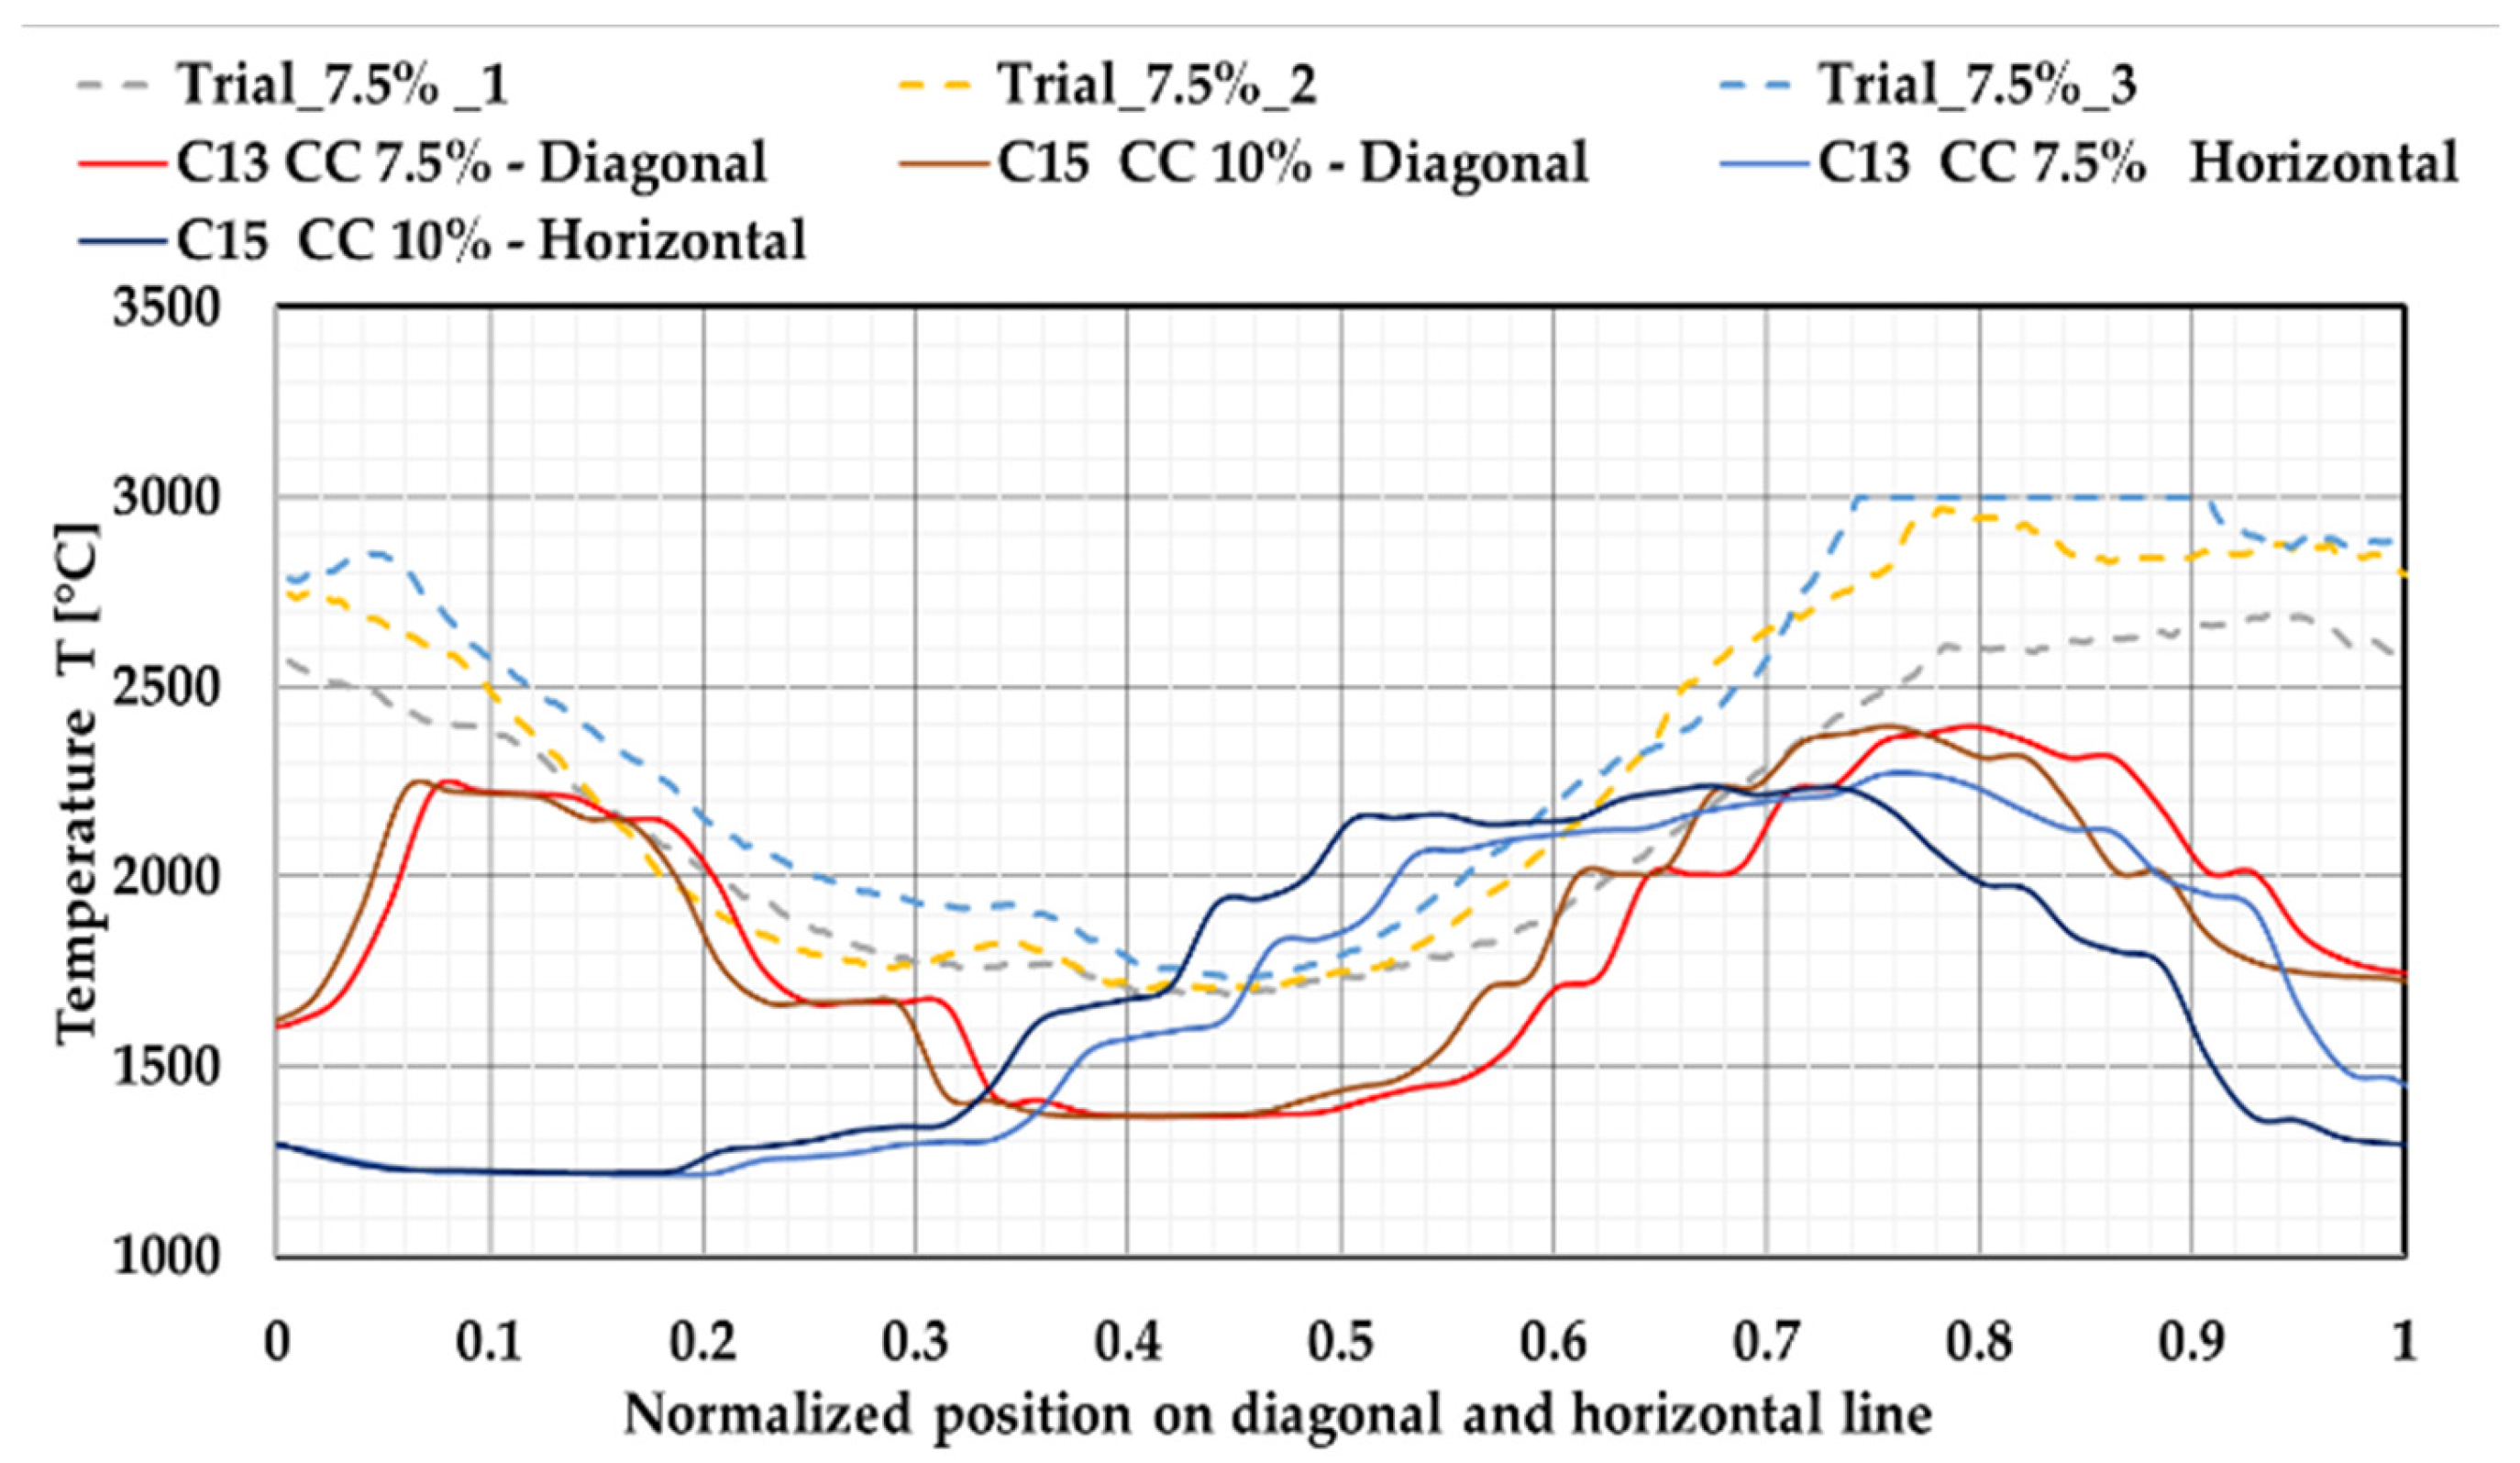
3.4. Raceway Monitoring

Temperature measurements using a thermal imaging camera indicated no major differences in the raceway between 100% PC injection and the injection of blends of CC and PC, as shown in Figure 8 and Figure 9. Comparisons are made for recordings taken during similar conditions to during the Ref. period, as given in Table 7. High-speed camera monitoring did not indicate any significant change in the size of the coal plume or variation in the movements due to the introduction of CC.

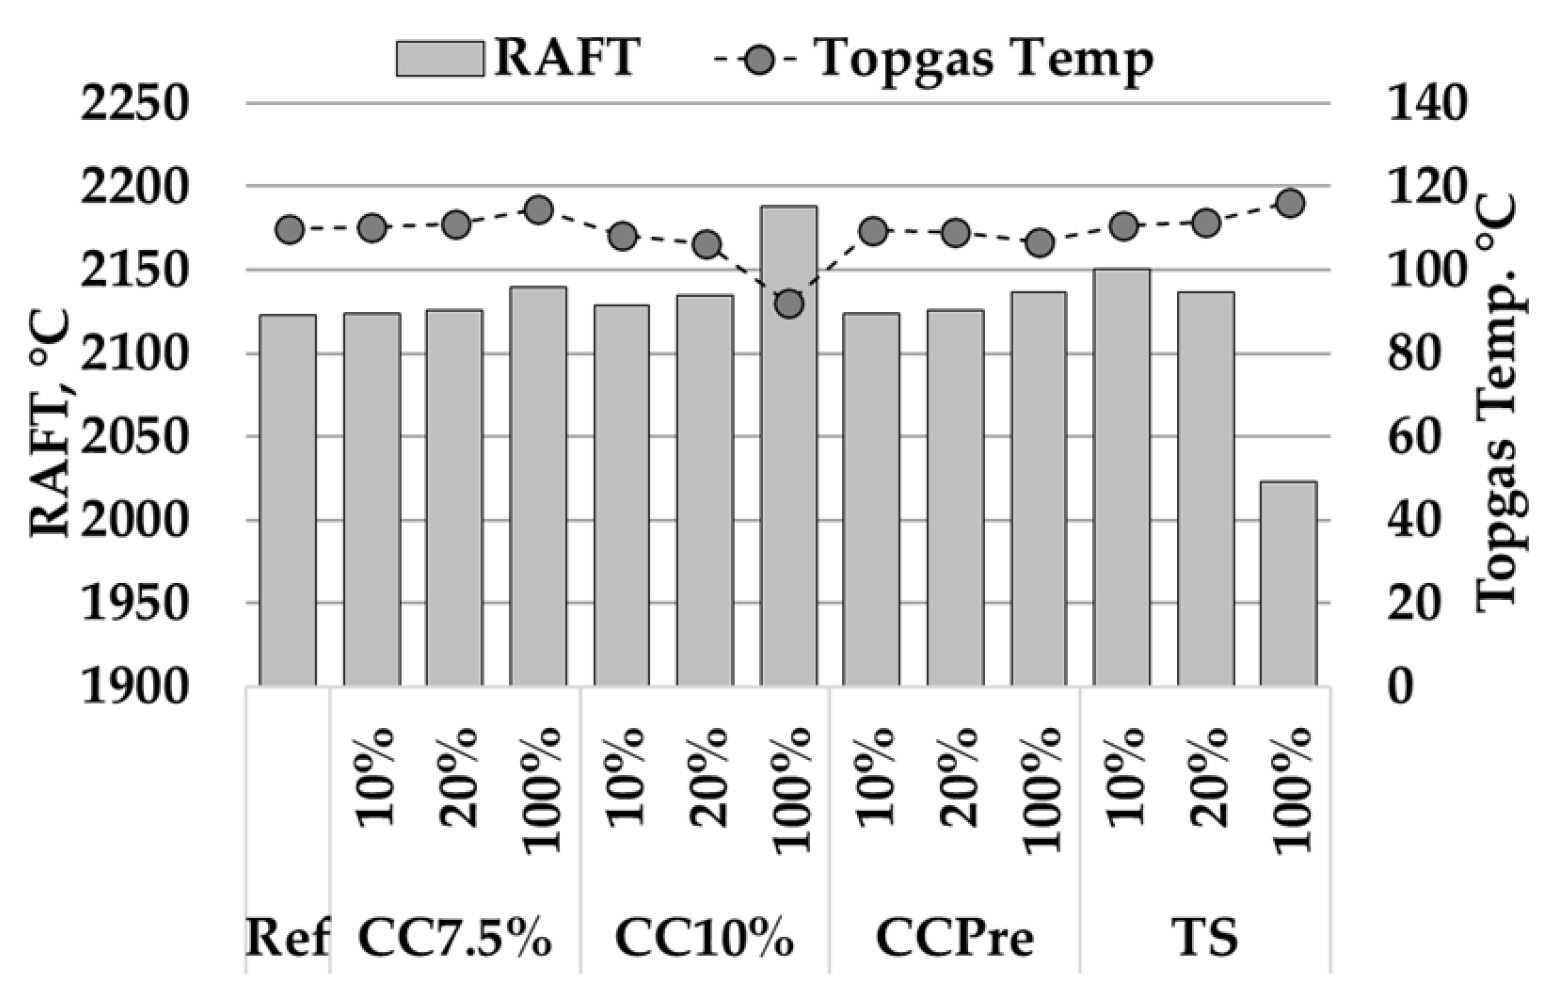
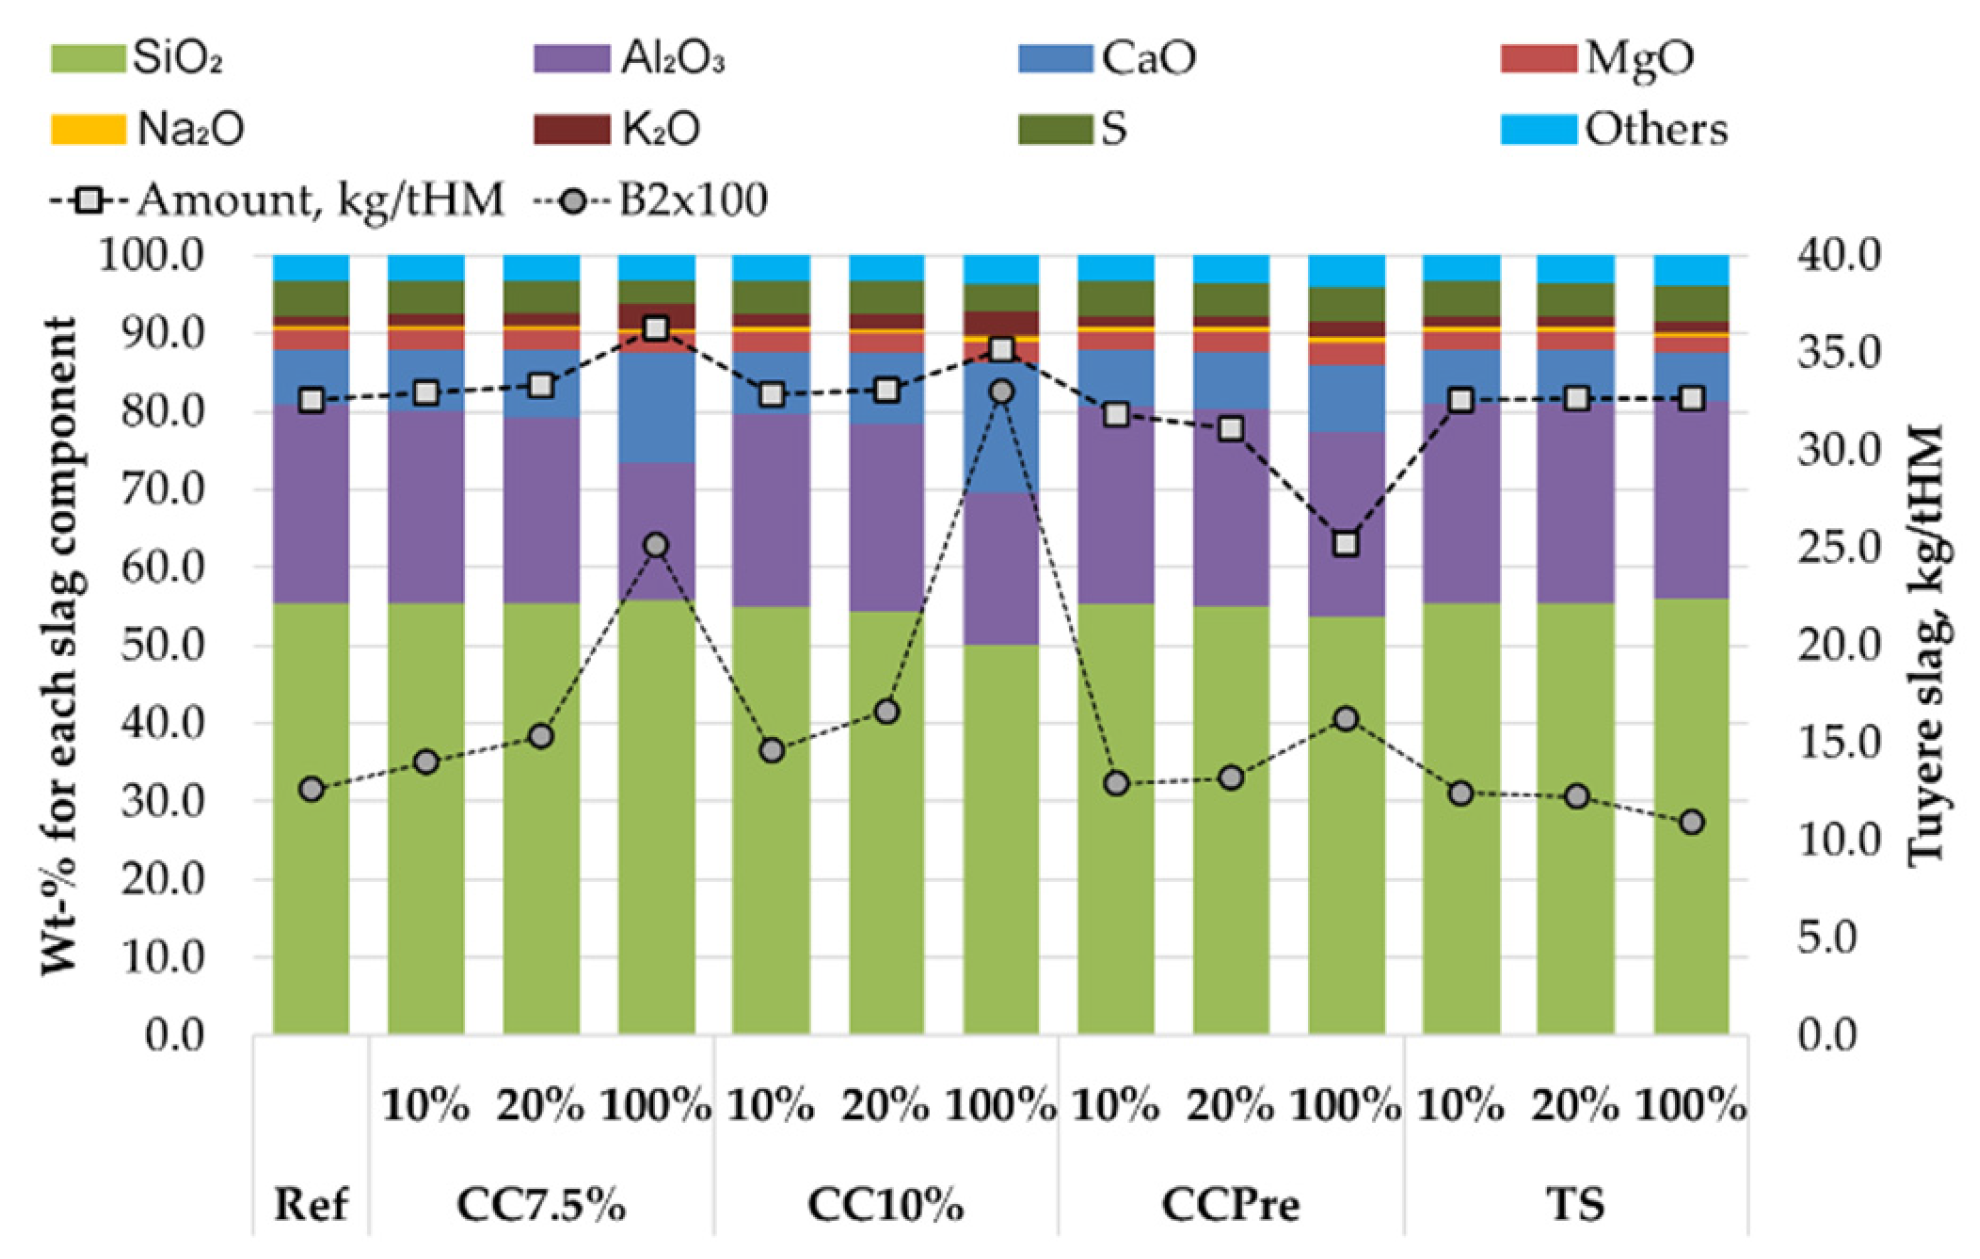
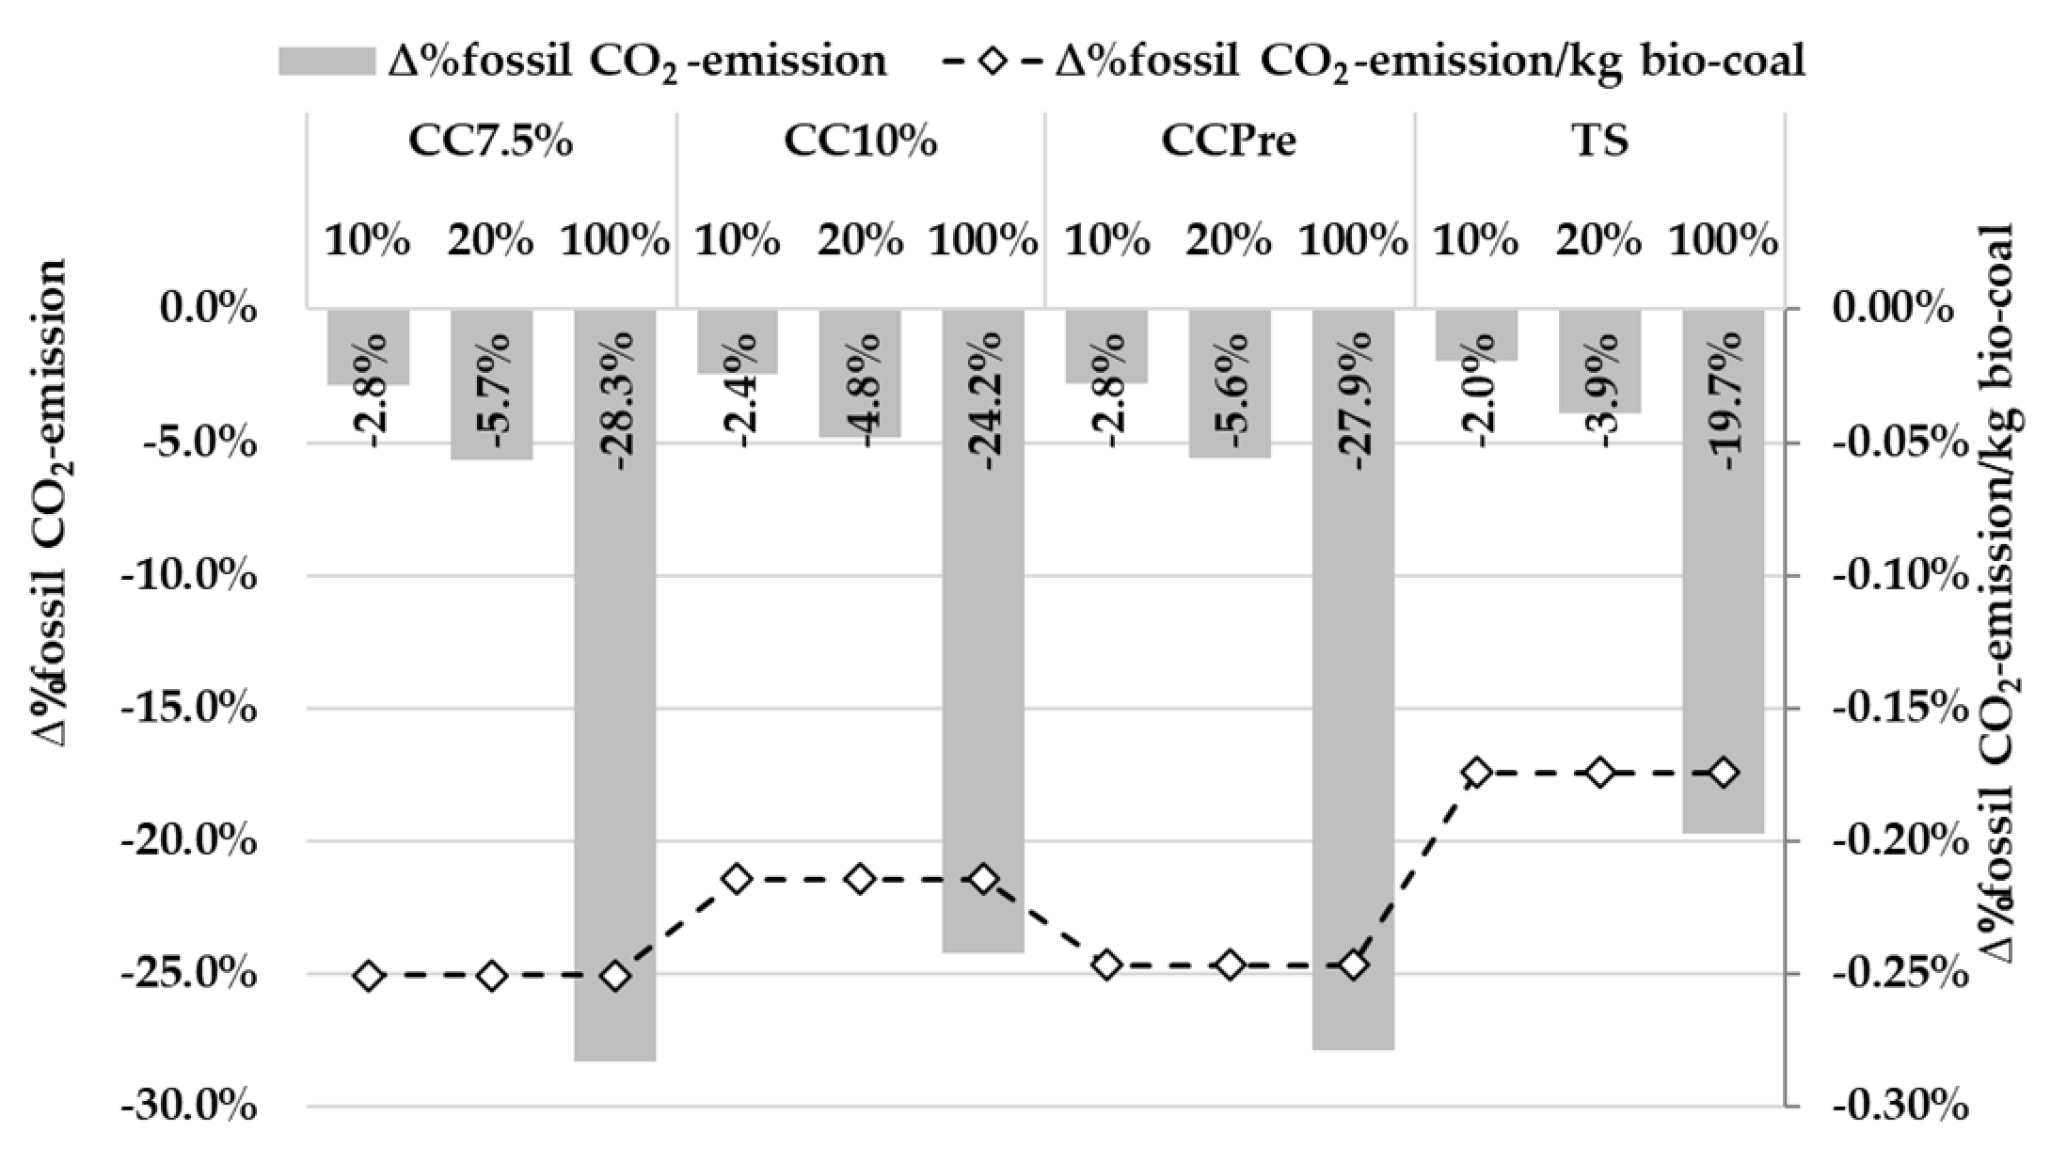
3.5. Evaluation of Bio-Coal Impact on the BF in Heat and Mass Balance Model
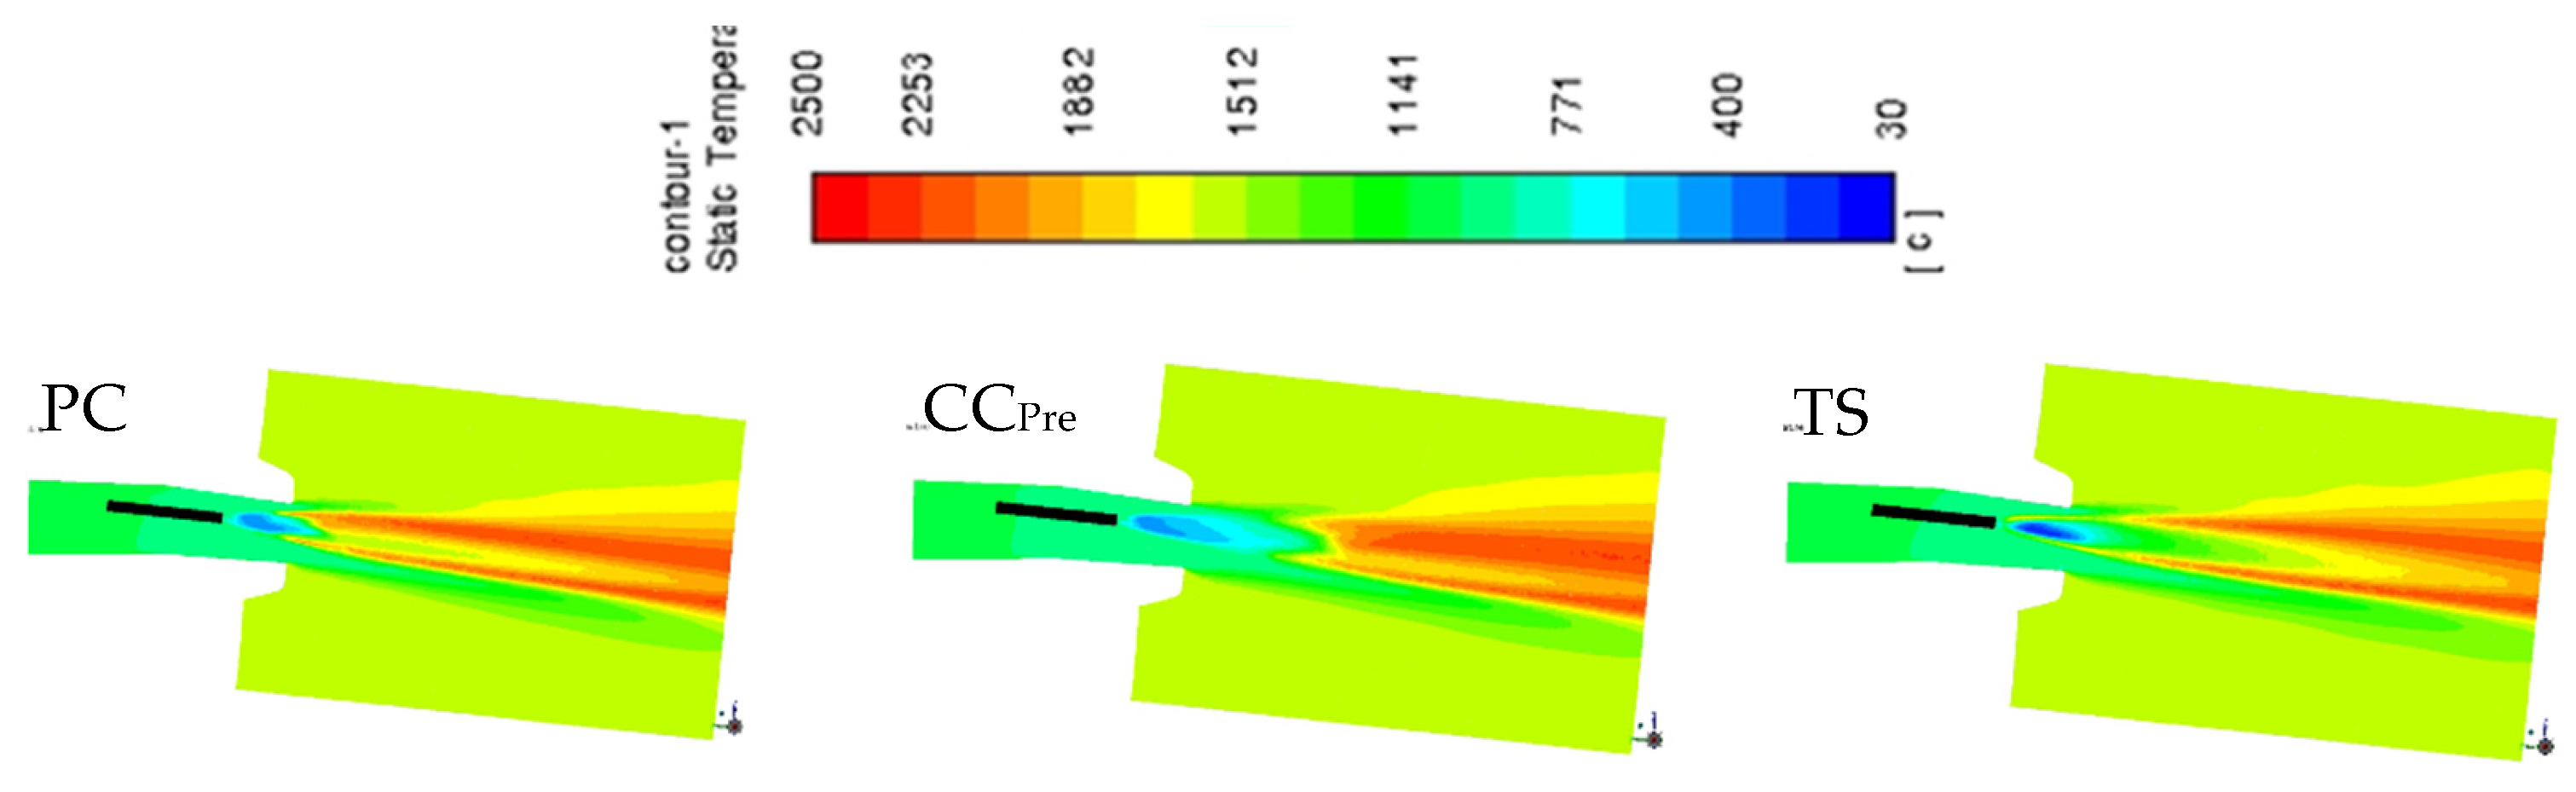
The consumed amount of coke is deduced by using experimental data and closing the heat and mass balances, accounting for the cooling losses. The cooling losses are relatively constant per time unit but vary per ton of HM if the production rate varies. For a fair comparison, the blast moisture was normalized to 13 g/Nm3 for all periods, as shown in Figure 10 and Figure 11 this normalization results in lower coke consumption and fossil CO2 emission for both the Ref and 5% CC cases. The lowering of fossil CO2 emission due to the CC injection is up to 3.5% based on original data and up to 2.5% for normalized data. Due to the roughly similar C content and HHV of CC and PC, the replacement ratio is approximately 1:1.
The effect on fossil CO2 emission when replacing 10%, 20%, or 100% of PC with the bio-coals listed in Table 1 was evaluated in MASMOD after calibration with data from the Ref. period but with a blast moisture of 13 g/Nm3. CC7.5%, with the highest Ctot and CaO contents, resulted in the largest coke savings, c.f. Figure 12. This also led to a reduced need for fossil C and limestone for slag basicity adjustment. The second largest coke savings were found for CCPre. CC10% has a lower C content and higher ash content, with a replacement ratio of less than 1:1 compared to PC. TS, with the lowest Ctot content, highest VM content, and largest energy consumption due to cracking, shows the lowest replacement efficiency. The properties of TS result in lower RAFT and higher TGT, as shown in Figure 13, whereas the opposite is seen for CC10%, c.f. Figure 13. The cracking energy for TS has a significant impact on the BF conditions at 100% replacement of PC with bio-coal.
The tuyere slag amounts, basicities, and compositions are shown in Figure 14. As TS has a lower C content and HHV compared to PC, more coke must be burned at the tuyere level to maintain the thermal state than if PC is replaced by CC. The combination of additional coke burning and the low ash content of TS results in a minor impact on the tuyere slag amount and composition. CC7.5% and CC10% have higher C contents and replacement ratios relative to PC, and also higher ash and CaO contents. These factors contribute to a higher basicity of the tuyere slag, as shown in Figure 14.
As shown in Figure 15, the full replacement of PC with CC results in a 24 to 28% reduction in fossil CO2 emissions, depending on the type of CC used, whereas replacing PC with an equivalent amount of TS lowers fossil CO2 emissions by 12%. For each kilogram of injected CC, the fossil CO2 emissions are lowered with 0.21–0.25%, and for TS, the corresponding reduction is 0.11%.

3.6. CFD Modelling

The combustion results of all cases are presented and compared in Table 9. In the BF trials, the replacement of PC with 20% CC7.5% or CC10% corresponds to a slightly higher reaction heat compared to using PC only. The reaction efficiency was higher with the high-VM-containing TS due to earlier ignition, the gas composition indicates the ignition point. For injection blends consisting of PC and any of the types of bio-coal, the flame profiles are quite similar, as illustrated in Figure 16, with the primary difference being the ignition position. Due to the kinetic reaction parameters deduced from TGA, pure CCPre (C10) shows a profile similar to that of 100% PC.
For CFD modelling cases under conditions corresponding to the trial conditions, the results were validated using raceway monitoring data, c.f. Figure 17 and Figure 18. The temperature trends along the diagonal line indicated in Figure 17a and the horizontal line derived from thermal imaging camera measurements in Figure 17b (Trial 7.5%_1, Trial 7.5%_2 and Trial 7.5%_3) follow a similar trend (see Figure 18).

4. Discussion

The impacts on BF conditions, reducing agent consumption, and CO2 emissions by replacing PC with bio-coals were explored in laboratory studies, in CFD and heat and mass balance modelling (MASMOD), and in industrial trials. Industrial trials involved co-grinding and co-injecting CC mixed with coal at ratios of up to 10%.
Mixing CC with PC before grinding and co-injection has the benefit of a controlled PSD and moisture content. The results from pre-trial CFD modelling (cases 1–6) show negative effects on combustion rate, ignition point, and temperature distribution when the injected bio-coal has a high moisture content and contains large bio-coal particles. However, large differences in the grinding properties of CC and PC made it necessary to carefully increase the added amount of CC and to limit it to a maximum of 10% to minimize the risk of downtime in the PCI plant. No negative effects on grinding, conveying, or injection could be observed with up to a 10% addition of CC to PC. The similarity in C and ash content in CC and PC made it difficult to monitor variations in the blend composition. However, the risk of varying heat levels is small when CC with a quite similar C content and HHV to the PC is used; this makes it advantageous from a process point of view to use CC in comparison with TS for injection. There was no notable change in the amount or chemical composition of generated dust, and C originating from CC could not be detected in the off-gas dust. This indicates that the recycling of dust via injection and in briquettes will not be affected.
The evaluation of the BF trial results shows that at a total injection rate of 120 kg/tHM with 7.5% of CC7.5% corresponds to 9 kg CC/tHM and can reduce the fossil CO2 emissions by approximately 3%. Theoretical evaluation of the use of 20% addition indicates a 6% reduction in fossil CO2 emissions. The evaluated experimental results align well with corresponding modeling results, indicating that it is possible to assess the suitability of a bio-coal for injection into the BF if several characterization methods are combined with theoretical modelling. The established analytical methods for carbonaceous substances, e.g., ultimate analysis (N, H, O, C), ash content and ash composition, VM content, and heating values, provide crucial initial information. Using these properties, the impact on process, raw material consumption, and CO2 emissions, as well as combustion behavior and raceway conditions, can be evaluated via mass and heat balance and CFD modelling, respectively.
The TGA of different types of bio-coals provides data for deducing reaction kinetic parameters, which are used to assess the bio-coal type and evaluate the combustion behavior and raceway conditions in the CFD model. A high content of VM leads to early devolatilization and ignition, which results in high combustion efficiency. However, replacing a large part of PC with high volatile bio-coal negatively impacts the replacement of PC and coke (see Figure 11), and therefore is less effective in lowering the fossil CO2 emissions, as shown in Figure 15. Using low-volatility pyrolyzed bio-coal like CC provides a higher degree of replacement. Evaluations using the heat and mass balance in MASMOD show that a pyrolyzed bio-coal has the potential to replace substantial amounts of PC in the BF, and the degree of replacing C in coke/coal with C in bio-coal may even exceed 1:1, c.f. Figure 11. The CFD modelling results were in line with raceway monitoring data from the trial campaign, showing that the model is reliable for the prediction of effects in the combustion zone. Replacing PC with CC does not have a significant effect on the raceway conditions or the heat input via injected reducing agents. Meanwhile, the injection of TS at high rates results in early ignition and improved combustion efficiency, but also results in lower RAFT and high TGT, and the shift in temperature can be partly counteracted by increased O2 enrichment.

5. Conclusions

Co-grinding, conveying, and injection of CC with PC at a rate of up to 10% can be safely achieved at the BF without negative impacts on PCI plant or BF operational conditions. Losses of injected CC to the off-gas dust could not be detected and the CO2 emissions were reduced by approximately 3%.
A high moisture content and the presence of some large particles delay devolatilization and ignition, which can be unfavorable for combustion; this is avoided by co-grinding. Using CC with similar HHV value to PC ensures that variations in the blend of PC and CC are not critical. Contrarily, the control of the bio-coal ratio is of high importance when using TS, which has a low replacement ratio of PC, leading to higher coke consumption. The need for limestone addition is lowered and so is the CO2 emissions if the CaO content of bio-coal is relatively high.
By combining the use of conventional analyses for chemical composition, ash, VM content, HHV, etc., with TGA for kinetic parameters to be applied in a validated CFD model, as well as heat and mass balance calculation in a BF model calibrated and validated with actual operational data, it is possible to select bio-coals feasible for use in the BF.

Author Contributions

Conceptualization. L.S.Ö.; methodology. L.S.Ö., M.L., L.-E.F., J.E., M.K. and H.A.; validation. L.S.Ö., M.L., L.-E.F., J.E., M.K. and H.A.; formal analysis. L.S.Ö., M.L., L.-E.F., J.E., M.K. and H.A.; investigation. L.S.Ö., M.L., L.-E.F., J.E., M.K. and H.A.; resources. M.K.; data curation. L.S.Ö., M.L., L.-E.F., J.E., M.K. and H.A.; writing—original draft preparation. L.S.Ö., M.L., L.-E.F. and J.E.; writing—review and editing. L.S.Ö., M.L., L.-E.F. and J.E.; visualization. L.S.Ö., M.L. and J.E.; project administration. L.S.Ö. and M.L.; funding acquisition. L.S.Ö. All authors have read and agreed to the published version of the manuscript.

Funding

This research was funded by Swedish Energy Agency, grant number P44676-1, and the APC was funded by The Centre of Advanced Mining and Metallurgy at Luleå University of Technology.

Data Availability Statement

The original contributions presented in the study are included in the article, further inquiries can be directed to the corresponding author.

Acknowledgments

The technical support from the operational personnel at SSAB during the trials is highly appreciated.

Conflicts of Interest

Author Martin Kjellberg was employed by the company SSAB Special Steels. The remaining authors declare that the research was conducted in the absence of any commercial or financial relationships that could be construed as a potential conflict of interest.

References

  1. 2021 World Steel in Figures; World Steel Association: Brussels, Belgium, 2021.
  2. Steel’s Contribution to A Low Carbon Future and Climate Resilient Societies—World Steel Position Paper. World Steel Association. 2020. Available online: https://www.worldsteel.org/en/dam/jcr:7ec64bc1-c51c-439b-84b8-94496686b8c6/Position_paper_ climate_2020_final.pdf (accessed on 28 November 2021).
  3. European Commission Energy 2030 Strategy and the 2050 Energy Roadmap. Available online: https://ec.europa.eu/energy/taxonomy/energy-strategy_en (accessed on 28 November 2021).
  4. Fact Sheet. Hydrogen (H2)-Based Ironmaking; World Steel Association: Brussels, Belgium, 2021. [Google Scholar]
  5. HYBRIT. Available online: https://www.hybritdevelopment.com/ (accessed on 20 December 2020).
  6. H2 Green Steel. Available online: https://www.h2greensteel.com/ (accessed on 28 November 2021).
  7. Available online: https://corporate.arcelormittal.com/climate-action/decarbonisation-technologies/hamburg-h2-working-towards-the-production-of-zero-carbon-emissions-steel-with-hydrogen (accessed on 1 August 2024).
  8. Available online: https://www.iea.org/reports/the-future-of-hydrogen (accessed on 28 November 2021).
  9. Available online: https://www.voestalpine.com/greentecsteel/en/breakthrough-technologies/ (accessed on 1 August 2024).
  10. Lavelaine de Maubeuge, H.; van der Laan, S.; Hita, A.; Olsen, K.; Serna, M.; Haarberg, G.M.; Frade, J. Iron Production by Electrochemical Reduction of Its Oxide for High CO2 Mitigation (IERO); EUR 28065 EN; Publications Office of the European Union: Luxembourg, 2016. [Google Scholar]
  11. Available online: https://www.siderwin-spire.eu/ (accessed on 1 August 2024).
  12. Available online: https://www.thyssenkrupp-steel.com/en/newsroom/press-releases/thyssenkrupp-steel-concludes-first-test-phase-successfully.html (accessed on 1 August 2024).
  13. Watakabe, S.; Miyagawa, K.; Matsuzaki, S.; Inada, T.; Tomita, Y.; Saito, K.; Osame, M.; Sikström, P.; Sundqvist Ökvist, L.; Wikström, J.-O. Operation Trial of Hydrogenous Gas Injection of COURSE50 Project at an Experimental Blast Furnace. ISIJ Int. 2013, 53, 2065–2071. [Google Scholar] [CrossRef]
  14. Bittencourt Marques, M.; Rodrigues Assis, A.; Benício Dias, S.M.; Harley Araújo, F.; Junqueira dos Santos, R. Co-injeção de gás natural moinha de carvão vegetal e carvão mineral no alto-forno “A” da Arcelormittal Monlevade. In Proceedings of the 41 Seminário de Redução de Minério de Ferro e Matérias-Primas Conference, Vila Vehla, Brazil, 12–16 September 2011. [Google Scholar]
  15. Mathieson, J.G.; Somerville, M.; Deev, A.; Jahanshahi, S. Chapter 19 Utilization of biomass as an alternative fuel in ironmaking. In Iron Ore: Mineralogy. Processing and Environmental Sustainability, 1st ed.; Lu, L., Ed.; Woodhead Publ. Elsevier Ltd.: Cambridge, UK; Waltham, MA, USA, 2015; pp. 581–609. [Google Scholar] [CrossRef]
  16. Mousa, E.; Lundgren, M.; Sundqvist Ökvist, L.; From, L.-E.; Robles, A.; Hällsten, S.; Sundelin, B.; Friberg, H.; El-Tawil, A. Reduced Carbon Consumption and CO2 Emission at the Blast Furnace by Use of Briquettes Containing Torrefied Sawdust. J. Sustain. Met. 2019, 5, 391–401. [Google Scholar] [CrossRef]
  17. Sundqvist Ökvist, L.; Hu, X.; From, L.-E.; Sandström, D.; Ölund, M.; Hirsch., A.; Mittelstädt, M.; Bolle, M.; Hensmann, M.; Möhring, S.; et al. Improved Coal Combustion under Variable Blast Furnace Conditions (IMPCO); Final Report EUR 29519 EN; Publications Office of the European Union: Luxembourg, 2018; ISBN 978-92-79-98296-5. [Google Scholar]
  18. Sundqvist Ökvist, L.; From, L.-E.; Ölund, M.; Orre, J.; Sundelin, B.; Ahmed, H. Lowering of CO2 Emissions at the BF by Using Bio-coal—Theoretical and Practical Possibilities and Limitations. In Proceedings of the Association for Iron and Steel AISTech 2018 Conference, Philadelphia, PA, USA, 7–10 May 2018. [Google Scholar]
  19. Swedish Energy Agency. Reduced CO2 Emission through Designed Bio-Coal in the Residue Briquette for the Blast Furnace (MICO); 48843-1; Swedish Energy Agency: Eskilstuna, Sweden, 2023. [Google Scholar]
  20. El-Tawil, A. Influence of the Properties of Bio-Coal as a Substitute for Fossil Coal in Carbon Composite Agglomerates and in Coke. Ph.D. Thesis, Luleå University of Technology, Luleå, Sweden, 2022. Available online: https://urn.kb.se/resolve?urn=urn:nbn:se:ltu:diva-88817 (accessed on 1 August 2024).
  21. Available online: https://cinea.ec.europa.eu/featured-projects/fresme_en (accessed on 28 November 2021).
  22. Available online: https://www.thyssenkrupp.com/en/newsroom/content-page-162.html (accessed on 1 August 2024).
  23. Available online: http://www.steelanol.eu/en (accessed on 28 November 2021).
  24. Available online: https://www.initiate-project.eu/initiate/ (accessed on 28 November 2021).
  25. Noldin, J.H. Energy efficiency and CO2 reduction in the Brazil steel industry. In Proceedings of the METEC InsteelCon 2011, 1st International Conference on Energy Efficiency and CO2 Reduction in the Steel Industry, Dusseldorf, Germany, 28–30 June 2011. [Google Scholar]
  26. Nascimento, R.; Almeida, A.; Olivera, E.; De Jesus, A.; De Moraes, A. 18 months of charcoal fines injection into Gusa Nordeste’s (1) blast furnaces. In Proceedings of the 3rd International Meeting on Ironmaking, ABM, Sao Paolo, Brazil, 1–4 October 2018. [Google Scholar]
  27. Chateigner, D.; Downs, R.T.; Yokochi, A.F.T.; Quiro, M. Crystallography open database: An open-access collection of crystal structures cif applications. J. Appl. Crystallogr. 2009, 42, 726–729. [Google Scholar]
  28. Hooey, P.L.; Bodén, A.; Wang, C.; Grip, C.-E.; Jansson, B. Design and Application of a Spreadsheet-based Model of the Blast Furnace Factory. ISIJ Int. 2010, 50, 924–930. [Google Scholar] [CrossRef]
  29. Badzioch, S.; Hawksley, P.G.W. Kinetics of thermal Decomposition of Pulverized Coal Particles. Ind. Eng. Chem. Process. Des. Develop. 1970, 9, 521–530. [Google Scholar] [CrossRef]
  30. Magnussen, B.F.; Hjertager, B.H. On mathematical models of turbulent combustion with special emphasis on soot formation and combustion. In Proceedings of the 16th Symposium International on Combustion, Cambridge, MA, USA, 15–20 August 1976. [Google Scholar]
Figure 1. Iso-kinetic dust sampling probe with a cyclone for collection of coarse dust and a filter holder for fine dust.
Metals 14 00969 g001
Figure 2. The iso-kinetic dust sampling probe installed above the dust cyclone at the BF.
Metals 14 00969 g002
Figure 3. Schematic representation of the BF as described by MASMOD.
Metals 14 00969 g003
Figure 4. Heating program for devolatilization and gasification or oxidation of coal/bio-coals.
Metals 14 00969 g004
Figure 5. Deduction of Arrhenius kinetic parameters as described in Equation (2), using an example for the gasification of TS. Points marked in red are used in the regression.
Metals 14 00969 g005
Figure 6. The amount of coarse and fine iso-kinetically collected total dust (g/Nm3 dry gas and in kg/tHM) in the off-gas and content of solids (wt.%) in the sludge collected in each period.
Metals 14 00969 g006
Figure 7. XRD diffractogram of iso-kinetically collected dust samples from Ref., 7.5% CC, and 10% CC injection periods.
Metals 14 00969 g007
Figure 8. Thermal imaging camera images, with the average temperature for the horizontal line, collected over ~1.5 h during Ref. period with 100% PC.
Metals 14 00969 g008
Figure 9. Thermal imaging camera images, with the average temperature for the horizontal line, collected over ~1.5 h with 7.5% addition of CC7.5% to PC.
Metals 14 00969 g009
Figure 10. Reductant (coke, PC, CC, and injected BF flue dust) consumption.
Metals 14 00969 g010
Figure 11. Effect on CO2 emissions of injecting 5%, 7.5%, and 10% CC with PC.
Metals 14 00969 g011
Figure 12. Reductant amounts estimated based on trial results and the replacement of PC with bio-coals listed in Table 1.
Metals 14 00969 g012
Figure 13. Effect of the bio-coal injection ratio on RAFT and TGT.
Metals 14 00969 g013
Figure 14. Main components in tuyere slag formed under varied injection conditions.
Metals 14 00969 g014
Figure 15. Impact on fossil CO2 emissions by bio-coal injection.
Metals 14 00969 g015
Figure 16. View and temperature distribution from the side of the combustion zone for cases C1, C5, and C6 (100% PC, 100% CCPre and 100% TS). Temperature scale in °C.
Metals 14 00969 g016
Figure 17. The simulation plane 350 mm downstream of the lance tip showing diagonal and horizontal lines for temperature extraction (a), the thermal image from the tuyere in Oxelösund BF No. 4 (b) with projected lines for temperature extraction, and the simulation domain (c) from which the plane is extracted.
Metals 14 00969 g017
Figure 18. Temperature profiles for the normalized horizontal and diagonal lines shown in Figure 16.
Metals 14 00969 g018
Table 1. Analyzed chemical compositions (wt.%), contents of VM (volatile matter, wt.%), and ash (wt.%), and HHV of carbonaceous materials for injection together with moisture content (H2O, wt.% as received) and calculated Cfix (Cfix = 100% − Ash − VM, wt.%).
Pre-Trial Evaluated MaterialBF Trial Materials
PC 1TSCCPrePC 2CC7.5%CC10%
CaO0.650.160.530.583.093.70
MgO0.240.0230.140.240.350.40
SiO23.840.030.504.016.553.23
Al2O31.920.010.121.990.520.47
K2O0.140.070.220.150.750.73
S0.280.010.020.260.040.05
P0.0220.0060.0340.0180.080.11
Fe0.610.010.080.540.360.36
C81.757.787.280.688.775.4
H4.15.83.24.12.72.5
O4.836.76.64.63.111.9
N2.00.10.62.20.150.23
VM18.270.813.918.517.818.3
CFix70.624.582.470.669.271.5
Ash 10.60.42.48.212.610.1
H2O1.2 11.2 11.2 10.51 20.51 20.51 2
HHV
db 3
31.321.832.332.331.629.9
1 H2O = 1.2% assumed in CFD modelling; 2 H2O = 0.51% measured during trials; 3 db = dry basis.
Table 2. Indicative process parameters. tHM = ton hot metal.
ParameterValueUnitParameterValueUnit
Production rate3100tHM/24 hBF dust inj.0–25kg/tHM
Blast flow117.65kNm3/hBlast moisture10g/Nm3
O2 to blast2.64kNm3/hBlast temp.1040°C
O2 to lance2.51kNm3/hCoke rate~355kg/tHM
PC and CC inj.115kg/tHMTop-gas temp.125°C
O2 enrichment (blast + oxy-coal)4.3%
Table 3. Chemical reactions considered in the CFD model calculations; specific amounts and compositions of the VM from carbonaceous material are considered.
Devolatilization Raw   coal     Char   ( C ( s ) ) + Residue   ( Ash )     VM (R1)
Homogenous
reactions
VM + a · O 2   b · C + c · H 2 O + d · N 2 + d · S O 2 (R2)
CO + 0.5   O 2   C O 2 (R3)
H 2 + 0.5   O 2 H 2 O (R4)
CO +   H 2 O C O 2   +   H 2 (R5)
C O 2 + H 2   CO +   H 2 O (R6)
Heterogeneous
reactions
C ( s ) + O 2   C O 2 (R7)
C ( s ) + C O 2     2   CO (R8)
C ( s ) +   H 2 O     CO +   H 2 (R9)
Table 4. Kinetic parameters for heterogeneous reactions deduced from TGA test results.
PC1TSCCPrePC2CC7.5%CC10%
DevolatilizationStart of reaction [°C]379220499340341341
Exp. factor [1/s]1.11 × 1046.22 × 1062.96 × 1041.80 × 1033.09 × 10−22.22 × 10⁻²
Norm. Exp. factor [1/s]3.49 × 1098.22 × 10146.86 × 1091.96 × 1081.558.24 × 10−1
Activation energy [kJ/mol]102111126893028
Combustion Exp. factor [s/m]2.03 × 10−38.55 × 10−21.44 × 10−25.55 × 10−33.61 × 10−33.98 × 10−3
Norm. Exp. factor [s/m]2.42 × 1025.16 × 1052.89 × 1032.18 × 1034.39 × 1034.94 × 103
Activation energy [kJ/mol]1031141141099494
Gasification Exp. factor [s/m]1.54 × 10−34.77 × 10−35.66 × 10−21.01 × 10−33.66 × 10−33.82 × 10−3
Norm. Exp. factor [s/m]1.16 104.35 × 1022.80 × 1037.623.78 × 101.92 × 102
Activation energy [kJ/mol]184176201170159157
Table 5. Reaction parameters for the applied reaction models.
Homogenous ReactionsHeterogeneous Reactions
A(R2)2.12 × 10¹¹ PC, TS, CCPre, CC7.5%, CC10%Coke
E(R2)2.03 × 10⁸Ac(R7)See Table 4234
A(R3)2.24 × 10¹²Ec(R7)9.00 × 10⁷
E(R3)1.70 × 10¹⁸Ac(R8)11.0
A(R4)–(R6)1.00 × 10¹⁵Ec(R8)2.40 × 10⁸
E(R4)–(R6)1.00 × 10¹⁸Ac(R9)1.50-
AEDM4.00Ec(R9)1.50 × 10⁸-
BEDM0.50C15.00 × 10−117.50 × 10⁻⁸
Nomenclature: A(R2)–(R6)—exponential factors for devolatilization and homogenous reactions [1/s]; AEDM; BEDM—empirical constants for the “Eddy-dissipation model” [30]; A(R7)–(R9)—exponential factors for heterogeneous reactions [s/m]; E—activation energy for devolatilization; homogenous and heterogeneous reactions [kJ/mol]; C—diffusion constant for heterogeneous reactions [s/m.K0.75].
Table 6. Data for CFD modelling cases.
Pre-Trial Evaluation by CFD ModellingTrial Evaluation by CFD Modelling
CaseInjection MixPC
wt.%
Bio
wt.%
Energy
(kJ/s)
Energy Bio, %CaseInjection MixPC
wt.%
Bio
wt.%
Energy
(kJ/s)
Energy Bio, %
1PC110005734---7PC210005404---
2PC1 and CCPre95557405.168PC2 and CC7.5% 92.57.553957.35
3PC1 and CCPre8020575720.29PC2 and CC7.5%8020538119.7
4PC1 and TS8020542315.410PC2 and CC10%901053649.33
5CCPre0100585110011PC2 and CC10%8020536418.65
6TS01004178100
Table 7. Average process data during selected periods of reference and trial periods.
Ref.5% CC 7.5% CC 10% CC Unit
Production rate3076308231183025Ton/24 h
Blast flow 117.7117.7117.7115.4kNm3/h
Blast moisture20.918.313.212.8g/Nm3
Blast temperature1047103910391040°C
O2 to blast2.562.452.442.36kNm3/h
O2 to lance2.512.512.522.50kNm3/h
Total O2 enrichm.4.44.34.34.3%
Total injection rate *113.0113.4119.6114.7kg/tHM
BF dust injection15.916.415.315.8kg/tHM
Coke rate353.8352.9348.6351.4kg/tHM
TGT117.1110.6109.9111.3°C
EtaCO55.455.655.355.0%
RAFT1938193719661961°C
HM temperature1477146114711474°C
HM Si0.680.620.600.63%
Slag amount #150151152152kg/tHM
Basicity B20.900.880.900.91-
* Total injection = PC + bio-coal. # Calculated from the material balance.
Table 8. Main components and distribution of C and Fe in iso-kinetically collected dust.
Ref.5% CC to PC7.5% CC to PC10% CC to PC
CaO5.094.645.715.30Wt.%
MgO2.482.042.252.50
SiO27.716.967.206.86
Al2O34.443.253.623.62
Na2O0.340.200.220.25
K2O0.520.400.390.43
S0.360.380.410.44
Fe27.827.927.024.1
Ctot35.839.038.543.1
Zn0.280.210.190.26
Fe Fe2O310.911.513.610.1
Fe3O489.188.586.489.9
CCPC8.18.27.29.7
CCC----
CCoke31.027.528.527.4
Table 9. CFD modelling results for calculation cases 1–11 (C1–11).
CasesInjected PC and BioIncluding CokeRaceway Characteristics
Injected Carb. Mtrl.Ratio [%]Devolatilization Degree [%]Reaction Eff. VM [%]Reaction Eff. C(s) [%]Conv. C+H2 (VM, C(s)) [g/s]Reaction Eff. C+H2 [%]Conv. C<s> in Coke [g/s]Tot Conv. C+H2 [g/s]Total Reaction Eff. C+H2 [%]Comb. Start from Lance Inlet [mm]Reaction Heat Complete Comb. of Injected [MW]Max. Raceway Temp. [°C]Mean Raceway Temp. [°C]
1PC110010083.145.877.551.350.312823.42263.924051811
2PC19510083.646.579.052.150.112923.62224.023381810
CCPre510097.151.9
3PC18099.984.545.980.152.150.313023.71944.023341806
CCPre2099.992.051.1
4PC18010080.442.778.754.849.512823.82263.723061785
TS2010094.681.7
5CCPre10097.182.946.480.949.153.013423.92184.223441812
6TS10010080.484.794.082.248.214227.92303.623391811
7PC210097.483.948.081.652.851.713324.32264.223471835
8PC292.599.577.949.685.555.150.813624.82744.223241819
CC7.5%7.599.597.162.7
9PC28099.581.750.288.157.150.913925.42404.323431822
CC7.5%2099.588.563.2
10PC29099.681.851.385.356.150.613624.92034.223401832
CC10%1099.697.959.9
11PC28099.582.952.688.158.051.313925.5233 4.323711825
CC10%2099.593.261.4
Disclaimer/Publisher’s Note: The statements, opinions and data contained in all publications are solely those of the individual author(s) and contributor(s) and not of MDPI and/or the editor(s). MDPI and/or the editor(s) disclaim responsibility for any injury to people or property resulting from any ideas, methods, instructions or products referred to in the content.

