Article

Effect of Cu–Al Ratio on Microstructure and Mechanical Properties of Cu–Al Alloys Prepared by Powder Metallurgy

1
School of Mechanical Engineering, Jiangsu Ocean University, Lianyungang 222000, China
2
Zhongtian Science and Technology Marine Cable Co., Ltd., Nantong 226000, China
*
Authors to whom correspondence should be addressed.
Metals 2024, 14(9), 978; https://doi.org/10.3390/met14090978
Submission received: 19 July 2024 / Revised: 23 August 2024 / Accepted: 25 August 2024 / Published: 28 August 2024

Abstract

:
Cu–Al alloys are widely used in electronics, new energy, and other fields due to the combination of th excellent corrosion resistance and electrical conductivity of Cu and the light weight of Al. In this paper, the powder metallurgy and equal-channel angular pressing compound technology was used to fabricate a Cu–Al alloy joint, which can be used to replace armor. Devices such as an optical microscope, electron scanning microscope, and microhardness scale were used to characterize the microstructure and mechanical properties of the Cu–Al alloys. The finite element analysis software Abaqus was used to analyze stress distribution during equal-channel angular pressing. The results indicated that the microstructure and properties of Cu–Al alloys were closely related to the volume ratio of Cu–Al. The microhardness and tensile strength were significantly increased by increasing the volume ratio of Cu–Al. As the volume ratio of Cu–Al varied from 1:2 to 2:1, the ultimate tensile strength of the Cu–Al alloys increased from 79.9 MPa to 164.9 MPa at room temperature and the microhardness increased from 60 HV to 101 HV. However, the elongation of the Cu–Al alloys hardly changed; this was about 4.4%. Crack initiation occurred at the Cu–Al interface and spread along the bonding surface of the Cu–Al alloys during the tensile process.

1. Introduction

The requirements of submarine cables have increased significantly with the development of offshore wind power. Due to the combination of the high electrical and thermal conductivity of Cu and the light weight of Al [1], Cu–Al bimetallic composite materials are widely used as guidewires for submarine cables.
As one type of solid–solid composite, the advantages of powder metallurgy are simple processing and low cost, and metal composites can be acquired via the mixing, extrusion, and sintering of metal particles. Thus, it is suitable for the bulk preparation of submarine cables. Ample research on Cu–Al composites prepared by powder metallurgy were undertaken.
Various factors needed to be considered, such as the reinforcing agent, pressure during compaction of the powder, sintering temperature, holding time at the sintering temperature, particle size, volume fraction of the reinforcing agent, etc. [2].
In a study of Al–Cu–Mg alloys reinforced with WC particles, G. Rodríguez-Cabriales et al. [3] compared multiple process parameters, confirming that the reinforcing material has low porosity, and was dispersed uniformly at a sintering temperature of 450 °C and a sintering time of 3 h. The interfacial bonding between the WC and Al–Cu–Mg matrices was strong, and the optimal reinforcing properties and microhardness were attained.
Dasom Kim et al. [4] systematically investigated the relationship between the Cu–Al interfacial interdiffusion mechanism and the processing temperature, indicating that the thickness of the diffusion layer rose sharply above 400 °C. In the improvement of the conventional powder metallurgy process, other process methods were created by the researchers [5,6,7,8], which included combining powder metallurgy with the extrusion process [9,10] and heat treatment process [11] using microwave sintering technology [12], and preparing alloys with a special structure of large grains encapsulating small grains according to the idea of homogeneous isomerism [13].
These methods could significantly improve the bonding and mechanical properties of Cu–Al alloys. Some metal particles such as Ag [11,14,15] and Ti [16] and compound particles, such as carbide and boride [17,18,19,20], were used to improve the properties of Cu–Al alloys by powder metallurgy. Ag especially could improve the thermal conductivity of these alloys.
Moreover, the content of Cu and Al also has an influence on the microstructure and properties of Cu–Al composites prepared by powder metallurgy. The effect of different mass or volume fractions of Cu on the properties of Cu–Al alloys was also investigated [21,22].
Desalegn Wogaso Wolla et al. [21] investigated the effect of Cu content on the forming properties of Cu–Al alloys by the indexes of material densification and machining friction coefficient with 2, 4, and 6% wt. Cu.
Comparing 5% and 15% wt. Cu Cu–Al functional gradient materials (FGMs), Kotikala Rajasekhar et al. [22] found that the FGM with 10% wt. Cu had good interfacial microstructure, microbundles, and relative density. When investigating the effect of different mass or volume fractions of Al on the properties of Cu–Al alloys [23,24], Muhammad Rashad et al. [23] found the hardness and wear resistance of the Cu matrix increased with higher Al content.
For the Cu–Mg–Al alloy, Al could increase the tensile strength and hardness of the alloy. However, when the Al content exceeded 3%wt, a brittle phase was generated, and brittle fracture happened easily [24]. Therefore, it is worth investigating the effect of volume or mass fraction of Cu and Al on the mechanical properties of alloys. However, the influence of Cu–Al volume or weight ratio on the properties of Cu–Al alloys is rarely reported.
In this paper, a powder metallurgy and equal-channel angular pressing compound technology was used to fabricate a Cu–Al bimetallic composite. The effect of the Cu–Al volume ratio on the Cu–Al alloy’s microstructure and mechanical properties was further analyzed. The finite element analysis software Abaqus was used to analyze the stress distribution during equal-channel angular pressing. The results of this work have a certain reference value for the development of Cu–Al alloys prepared by powder metallurgy.

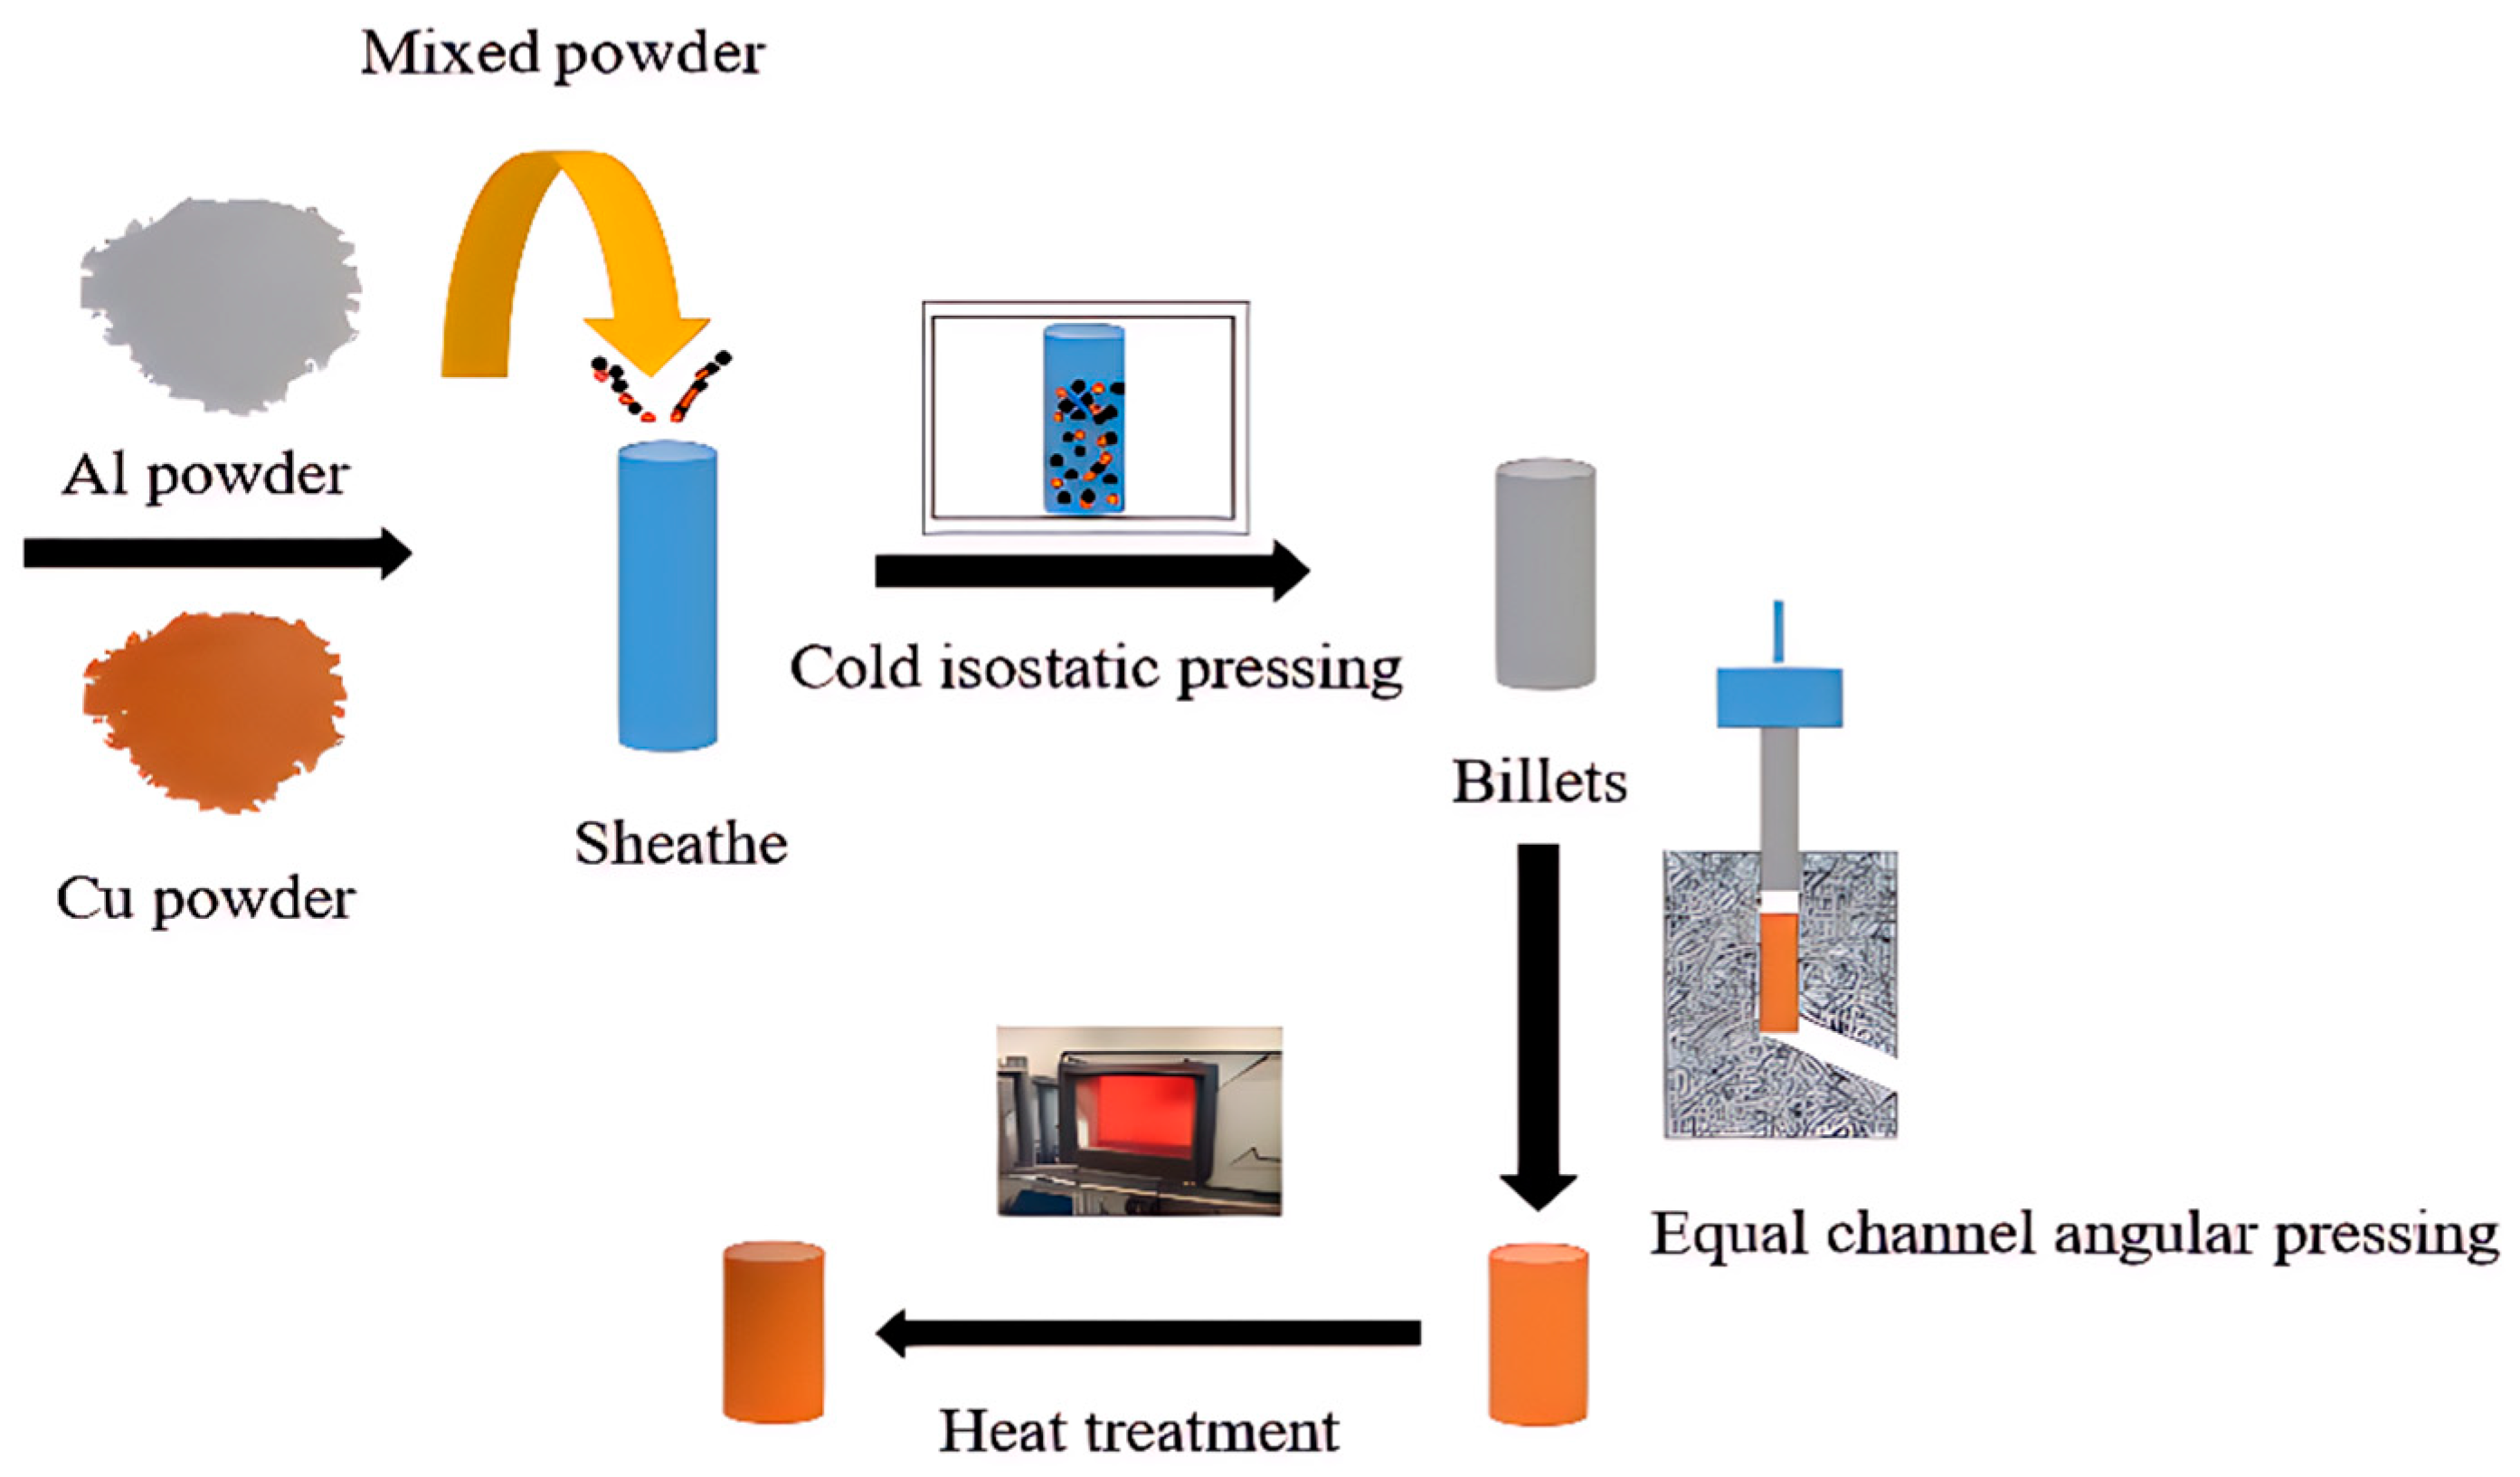
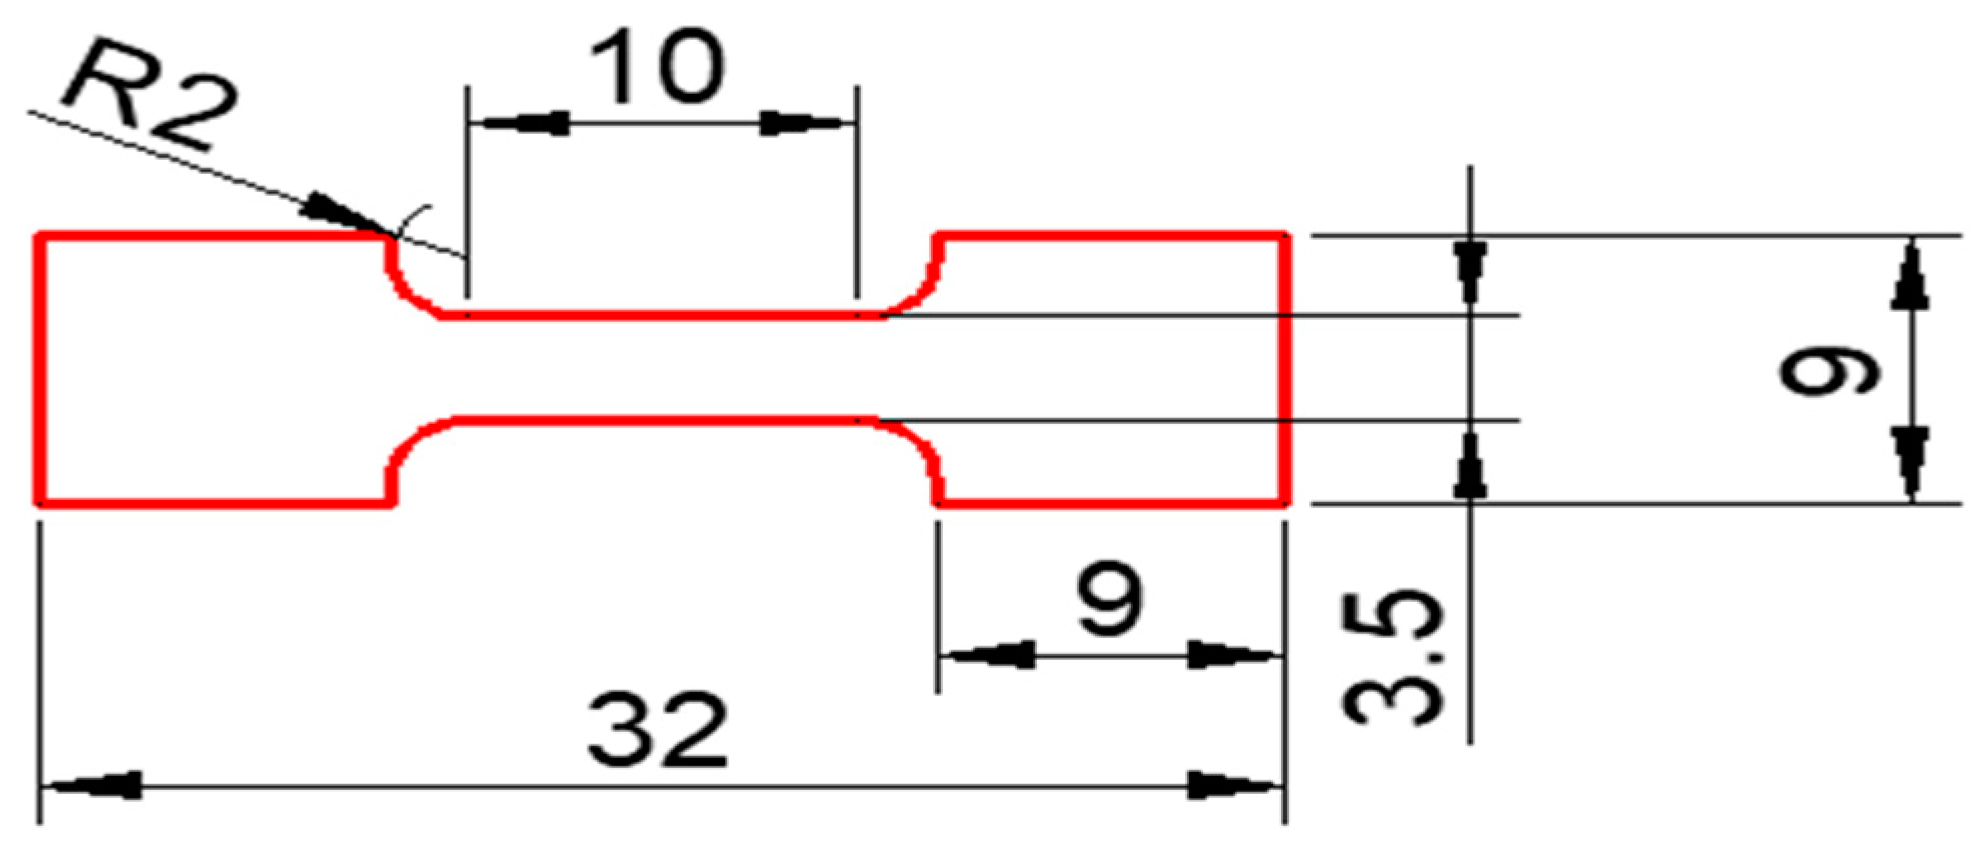
2. Experimental Design

The Cu–Al alloys were prepared using Cu powder and Al powder with a purity of 99.9%, which were produced by the Zhongzhou Alloy Material Co., Ltd. (Shanghai, China). A scanning electron microscope (SEM) was used to index the microstructure of the Cu–Al powder, and the micromorphology of the Cu powder and Al powder is shown in Figure 1. The chemical composition of the Cu powder and Al powder is displayed in Table 1.
The Cu and Al had a size of 3–5 μm. The mixed powders with volume fractions of 1:2, 1:1, and 2:1 respectively, were combined in mixing equipment (LDJ200/600–300, Sichuan Aviation Industry, Sichuan West Machinery Co., Ltd., Ya’an, China) at room temperature for 3 h.
The pressure was 275 MPa, and the pressure holding time was 300 s, while the pressure rise rate was 30 MPa/s and the pressure reduction rate was 10 MPa/s. Then, the mixed powder was added to a clean container with an inner diameter of 15 mm, a height of 140 mm, and a wall thickness of 5 mm, respectively.
After vacuum degassing, the container with different mixed powders was re-pressed in an LDJ200/600-300 cold isostatic press (LDJ200/600–300, Sichuan Aviation Industry, Sichuan West Machinery Co., Ltd., Ya’an, China). Finally, the pre-form was placed in a YJ32-315A vertical four-column hydraulic press (Jiang Dong Machinery Co., Ltd., Chongqing, China) and held at 450 °C for 30 min before being extruded in two passes through the equal-channel angular extrusion.
The extruded samples were kept in the GSL-1500X-OTF (Hefei, China) at 500 °C for 2 h, and were protected by the N2. The preparation process of the Cu–Al alloys is summarized in Figure 2.
The metallographic samples were initially polished in sequence on 400#, 1200#, 3000#, and 5000# water-abrasive sandpaper and mechanically ground. Finally, the metallographic samples were hand-polished on a velvet cloth, using a magnesium oxide solution with a particle size of 0.05 μm. The microstructure of the Cu–Al alloys was characterized by an AXIO-type optical microscope (OM). The quantitative statistics of the determining particle aggregation size was analyzed by Image Pro Plus 6.0 (IPP) software.
The dimensions of the tensile samples are displayed in Figure 3. Tensile tests were conducted on a Zwick Z050 electronic tensile testing machine (Ulm, Germany) at room temperature. At least five specimens were examined for each parallel sample. The FEI Scios 2 HiVac SEM (Hillsboro, OR, USA) was used to characterize the surface of the tensile fracture.
The microhardness of the Cu–Al alloys was characterized using an HXD-1000TM digital microhardness tester (Shanghai, China) with a load of 200 g and a loading time of 15 s, for which the 10-micron scale was used The microhardness for each studied alloy was the average taken from 10 tests with the minimum and maximum removed to maximize reliability.

3. Results and Discussion
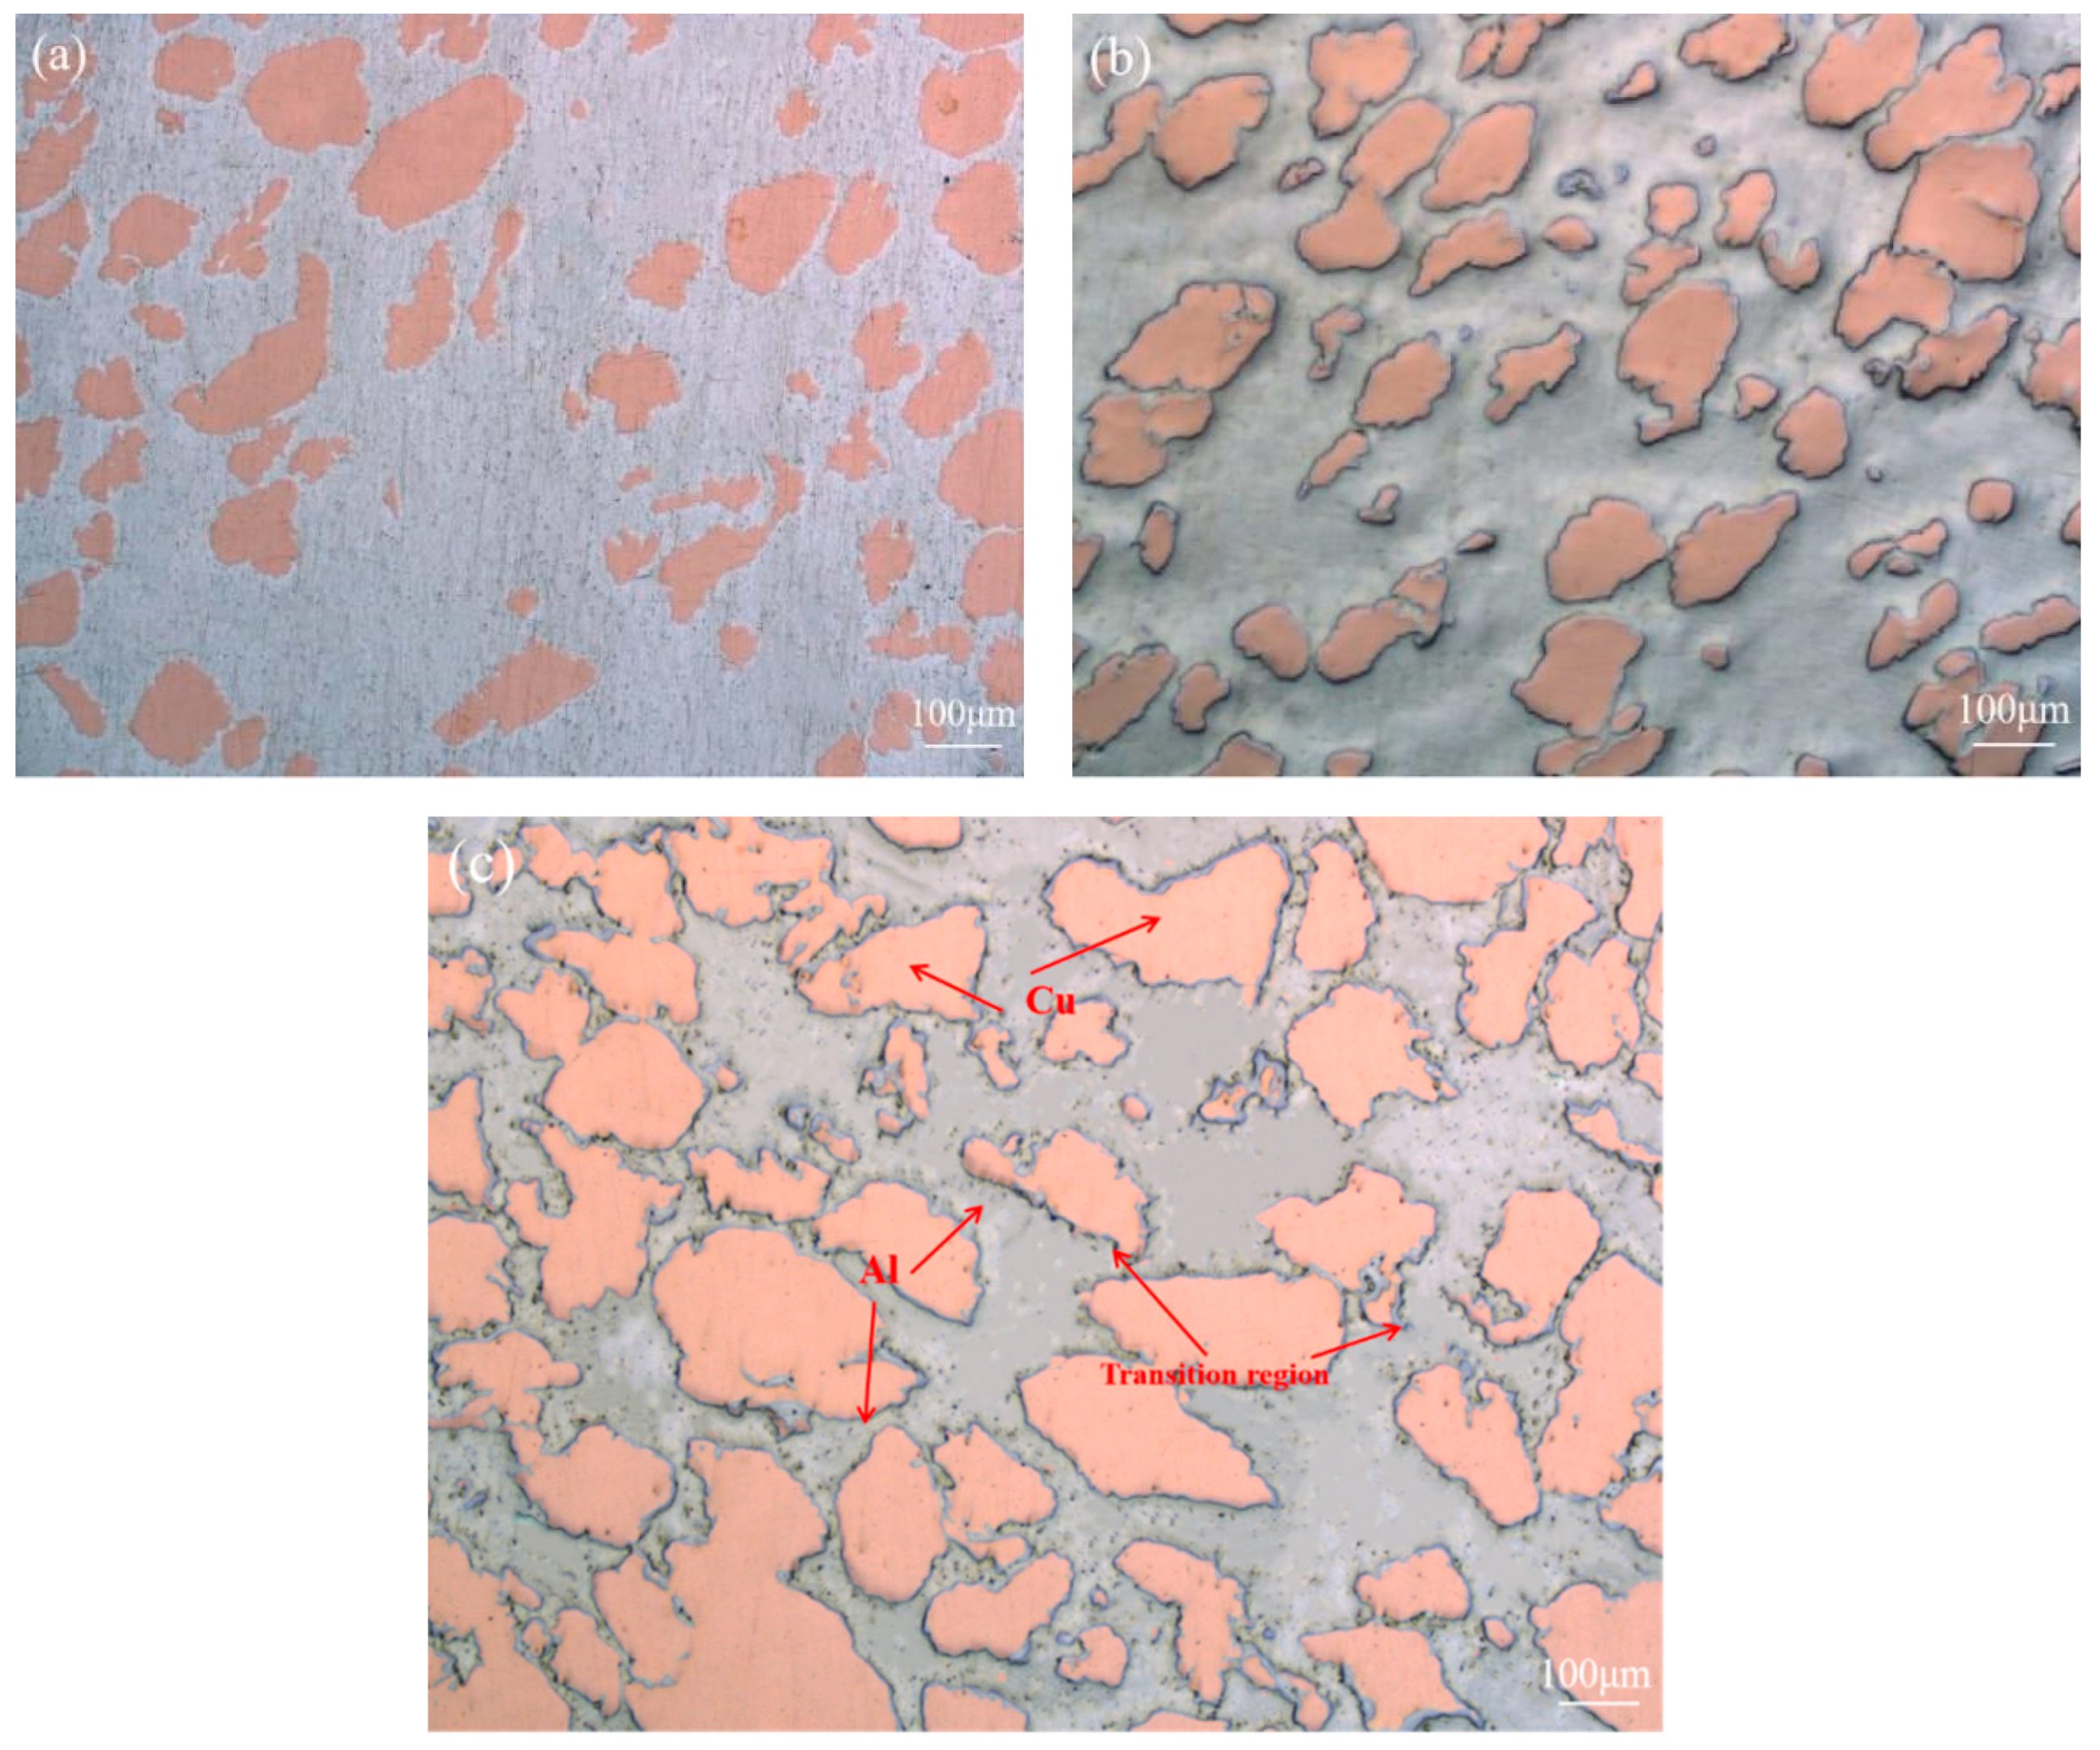
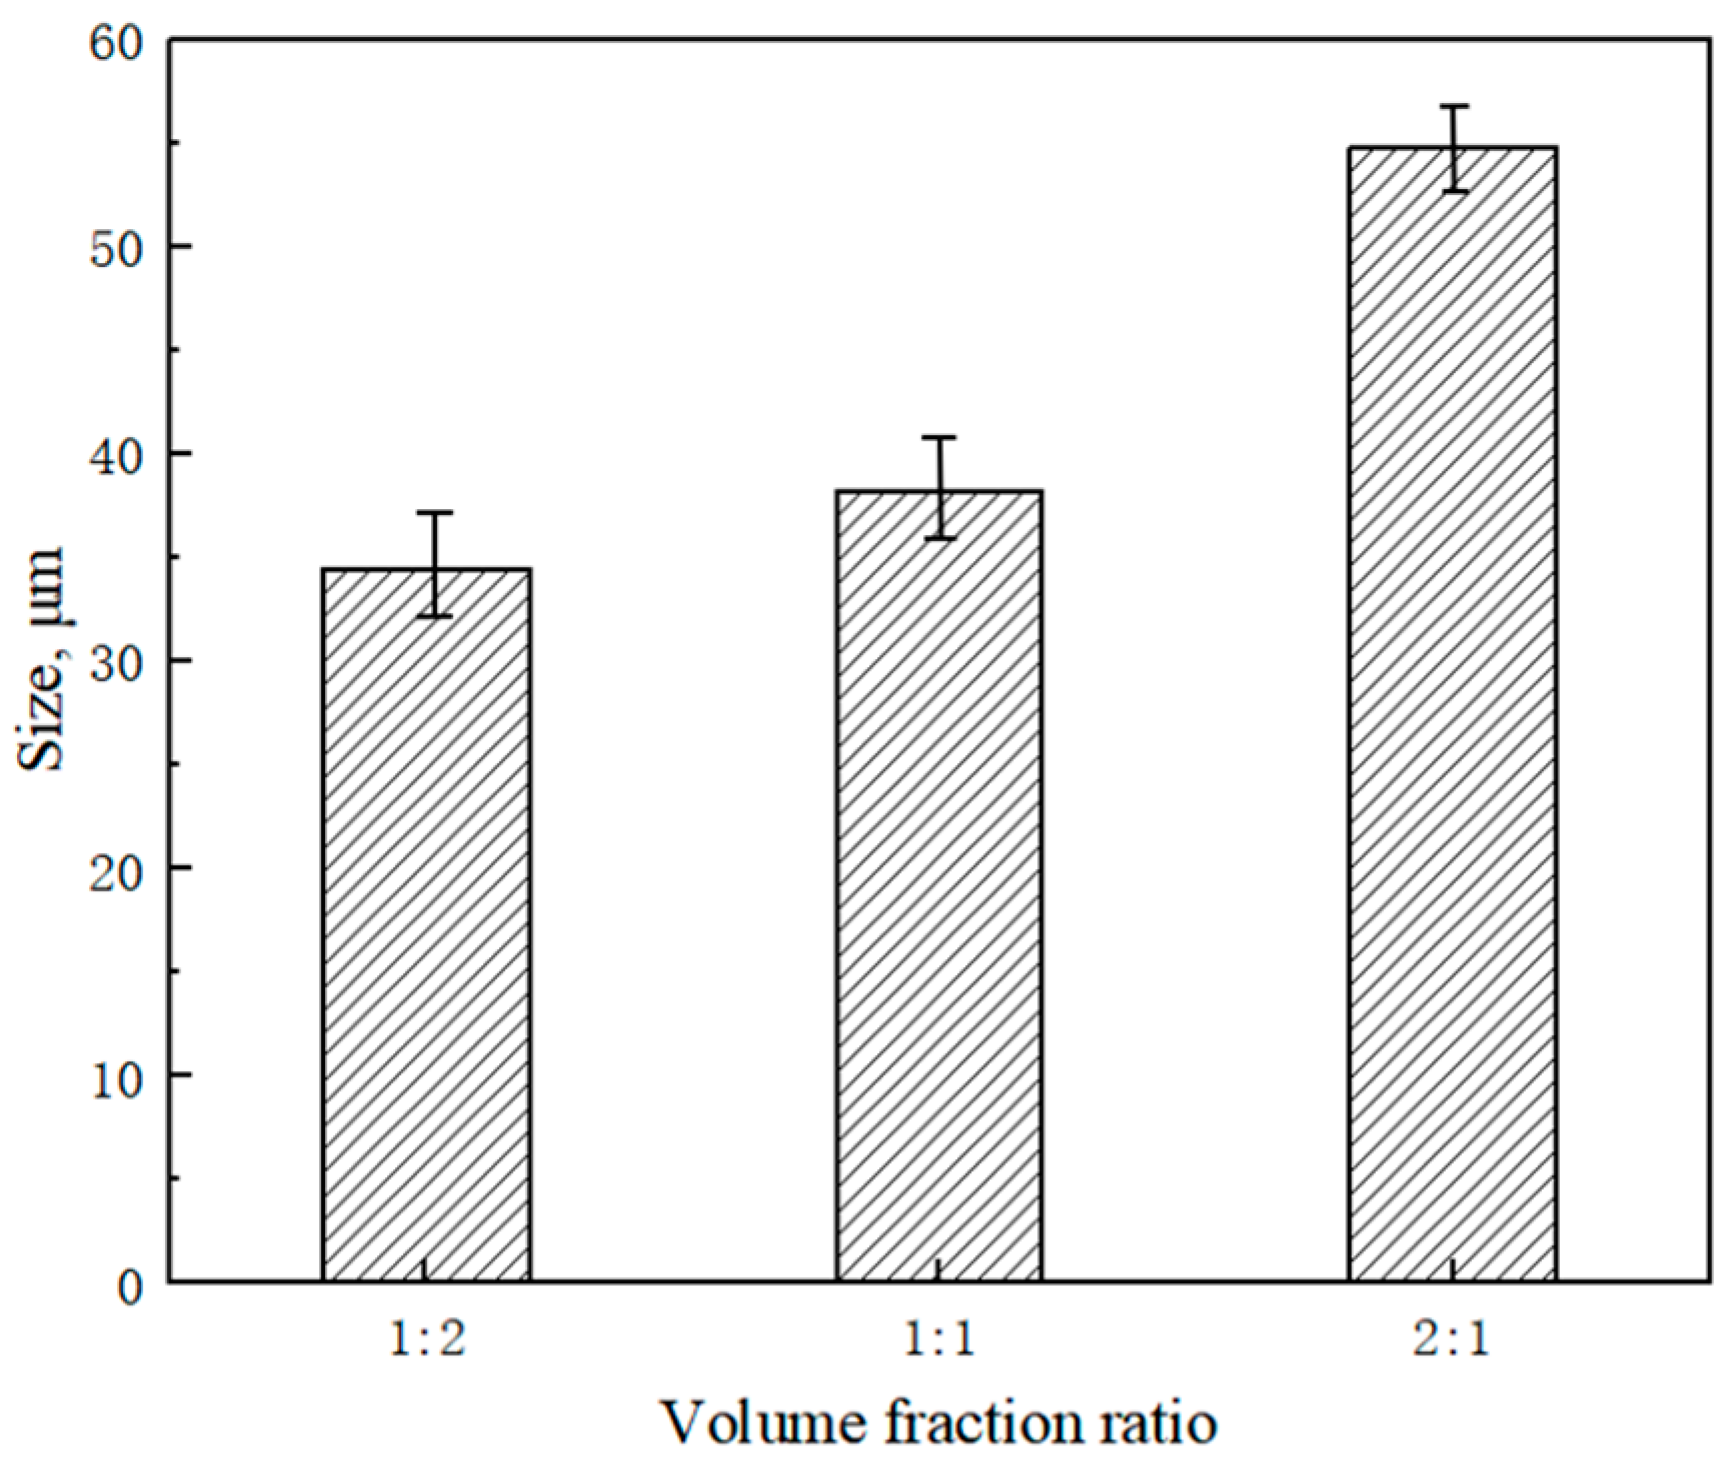
3.1. Microstructure

Figure 4 displays the microstructures of the Cu–Al alloys produced by uniformly mixed Cu and Al powders. As shown in Figure 4, the phase with the yellow color was Cu, and the other was Al. It was found that, after the equal-channel angular extrusion at an elevated temperature, the Cu powder aggregated into the Cu phase with different sizes.
With the Cu–Al volume ratios increasing from 1:2 to 2:1, both the number and size of the Cu phase significantly increased. Due to the extrusion between Cu and Al, more metal compounds were generated, and the transition region showed an increasing trend.
Cu has great fluidity during the sintering process, which can fill the gaps between particles and form a continuous copper phase. When the copper content increased, the fluidity effect became more pronounced, promoting the expansion and connection of the copper phase. The IPP 6.0 software was used to quantitatively analyze the volume fraction of the Cu powder on the microstructure of the Cu–Al alloys.
The average size of the aggregate Cu phase in Cu–Al alloys at different volume ratios is shown in Figure 5. As shown in Figure 5, the average size of the Cu phase in the Cu–Al alloys with a Cu–Al volume ratio of 1:2 was 35 μm. With the Cu–Al volume ratios increasing to 1:1, the average size increased to 38 μm. The average size of the Cu phase significantly increased when the Cu–Al volume fraction ratio increased to 2:1. In addition, the aspect ratio of the Cu phase in Cu–Al alloys at different volume ratios was also quantitatively analyzed by the IPP software.
As shown in Figure 6, the aspect ratio of the Cu phase varied from 1.2 to 1.4, with the Cu–Al volume ratio increasing from 1:2 to 2:1, which indicated that the shape of the Cu phase gradually changed from a square to a long strip.

3.2. Finite Element Simulation Verification

The finite element simulation technique was used to characterize the distribution of extrusion stress and the deformation of the Cu and Al metal particles during the process of equal-channel angular pressing. For the modeling array, the Cu and Al powders were approximated as solid balls of the same size. Then, the model of the ball and die casting mold was built with Pro ENGINEER 5.0modeling software. The die casting mold included a negative mold and an upper mold. The diagrams of the negative mold, upper mold, and the powder model are displayed in Figure 7. In order to ensure the reliability of the simulation, the diameter of the simulated powder compact was 48 mm, the initial packing height was 120 mm, and the final compact height was 80 mm. Then, the model was imported into the finite element software Abaqus 2020. All the model parameters were consistent with the experimental parameters.
The Abaqus software analyzed the problem in three stages: pre-processing, analytical calculations, and post-processing. The pre-processing stage mainly involved building the model based on a regular distribution and setting the material parameters of the model. The components were imported and assembled in the generation module.
Then, the properties of each component of the material were defined. The powder consisted of two materials, pure Cu and pure Al, and the molds were set as rigid bodies. The material parameters of Cu and Al powder are shown in Table 2. The density was set in the general module, while Poisson’s ratio and elastic modulus were set in the elastic module, and yield strength was set in the plastic module.
As depicted in Figure 8, the Cu and Al particles were arranged in three different volume ratios and according to gradient distribution. The yellow ball was Cu, and the gray ball was Al. In addition, the relevant material parameters were assigned. Then, in the assembly module, the die casting mold and the Cu and Al powder were assembled according to their position before extrusion.
After defining the material properties, it was necessary to define the boundary conditions and loads. The analysis step employed a dynamic display, with the pressing speed being alterable by setting different time durations depending on the depth of the press.
The frictions occurring between the powders, the powder and the mold, and the powder and the upper mold were classified as Coulomb friction with a friction coefficient of 0.2 [25]. The reference point was set at the center of the upper mold, and binding constraints between the reference point and the upper mold surface were added. According to the experimental design, the force was applied in the load module, and the direction was perpendicular to the surface of the upper mold.
Mesh division is a key stage in the pre-processing of finite element calculations, which is completed in the mesh module. Firstly, the mesh seed layout was carried out, and then tetrahedral elements were selected as the unit types upper mold, mold, and powder particles. Free meshing was chosen, and dynamic display analysis was set as the analysis step. The significant deformation of the Al and Cu powder during the process of equal-channel angular pressing was large easily caused mesh distortion in the finite element simulation, which resulted in operational interruption.
The seed size of the upper and negative molds was set as 4 μm. Considering both accuracy and computational speed, the powder seed size was set to 2 μm. The number of meshes for the upper and negative molds was 1909 and 1298, respectively. The number of meshes for the powder was 113,207, and the total number of meshes for the model was 116,414. Figure 9 depicts the finite element model after the meshing process.
The stress cloud diagram of the equal-channel angular pressing of the Cu and Al powders obtained by post-processing is shown in Figure 10. The semi-section view was used to clearly characterize the deformation of internal particles. As displayed in Figure 10a, the stress was concentrated between the Cu particles, and the maximum stress was 187.7 MPa with a Cu–Al volume ratio of 1:2.
After extrusion, it was shown that the deformation of Al particles was relatively obvious, and the shape of the Cu particles was almost the same as that before extrusion. When the Cu-Al volume ratio was increased to 1:1, the maximum stress was 213.5 MPa at the junction of the two powders.
In addition, the shape of the Cu began to undergo significant deformation. The larger stress was concentrated at the bottom of the Cu particles, and the maximum stress was 271.3 MPa between the Cu powder and the edge of the mold with the Cu-Al volume ratio of 2:1. The shape of Cu tends to be a long strip, which was consistent with the metallographic characterization part.
The variation in the Cu–Al volume ratio directly affects the microstructure of the Cu–Al alloys prepared by the powder’s equal-channel angular pressing. The microstructures of the Cu–Al alloys at different Cu–Al volume ratios are displayed in Figure 4. With an increasing Cu–Al volume ratio, the aggregate size of the Cu grains increased and the transition zone gradually became obvious, which was related to the stress distribution during the process of equal-channel angular pressing.

3.3. Mechanical Properties

The microhardness of the Cu–Al alloys at different volume ratios is displayed in Figure 11. As shown in Figure 11, the microhardnesses of the Cu–Al alloys with different Cu–Al volume ratios were 60 HV, 76 HV, and 101 HV, respectively. The microhardness value of the materials measured was related to the phase composition of the indenter contact part of the microhardness tester.
As shown in the Microstructure section, the proportion of Cu in the unit cross-section area increased with increasing Cu–Al ratio. In addition, the microhardness of Cu is higher than Al and forms hard and brittle intermetallic compounds. Therefore, the microhardness of the Cu–Al alloys increased with the increasing Cu–Al volume ratio.
The tensile properties of the Cu–Al alloys at different volumes is displayed in Figure 12. The ultimate tensile strength (UTS) of the Cu–Al alloys with a Cu–Al volume ratio of 1:2 was 79.9 MPa. By increasing the Cu–Al volume ratio from 1:1 to 2:1, the UTS of the Cu–Al alloys increased from 143.3 MPa to 164.9 MPa. The influence of the Cu–Al volume ratio on tensile strength is simply described as:
σ = ( f 1 f 2 ) σ A l + 1 f 1 f 2 σ C u + f 2 σ i
where σ is the external stress, σ A l is the stress loading on the Al, σ C u is the stress loading on the Cu, and σ i is the stress loading on the particle interface. And f 1 is the volume of Al and f 2 is the volume of the particle interface.
Due to the elastic modulus and tensile strength of Cu being significantly higher than that of Al, and as the volume of the particle interface increased with an increasing Cu–Al volume ratio, the UTS of the Cu–Al alloys increased with the increasing Cu–Al volume ratio, which was consistent with the experimental results.
It should be noted in Figure 12a that the elongation of the Cu–Al alloys changed little with increasing Cu–Al volume ratio. There is no doubt that the elongation of Cu and Al with a face-centered cubic structure was much greater than 5%. Additionally, we can ascertain that the Young’s module, yield strength, and strain energy rose with increasing Cu–Al volume ratio.
The micrographs of the longitudinal section of the tensile fracture surface of the Cu–Al alloys at different volume ratios are displayed in Figure 13. It was found that the crack initiation occurred at the Cu–Al interface and spread along the bonding surface due to the high hardness and brittleness of the copper–aluminum metal compounds.
In addition, the initiation and propagation of the cracks did not change with increasing Cu–Al volume ratio. Figure 14 illustrates the fracture surfaces of the Cu–Al alloys. It was found that a mass of cleavage planes was observed in Figure 14a1,a2, indicating that the dominant fracture mechanism of the Cu–Al alloys with 1:2 volume ratios was a quasi-cleavage fracture.
With the increasing particle interface, the fracture surface was in the form of grains in Figure 14b1,b2, which resulted in crack generation. When the volume ratios of the Cu–Al alloys were increased to 2:1 in Figure 14c1,c2, a great number of large tearing edges were distributed in the tensile fracture surface of the Cu–Al alloys, indicating that the dominant fracture mechanism was brittle fractures.
As reported in the literature, hard and brittle intermetallic compounds are inevitably formed at the transition region of the Cu and Al, such as Al2Cu, AlCu, and Al4Cu9. Specifically, the main IMC was Al2Cu with a Cu–Al volume ratio of 1:2, and the IMCs Al2Cu and AlCu had Cu–Al volume ratios of 1:1 and 2:1. Therefore, the elongation of the Cu–Al alloys was not affected by their Cu–Al volume ratios.

4. Conclusions

In the present work, the effects of the Cu–Al ratio on the microstructure and mechanical properties of Cu–Al alloys prepared by powder metallurgy and equal-channel angular pressing were investigated. The main conclusions are as follows:
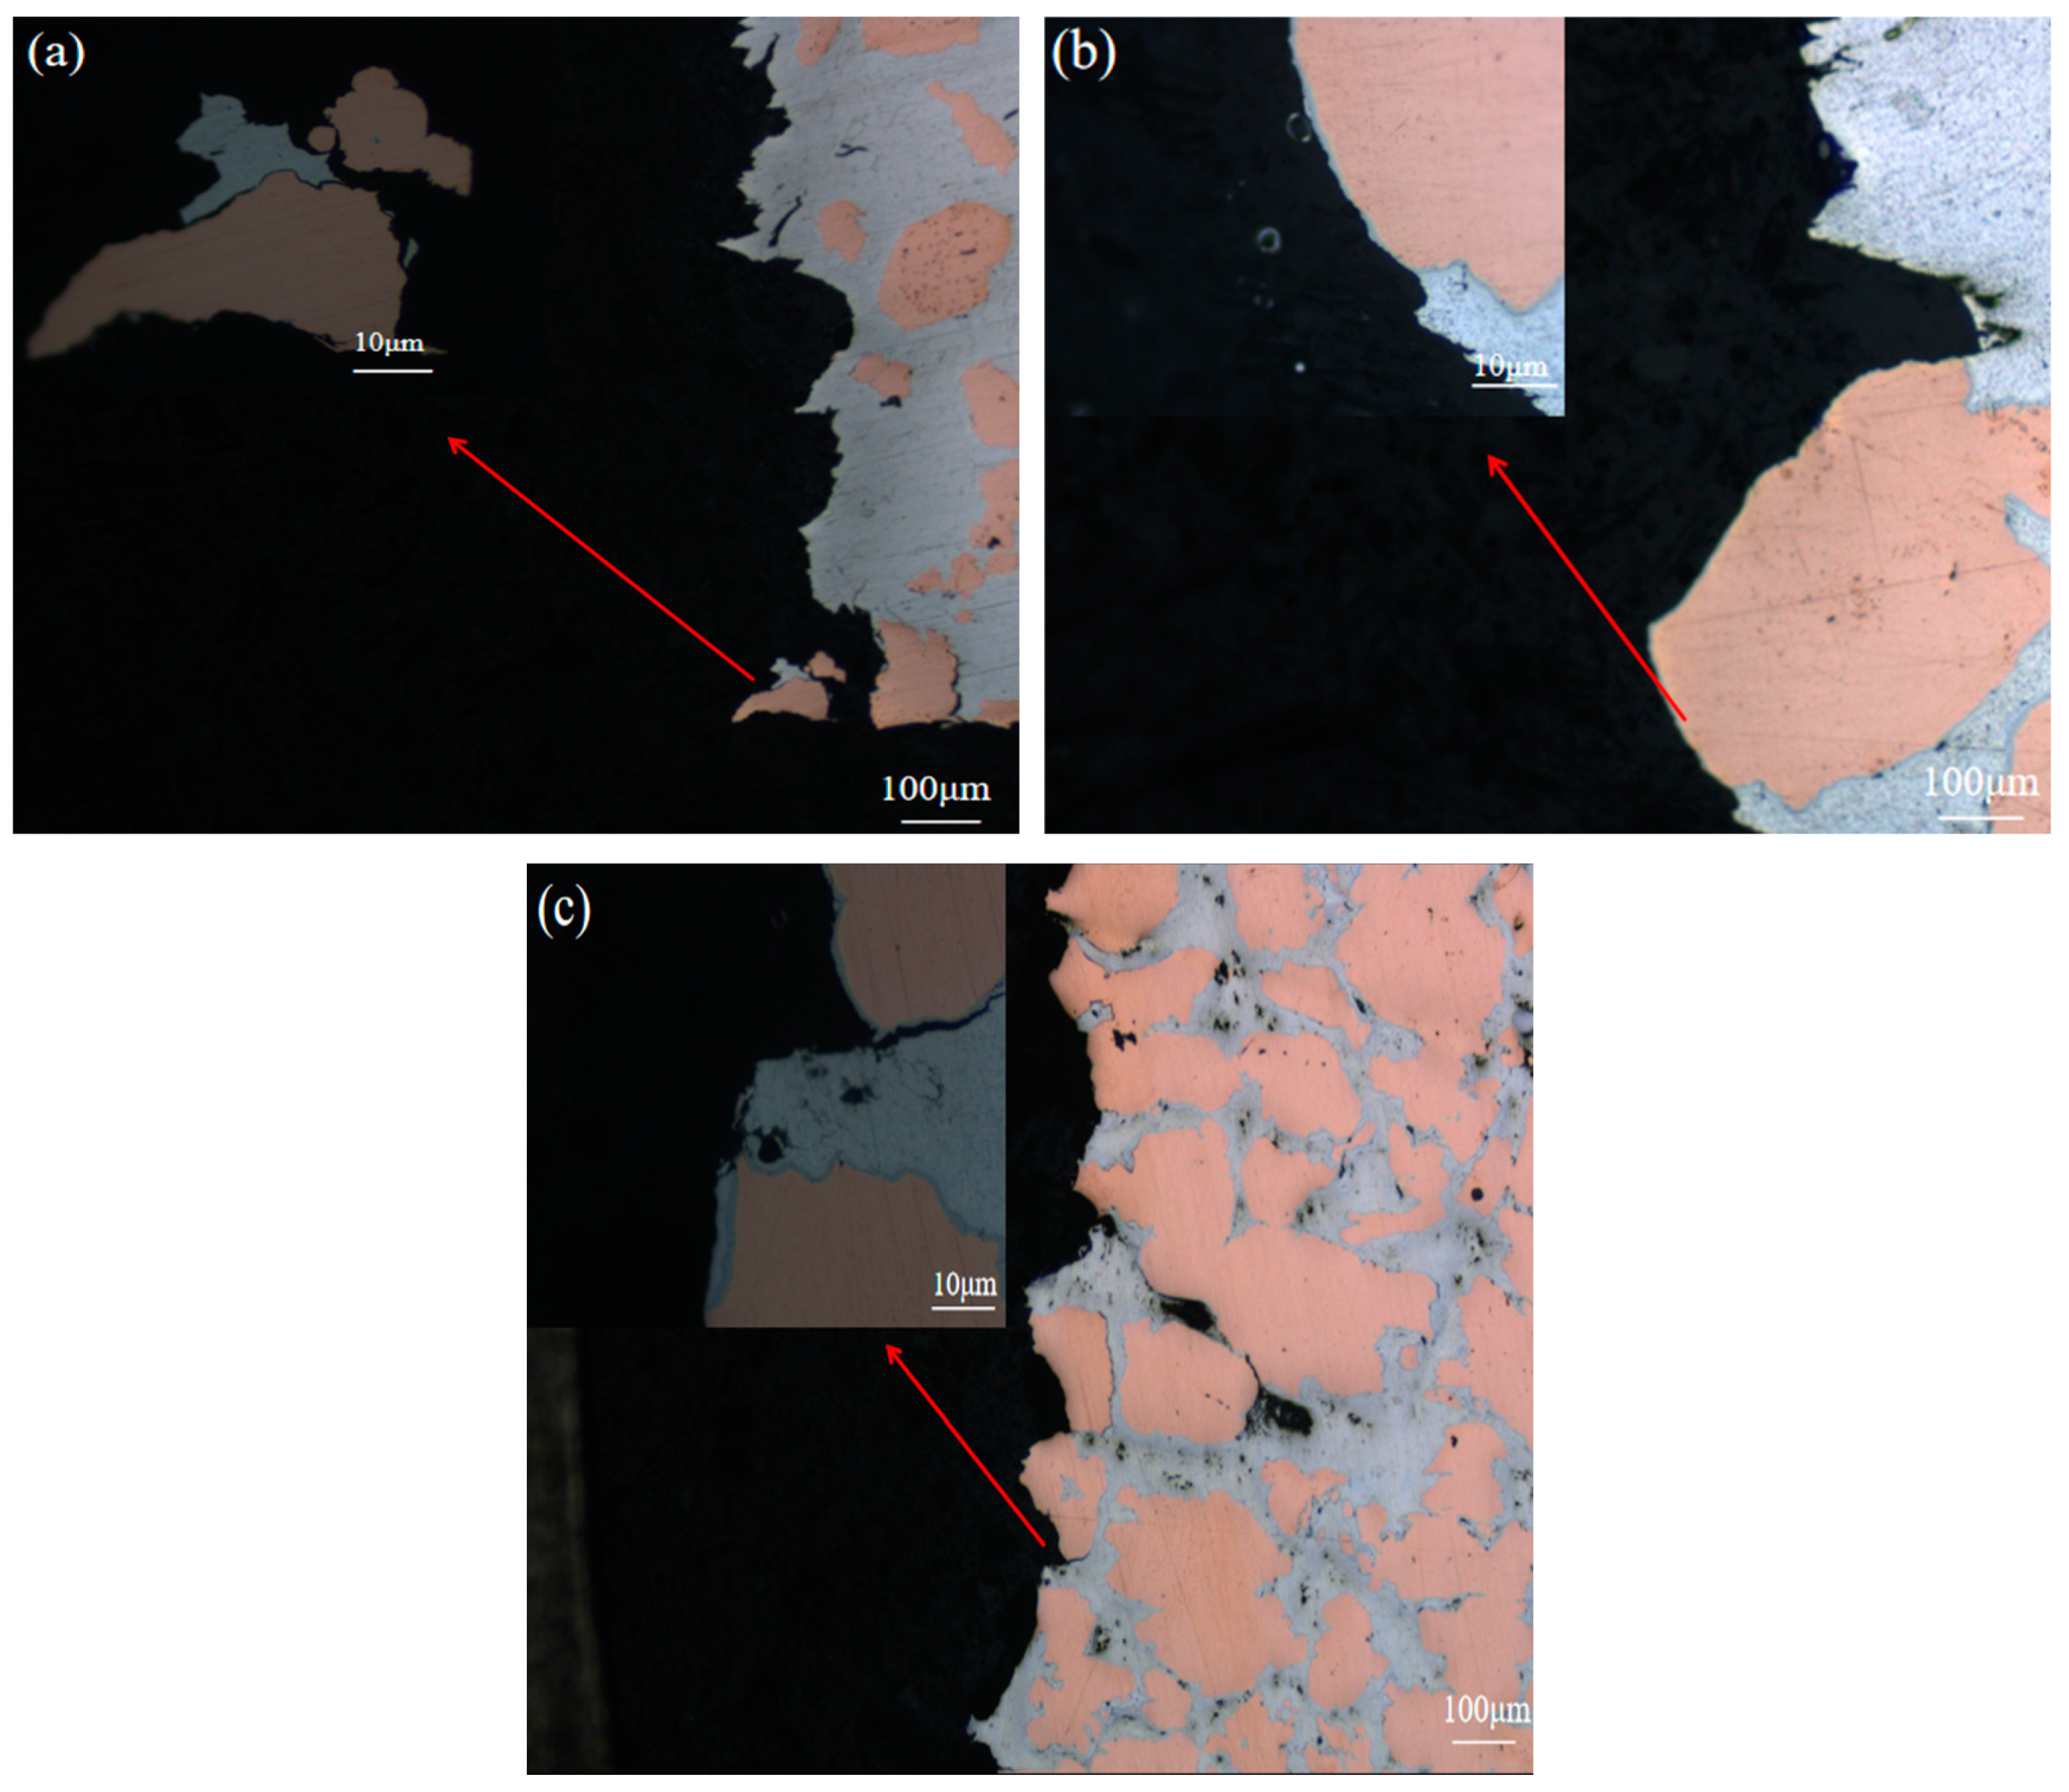
  • The thickness of the transition zone increased with increasing Cu–Al volume ratio. The mass fractions of copper in different Cu–Al volume ratios were 62%, 77%, and 87%, respectively. According to the AI–Cu phase diagram, it can be inferred that as the transition region thickens, the metal compound is AI2Cu at first, followed by AICu, and finally Al4Cu9.
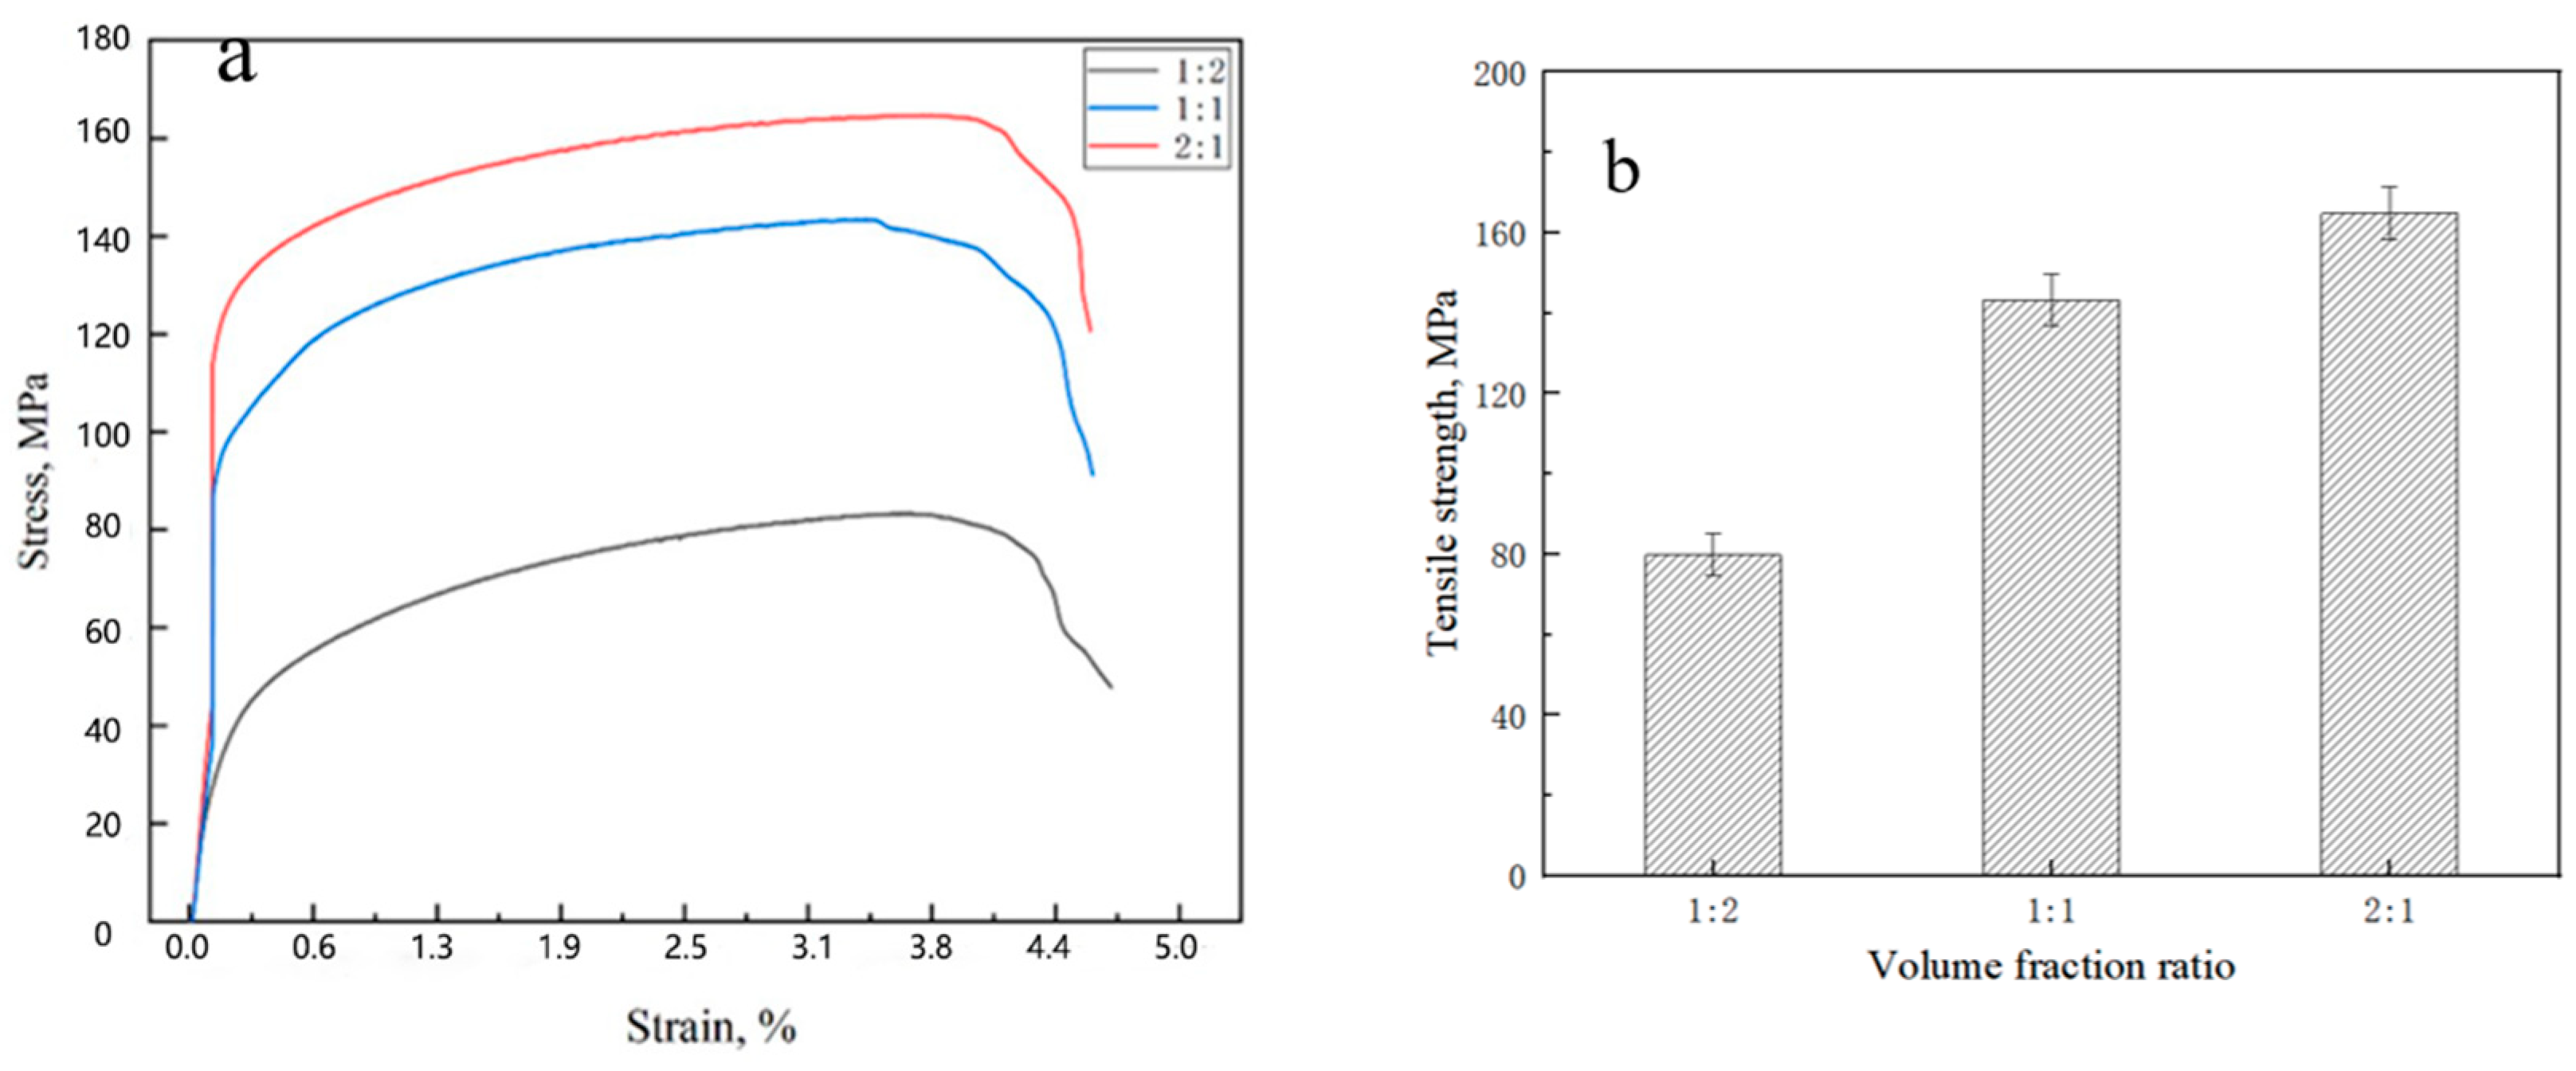
  • Due to the high microhardness of Al–Cu and the high fracture toughness of Al4Cu9, the ultimate tensile strength and microhardness of the Cu–Al alloys increased with increasing Cu–Al volume ratio. The ultimate tensile strength reached the maximum value of 164.9 MPa with a Cu–Al volume ratio of 2:1. The microhardness increased from 60 HV to 101 HV, while the Cu–Al volume ratio varied from 1:2 to 2:1.
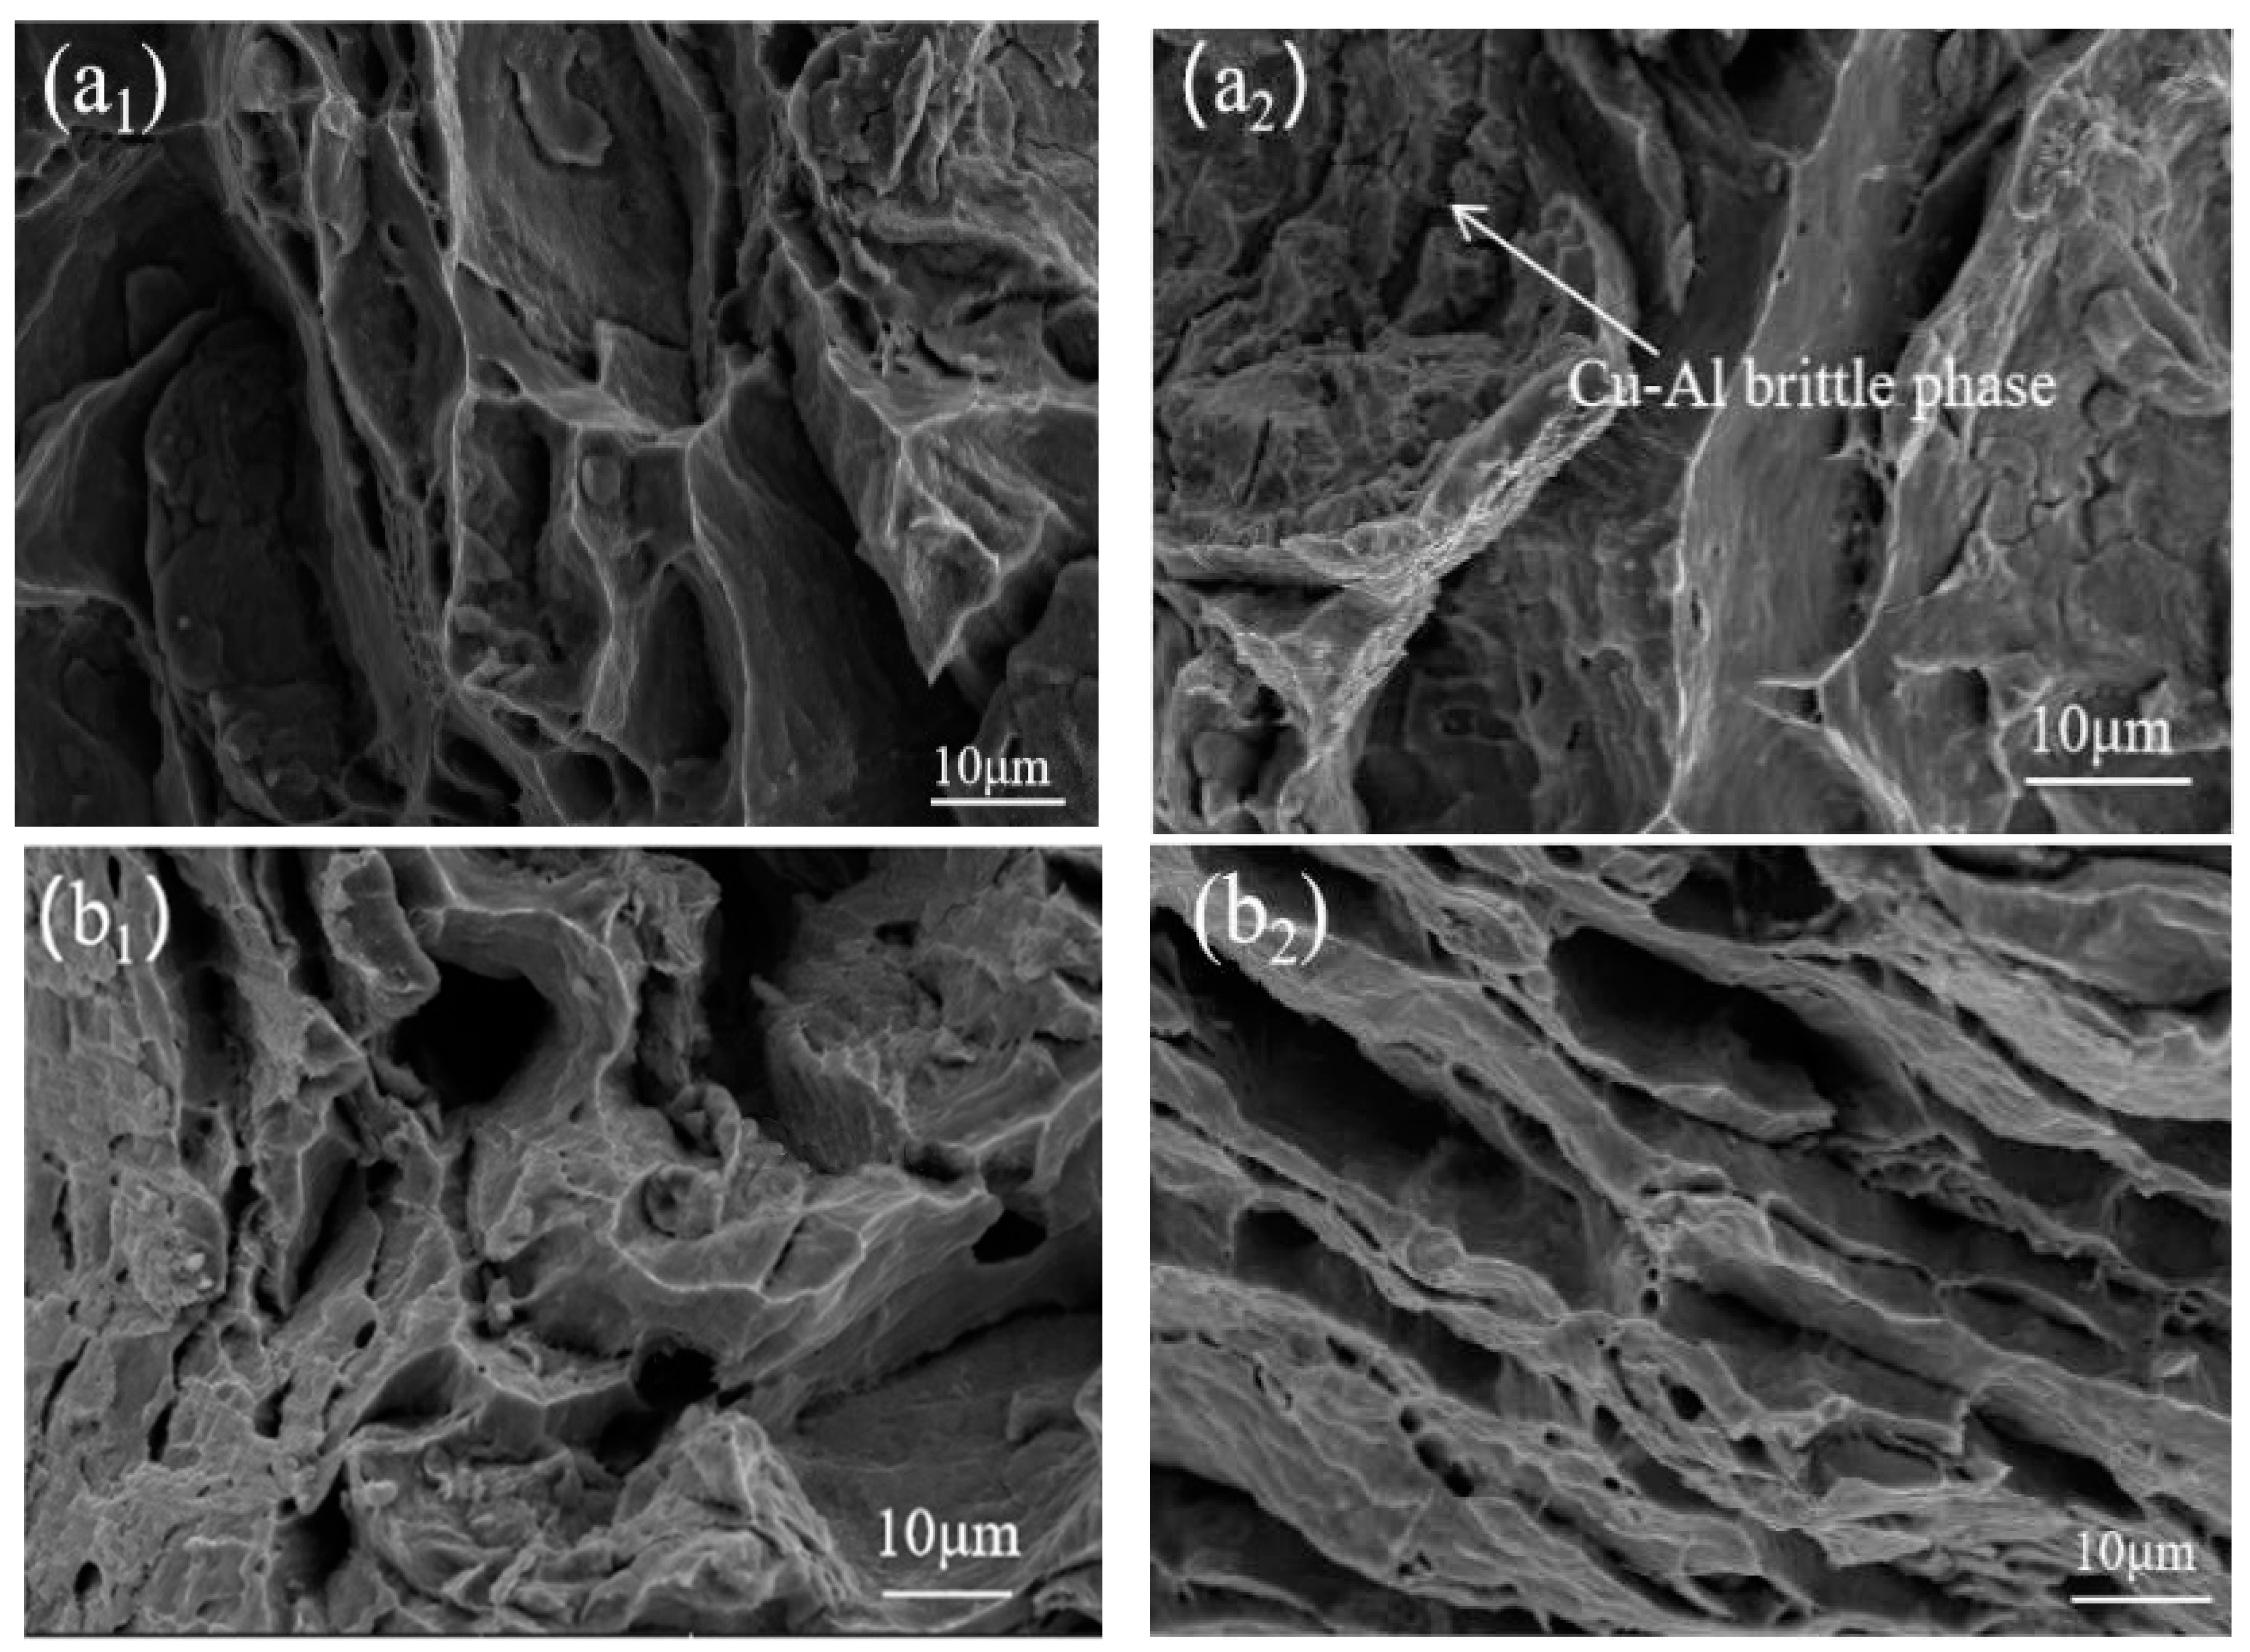
  • With the increasing Cu–Al volume ratio, the elongation of the Cu–Al alloys hardly changed, which was related to the crack initiation and propagation of the Cu–Al alloys. The crack initiation occurred at the Cu–Al interface and spread along the bonding surface of the Cu–Al alloys.

Author Contributions

Conceptualization, Y.H. and Y.L.; methodology, Y.W.; software, L.Z. and Z.W.; validation, Y.W., C.L. and Z.Q.; formal analysis, Y.H. and Y.L.; investigation, H.Z.; resources, H.Z. and Y.H.; data curation, C.L. and Z.Q.; writing—original draft preparation, Y.W., Z.W. and L.Z.; writing—review and editing, C.Z., H.Z. and H.Y.; visualization, C.L. and Z.Q.; supervision, L.Z.; project administration, H.Z.; funding acquisition, H.Y. All authors have read and agreed to the published version of the manuscript.

Funding

Supported by the 2024 Jiangsu Province Graduate Practice Innovation Program (SJCX24_2090).

Data Availability Statement

The original contributions presented in the study are included in the article, further inquiries can be directed to the corresponding authors.

Conflicts of Interest

Authors Hongliang Zhang and Hongmiao Yu were employed by the company Zhongtian Science and Technology Marine Cable Co., Ltd. The remaining authors declare that the research was conducted in the absence of any commercial or financial relationships that could be construed as a potential conflict of interest.

References

  1. Jin, T.; Li, G.; Cao, Y.; Xu, R.; Shao, S.; Yang, B. Experimental research on applying the copper-clad aluminum tube asconnecting tubes of air conditioners. Energy Build. 2015, 97, 1–5. [Google Scholar] [CrossRef]
  2. Ankur; Bharti, A.; Prasad, D.; Kumar, N.; Saxena, K.K. A Re-investigation: Effect of various parameter on mechanical properties of copper matrix composite fabricated by powder metallurgy. Mater. Today Proc. 2021, 45, 4594–4600. [Google Scholar] [CrossRef]
  3. Rodríguez-Cabriales, G.; Lometo-Sánchez, A.M.; Guía-Tello, J.C.; Medrano-Prieto, H.M.; Gutiérrez-Castañeda, E.J.; Estrada-Guel, I.; Garay-Reyes, C.G.; Hernández-Rivera, J.L.; Cruz-Rivera, J.J.; Maldonado-Orozco, M.C.; et al. Synthesis and characterization of Al-Cu-Mg system reinforced with tungsten carbide through powder metallurgy. Mater. Today Commun. 2020, 22, 100758. [Google Scholar] [CrossRef]
  4. Kim, D.; Kim, K.; Kwon, H. Interdiffusion and Intermetallic Compounds at Al/Cu Interfaces in Al-50vol.%Cu Composite Prepared by Solid-State Sintering. Materials 2021, 14, 4307. [Google Scholar] [CrossRef]
  5. Chen, C.; Guo, L.; Luo, J.; Hao, J.; Guo, Z.; Volinsky, A.A. Aluminum powder size and microstructure effects on properties of boron nitride reinforced aluminum matrix composites fabricated by semi-solid powder metallurgy. Mater. Sci. Eng. A 2015, 646, 306–314. [Google Scholar] [CrossRef]
  6. Nehrkorn, S.; Händel, M.; Dietrich, D.; Podlesak, H.; Nickel, D.; Wielage, B.; Lampke, T. A hardness–microstructure correlation study of anodized powder-metallurgical Al–Cu alloy composites. Surf. Coat. Technol. 2014, 242, 118–124. [Google Scholar] [CrossRef]
  7. Yang, Q.; Ma, Y.; Chen, Z.; Ji, G.; Wang, M.; Zhong, S.; Wu, Y.; Ji, V.; Wang, H. A new powder metallurgy routine to fabricate TiB2/Al–Zn–Mg–Cu nanocomposites based on composite powders with pre-embedded nanoparticles. Materialia 2019, 8, 100458. [Google Scholar] [CrossRef]
  8. Zhang, A.; Li, F.; Yu, T.; Li, C.; Li, Y. Enhanced strength-ductility synergy of homogeneous isomeric Al-Cu-Mg sheet prepared by powder metallurgy. J. Mater. Res. Technol. 2023, 25, 6938–6948. [Google Scholar] [CrossRef]
  9. Zhao, X.; Meng, J.; Zhang, C.; Wei, W.; Wu, F.; Zhang, G. A novel method for improving the microstructure and the properties of Al-Si-Cu alloys prepared using rapid solidification/powder metallurgy. Mater. Today Commun. 2023, 35, 105802. [Google Scholar] [CrossRef]
  10. El Aal, M.I.A.; Sadawy, M.M. Influence of ECAP as grain refinement technique on microstructure evolution, mechanical properties and corrosion behavior of pure aluminum. Trans. Nonferrous Met. Soc. China 2015, 25, 3865–3876. [Google Scholar] [CrossRef]
  11. Gohar, G.A.; Manzoor, T.; Shah, A.N. Investigation of thermal and mechanical properties of Cu-Al alloys with silver addition prepared by powder metallurgy. J. Alloys Compd. 2018, 735, 802–812. [Google Scholar] [CrossRef]
  12. Kumar, M.G.A.; Seetharamu, S.; Nayak, J.; Satapathy, L.N. A Study on Thermal Behavior of Aluminum Cenosphere Powder Metallurgy Composites Sintered in Microwave. Procedia Mater. Sci. 2014, 5, 1066–1074. [Google Scholar] [CrossRef]
  13. Yu, T.; Li, F.; Wang, Y.; Li, X. New powder metallurgy preparation method of homogeneous and isomeric Al-Cu-Mg mixed crystal materials. Trans. Nonferrous Met. Soc. China 2023, 33, 371–382. [Google Scholar] [CrossRef]
  14. Kotikala Rajasekhar, V.; Suresh Babu, M.J. Davidson. Microstructural and mechanical properties of Al-Cu functionally graded materials fabricated by powder metallurgy method. Mater. Today Proc. 2021, 41, 1156–1159. [Google Scholar] [CrossRef]
  15. Gohar, G.A.; Manzoor, T.; Ahmad, A. Synthesis and investigate the properties of Cu-Al-Ni alloys with Ag addition using powder metallurgy technique. J. Alloys Compd. 2020, 817, 153281. [Google Scholar] [CrossRef]
  16. Deng, Z.; Yin, H.; Zhang, C.; Li, W. Microstructure and mechanical properties of Cu-12 Al-6 Ni with Ti addition prepared by powder metallurgy. Mater. Sci. Eng. A 2021, 803, 140472. [Google Scholar] [CrossRef]
  17. Cao, F.; Cui, H.; Song, X.; Gao, L.; Liu, M.; Qiao, Q.; Kong, H. Fabrication of multi-scale TiC and stainless steel composite coatings via circular oscillating laser towards superior wear and corrosion resistance of aluminum alloy. J. Mater. Sci. Technol. 2024, 177, 191–204. [Google Scholar] [CrossRef]
  18. Irhayyim, S.S.; Hammood, H.S.; Meteab, M.M. Gravel powder effect in reinforced aluminum alloy matrix composite. Mater. Today Proc. 2020, 20, 548–554. [Google Scholar] [CrossRef]
  19. Akçamlı, N.; Şenyurt, B. B4C particulate-reinforced Al-8.5 wt% Si-3.5 wt% Cu matrix composites: Powder metallurgical fabrication, age hardening, and characterization. Ceram. Int. 2021, 47, 6813–6826. [Google Scholar] [CrossRef]
  20. Karthikeyan, N.; Krishnan, B.R.; VembathuRajesh, A.; Vijayan, V. Experimental analysis of Al-Cu-Si metal matrix composite by powder-metallurgy process. Mater. Today Proc. 2021, 37, 2770–2774. [Google Scholar] [CrossRef]
  21. Woll, D.W.; Davidson, M.J.; Khanr, A.K. Studies on the formability of powder metallurgical aluminum–copper composite. Mater. Des. 2014, 59, 151–159. [Google Scholar] [CrossRef]
  22. Rajasekhar, K.; Babu, V.S.; Davidson, M.J. Interfacial microstructure and properties of Al-Cu functionally graded materials fabricated by powder metallurgy method. Mater. Today Proc. 2021, 46, 9212–9216. [Google Scholar] [CrossRef]
  23. Rashad, M.; Pan, F.; Asif, M. Room temperature mechanical properties of Mg–Cu–Al alloys synthesized using powder metallurgy method. Mater. Sci. Eng. A 2015, 644, 129–136. [Google Scholar] [CrossRef]
  24. Shaik, M.A.; Golla, B.R. Development of highly wear resistant Cu-Al alloys processed via powder metallurgy. Tribol. Int. 2019, 136, 127–139. [Google Scholar] [CrossRef]
  25. Li, L.; Gong, Z.; Li, P. Simulation and experimental study of extrusion consolidation of pure aluminum powder with equidistant angle. Precis. Form. Eng. 2014, 6, 24–30. [Google Scholar]
Figure 1. The micromorphology of the raw powder: (a) Cu and (b) Al.
Metals 14 00978 g001
Figure 2. Diagram of the Cu–Al alloy preparation process.
Metals 14 00978 g002
Figure 3. Dimensions of tensile specimen (mm).
Metals 14 00978 g003
Figure 4. The microstructure of the Cu–Al alloys without etching and at different Cu–Al volume ratios: (a) 1:2; (b) 1:1; (c) 2:1.
Metals 14 00978 g004
Figure 5. The average size of the aggregate Cu phase in Cu–Al alloys at different volume ratios.
Metals 14 00978 g005
Figure 6. Statistical analysis of the aspect ratio of the Cu phase in Cu–Al alloys at different volume ratios ((a) 1:2, (b) 1:1, and (c) 2:1) and the plot of average transverse and longitudinal dimension ratios (d).
Metals 14 00978 g006
Figure 7. The diagrams of the model: (a) negative mold, (b) upper mold, and (c) powder model.
Metals 14 00978 g007
Figure 8. Powder models at different Cu–Al volume ratios: (a) 1:2, (b) 1:1, and (c) 2:1.
Metals 14 00978 g008
Figure 9. The finite element model after the meshing process: (a) negative mold and (b) mixed powder model.
Metals 14 00978 g009
Figure 10. Extrusion stress diagram of Cu and Al powder particles: (a) 1:2, (b) 1:1, and (c) 2:1.
Metals 14 00978 g010aMetals 14 00978 g010b
Figure 11. Microhardness of the Cu–Al alloys at different volume ratios.
Metals 14 00978 g011
Figure 12. The tensile properties of the Cu–Al alloys at different volume ratios: (a) Typical tensile curves and (b) Ultimate tensile strength.
Metals 14 00978 g012
Figure 13. Micrographs of the longitudinal section of the tensile fracture surface of the Cu–Al alloys with different volume ratios: (a) 1:2, (b) 1:1, and (c) 2:1.
Metals 14 00978 g013
Figure 14. SEM morphology of tensile fracture of the Cu–Al alloys with different volume ratios: (a1,a2) 1:2, (b1,b2) 1:1, and (c1,c2) 2:1.
Metals 14 00978 g014aMetals 14 00978 g014b
Table 1. Chemical composition of Cu powder and Al powder (wt%).
MaterialAlCuFeSiNiOthers
Al powder99.970.00470.00590.0062-0.0132
Cu powder-99.900.001-0.0050.094
Table 2. The material parameters of Cu and Al powder.
MaterialYoung’s Modulus (MPa)Poisson’s RatioDensityYield Strength (MPa)
Al70,0000.32.7 × 10−930
Cu90,0000.38.9 × 10−960
Disclaimer/Publisher’s Note: The statements, opinions and data contained in all publications are solely those of the individual author(s) and contributor(s) and not of MDPI and/or the editor(s). MDPI and/or the editor(s) disclaim responsibility for any injury to people or property resulting from any ideas, methods, instructions or products referred to in the content.

