Abstract
7075 aluminum alloy has been widely used because of its excellent mechanical properties. The fatigue crack acceleration induced by compressive overloading is detrimental to 7075 aluminum alloy in service, and the corresponding mechanisms are complex. To further reveal these mechanisms, the effect of microstructure on fatigue damage response ahead of the crack tip is simulated based on the damage-coupled crystal plasticity model for 7075 aluminum alloy. Results show that the ratchetting strain ahead of the crack tip at the compressive overload ratio of −3 is greater than that at the compressive overload ratio of −2, which is attributed to the fact that higher compressive overloading induces greater tensile residual stress ahead of the crack tip. The proportion of material points with no less than four activated slip systems increases after compressive overloading, indicating the number of activated slip systems ahead of the crack tip increases because of the compressive overload effect. This causes the dislocation multiplication rate to be faster, thereby accelerating the fatigue damage accumulation after compressive overloading. Furthermore, the effect of compressive overload changes the slip system activity, and this change in slip system activity depends on grain orientation. It is also found that for a grain ahead of the crack tip, the acceleration of fatigue damage accumulation caused by the effect of compressive overload is influenced by the orientation of its nearest neighbor grains. The findings provide further insight into the acceleration mechanisms induced by the compressive overload effect from a microscopic perspective.
1. Introduction
7075 aluminum alloy belongs to Al–Zn–Mg–Cu aluminum alloy and has excellent performance characteristics, such as low density, high strength-to-density ratio and good corrosion resistance [1,2,3]. Consequently, 7075 aluminum alloy is widely used in the aerospace, marine and automobile sectors. For instance, different aircraft components (i.e., fuselage, landing gear and wing skin) are made of 7075 aluminum alloy [4,5]. During the service period, many components of 7075 aluminum alloy withstand the variable amplitude loading that includes the compressive overloading. Under this circumstance, it is worth investigating the crack tip behaviors of 7075 aluminum alloy subjected to compressive overloading to ensure the safety.
Efforts have been made to study the fatigue crack growth behaviors of 7075 aluminum alloy after the application of compressive overloading. Stephens et al. [6] found by experiments that for 7075 aluminum alloy, the crack-propagation rate under the cyclic load with a single compressive overload is higher than that without compressive overloading. Zhao et al. [7] tested two different compact specimens of 7075 aluminum alloy with the cyclic load with compressive overloading in the crack-propagation experiments. Results indicated that the effect of compressive overload increased the fatigue crack growth rate of 7075 aluminum alloy. Therefore, it can be concluded that the effect of compressive overload accelerates the fatigue crack growth of 7075 aluminum alloy. Previous studies [8,9,10,11] have shown that plasticity-induced crack closure and tensile residual stress are responsible for the acceleration of fatigue crack growth induced by compressive overloading. The plasticity-induced crack closure effect caused by the compressive overload reduces the crack opening stress levels, thereby increasing the effective stress intensity factor range and accelerating the fatigue crack growth [8,9]. Meanwhile, the mechanism of tensile residual stress believes that compressive overloading leads to the presence of the tensile residual stress near the crack tip, and the tensile residual stress together with the applied load increases the peak value of the stress intensity factor and the corresponding effective stress intensity factor range, resulting in the acceleration of fatigue crack growth [10,11]. Zitounis and Irving [12] experimentally found that for the 7010 and 8090 aluminum alloys influenced by the effect of compressive overload, the crack closure induced by the crack tip plasticity increased the effective stress intensity factor range and thus accelerated the crack propagation. When investigating the crack-propagation behaviors of 2024 aluminum alloy and three other steels, Topper and Yu [13] found that compressive overloading caused the crack opening stress to decrease to below zero, indicating that the fatigue crack could open at a stress level below zero and thus propagated faster. Dabayeh and Topper [14] obtained similar results. They observed in the experiment that the crack opening stress of 2024 aluminum alloy rapidly decreased after compressive overloading, then gradually increased to the stable condition. Therefore, it can be concluded that the fatigue crack-propagation rate of aluminum alloys after compressive overloading depends on the local stress and strain fields ahead of the crack tip. It should be noted, however, that the polycrystal is an aggregate of numerous grains with different orientations. The microstructure features determine the mechanical response of polycrystalline aggregates [15,16,17,18]. This indicates that the local stress and strain fields ahead of the crack tip are inevitably affected by the microstructure features of aluminum alloys. The effect of microstructure on the overload retardation induced by tensile overloading has been investigated in recent years [19,20,21,22,23]. The polycrystal is an aggregate of numerous grains with different orientations, and the microstructure plays an important role in the mechanical behavior of the polycrystal. However, the studies above do not discuss the effect of microstructure on the fatigue crack acceleration induced by compressive overloading. For this reason, the main aim of this study is to investigate the mechanisms of the compressive overload effect from the perspective of the material microstructure.
Based on the damage-coupled crystal plasticity model, the effect of microstructure on the damage accumulation ahead of the crack tip under the cyclic load with a single compressive overload is investigated in this study, the aim of which is to provide further insight into the mechanisms of fatigue crack acceleration in 7075 aluminum alloy. The crystal plasticity model is able to reflect the mechanical response of individual grains [24]. To discuss the correlation between the dislocation density and damage accumulation under the cyclic load with a single compressive overload, the isotropic hardening rule based on the densities of forest dislocation and dislocation debris is adopted in the damage-coupled crystal plasticity model. The remaining sections of this study are organized as follows. The dual-scale modeling approach and the damage-coupled constitutive models are described in Section 2 and Section 3, respectively. Subsequently, the response ahead of the crack tip is discussed in Section 4. Finally, the conclusions are drawn in Section 5.
2. Material and Experiments
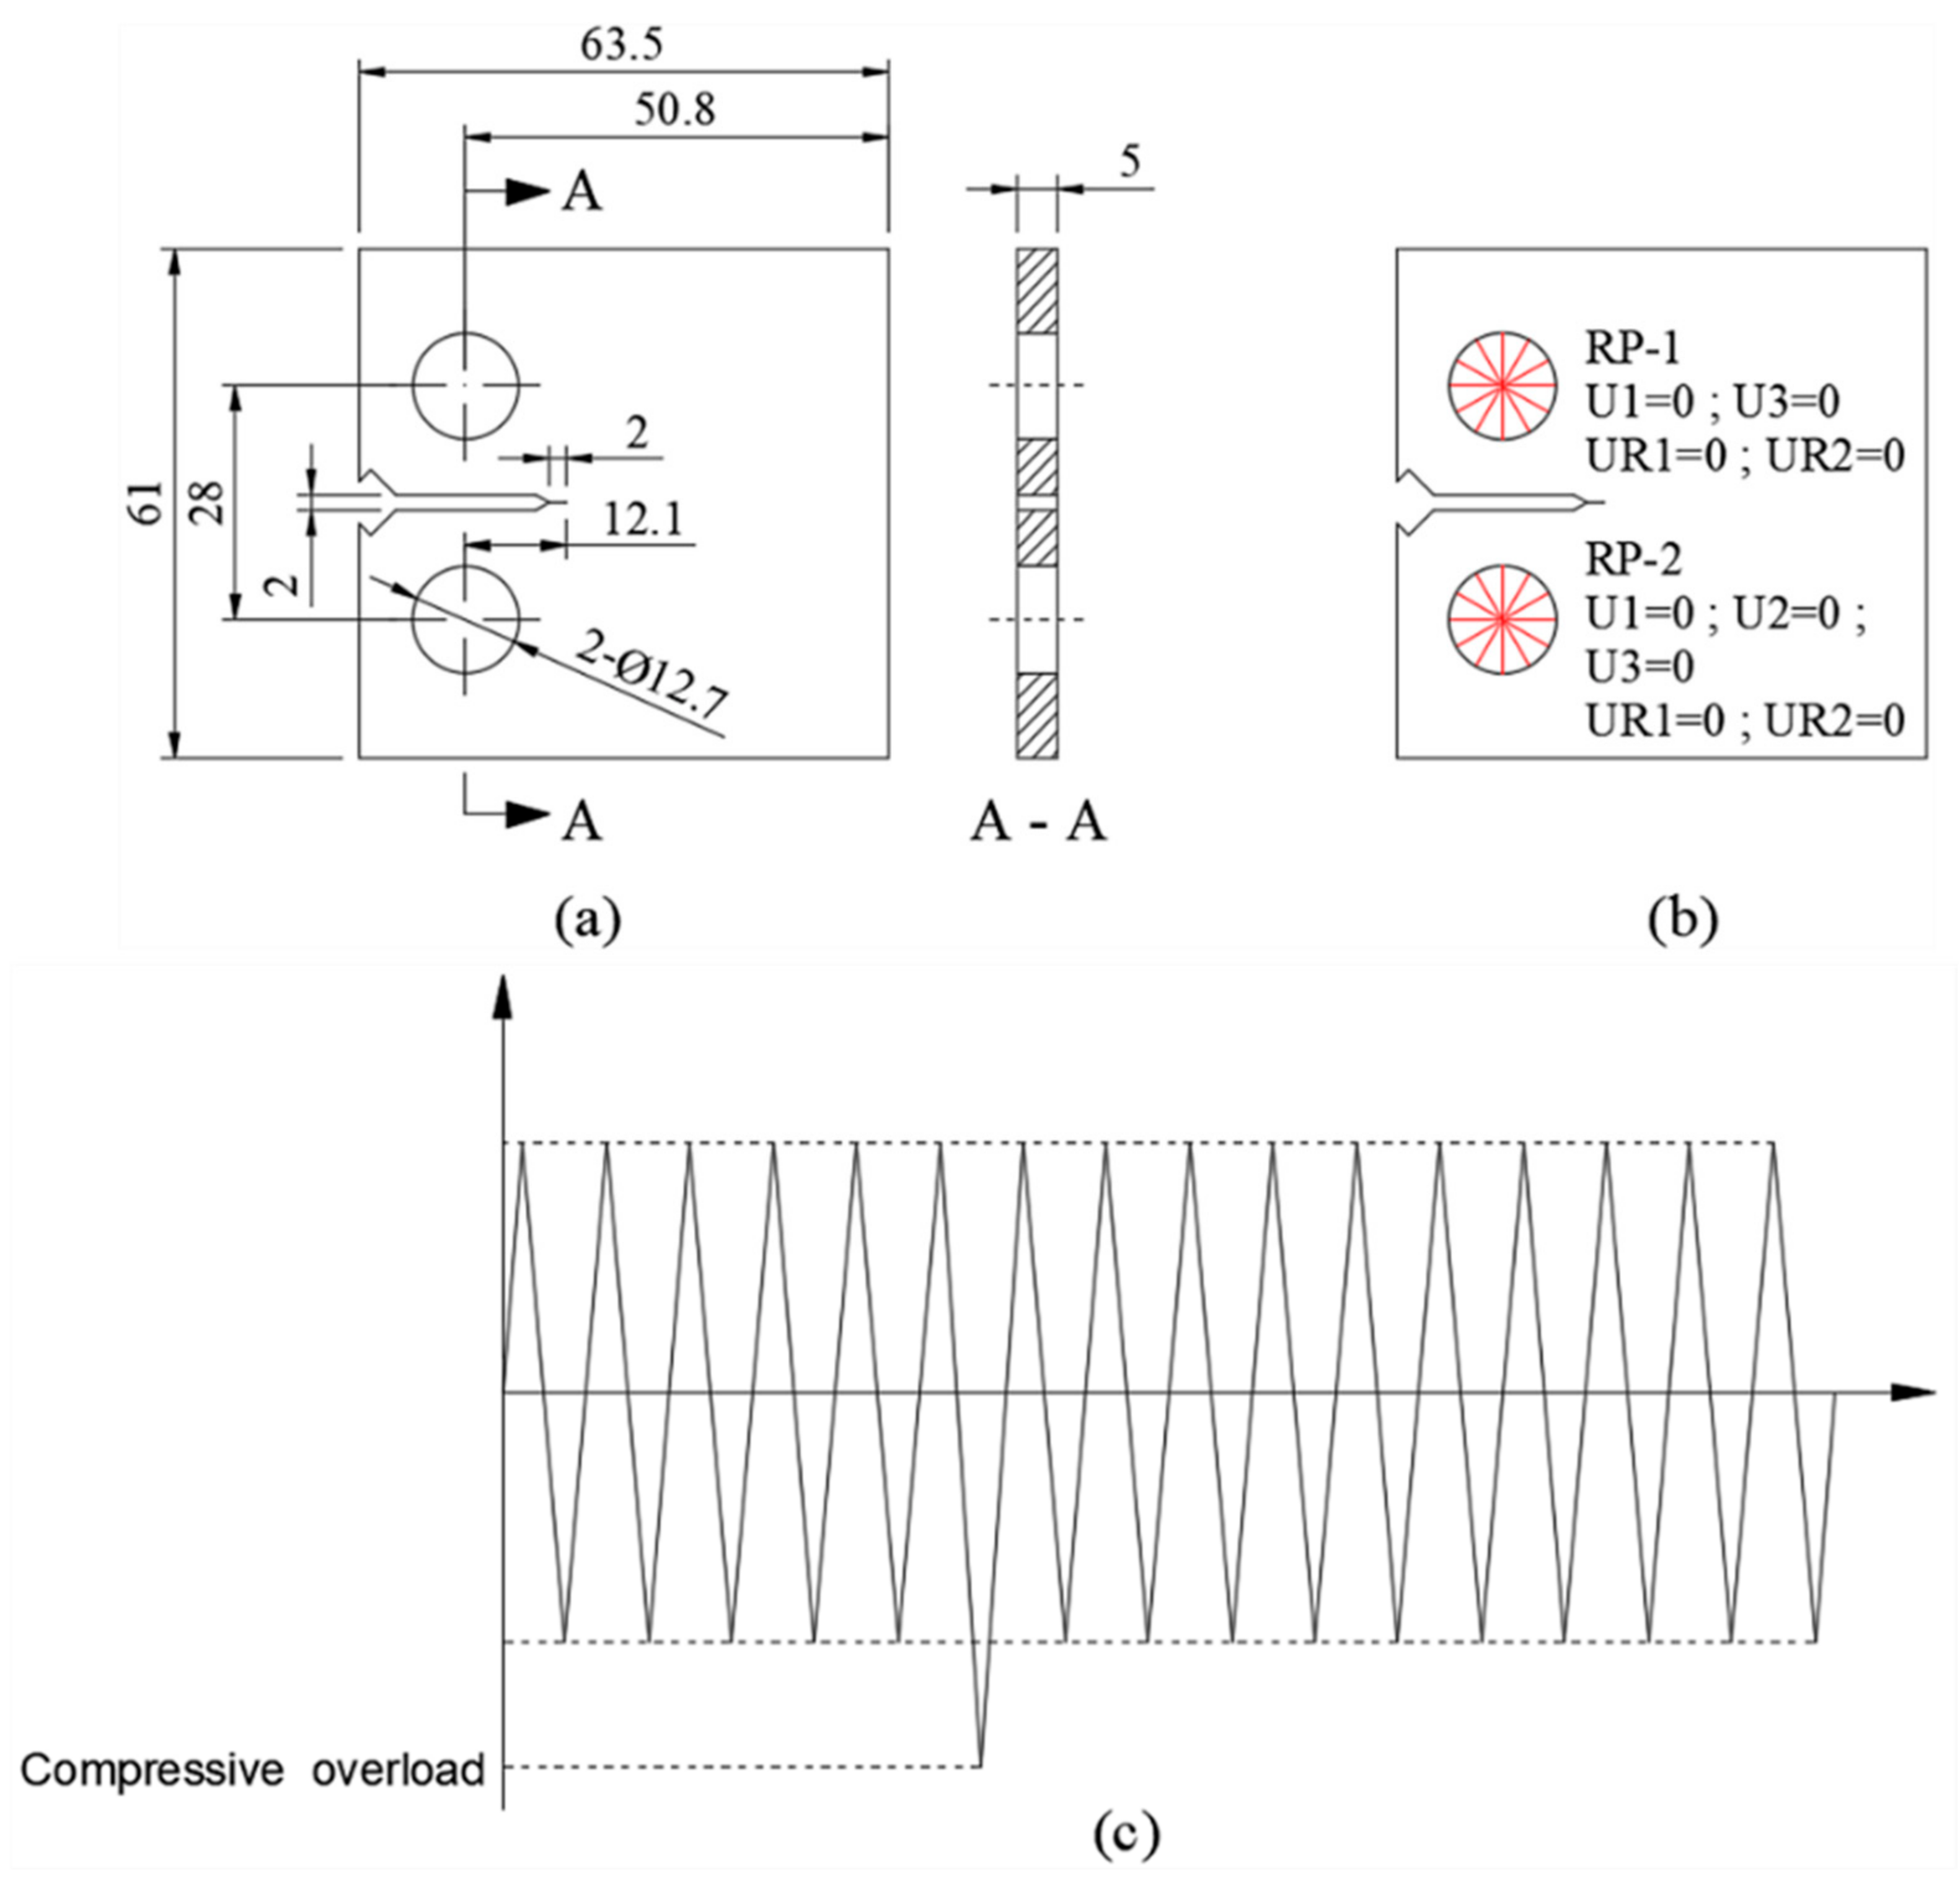
The chemical composition of 7075 aluminum alloy used in this study is listed in Table 1. EBSD experiments are conducted to obtain the microstructure of 7075 aluminum alloy, and the step size in the EBSD scans is set to 1 μm. In addition, the strain-controlled and stress-controlled low-cycle fatigue tests are carried out on an HDT-105B fatigue-testing machine to obtain the cyclic strain–stress response and fatigue lives for determining the parameters of the damage-coupled constitutive models. The dimensions of the fatigue specimen are shown in Figure 1. Three strain amplitudes (i.e., 1.0%, 1.1% and 1.2%) and two stress amplitudes (i.e., 500 MPa and 560 MPa) are used. Both the strain ratio and stress ratio are set as −1, and the testing frequency is 0.1 Hz.

Table 1.
Chemical composition of 7075 aluminum alloy.
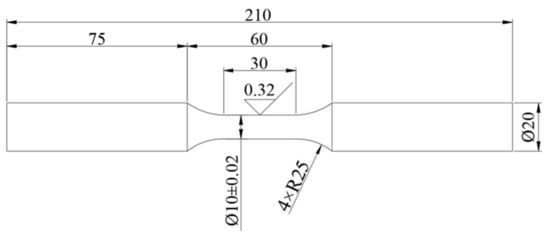
Figure 1.
Geometric dimensions of the fatigue sample (dimensions in mm).
3. Numerical Framework
A dual-scale modeling approach is employed here to save on the computational cost of the simulation. The role of the macro-scale model is to provide the micro-scale model with displacement boundary conditions. The low-cycle fatigue damage-coupled Chaboche (Chaboche–LCFD) model is applied to the macro-scale model, and the low-cycle fatigue damage-coupled crystal plasticity (CPFEM–LCFD) model is applied to the micro-scale model to reflect the effect of microstructure on the damage behavior ahead of the crack tip under the cyclic load with a single compressive overload. The CPFEM–LCFD and Chaboche–LCFD models are coupled with the same low-cycle fatigue damage-evolution model. The dual-scale modeling approach and the damage-coupled constitutive models are described in this section.
3.1. Dual-Scale Modeling
3.1.1. Macro-Scale Model
The macro-scale model is established based on a compact tensile (CT) specimen. The CT specimen has a pre-fabricated crack whose length is 2 mm, and its dimensions are displayed in Figure 2a. Two reference points RP-1 and RP-2 are assigned to the macro-scale model, as shown in Figure 2b. Reference point RP-1 is located at the center of the upper hole of the macro-scale model, and reference point RP-2 is at the center of the lower hole. Moreover, reference point RP-1 and reference point RP-2 are coupled with the inner surfaces of the upper and lower holes, respectively. The constraint conditions of two reference points are given in Figure 2b where U1, U2 and U3 denote the displacements in the x, y and z directions, respectively. Furthermore, UR1 and UR2 in Figure 2b denote the rotations around the x and y axes, respectively. The cyclic loading, which is presented in Figure 2c, is applied on reference point RP-1.

Figure 2.
Schematic diagrams of the (a) dimensions, (b) boundary conditions and (c) cyclic loading history of the CT specimen (dimensions in mm).
3.1.2. Micro-Scale Model
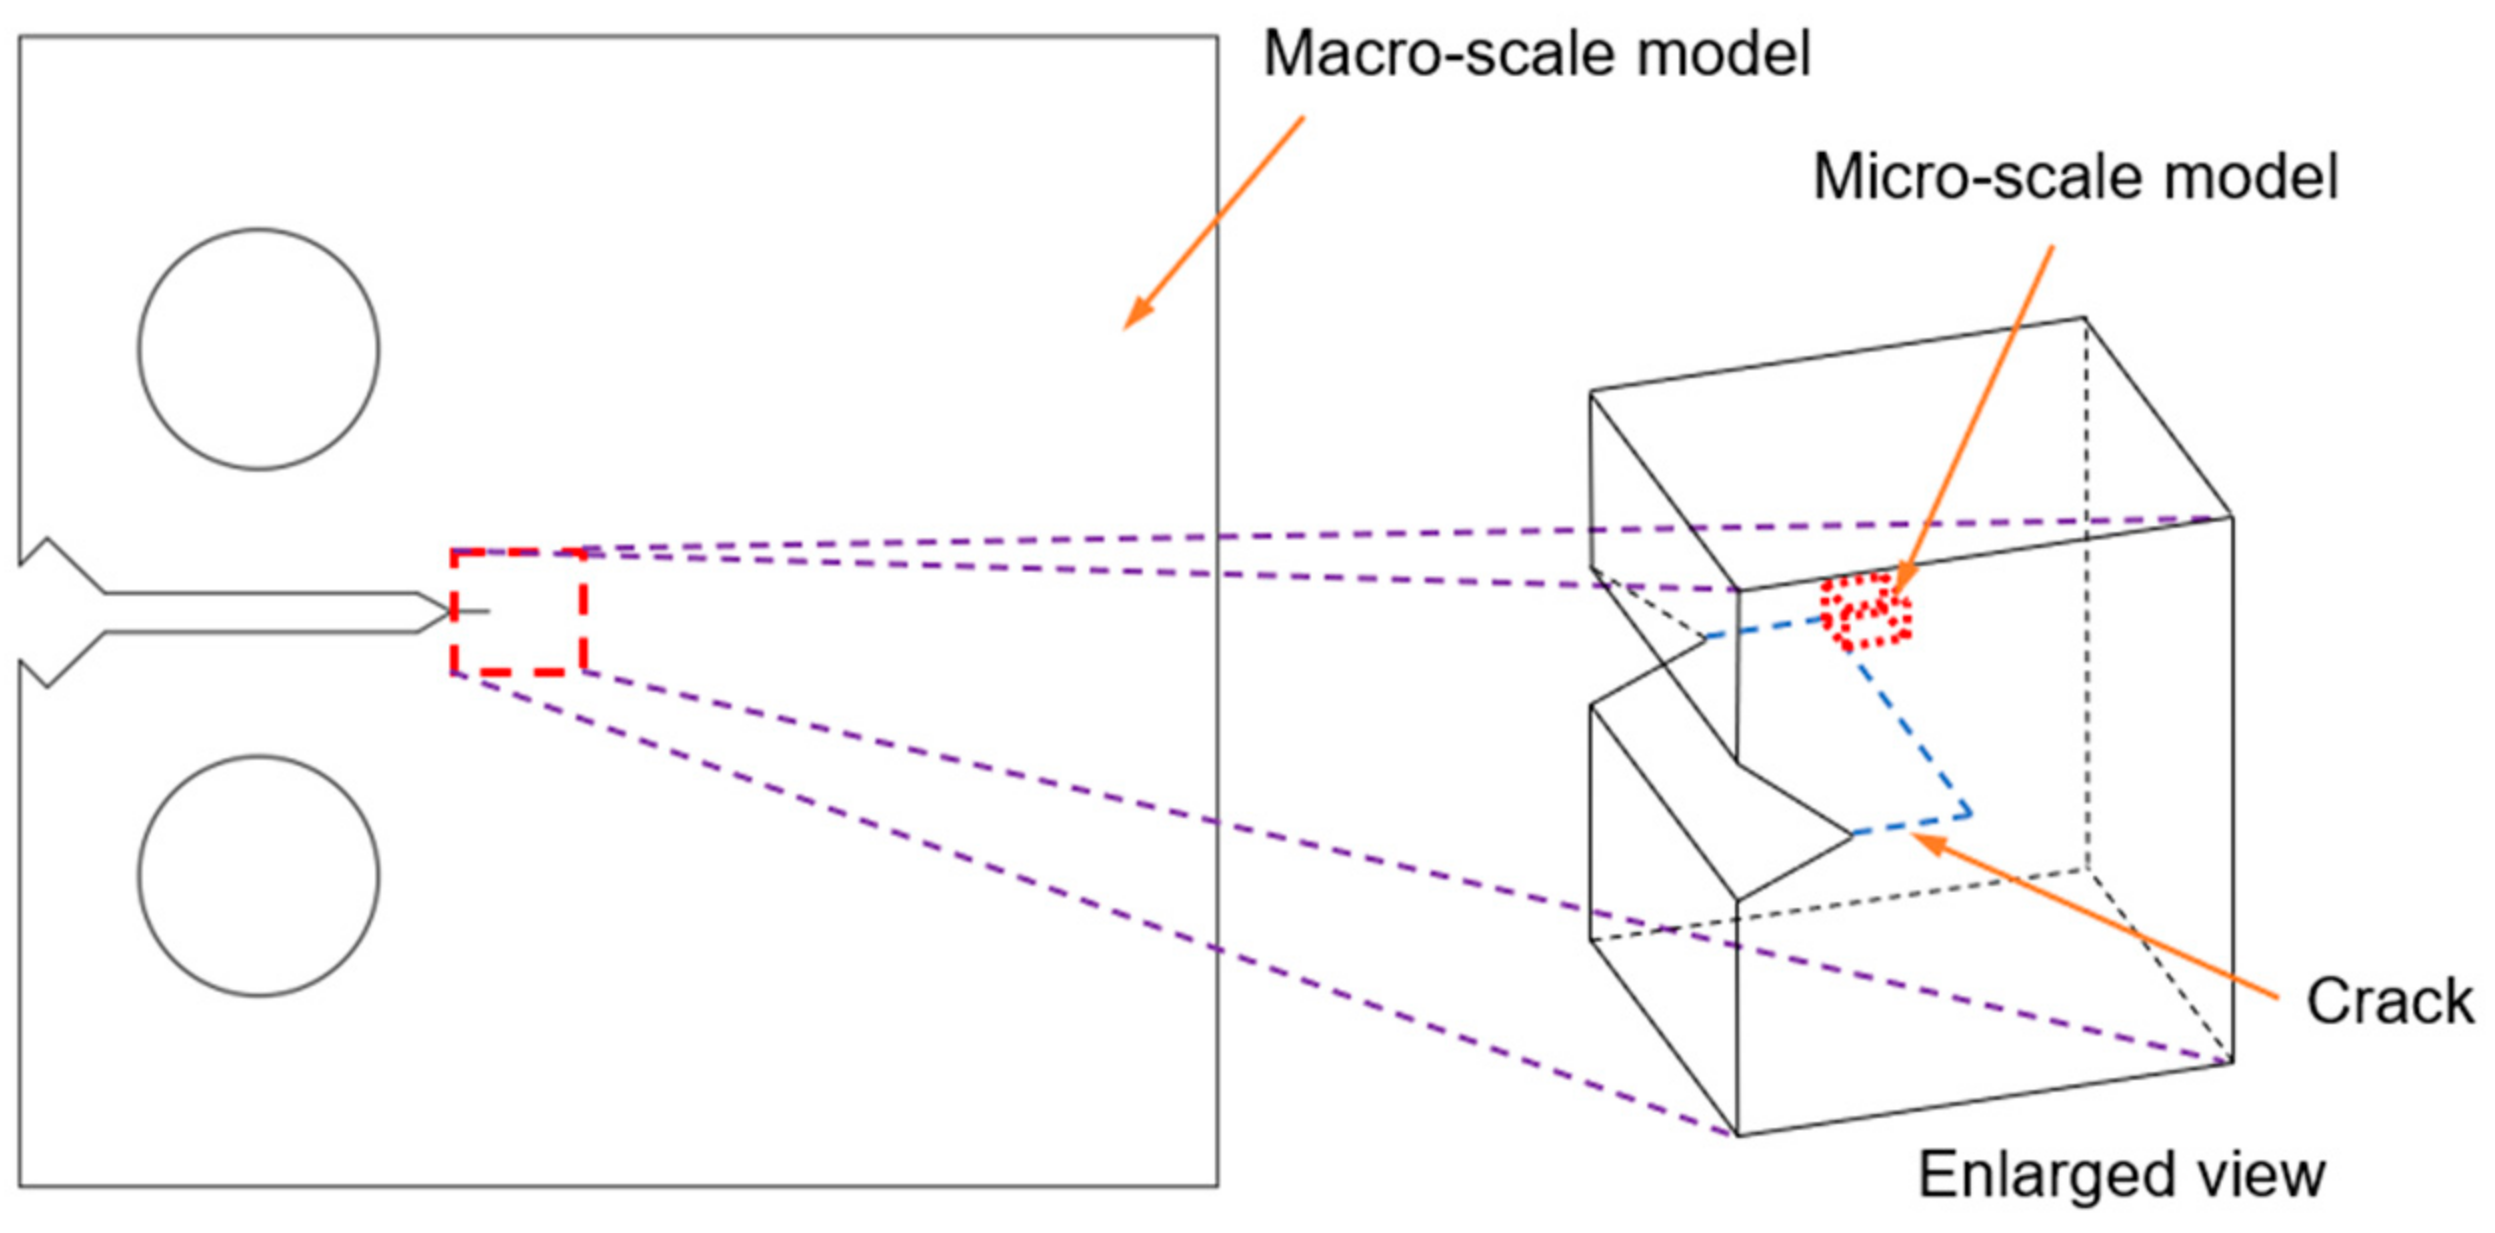
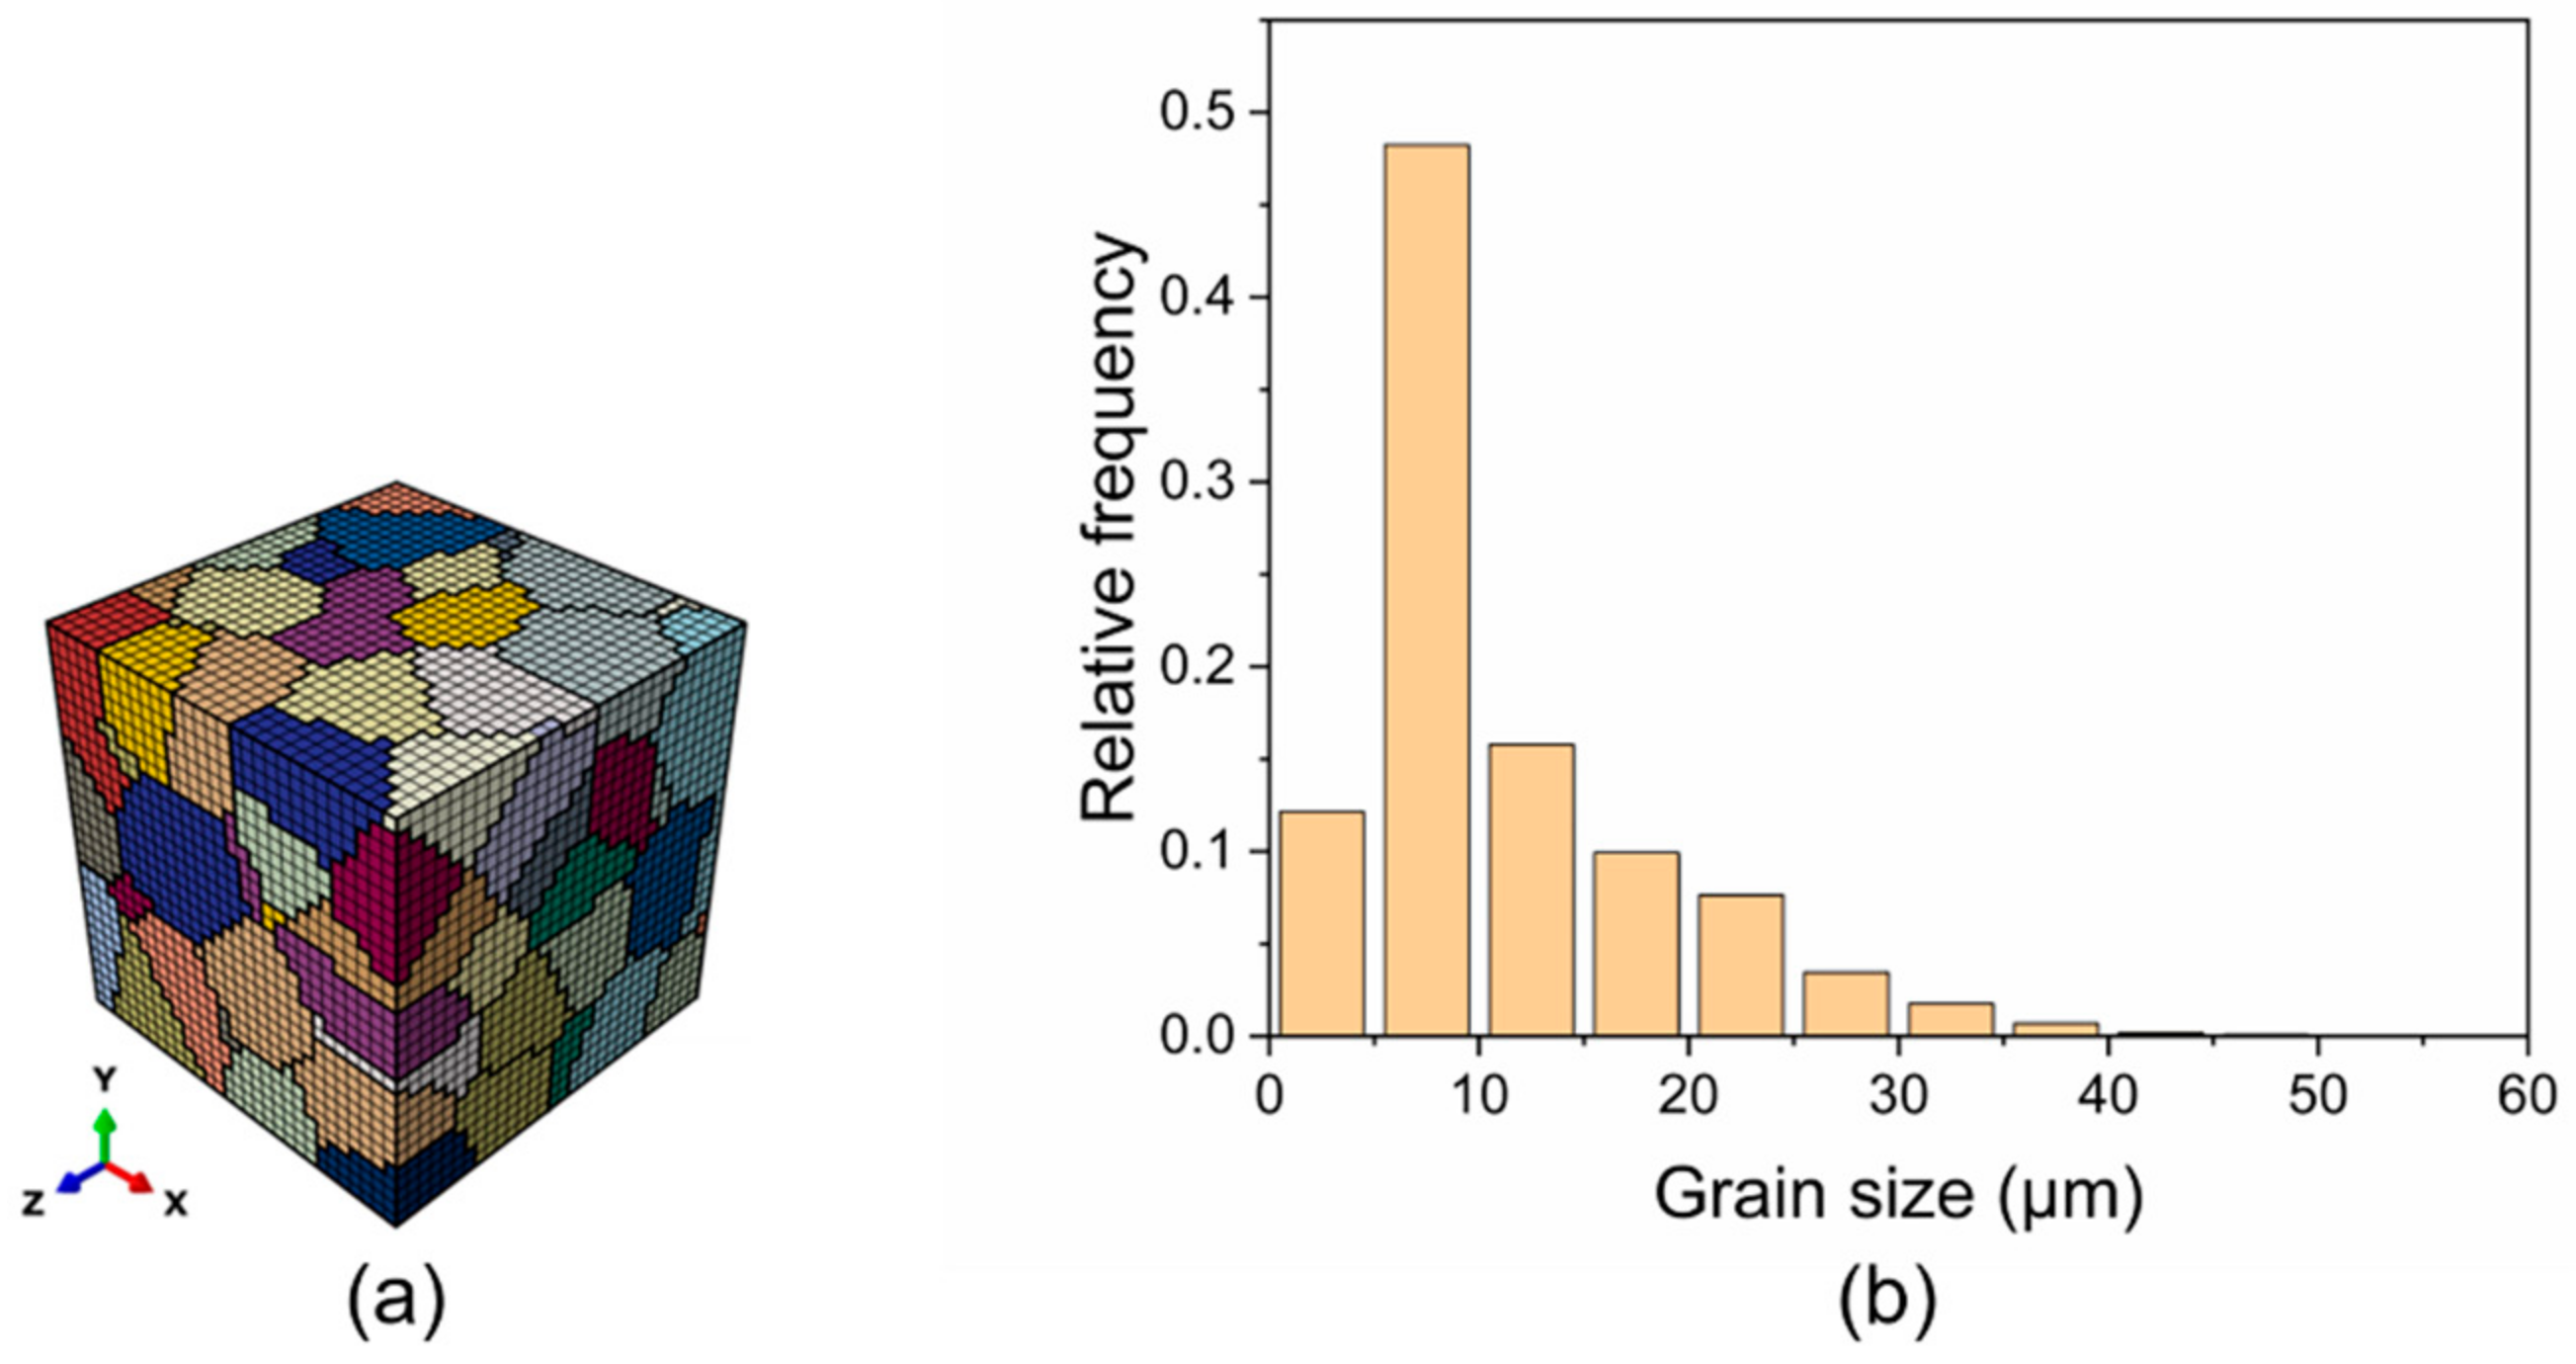
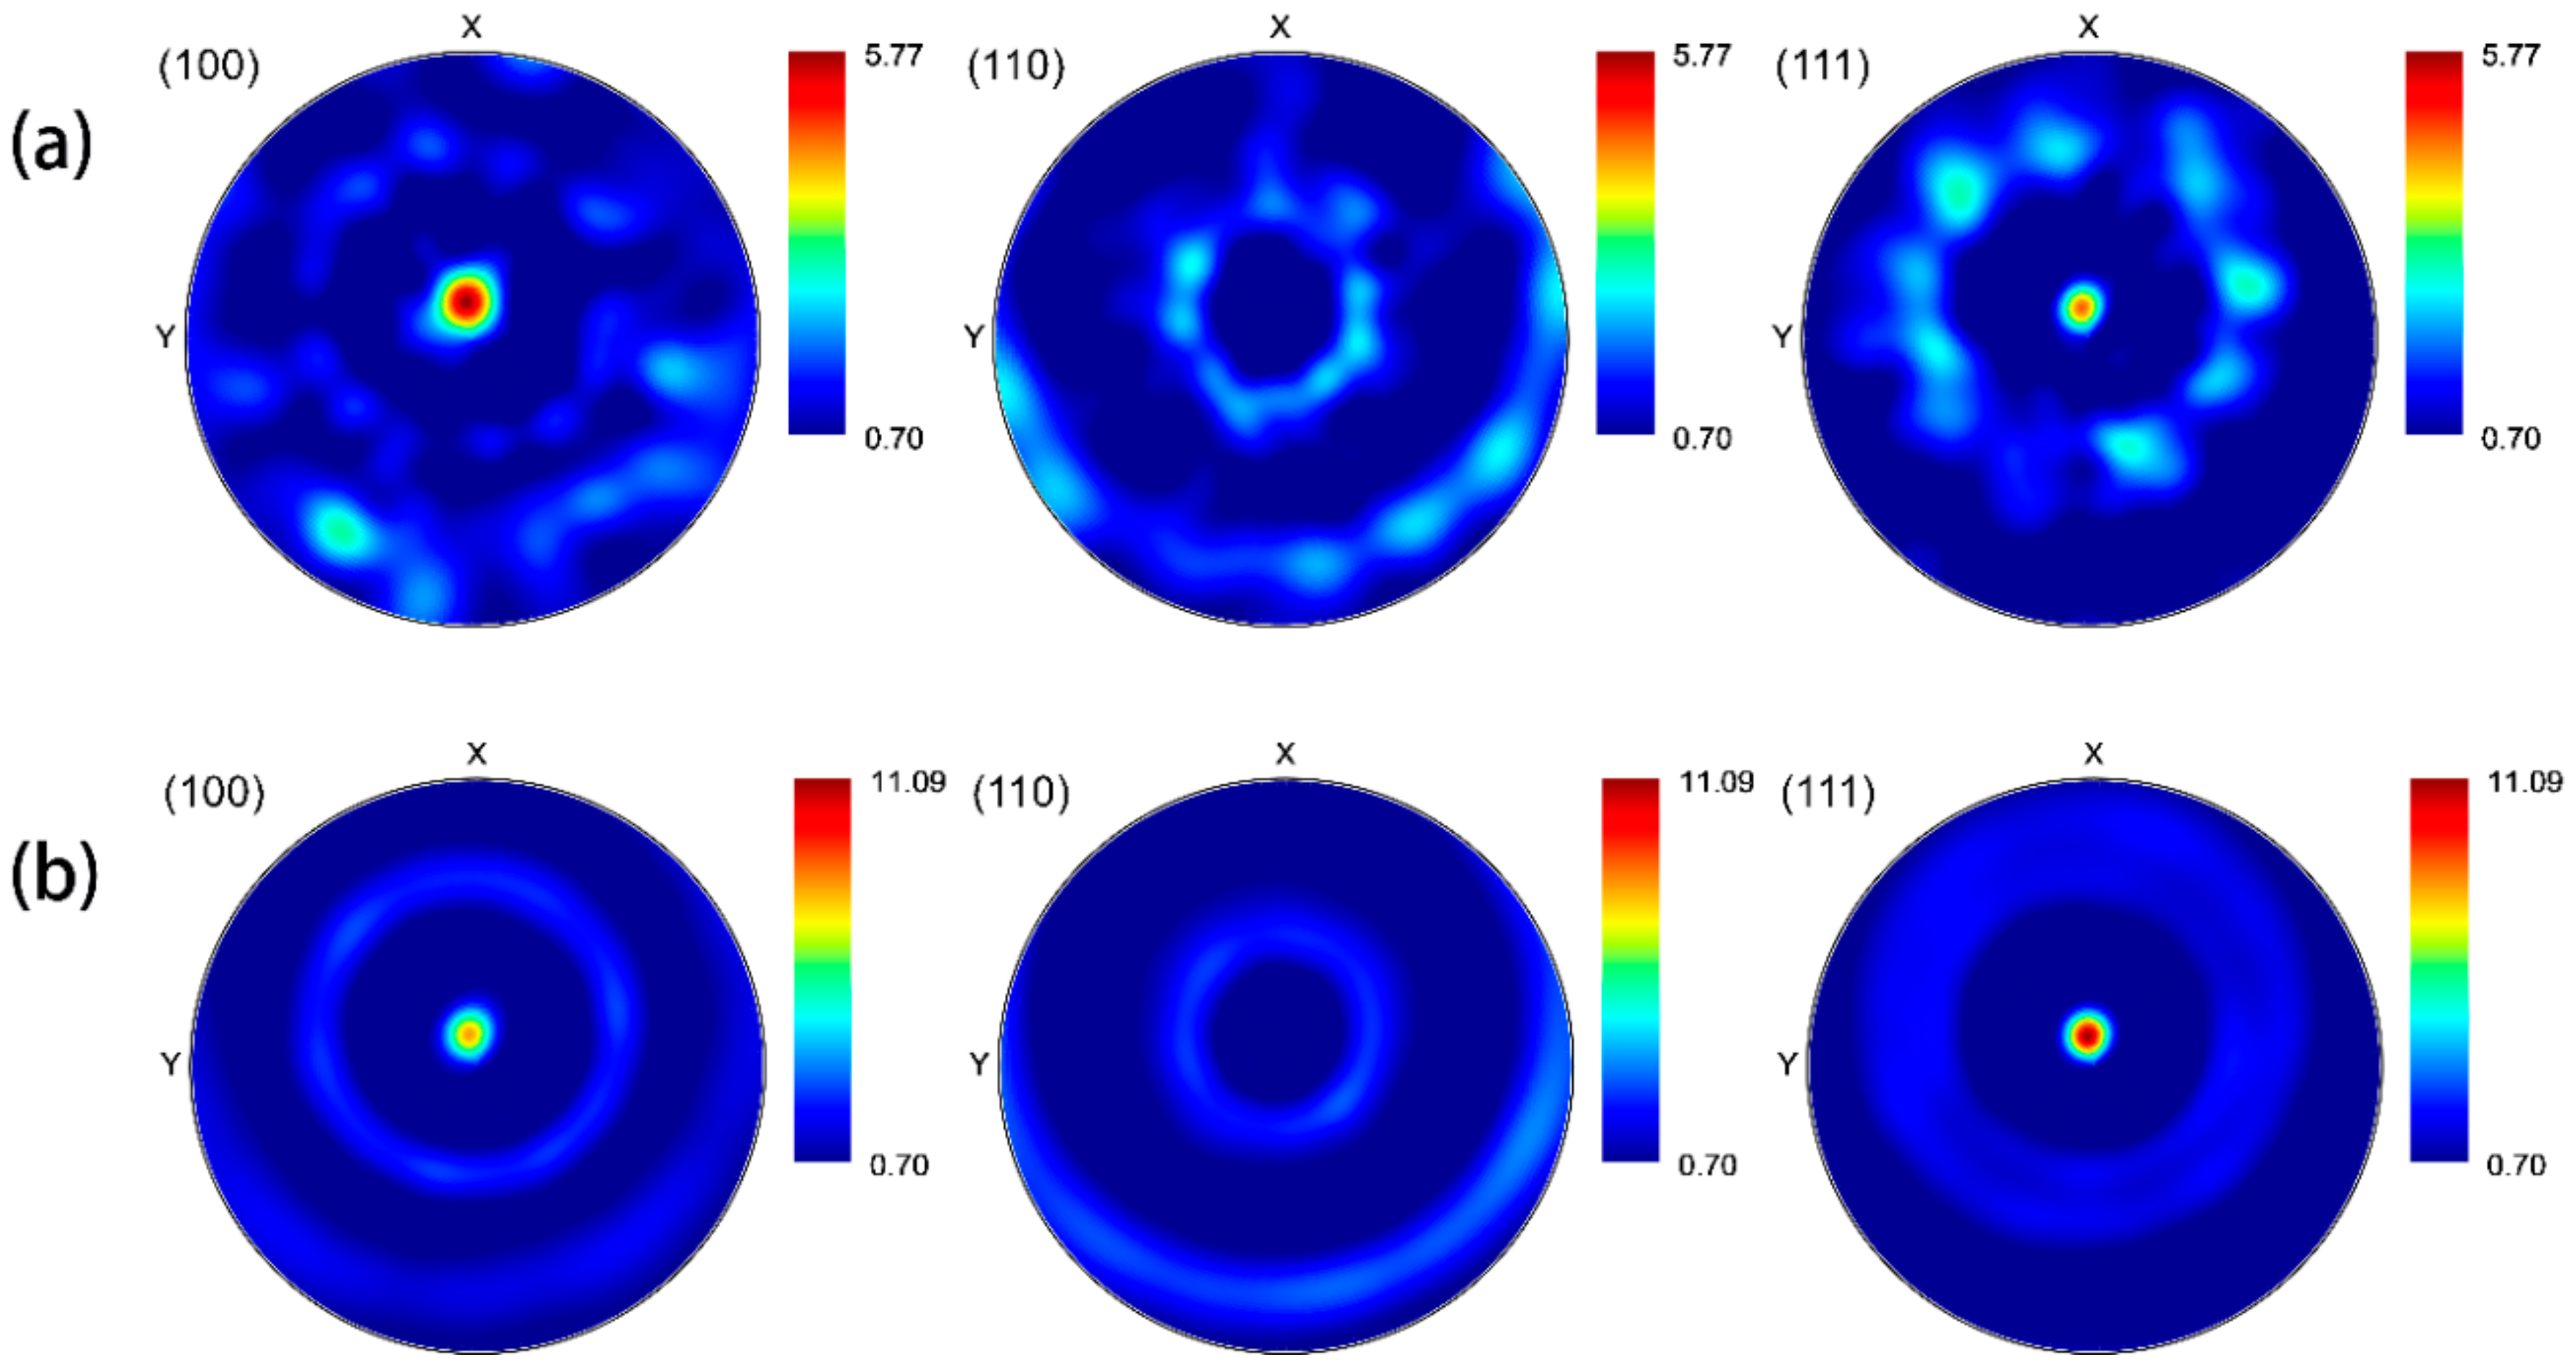
The micro-scale model, created as the sub-model of the macro-model, is located ahead of the crack tip, as shown in Figure 3. Moreover, the representative volume element (RVE) model containing 125 grains, as displayed in Figure 4a, is used to represent the micro-scale model. The distribution of grain sizes from the EBSD experiment is presented in Figure 4, and the average grain size is 11 μm. The orientations of 125 grains within the RVE model are extracted from EBSD results. The comparison between the orientation distributions of the RVE model and the fatigue specimen is shown in Figure 5, indicating that the orientation distribution of the RVE model is similar to that of the fatigue specimen.
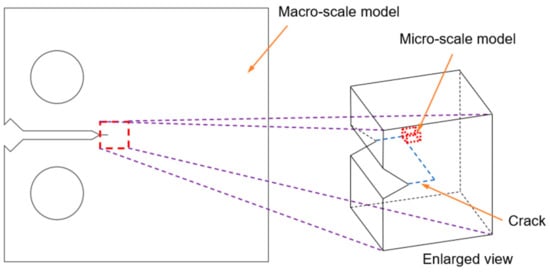
Figure 3.
Schematic diagrams of the position of the micro-scale model.

Figure 4.
(a) Representative volume element model representing the micro-scale model; (b) distribution of grain sizes.
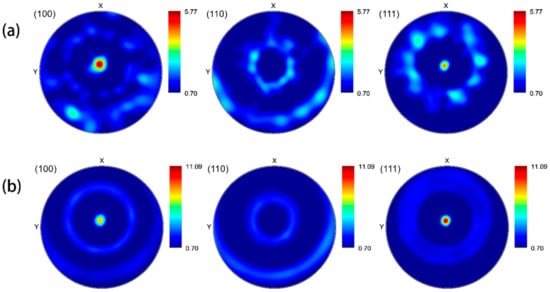
Figure 5.
Comparison between the orientation distributions of (a) the RVE model and (b) the fatigue specimen.
3.2. Constitutive Models and Parameter Determination
3.2.1. CPFEM–LCFD Model
The crystal plasticity theory shows that crystalline slip results in plastic deformation, and the stretching and rotation of lattice lead to elastic deformation. The total deformation gradient F is accordingly decomposed into elastic and plastic parts:
in which Fe is the elastic part of the total deformation gradient F, and Fp is the plastic part. Moreover, the plastic velocity gradient Lp, used to describe the plastic flow of each individual grain, is given by the following equation:
where is the slipping rate of the α-th slip system; and are the slip direction and slip plane normal, respectively; denotes the total number of slip systems.
To describe the strain–stress response of damaged materials, the stress in the constitutive equation for undamaged materials is replaced by the effective stress that is defined as follows [25]:
where σ is the Cauchy stress tensor and D is the damage factor. As a result, the effective resolved shear stress is given by the following equation:
where is the effective resolved shear stress of the α-th slip system; is the resolved shear stress; is the Schmid tensor that projects the stress tensor onto the slip system; D is the damage factor.
Crystallographic slip occurs on the slip system, and the slipping rate follows the following flow rule:
in which is the back stress on the α-th slip system; is the threshold stress; K and n are the material constants; <•> is the Macaulay brackets, namely <•> = Max (x, 0).
The evolution of back stress in Equation (5) is expressed by the following equation [26]:
where r1 and r2 are material constants.
It is considered that both the forest dislocation and dislocation debris contribute to the threshold stress [27,28,29]. Thus, the threshold stress is given by the following equation [29]:
where τ0 is the initial threshold stress; is the stress caused by forest dislocation; is the stress resulting from dislocation debris. Furthermore, and are calculated by the following equations [29]:
where b is the Burgers vector and is set to 2.86 × 10⁻¹⁰ m according to the work of Aoba et al. [30]; μ is the interaction constant; G is the shear modulus; Lαβ is the latent hardening interaction; is the forest dislocation density on the β-th slip system; kdeb is the material constant; ρdeb is the dislocation debris density. Here the initial dislocation density is set to 1 × 10⁹ m−2 according to the work of Pesin et al. [31]. Though the latent hardening interaction Lαβ is a 12 × 12 diagonal symmetry matrix as shown in Table 2, it has only six independent coefficients for FCC materials. These six independent coefficients are determined according to the work of Khadyko et al. [32], and their values are shown in Table 3.
Table 2.
The latent hardening interaction matrix Lαβ. A, B, C and D denote the slip planes , , and , respectively; and the index numbers 1 to 6 represent the slip directions , , , , and , respectively.
Table 3.
Six independent components of the latent hardening interaction matrix Lαβ.
Forest dislocation is decomposed into reversible and irreversible components. To describe the evolution of reversible forest dislocations, each slip system is split into two systems. The slip directions of these two systems are opposite, as shown in Figure 6. As a result, the forest dislocation density is expressed as follows:
where is the density of irreversible forest dislocation on the α-th slip system; is the reversible forest dislocation density of the system ; denotes the reversible forest dislocation density of the system .
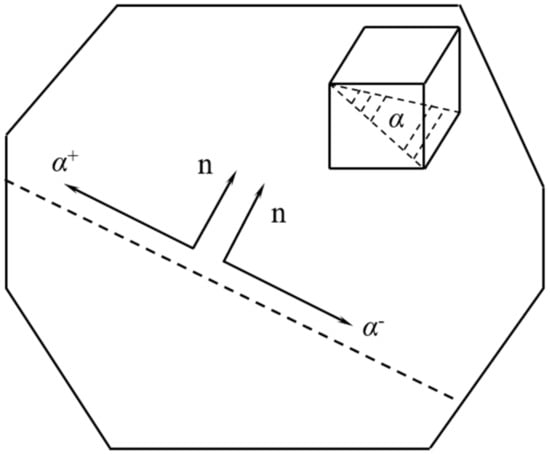
Figure 6.
Schematic illustration of two systems and .
The evolutions of , and are given by the following equations:
(if )
(if )
in which P is the reversibility factor and is set to 0.8 [33]; is the interaction matrix, of which each element is set as 1.0 according to the work of Sharma et al. [29]; k1 is the generation rate of the statistically stored dislocations; k2 is the parameter associated with the dynamic recovery of dislocations; is the total dislocation density when the strain path reverses its direction on the α-th slip system. Moreover, k2 is calculated using the following equation:
in which k is the Boltzmann constant; T is the absolute temperature; is the reference strain rate and is set to 107 s−1 according to the work of Liu [34]; is the drag stress; ψ is the activation energy.
The evolution of dislocation debris is expressed as follows:
in which is the parameter controlling the rate of dislocation recovery.
3.2.2. Chaboche–LCFD Model
In the framework of the Chaboche–LCFD model, the von Mises yield criterion is given by the following equation:
in which S is the deviatoric stress tensor; X is the back stress in the kinematic hardening rule adopted by the Chaboche model; R is the isotropic hardening variable; σY is the yield stress when the value of plastic strain is zero [35]. The back stress X is decomposed into three components as follows [36,37]:
in which Ci and λi are material constants; p is the accumulated plastic strain; εp is the plastic strain tensor.
The isotropic hardening variable R is calculated by the following equation [36,37]:
in which is the isotropic hardening rate and is the limit of the isotropic hardening variable.
By integrating Equation (21) based on the condition of R = 0, the isotropic hardening variable R is formulated as follows [37]:
3.2.3. Low-Cycle Fatigue Damage-Evolution Model
Low-cycle fatigue damage occurs near the fatigue crack [38,39,40], and the fatigue crack continues to propagate forward once the accumulation of fatigue damage reaches the critical value [41]. To describe the fatigue damage accumulation, a low-cycle fatigue damage-evolution model is adopted here and is expressed as follows:
in which is the material constant; η is the stress triaxiality; ξ is the Lode parameter; is the von Mises stress.
3.3. Parameter Determination
The CPFEM–LCFD and Chaboche–LCFD models both contain three elastic parameters C11, C12 and C44, which can be determined by the following equation [42]:
in which E is the elastic moduli and is set to 71,000 MPa; is the Poisson ratio and is set to 0.31.
The fatigue damage during one cycle, derived from the integration of Equation (23), is expressed as follows:
in which N is the number of fatigue cycles.
The initial fatigue damage factor is set as zero, and the fatigue damage factor is 1 when the number of fatigue cycles reaches the value Nf corresponding to the fatigue life. As a consequence, Equation (26) can be obtained by integrating Equation (25):
in which and for the cylindrical specimen under uniaxial fatigue. According to Equation (26), the parameters M and in the damage-evolution model can be calculated based on two stress amplitudes and the corresponding fatigue lives. Furthermore, the results of stress-controlled low-cycle fatigue tests show that the fatigue life at the stress amplitude of 500 MPa is 1832 cycles, and that at the stress amplitude of 560 MPa is 556 cycles.
The rest parameters of the CPFEM–LCFD and Chaboche–LCFD models are determined as follows. Firstly, to gain the simulated stable hysteresis loop, the simulation at a given strain amplitude is conducted under the condition that the trial values are assigned to the undetermined parameters. Subsequently, the comparison between the simulated and measured cyclic stress–strain response is performed till a good match is achieved by fine-turning these parameters. Finally, the comparison between the simulated and measured cyclic stress–strain response at another strain amplitude should be carried out to validate the parameters. The parameters of the CPFEM–LCFD and Chaboche–LCFD models are shown in Table 4 and Table 5, respectively.
Table 4.
Parameters of the CPFEM–LCFD model.
Table 5.
Parameters of the Chaboche–LCFD model.
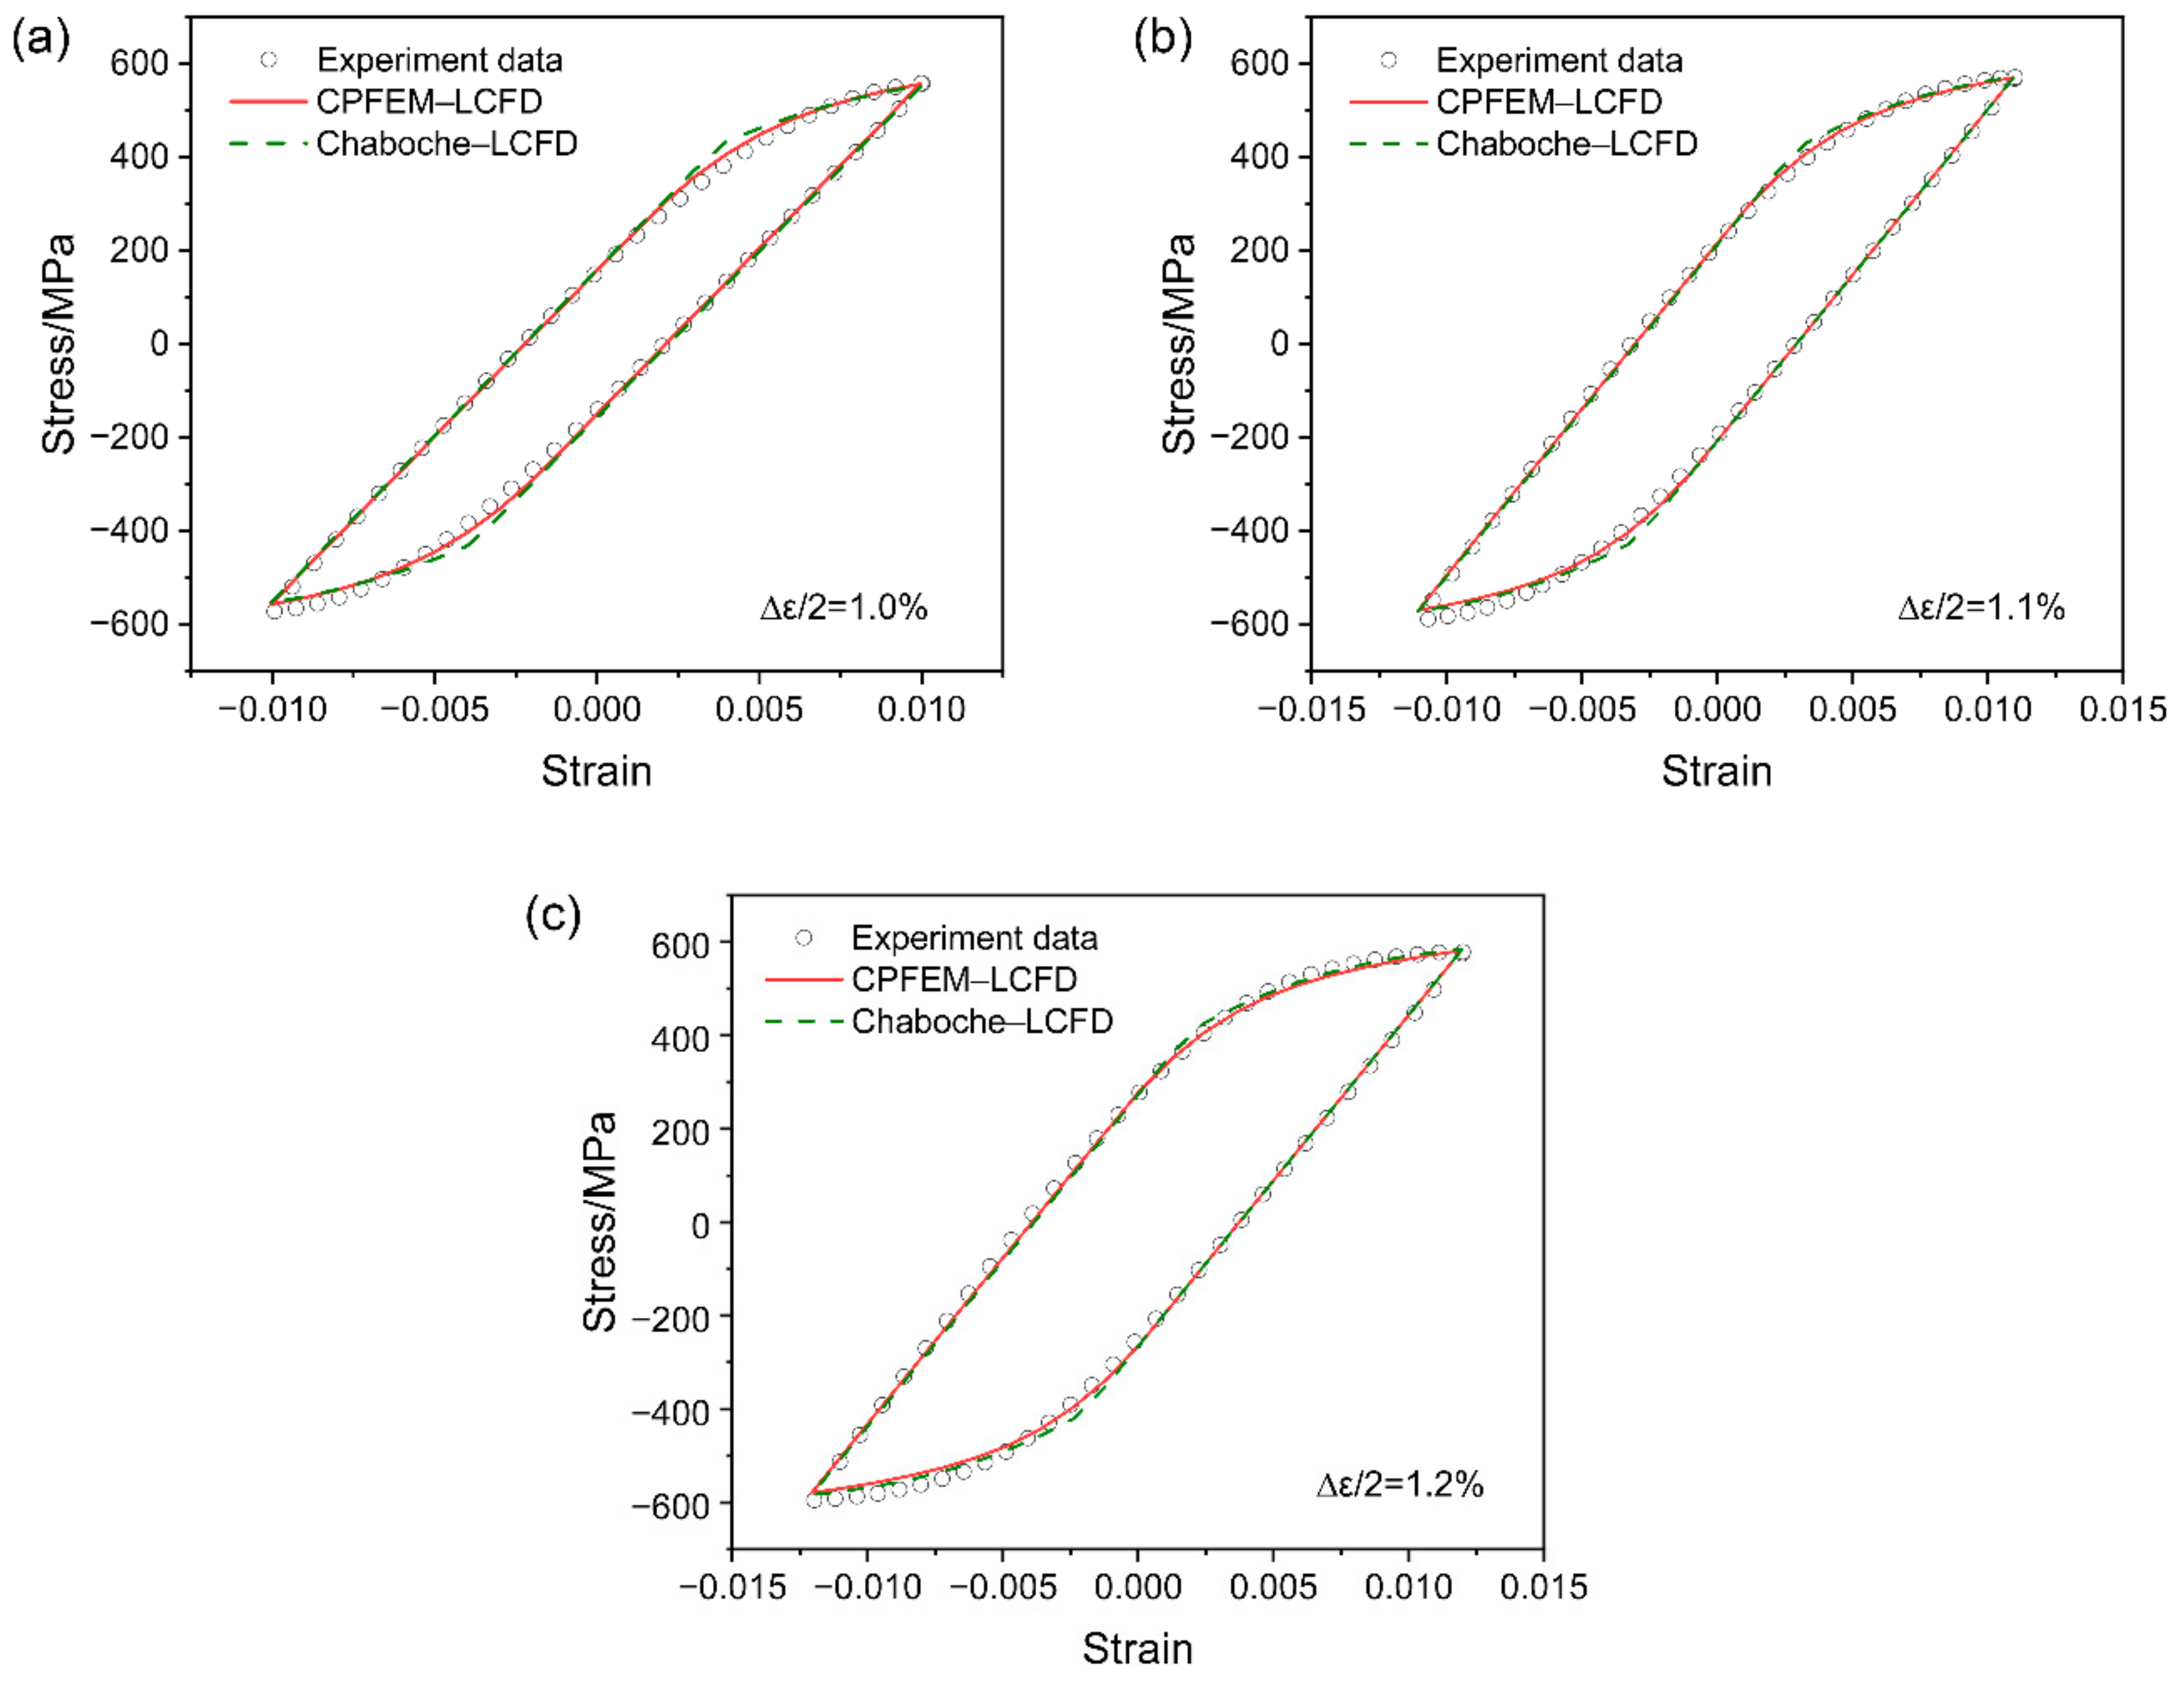
The comparison between the simulated and measured cyclic stress–strain response at the strain amplitudes of 1.0%, 1.1% and 1.2% is shown in Figure 7a–c, respectively. The measured cyclic stress–strain data are obtained from the results of strain-controlled low-cycle fatigue tests. A good agreement is achieved between the simulated and measured cyclic stress–strain response. This indicates that the two models with the calibrated parameters are able to represent the cyclic stress–strain response of 7075 aluminum alloy.
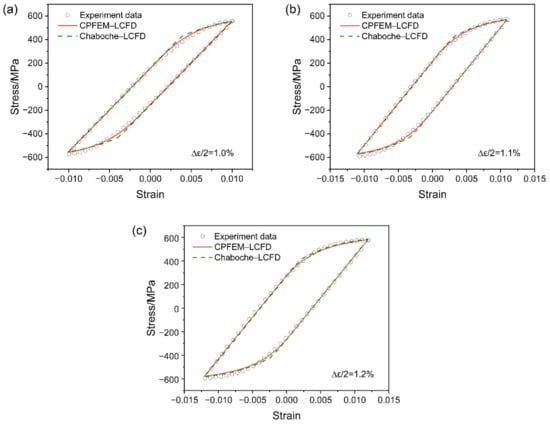
Figure 7.
Comparison between the simulated and measured cyclic stress–strain response at the strain amplitudes of (a) 1.0%, (b) 1.1% and (c) 1.2% for the CPFEM–LCFD and Chaboche–LCFD models.
4. Results and Discussions
4.1. Deformation and Tensile Residual Stress Distribution Ahead of Crack Tip
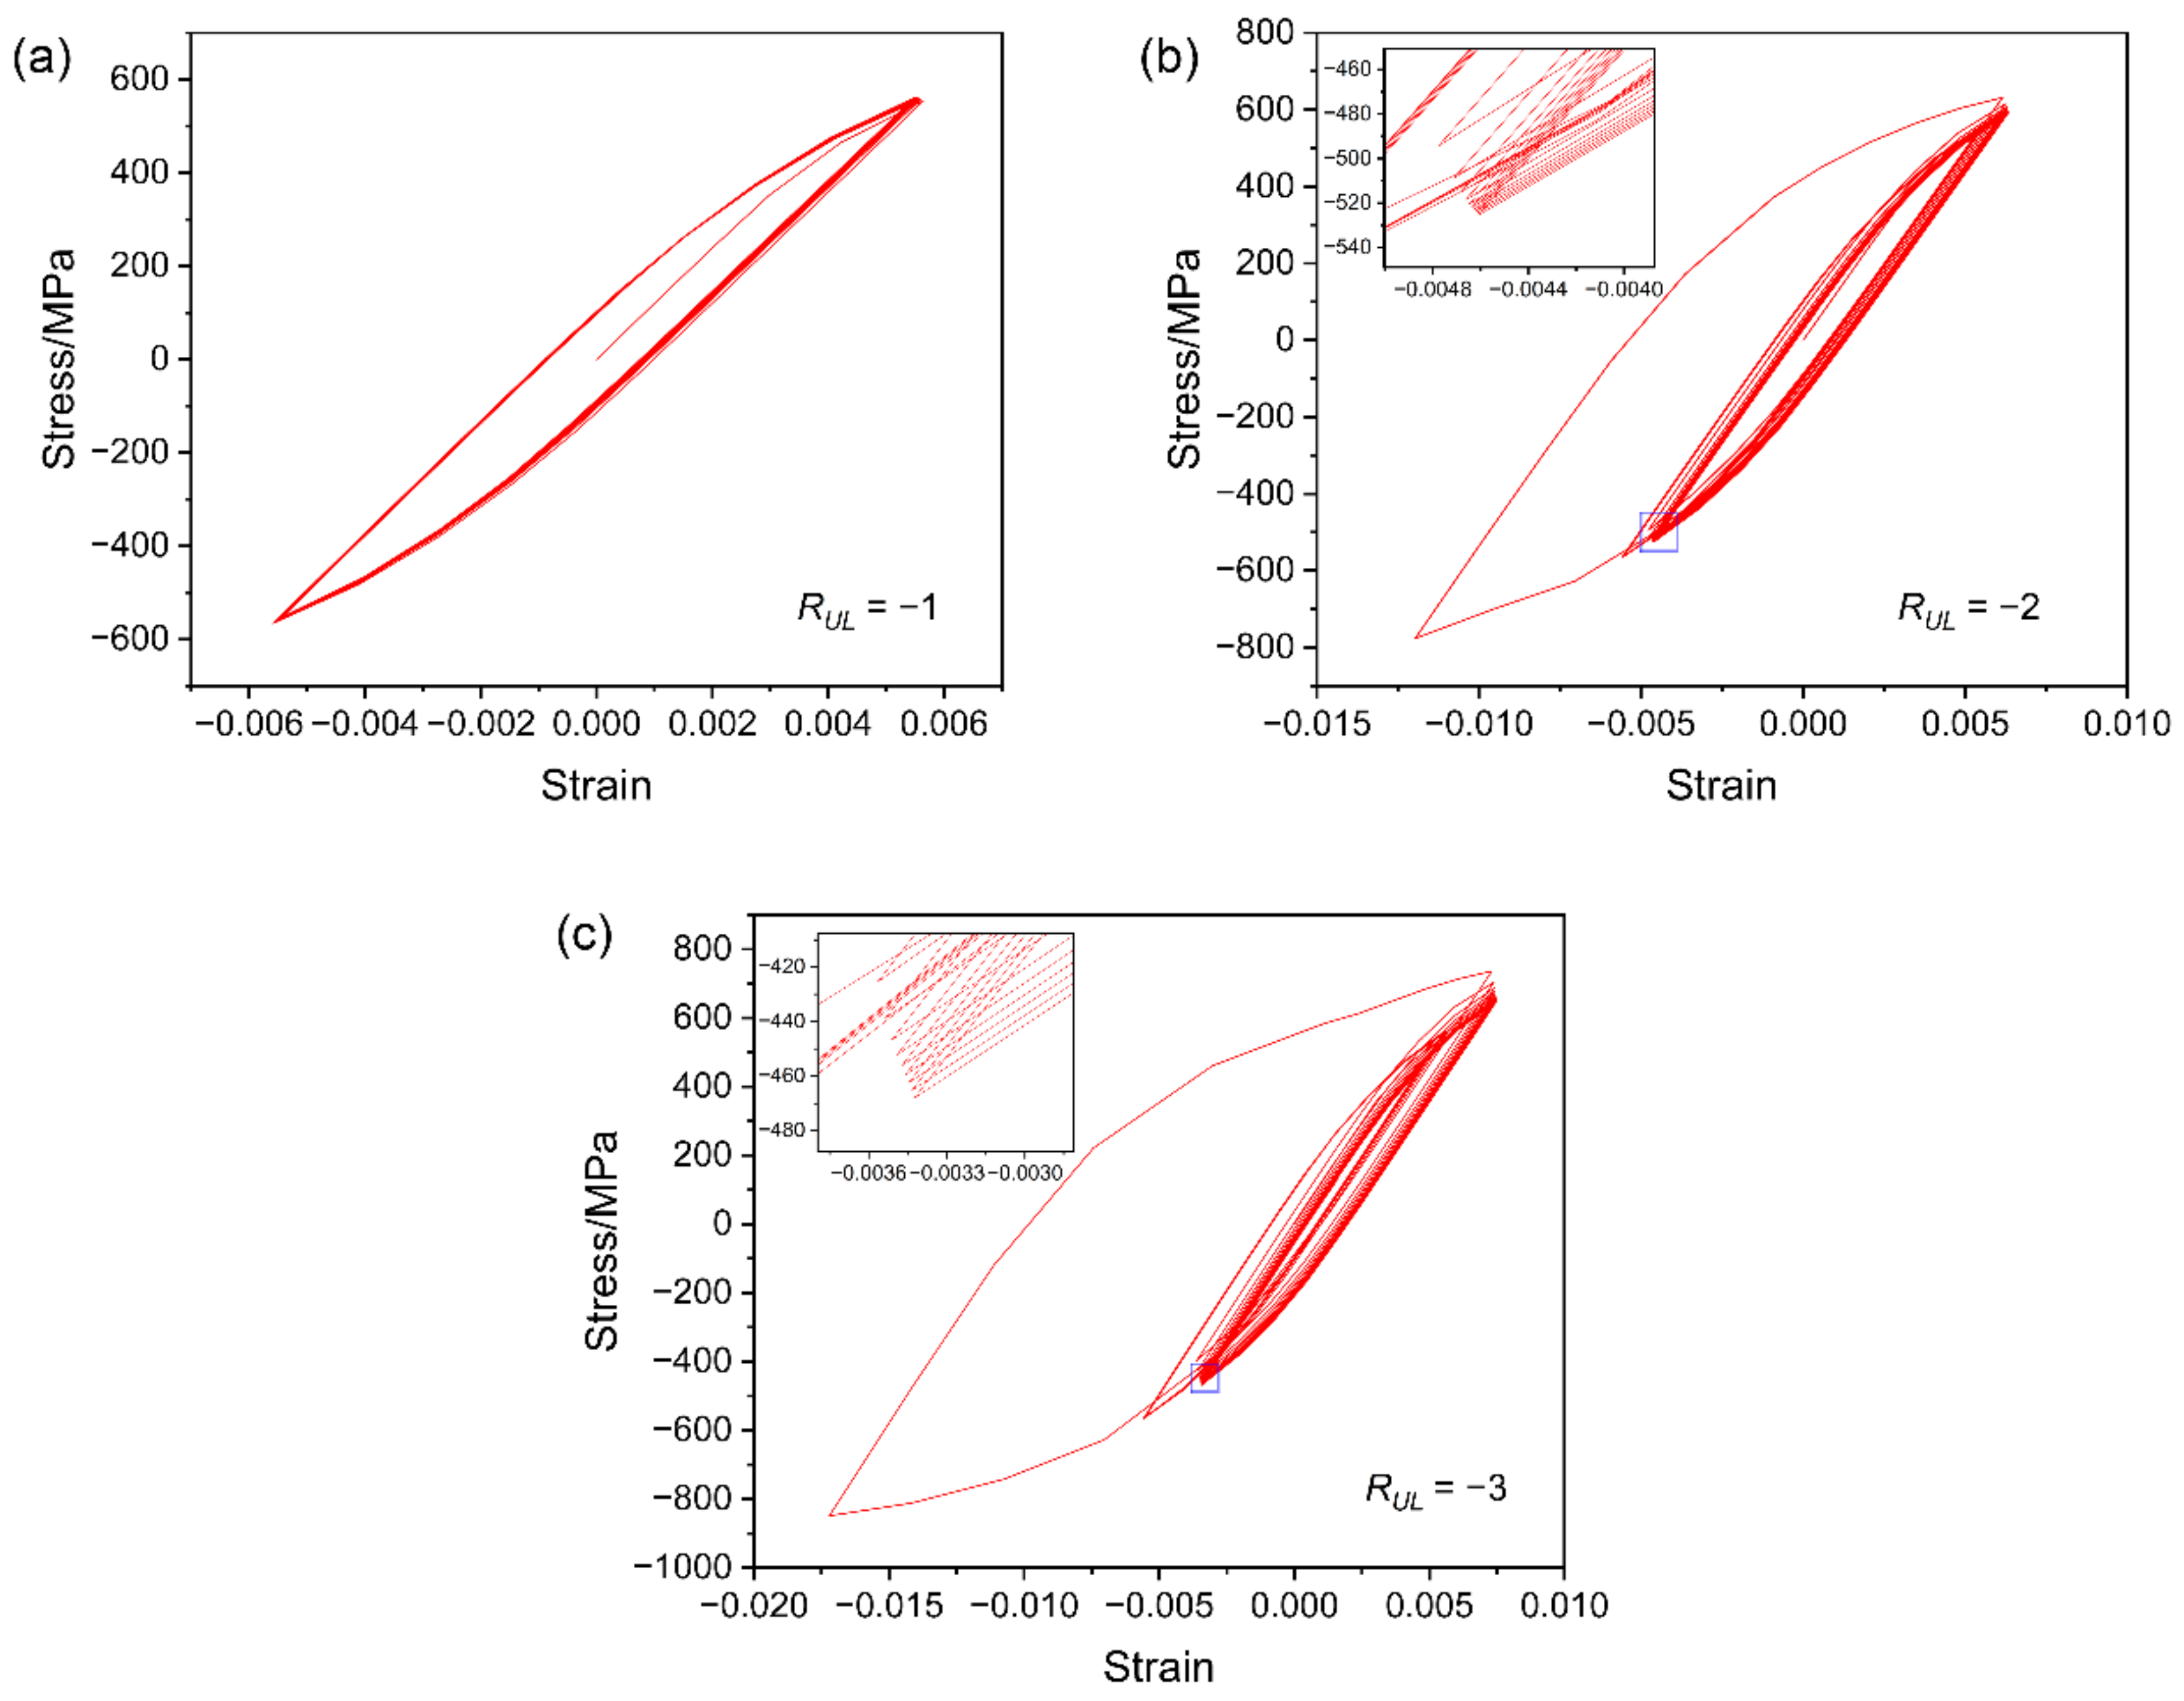
Here the compressive overload ratio (RUL) is defined as the ratio of the compressive overload to the maximum value of the baseline load. The cyclic stress–strain response under the conditions of RUL = −1, RUL = −2 and RUL = −3 is shown in Figure 8a–c, respectively. In the case of RUL = −1, the hysteresis loops are inclined to remain stable in shape. At the compressive overload ratios of RUL = −2 and RUL = −3, the area of the hysteresis loop increases significantly when the compressive overloading is applied, and the hysteresis loops shift to the right as the fatigue cycles continue to increase after the application of the compressive overload, which indicates that the ratchetting deformation occurs ahead of the crack tip. Because the accumulation of ratchetting deformation increases the fatigue damage [43,44], it is considered that the effect of compressive overload accelerates fatigue crack propagation.
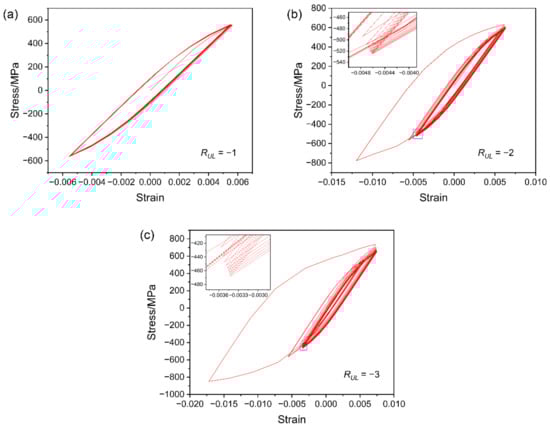
Figure 8.
Cyclic stress–strain response at different compressive overload ratios: (a) RUL = −1; (b) RUL = −2; (c) RUL = −3.
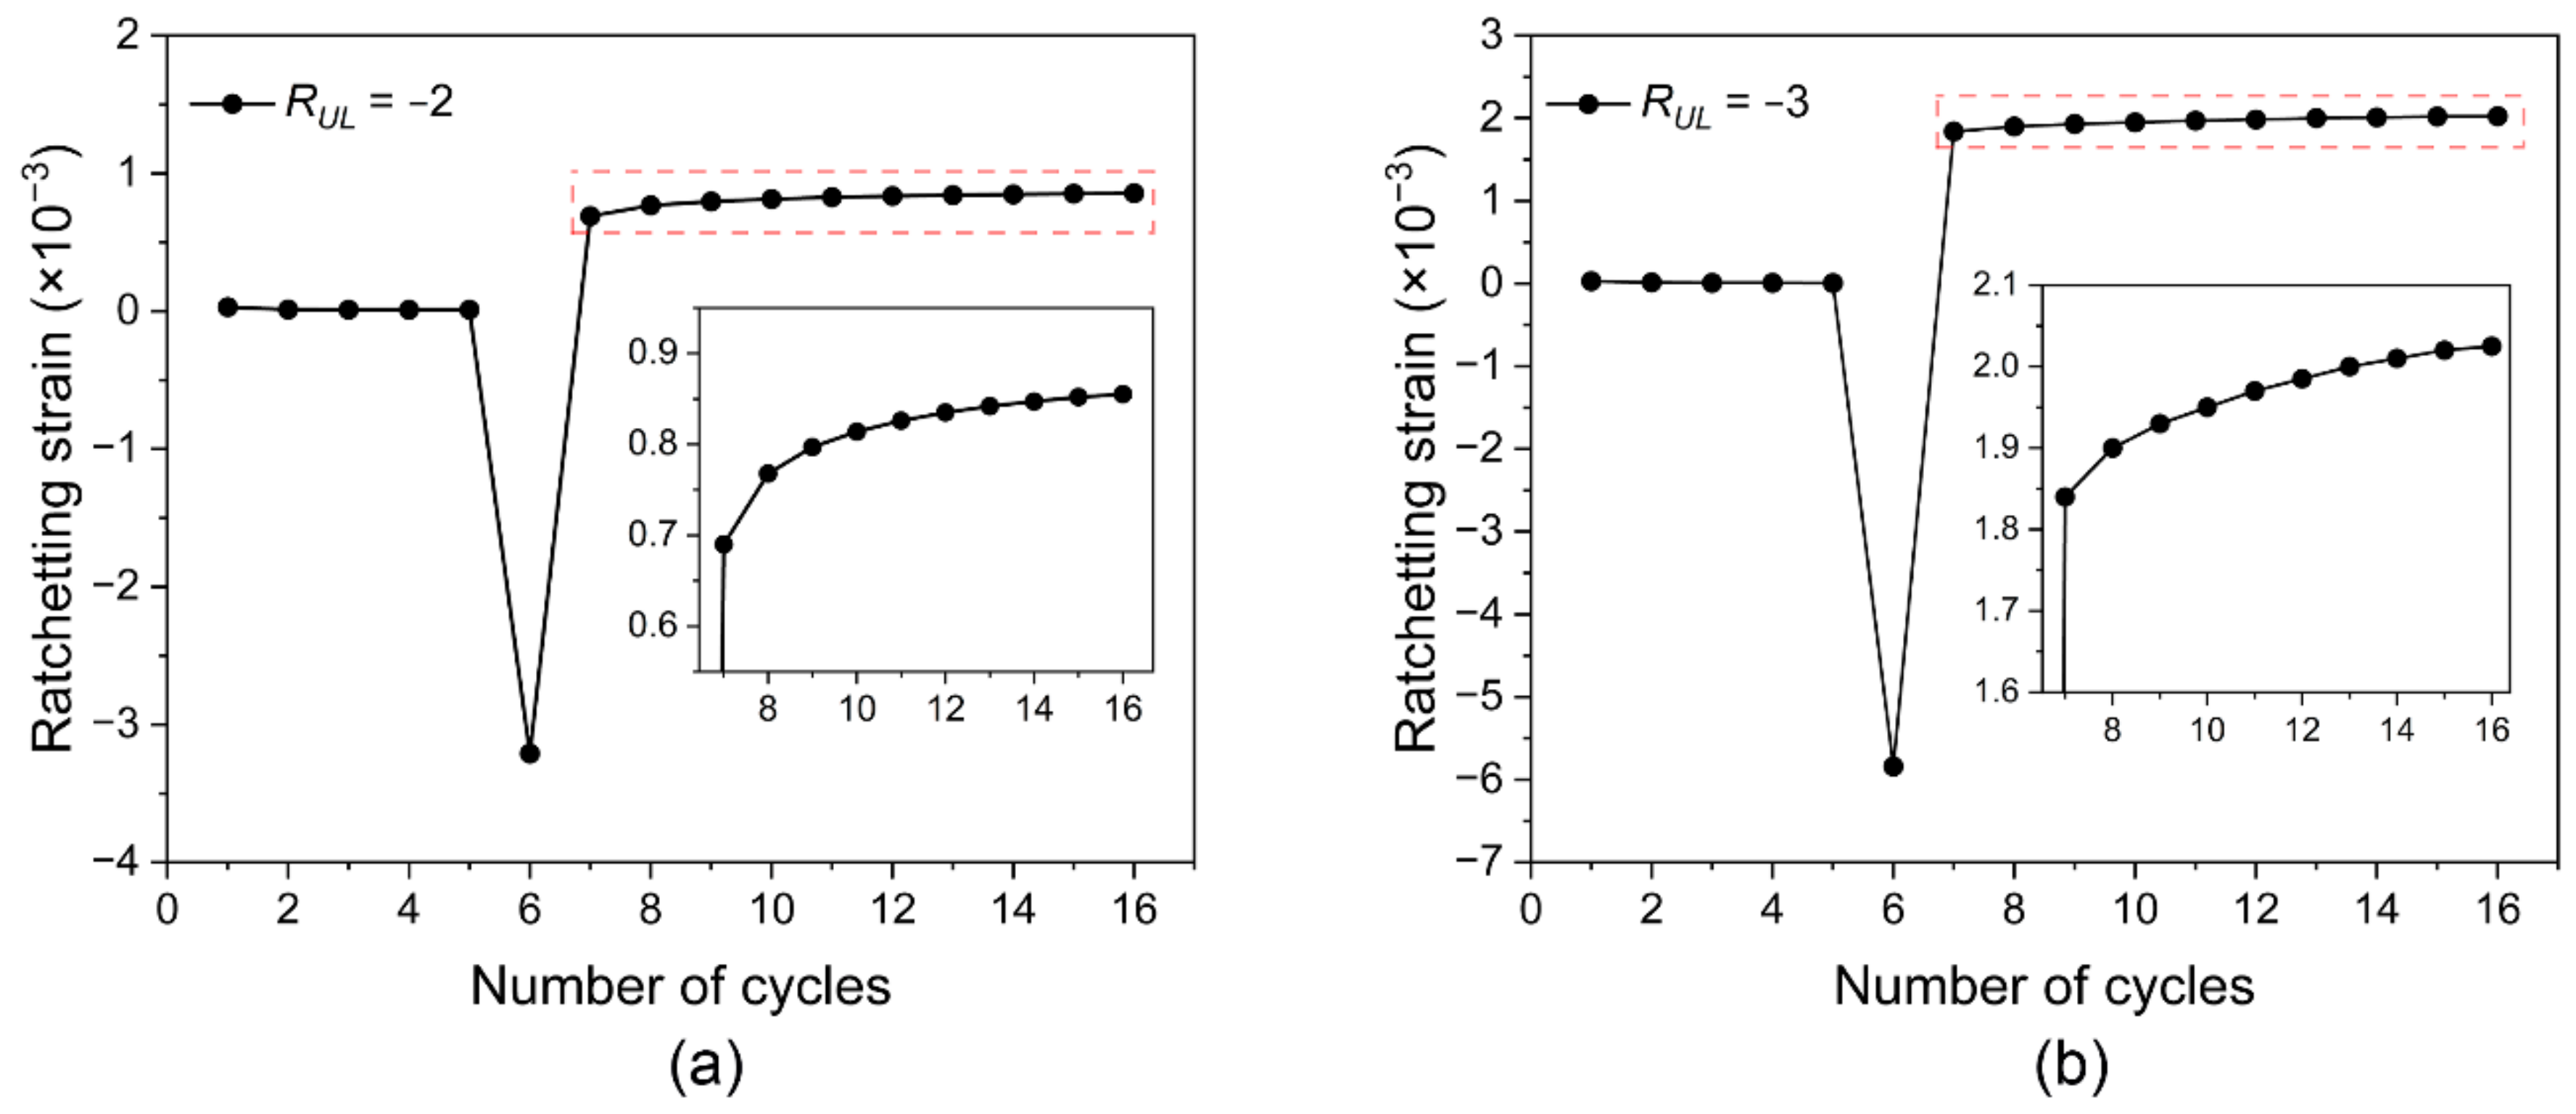
The ratchetting strain is defined as the average of the maximum and minimum axial strains in each cycle [45]. Figure 9 shows the ratchetting strain as a function of the number of fatigue cycles for the cases of RUL = −2 and RUL = −3. In both cases, there is almost no ratchetting strain in each cycle before the application of compressive overloading, which is attributed to the fact that the tensile and compressive strains generated in each cycle is approximately equal at this stage. Furthermore, compressive overloading leads to the significant ratchetting strain in the compression direction at the sixth cycle. It is also found that the ratchetting strain in the tension direction increases with increasing fatigue cycles after the compressive overload. It can be seen from Figure 9a,b that after the compressive overload, the increased ratchetting strain in the tension direction in the case of RUL = −3 is larger than that in the case of RUL = −2, indicating that the acceleration of fatigue crack propagation caused by the effect of compressive overload increases with the level of compressive overload ratio.
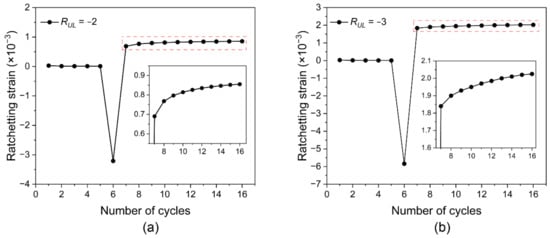
Figure 9.
Ratchetting strain as a function of fatigue cycles at different compressive overload ratios: (a) RUL = −2; (b) RUL = −3.
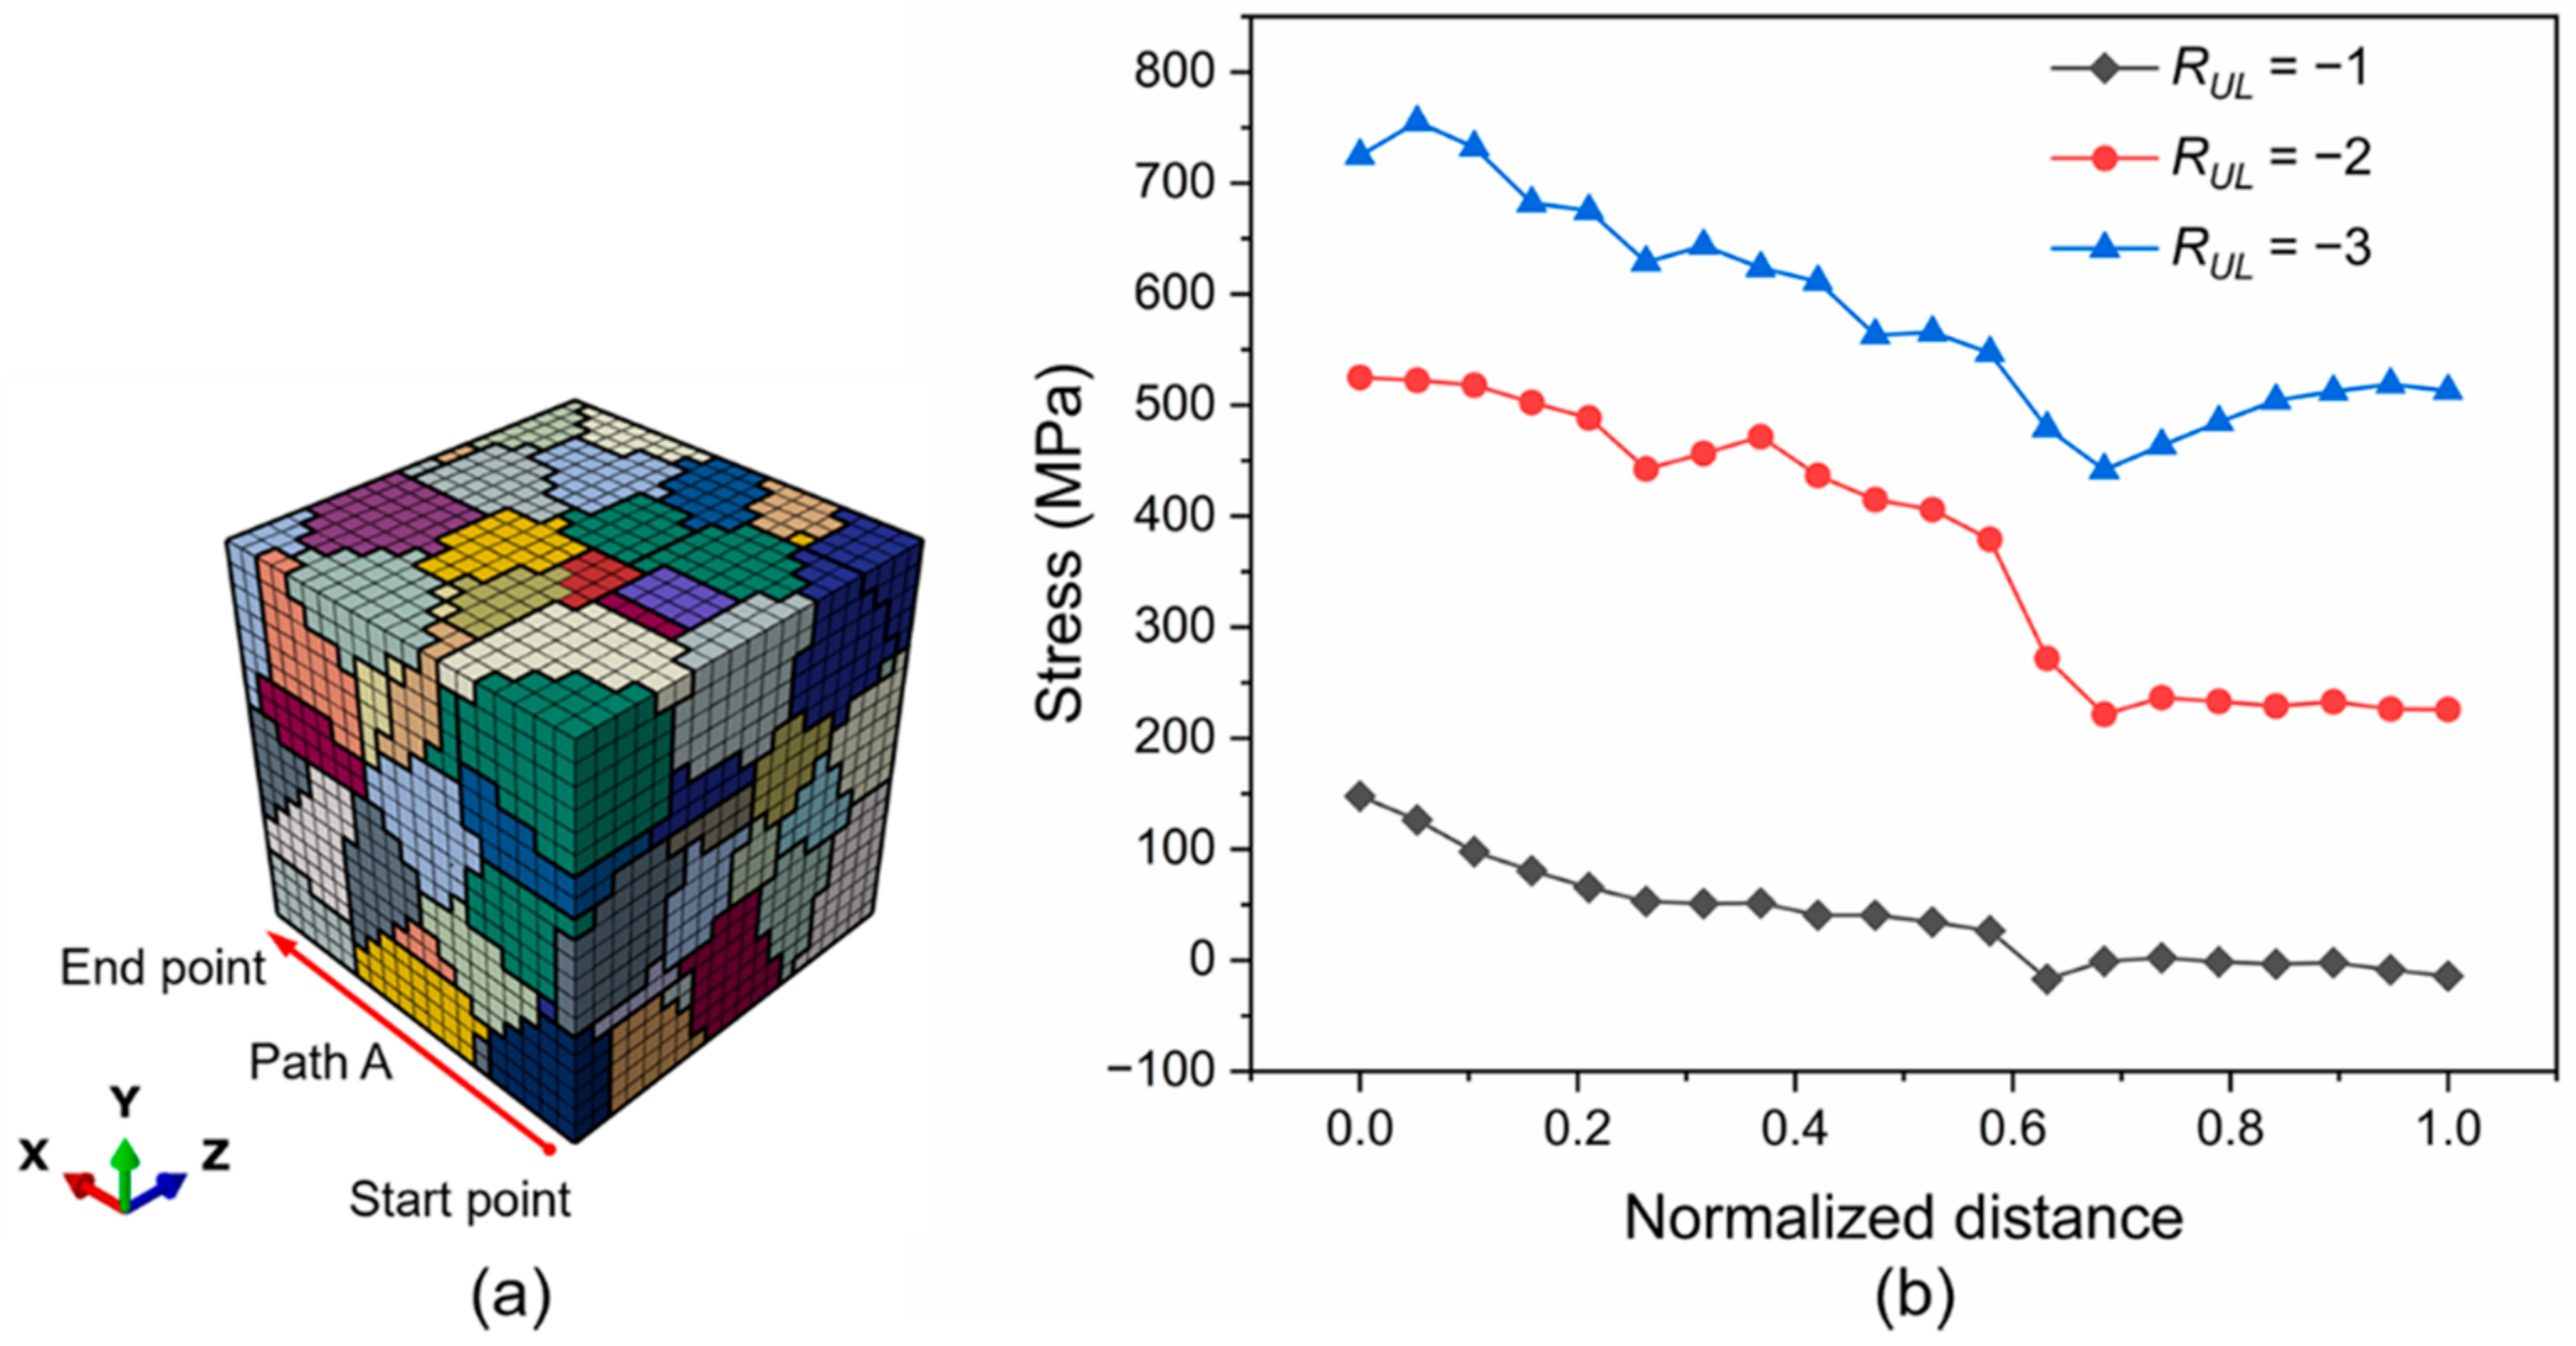
The RVE model has 20 rows of elements along Path A and the number of elements in each row is 400, as shown in Figure 10a. The distribution of the tensile residual stress at the end of the sixth cycle along Path A is shown in Figure 10b, and each data in Figure 10b is the average of the results of a row of elements. It can be observed from Figure 10b that the tensile residual stress increases with the level of compressive overload ratio. Kardomateas and Carlson [46] revealed that compressive overloading generated the local compressive strain ahead of the crack tip, which resulted in the tensile residual stress during unloading. Therefore, the presence of the tensile residual stress is correlated to the plastic deformation. The tensile residual stress and the stress field caused by the applied load are superimposed ahead of the crack tip, which produces the asymmetric stress. This indicates that the tensile residual stress caused by the compressive overload contributes to the ratchetting strain in the tension direction. From the comparison of Figure 9 and Figure 10, it can be considered that at the higher level of compressive overload ratio, the greater tensile residual stress is generated and causes larger ratchetting strains.
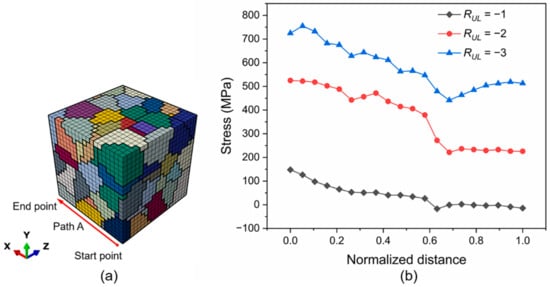
Figure 10.
(a) Schematic diagram of Path A and (b) distribution of the residual stress along Path A at the end of the sixth cycle.
4.2. Damage Evolution Ahead of Crack Tip
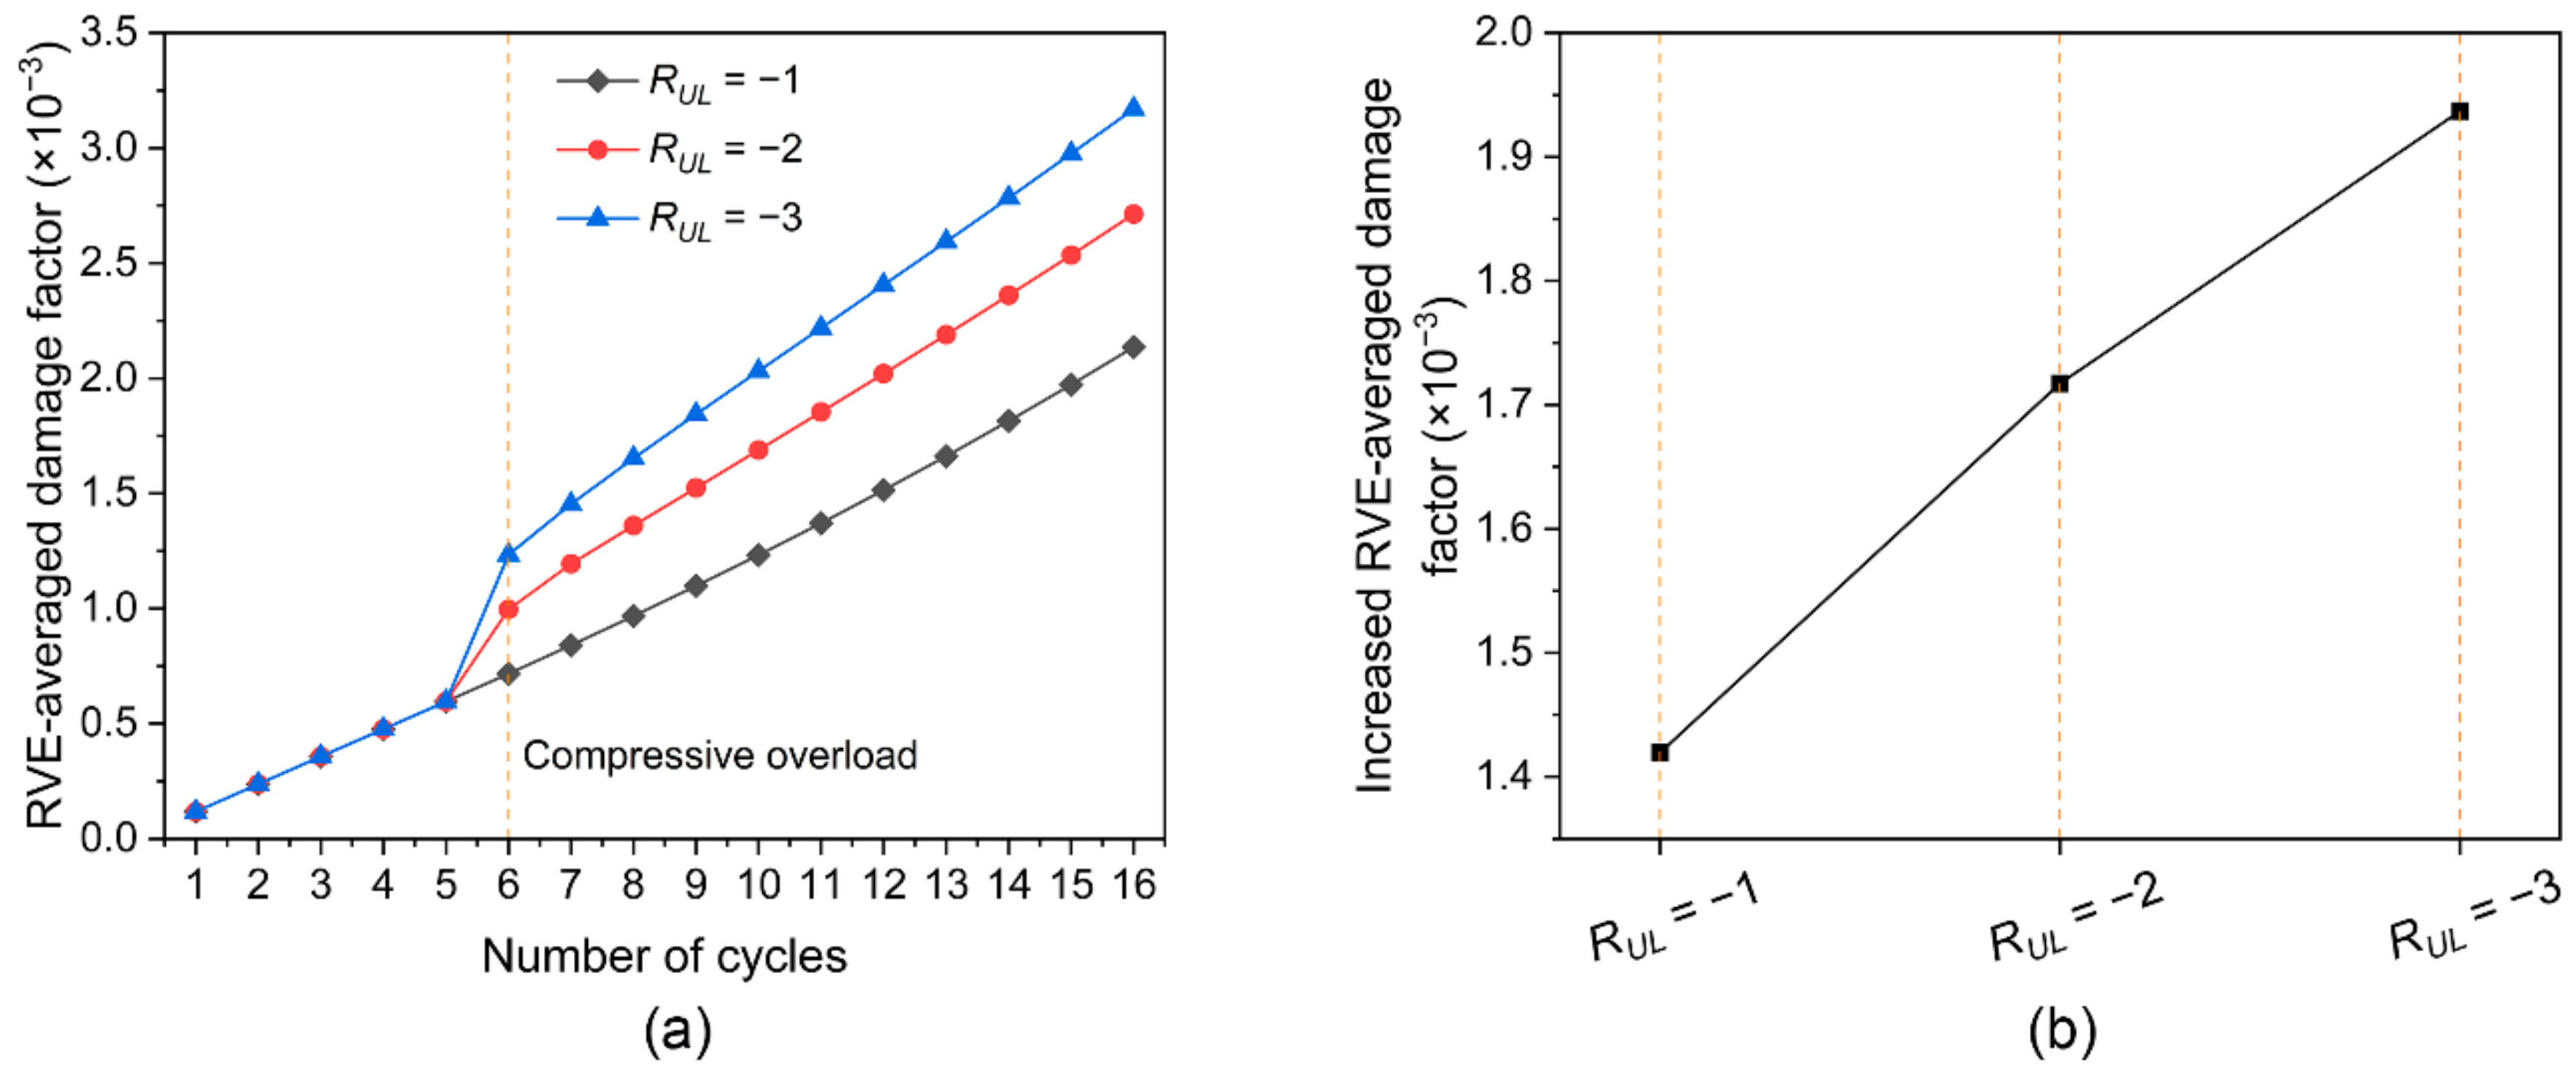
The effect of compressive overload ratio on the evolution of RVE-averaged damage factor is shown in Figure 11a. It can be seen that the RVE-averaged damage factor increases with increasing fatigue cycles for the cases of RUL = −1, RUL = −2 and RUL = −3, indicating that the fatigue damage accumulates ahead of the crack tip in each cycle. In addition, compressive overloading causes the significant fatigue damage in the sixth cycle. However, these three cases have different rates of increase in fatigue damage after the compressive overload. For these three cases, the increase in fatigue damage between the seventh and sixteenth cycles is shown in Figure 11b. it can be found that more fatigue damage is generated at the higher level of compressive overload ratio, indicating that the effect of compressive overload contributes to the accumulation of fatigue damage ahead of the crack tip and consequently accelerates the fatigue crack-propagation rate of 7075 aluminum alloy. Other researchers [6,7] experimentally revealed that the effect of compressive overload accelerated the fatigue crack growth rate of 7075 aluminum alloy, which also indicates that the effect of compressive overload on the acceleration of fatigue damage ahead of the crack tip.
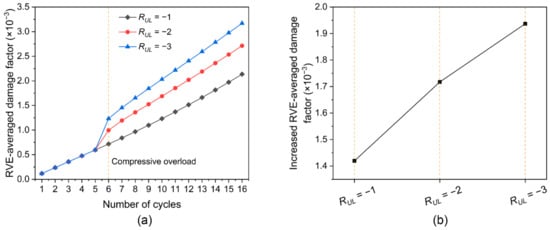
Figure 11.
(a) RVE-averaged damage factor as a function of fatigue cycles and (b) increase in RVE-averaged damage factor within ten cycles after compressive overloading under conditions of RUL = −1, RUL = −2 and RUL = −3.
To investigate whether the effect of compressive overload affects the stress distribution ahead of the crack tip after the application of the compressive overload, the von Mises stress at the tension peak of the seventh cycle is extracted at the integration point of each element within the RVE model. Figure 12 shows the distribution of von Mises stress. It can be found that the von Mises stress distribution is inhomogeneous at different compressive overload ratios. This is correlated to the grain orientation and the distance between the grain and crack tip. Grain orientation can influence the stress distribution [47], and hard grains generally tend to cause stress concentration in comparison with soft grains. Moreover, the stress level increases with the decreasing distance from the crack tip [48]. It can also be found from Figure 12 that the case of RUL = −3 has the largest proportion of high von Mises stress values, followed by the case of RUL = −2 and then the case of RUL = −1. This indicates that the von Mises stress increases with the level of compressive overload ratio, which can be explained by the tensile residual stress. The tensile residual stress together with the applied load can increase the peak value of the stress intensity factor and the corresponding effective stress intensity factor range [10,11].
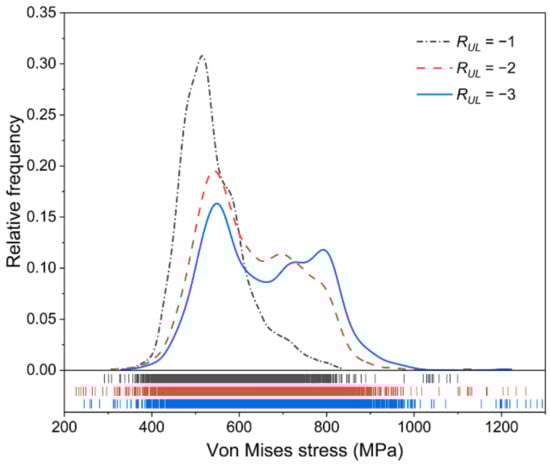
Figure 12.
Von Mises stress distribution at the tension peak of the seventh cycle under conditions of RUL = −1, RUL = −2 and RUL = −3.
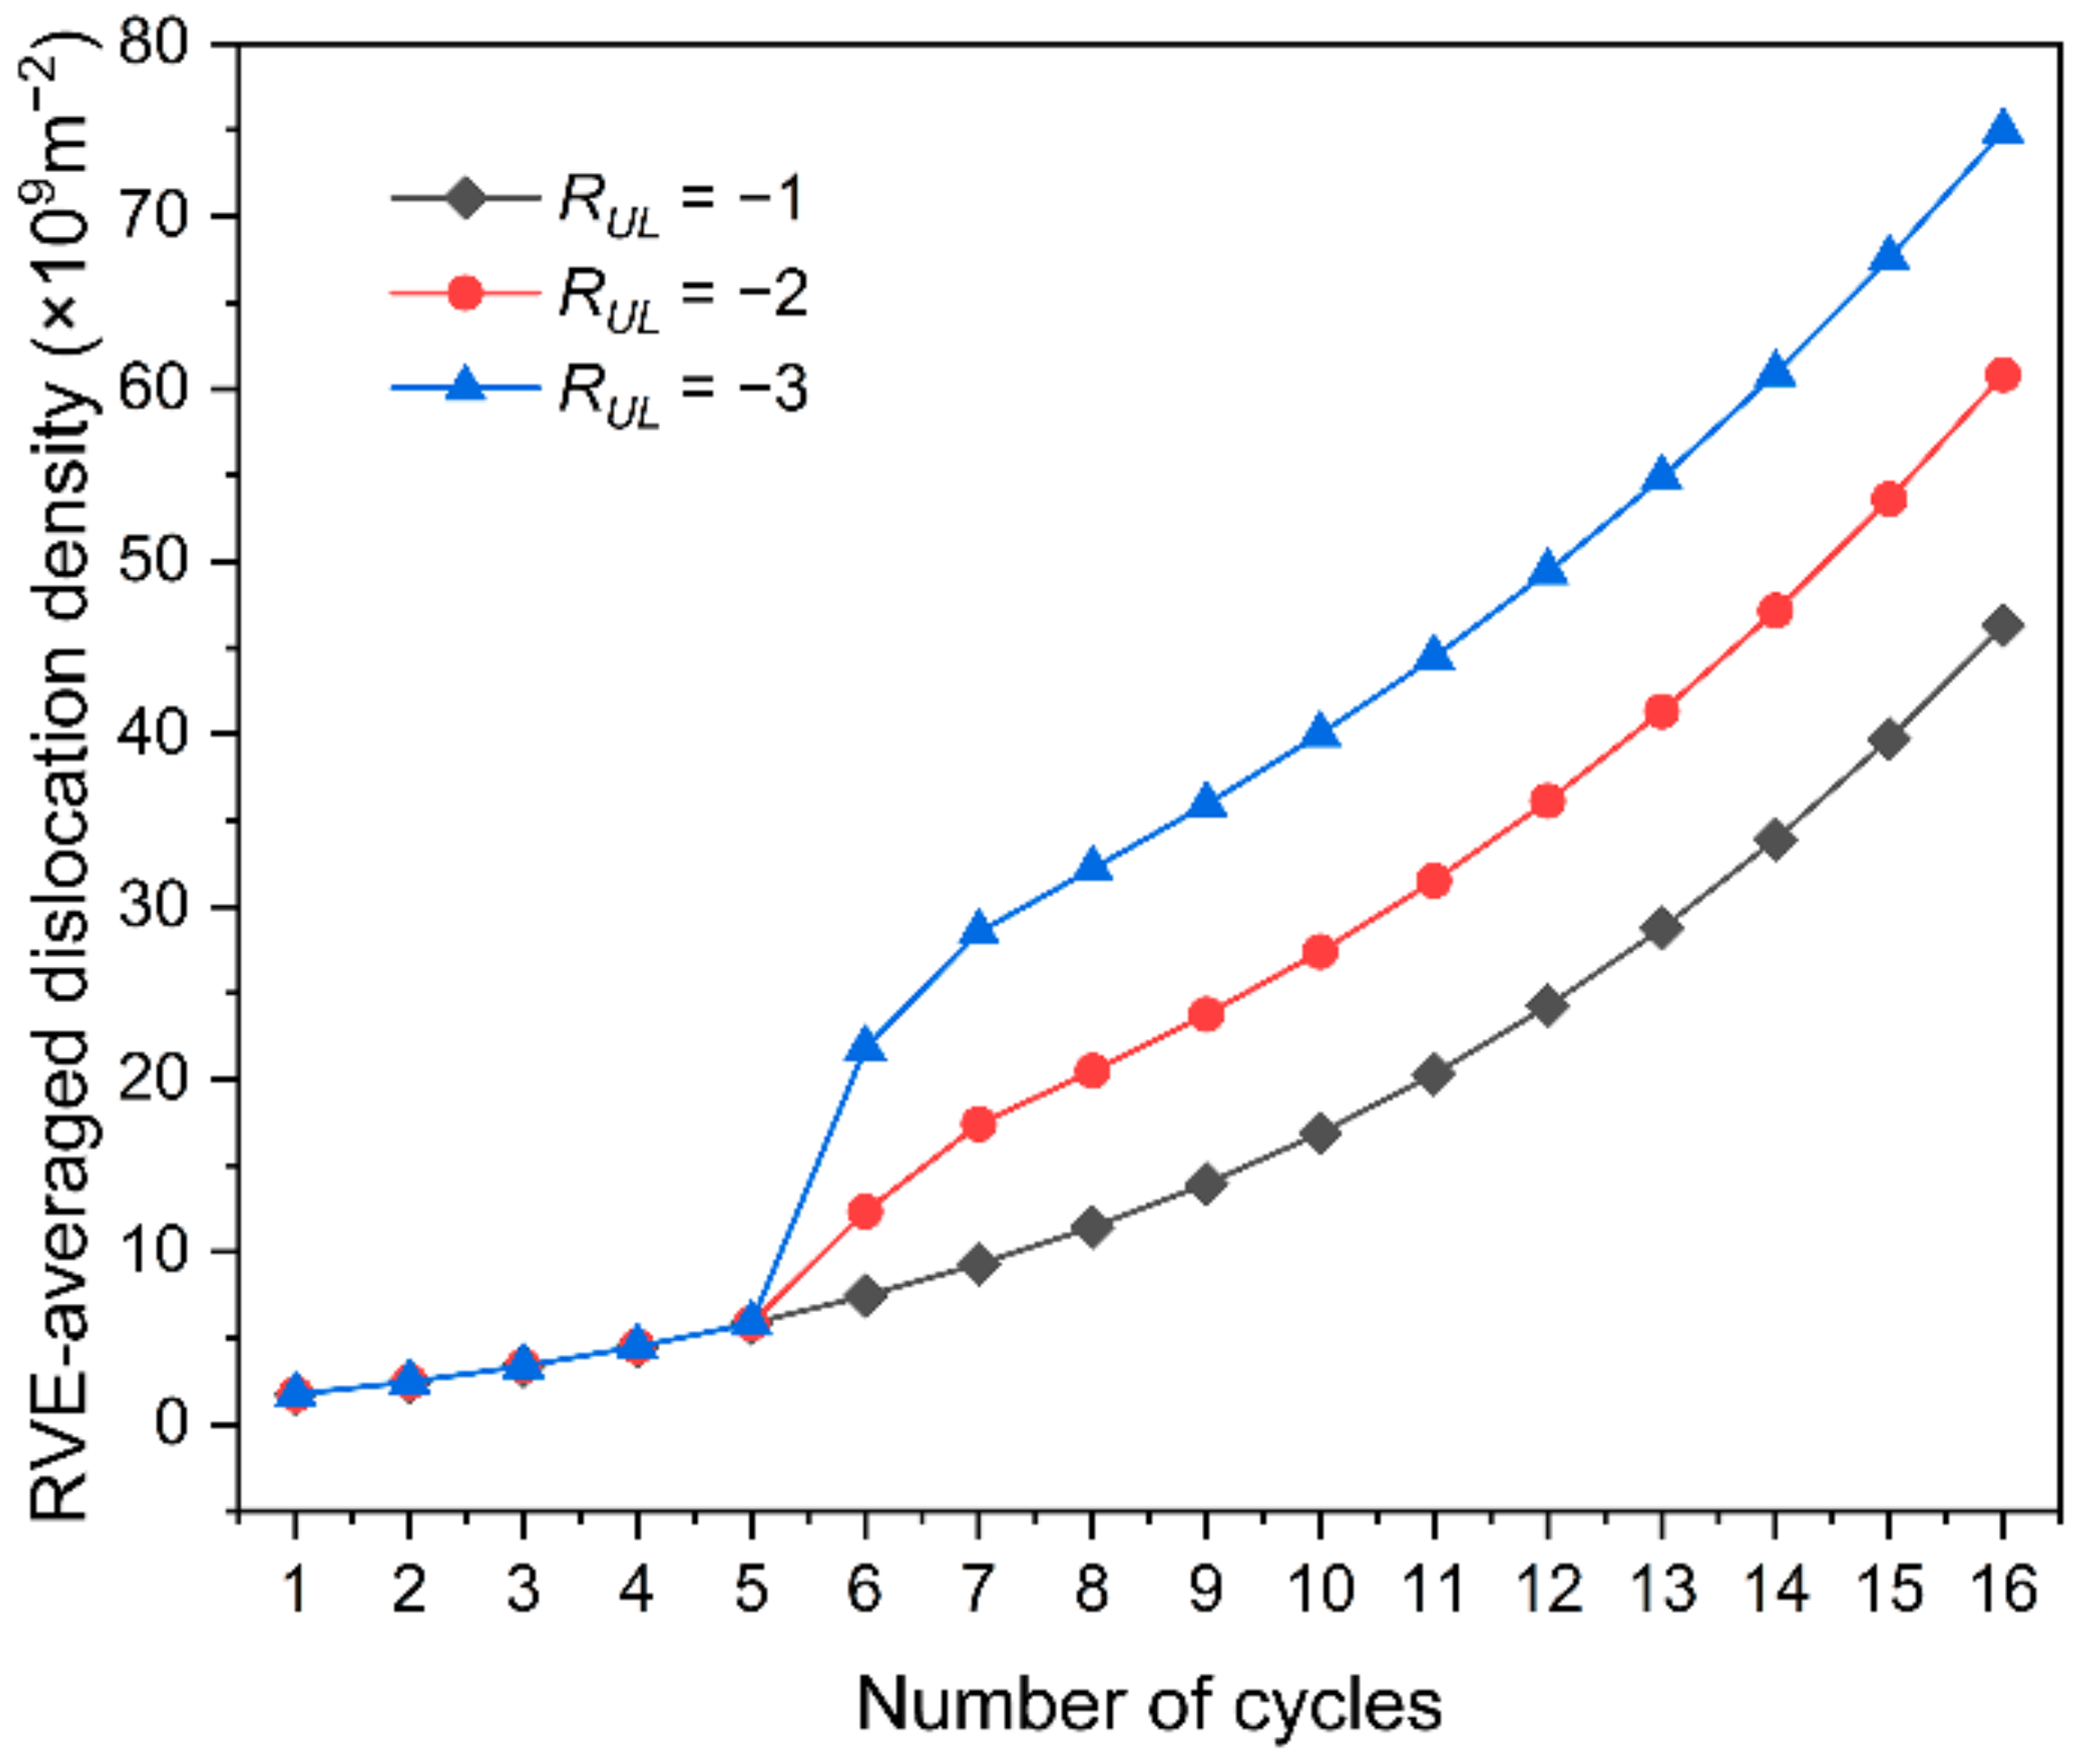
Figure 13 shows the RVE-averaged dislocation density as a function of the number of fatigue cycles. The RVE-averaged dislocation density increases with increasing fatigue cycles under the conditions of RUL = −1, RUL = −2 and RUL = −3, indicating the dislocation density increases under the cyclic load with a single compressive overload. It can also be found that after the application of the compressive overload, the dislocation density increases with the level of compressive overload ratio.
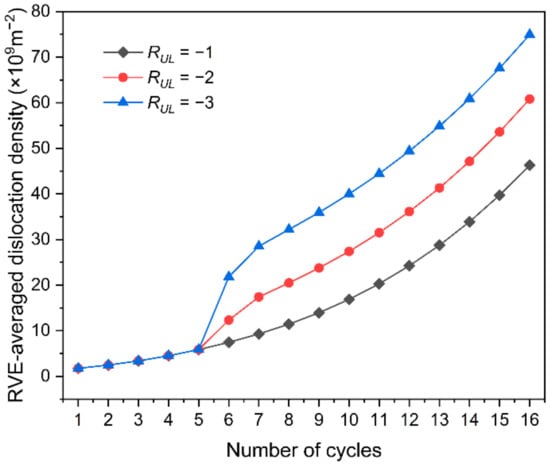
Figure 13.
RVE-averaged dislocation density as a function of fatigue cycles under conditions of RUL = −1, RUL = −2 and RUL = −3.
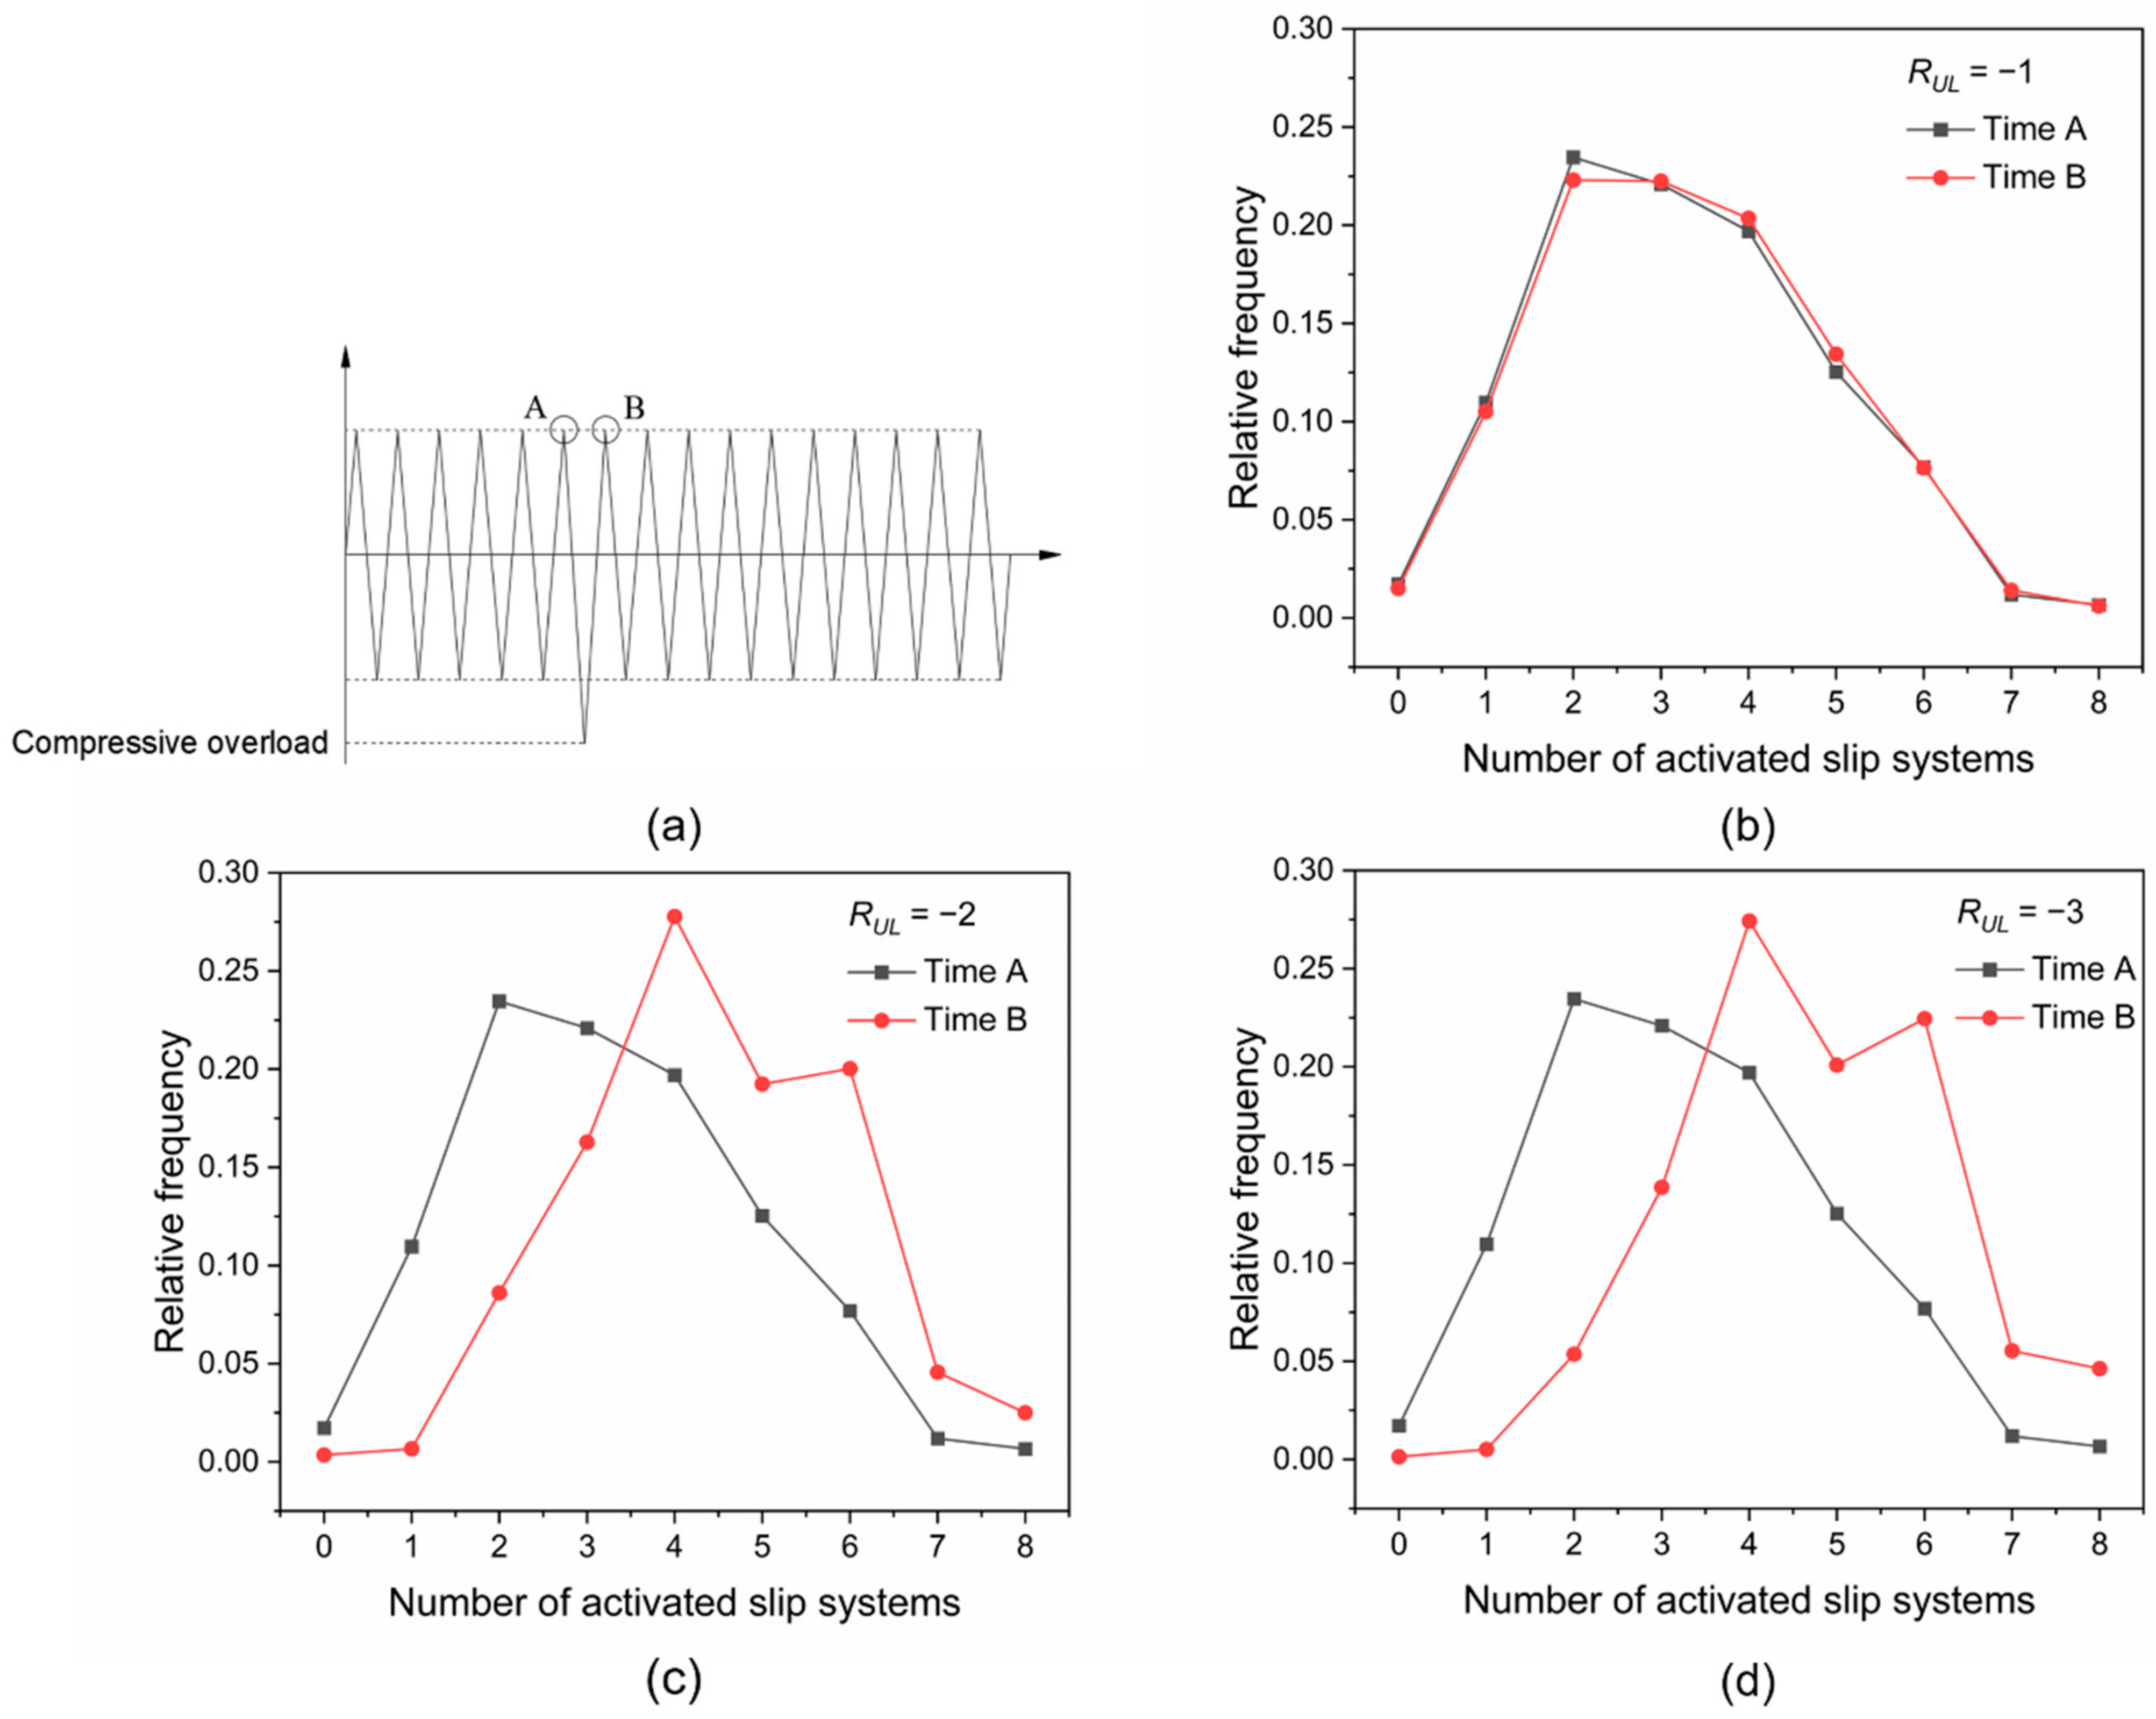
Plastic strain leads to dislocation multiplication and eventually causes an increase in dislocation density [49,50]. Moreover, plastic strain results from the slip on the activated slip systems [51]. Thereby, it is extrapolated that the dislocation density evolution is related to the activated slip systems. To investigate the effect of compressive overload on the number of activated slip systems, the number of activated slip systems in each element of the RVE model is analyzed.
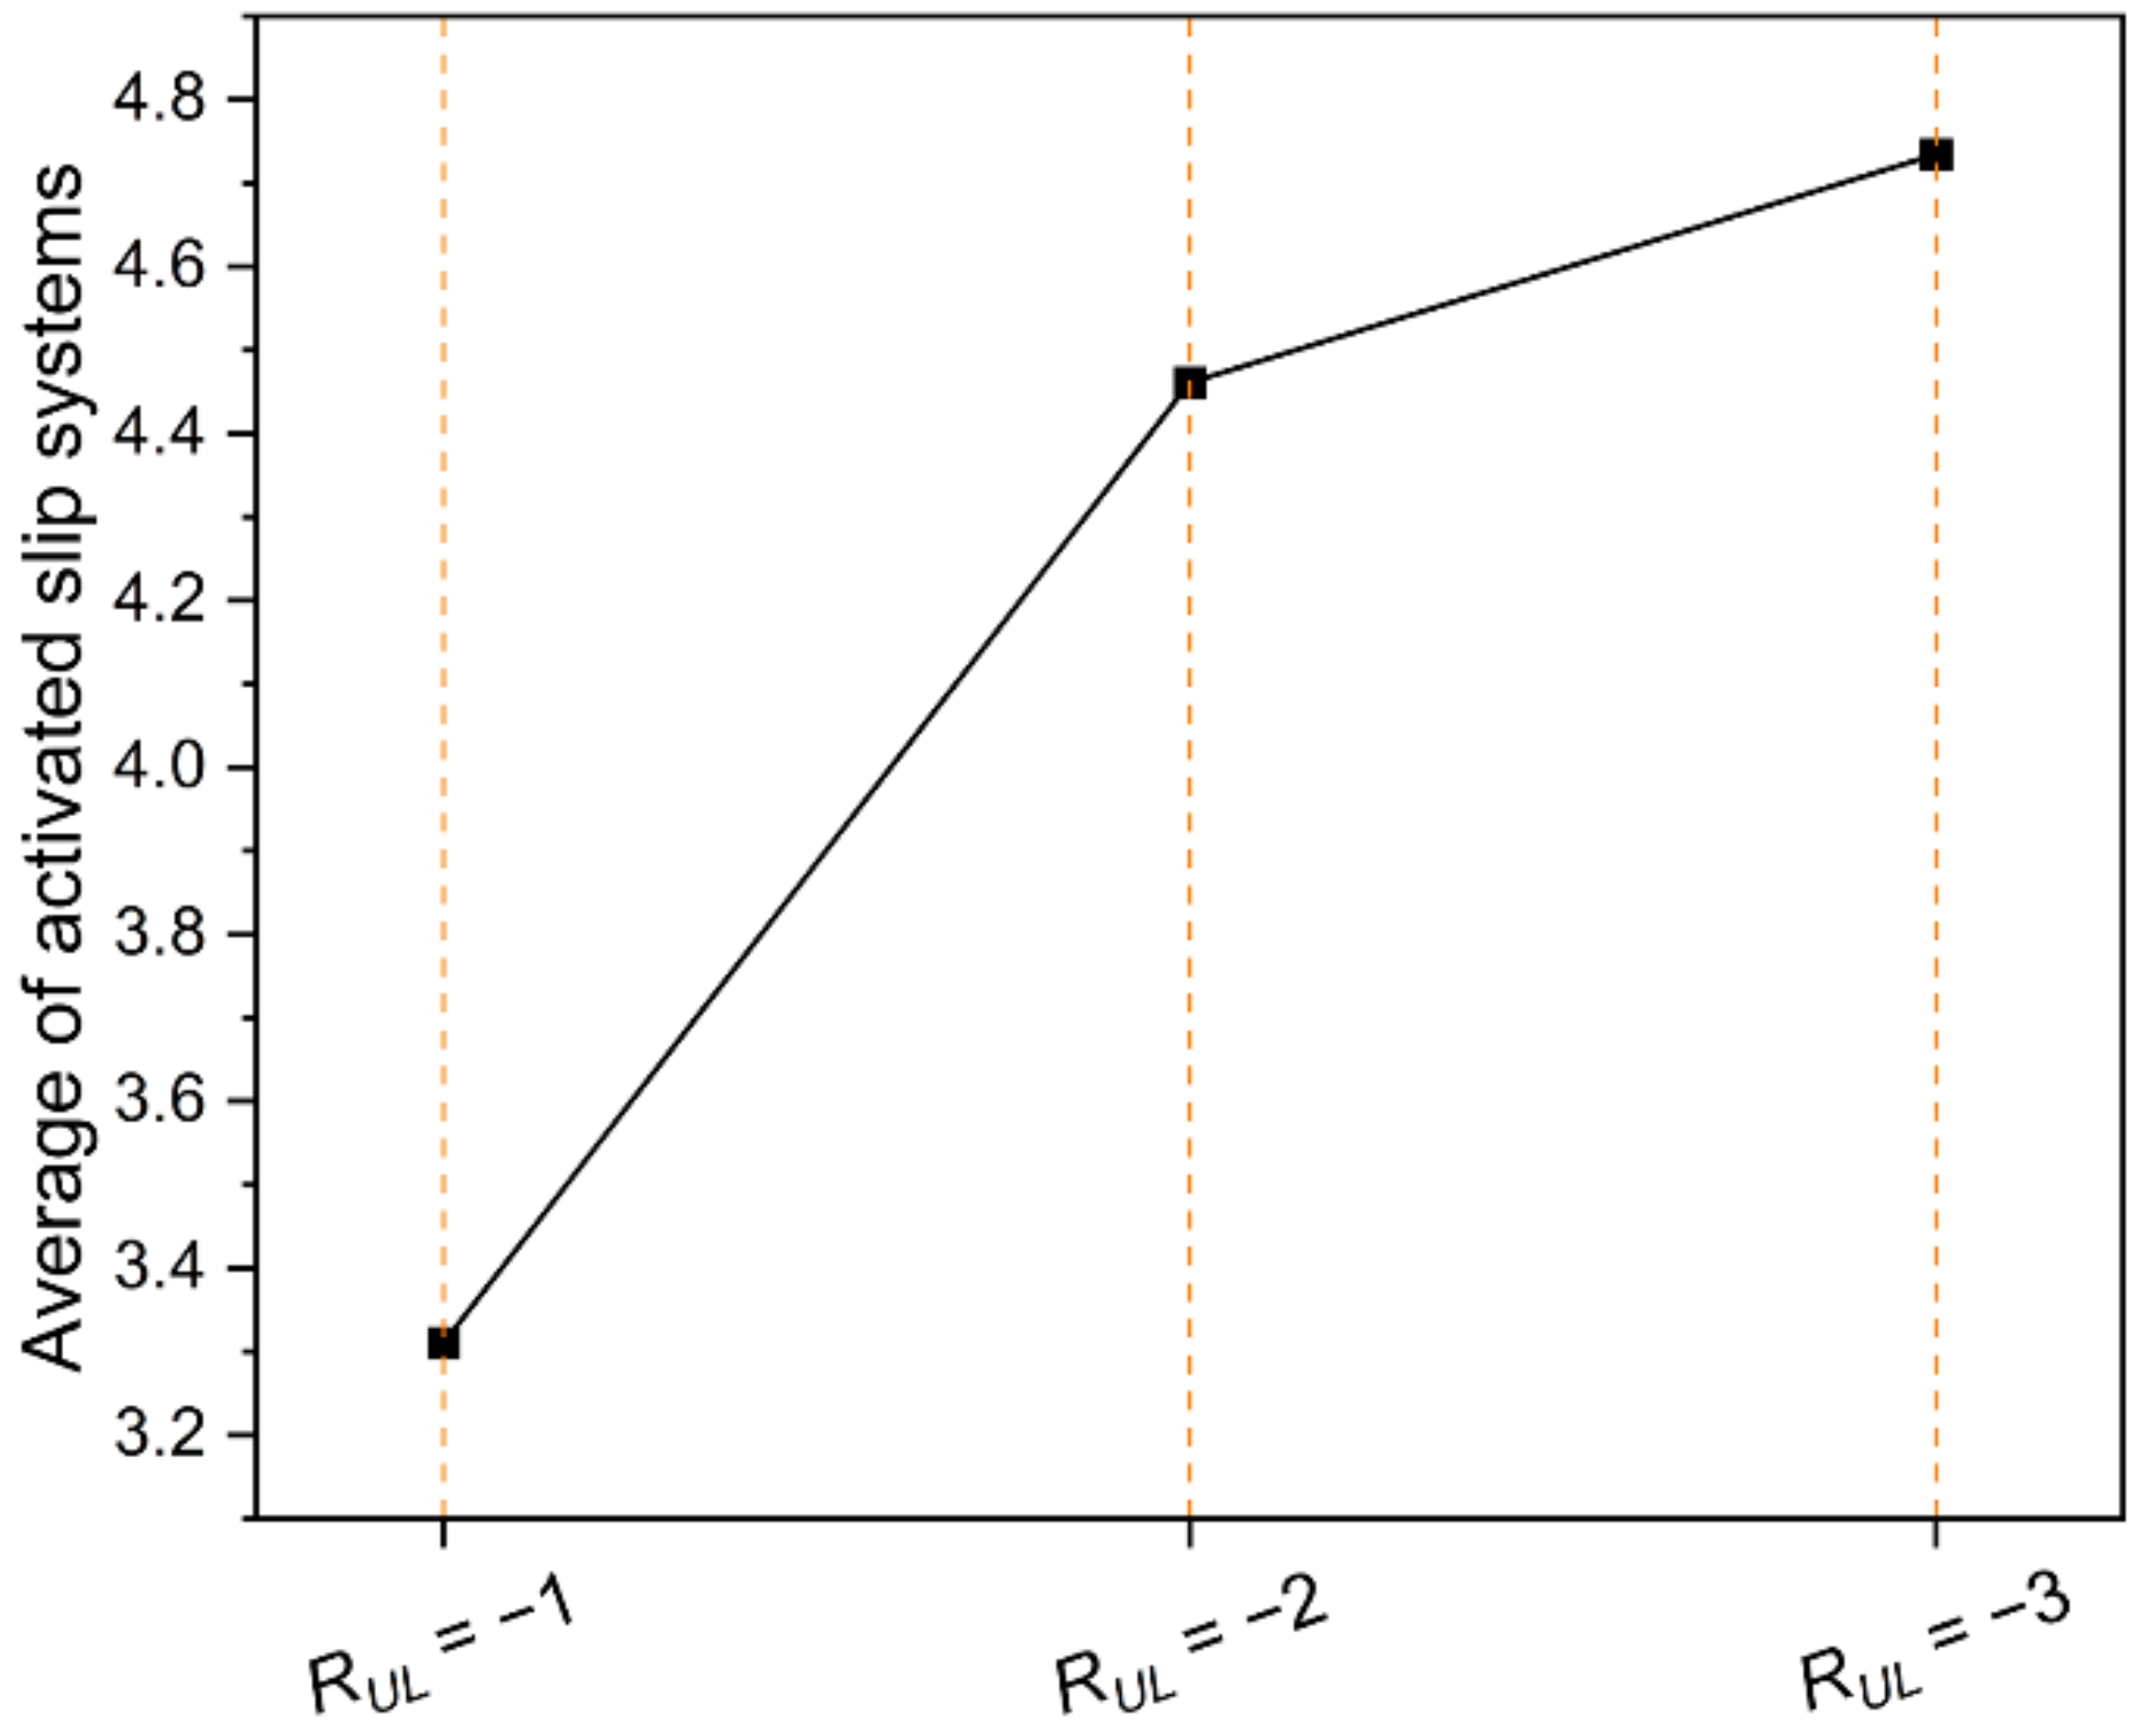
Figure 14b–d shows the frequency distribution of the number of activated slip systems at two time points (i.e., Time A and Time B). It can be seen from Figure 14b that there is almost no difference in the number of activated slip systems between Time A and Time B. However, Figure 14c,d displays that the effect of compressive overload causes a significant variation in the number of activated slip systems. More specifically, the proportion of elements with no less than four activated slip systems increases at Time B in comparison with that at Time A. Figure 15 shows the average number of activated slip systems at Time B, indicating that the number of activated slip systems increases with the level of compressive overload ratio.
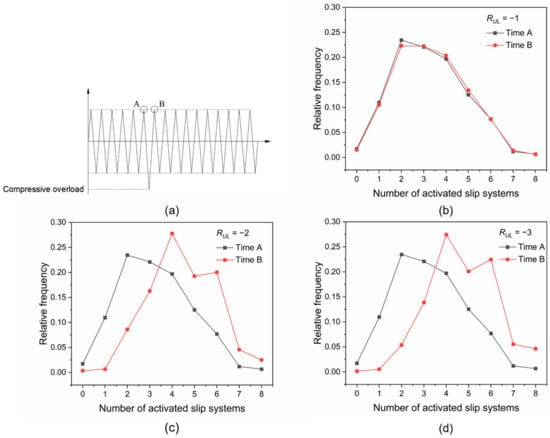
Figure 14.
(a) Schematic diagram of Time A and Time B; frequency distribution of the number of activated slip systems at different overload ratios: (b) RUL = −1; (c) RUL = −2; (d) RUL = −3.
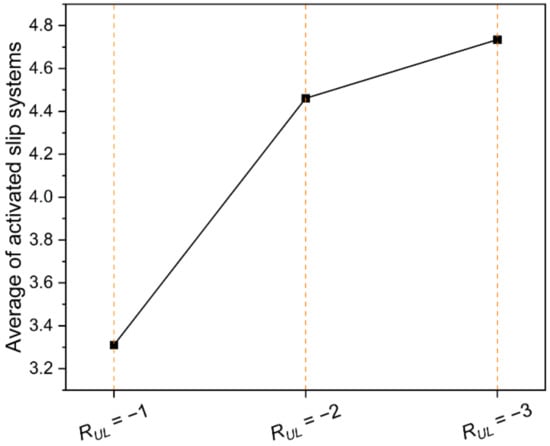
Figure 15.
Average number of activated slip systems at the tension peak of the 7th cycle under conditions of RUL = −1, RUL = −2 and RUL = −3.
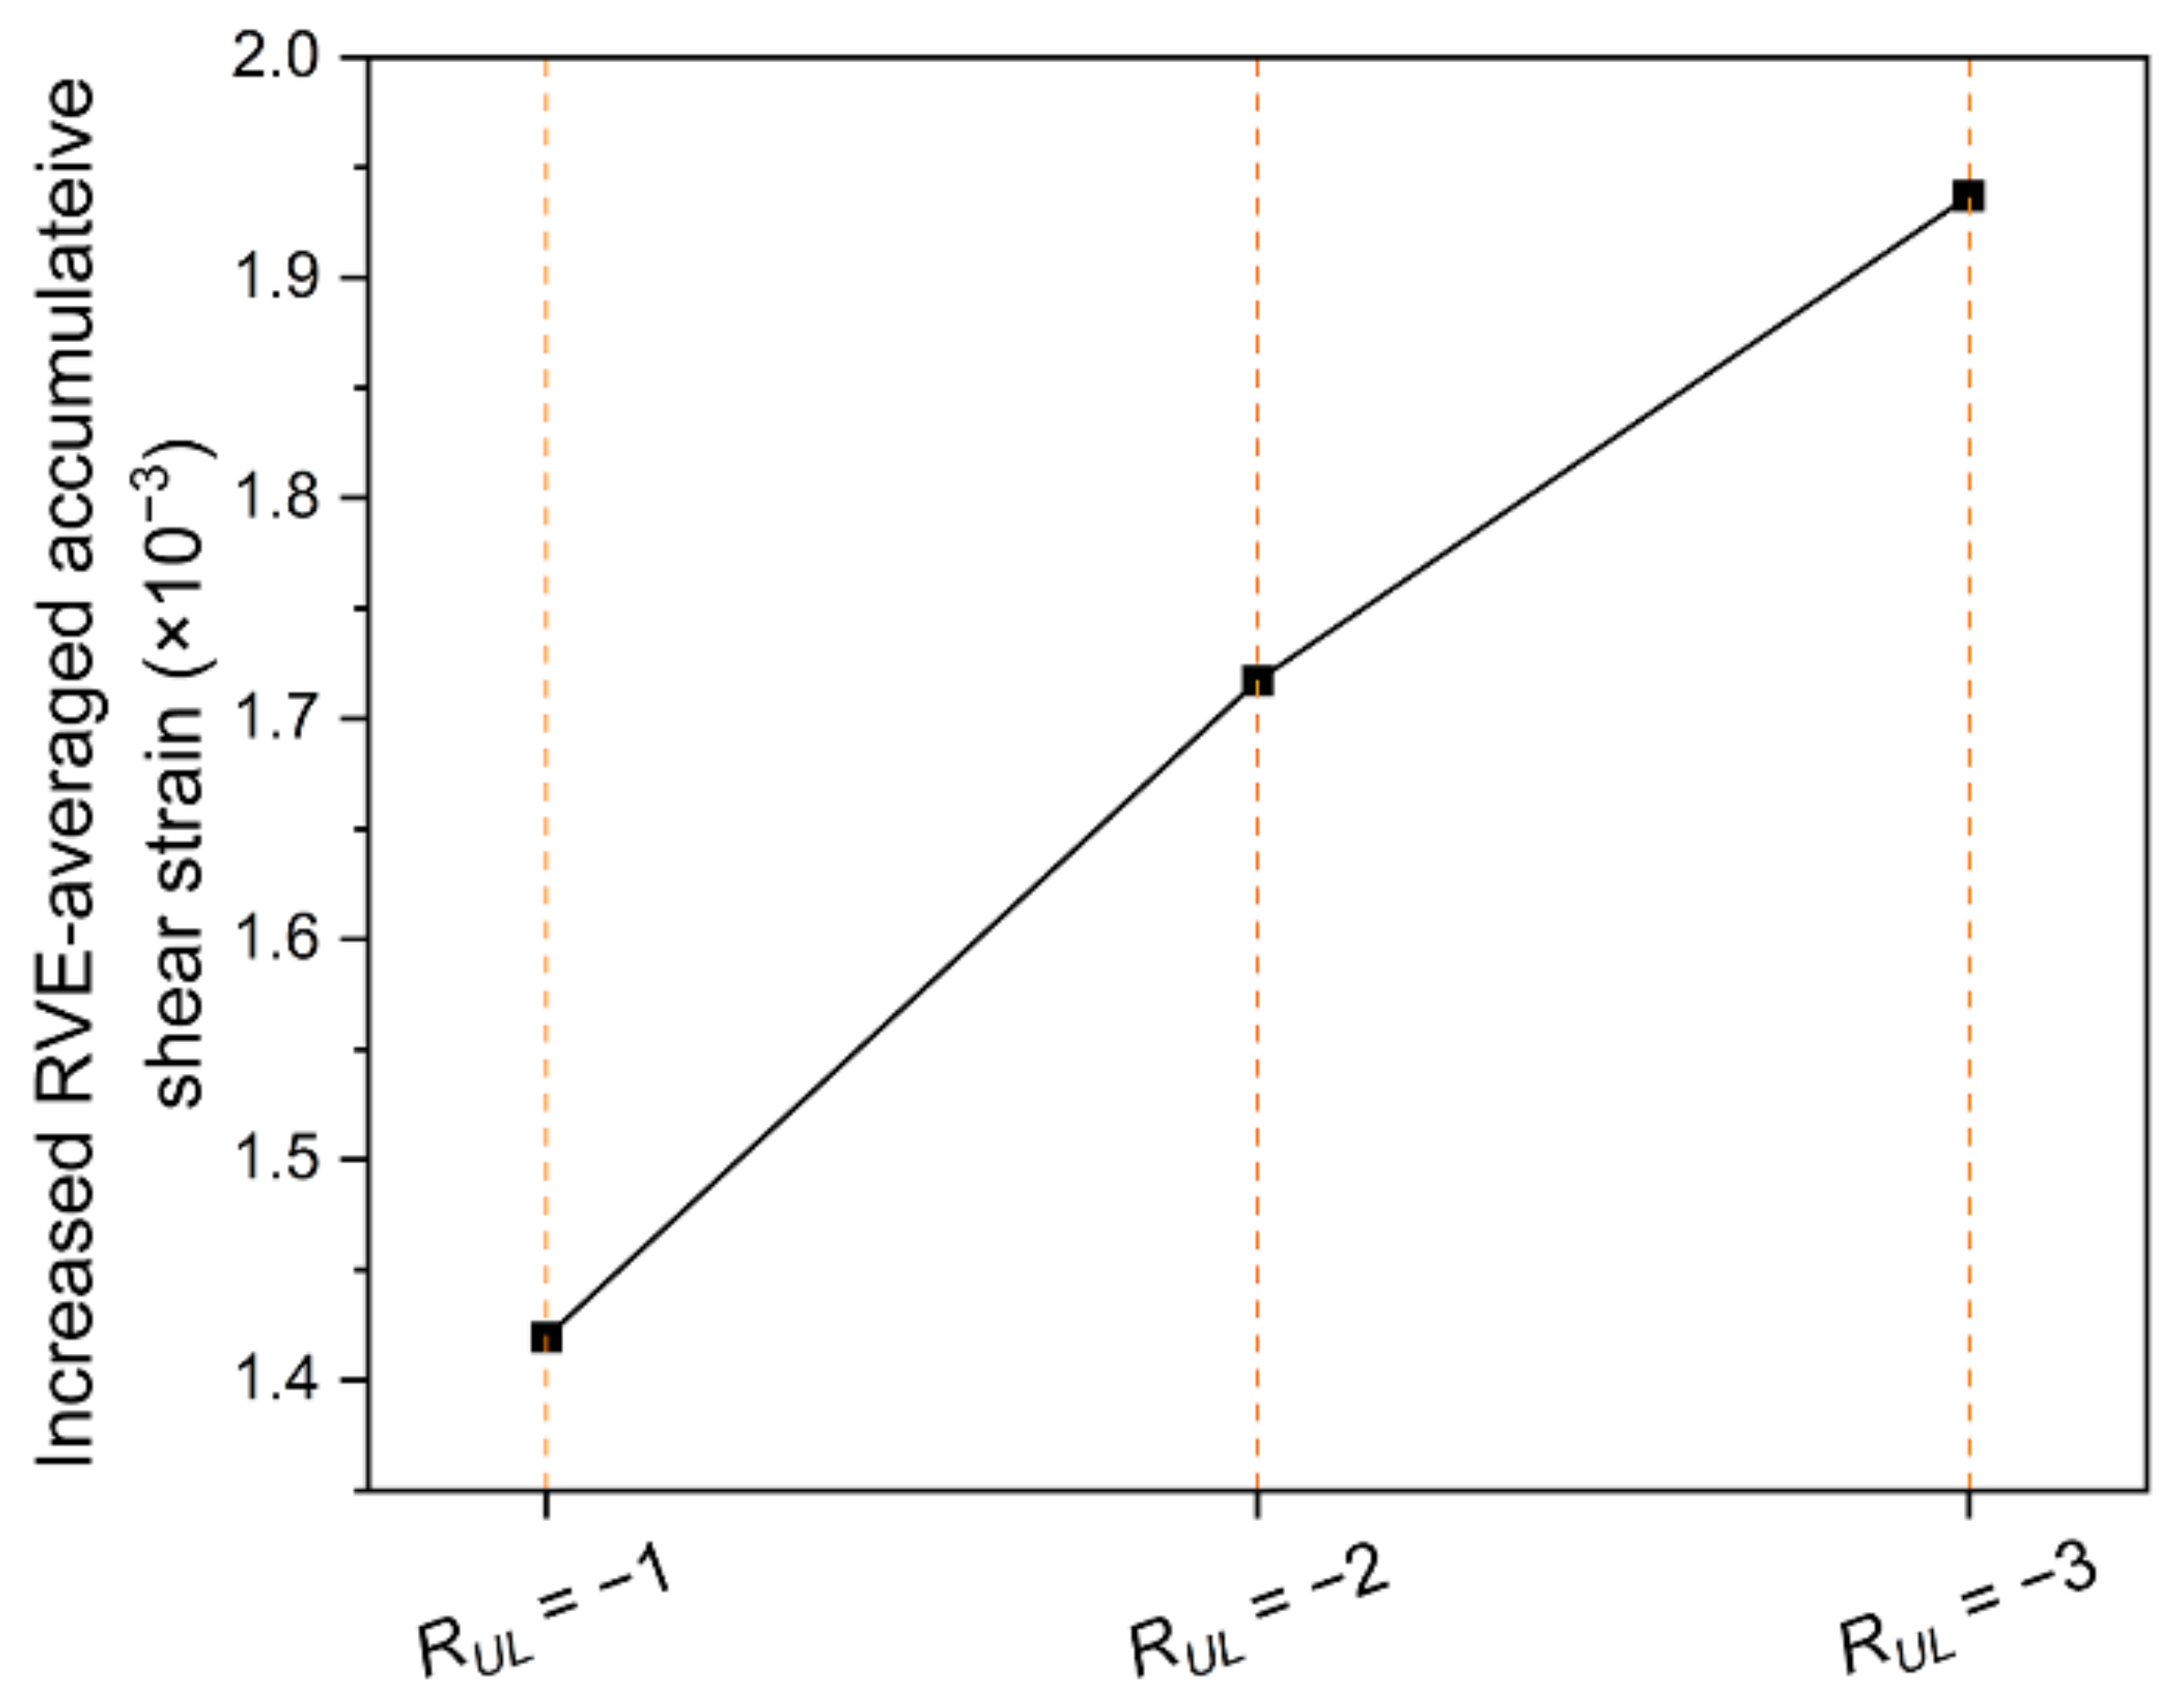
The increase in the RVE-averaged accumulative shear strain of grain G1 within ten cycles after the application of the compressive overload is shown in Figure 16. The increased RVE-averaged accumulative shear strain increases with the level of compressive overload ratio, which implies that the dislocation multiplication is faster at the higher level of compressive overload ratio. The stress level increases with an increase in dislocation density [52], and higher stress can result in more damage [53]. Therefore, it can be reasonably considered, based on Figure 14, Figure 15 and Figure 16, that the effect of compressive overload increases the number of activated slip systems ahead of the crack tip, thereby leading to an increase in the shear strain and the resultant dislocation density. This is another reason why the effect of compressive overload can accelerate fatigue crack propagation.
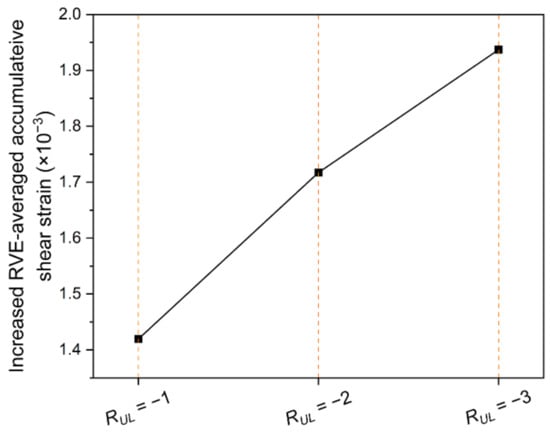
Figure 16.
Increase in the accumulated shear strain generated within ten cycles after compressive overloading under conditions of RUL = −1, RUL = −2 and RUL = −3.
4.3. Effect of Grain Orientation on Damage Evolution Ahead of Crack Tip
To investigate the effect of grain orientation on the fatigue damage evolution ahead of the crack tip under the cyclic load with a single compressive overload, grain G1 is selected as the target grain in this section, and grain G1 is assigned with three orientations, namely orientation A, orientation B and orientation C. Figure 17a shows the position of grain G1, and three orientations of grain G1 are shown in Figure 17b. It can be seen that there is a significant difference between orientation A, orientation B and orientation C. Orientation A is very close to orientation; orientation C is near the orientation; orientation B is far away from orientation and orientation, and it is closer to orientation. The compressive overload ratio RUL = −2 is used in this section.
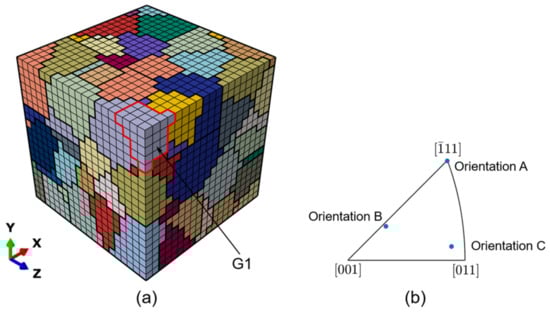
Figure 17.
(a) Position and (b) orientation distribution for grain G1.
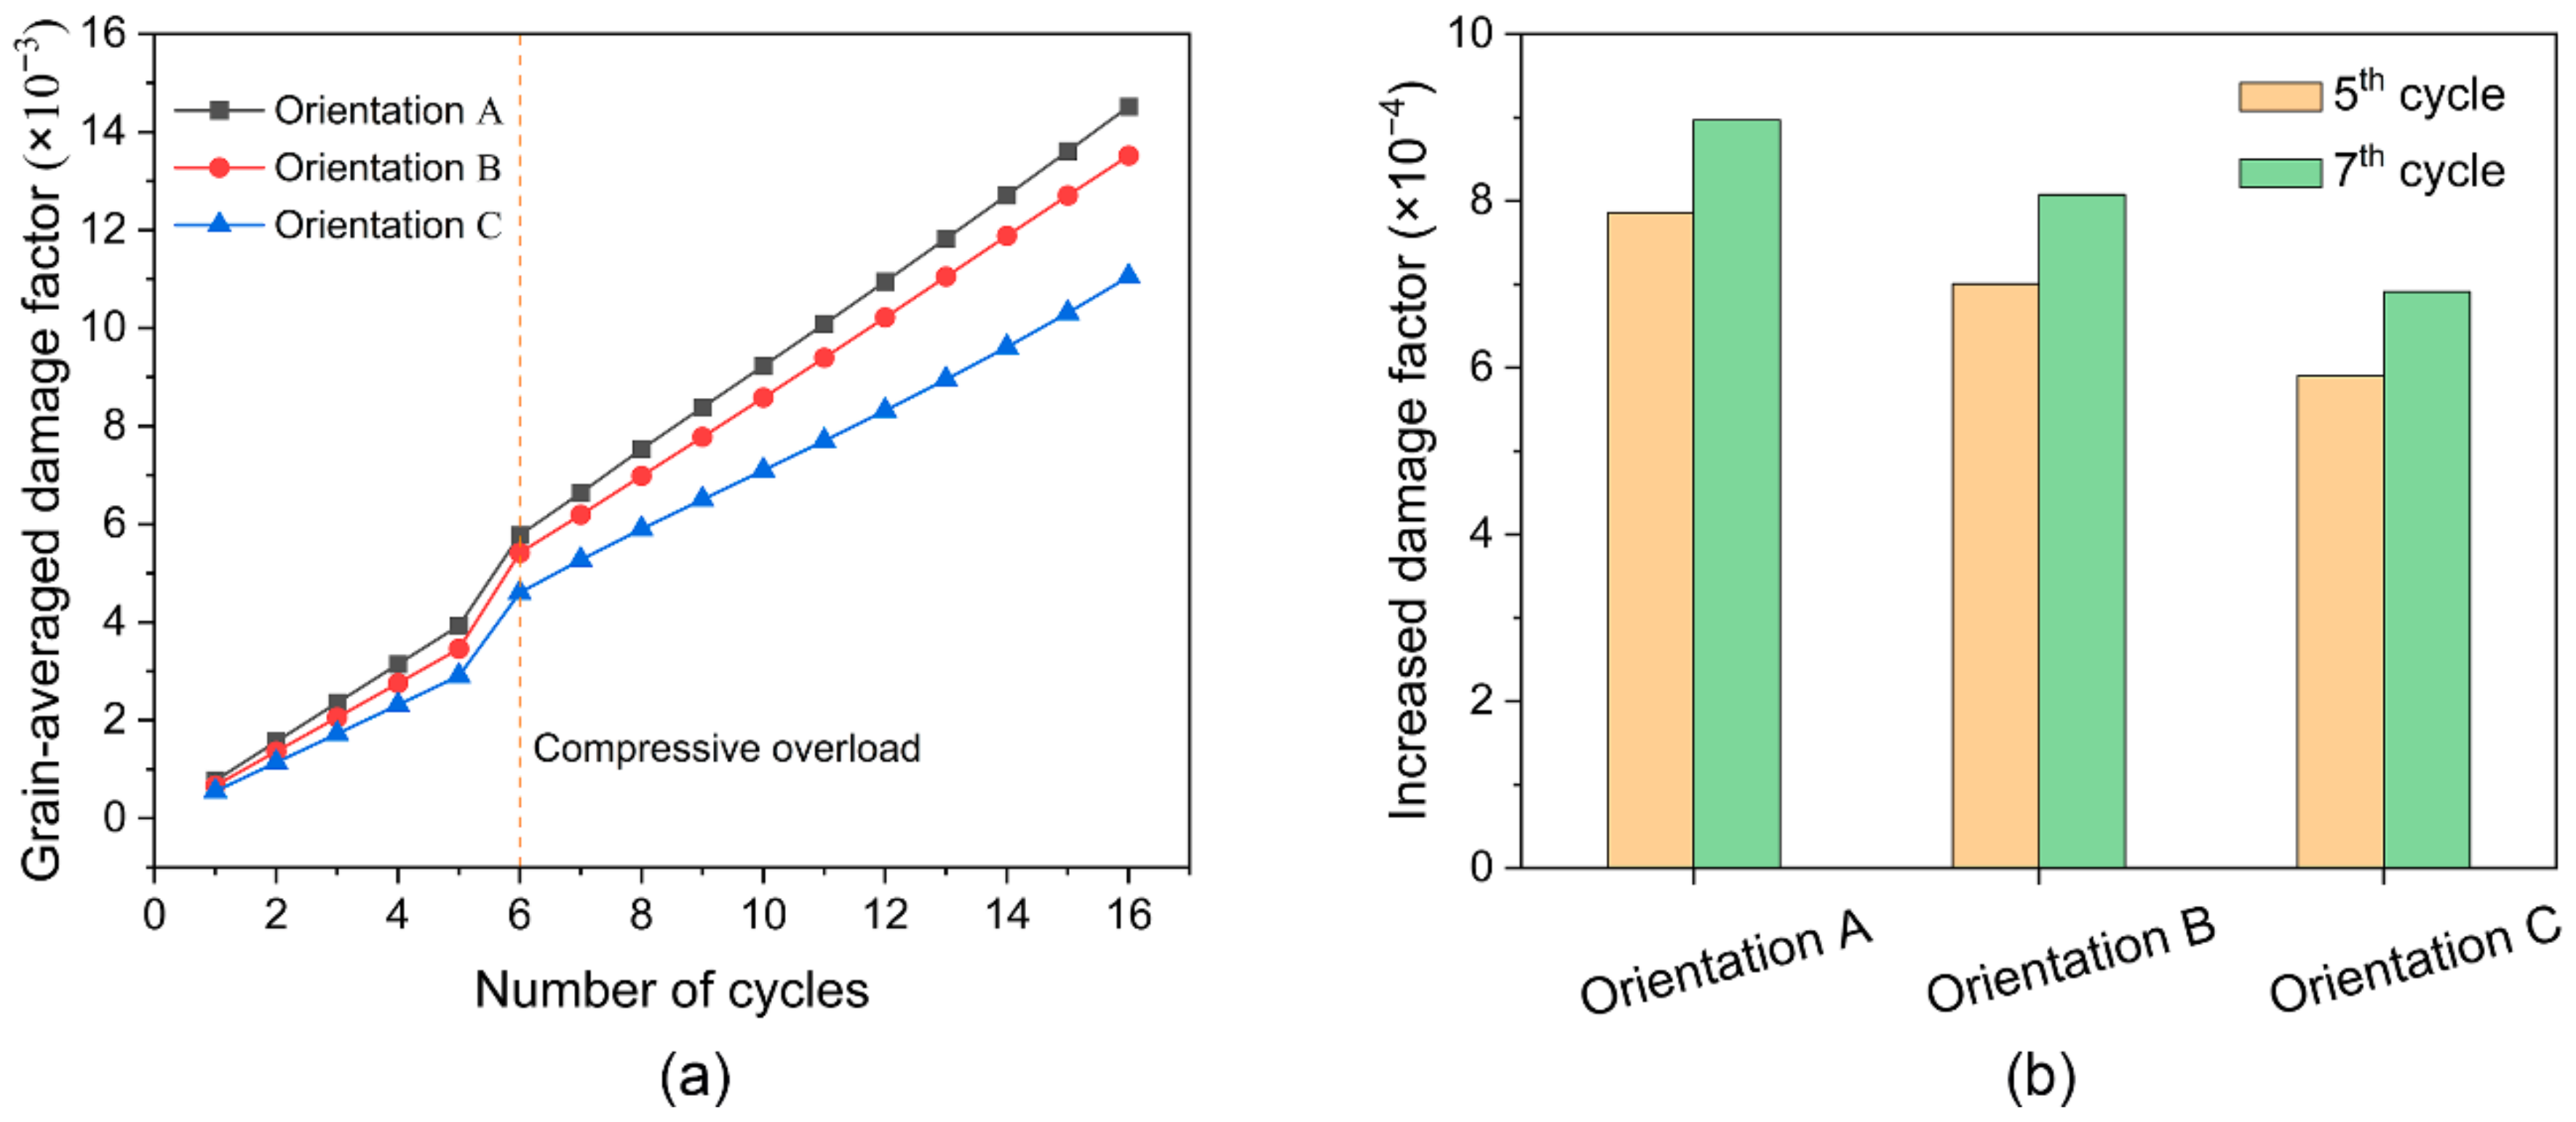
The fatigue damage evolution of grain G1 under three different orientations is shown in Figure 18a. It can be seen that the grain-averaged damage factor of grain G1 increase with increasing fatigue cycles in each case. However, the fatigue damage evolution of grain G1 varies under three different orientations. The case of orientation A suffers from the most severe fatigue damage in each cycle, followed by the case of orientation B and then the case of orientation C. This indicates that the fatigue damage evolution of grain G1 depends on its orientation. For three cases, the increases in the grain-averaged damage factor of grain G1 at the fifth and seventh cycles are shown in Figure 18b. It can be seen that the increased grain-averaged damage factor at the seventh cycle is greater than that at the fifth cycle in each case, indicating that the effect of compressive overload can accelerate the fatigue damage accumulation ahead of the crack tip regardless of the grain orientation.
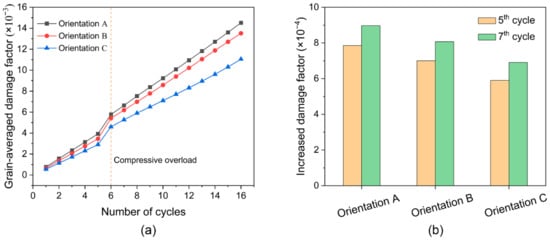
Figure 18.
(a) Grain-averaged damage factor as a function of fatigue cycles and (b) increases in the grain-averaged damage factor of grain G1 under three different orientations.
Because the accumulation of fatigue damage in metals arises from plastic slip [54], it is speculated that the effect of grain orientation on the damage accumulation ahead of the crack tip depends on the slip system activity under the cyclic load with a single compressive overload. To investigate the reasons for the variation in the damage evolution of grain G1 under different orientations, the slip system activity of grain G1 in the tension parts of the fifth and seventh cycles is analyzed.
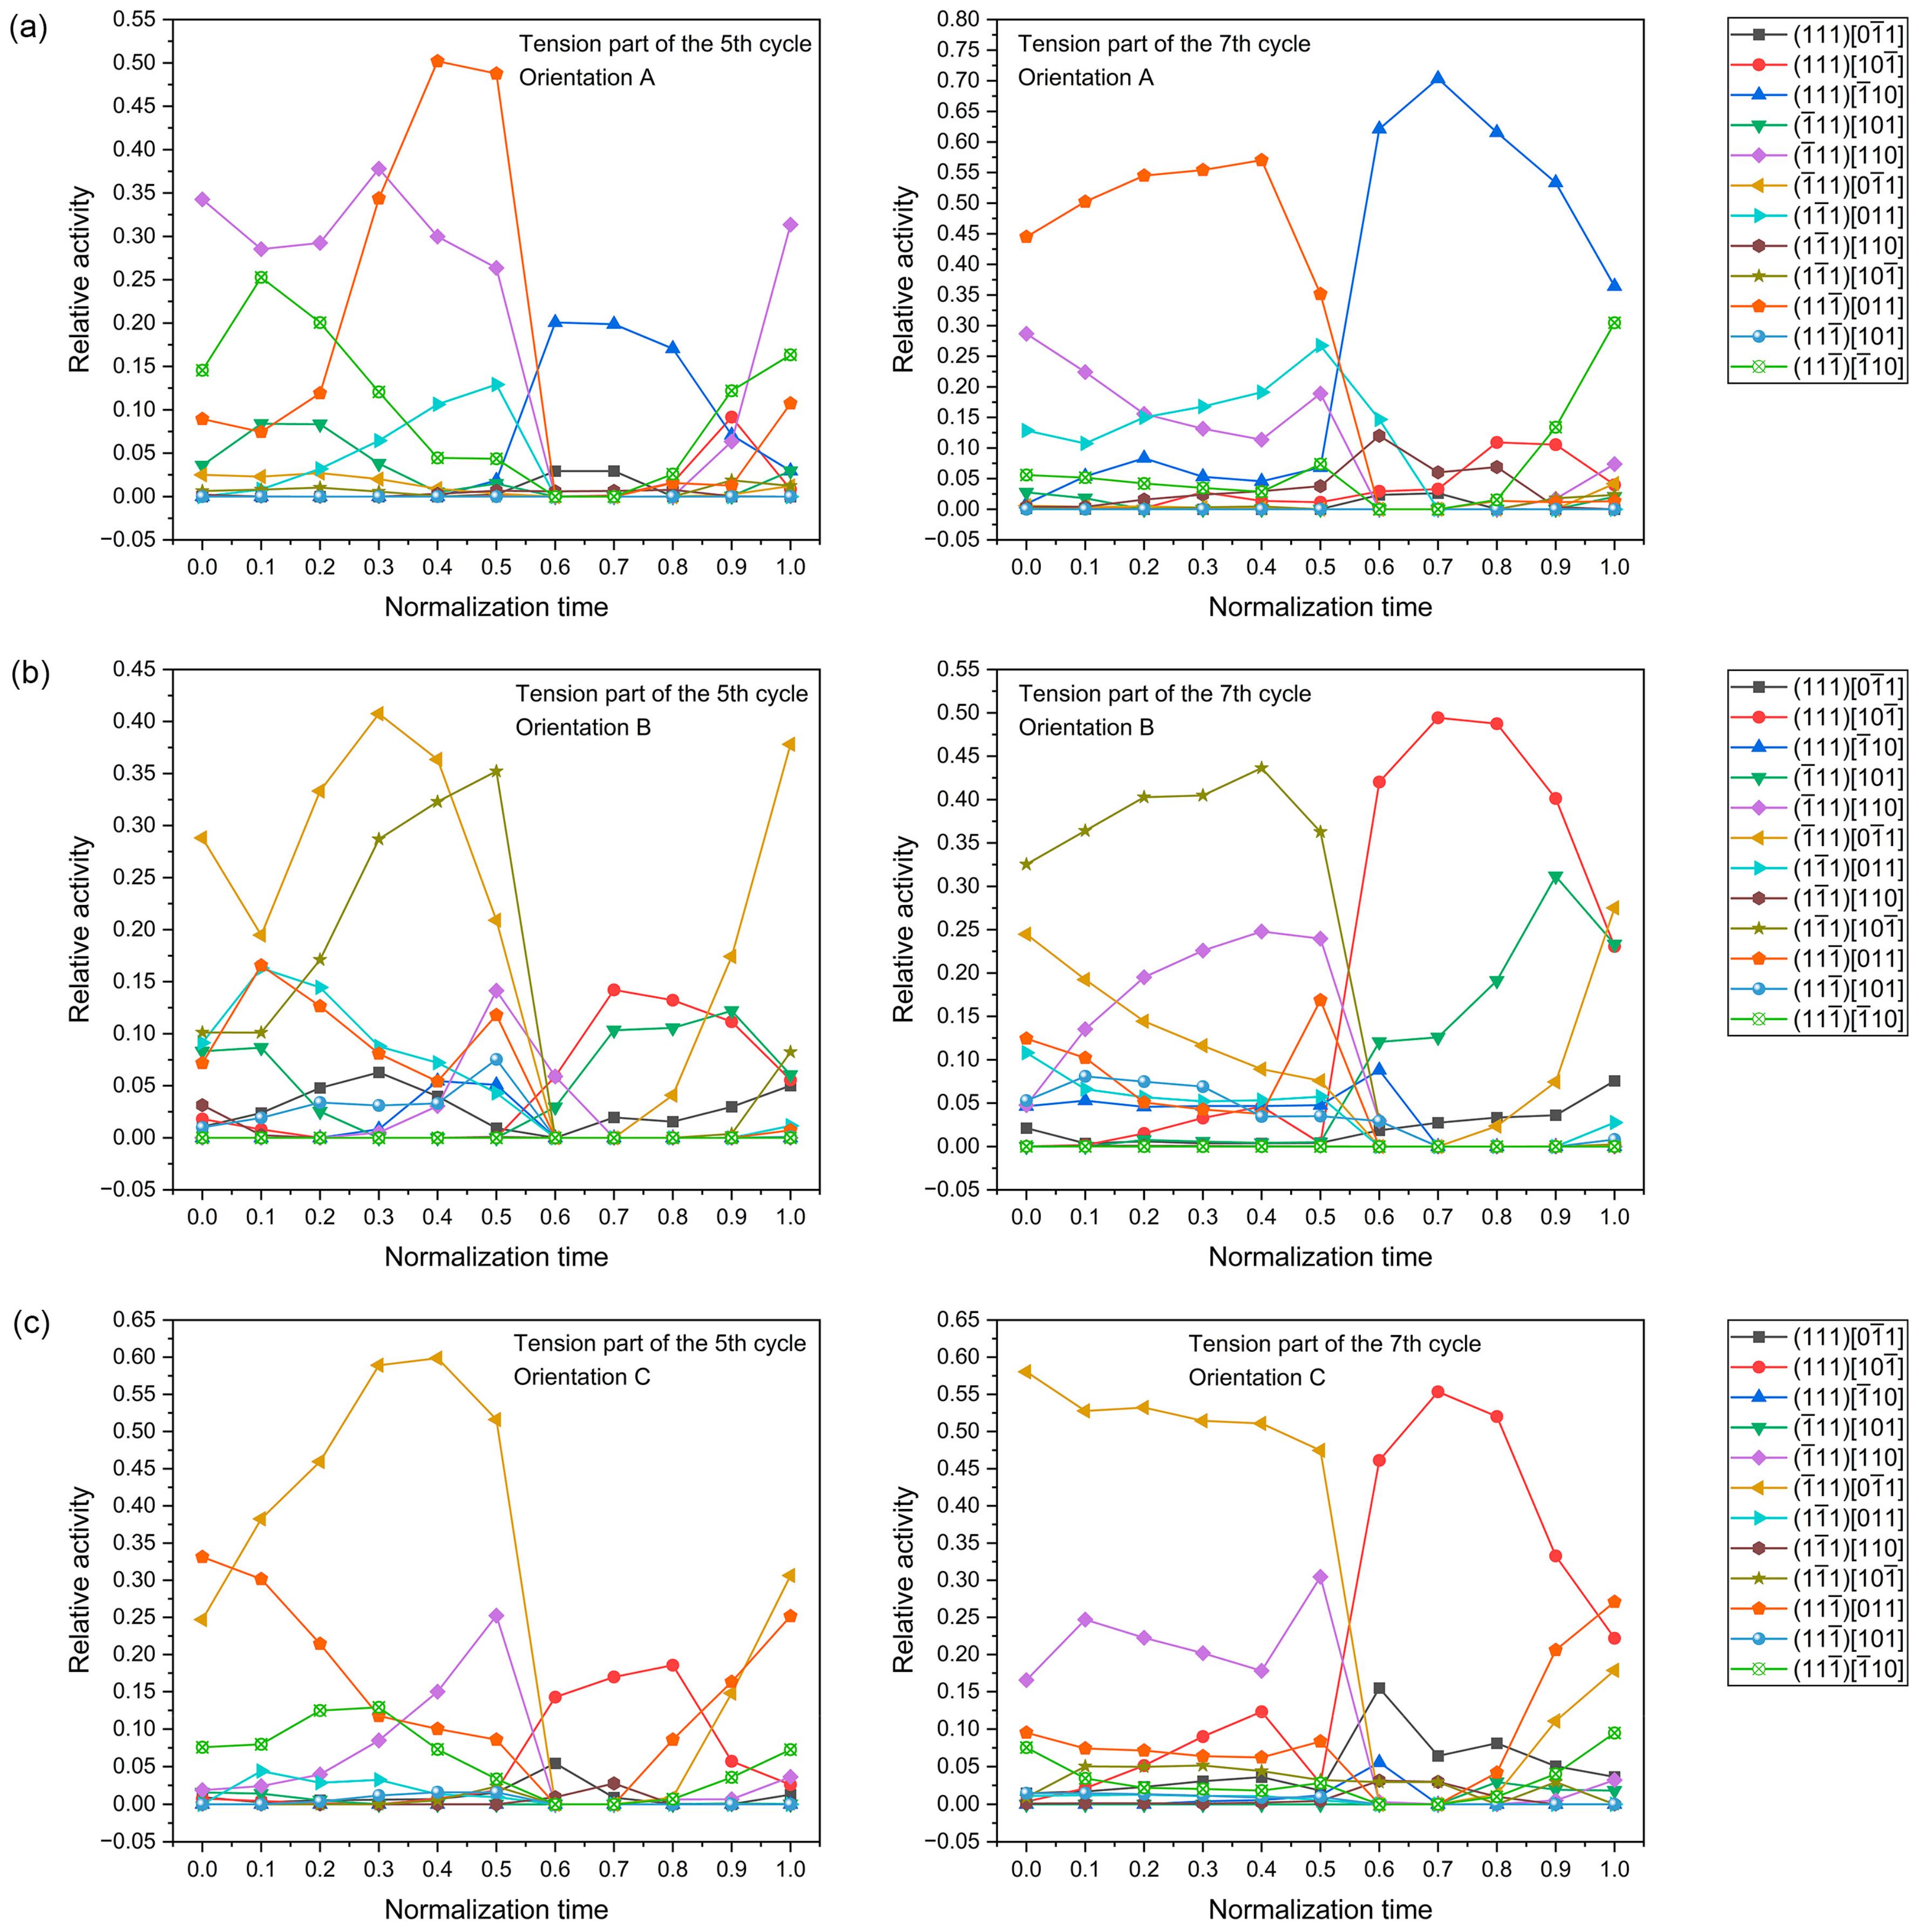
For the 12 slip systems of grain G1, the evolution of the relative activity under different orientations is shown in Figure 19. The relative activity of slip systems is defined by the following equation [55]:
in which is the relative activity of the α-th slip system; V is the total volume of grain; dv is the volume of a given material point within the grain; is the ratio of the shear strain on the α-th slip system to the total shear strain for each material point.
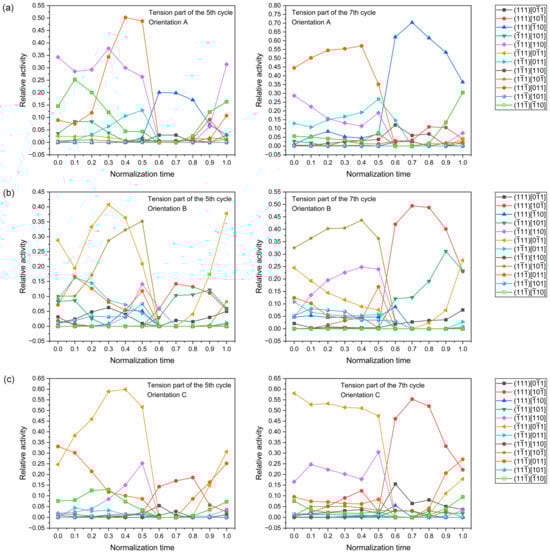
Figure 19.
Evolution of the slip system relative activity of grain G1 under different orientations: (a) orientation A; (b) orientation B; (c) orientation C.
It can be seen from Figure 19 that the activated slip systems of grain G1 are different under different orientations before or after compressive overloading. This difference in activated slip system indicates that the grain orientation can affect the stress and strain fields of grain G1 under the cyclic load with a single compressive overload, which is responsible for the fact that the damage evolution of grain G1 varies under different orientations. In addition, the relative activity of slip systems in the seventh cycle is different from that in the fifth cycle for each case, indicating that the effect of compressive overload changes the relative activity of slip systems.
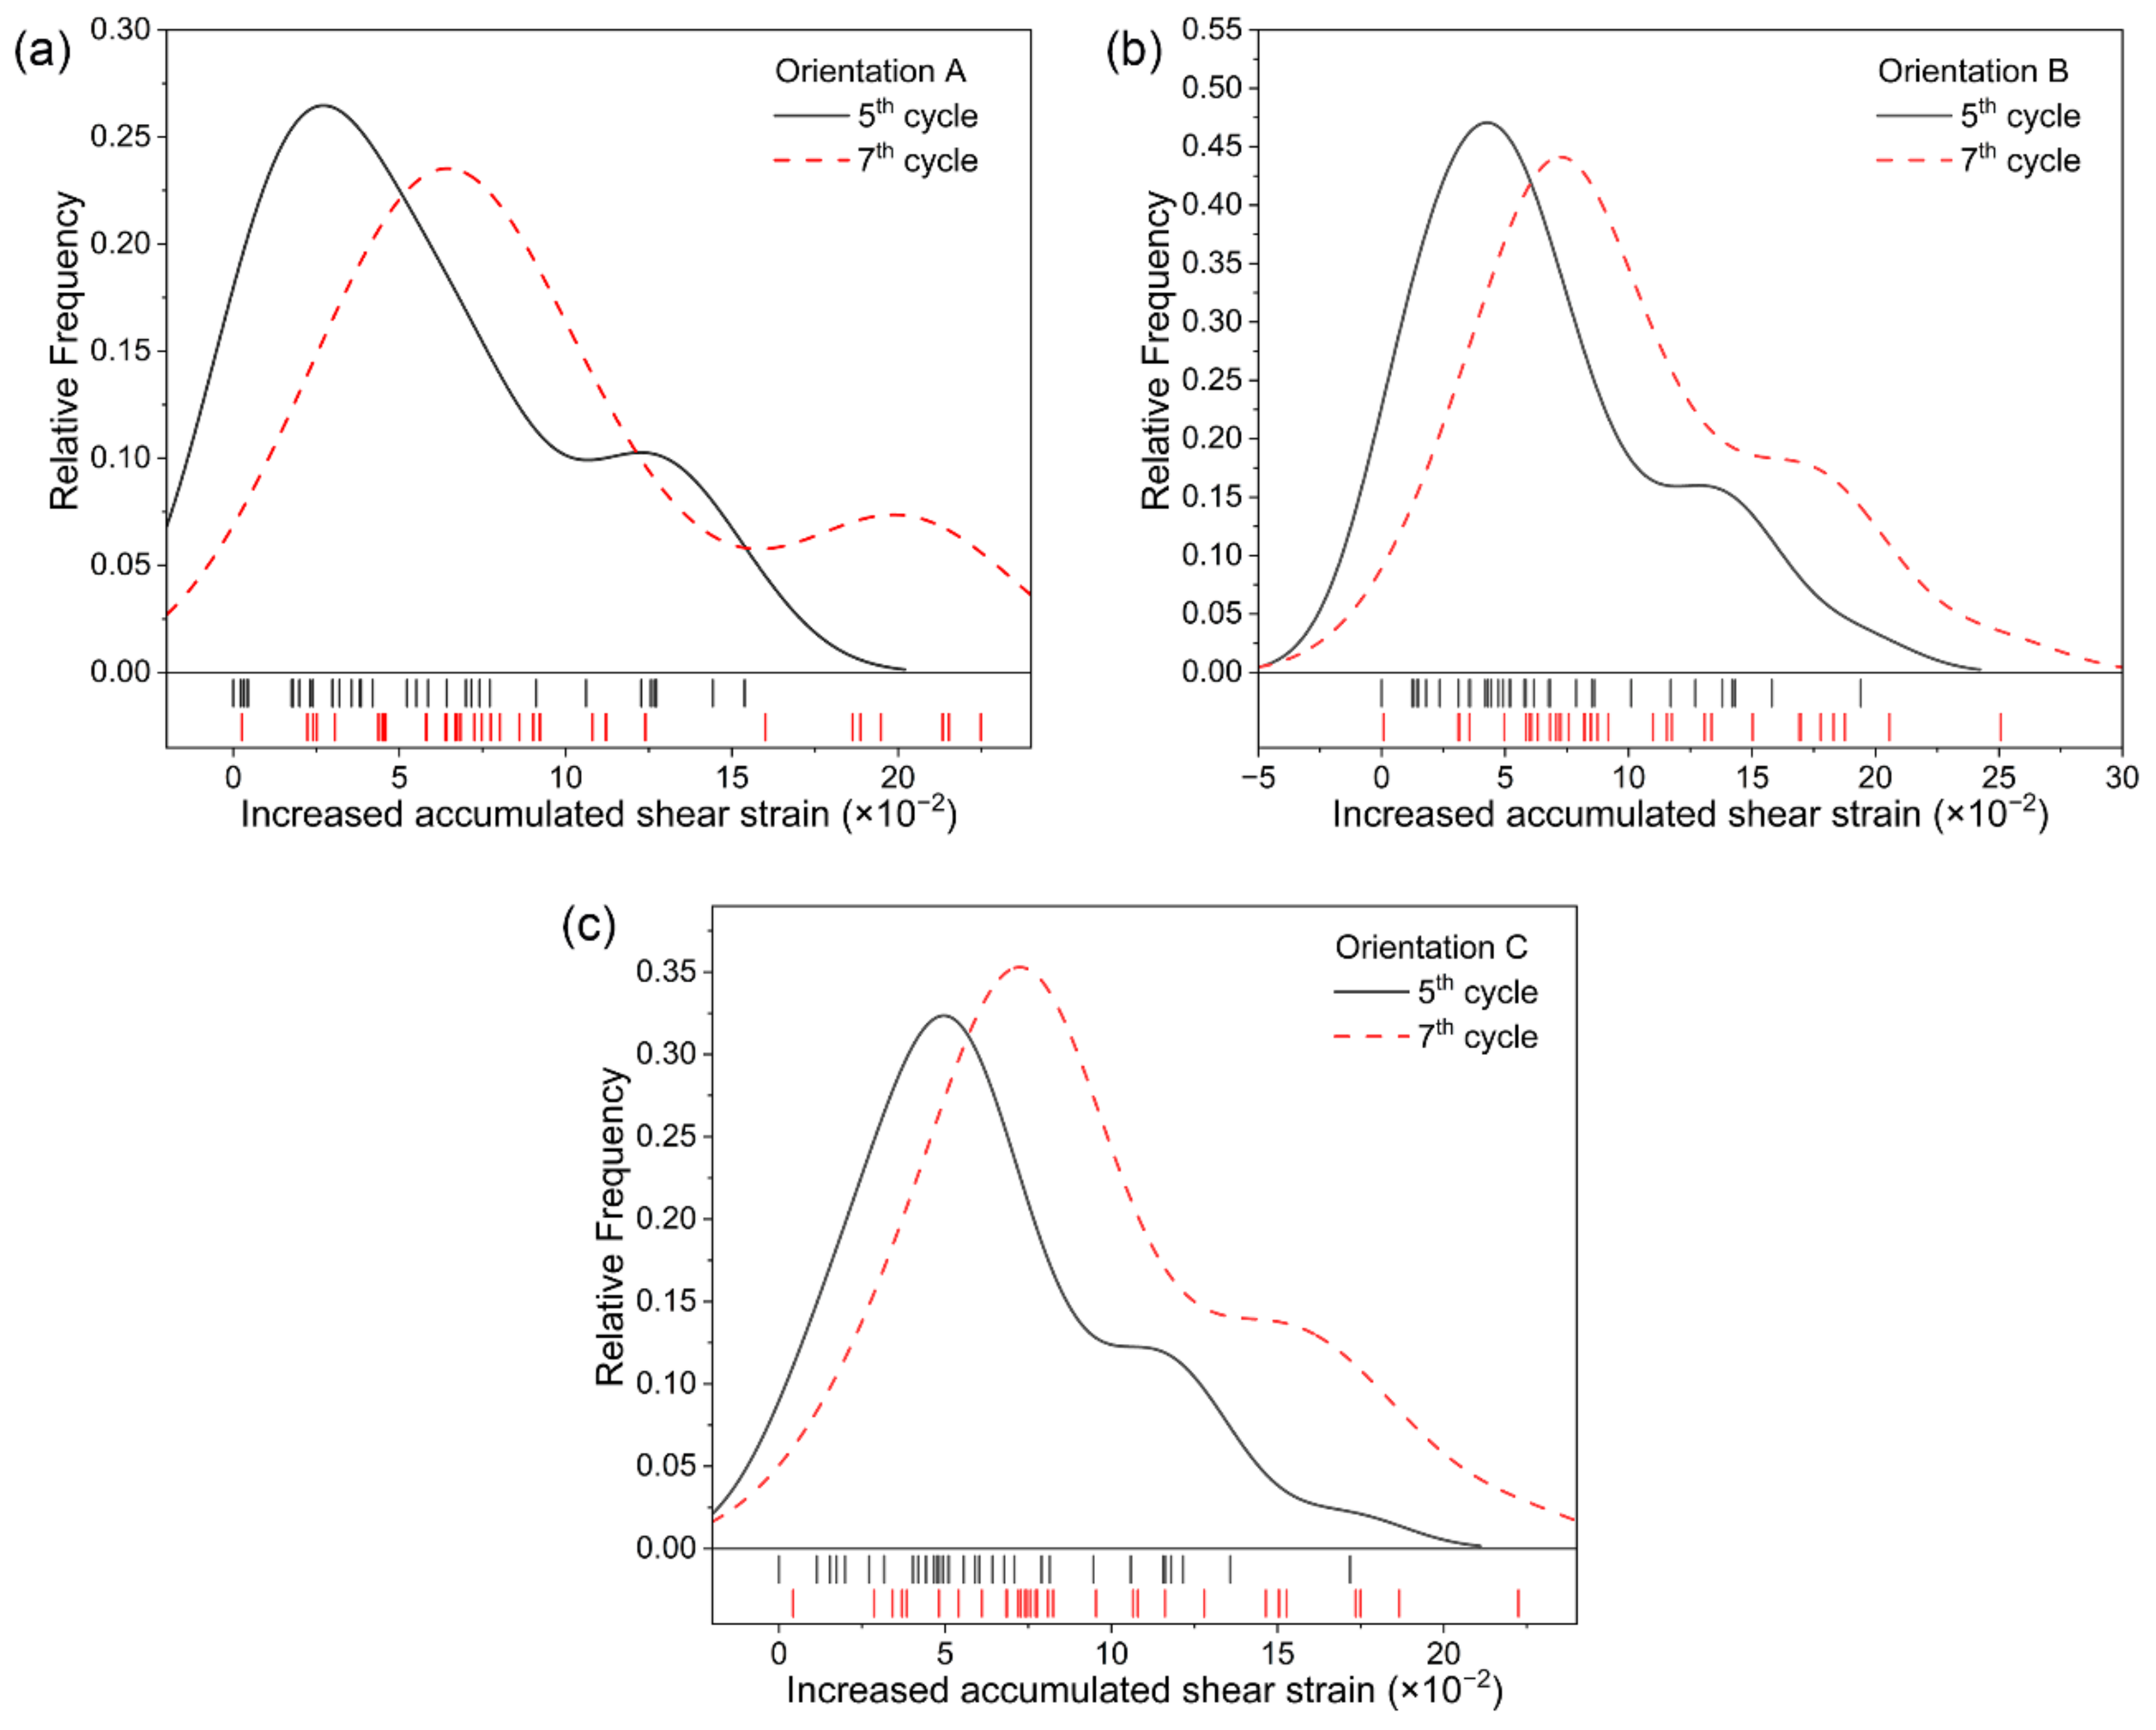
The accumulated shear strain increases at the fifth and seventh cycles are extracted at the integration point of each element within grain G1 to construct histograms for each case, as shown in Figure 20. It can be seen that at the fifth or seventh cycle, the accumulated shear strain increase varies with the grain orientation, implying that the fatigue damage accumulation rate depends on the grain orientation. In addition, the accumulated shear strain increases in the seventh cycle is greater than those in fifth cycle for each case, indicating that the rate of damage accumulation is faster after the application of compressive overloading.
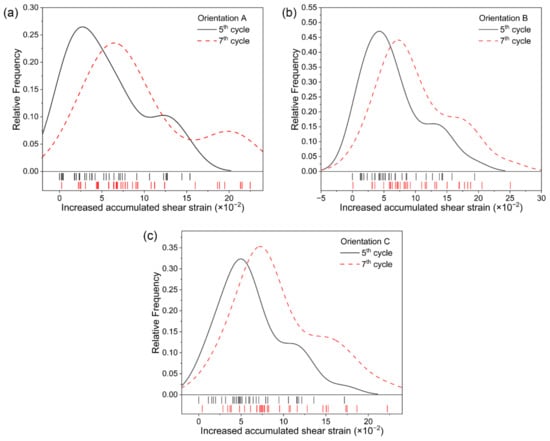
Figure 20.
Frequency distribution of increase in the accumulated shear strain of grain G1 under different orientations: (a) orientation A; (b) orientation B; (c) orientation C.
In summary, it can be reasonably considered that the grain orientation plays an important role in the slip system activity under the cyclic load with a single compressive overload, which eventually affects the plastic slip and the damage accumulation. Furthermore, it is particularly important to note that the effect of compressive overload changes the slip system activity, which is another factor accelerating the damage accumulation after the compressive overload.
4.4. Effect of Orientations of Nearest Neighbor Grains on Damage Evolution Ahead of Crack Tip
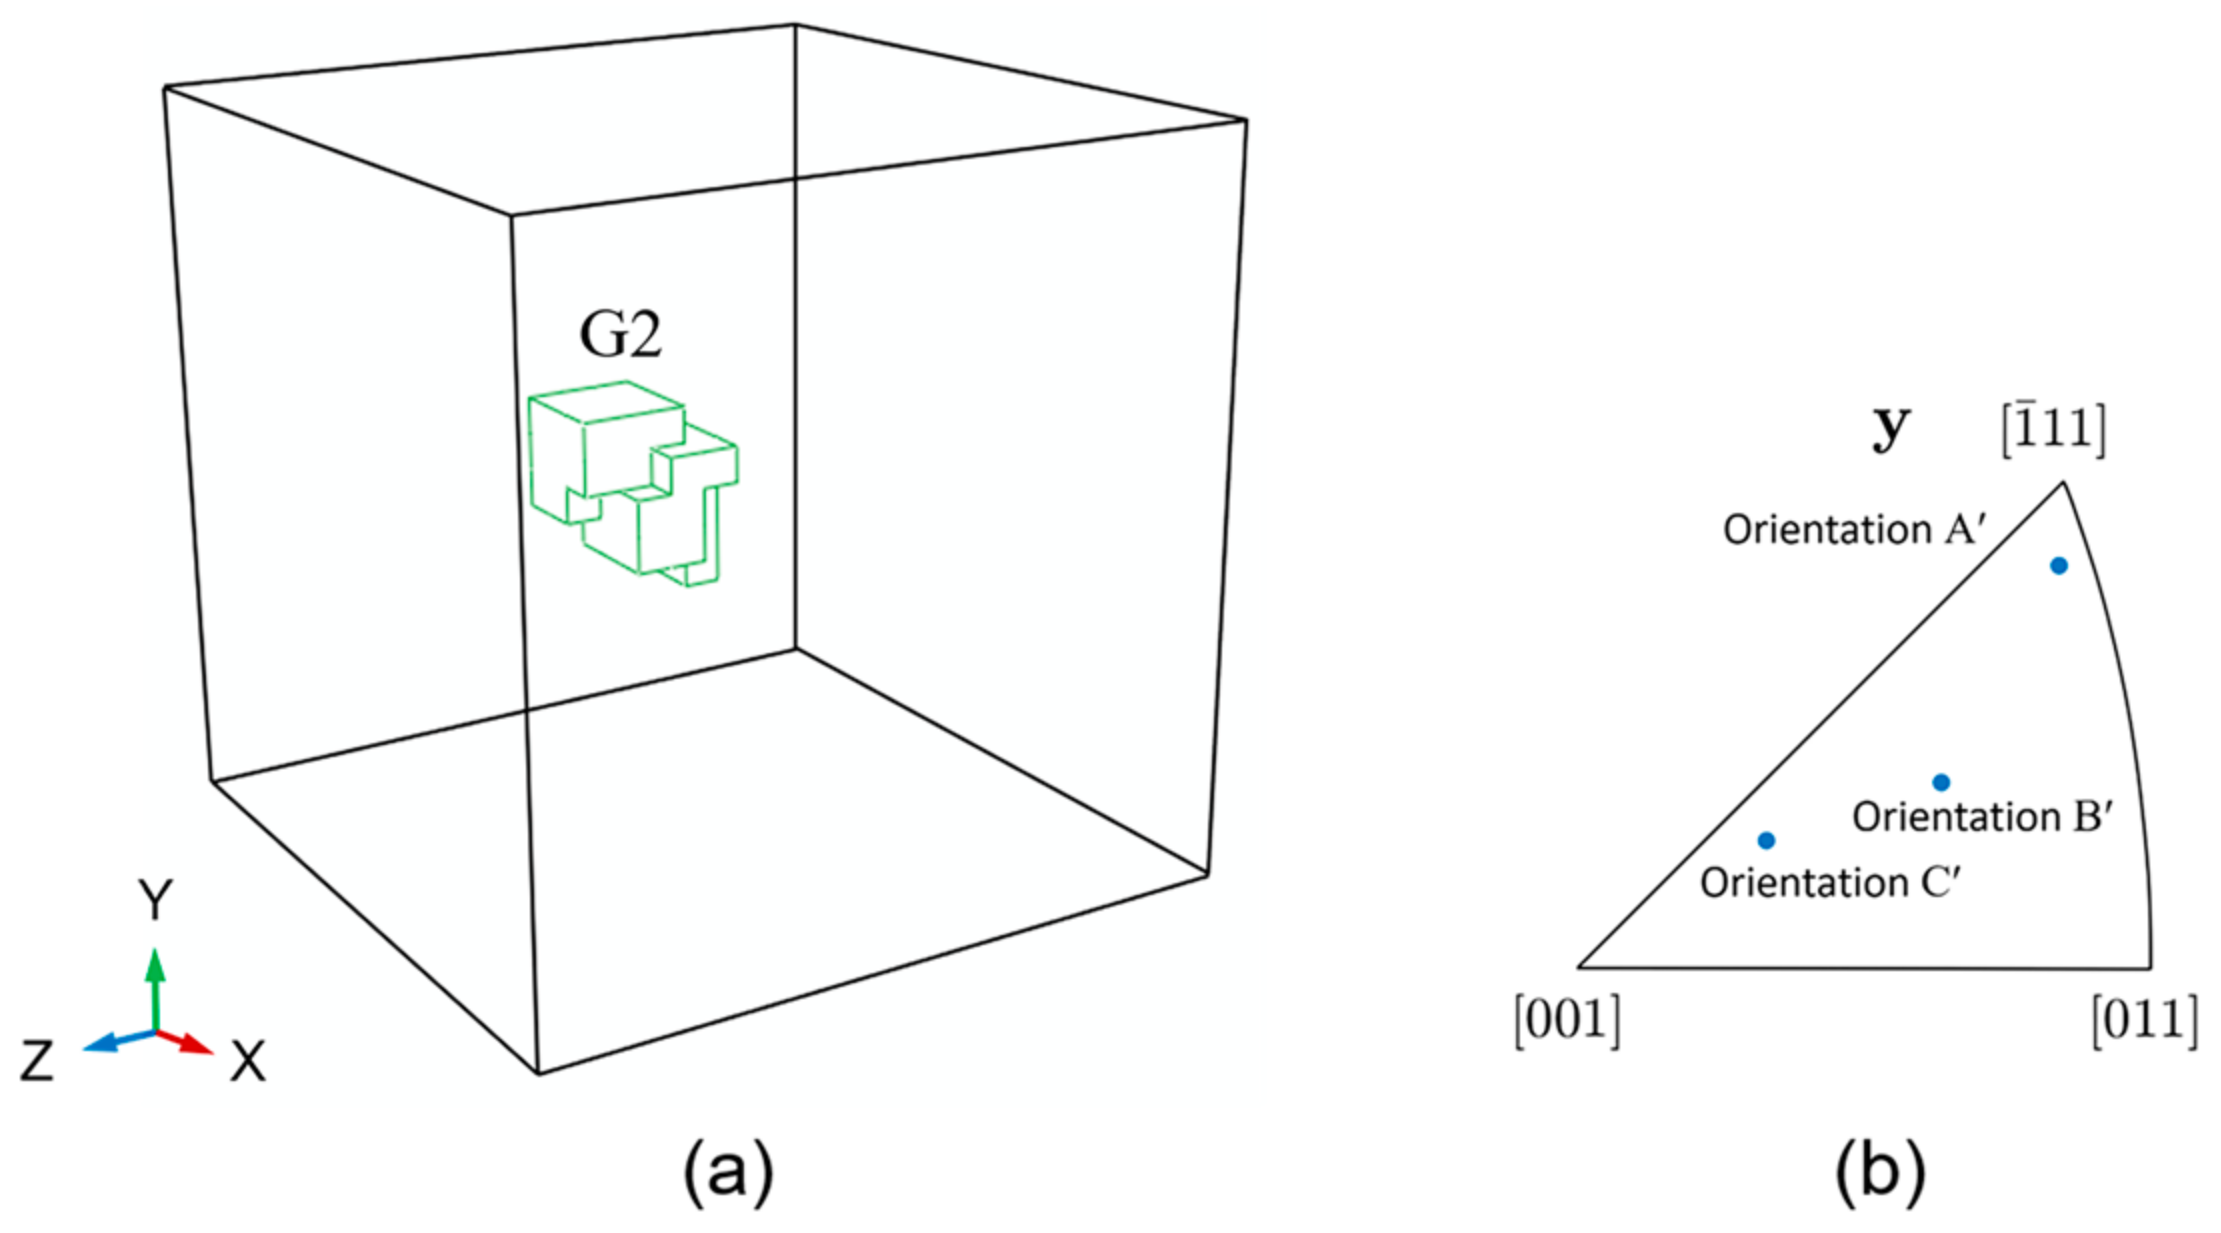
Based on the fact that the interaction between the nearest neighbor grains affects the fatigue damage accumulation under constant-amplitude cyclic loading [56], it is speculated that the damage evolution ahead of the crack tip is influenced by the orientations of the nearest neighbor grains under the cyclic load with a single compressive overload. The aim of this section is to validate this speculation. To reduce the effect of boundary conditions imposed on the boundary of the RVE model, grain G2 located at the center of the RVE model is selected as the target grain. Three different orientations (i.e., orientation Aʹ, orientation Bʹ and orientation Cʹ) are assigned to its nearest neighbor grains. The nearest neighbor grain of grain G2 is defined as the grain that shares at least one element face with grain G2. The position of grain G2 is schematically shown in Figure 21a, and the orientations of the nearest neighbor grains are shown in Figure 21b.

Figure 21.
(a) Position and (b) orientation distribution of the nearest neighbor grains of grain G2.
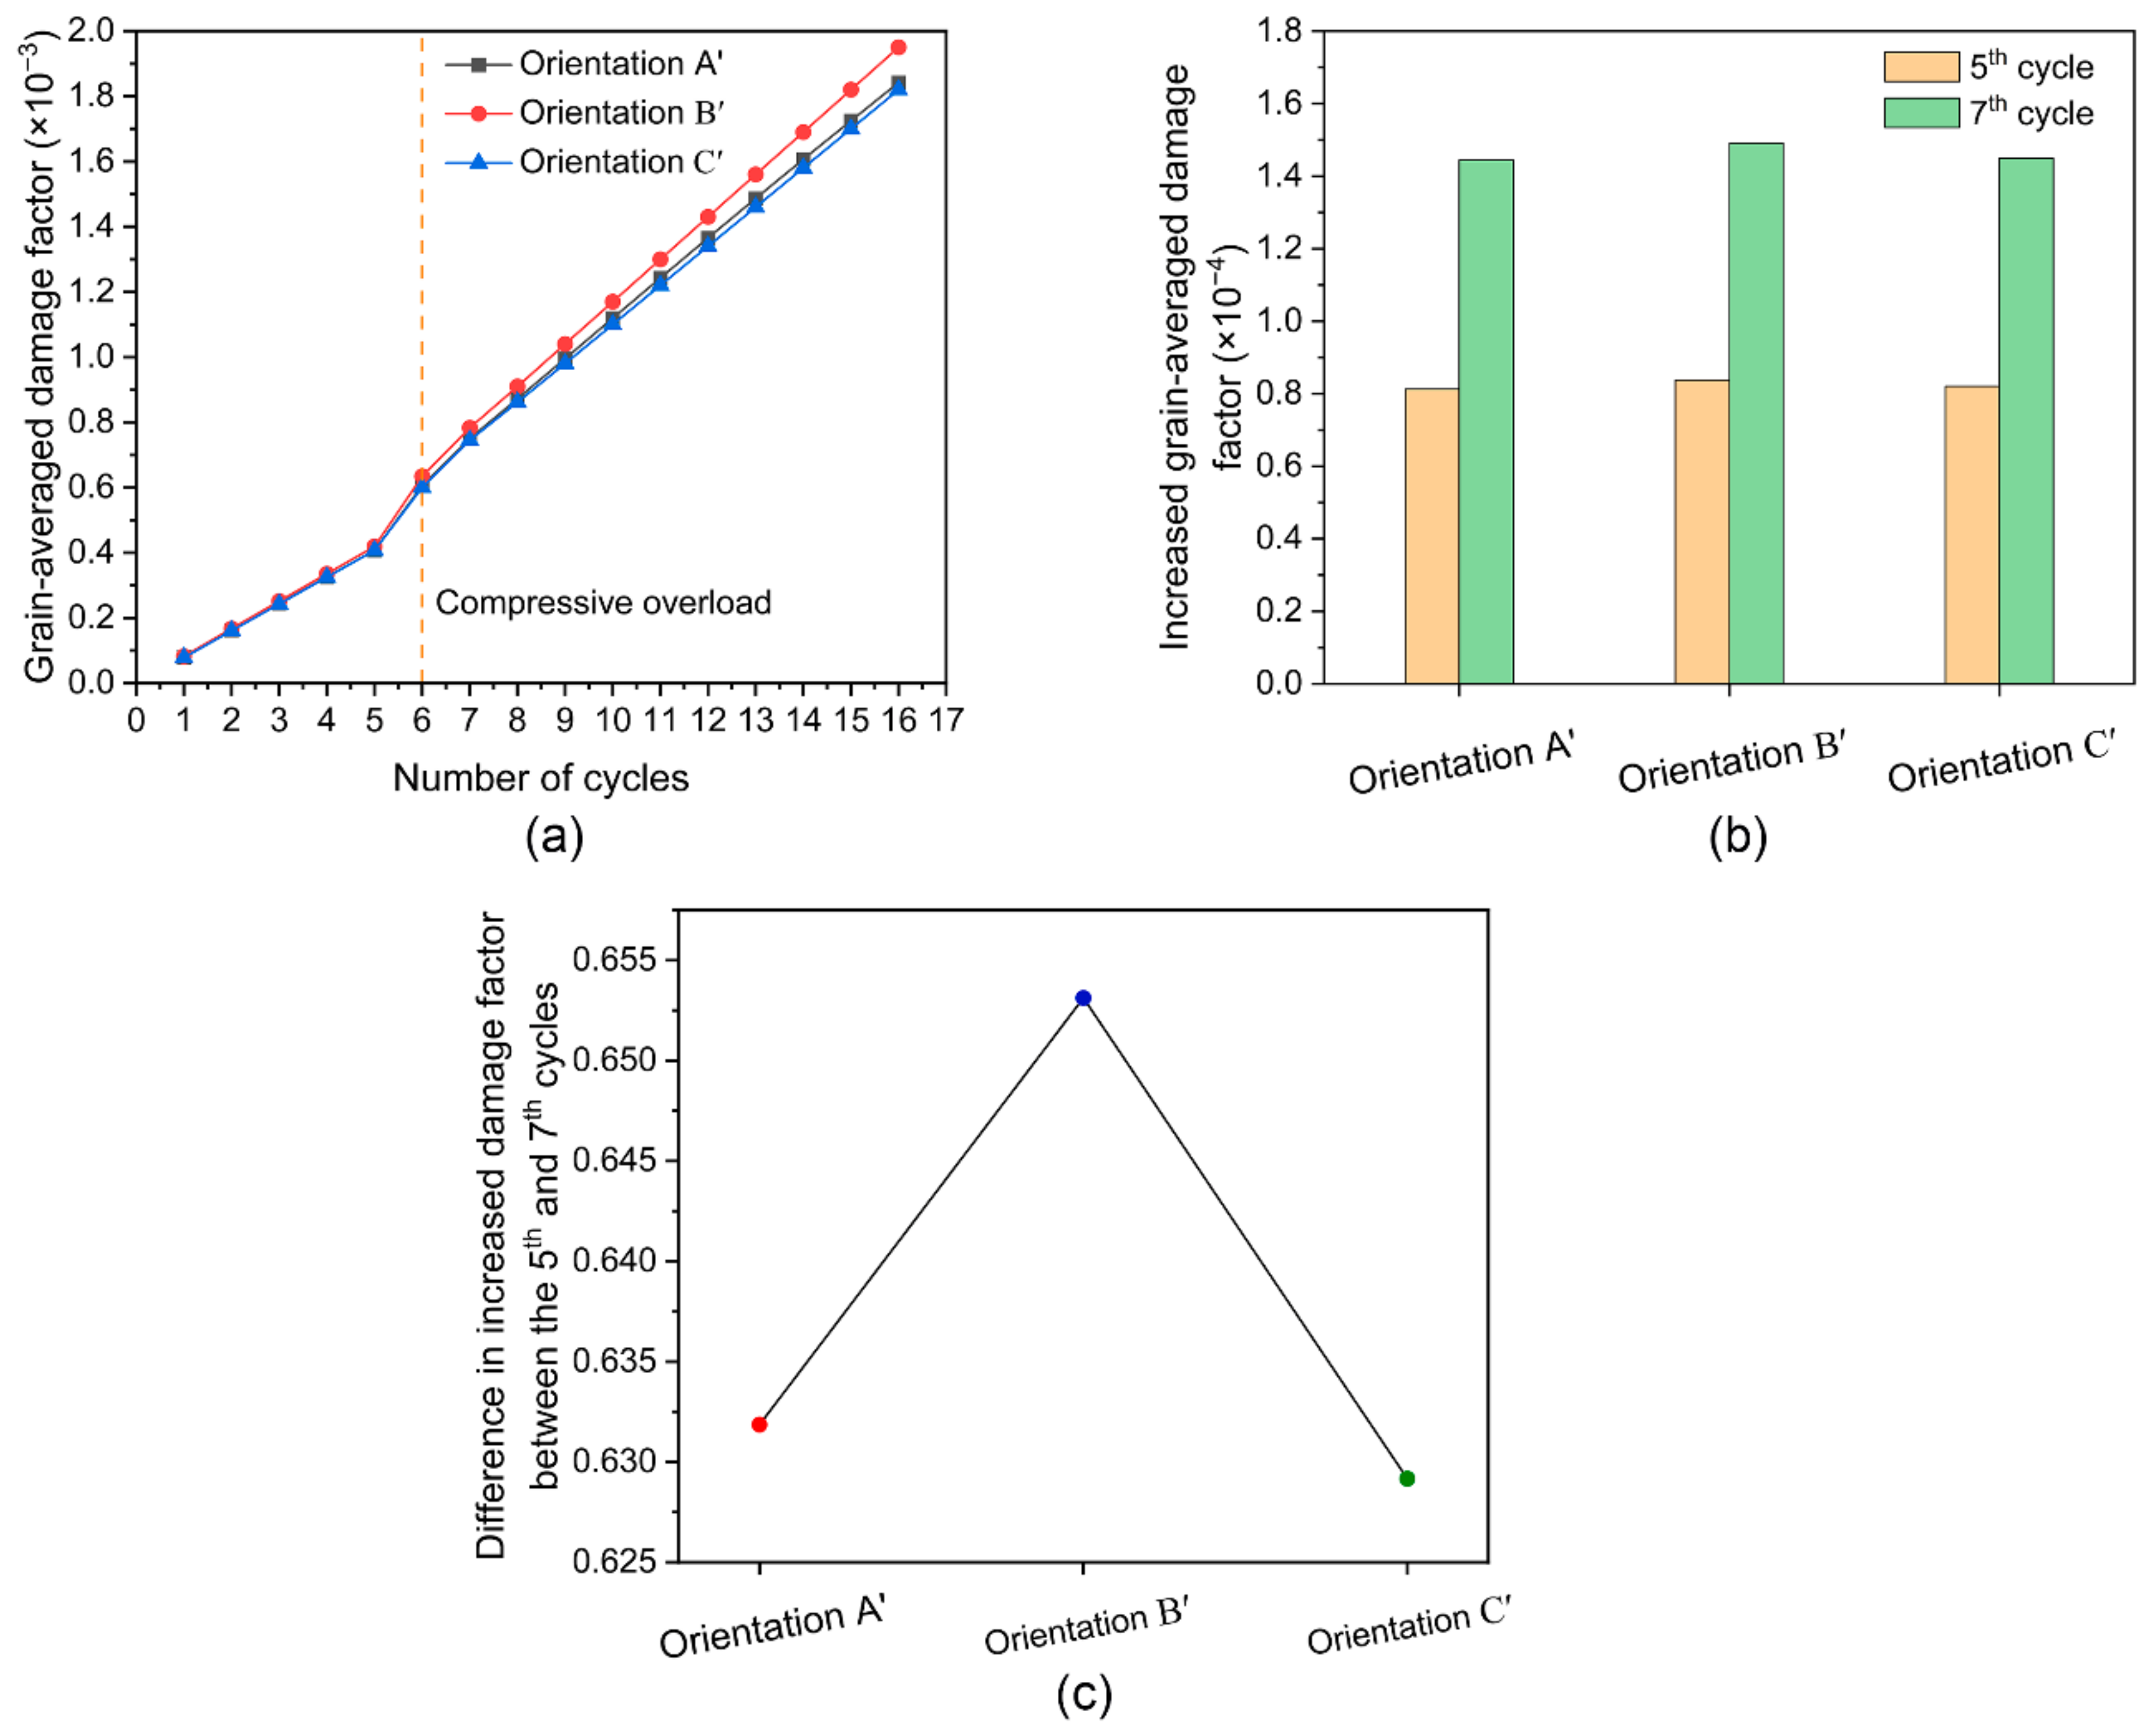
The grain-averaged damage factor of grain G2 as a function of the number of fatigue cycles is shown in Figure 22a. The fatigue damage evolutions become different by changing the orientations of the nearest neighbor grains, indicating that the fatigue damage accumulation ahead of the crack tip is influenced by the orientations of the nearest neighbor grains under the cyclic load with a single compressive overload. For grain G2 in each case, the increases in grain-averaged damage factor at the fifth and seventh cycles are shown in Figure 22b. It can be seen that the grain-averaged damage factor increase at the seventh cycle is greater than that at the fifth cycle in each case, indicating that the effect of compressive overload accelerates the fatigue damage accumulation ahead of the crack tip regardless of the orientation of the nearest neighbor grains. Furthermore, the difference in the grain-averaged damage factor of grain G2 between the fifth and seventh cycles in each case is shown in Figure 22c. It can be seen that the difference value varies in different cases, indicating that the fatigue damage acceleration caused by the effect of compressive overload depends on the orientation of the nearest neighbor grains. This is attributed to the fact that under the cyclic load with a single compressive overload, the local stress and strain fields are changed to satisfy both the strain compatibility and stress equilibrium when the orientation of the nearest neighbor grains varies, which eventually affects the local fatigue damage accumulation.

Figure 22.
(a) Grain-averaged damage factor as a function of fatigue cycles; (b) increases in grain-averaged damage factor at the 5th and 7th cycles; (c) difference in grain-averaged damage factor increase between the 5th and 7th cycles for grain G2 under three different orientations of the nearest neighbor grains.
5. Conclusions
Based on the dual-scale modeling approach and the damage-coupled crystal plasticity model, the effect of microstructure on the damage accumulation ahead of the crack tip under the cyclic load with a single compressive overload are investigated to provided further insight into the mechanisms of fatigue crack acceleration in 7075 aluminum alloy. The deformation and the evolutions of dislocation density and fatigue damage are discussed. The main conclusions are summarized as follows:
- (1)
- The ratchetting strain ahead of the crack tip increases with the level of compressive overload ratio, which is attributed to the fact that higher compressive overloading induces greater tensile residual stress ahead of the crack tip.
- (2)
- The number of activated slip systems ahead of the crack tip increases with an increase in compressive overloading. This causes the rate of dislocation multiplication to be faster, thereby accelerating the accumulation of fatigue damage.
- (3)
- The effect of compressive overload changes the activity of slip system, which is another factor accelerating the damage accumulation after the compressive overload. Furthermore, the change in slip system activity caused by the effect of compressive overload depends on the grain orientation.
- (4)
- For a grain ahead of the crack tip, the acceleration of fatigue damage accumulation caused by the effect of compressive overload is influenced by the orientation of its nearest neighbor grains.
Author Contributions
Conceptualization, C.X., T.S. and Z.Z.; methodology, C.X., T.S., L.L. and Z.Z.; software, C.X., validation, C.X., formal analysis, C.X., L.L. and Z.Z.; investigation, C.X., T.S., L.L. and Z.Z.; resources, C.X. and L.L. data curation, C.X., writing—original draft preparation, C.X., writing—review and editing, C.X. and Z.Z.; sualization, C.X., upervision, C.X., L.L. project administration, C.X., T.S. and Z.Z.; Conceptualization, C.X., T.S., and Z.Z.; methodology, C.X., T.S., L.L. and Z.Z.; software, C.X., validation, C.X., formal analysis, C.X., L.L. and Z.Z.; investigation, C.X., T.S., L.L. and Z.Z.; resources, C.X. and L.L. data curation, C.X., writing—original draft preparation, C.X., writing—review and editing, C.X. and Z.Z.; sualization, C.X., upervision, C.X., L.L. project administration, C.X., T.S. and Z.Z.; All authors have read and agreed to the published version of the manuscript.
Funding
This research was sponsored by the National Natural Science Foundation of China (Grant Nos. 52265018 and 51675110), the Guangxi Natural Science Foundation on youth Project (Grant No. 2023JJB110039) and the Natural Science Foundation of Guangxi (Grant No. 2021GXNSFAA220119).
Data Availability Statement
The original contributions presented in the study are included in the article, further inquiries can be directed to the corresponding authors.
Conflicts of Interest
The authors declare no conflict of interest.
References
- Imran, M.; Khan, A.R.A. Characterization of Al-7075 metal matrix composites: A review. J. Mater. Res. Technol. 2019, 8, 3347–3356. [Google Scholar] [CrossRef]
- Park, S.Y.; Kim, W.J. Difference in the Hot Compressive Behavior and Processing Maps between the As-cast and Homogenized Al-Zn-Mg-Cu (7075) Alloys. J. Mater. Sci. Technol. 2016, 32, 660–670. [Google Scholar] [CrossRef]
- Gao, P.; Wang, X.; Liang, Z.; Xiang, J.; Li, W.; Xie, J. Effects of WC grain size and Co content on microscale wear behavior of micro end mills in aluminum alloy 7075 machining. Int. J. Adv. Manuf. Technol. 2019, 104, 2401–2413. [Google Scholar] [CrossRef]
- Senthil, K.; Iqbal, M.A.; Chandel, P.S.; Gupta, N.K. Study of the constitutive behavior of 7075-T651 aluminum alloy. Int. J. Impact Eng. 2017, 108, 171–190. [Google Scholar] [CrossRef]
- Yu, X.R.; Zhang, G.F.; Jin, H.H.; Song, A.X. A data driven model for estimating the fatigue life of 7075-T651 aluminum alloy based on the updated BP model. J. Mater. Res. Technol. 2023, 24, 1252–1263. [Google Scholar]
- Stephens, R.I.; Chen, D.K.; Hom, B.W. Fatigue crack growth with negative stress ratio following single overload in 2024-T3 and 7075-T6 aluminum alloys. In Fatigue Crack Growth under Spectrum Loads, ASTM STP 595; ASTM: Philadelphia, PA, USA, 1976. [Google Scholar]
- Zhao, T.; Zhang, J.; Jiang, Y. A study of fatigue crack growth of 7075-T651 aluminum alloy. Int. J. Fatigue 2008, 30, 1169–1180. [Google Scholar] [CrossRef]
- Antunes, F.V.; Paiva, L.; Branco, R.; Borrego, L.P. Effect of underloads on plasticity-induced crack closure: A numerical analysis. J. Eng. Mater. Technol. 2019, 141, 031008. [Google Scholar] [CrossRef]
- Liang, H.; Zhan, R.; Wang, D.; Deng, C.; Guo, B.; Xu, X. Fatigue crack growth under overload/underload in different strength structural steels. J. Constr. Steel. Res. 2022, 192, 107213. [Google Scholar] [CrossRef]
- Liang, H.; Wang, D.; Deng, C.; Zhan, R. Fatigue crack growth acceleration in S355 steel under a single and periodic underload. Int. J. Fatigue 2022, 158, 106744. [Google Scholar] [CrossRef]
- Liang, H.; Zhan, R.; Wang, D.; Deng, C.; Xu, X.; Guo, B. Effect of crack-tip deformation on fatigue crack growth: A comparative study under overload/underload conditions. Theor. Appl. Fract. Mech. 2022, 118, 103268. [Google Scholar] [CrossRef]
- Zitounis, V.; Irving, P.E. Fatigue crack acceleration effects during tensile underloads in 7010 and 8090 aluminium alloys. Int. J. Fatigue 2007, 29, 108–118. [Google Scholar] [CrossRef]
- Topper, T.H.; Yu, M.T. The effect of overloads on threshold and crack closure. Int. J. Fatigue 1985, 7, 159–164. [Google Scholar] [CrossRef]
- Dabayeh, A.A.; Topper, T.H. Changes in crack-opening stress after underloads and overloads in 2024-T351 aluminium alloy. Int. J. Fatigue 1995, 17, 261–269. [Google Scholar] [CrossRef]
- Khademi, V.; Bieler, T.R.; Boehlert, C.J. On the correlation between plastic strain and misorientation in polycrystalline body-centered-cubic microstructures with an emphasis on the grain size, loading history, and crystallographic orientation. Int. J. Plast. 2021, 146, 103084. [Google Scholar] [CrossRef]
- Kumar, M.A.; Beyerlein, I.J.; Tomé, C.N. Effect of local stress fields on twin characteristics in HCP metals. Acta Mater. 2016, 116, 143–154. [Google Scholar] [CrossRef]
- Niezgoda, S.R.; Kanjarla, A.K.; Beyerlein, I.J.; Tomé, C.N. Stochastic modeling of twin nucleation in polycrystals: An application in hexagonal close-packed metals. Int. J. Plast. 2014, 56, 119–138. [Google Scholar] [CrossRef]
- Bhattacharyya, S.; Heo, T.W.; Chang, K.; Chen, L.Q. A phase-field model of stress effect on grain boundary migration. Model. Simul. Mater. Sci. Eng. 2011, 19, 035002. [Google Scholar] [CrossRef]
- Zhang, W.; Simpson, C.A.; Lopez-Crespo, P.; Mokhtarishirazabad, M.; Buslaps, T.; Pippan, R.; Withers, P.J. The effect of grain size on the fatigue overload behaviour of nickel. Mater. Des. 2020, 189, 108526. [Google Scholar] [CrossRef]
- Zhang, W.; Simpson, C.A.; Leitner, T.; Zhang, X.; Pippan, R.; Withers, P.J. The effect of anisotropic microstructure on the crack growth and fatigue overload behaviour of ultrafine-grained nickel. Acta Mater. 2020, 184, 225–240. [Google Scholar] [CrossRef]
- Salvati, E.; O’Connor, S.; Sui, T.; Nowell, D.; Korsunsky, A.M. A study of overload effect on fatigue crack propagation using EBSD, FIB-DIC and FEM methods. Eng. Fract. Mech. 2016, 167, 210–223. [Google Scholar] [CrossRef]
- Lam, T.-N.; Chin, H.-H.; Zhang, X.; Feng, R.; Wang, H.; Chiang, C.-Y.; Lee, S.Y.; Kawasaki, T.; Harjo, S.; Liaw, P.K.; et al. Tensile overload-induced texture effects on the fatigue resistance of a CoCrFeMnNi high-entropy alloy. Acta Mater. 2023, 245, 118585. [Google Scholar] [CrossRef]
- Carroll, J.D.; Abuzaid, W.; Lambros, J.; Sehitoglu, H. High resolution digital image correlation measurements of strain accumulation in fatigue crack growth. Int. J. Fatigue 2013, 57, 140–150. [Google Scholar] [CrossRef]
- Farukh, F.; Zhao, L.G.; Jiang, R.; Reed, P.; Proprentner, D.; Shollock, B.A. Realistic microstructure-based modelling of cyclic deformation and crack growth using crystal plasticity. Comput. Mater. Sci. 2016, 111, 395–405. [Google Scholar] [CrossRef]
- Lemaitre, J. A continuous damage mechanics model for ductile fracture. J. Eng. Mater. Technol. 1985, 107, 83–89. [Google Scholar] [CrossRef]
- Zhang, W.T.; Jiang, R.; Zhao, Y.; Zhang, L.C.; Zhang, L.; Zhao, L.G.; Song, Y.D. Effects of temperature and microstructure on low cycle fatigue behaviour of a PM Ni-based superalloy: EBSD assessment and crystal plasticity simulation. Int. J. Fatigue 2022, 159, 106818. [Google Scholar] [CrossRef]
- Ye, C.; Liu, G.; Chen, K.; Liu, J.; Hu, J.; Yu, Y.; Mao, Y.; Shen, Y. Strain-rate dependent crystal plasticity model and aluminum softening/hardening transition. Comput. Mater. Sci. 2023, 222, 112108. [Google Scholar] [CrossRef]
- Huang, A.; Fensin, S.J.; Meyers, M.A. Strain-rate effects and dynamic behavior of high entropy alloys. J. Mater. Res. Technol. 2023, 22, 307–347. [Google Scholar]
- Sharma, R.; Sargeant, D.; Daroju, S.; Knezevic, M.; Miles, M.P.; Fullwood, D.T. Multi-strain path deformation behavior of AA6016-T4: Experiments and crystal plasticity modeling. Int. J. Solids Struct. 2022, 244–245, 111536. [Google Scholar] [CrossRef]
- Aoba, T.; Kobayashi, M.; Miura, H. Effects of aging on mechanical properties and microstructure of multi-directionally forged 7075 aluminum alloy. Mater. Sci. Eng. A 2017, 700, 220–225. [Google Scholar] [CrossRef]
- Pesin, A.; Korchunov, A.; Pustovoytov, D. Numerical study of grain evolution and dislocation density during asymmetric rolling of aluminum alloy 7075. Key Eng. Mater. 2015, 685, 162–166. [Google Scholar] [CrossRef]
- Khadyko, M.; Dumoulin, S.; Cailletaud, G.; Hopperstad, O.S. Latent hardening and plastic anisotropy evolution in AA6060 aluminium alloy. Int. J. Plast. 2016, 76, 51–74. [Google Scholar] [CrossRef]
- Zheng, Z.; Xie, C.; Chen, J.; Huang, Z. A crystal plasticity model of low cycle fatigue damage considering dislocation density, stress triaxiality and Lode parameter. Int. J. Fatigue 2023, 175, 107823. [Google Scholar] [CrossRef]
- Liu, Y.; Zhu, Y.; Oskay, C.; Hu, P.; Ying, L.; Wang, D. Experimental and computational study of microstructural effect on ductile fracture of hot-forming materials. Mater. Sci. Eng. A 2018, 724, 298–323. [Google Scholar] [CrossRef]
- Shi, G.; Gao, Y.; Wang, X.; Zhang, Y. Mechanical properties and constitutive models of low yield point steels. Constr. Build. Mater. 2018, 175, 570–587. [Google Scholar] [CrossRef]
- Basan, R.; Franulović, M.; Prebil, I.; Kunc, R. Study on Ramberg-Osgood and Chaboche models for 42CrMo4 steel and some approximations. J. Constr. Steel Res. 2017, 136, 65–74. [Google Scholar] [CrossRef]
- Koo, G.H.; Lee, J.H. Investigation of ratcheting characteristics of modified 9Cr-1Mo steel by using the Chaboche constitutive model. Int. J. Pres. Ves. Pip. 2007, 84, 284–292. [Google Scholar] [CrossRef]
- Bathias, C. Retrospective view on the role of the plastic zone at a fatigue crack tip. Fatigue Fract. Eng. Mater. Struct. 1996, 19, 1301–1306. [Google Scholar] [CrossRef]
- Paul, S.K. Numerical models of plastic zones and associated deformations for a stationary crack in a C(T) specimen loaded at different R-ratios. Theor. Appl. Fract. Mech. 2016, 84, 183–191. [Google Scholar] [CrossRef]
- Paul, S.K. Numerical models of plastic zones and associated deformations for elliptical inclusions in remote elastic loading-unloading with different R-ratios. Eng. Fract. Mech. 2016, 152, 72–80. [Google Scholar] [CrossRef]
- Hosseini, Z.S.; Dadfarnia, M.; Somerday, B.P.; Sofronis, P.; Ritchie, R.O. On the theoretical modeling of fatigue crack growth. J. Mech. Phys. Solids 2018, 121, 341–362. [Google Scholar] [CrossRef]
- Zhu, F.; Zhang, M.L.; Zhang, C.J.; He, P.F.; Dai, Y. Experimental investigation and crystal plasticity modeling of combined high and low cycle loading on AISI 4140 steel. Int. J. Fatigue 2023, 168, 107465. [Google Scholar] [CrossRef]
- Bahloul, A.; Bouraoui, C. The overload effect on the crack-tip cyclic plastic deformation response in SA333 Gr 6 C-Mn steel. Theor. Appl. Fract. Mech. 2019, 99, 27–35. [Google Scholar] [CrossRef]
- Colas, D.; Finot, E.; Flouriot, S.; Forest, S.; Mazière, M.; Paris, T. Local ratcheting phenomena in the cyclic behavior of polycrystalline tantalum. JOM 2019, 71, 2586–2599. [Google Scholar] [CrossRef]
- Kang, G.Z.; Li, Y.; Kan, Q.H.; Zhang, J. Uniaxial ratchetting in steels with different cyclic softening/hardening behaviours. Fatigue Fract. Eng. Mater. Struct. 2006, 29, 93–103. [Google Scholar] [CrossRef]
- Kardomateas, G.A.; Carlson, R.L. Predicting the effects of load ratio on the fatigue crack growth rate and fatigue threshold. Fatigue Fract. Eng. Mater. Struct. 2008, 21, 411–423. [Google Scholar] [CrossRef]
- Zhu, W.; Yuan, G.; Tan, J.; Chang, S.; Tu, S. The Influence of Crystallographic Orientation and Grain Boundary on Nanoindentation Behavior of Inconel 718 Superalloy Based on Crystal Plasticity Theory. Chin. J. Mech. Eng. 2023, 36, 95. [Google Scholar] [CrossRef]
- Kartal, M.E.; Cuddihy, M.A.; Dunne, F.P.E. Effects of crystallographic orientation and grain morphology on crack tip stress state and plasticity. Int. J. Fatigue 2014, 61, 46–58. [Google Scholar] [CrossRef]
- Srivatsan, T.S.; Yamaguchi, K.; Starke, E.A. The effect of environment and temperature on the low cycle fatigue behavior of aluminum alloy 2020. Mater. Sci. Eng. 1986, 83, 87–107. [Google Scholar]
- Messerschmidt, U.; Bartsch, M. Generation of dislocations during plastic deformation. Mater. Chem. Phys. 2003, 81, 518–523. [Google Scholar] [CrossRef]
- Lebensohn, R.A.; Tomé, C.N. A self-consistent anisotropic approach for the simulation of plastic deformation and texture development of polycrystals: Application to zirconium alloys. Acta Metall. Mater. 1993, 41, 2611–2624. [Google Scholar] [CrossRef]
- Akhondzadeh, S.; Sills, R.B.; Bertin, N.; Cai, W. Dislocation density-based plasticity model from massive discrete dislocation dynamics database. J. Mech. Phys. Solids 2020, 145, 104152. [Google Scholar] [CrossRef]
- Xu, Q.; Wang, X. Experimental study on high-cycle flexural fatigue behavior of cement mortar for ballastless track of high-speed railway. Constr. Build. Mater. 2023, 385, 131525. [Google Scholar] [CrossRef]
- Kirchlechner, C.; Imrich, P.J.; Liegl, W.; Pörnbacher, J.; Micha, J.-S.; Ulrich, O.; Motz, C. On the reversibility of dislocation slip during small scale low cycle fatigue. Acta Mater. 2015, 94, 69–77. [Google Scholar] [CrossRef]
- Zhang, J.; Joshi, S.P. Phenomenological crystal plasticity modeling and detailed micromechanical investigations of pure magnesium. J. Mech. Phys. Solids 2012, 60, 945–972. [Google Scholar] [CrossRef]
- Stopka, K.S.; Yaghoobi, M.; Allison, J.E.; McDowell, D.L. Simulated effects of sample size and grain neighborhood on the modeling of extreme value fatigue response. Acta Mater. 2022, 224, 117524. [Google Scholar] [CrossRef]


Disclaimer/Publisher’s Note: The statements, opinions and data contained in all publications are solely those of the individual author(s) and contributor(s) and not of MDPI and/or the editor(s). MDPI and/or the editor(s) disclaim responsibility for any injury to people or property resulting from any ideas, methods, instructions or products referred to in the content. |
© 2024 by the authors. Licensee MDPI, Basel, Switzerland. This article is an open access article distributed under the terms and conditions of the Creative Commons Attribution (CC BY) license (https://creativecommons.org/licenses/by/4.0/).