Article

Fatigue Response of Additive-Manufactured 316L Stainless Steel

Department of Mechanical Engineering, Howard University, Washington, DC 20059, USA
*
Author to whom correspondence should be addressed.
Metals 2024, 14(9), 988; https://doi.org/10.3390/met14090988
Submission received: 11 July 2024 / Revised: 27 August 2024 / Accepted: 27 August 2024 / Published: 29 August 2024
(This article belongs to the Special Issue Mechanical Properties, Fatigue and Fracture of Metallic Materials)

Abstract

:
This study investigated the fatigue performance of 316L stainless steel fabricated via laser powder bed fusion (LPBF). Stress-controlled fatigue tests were performed at different stress amplitudes on vertically built samples using a frequency of 15 Hz and a stress ratio of 0.1. The stress amplitudes were varied to provide the cyclic response of the materials under a range of loading conditions. The average fatigue strength was determined to be 92.94 MPa, corresponding to a maximum stress of 185.87 MPa. The microstructures were observed through scanning electron microscopy (SEM) with the aid of electron backscattered diffraction (EBSD), and the average grain size of the as-built samples was determined to be 15.6 µm, with most grains having a <110> preferred crystallographic orientation. A higher kernel average misorientation value was measured on the deformed surfaces, revealing the increased misorientation of the grains. Defects were observed on the fractured surfaces acting as crack initiators while deflecting the crack propagation paths. The fatigue failure mode for the LPBF 316L samples was ductile, as illustrated by the numerous dimples on fracture surfaces and fatigue striations.

1. Introduction

The ability to produce complex designs, thin and small structures, and the possibility of quickly changing the material’s microstructure has made Laser Powder Bed Fusion (LPBF) quite popular. LPBF boasts of the precise deposition of metal powders, thus reducing material wastage and increasing accuracy and efficacy [1,2]. The enhanced design freedom has made it a desired method compared to conventional manufacturing methods. Additive Manufacturing (AM) has proven to be quite suitable for prototype designs without compromising their effectiveness and thus encouraging innovation and improvements on existing designs [3,4]. In addition, there is a great demand for lightweight structures, more so in aerospace, medical fields, and automobiles. Lightweight structures in automobiles and aerospace are essential in that they reduce fuel consumption, hence fewer carbon emissions, eventually reducing global warming effects [5]. The aerospace industry is looking at developing materials with a high strength-to-weight ratio, and LPBF is a potential manufacturing method [6,7].
Stainless steel has gained popularity in aerospace due to its high strength-to-weight ratio, hardness values, and good mechanical properties at higher temperatures. It is often used in engines, exhaust components, heat exchangers, landing gears, and fuel tanks [8,9]. Manufacturing various aircraft components requires high precision, reliability, and safety standards. It is, thus, essential that the materials produced for this purpose are efficient.
The fabrication parameters used in the LPBF process are crucial in determining the final material properties and overall performance of the manufactured components. For instance, the build orientation, whether vertical, horizontal, or diagonal, significantly impacts the materials’ fatigue life. Mower and Long [10] studied 316L stainless steel fabricated at different build orientations. The vertically built samples were observed to have lower fatigue lives compared to the horizontally built samples. They also observed that the fatigue strength of LPBF 316L was lower than that of the wrought materials. Hitzler et al. [11] reported that the elongation to failure of the materials was dependent on the orientation of the loading direction with respect to the build direction. Similarly, Yadollahi et al. [12] observed that the lack of fusion affected the vertically built samples more than the horizontally built ones. As such, the horizontal materials had longer fatigue lives compared to the vertically built ones. Also, Shrestha et al. [13] reported that the vertical build orientation possesses improved fatigue resistance over the samples built in the diagonal direction in the as-built condition. The study also improved the surface roughness by machining the samples. Their results showed that the horizontally built LPBF samples had higher fatigue resistance than the vertically built samples. In another study, Alkindi et al. [14] demonstrated the effect of the angle of print. They showed that 17-4 PH stainless steel specimens printed at 90° exhibited lower tensile properties than those printed at 0°. The melt pools and grain structures formed differently under different orientations, thus affecting the grain angle boundaries as well as the orientation of defects. Therefore, the direction of the build plays a critical role in the fatigue life of LPBF samples.
Apart from the build direction and surface roughness, other properties also play a great role, and failure to optimize these parameters can result in numerous defects that eventually reduce the integrity of the final part [15,16]. Some of the common defects include a lack of fusion, the entrapment of gas pores, unmolten materials, residual stresses, and voids [9,17]. The fatigue strength was found to be inferior compared to conventional/wrought 316L steel, as reported by Zhang et al. [18]. Most samples were reported to fail due to a lack of fusion, as their surfaces are either smooth or show parallel lines, triggering fatigue failure. Hamada et al. [19] attributed residual stresses caused by highly localized deformation and dendric cellular structures that possess weak links in their grain boundaries to be points of imperfections that result in fatigue crack propagation. Defects highly influence the fatigue strengths of the materials compared to their quasi-static strength [20,21]. This is because the defects act as stress concentrators where cracks can easily initiate. The impact of defects can be further understood by conducting a microstructural analysis of the LPBF 316L stainless steel samples in this study.
An extensive literature review revealed that numerous investigations have been conducted on the quasistatic properties of LPBF 316L stainless steel. However, a notable research gap is the very limited research on the fatigue behavior of 316 steel produced via the L-PBF method that covers both the High Cycle Fatigue (HCF) and Low Cycle Fatigue (LCF) regions. Therefore, this study addresses this gap by thoroughly examining the microstructure, mechanical properties, and their correlations to its fatigue life. This research aims to deepen the understanding of the underlying fatigue mechanisms and the factors contributing to their fatigue failure. Furthermore, understanding the properties will encourage their applicability in safety-critical applications such as aerospace.

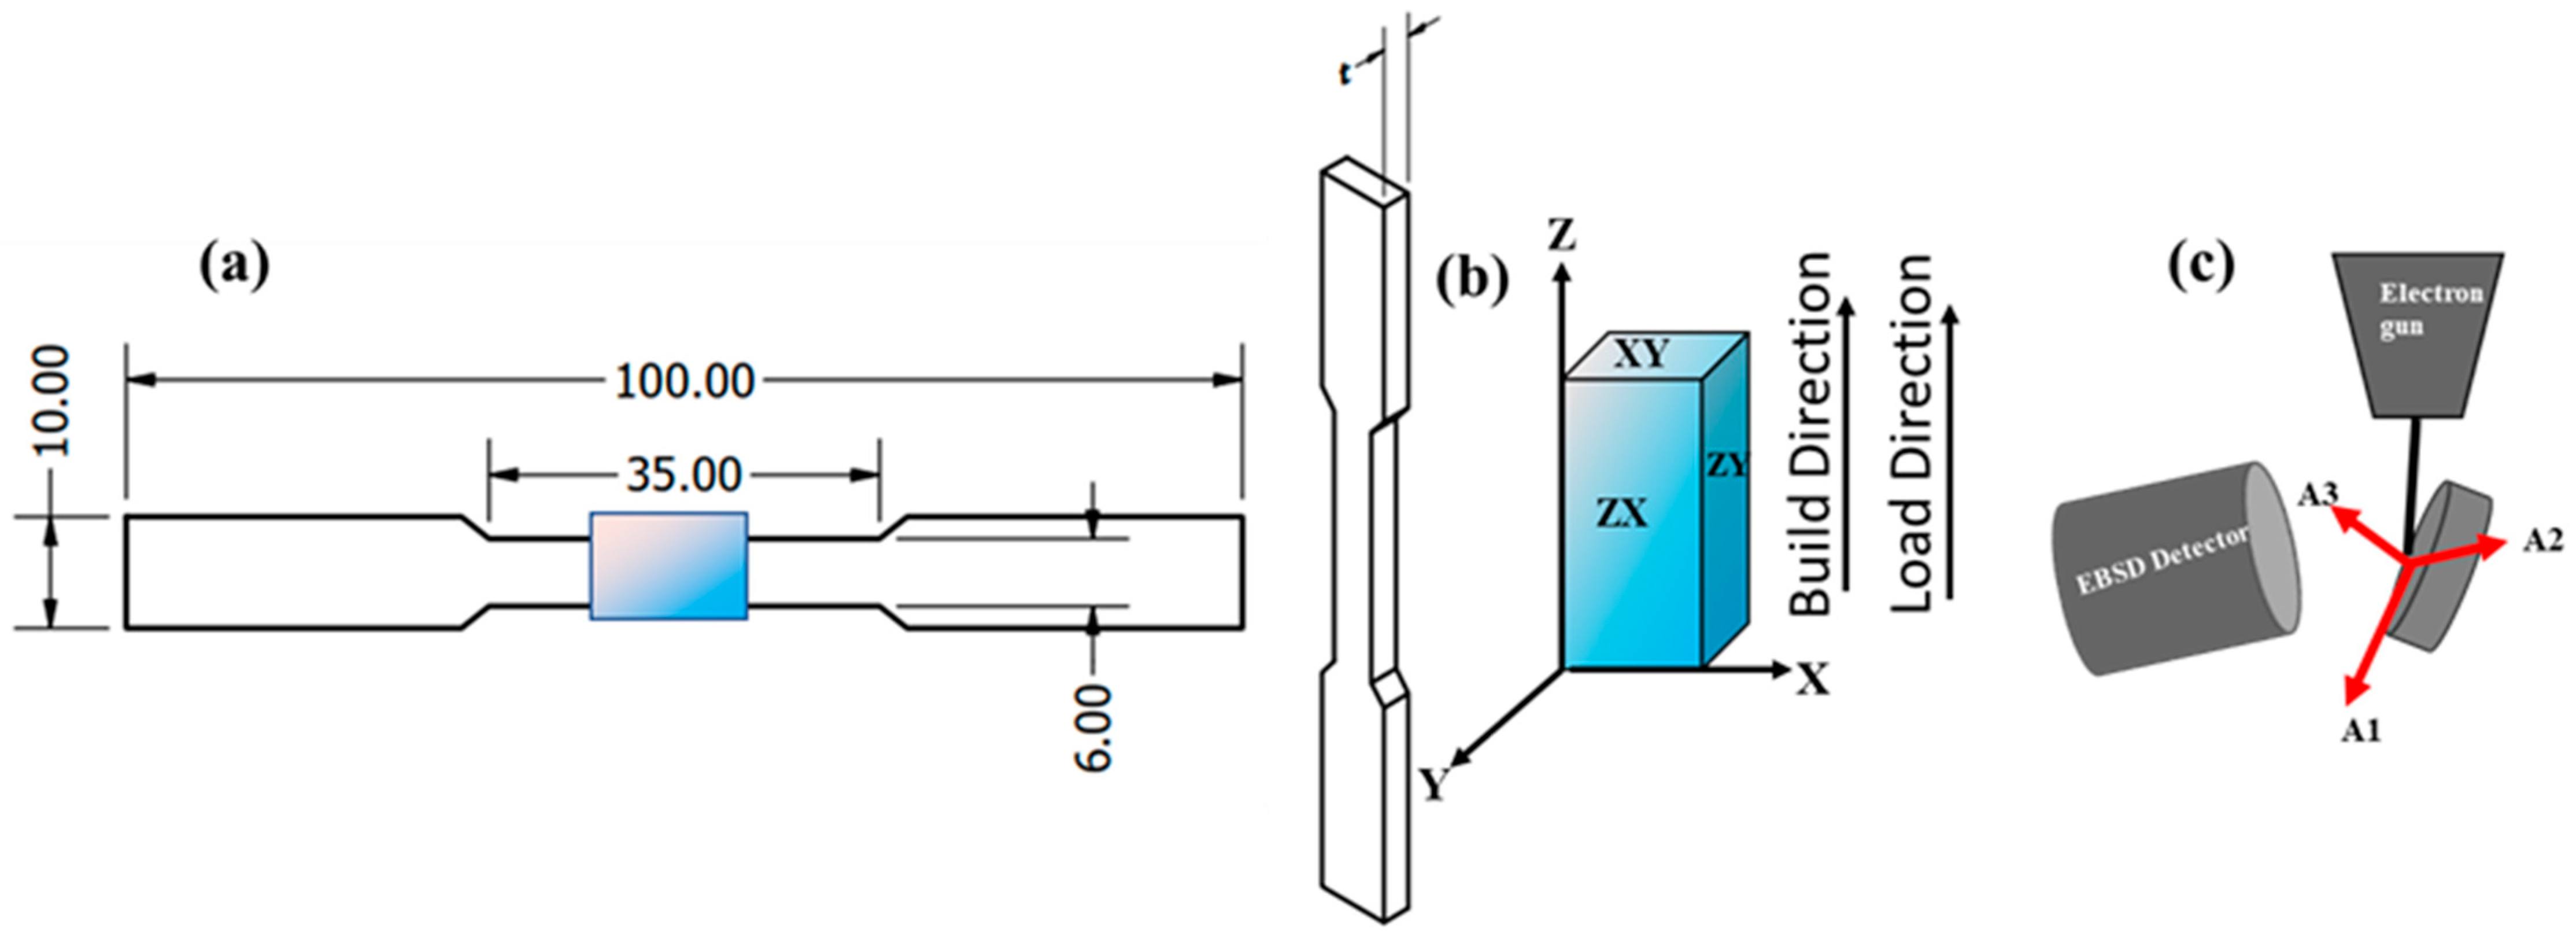
2. Materials and Methods

The LPBF 316L stainless steel dog-bone-shaped samples were fabricated using Renishaw AM250 (Renishaw, Wotton-under-Edge, UK) in a Nitrogen atmosphere of 99.5% purity. The dimensions of the vertically built samples used are illustrated in Figure 1a, with a thickness (t) of 4.0 mm. The build direction is shown in Figure 1b, and the scan direction during electron backscatter diffraction investigation is presented in Figure 1c. The fabrication parameters used are shown in Table 1. A stripe scan strategy was used where the laser beam scanned bidirectionally without rotation. The elemental composition of the powder used is presented in Table 2.
MTS 810 servo-hydraulic test frame with a load capacity of 100 kN was used to conduct both tensile and fatigue tests. The quasi-static tensile tests were conducted at a strain rate of 0.001 s−1 until failure on five samples in accordance with ASTM E8 standards. Stress-controlled fatigue tests were performed at room temperature using a sinusoidal waveform and a frequency of 15 Hz in accordance with ASTM E466 [23] standard specifications. The tests employed a load ratio (R = σ_min/σ_max) of 0.1. The stress amplitudes were determined based on the ultimate tensile strength obtained from the quasi-static tensile tests. Specifically, the tests were performed at stress amplitudes corresponding to 95%, 90%, 80%, 70%, 60%, 50%, 40%, 35%, 30%, and 20% of the ultimate tensile strength, using three samples per stress amplitude. The threshold of runouts for the tension–tension fatigue tests was set to 1 × 10⁶ cycles.
The microstructures of the samples were examined using optical microscopy (OM) and scanning electron microscopy (SEM) equipped with an electron backscatter diffraction (EBSD) detector (TESCAN, Brno-Kohoutovice, Czech Republic). Microstructural characterization was performed on both as-built and deformed samples. EBSD analysis was used to obtain inverse pole figure (IPF) maps, kernel average misorientation (KAM) maps, and grain morphologies. For EBSD and OM analysis, the samples were sectioned at the gage section along the ZX plane. Subsequently, the surfaces of the samples were mechanically polished using silicon carbide paper until a grit size of 1200 was reached and thoroughly rinsed with water. Cloth polishing was followed using a diamond paste of 1 µm, and final polishing was carried out using 0.05 µm colloidal silica to achieve a mirror finish. The samples were then cleaned under water and then ultrasonically with ethanol for 3–5 min before being dried under hot air flow. Kalling’s reagent (Pace Technologies, Tucson, AZ, USA) was used to etch the samples for 50–60 s. The etched samples were observed under OM to give the melt pool sizes and shapes. EBSD data were analyzed using TSL OIM analysis software (V5.3).

3. Results

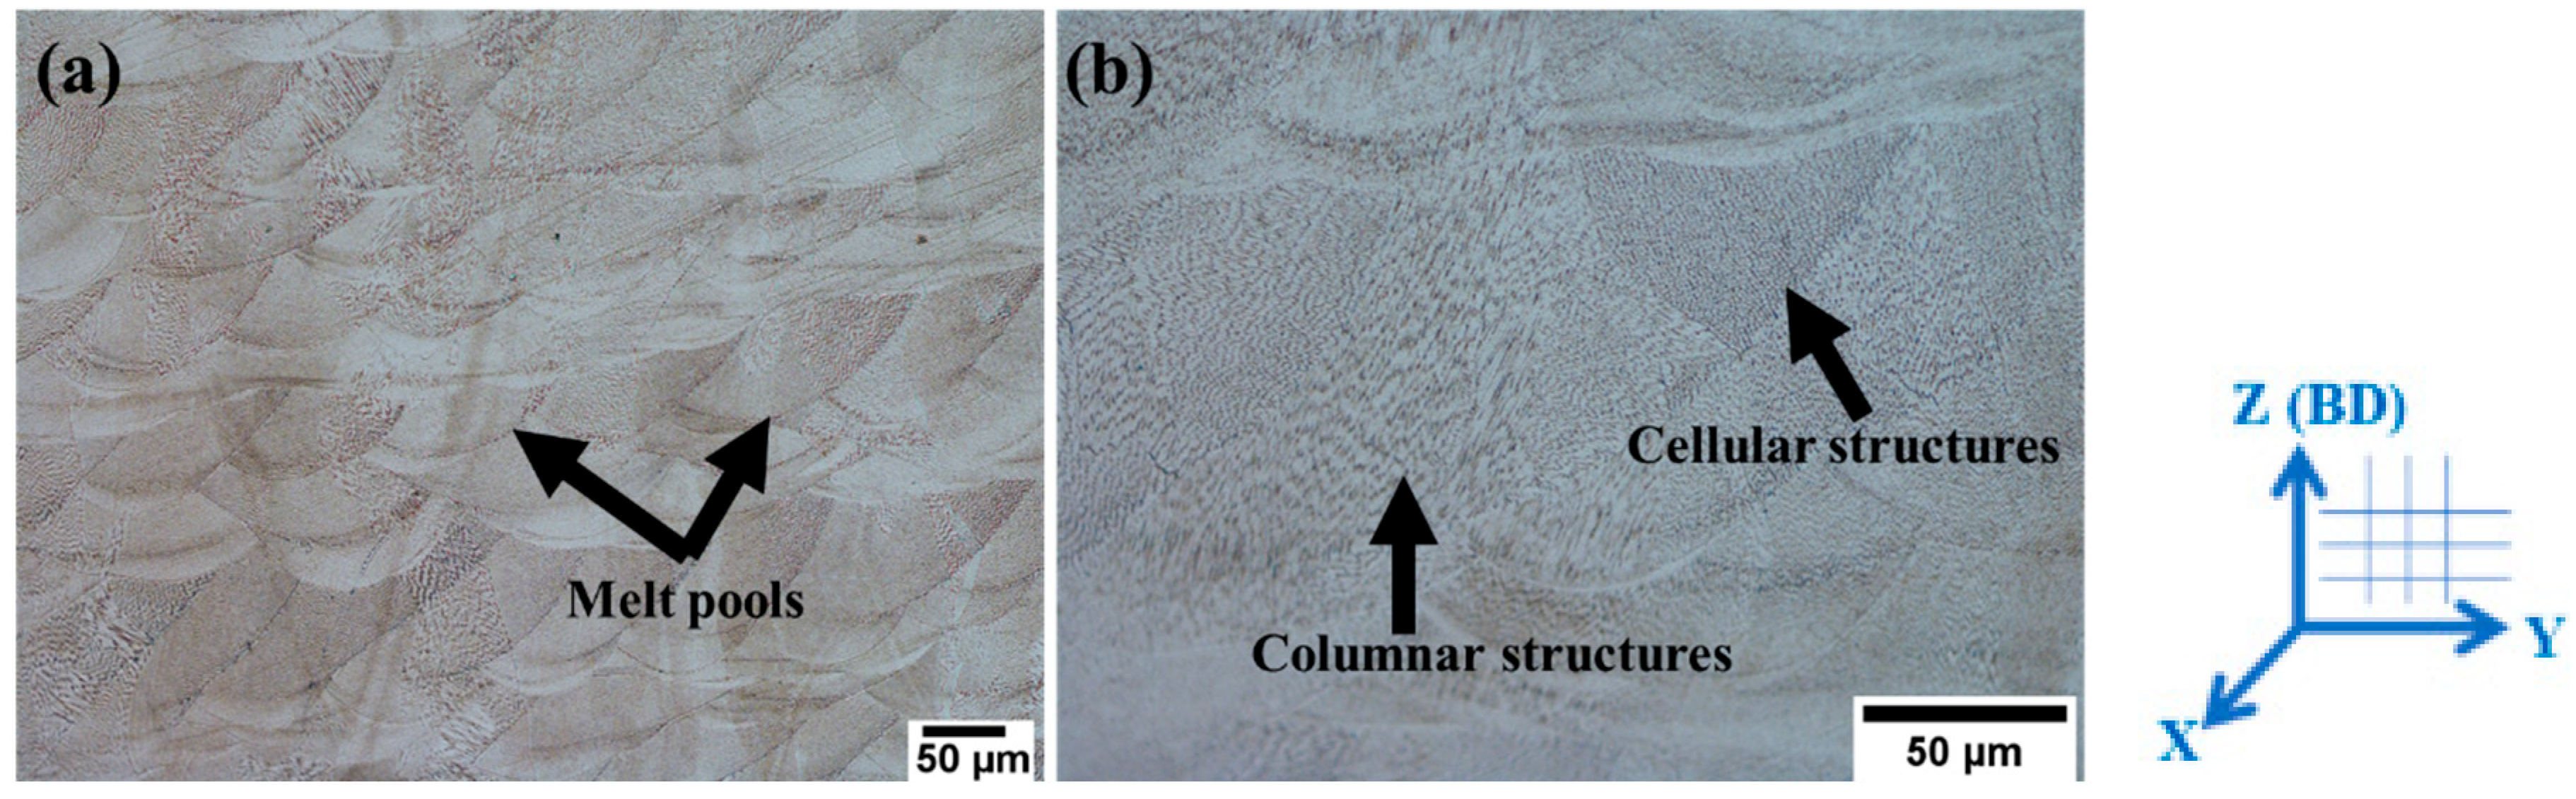
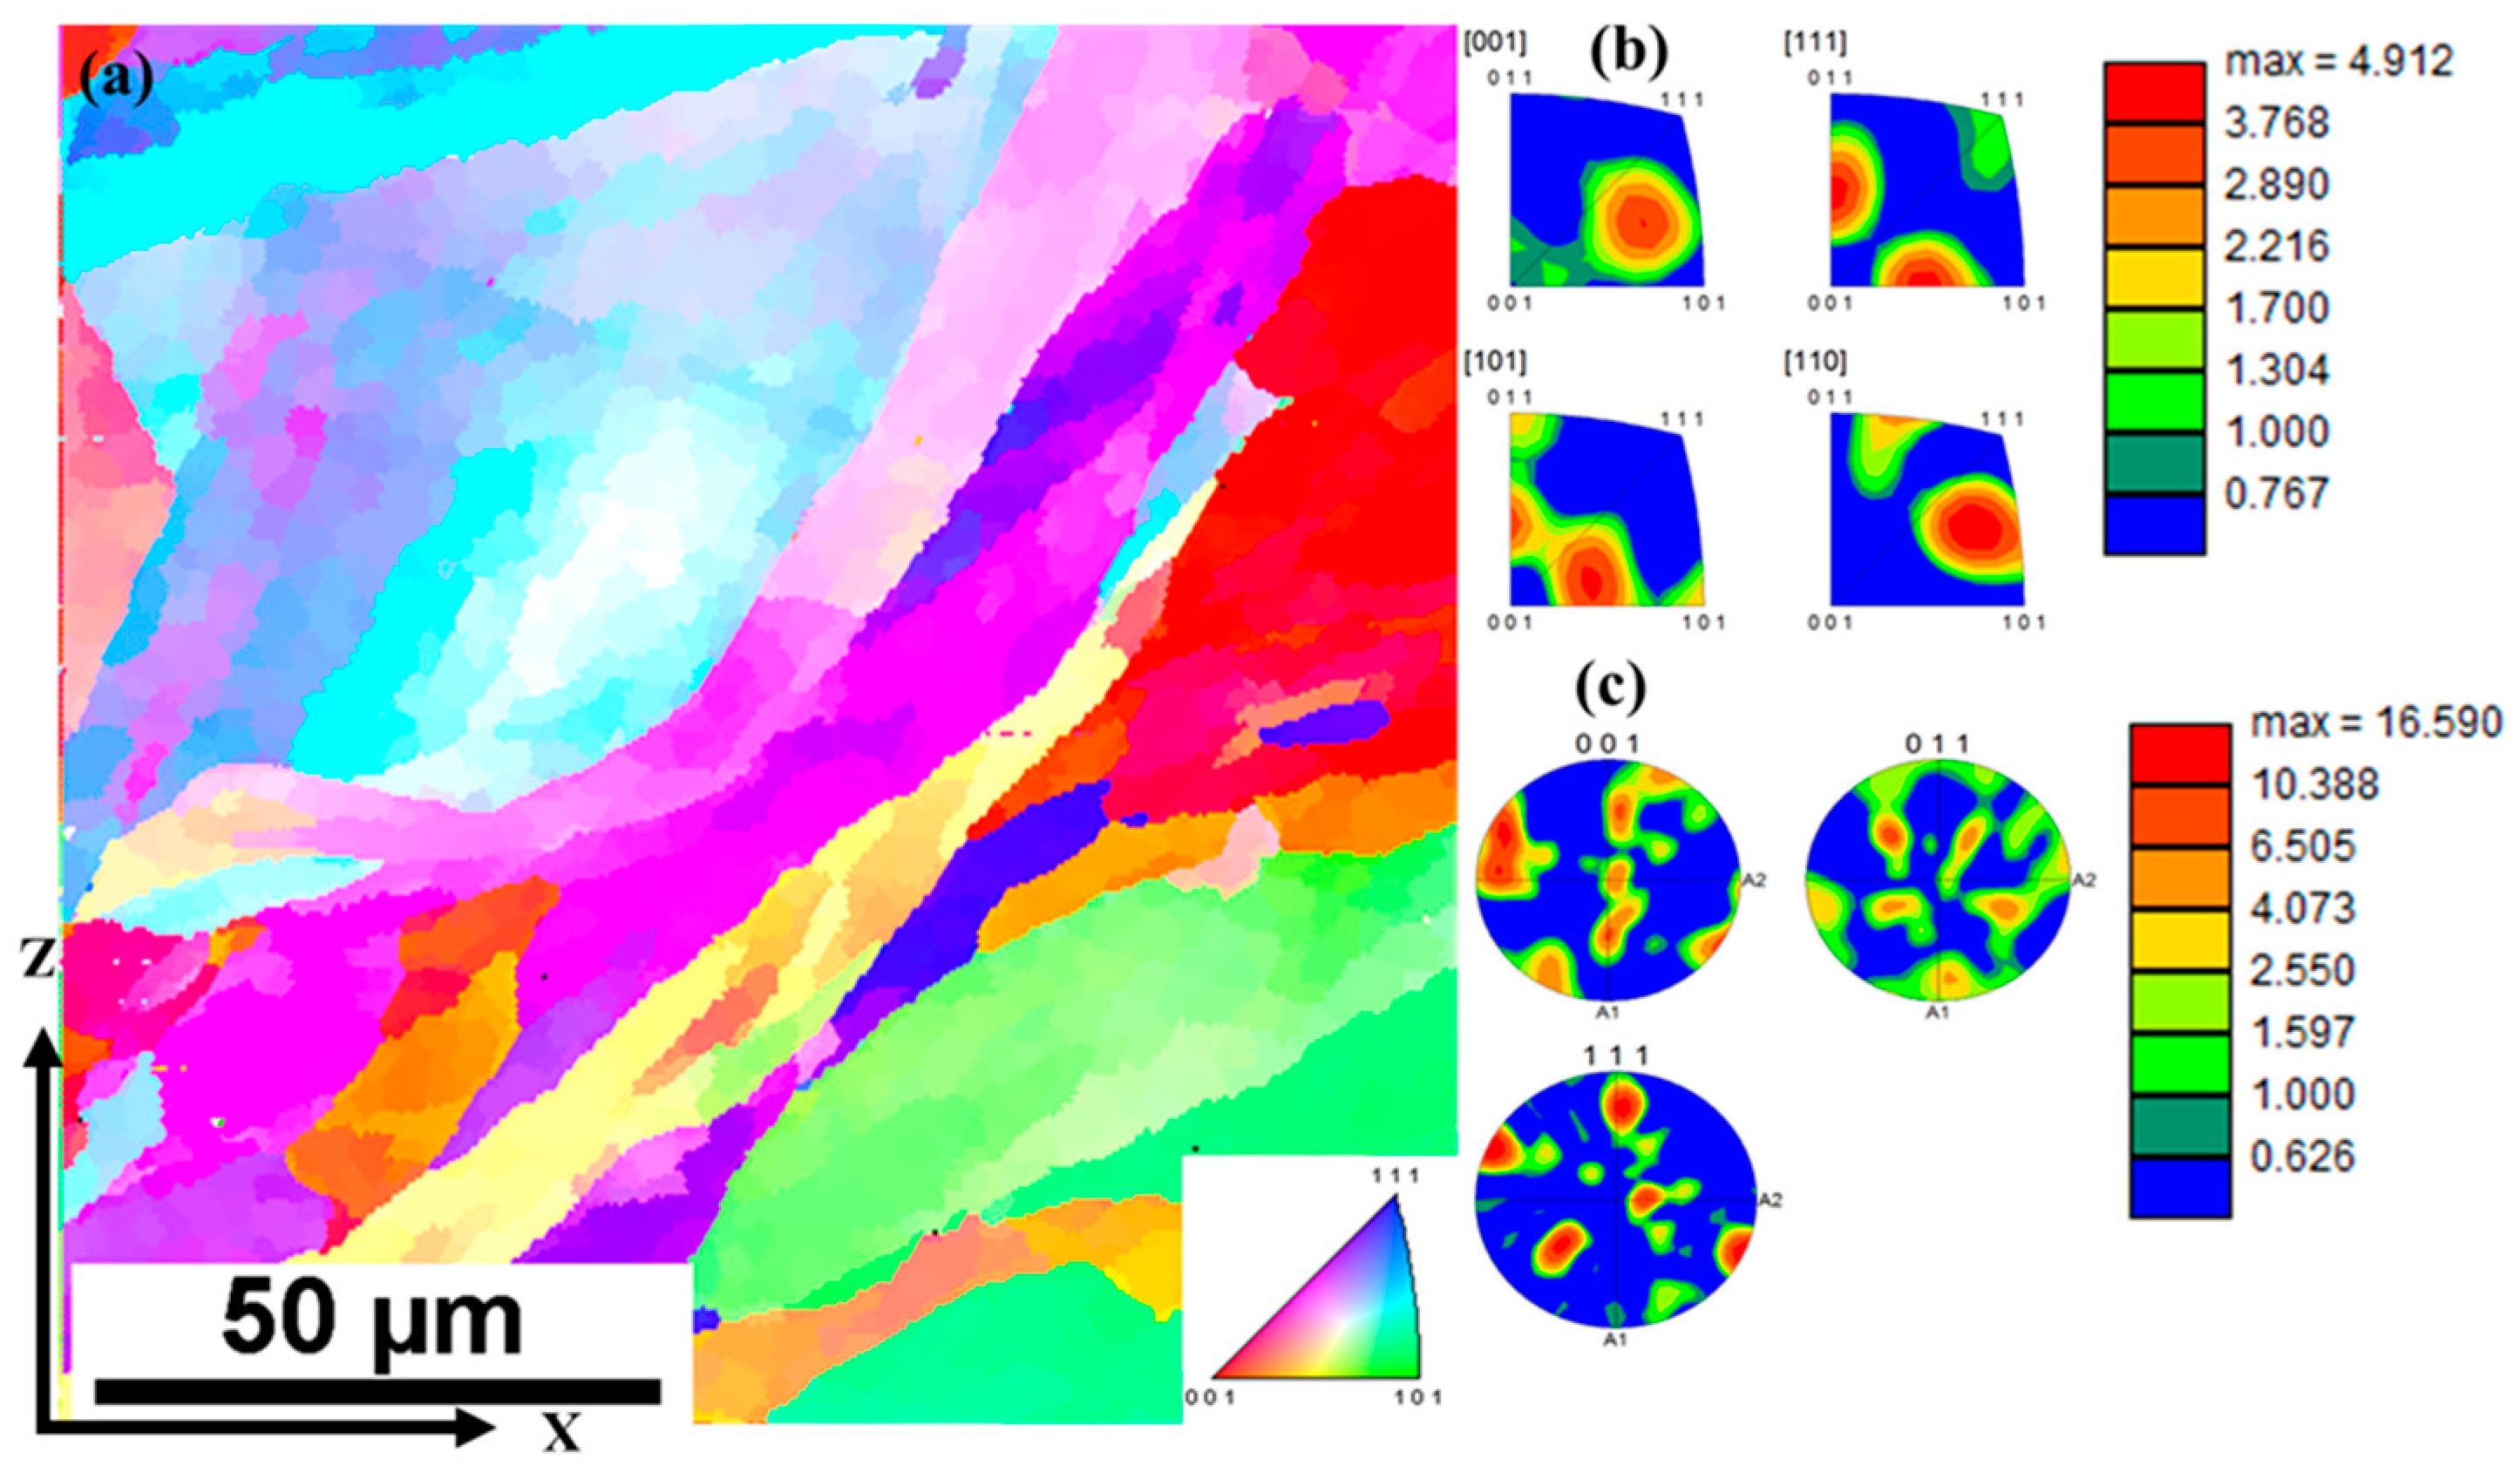
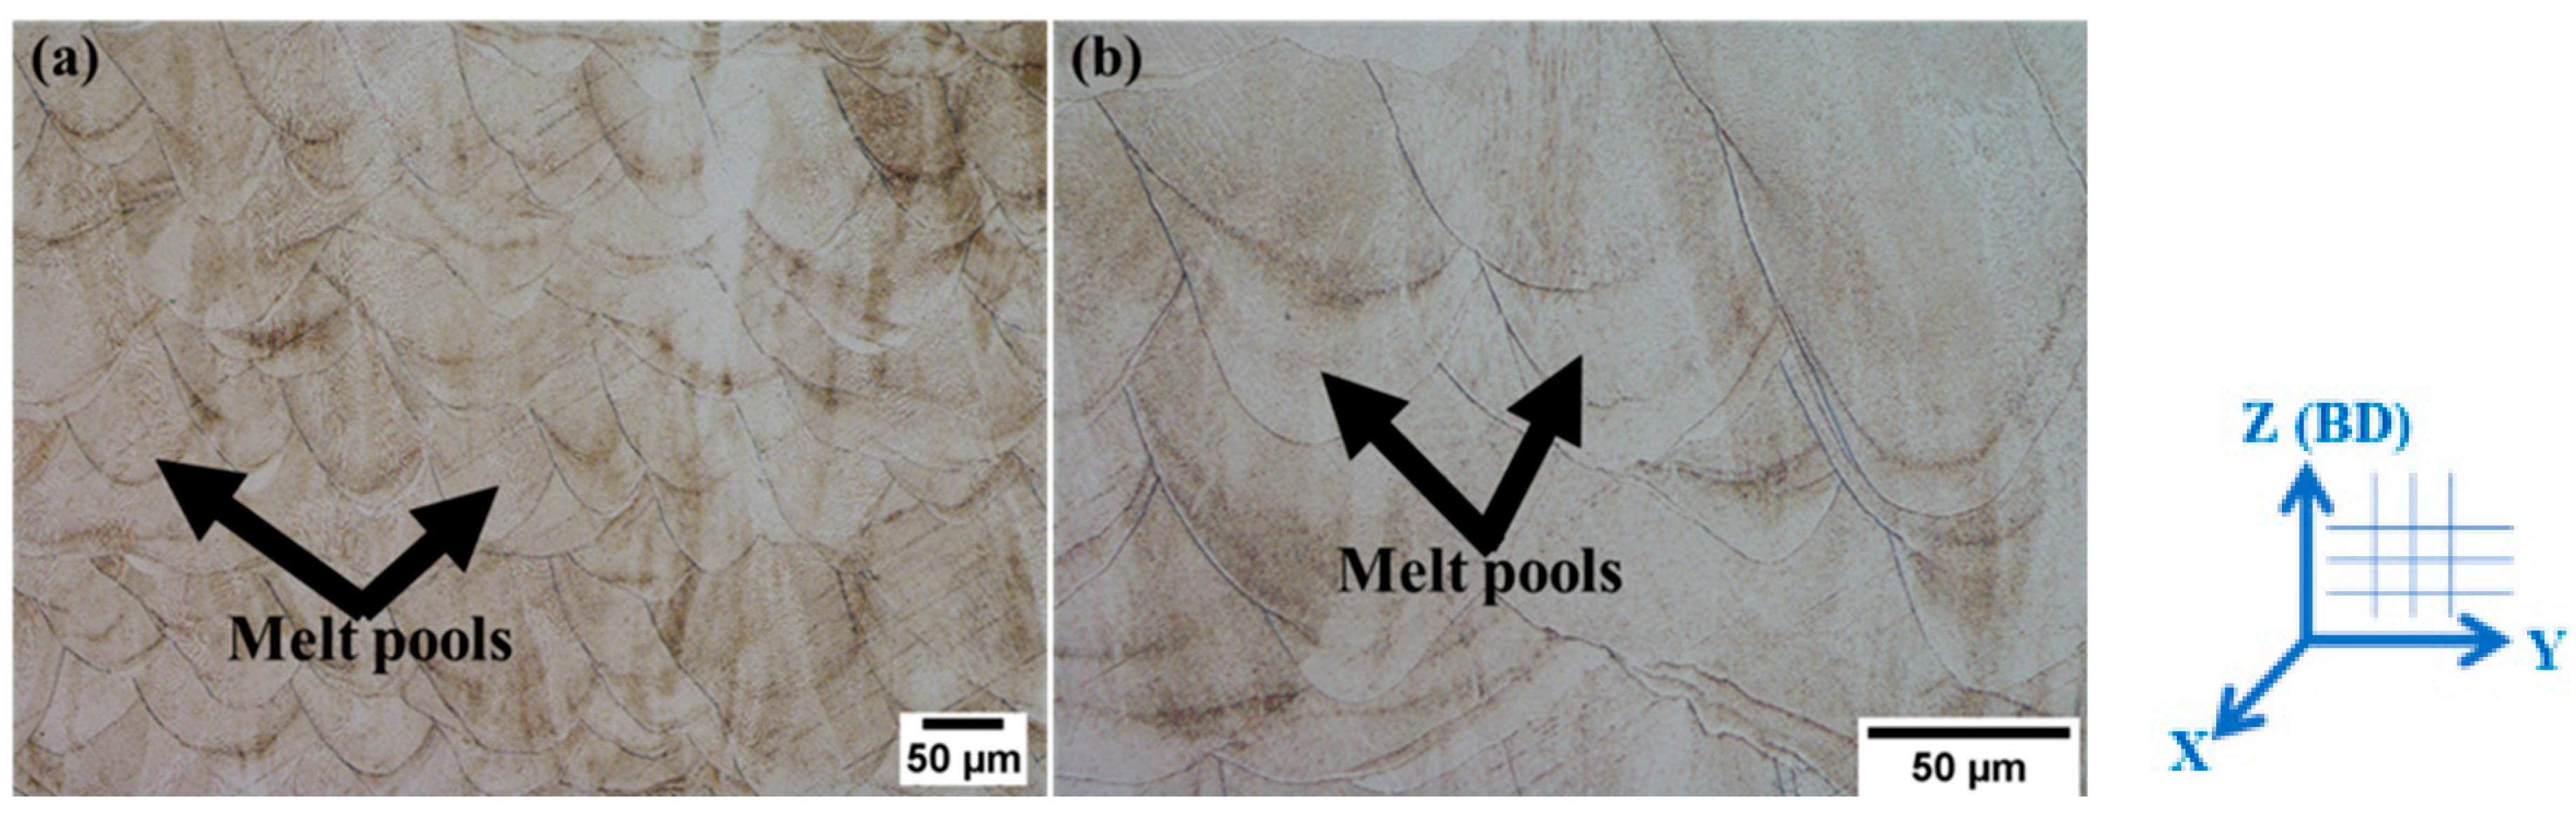
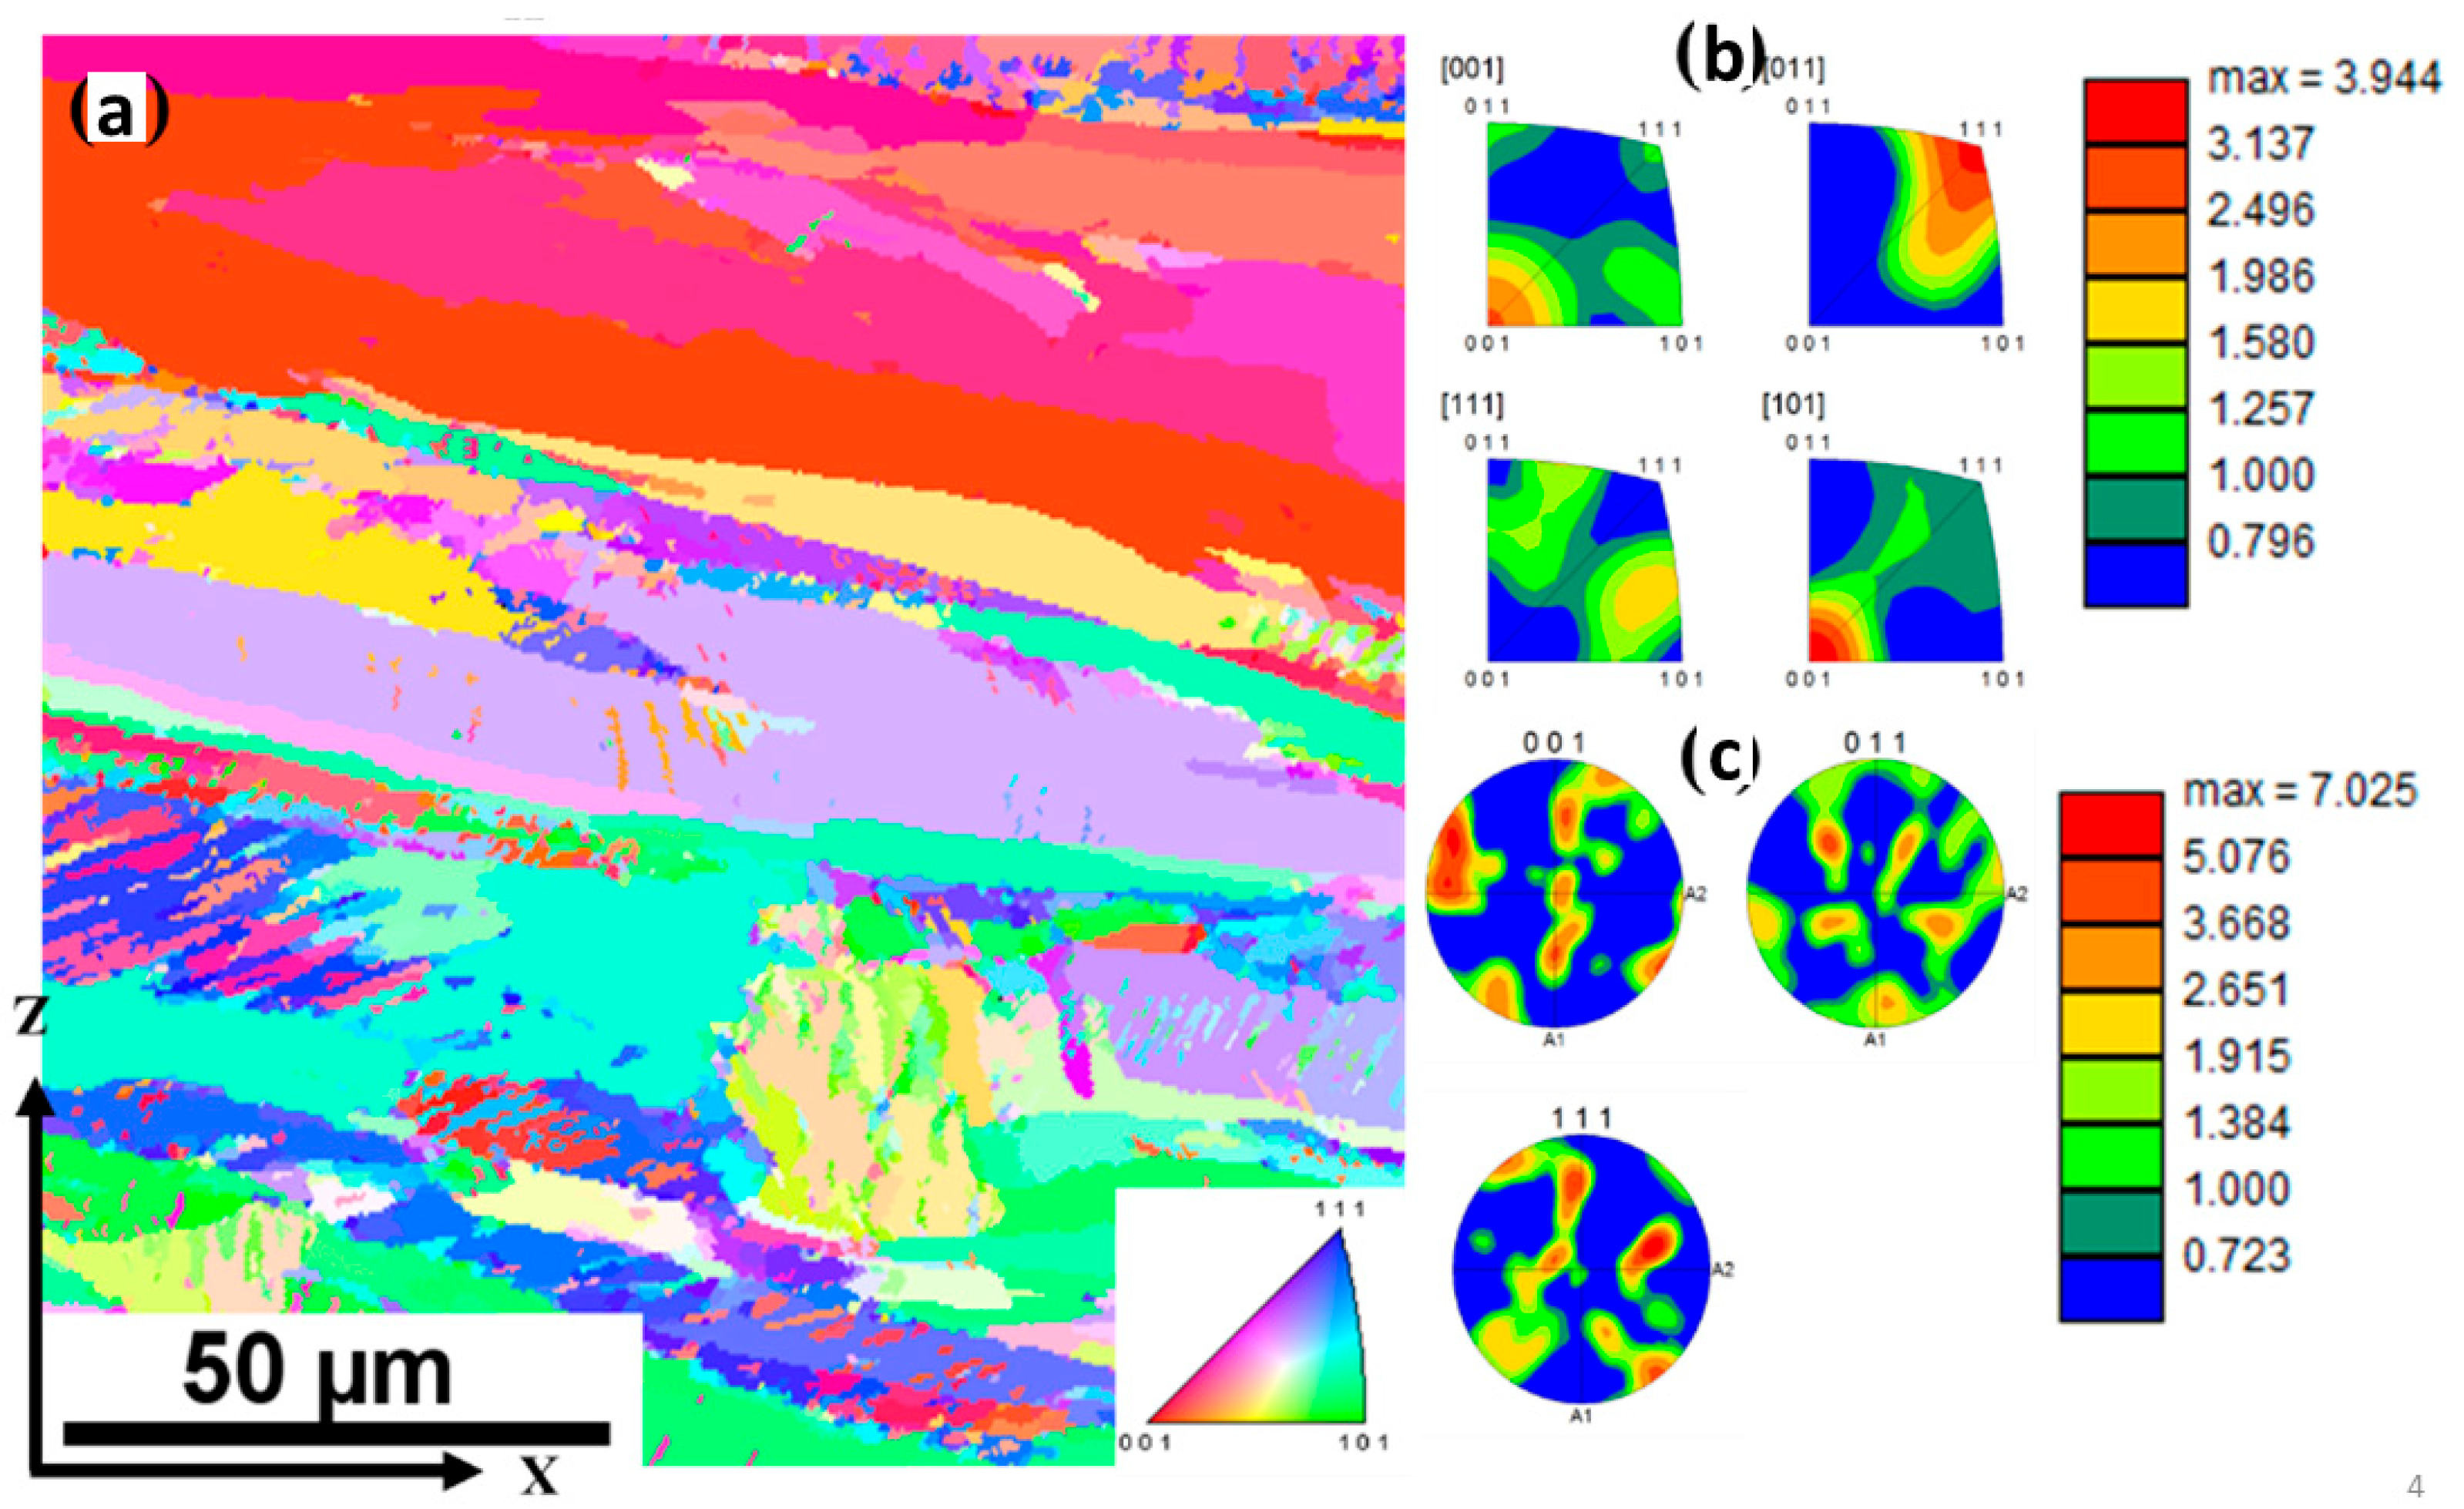
3.1. As-Built Microstructure

Optical micrographs of the as-built LPBF 316L stainless steel samples are illustrated in Figure 2a. The micrograph shows the variations of layers formed due to layer-by-layer deposition of materials and the difference in the cooling rate of each layer and are within 75–90 µm along the build direction, corresponding to the hatching distance used during deposition. The curved molten pools show the Gaussian distribution and the conduction melting mode during deposition. Figure 2b shows the melt pool at a higher magnification [22,24,25]. Cellular and columnar structures were observed on the surfaces, as shown in Figure 2b, which is attributed to the rapid cooling rate, which Li et al. [26] reported to be around 103–104 Ks−1. These features are formed due to the rapid solidification of molten materials [27].
Figure 3a shows the inverse pole figure (IPF) maps obtained from EBSD characterization, with their corresponding pole figures (PF), Figure 3b, and inverse pole figure plots (IPFP), as shown in Figure 3c. The IPF maps confirm the heterogeneity in grain structures portrayed by the different grain sizes and widths. Columnar grains aligned towards the build direction are observed. The preferred crystallographic orientation from the inverse pole figure plots was <110>, as also observed by Sun et al. [28] and Charmi et al. [29]. The density bars generated values of 3.85, 4.20, 4.21, and 4.91 for <001>, <111>, <101>, and <110>, respectively. On the other hand, the pole figures showed that the grains had a preferred {001} plane normal to the scanning direction. Therefore, the texture for as-built samples was determined to be {001}<110>. The texture could be attributed to the recrystallization of the grains as there is repeated heating and cooling during the layer-by-layer deposition of the material [30]. Furthermore, it can also be attributed to the epitaxial growth of the grains along the build direction.
Figure 4a presents the grain size distribution charts for the LPBF 316L stainless steel samples. The average grain size is determined based on the average diameter and the average length. The estimated average diameter was 4.7 ± 10.12 μm, while the length shown in Figure 4b was 15.58 ± 3.4 μm. The large standard deviation observed, more so for the diameter of the grains, can be attributed to the wide range of grain sizes. The epitaxial growth of grains during rapid solidification causes some grains to extend beyond the grain boundaries. The remelting process at the melt pool boundaries can also result in different grain sizes being formed.
Figure 4c demonstrates the average misorientation angle of the grains, with an average value of 6°. The low misorientation angle observed demonstrates that the fabrication process did not result in the significant misorientation of the grains.
A misorientation angle of 15° was used to define the grain boundaries. Low-angle grain boundaries (LAGBs) were defined as those < 15°, whereas the high-angle grain boundaries (HAGBs) were defined as those > 15°, as depicted in Figure 5a. Based on this, the LAGBs were measured to be 87.9%, whereas the HAGBs were 12.1%. The distribution of these grain boundaries plays a crucial role in the hindrance of dislocation motion under plastic deformations, as shown in Figure 5b.

3.2. Mechanical Performance of LPBF 316L Stainless Steel

The quasi-static tensile tests resulted in a yield strength of 551.21 MPa, ultimate tensile strength of 619.58 MPa, and elongation to failure of 73.66%. The tensile results of the LPBF 316L stainless steels surpassed the values specified in the ASTM A240/A240M-18 standard specifications. This demonstrates the excellent properties exhibited by the LPBF 316L stainless steel samples. The results are similar to that of Ponticelli et al. [9] on LPBF 316L stainless steel with a yield strength of 502 ± 14.2 MPa and ultimate tensile strength of 696 ± 25.3 MPa. Table 3 summarizes the results of the tensile strength test.
The stress amplitudes versus the number of cycles (S-N) curves for the tension-tension fatigue tests are illustrated in Figure 6. The S-N curves data acquired showed a big gap in the number of cycles between the 35% and 30% values of UTS. At 35%, 467,534 cycles were measured, whereas 1,906,814 cycles were measured for 30% of the UTS. The 1 × 10⁶ cycles threshold thus was considered to have been reached at 30% of the UTS which is at a stress amplitude of 92.94 MPa and corresponds to a maximum stress of 185.87 MPa. The S-N curve for the LPBF was compared with wrought samples from Mohammad et al. [31], with a load ratio of R = 0.1. Though the wrought samples were all tested within the high cycle fatigue (HCF), it shows that they had a better fatigue performance than the LPBF samples. These results can be attributed to the refined grains that exist in the wrought samples and minimal porosity. Furthermore, the additive manufacturing processes introduce residual stresses, poor surface finishing, and porosity, which can be points in favor of crack initiation [32]. It is also important to note that the wrought samples also experience crack nucleation at the material’s surface, mostly due to cyclic slip deformation and the formation of fatigue slip bands [33]. However, the obtained fatigue limits are slightly lower than those of steels, which are within the range of 0.35–0.60 in its ultimate tensile strength, as the lower fatigue strength can be ascribed to residual stresses developed during the manufacturing operation of the material, which is also due to the characteristic surface roughness of the additive manufactured materials [9].
It is important to state that increasing the comparisons of the fatigue strength measured in this study with additional ones reported in the literature for wrought materials is challenging. This is because most test results for wrought samples presented in the literature have undergone annealing and/or post-treatment processes. In addition, the wrought materials are majorly tested within the high cycle fatigue region with stress ratios that are different from the one used in the present study. As such, the samples employed in the present investigation were not subjected to any post-fabrication treatments. For instance, Puchi-Cabrera et al. [34] analyzed 316L stainless steel that was first annealed. To facilitate controlled crack initiation, notches were machined into the samples prior to final polishing, which aimed to eliminate surface roughness. The investigation determined that under a maximum applied stress of 400 MPa, the samples exhibited an average fatigue life of 277,795 cycles.
Furthermore, drawing direct comparisons with existing data on additively manufactured (AM) 316L stainless steel presents a significant challenge. This difficulty arises from the limited body of research currently available on laser powder bed fusion (LPBF)-processed 316L and the inherent variability introduced by the use of diverse fabrication parameters across different studies. Notably, discrepancies in the processing conditions, load ratios, stress amplitudes, testing frequencies, and loading machine types employed by various researchers can significantly influence the obtained fatigue test results. In the case of AM materials analyzed for this investigation, the analyses were conducted as previously described. Liang et al. [17] conducted stress-controlled fatigue tests using a load ratio of R = −1 and a frequency of 15 Hz on vertically built samples fabricated using LPBF. The authors reported an average fatigue strength of 92.5 MPa, which is approximately the value observed in the present study. However, a direct comparison is limited due to the aforementioned authors’ utilization of a higher laser power and a random island scanning strategy. These parameters deviate significantly from those employed in the current investigation. Consequently, the resulting microstructural properties are expected to differ, potentially influencing the fatigue strength observed. Riemer et al. [35] conducted fatigue tests at a stress ratio (R) of −1 and a frequency of 40 Hz, reporting an average fatigue limit of 108 MPa for samples fabricated using selective laser melting (SLM). However, a comprehensive comparison with the present study’s findings is not feasible due to the absence of detailed information regarding the specific fabrication parameters employed in the aforementioned research. Wang et al. [36] reported an endurance limit of 90 MPa at a stress ratio (R) of 0.1 and a frequency of 15 Hz, corresponding to a fatigue life of 1,000,000 cycles. In the present study, a fatigue life of 1,000,000 cycles falls within the stress amplitude range of 97.65 MPa. This observation suggests a close correlation between the findings of this research and those reported by Wang et al. [36]. It could also be due to the fact that the same stress ratio and frequency were used. However, it is important to note that the author used different fabrication parameters, such as a lower laser power and layer thickness; thus, different microstructural properties were likely formed. From these literature values, it is clear that the fabrication parameters and testing techniques can influence the fatigue strength to be measured, and failure to define them clearly can make it quite challenging to obtain a clear comparison.
Surface roughness has a significant influence on the fatigue performance of materials. Notably, the sample used for this study did not undergo any post-treatment to remove any surface defects. Liang et al. [17] showed that the surface finish of the samples can improve fatigue strength by 24%. The stress-relieving process through heat treatment releases the tension and residual stresses in the material induced by the fabrication process. Annealing and hot isostatic pressing (HIP) have been suggested as other heat treatment processes that can enhance metals’ fatigue strength. They have been suggested to reduce the low cycle fatigue life of SLM 316L stainless steel but enhance the high cycle fatigue life. It has been argued that low cycle fatigue is highly dependent on the tensile strength of a material. Heat treatment causes the growth of the grain size and thus reduces the yield strength according to the Hall-Petch relationship [37]. On the other hand, high cycle fatigue is highly affected by defects such as pores, voids, microcracks, and a lack of fusion [19,38]. Therefore, through heat treatment, some of the unmolten powder can be remelted, reducing the occurrence of pores and the lack of fusion defects, which then enhances the high cycle fatigue strength.

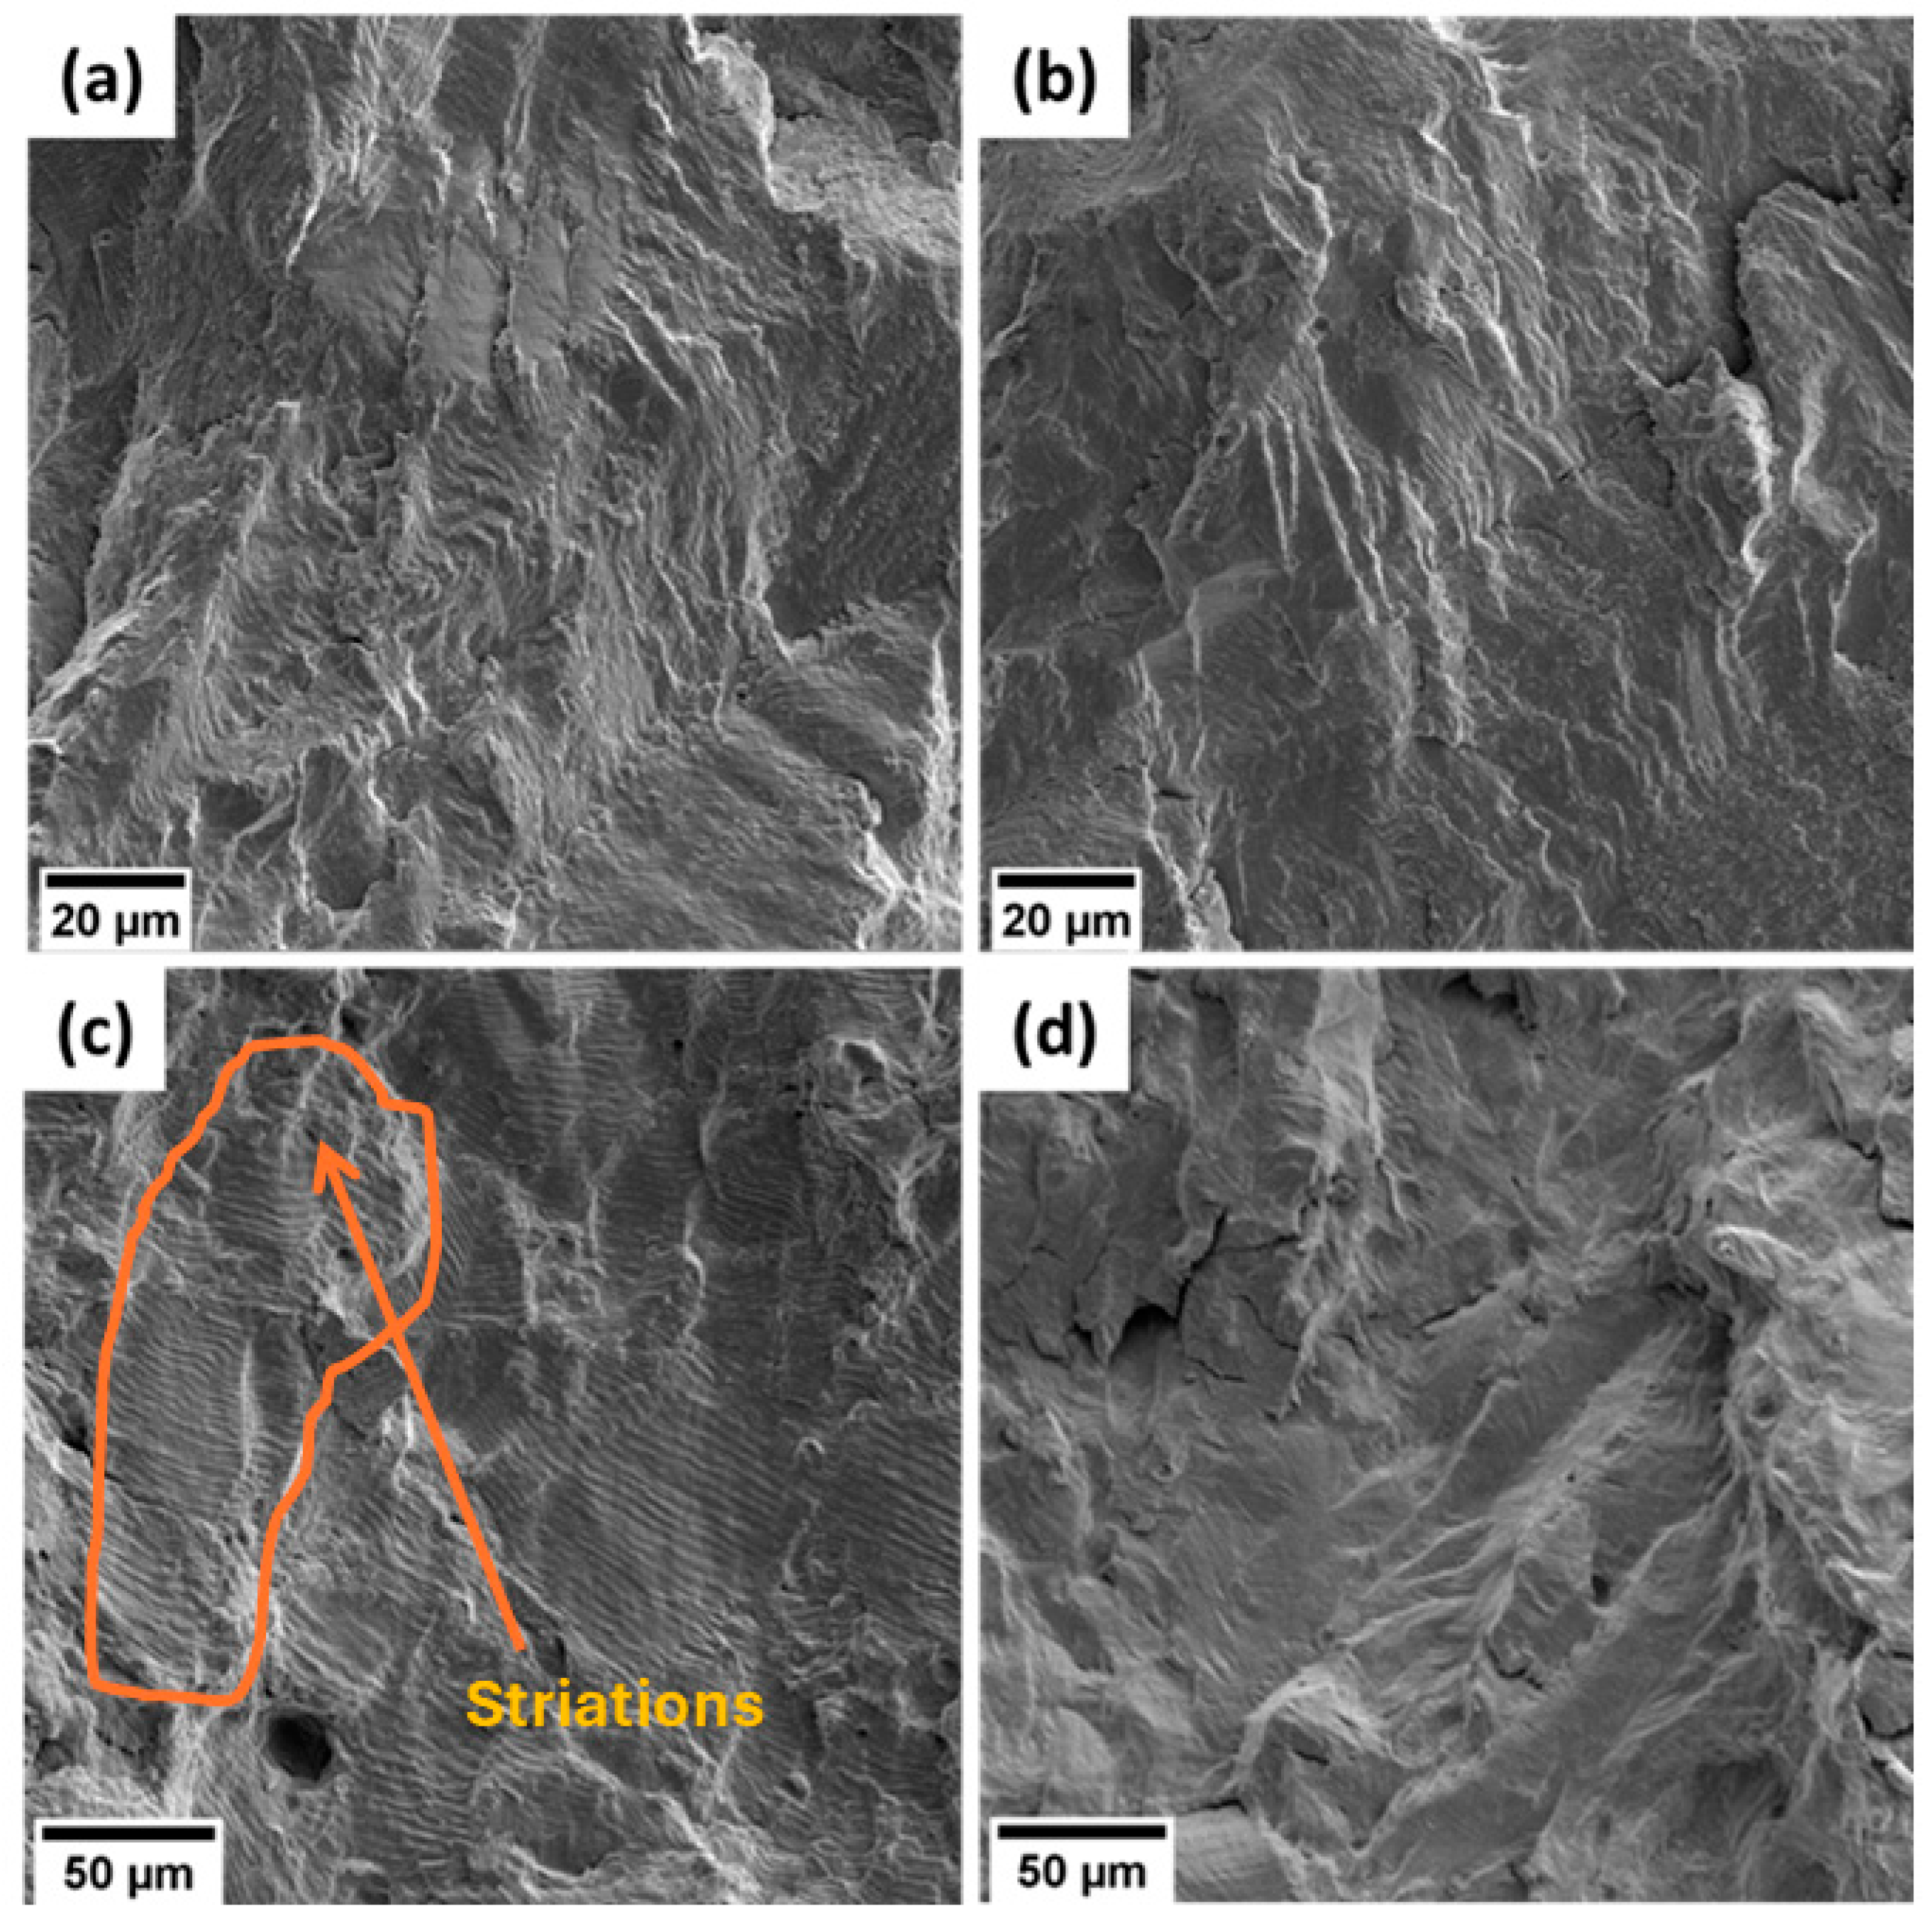
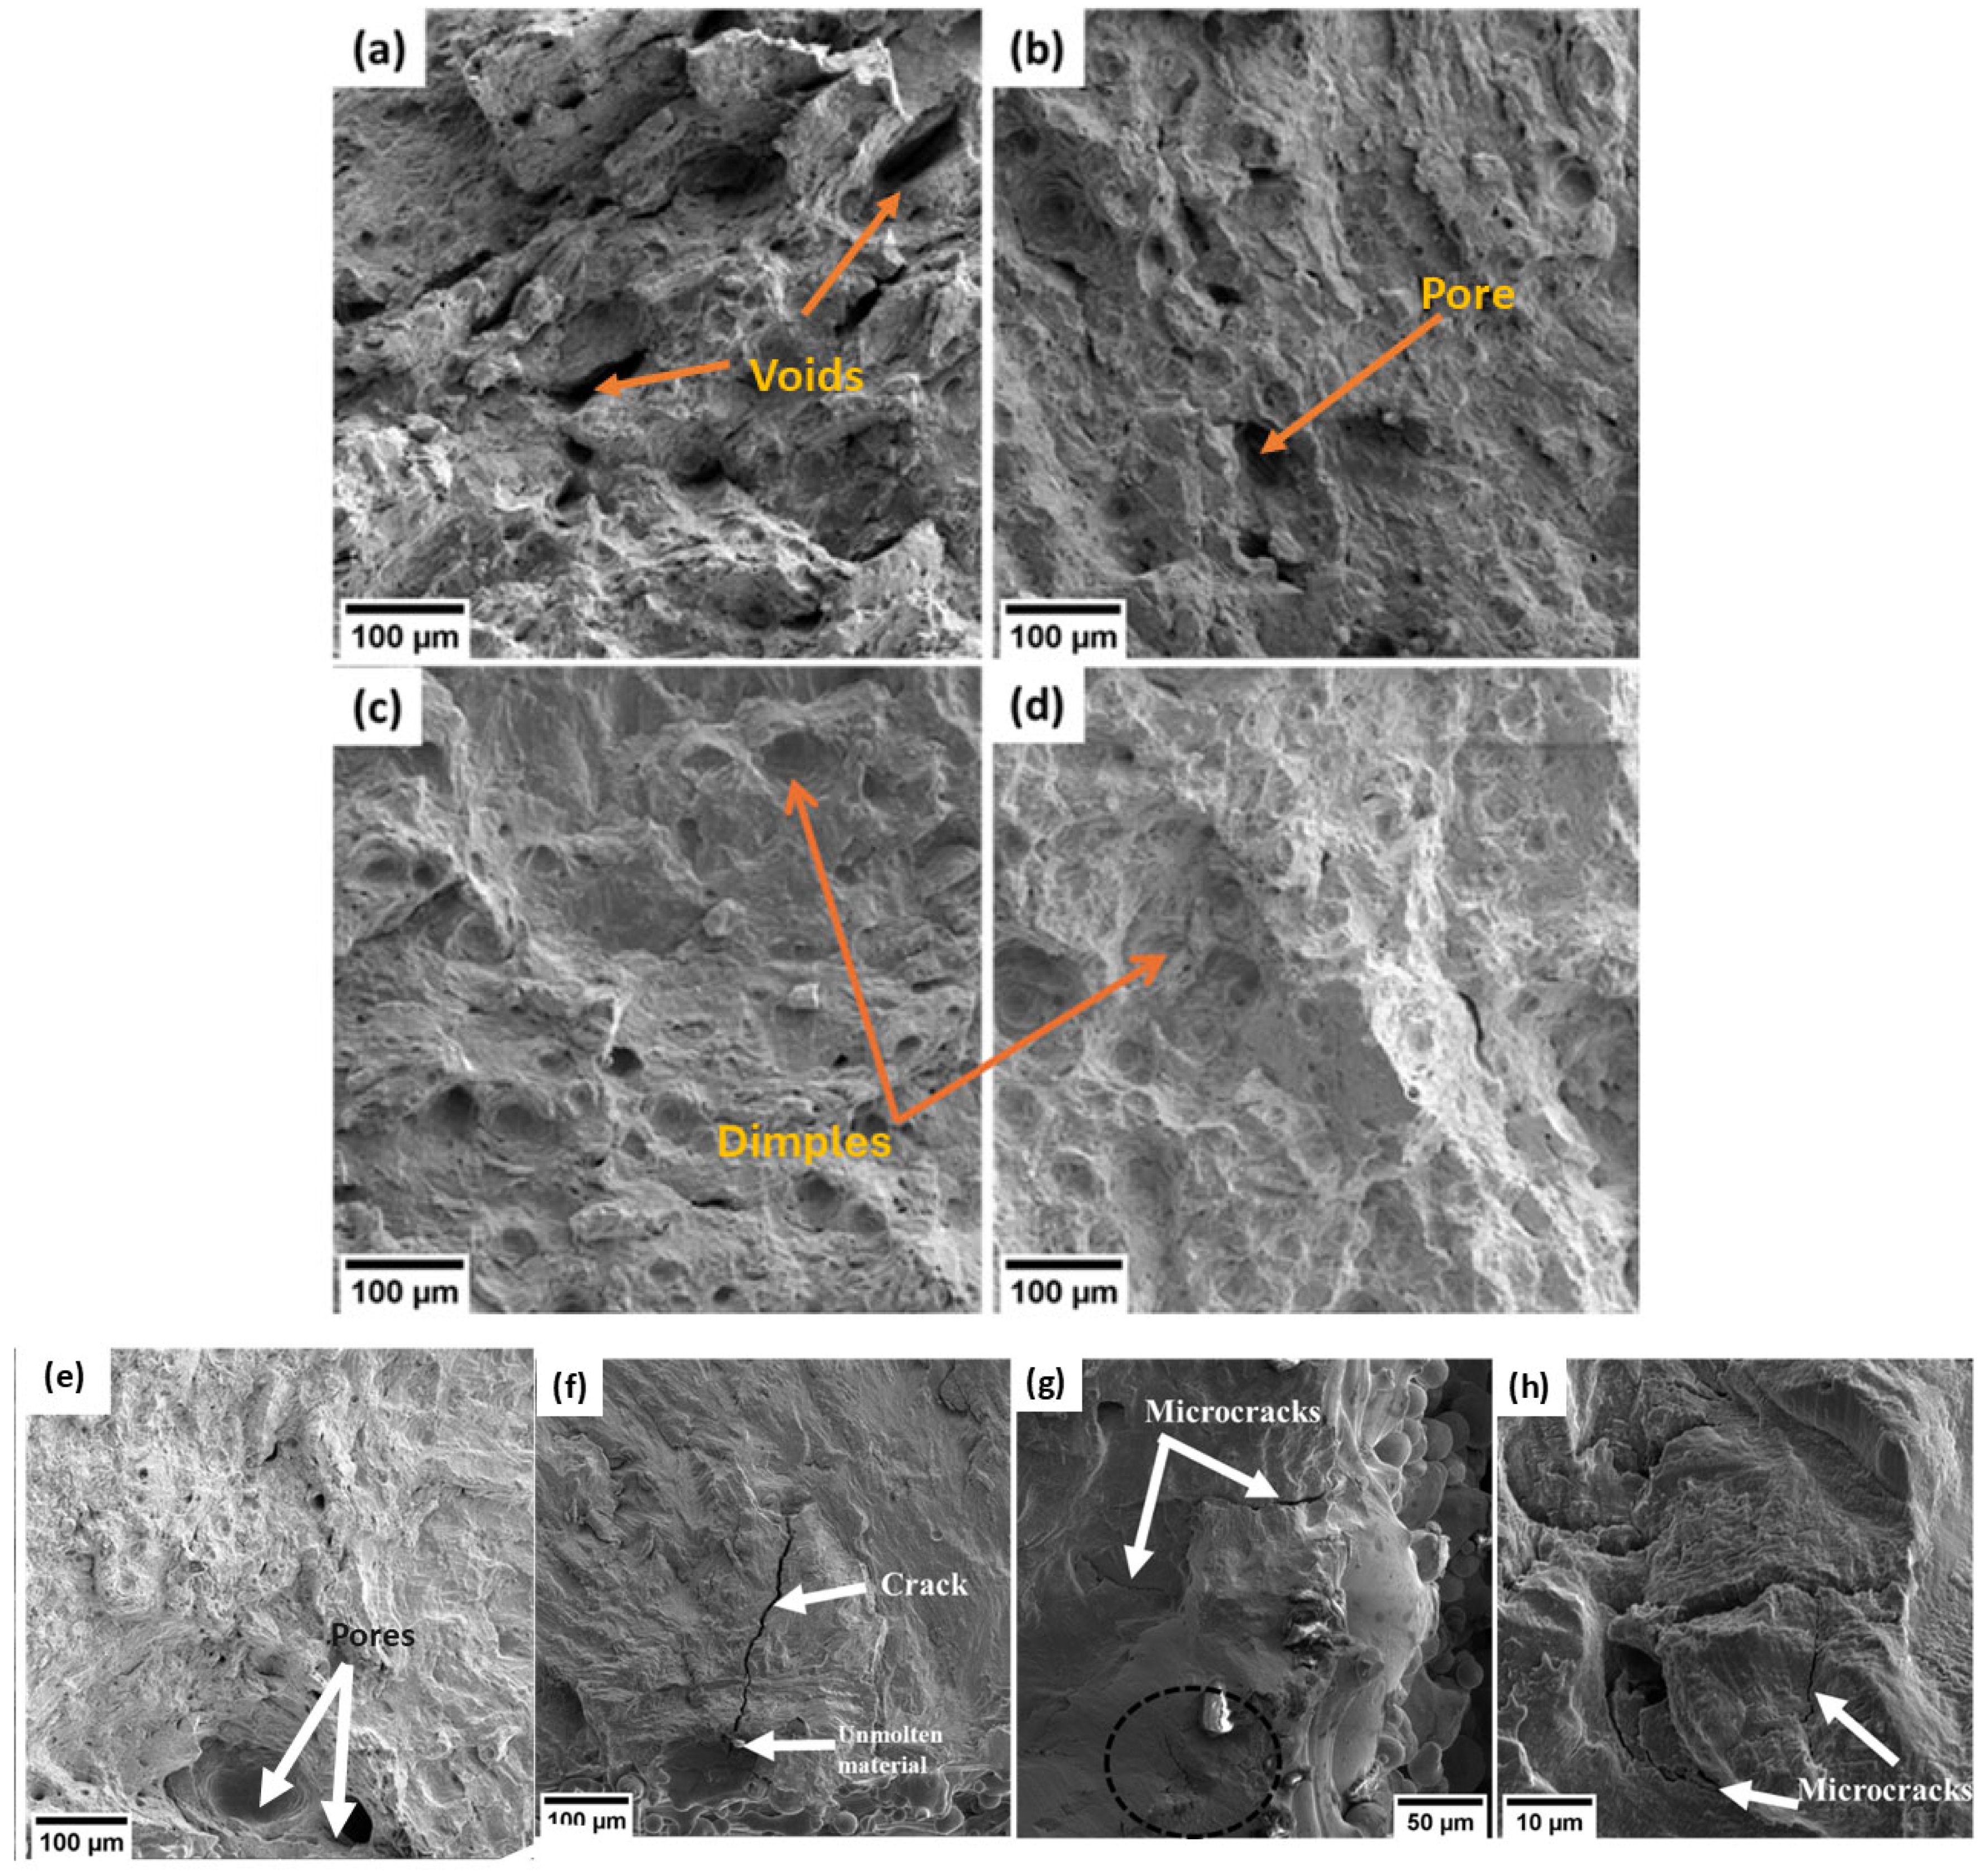
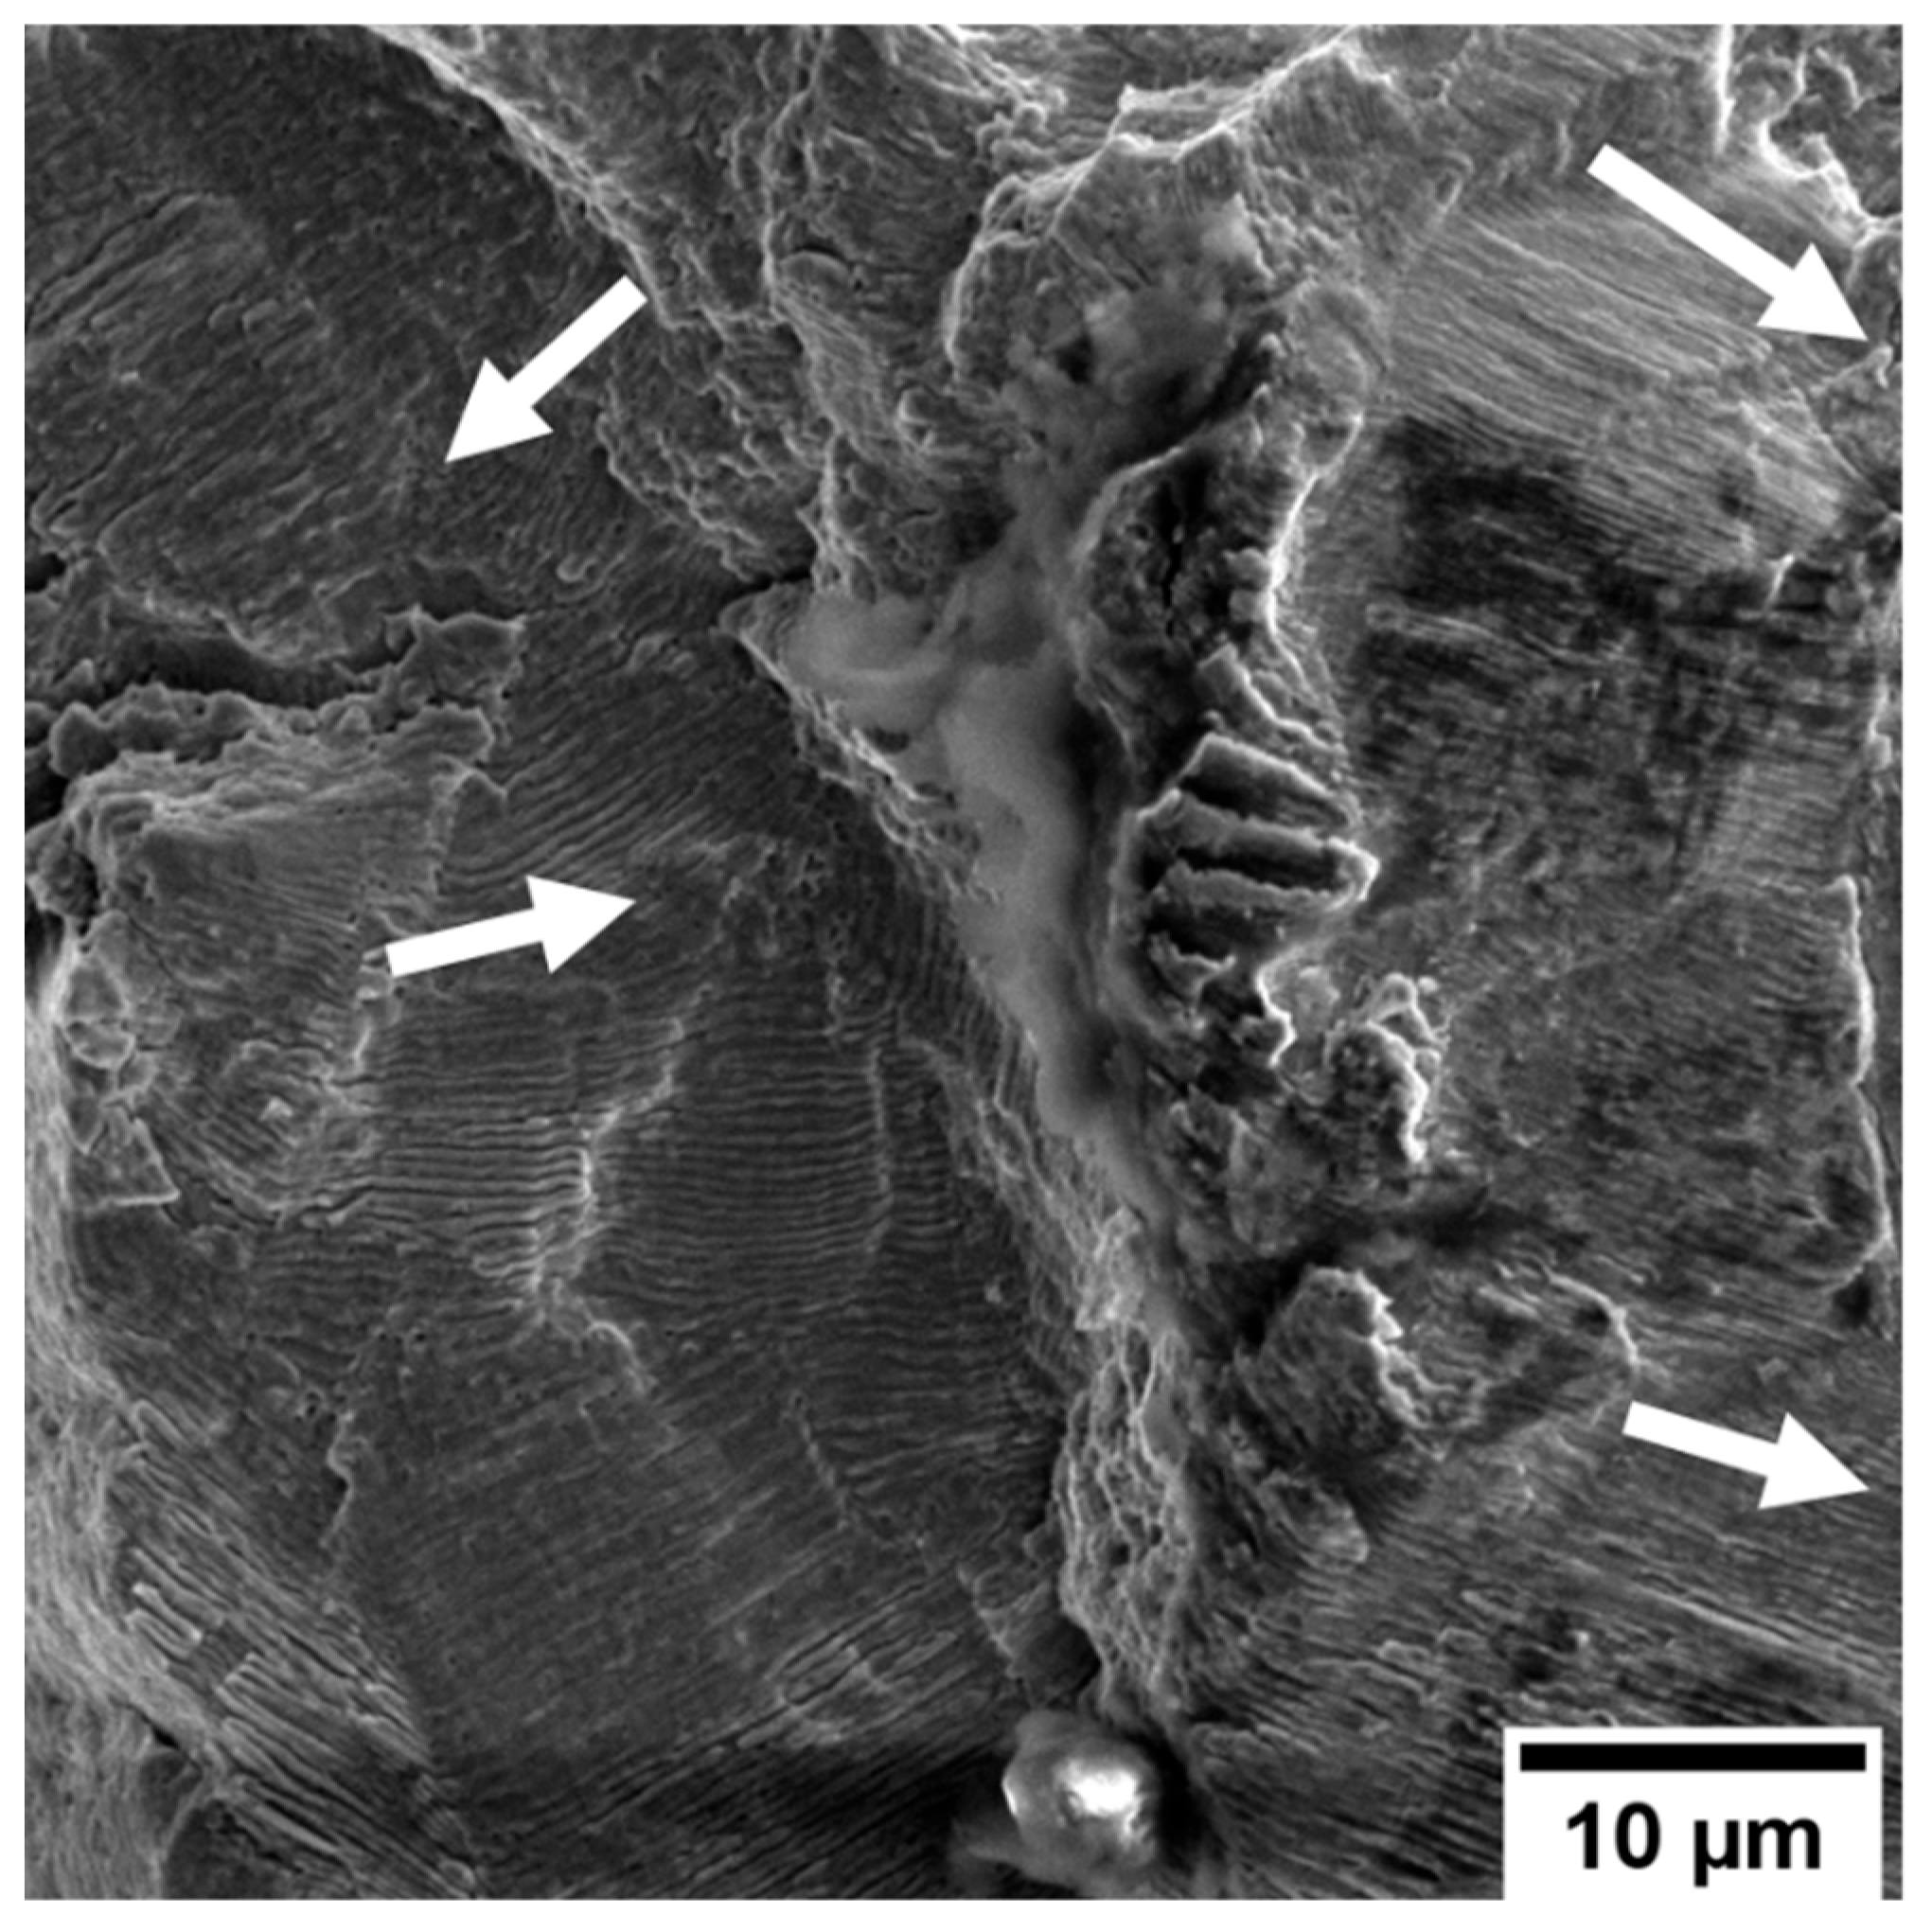
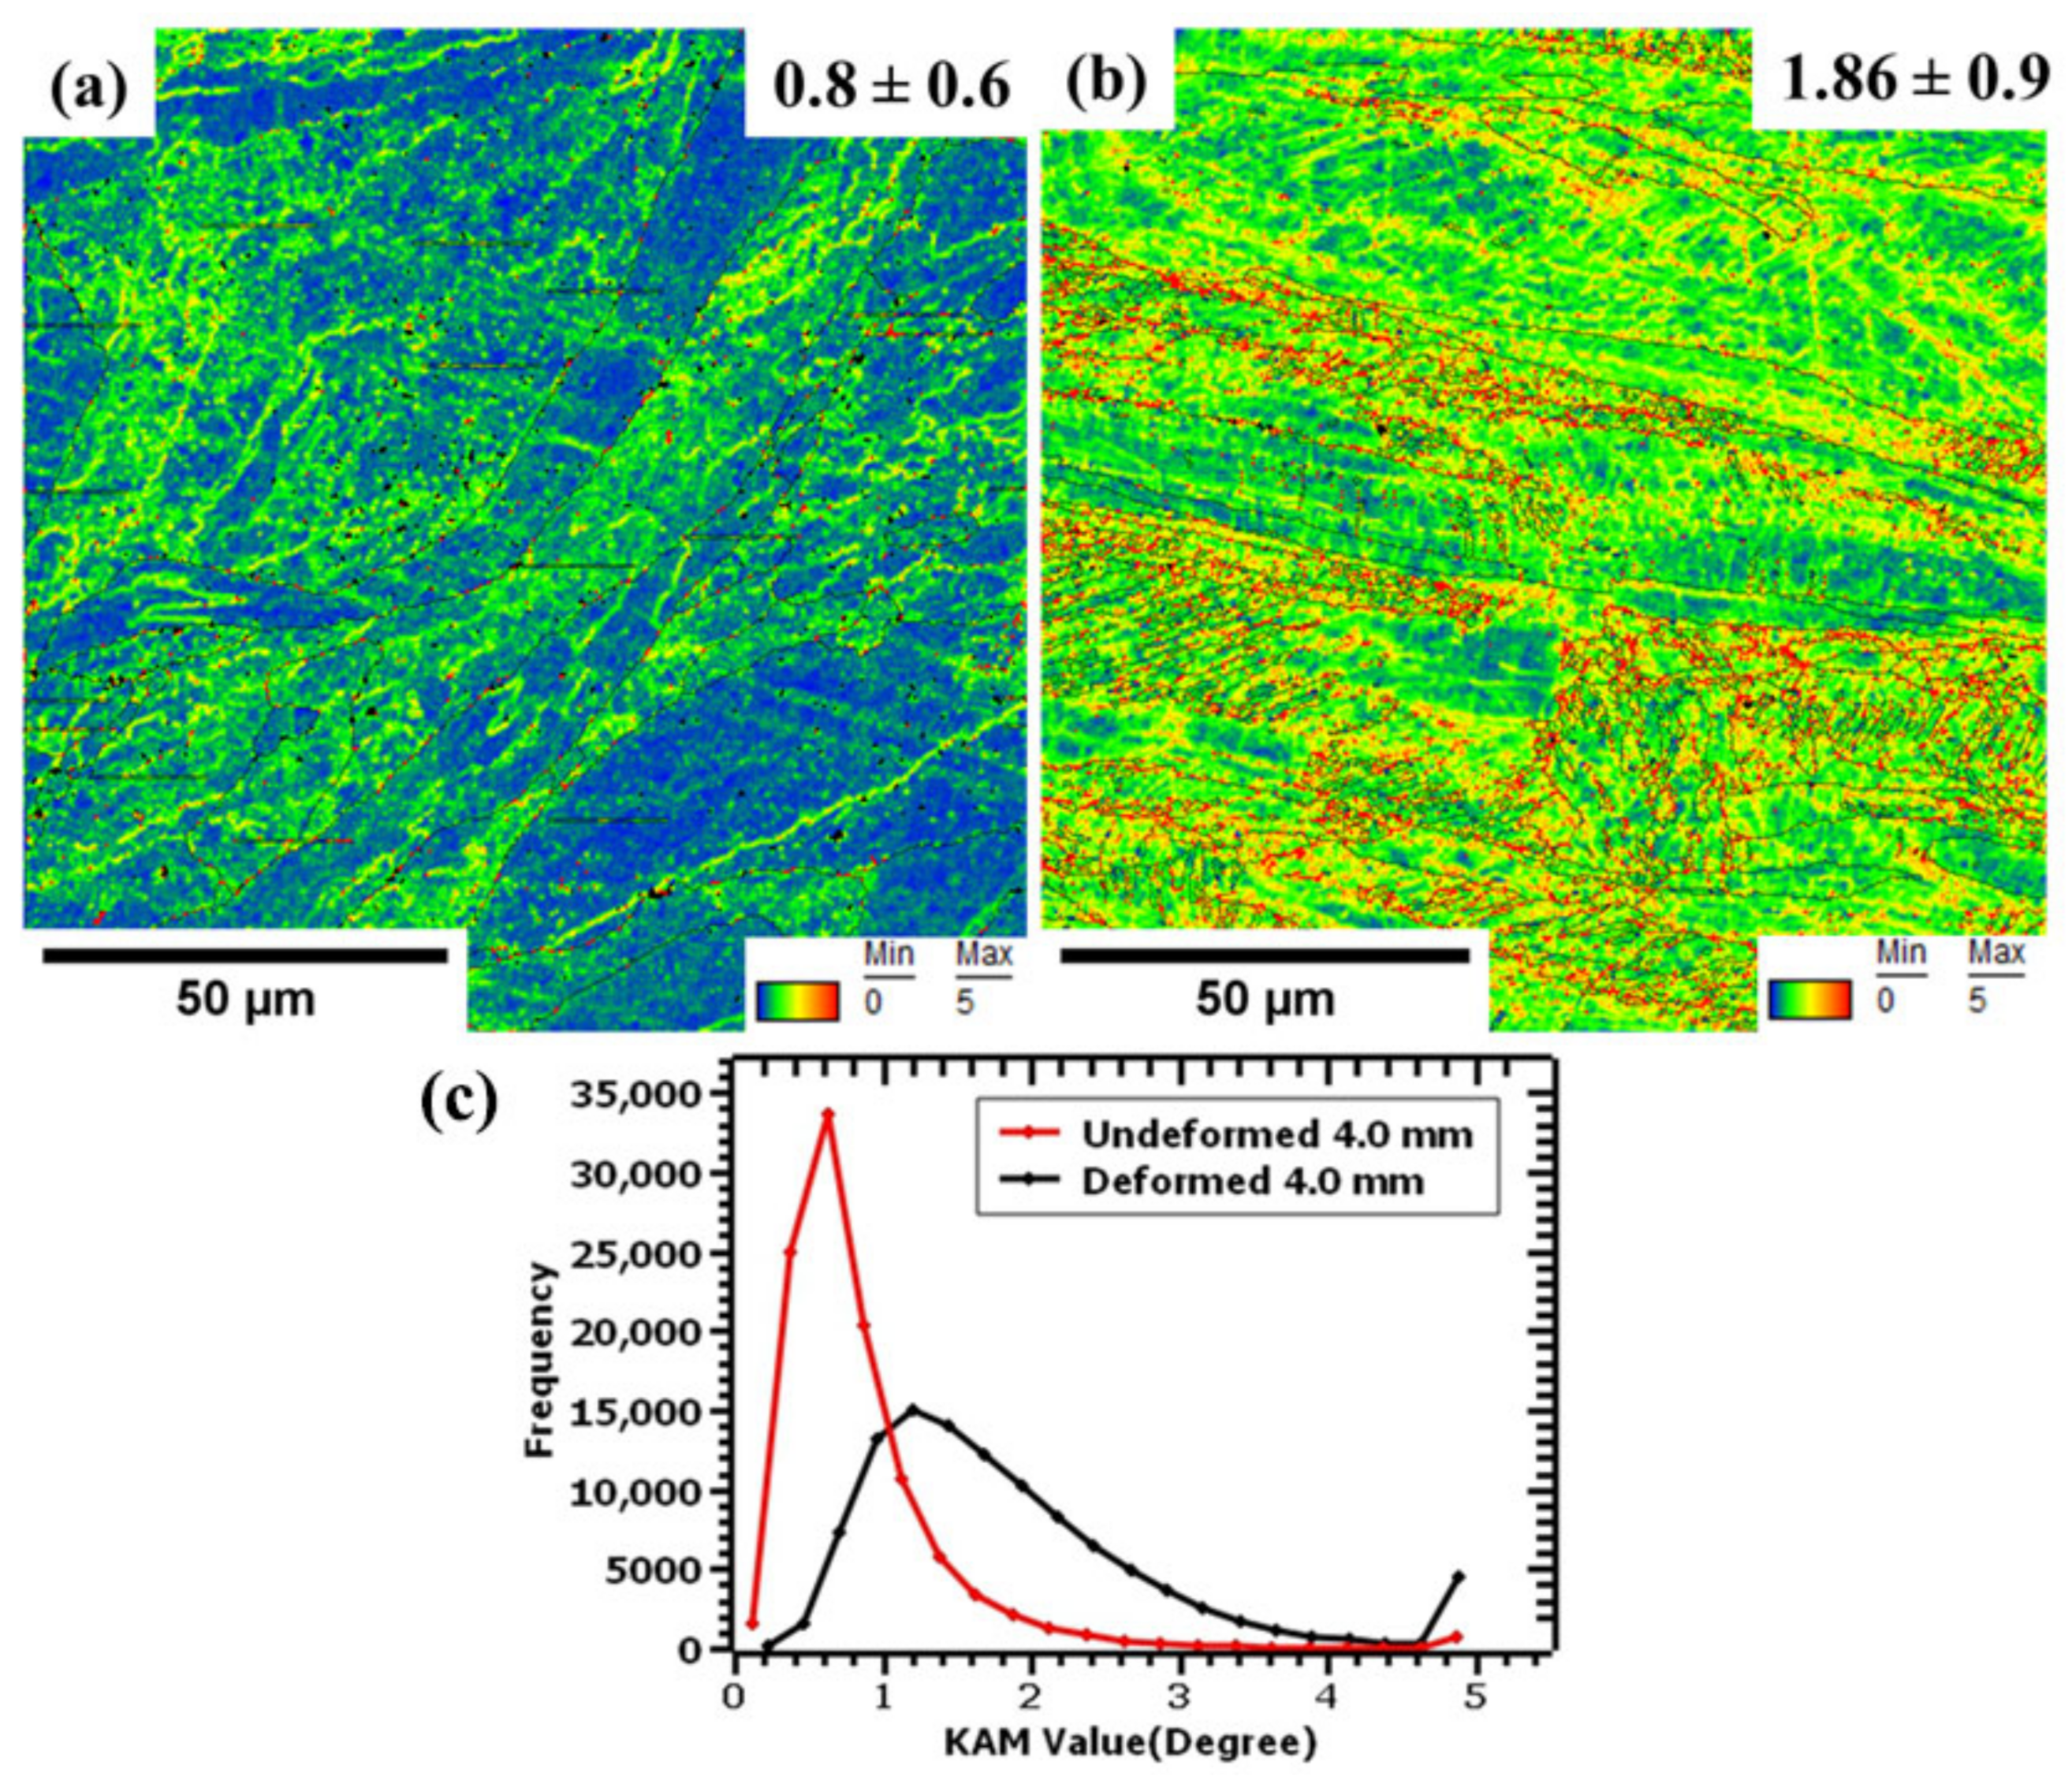
3.3. Microstructural Characterization of Fatigue-Deformed Samples

To further understand the cyclic behavior of the LPBF 316L stainless steel samples, fractography analysis was performed on the fractured surfaces. Figure 7a,b shows the optical micrographs obtained at 20× and 50× magnifications. The tension-tension cyclic loading on the material is observed to have caused the elongation and enlargement of the melt pools [39].
To further explain the fatigue deformation mechanisms in LPBF 316L stainless steel, scanning electron microscopy (SEM) fractography analysis was employed. As illustrated in Figure 8a,b, the overall fracture surface exhibits a transition from a region dominated by fatigue crack growth (characterized by striations) to a region of the final ductile fracture (evidenced by dimples). A key observation from the fractography analysis is that cracks initiate at the surface and propagate inwards, as indicated by the extensive striation zone exceeding 50% of the sample’s depth, before culminating in a final ductile fracture. The final fracture zone reveals a well-defined crack propagation path and evidence of plastic deformation via shear slip mechanisms.
Figure 9a,b demonstrate the initiation of cracks at the surface. In additively manufactured materials, competition exists between slip bands and inherent microstructural defects as potential crack nucleation sites. Due to the reduced geometric constraints experienced by surface grains compared to their interior counterparts, dislocation slip readily occurs at the sample’s surface. Under cyclic loading conditions, the repeated back-and-forth movement of dislocations leads to the formation of surface irregularities in the form of intrusions and extrusions. These microscopic features act as stress concentrators, promoting crack initiation [12,40]. Consequently, these surface irregularities, coupled with inherent microstructural defects, render these regions particularly susceptible to failure. Furthermore, the clustering of defects can act synergistically, effectively behaving as a single, significant defect that significantly facilitates crack initiation and propagation.
The SEM fracture surfaces were also observed at different stress amplitudes to understand the fracture behaviors at low and high cycle fatigue regimes. Figure 10a–d show the images obtained from deformed sections at 90%, 70%, 50%, and 40% of the ultimate tensile strength. Striations are observed on the surfaces, and it is observed that at higher stress amplitudes, striations are more closely spaced and pronounced than at lower stress amplitudes. Cracks usually develop at stress concentration sites, such as the edges of the sample or the areas with defects. However, the increase in stress at these sites results in the formation of microcracks in its surroundings so as to relieve the material from this stress. Striations are formed as cracks open and close, and their path is defined by features such as grain boundaries or defects.
The ductile fracture mode was observed on the fractured fatigue surfaces, as shown in Figure 11. The images are obtained at 90%, 70%, 50%, and 40% of the ultimate tensile strength. At higher stress amplitudes (90–70%), the dimples were observed to be larger and deeper, as shown in Figure 11a,b, signifying the low cycle fatigue region. As the stress amplitude reduced (50–40%), the dimples became shallower and wider, as shown in Figure 11c,d, signifying the high cycle fatigue region. The materials incur high amounts of plastic deformation at high-stress amplitudes that can cause plastic strain accumulation. Microvoids easily coalesce and grow to form larger and deeper dimples. Figure 11e,f show the defects on the fractured surface of the samples after deformation. These defects have been attributed to the additive manufacturing process (LPBF), which causes grain growth due to rapid inter-cooling during layer-by-layer deposition. The cooling process also results in differently orientated grain clusters, which have been reported to be sites for intergranular fracture via a slip/grain boundary interaction [41].
Another noteworthy observation from Figure 12 is the occurrence of irreversible slip events under cyclic loading. The continuous application of fatigue loads leads to the formation of non-uniform surface regions due to the accumulation of intrusions and extrusions. These extrusions and intrusions manifest as step-like features, disrupting the surface uniformity and promoting microcrack initiation. The white arrows in Figure 12 highlight the diverse orientations of persistent slip bands (PSBs). Interestingly, these PSBs were observed to deflect and alter their course upon encountering a defect.
Mughrabi [42] reported that the fatigue behavior of materials exhibits a dependence on the interplay between strength and ductility. At low cycle fatigue (LCF), high ductility allows for greater energy absorption before crack formation, enhancing resistance to fatigue failure. Conversely, at high cycle fatigue (HCF), the dominance of elastic deformation diminishes the influence of ductility, with crack initiation becoming the primary fatigue mechanism. Interestingly, despite exhibiting high ductility and the ultimate tensile strength, the LPBF 316L stainless steel samples displayed lower fatigue strengths in the HCF regime. This observation suggests the possible influence of additional factors. One prominent contributor is likely to be the surface roughness of the samples. The absence of pre-testing polishing resulted in surface irregularities that acted as stress concentration points, facilitating crack initiation.
Studies have shown that crack growth and propagation is affected by a material’s grain size significantly. According to Sun et al. [43], the influence of the grain size on the crack propagation mode is well-documented. Larger grain sizes typically promote transgranular crack propagation, where cracks travel directly through the grains. Conversely, finer grain sizes favor intergranular crack propagation, where cracks preferentially follow the weaker grain boundaries. This preference arises from the increased number of grain boundaries in fine-grained materials. These boundaries can act as obstacles, hindering crack propagation and even deflecting the crack path. However, the repeated stress cycles can lead to dislocation pile-up at grain boundaries. This phenomenon can cause strain localization at these boundaries, ultimately rendering them preferential sites for crack initiation.
The influence of the grain size on the crack propagation behavior is attributed to the varying presence of grain boundaries. Larger grains, with fewer boundaries, offer less resistance to crack propagation due to a more homogeneous distribution of deformation within each grain. This translates to faster crack growth and earlier failure under cyclic loading compared to materials with finer grain structures. Conversely, the increased number of grain boundaries in fine-grained materials act as obstacles, hindering crack propagation and potentially deflecting its path. However, these boundaries can become preferential sites for crack initiation after repeated stress cycles due to the phenomenon of dislocation pile-up and subsequent strain localization.
To elucidate the texture, grain size distribution, and grain boundary characteristics of the LPBF 316L stainless steel subjected to fatigue testing, electron backscatter diffraction (EBSD) analysis was employed. The analysis utilized a step size of 0.4 µm on an area of 100 × 100 μm2. The corresponding inverse pole figure (IPF) maps of the deformed samples are presented in Figure 13a, alongside their respective pole figures (Figure 13c) and inverse pole figure plots (Figure 13b). The IPF maps revealed a preferential crystallographic orientation of the grains along the direction, indicating that the material retained its preferred orientation despite cyclic loading. This suggests that the applied cyclic stresses were insufficient to induce grain reorientation within the observed sample. The pole figures, however, depicted a stronger orientation along the plane normal to {111}, which deviates from the {001} texture observed in the as-built samples. The observed shift in texture from a dominant {001} orientation in the as-built condition to a {111} texture following deformation could be attributed to dynamic grain refinement induced by the cyclic loading. This process involves the nucleation and growth of new grains within the material, reducing the average grain size. Alongside, the accumulation of dislocations during plastic deformation results in strain hardening as the {111} plane is one of the preferred slip planes in a face-centered cubic (FCC) structure, contributing to the observed texture change [27,44,45].
The average grain sizes of the samples were analyzed by plotting grain size distribution charts of both their length and diameter, as shown in Figure 14a. The average grain size diameter of the grains was observed to have reduced to 1.4 ± 2.7 μm, whereas their length, shown in Figure 14b, increased to 17.4 ± 1.9 μm. The tension-tension cyclic loads caused the grains to elongate, increasing their length. An average misorientation angle of 11° was determined, as shown in Figure 14c. It can thus be inferred that the deformation of the samples resulted in an increase in the misorientation of the grains with respect to each other.
A representative grain boundary map for the deformed samples is presented in Figure 15a. Similar to its undeformed state, the low-angle grain boundaries (LAGBs) were observed to be more dominant than the high-angle grain boundaries (HAGBs). However, it can be observed that their fraction reduced slightly from 87.9% to 81%. The interplay between grain boundaries and persistent slip bands (PSBs), generated under cyclic loading conditions, influences the behavior of dislocations. This interaction can manifest in three primary ways: (1) a complete passage of dislocations through the grain boundary, (2) an accumulation of dislocations at the grain boundary (piling up), or (3) a partial passage with a residual dislocation segment left within the grain boundary. According to Zhang et al. [46], the preferential crack nucleation sites within a material depend on the relative abundance of high-angle grain boundaries (HAGBs) and low-angle grain boundaries (LAGBs). In materials dominated by HAGBs, crack nucleation is preferentially observed at grain boundaries rather than along persistent slip bands (PSBs). This propensity arises from the significant hindrance to dislocation motion imposed by HAGBs, leading to dislocation pile-up and localized stress concentrations. The high misorientation angles between HAGBs and adjacent grains further exacerbate this effect. Consequently, the combined influence of high misorientation and pronounced dislocation pile-up renders HAGBs favorable sites for crack initiation. As the number of fatigue cycles accumulates, the ongoing stress and repeated straining promote the formation of extrusions, intrusions, and microcracks at these susceptible HAGB locations.
Conversely, LAGBs exhibit a weaker impediment to the dislocation motion compared to HAGBs. Dislocations encountering LAGBs experience a temporary obstacle before being ultimately transported by PSBs. This characteristic prevents significant dislocation pile-up within the LAGB regions. In contrast, PSB-mediated dislocation motion is hindered by HAGBs, resulting in localized stress enhancement and ultimately leading to intergranular fracture along these boundaries.
To further evaluate the fatigue-tested samples’ deformation mechanisms, kernel average misorientation (KAM) maps were obtained. The KAM maps are used to understand the degree of localized strain on the grains. Figure 16a–c show the KAM maps of the undeformed and deformed samples. A 5° maximum misorientation angle was set as the threshold value to avoid error due to LAGBs. The misorientation of each grain is defined by the colors as defined by the intensity bar. For both surfaces, inhomogeneity in localized strain distribution is observed. The undeformed sample was dominated by a blue color, showing a lower degree of strain localization. The few red and green points could be due to the residual stresses and thermal gradients induced during the rapid cooling rates of the AM processing. KAM intensities were higher at grain boundaries for the undeformed sample and even more for the deformed sample. Cyclic loads cause dislocations of grains and these dislocations are arrested at the grain boundaries. The boundaries are thus strained, resulting in higher misorientations, hence the increased localized strain shown by the green and red colors. The increase in lattice distortion due to cyclic loadings is confirmed by the increase in the average KAM value from 0.8° to 1.9°.
During deformation, the nucleation, storage, or annihilation of dislocations can occur, thus determining these materials’ strengthening and work-hardening performance [46]. The KsAM value measured in the as-built state indicates the existence of dislocation densities before any plastic deformation occurs. The residual stresses and the thermal gradients cause the dislocation densities to transform into energetically favorable configurations known as geometrically necessary dislocation (GND) densities. Additionally, the GNDs increase as the strain gradients increase during the cyclic loadings to accommodate the lattice distortions. This is also confirmed by the increase in dislocation densities of the deformed sample, as shown by the KAM value.
To estimate the geometrically necessary dislocation (GND) density of the as-built samples, Equation (1) was used.
ρ G N D 2 θ K A M b d
where b is the Burgers vector magnitude (0.255 nm), d is the step size, and θ is the KAM misorientation angle. A small step size was carefully selected for this analysis to ensure that the dislocation substructures are well indexed during scanning. Thus, using these parameters, the GND density was calculated to be 1.76 × 10¹⁶ m−2.
The KAM distribution chart in Figure 16c shows the distribution of KAM values for undeformed and deformed samples. The deformed sample shows a wider distribution with an increased misorientation value compared to the undeformed sample.
This investigation revealed that several microstructural features and surface characteristics exert a significant influence on the crack initiation and propagation behavior in LPBF 316L stainless steel. Finer grain sizes impede crack propagation due to the increased resistance offered by the grain boundaries. Conversely, the presence of defects, such as unmolten material, can not only alter the crack path, but also act as preferential sites for crack initiation. Striations observed on fracture surfaces serve as indicators of both the stress intensity and the direction of crack propagation. Furthermore, the surface roughness plays a critical role in the fatigue performance. The observed lower fatigue life of the LPBF 316L stainless steel samples is likely attributable to the presence of numerous defects.

4. Conclusions

In this work, 316L stainless steel samples manufactured by laser powder bed fusion were subjected to both static and cyclic loadings. Microstructural characterization was then carried out using optical microscopy and scanning electron microscopy equipped with EDS and EBSD analysis. The results obtained can be summarized as follows:
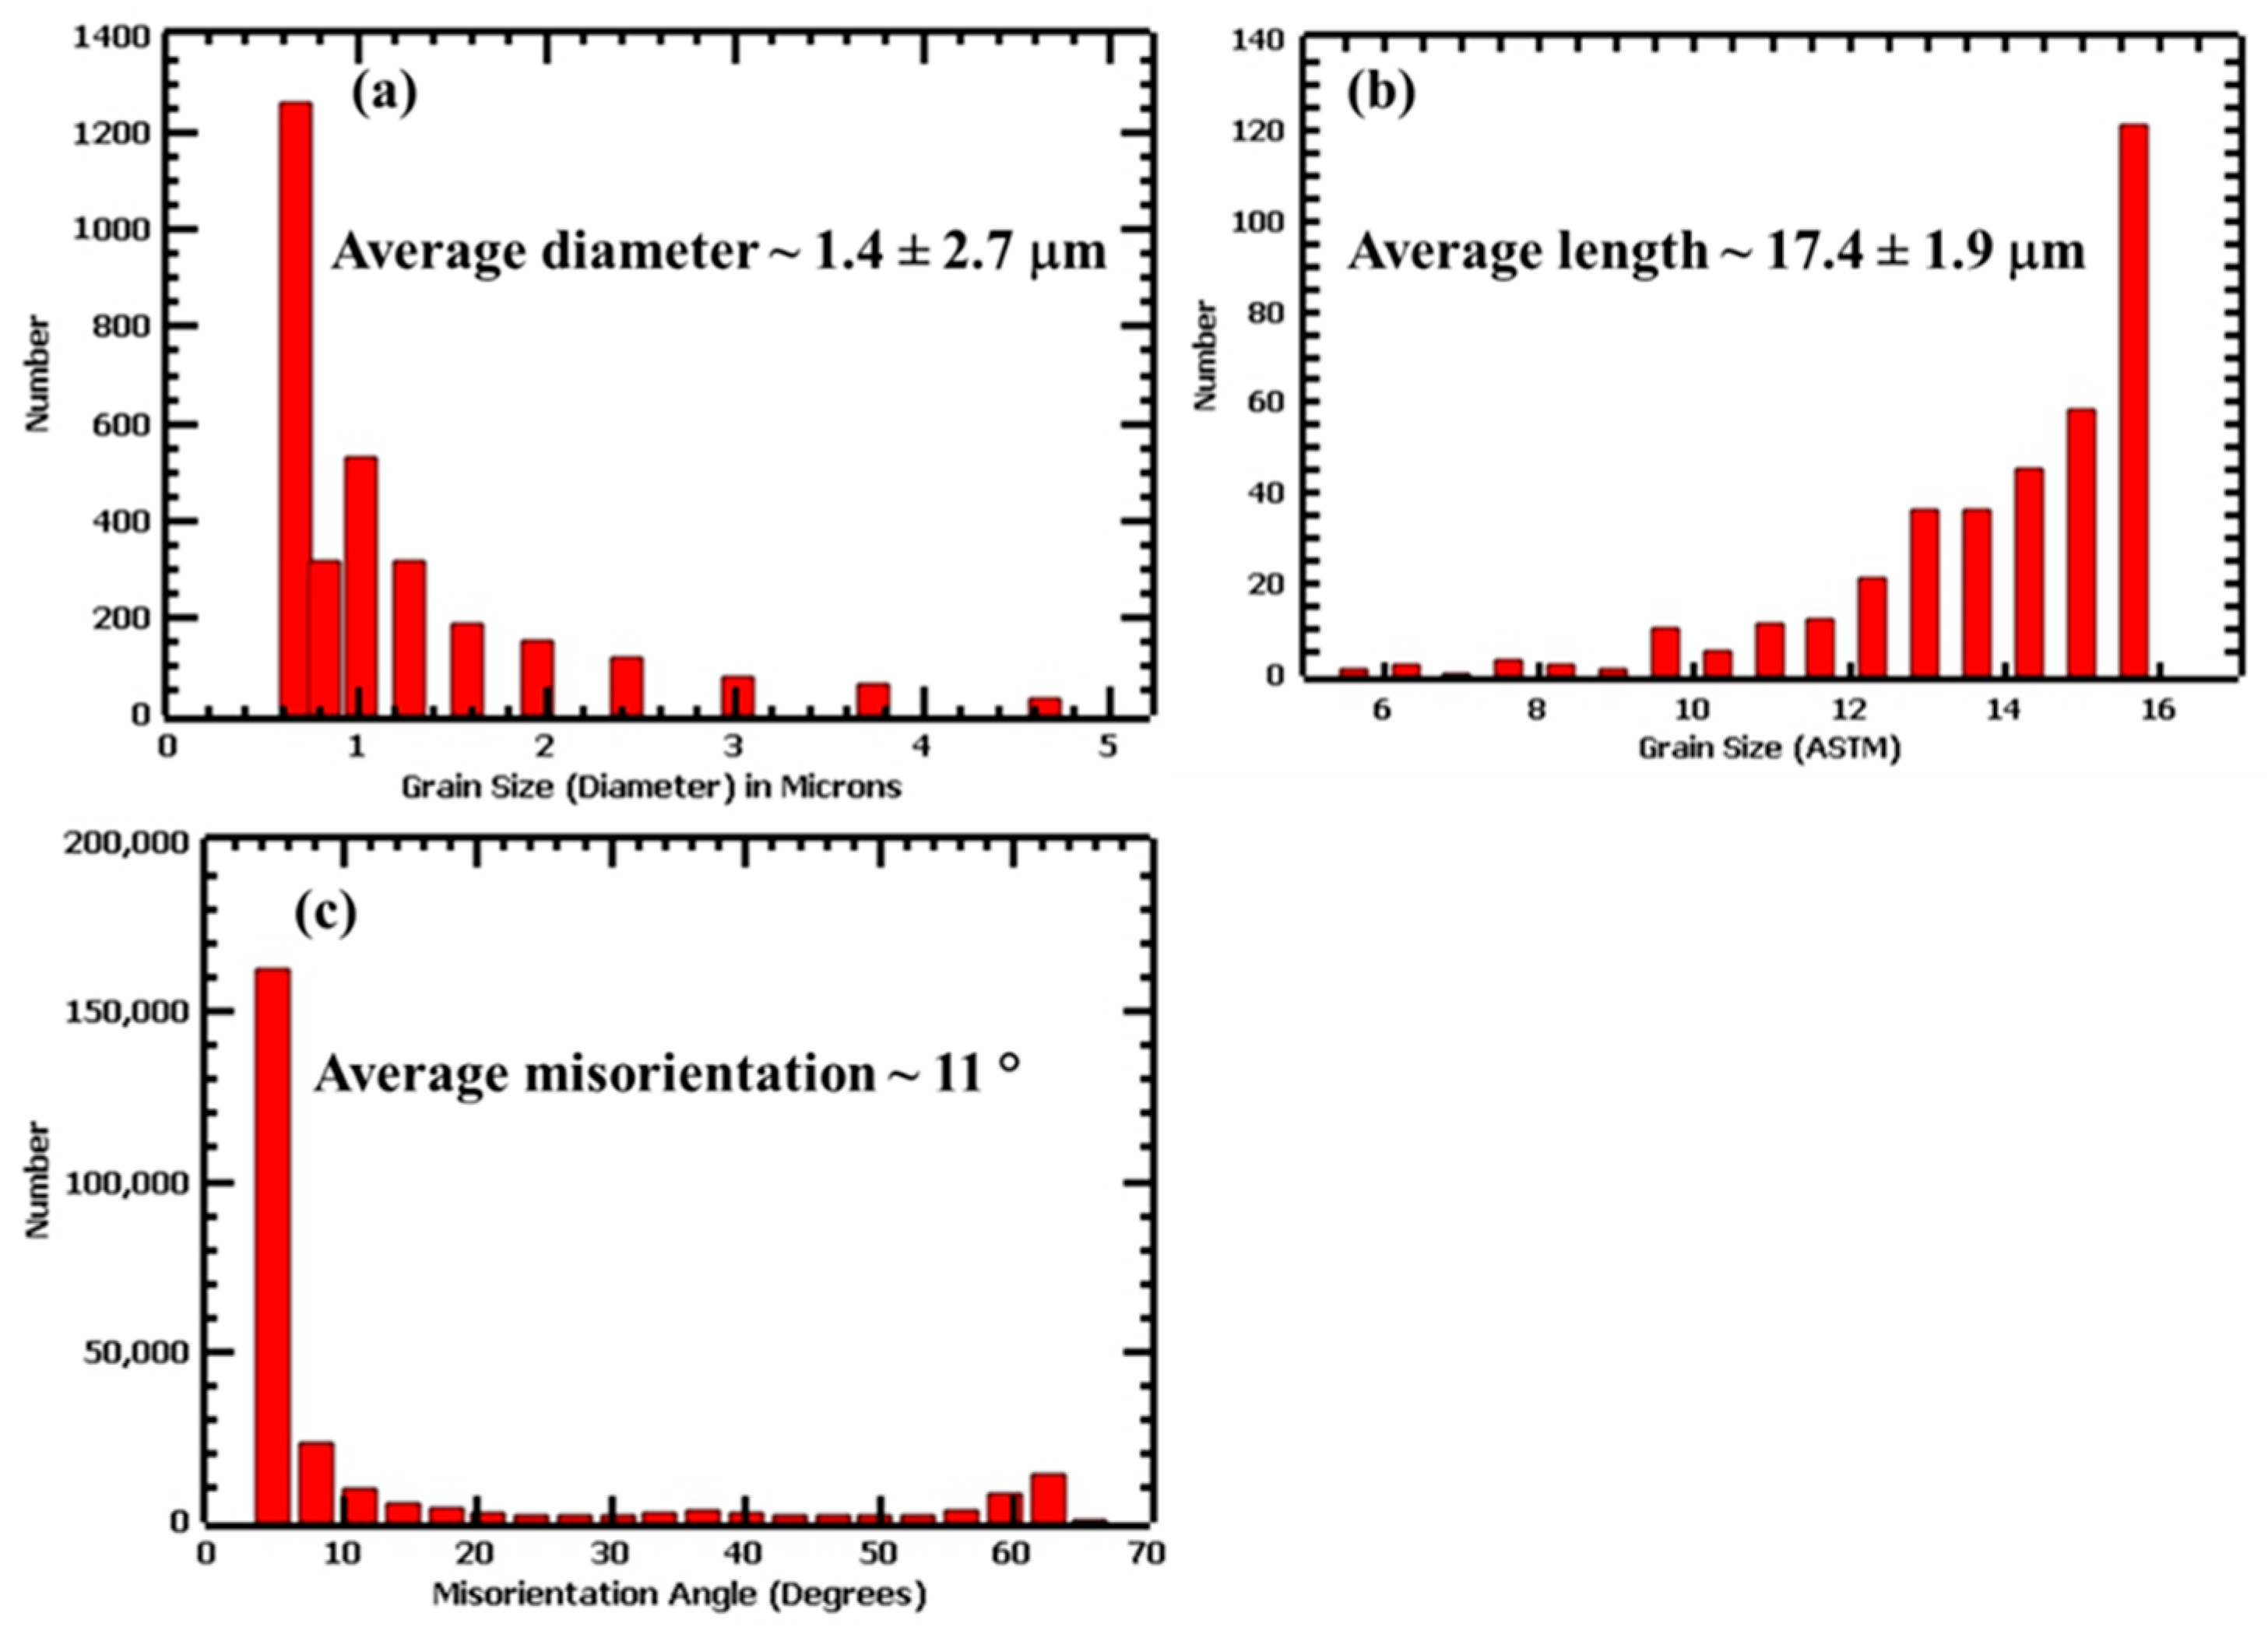
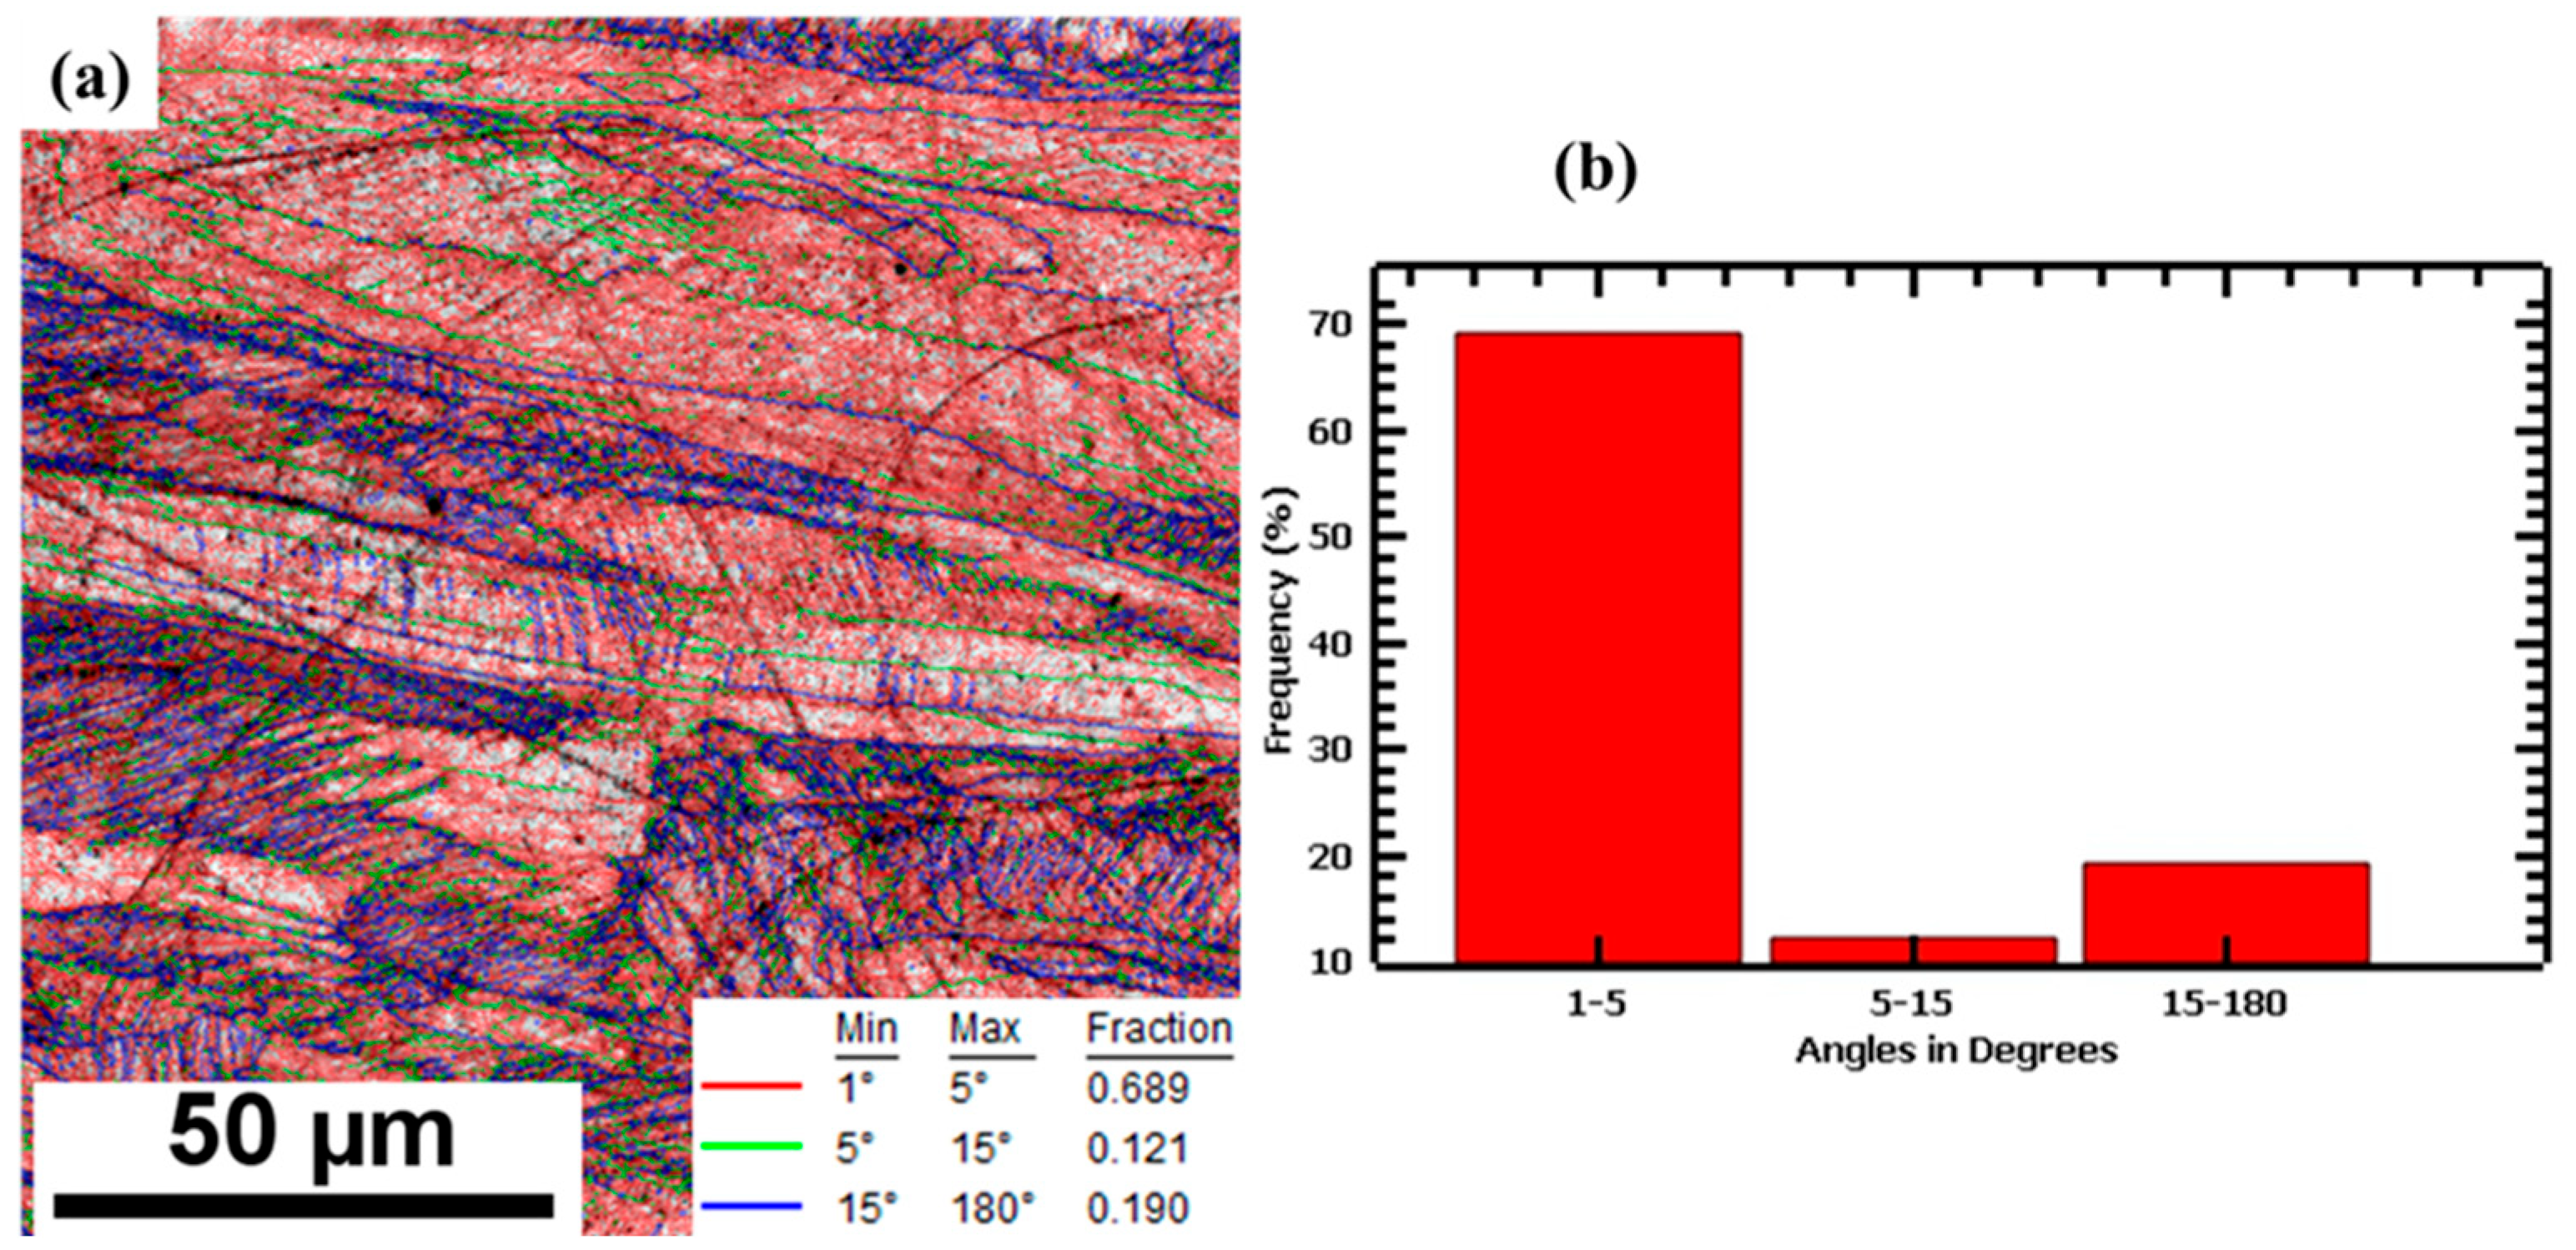
  • The as-built samples showed microstructural heterogeneity, as depicted by the wide range of grain sizes. The higher magnification of the surfaces revealed the presence of cellular structures formed due to high-temperature gradients during the fabrication process.
  • The unique microstructural features were observed to contribute significantly to the tensile strength of the samples. An average yield strength of 551 MPa, ultimate tensile strength of 619 MPa, and elongation to failure of 73% were obtained. The strength increased with ductility, which is usually not the case for stainless steel samples.
  • The enhanced quasi-static performance of the LPBF samples was attributed to the pre-existing high-density dislocations, fine grain structures, cellular structures, and chemical micro-segregation that acted as strengthening mechanisms.
  • The fatigue strength of the LPBF samples was determined to be 92.94 MPa and was observed at 30% of the UTS, where an average of 1,906,814 cycles were recorded.
  • At higher stress amplitudes, the fracture areas were observed to be filled with a mixture of striations and dimples. In contrast, at lower stress amplitudes, there were reduced dimples.
  • Numerous defects were observed at the fractured surfaces of fatigue-tested samples, and they were determined to have reduced the fatigue strength of the stainless steel samples.
Based on the outcomes of this study, it is recommended that the effect of the print strategy be studied, as the print strategy affects the size of grains, the porosity, the surface roughness of the printed samples, and, overall, affects the fatigue properties at lower and higher cycle frequencies. Specifically, the variation of the LPBF fabrication parameters should be studied to understand their impact on the formation of defects during fabrication and the mechanical response of the materials under fatigue loads. The process parameters that can be varied include speed, laser power, the powder used, hatch spacing, and layer thickness. It is worth noting that the samples used in this study did not undergo any post-fabrication treatments. Therefore, the samples can be subjected to surface treatments or heat treatments to enhance their properties under the fatigue load. Moreover, the additive manufacturing method used to fabricate the samples plays a critical role in determining the microstructures and thus the mechanical properties of 316L stainless steel. Therefore, future work should compare the properties of LPBF 316L stainless steel with those fabricated via alternative methods such as direct energy deposition or binder jetting. These comparative findings will offer valuable insights into identifying the most appropriate and effective manufacturing method.

Author Contributions

Conceptualization, M.C. and G.O.; investigation, M.C.; writing—original draft preparation, M.C.; writing—review and editing, M.C., P.O. and G.O.; funding acquisition, G.O. All authors have read and agreed to the published version of the manuscript.

Funding

The authors acknowledge materials received from KCNSC via the Department of Energy—National Nuclear Security Administration (DOE-NNSA) and the financial support provided by the Department of Defence via its HBCU/MSI Research and Education Program (Contract #: W911NF2310218).

Data Availability Statement

The data that support the findings of this study are available from the author upon request.

Conflicts of Interest

The authors declare no conflicts of interest.

References

  1. Cobbinah, P.V.; Nzeukou, R.A.; Onawale, O.T.; Matizamhuka, W.R. Laser Powder Bed Fusion of Potential Superalloys: A Review. Metals 2020, 11, 58. [Google Scholar] [CrossRef]
  2. Pant, M.; Nagdeve, L.; Moona, G.; Kumar, H.; Rajput, A.; Ramkumar, J. Comprehensive Investigation of the Mechanical Properties of 316L Stainless Steel Processed via Laser Powder Bed Fusion. J. Mater. Eng. Perform. 2024, 1–14. [Google Scholar] [CrossRef]
  3. Hirschberg, C.; Larsen, M.S.; Bøtker, J.P.; Rantanen, J. Additive manufacturing of prototype elements with process interfaces for continuously operating manufacturing lines. Asian J. Pharm. Sci. 2018, 13, 575–583. [Google Scholar] [CrossRef]
  4. Chepkoech, M.; Alunda, B.O.; Otieno, L.O.; Park, S.J.; Byeon, C.C.; Lee, Y.J. Design and Fabrication of a Low-Cost Teaching Atomic Force Microscope with 3D Printed Parts. New Phys. Sae Mulli 2019, 69, 128–135. [Google Scholar] [CrossRef]
  5. Zhong, T.; He, K.; Li, H.; Yang, L. Mechanical properties of lightweight 316L stainless steel lattice structures fabricated by selective laser melting. Mater. Des. 2019, 181, 108076. [Google Scholar] [CrossRef]
  6. Kluczyński, J.; Śnieżek, L.; Grzelak, K.; Janiszewski, J.; Płatek, P.; Torzewski, J.; Szachogłuchowicz, I.; Gocman, K. Influence of Selective Laser Melting Technological Parameters on the Mechanical Properties of Additively Manufactured Elements Using 316L Austenitic Steel. Materials 2020, 13, 1449. [Google Scholar] [CrossRef]
  7. Seharing, A.; Azman, A.H.; Abdullah, S. A review on integration of lightweight gradient lattice structures in additive manufacturing parts. Adv. Mech. Eng. 2020, 12, 168781402091695. [Google Scholar] [CrossRef]
  8. Pradeep, P.I.; Kumar, V.A.; Sriranganath, A.; Singh, S.K.; Sahu, A.; Kumar, T.S.; Narayanan, P.R.; Arumugam, M.; Mohan, M. Characterization and Qualification of LPBF Additively Manufactured AISI-316L Stainless Steel Brackets for Aerospace Application. Trans. Indian Natl. Acad. Eng. 2020, 5, 603–616. [Google Scholar] [CrossRef]
  9. Ponticelli, G.S.; Panciroli, R.; Venettacci, S.; Tagliaferri, F.; Guarino, S. Experimental investigation on the fatigue behavior of laser powder bed fused 316L stainless steel. CIRP J. Manuf. Sci. Technol. 2022, 38, 787–800. [Google Scholar] [CrossRef]
  10. Mower, T.M.; Long, M.J. Mechanical behavior of additive manufactured, powder-bed laser-fused materials. Mater. Sci. Eng. A 2016, 651, 198–213. [Google Scholar] [CrossRef]
  11. Hitzler, L.; Hirsch, J.; Heine, B.; Merkel, M.; Hall, W.; Öchsner, A. On the Anisotropic Mechanical Properties of Selective Laser-Melted Stainless Steel. Materials 2017, 10, 1136. [Google Scholar] [CrossRef]
  12. Yadollahi, A.; Shamsaei, N.; Thompson, S.M.; Elwany, A.; Bian, L. Effects of building orientation and heat treatment on fatigue behavior of selective laser melted 17-4 PH stainless steel. Int. J. Fatigue 2017, 94, 218–235. [Google Scholar] [CrossRef]
  13. Shrestha, R.; Simsiriwong, J.; Shamsaei, N. Fatigue behavior of additive manufactured 316L stainless steel parts: Effects of layer orientation and surface roughness. Addit. Manuf. 2019, 28, 23–38. [Google Scholar] [CrossRef]
  14. Alkindi, T.; Alyammahi, M.; Susantyoko, R.A.; Atatreh, S. The effect of varying specimens’ printing angles to the bed surface on the tensile strength of 3D-printed 17-4PH stainless-steels via metal FFF additive manufacturing. MRS Commun. 2021, 11, 310–316. [Google Scholar] [CrossRef]
  15. Yang, T.; Xie, D.; Yue, W.; Wang, S.; Rong, P.; Shen, L.; Zhao, J.; Wang, C. Distortion of thin-walled structure fabricated by selective laser melting based on assumption of constraining force-induced distortion. Metals 2019, 9, 1281. [Google Scholar] [CrossRef]
  16. Chakraborty, A.; Tangestani, R.; Batmaz, R.; Muhammad, W.; Plamondon, P.; Wessman, A.; Yuan, L.; Martin, É. In-process failure analysis of thin-wall structures made by laser powder bed fusion additive manufacturing. J. Mater. Sci. Technol. 2022, 98, 233–243. [Google Scholar] [CrossRef]
  17. Liang, X.; Hor, A.; Robert, C.; Salem, M.; Lin, F.; Morel, F. High cycle fatigue behavior of 316L steel fabricated by laser powder bed fusion: Effects of surface defect and loading mode. Int. J. Fatigue 2022, 160, 106843. [Google Scholar] [CrossRef]
  18. Zhang, J.; Zeißig, M.; Dörfert, R.; Jablonski, F.; Kienzler, R.; Schumacher, J.; Clausen, B.; Woizeschke, P.; Vollertsen, F. Influence of laser beam scanning pattern and polar angle on the fatigue behavior of additively manufactured specimens made of steel 316L. Mater. Sci. Eng. A 2023, 886, 145651. [Google Scholar] [CrossRef]
  19. Hamada, A.; Jaskari, M.; Gundgire, T.; Järvenpää, A. Enhancement and underlying fatigue mechanisms of laser powder bed fusion additive-manufactured 316L stainless steel. Mater. Sci. Eng. A 2023, 873, 145021. [Google Scholar] [CrossRef]
  20. Bian, L.; Thompson, S.M.; Shamsaei, N. Mechanical Properties and Microstructural Features of Direct Laser-Deposited Ti-6Al-4V. JOM 2015, 67, 629–638. [Google Scholar] [CrossRef]
  21. Hatami, S.; Ma, T.; Vuoristo, T.; Bertilsson, J.; Lyckfeldt, O. Fatigue Strength of 316 L Stainless Steel Manufactured by Selective Laser Melting. J. Mater. Eng. Perform. 2020, 29, 3183–3194. [Google Scholar] [CrossRef]
  22. Chepkoech, M.; Owolabi, G.; Warner, G. Investigation of Microstructures and Tensile Properties of 316L Stainless Steel Fabricated via Laser Powder Bed Fusion. Materials 2024, 17, 913. [Google Scholar] [CrossRef] [PubMed]
  23. Godec, M.; Zaefferer, S.; Podgornik, B.; Šinko, M.; Tchernychova, E. Quantitative multiscale correlative microstructure analysis of additive manufacturing of stainless steel 316L processed by selective laser melting. Mater. Charact. 2020, 160, 110074. [Google Scholar] [CrossRef]
  24. Rautio, T.; Hietala, M.; Hirvimaki, M.; Makikangas, J.; Kumpula, J.; Jarvenpaa, A. Fatigue Life and Surface Quality of Laser Powder Bed Fusion Manufactured 316L Parts by Laser Heat Treatment. In Proceedings of the 2022 7th International Conference on Business and Industrial Research (ICBIR), Bangkok, Thailand, 19–20 May 2022; pp. 187–191. [Google Scholar] [CrossRef]
  25. Li, J.N.; Gao, D.; Lu, Y.; Hao, Z.P.; Wang, Z.Q. Mechanical properties and microstructure evolution of additive manufactured 316L stainless steel under dynamic loading. Mater. Sci. Eng. A 2022, 855, 143896. [Google Scholar] [CrossRef]
  26. Kumar, D.; Shankar, G.; Prashanth, K.G.; Suwas, S. Control of texture and microstructure in additive manufacturing of stainless steel 316 L. J. Alloys Compd. 2024, 976, 173040. [Google Scholar] [CrossRef]
  27. Sun, Z.; Tsai, S.P.; Konijnenberg, P.; Wang, J.Y.; Zaefferer, S. A large-volume 3D EBSD study on additively manufactured 316L stainless steel. Scr. Mater. 2024, 238, 115723. [Google Scholar] [CrossRef]
  28. Charmi, A.; Falkenberg, R.; Ávila, L.; Mohr, G.; Sommer, K.; Ulbricht, A.; Sprengel, M.; Neumann, R.S.; Skrotzki, B.; Evans, A. Mechanical anisotropy of additively manufactured stainless steel 316L: An experimental and numerical study. Mater. Sci. Eng. A 2021, 799, 140154. [Google Scholar] [CrossRef]
  29. Dixit, S.; Liu, S.; Murdoch, H.A.; Smith, P.M. Investigating build orientation-induced mechanical anisotropy in additive manufacturing 316L stainless steel. Mater. Sci. Eng. A 2023, 880, 145308. [Google Scholar] [CrossRef]
  30. Mohammad, K.A.; Zainudin, E.S.; Salit, M.S.; Zahari, N.I.; Ali, A. Experimental determination of the fatigue behavior of austenitic 316L stainless steel under fatigue and creep-fatigue tests at high temperature. Int. J. Met. Steel Res. Technol. 2013, 1, 1–11. Available online: http://acascipub.com/Journals.php (accessed on 25 August 2024).
  31. Omoniyi, P.O.; Mahamood, R.M.; Arthur, N.; Pityana, S.; Skhosane, S.; Okamoto, Y.; Shinonaga, T.; Maina, M.R.; Jen, T.C.; Akinlabi, E.T. Joint integrity evaluation of laser beam welded additive manufactured Ti6Al4V sheets. Sci. Rep. 2022, 12, 4062. [Google Scholar] [CrossRef]
  32. Ceschini, L.; Minak, G. Fatigue behaviour of low temperature carburised AISI 316L austenitic stainless steel. Surf. Coat. Technol. 2008, 202, 1778–1784. [Google Scholar] [CrossRef]
  33. Puchi-Cabrera, E.S.; Matı, F.; Herrera, I.; Berrı, J.A.; Dixit, S.; Bhat, D. On the fatigue behavior of an AISI 316L stainless steel coated with a PVD TiN deposit. Surf. Coat. Technol. 2004, 182, 276–286. [Google Scholar] [CrossRef]
  34. Riemer, A.; Leuders, S.; Thöne, M.; Richard, H.A.; Tröster, T.; Niendorf, T. On the fatigue crack growth behavior in 316L stainless steel manufactured by selective laser melting. Eng. Fract. Mech. 2014, 120, 15–25. [Google Scholar] [CrossRef]
  35. Wang, Z.; Yang, S.; Huang, Y.; Fan, C.; Peng, Z.; Gao, Z. Microstructure and Fatigue Damage of 316L Stainless Steel Manufactured by Selective Laser Melting (SLM). Materials 2021, 14, 7544. [Google Scholar] [CrossRef] [PubMed]
  36. Afkhami, S.; Dabiri, M.; Alavi, S.H.; Björk, T.; Salminen, A. Fatigue characteristics of steels manufactured by selective laser melting. Int. J. Fatigue 2019, 122, 72–83. [Google Scholar] [CrossRef]
  37. Fayazfar, H.; Salarian, M.; Rogalsky, A.; Sarker, D.; Russo, P.; Paserin, V.; Toyserkani, E. A critical review of powder-based additive manufacturing of ferrous alloys: Process parameters, microstructure and mechanical properties. Mater. Des. 2018, 144, 98–128. [Google Scholar] [CrossRef]
  38. Lamb, K.; Koube, K.; Kacher, J.; Sloop, T.; Thadhani, N.; Babu, S.S. Anisotropic spall failure of additively manufactured 316L stainless steel. Addit. Manuf. 2023, 66, 103464. [Google Scholar] [CrossRef]
  39. Elangeswaran, C.; Cutolo, A.; Muralidharan, G.K.; Vanmeensel, K.; Van Hooreweder, B. Microstructural analysis and fatigue crack initiation modelling of additively manufactured 316L after different heat treatments. Mater. Des. 2020, 194, 108962. [Google Scholar] [CrossRef]
  40. Zhang, M.; Sun, C.N.; Zhang, X.; Wei, J.; Hardacre, D.; Li, H. Predictive models for fatigue property of laser powder bed fusion stainless steel 316L. Mater. Des. 2018, 145, 42–54. [Google Scholar] [CrossRef]
  41. Mughrabi, H. Damage Mechanisms and Fatigue Lives: From the Low to the Very High Cycle Regime. Procedia Eng. 2013, 55, 636–644. [Google Scholar] [CrossRef]
  42. Sun, G.; Wang, C.; Wei, X.; Shang, D.; Chen, S. Study on small fatigue crack initiation and growth for friction stir welded joints. Mater. Sci. Eng. A 2019, 739, 71–85. [Google Scholar] [CrossRef]
  43. Mineur, M.; Villechaise, P.; Mendez, J. Influence of the crystalline texture on the fatigue behavior of a 316L austenitic stainless steel. Mater. Sci. Eng. A 2000, 286, 257–268. [Google Scholar] [CrossRef]
  44. Dowling, N.E. Mechanical Behavior of Materials: Engineering Methods for Deformation, Fracture, and Fatigue, 4th ed.; Pearson Education Inc.: London, UK, 2013. [Google Scholar]
  45. Zhang, Z.F.; Wang, Z.G. Dependence of intergranular fatigue cracking on the interactions of persistent slip bands with grain boundaries. Acta Mater. 2003, 51, 347–364. [Google Scholar] [CrossRef]
  46. Wang, G.; Ouyang, H.; Fan, C.; Guo, Q.; Li, Z.; Yan, W.; Li, Z. The origin of high-density dislocations in additively manufactured metals. Mater. Res. Lett. 2020, 8, 283–290. [Google Scholar] [CrossRef]
Figure 1. The geometrical dimensions of (a) LPBF 316L stainless steel samples, (b) schematics showing the build direction, and (c) scanning direction during EBSD analysis, reprinted from Ref. [22]. (Unit: mm).
Metals 14 00988 g001
Figure 2. Optical Micrographs of as-built samples obtained after etching using Kalling’s reagent; (a) 20× and (b) 50× magnifications.
Metals 14 00988 g002
Figure 3. EBSD results show (a) an IPF map of the as-built surface, (b) its corresponding inverse pole figure plot, and (c) the pole figure, showing a preferred crystallographic orientation along the <101> direction and {001} plane.
Metals 14 00988 g003
Figure 4. Distribution charts of as-built samples obtained from EBSD maps showing (a) the diameter of the grains, (b) the length of the grains, and (c) the misorientation angle of the grains.
Metals 14 00988 g004
Figure 5. (a) Grain boundary map of as-built 316L stainless steel showing the low- and high-angle grain boundaries and (b) distribution chart of the grain boundaries.
Metals 14 00988 g005
Figure 6. Stress amplitudes versus the number of cycles to failure of fatigue-tested LPBF 316L stainless steel samples, compared with wrought 316L stainless steel fatigue performance from Mohammad et al. [31].
Metals 14 00988 g006
Figure 7. Optical micrographs of fractured fatigue-tested samples were observed at (a) 20× magnification and (b) 50× magnification.
Metals 14 00988 g007
Figure 8. SEM images of LPBF 316L stainless steel samples depicting the fractured surfaces. In (a), the yellow dotted line separates the striations and dimple fracture zones, whereas the white arrows in (b) show the crack propagation direction.
Metals 14 00988 g008
Figure 9. (a) SEM image illustrating the initiation of cracks from the edge of the samples and (b) a higher magnification of the crack initiation site.
Metals 14 00988 g009
Figure 10. SEM fractography showing the striations formed at fractured surfaces observed at (a) 90%, (b) 70%, (c) 50%, and (d) 40% of the ultimate tensile strength.
Metals 14 00988 g010
Figure 11. Fracture morphologies demonstrate the sizes and shapes of dimples at (a) 90%, (b) 70%, (c) 50%, and (d) 40% of the ultimate tensile strength, (e) fracture morphologies showing pores within the sample, (f) and (g) cracks initiating from the edges of the samples, and (h) numerous microcracks.
Metals 14 00988 g011
Figure 12. Persistent slip bands were observed on the fractured surface of the LPBF 316L stainless steel sample.
Metals 14 00988 g012
Figure 13. (a) Inverse pole figure (IPF) map, (b) inverse pole figure plots, and (c) pole figures of fatigue-tested LPBF samples.
Metals 14 00988 g013
Figure 14. Representative EBSD distribution charts of fatigue-tested LPBF 316L samples showing (a) average grain (diameter) size, (b) average grain (length) size, and (c) average misorientation angle.
Metals 14 00988 g014
Figure 15. (a) The EBSD grain boundary map with its respective (b) grain boundary distribution chart for LPBF 316L stainless steel is subjected to a fatigue test.
Metals 14 00988 g015
Figure 16. Kernel average misorientation (KAM) maps of (a) as-built and (b) fatigue-tested LPBF 316L stainless steel samples, with (c) KAM value distributions of the undeformed and deformed samples.
Metals 14 00988 g016
Table 1. LPBF 316L stainless steel fabrication parameters.
MachineParametersScanning
Strategy
Renishaw AM250Laser PowerExposure timeLayer ThicknessHatch DistanceStripes
180 W86 μs40 μm85 μm
Table 2. Chemical composition of 316L stainless steel powder [22].
Element wt. %FeCrNiMoMnSiNOPCS
316L stainless steel PowderBal.18.210.22.571.10.80.070.020.0090.0130.001
Table 3. Tensile properties of LPBF 316L stainless steel samples.
SampleYield Strength (MPa)Tensile Strength (MPa)Elongation to Failure (%)Rockwell Hardness (HRB)
4.0 mm551.21 ± 2.43619.58 ± 3.2373.66 ± 3.0293 ± 1.5
ASTM A240/A240M-20a1704854095
Disclaimer/Publisher’s Note: The statements, opinions and data contained in all publications are solely those of the individual author(s) and contributor(s) and not of MDPI and/or the editor(s). MDPI and/or the editor(s) disclaim responsibility for any injury to people or property resulting from any ideas, methods, instructions or products referred to in the content.

