
Features of Increasing the Wear Resistance of 90CrSi Tool Steel Surface under Various Electrophysical Parameters of Plasma Electrolytic Treatment

 ,
,  ,
,
Abstract
1. Introduction
2. Materials and Methods
2.1. Materials
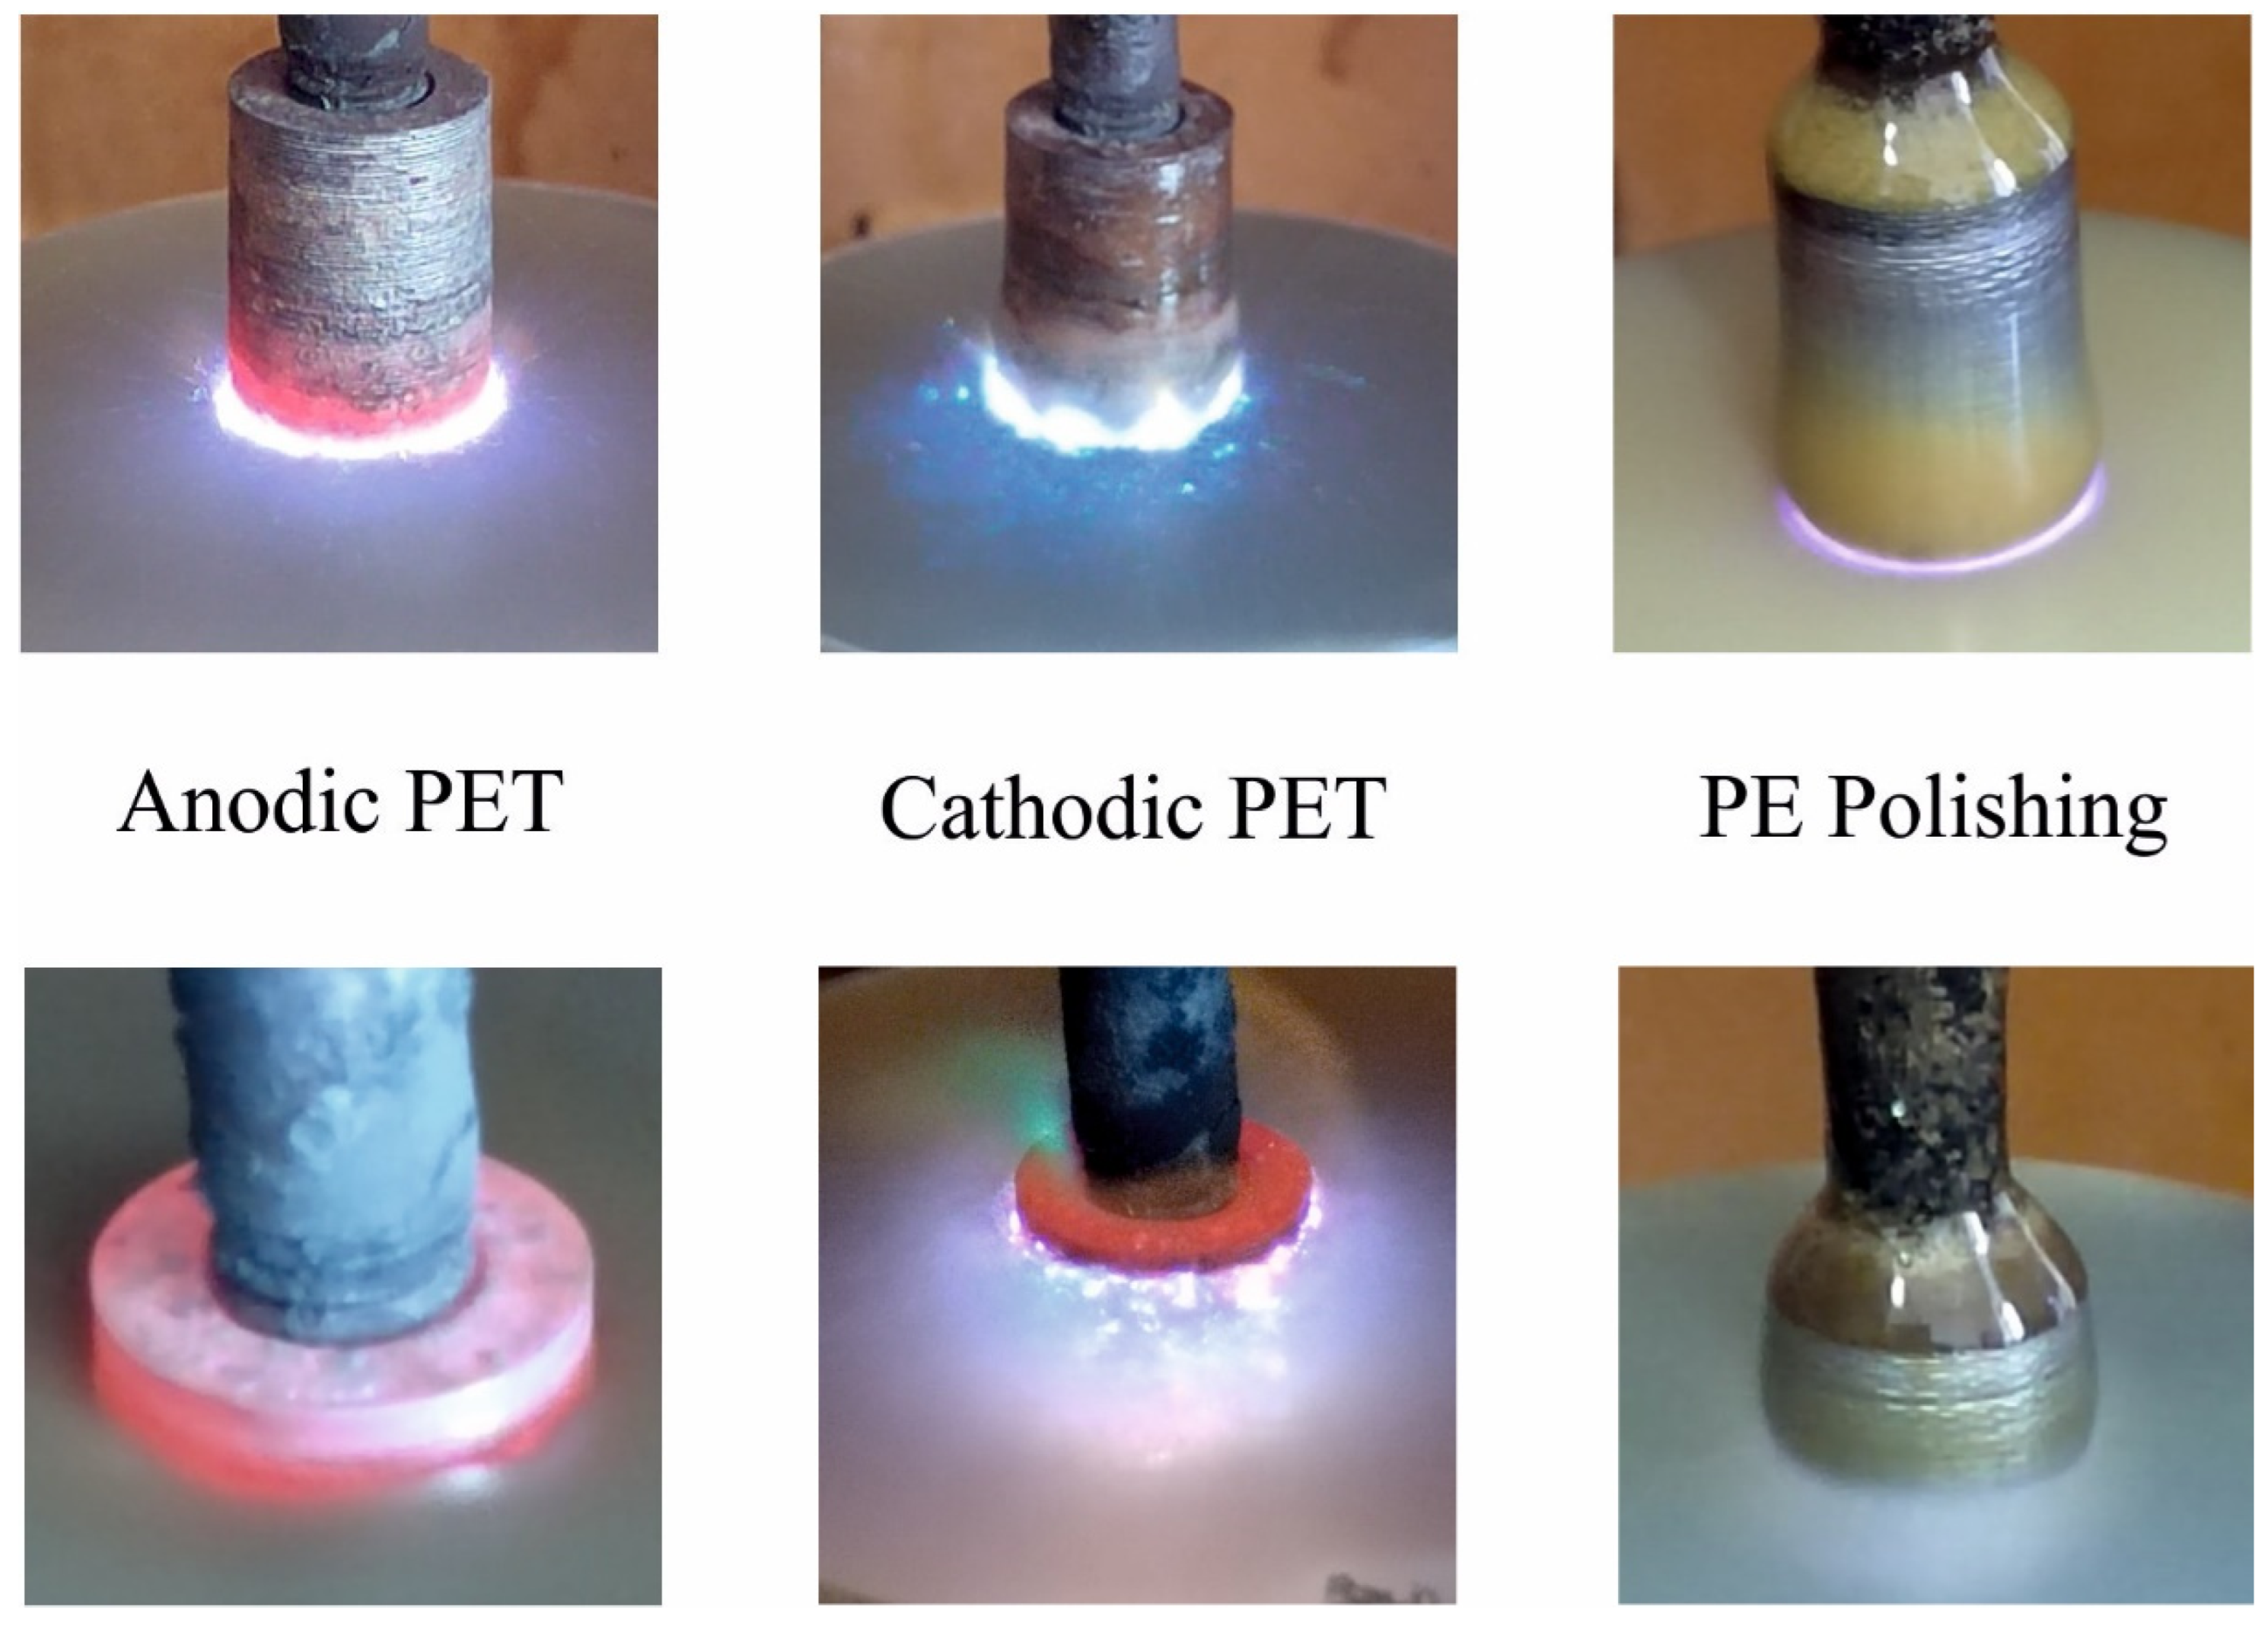
2.2. Processing
2.3. Study of Morphology, Structure, and Element and Phase Composition
2.4. The Microhardness Measurement
2.5. Surface Roughness and Weight of Samples Measurement
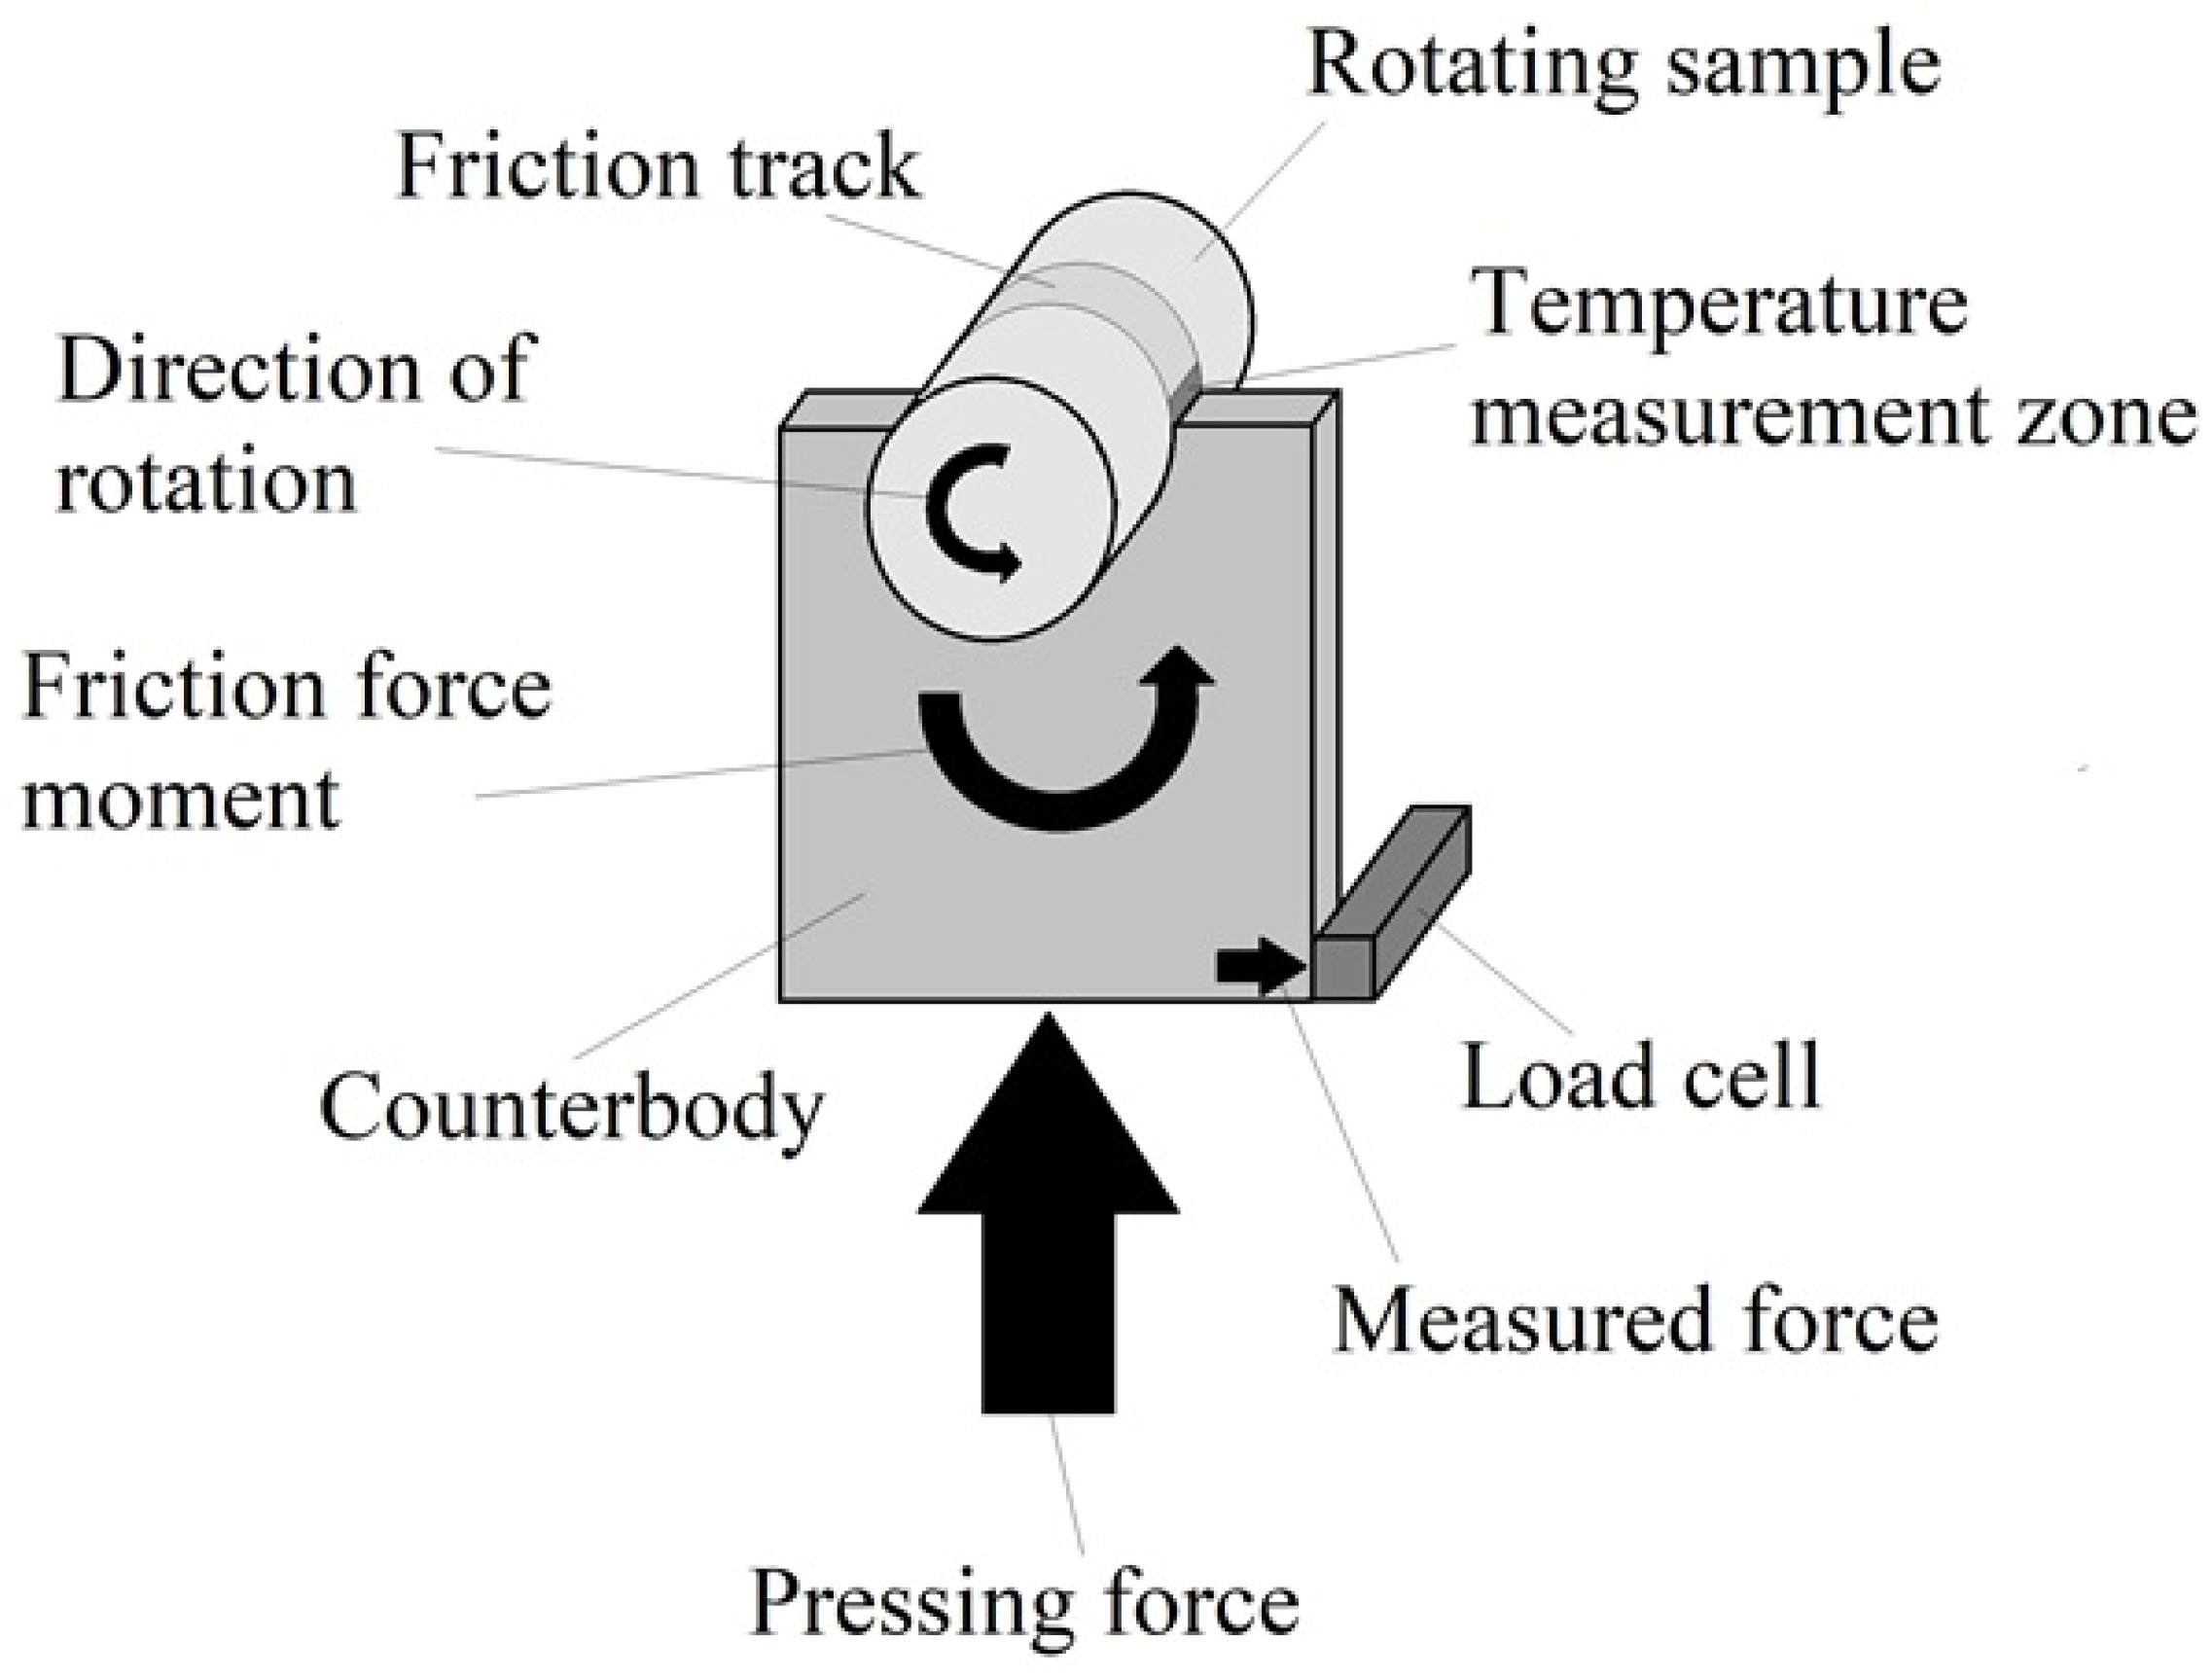
2.6. Study of Tribological Properties
2.7. Determination of the Microgeometry Characteristics and Type of Violation of Friction Bonds during Friction
3. Results and Discussion
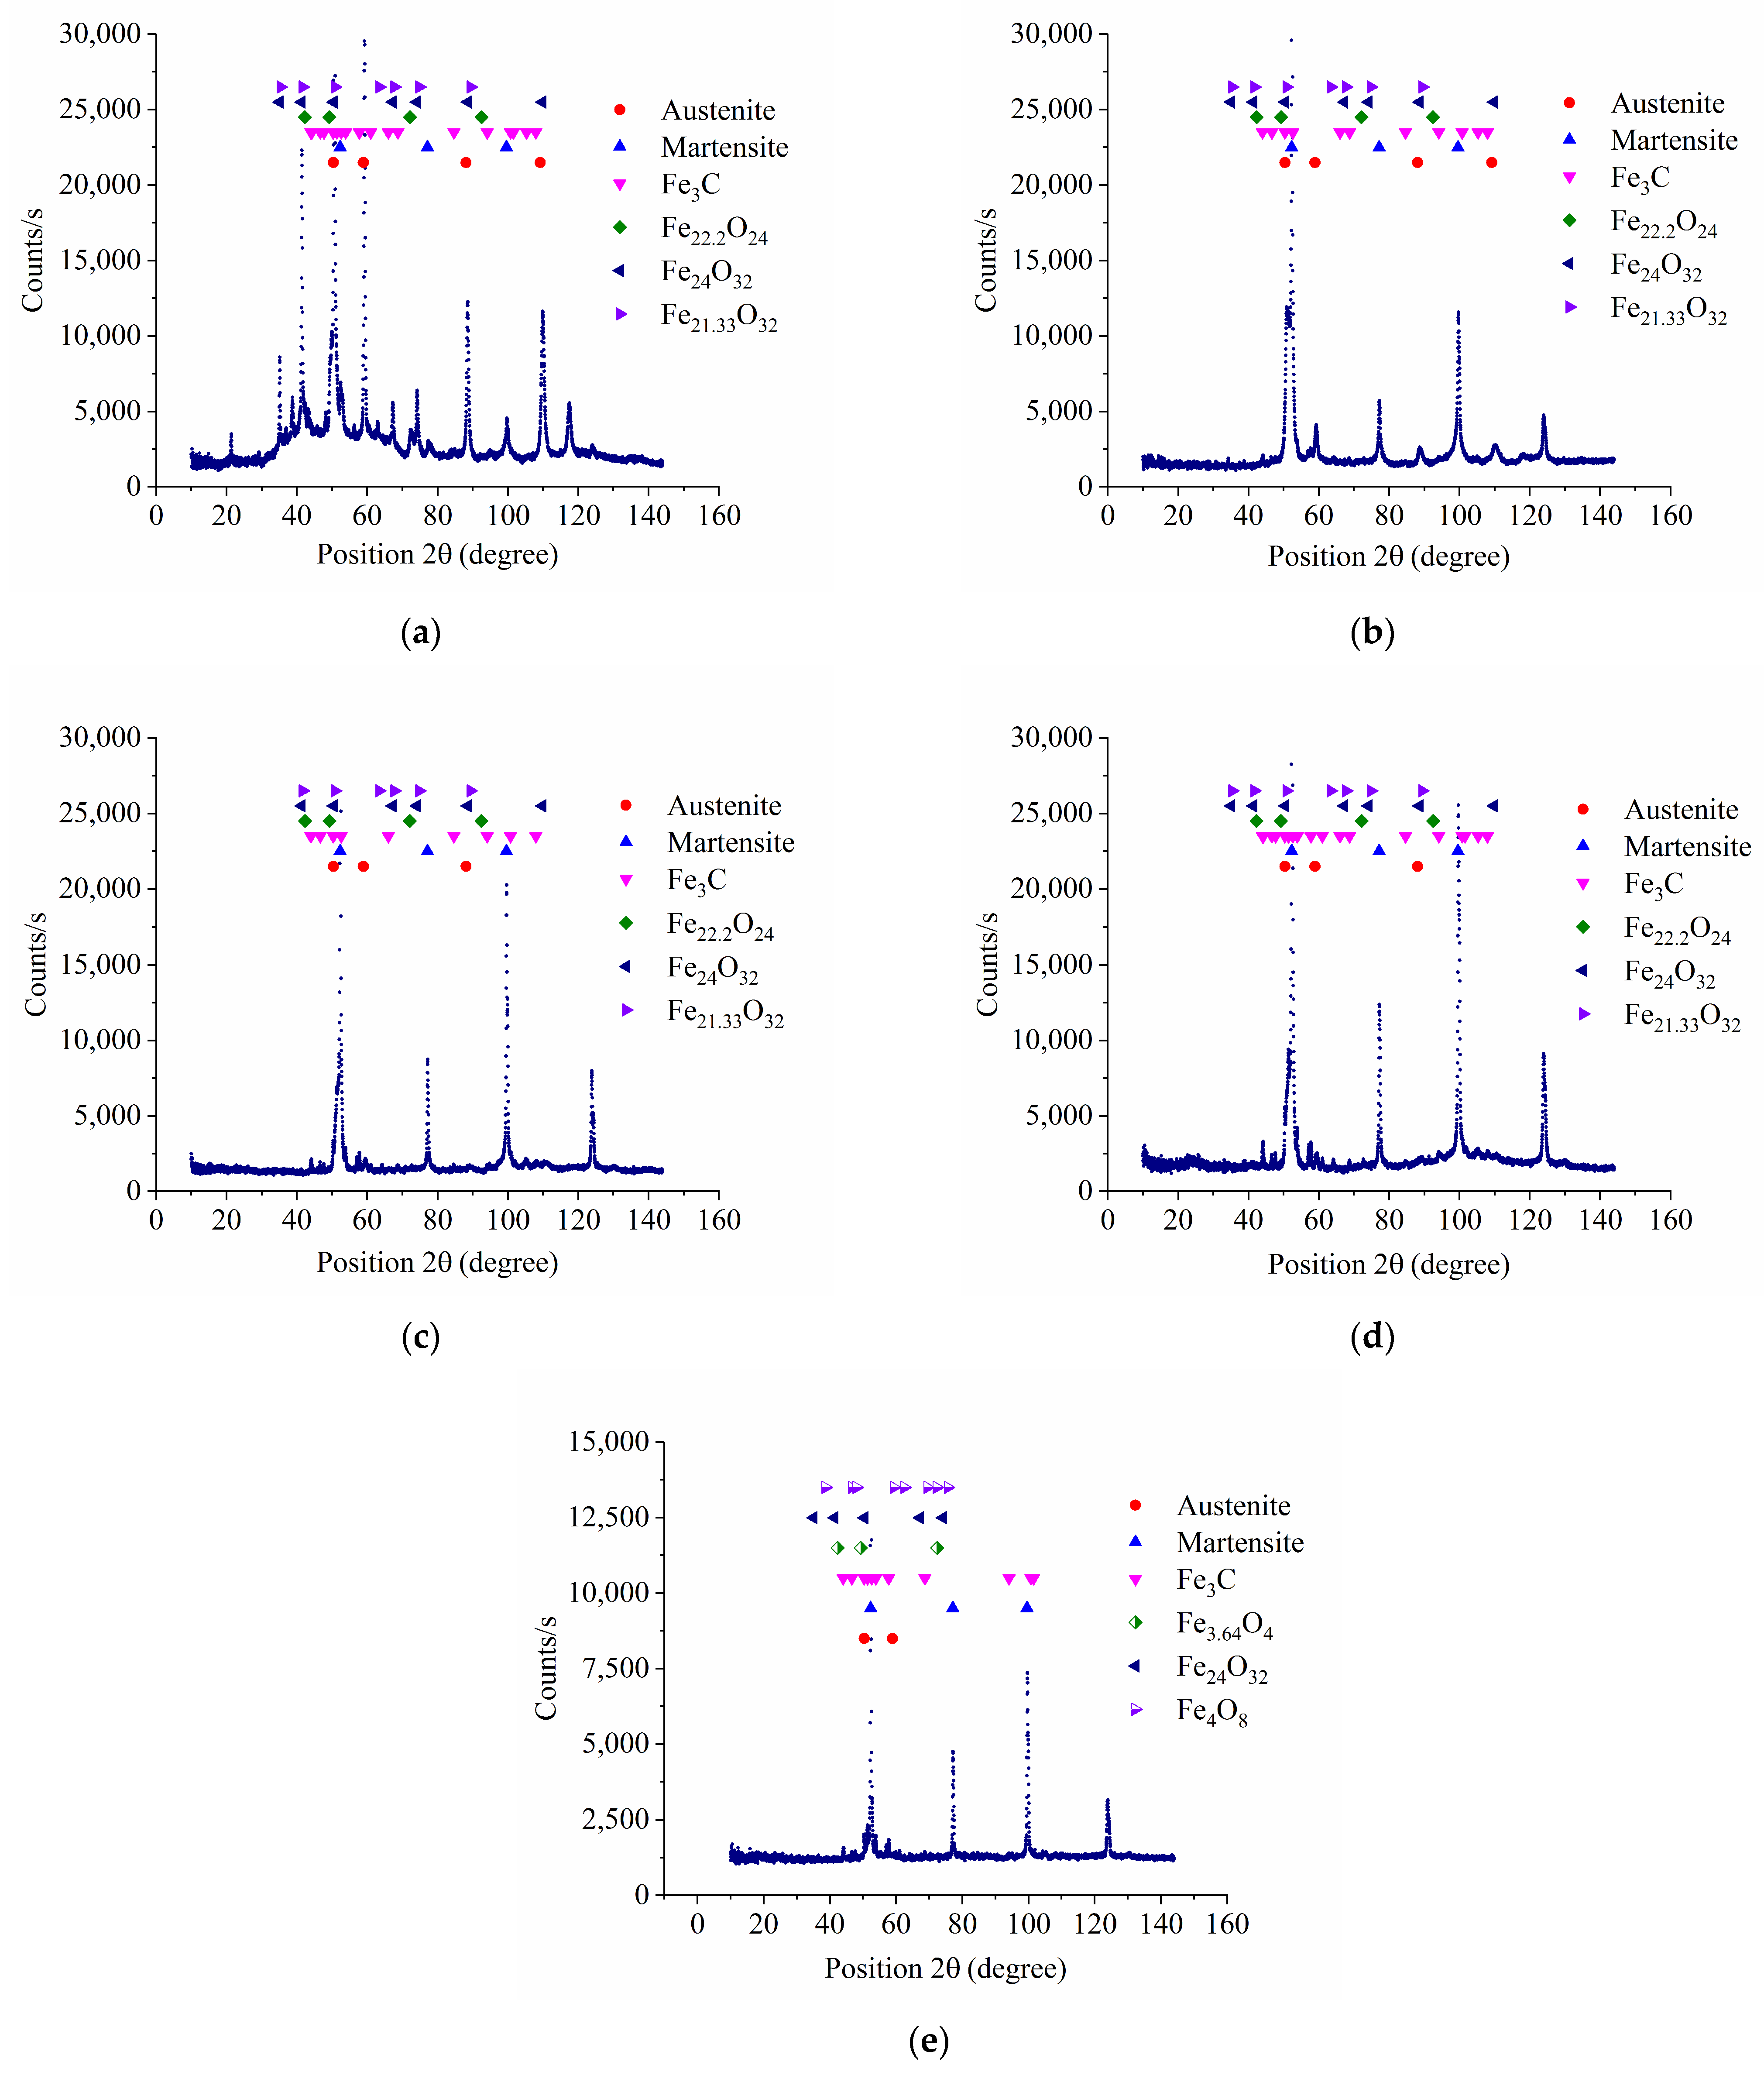
3.1. XRD Analysis of Samples Surface
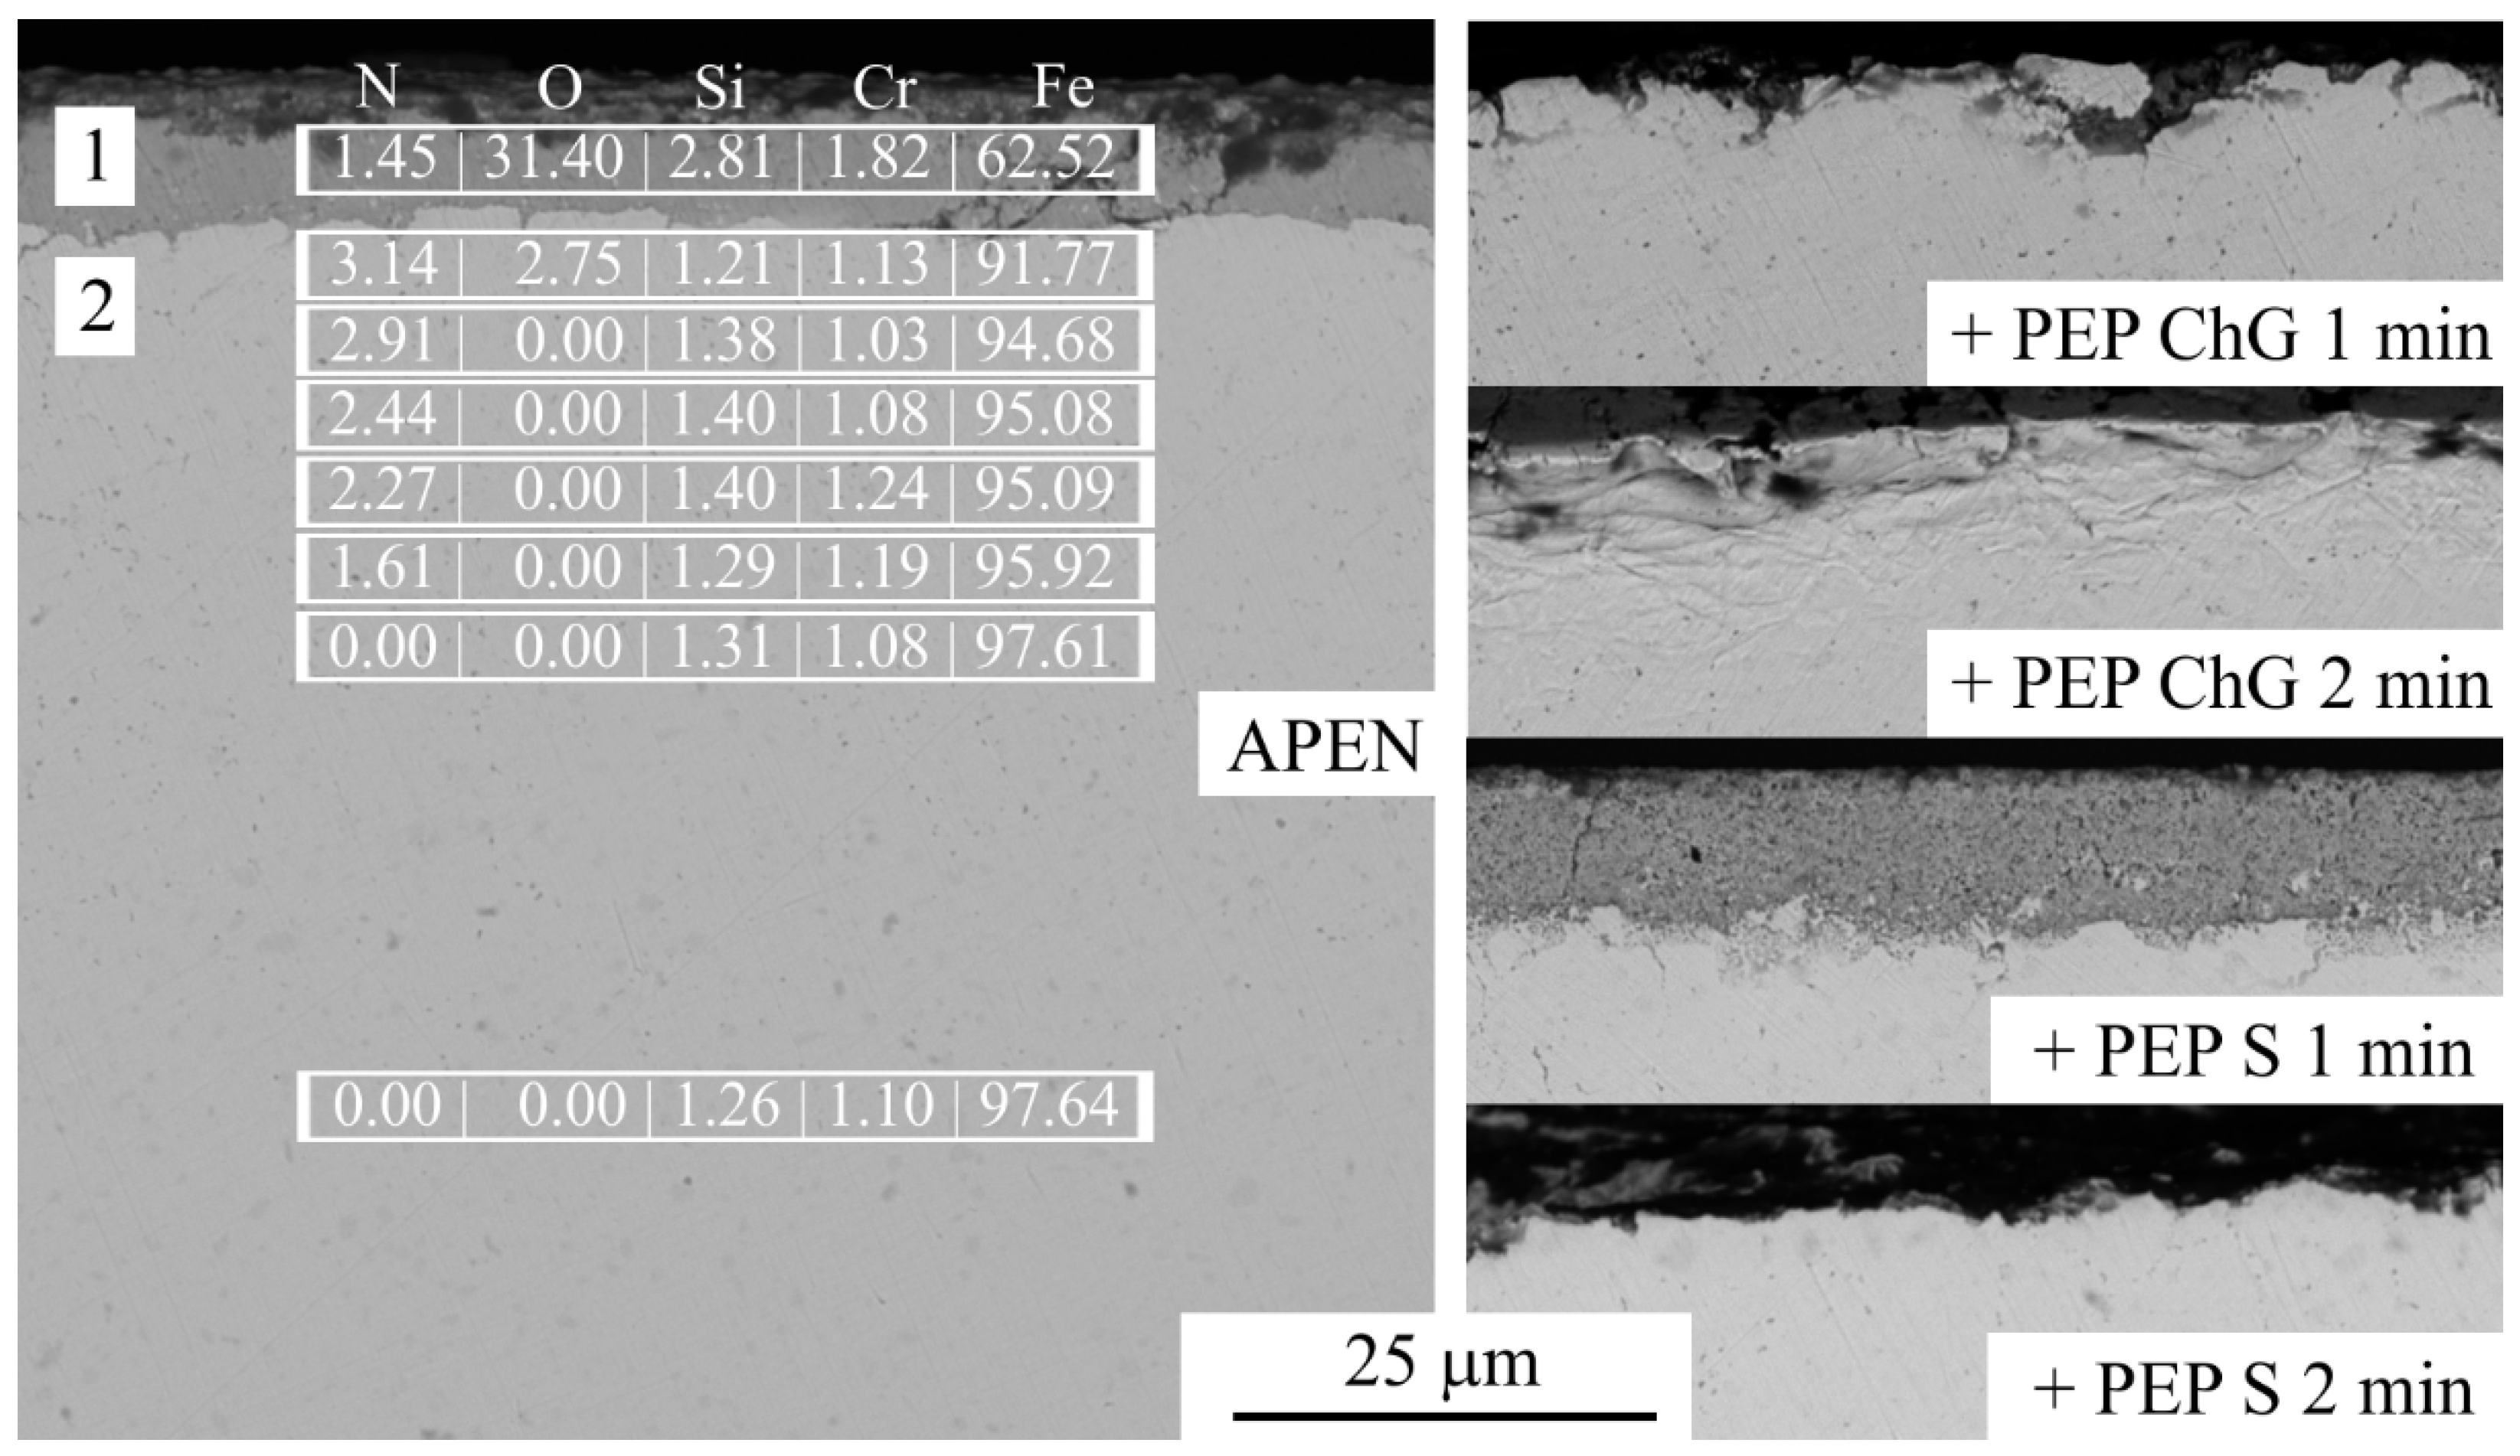
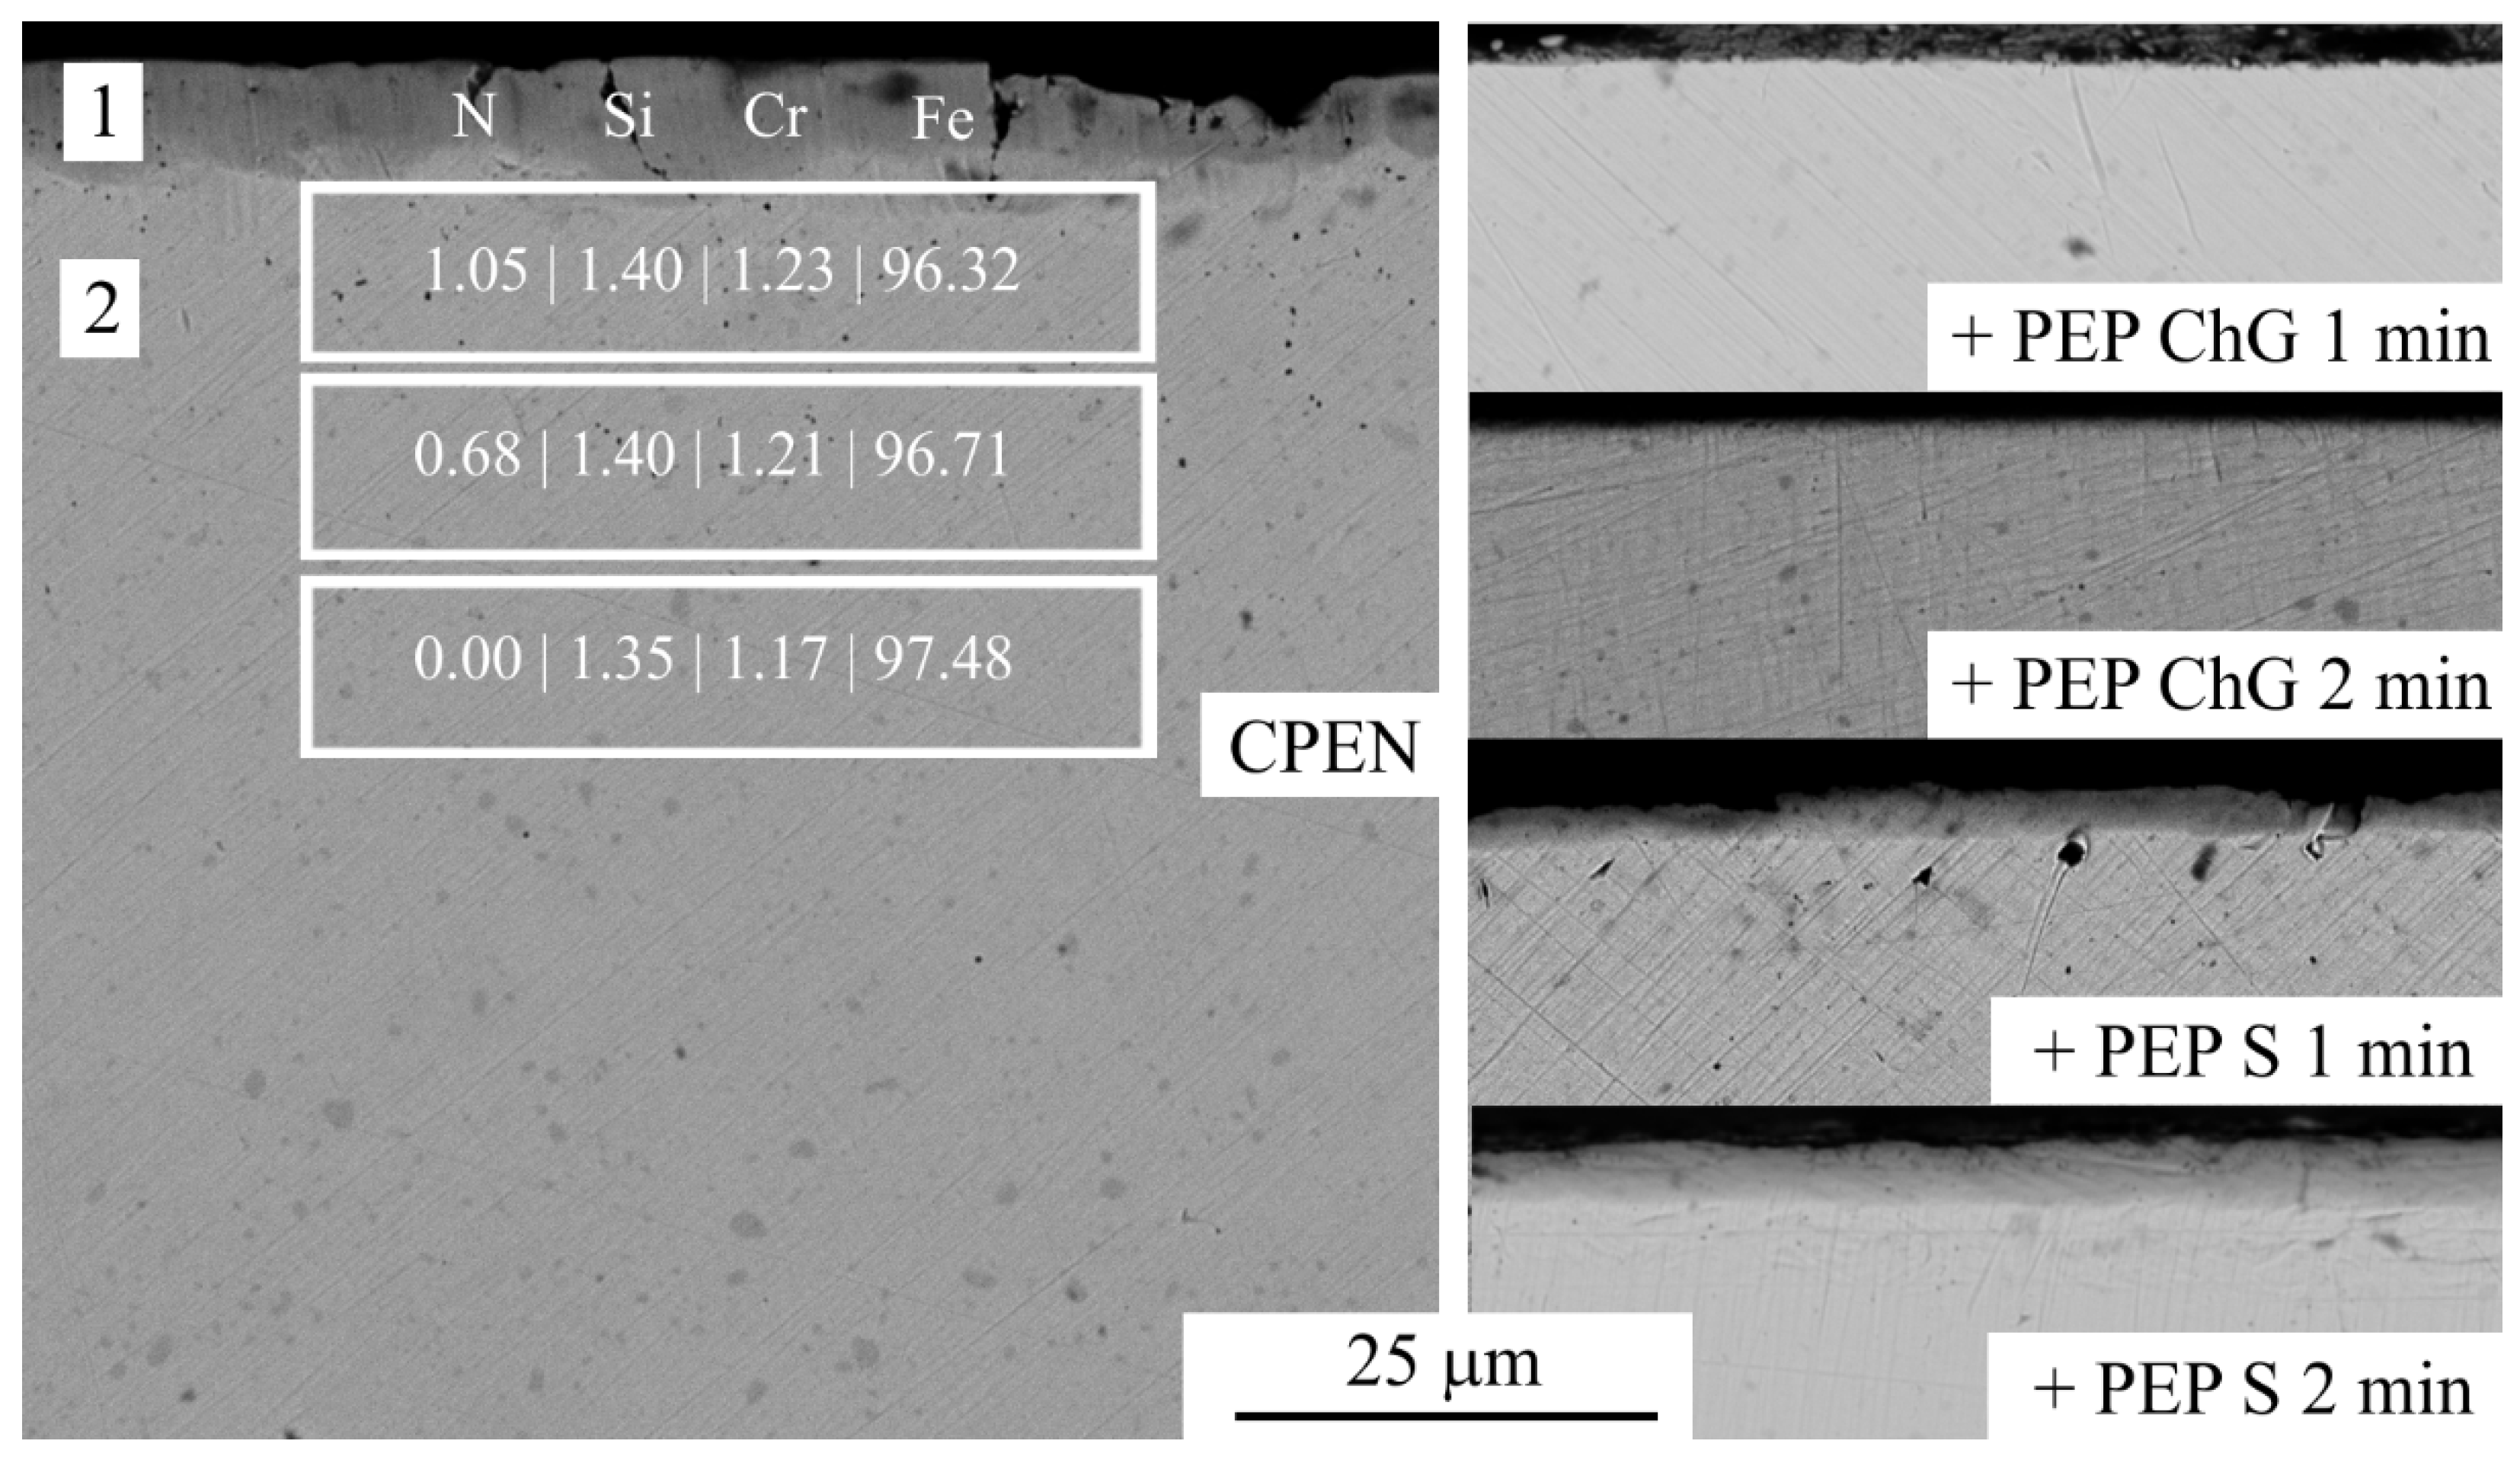
3.2. SEM and EDX Analysis of Samples Cross-Section
3.3. Calculation of Nitrogen Diffusion Coefficients
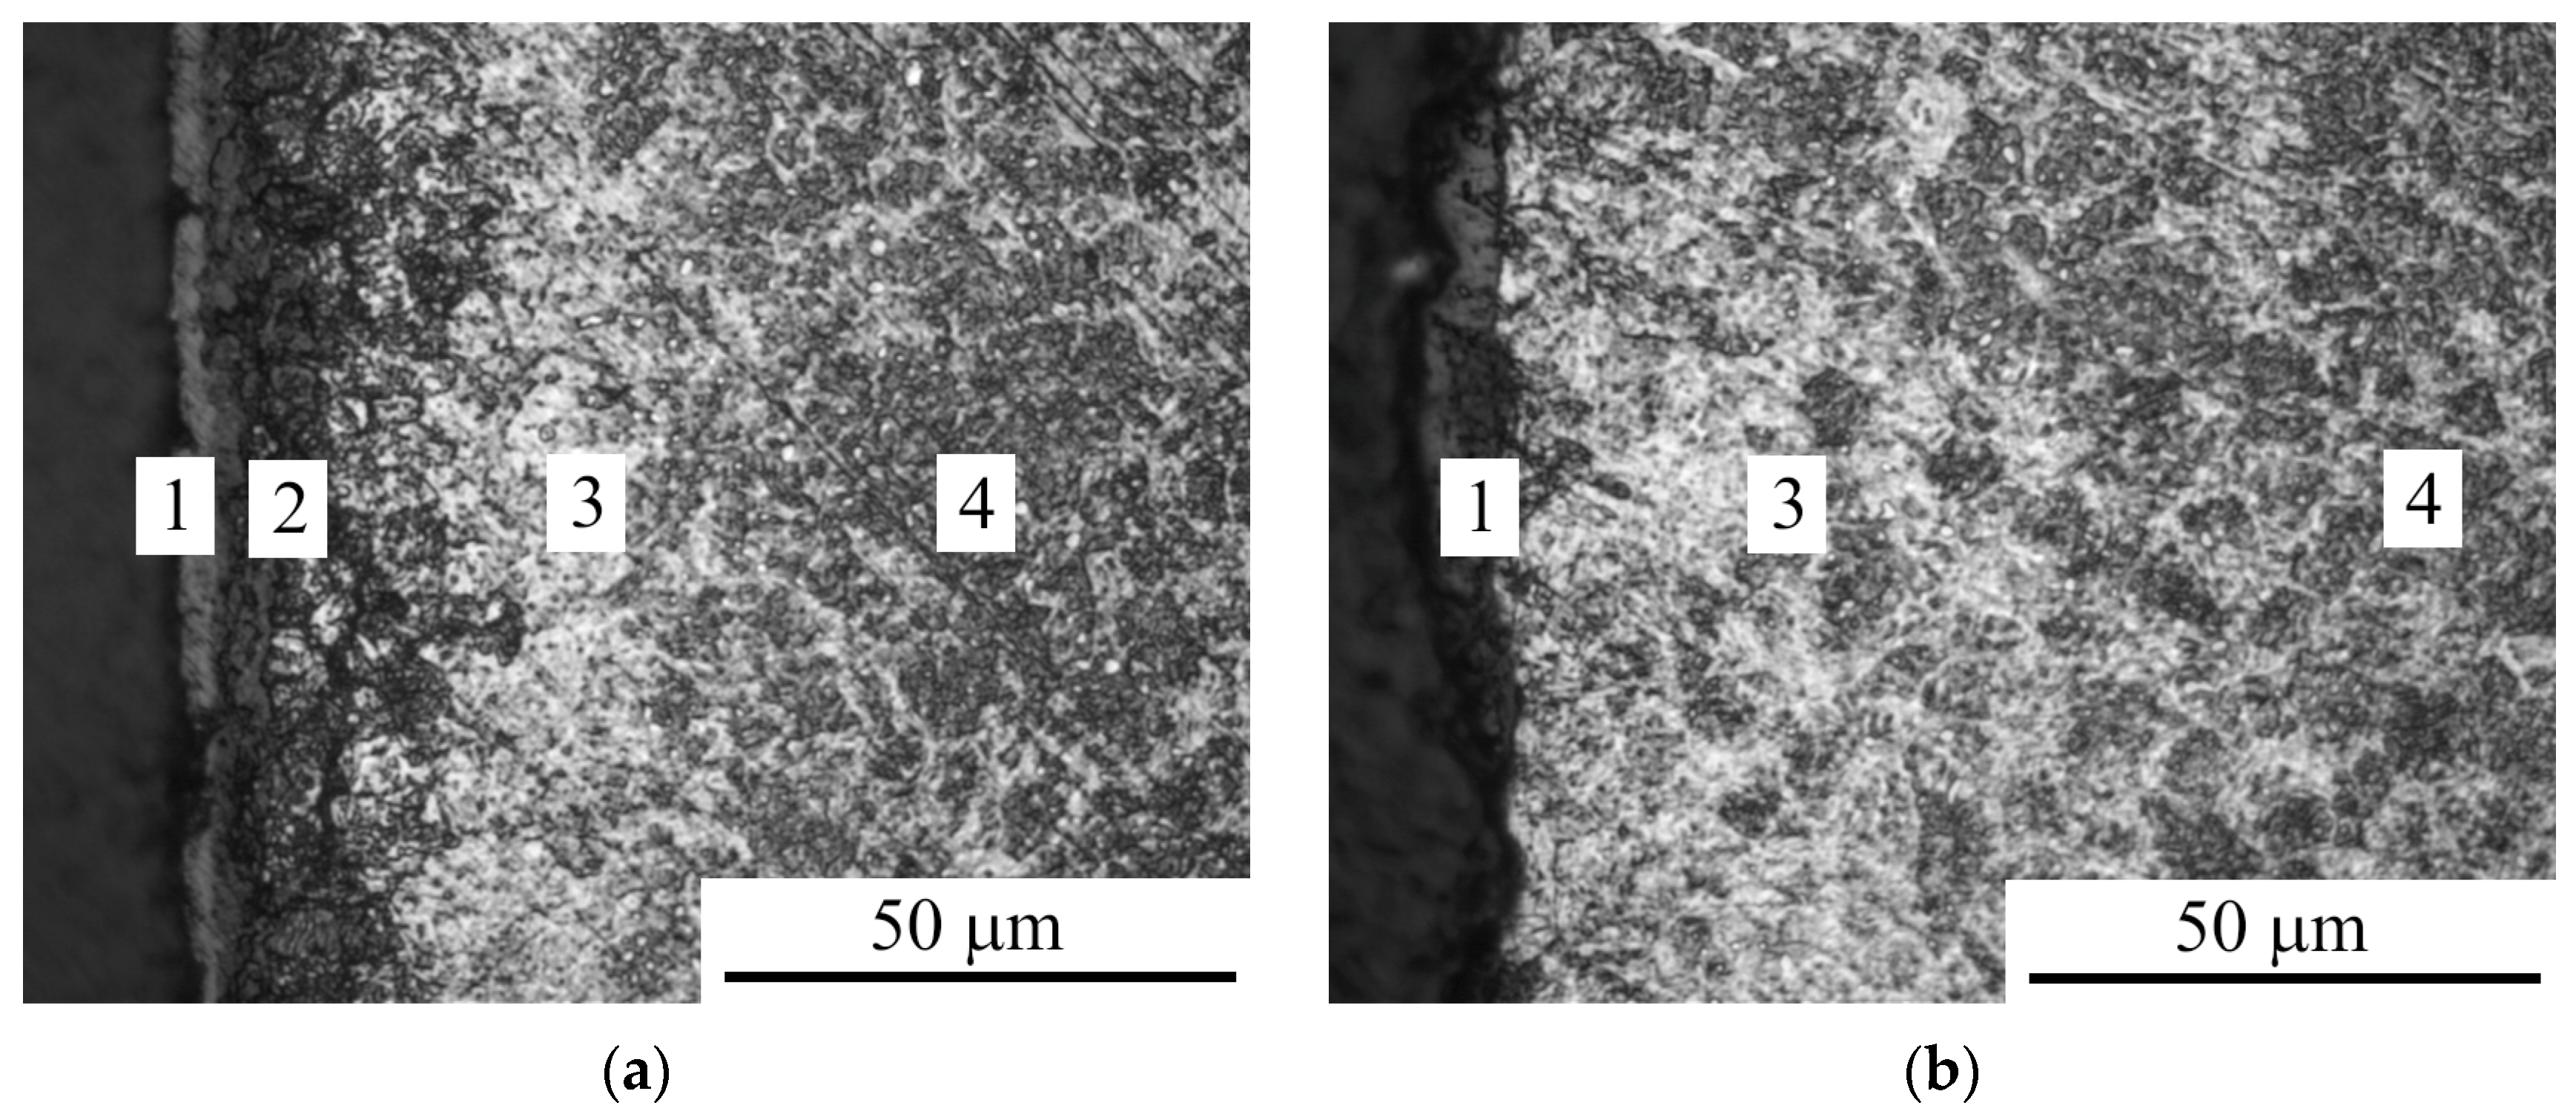
3.4. Metallographic Analysis and Microhardness of Samples Cross-Section
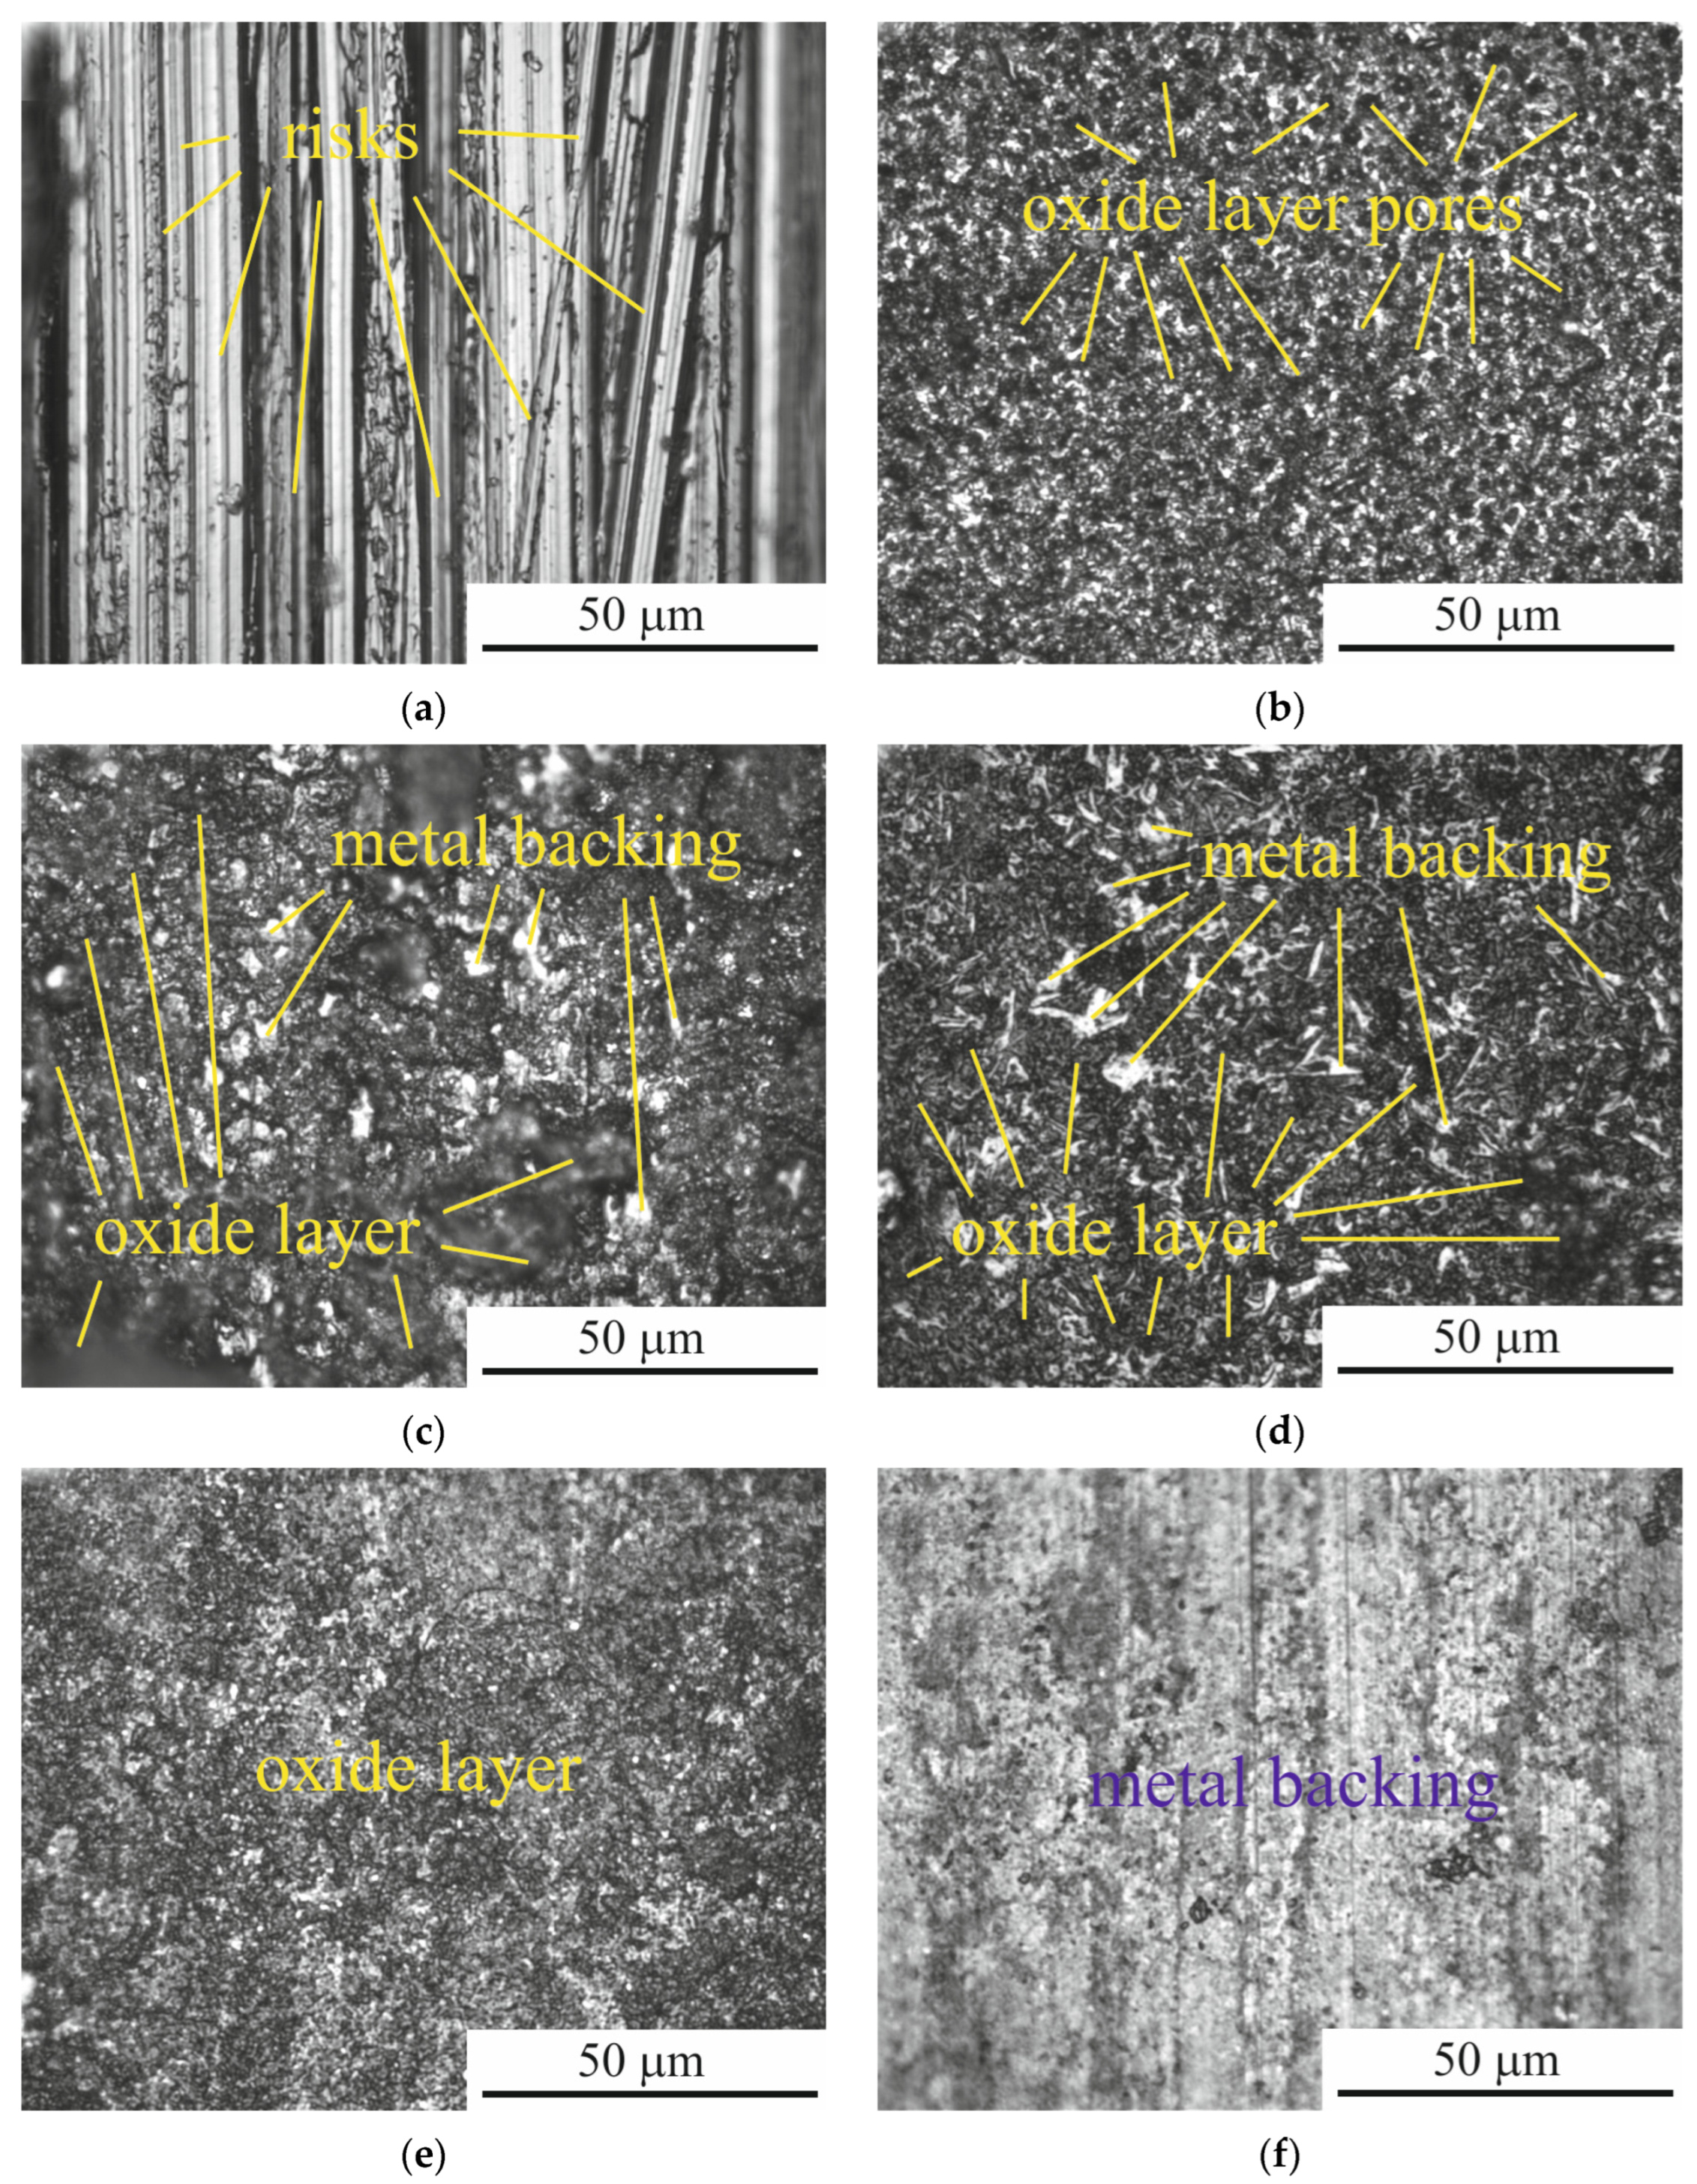
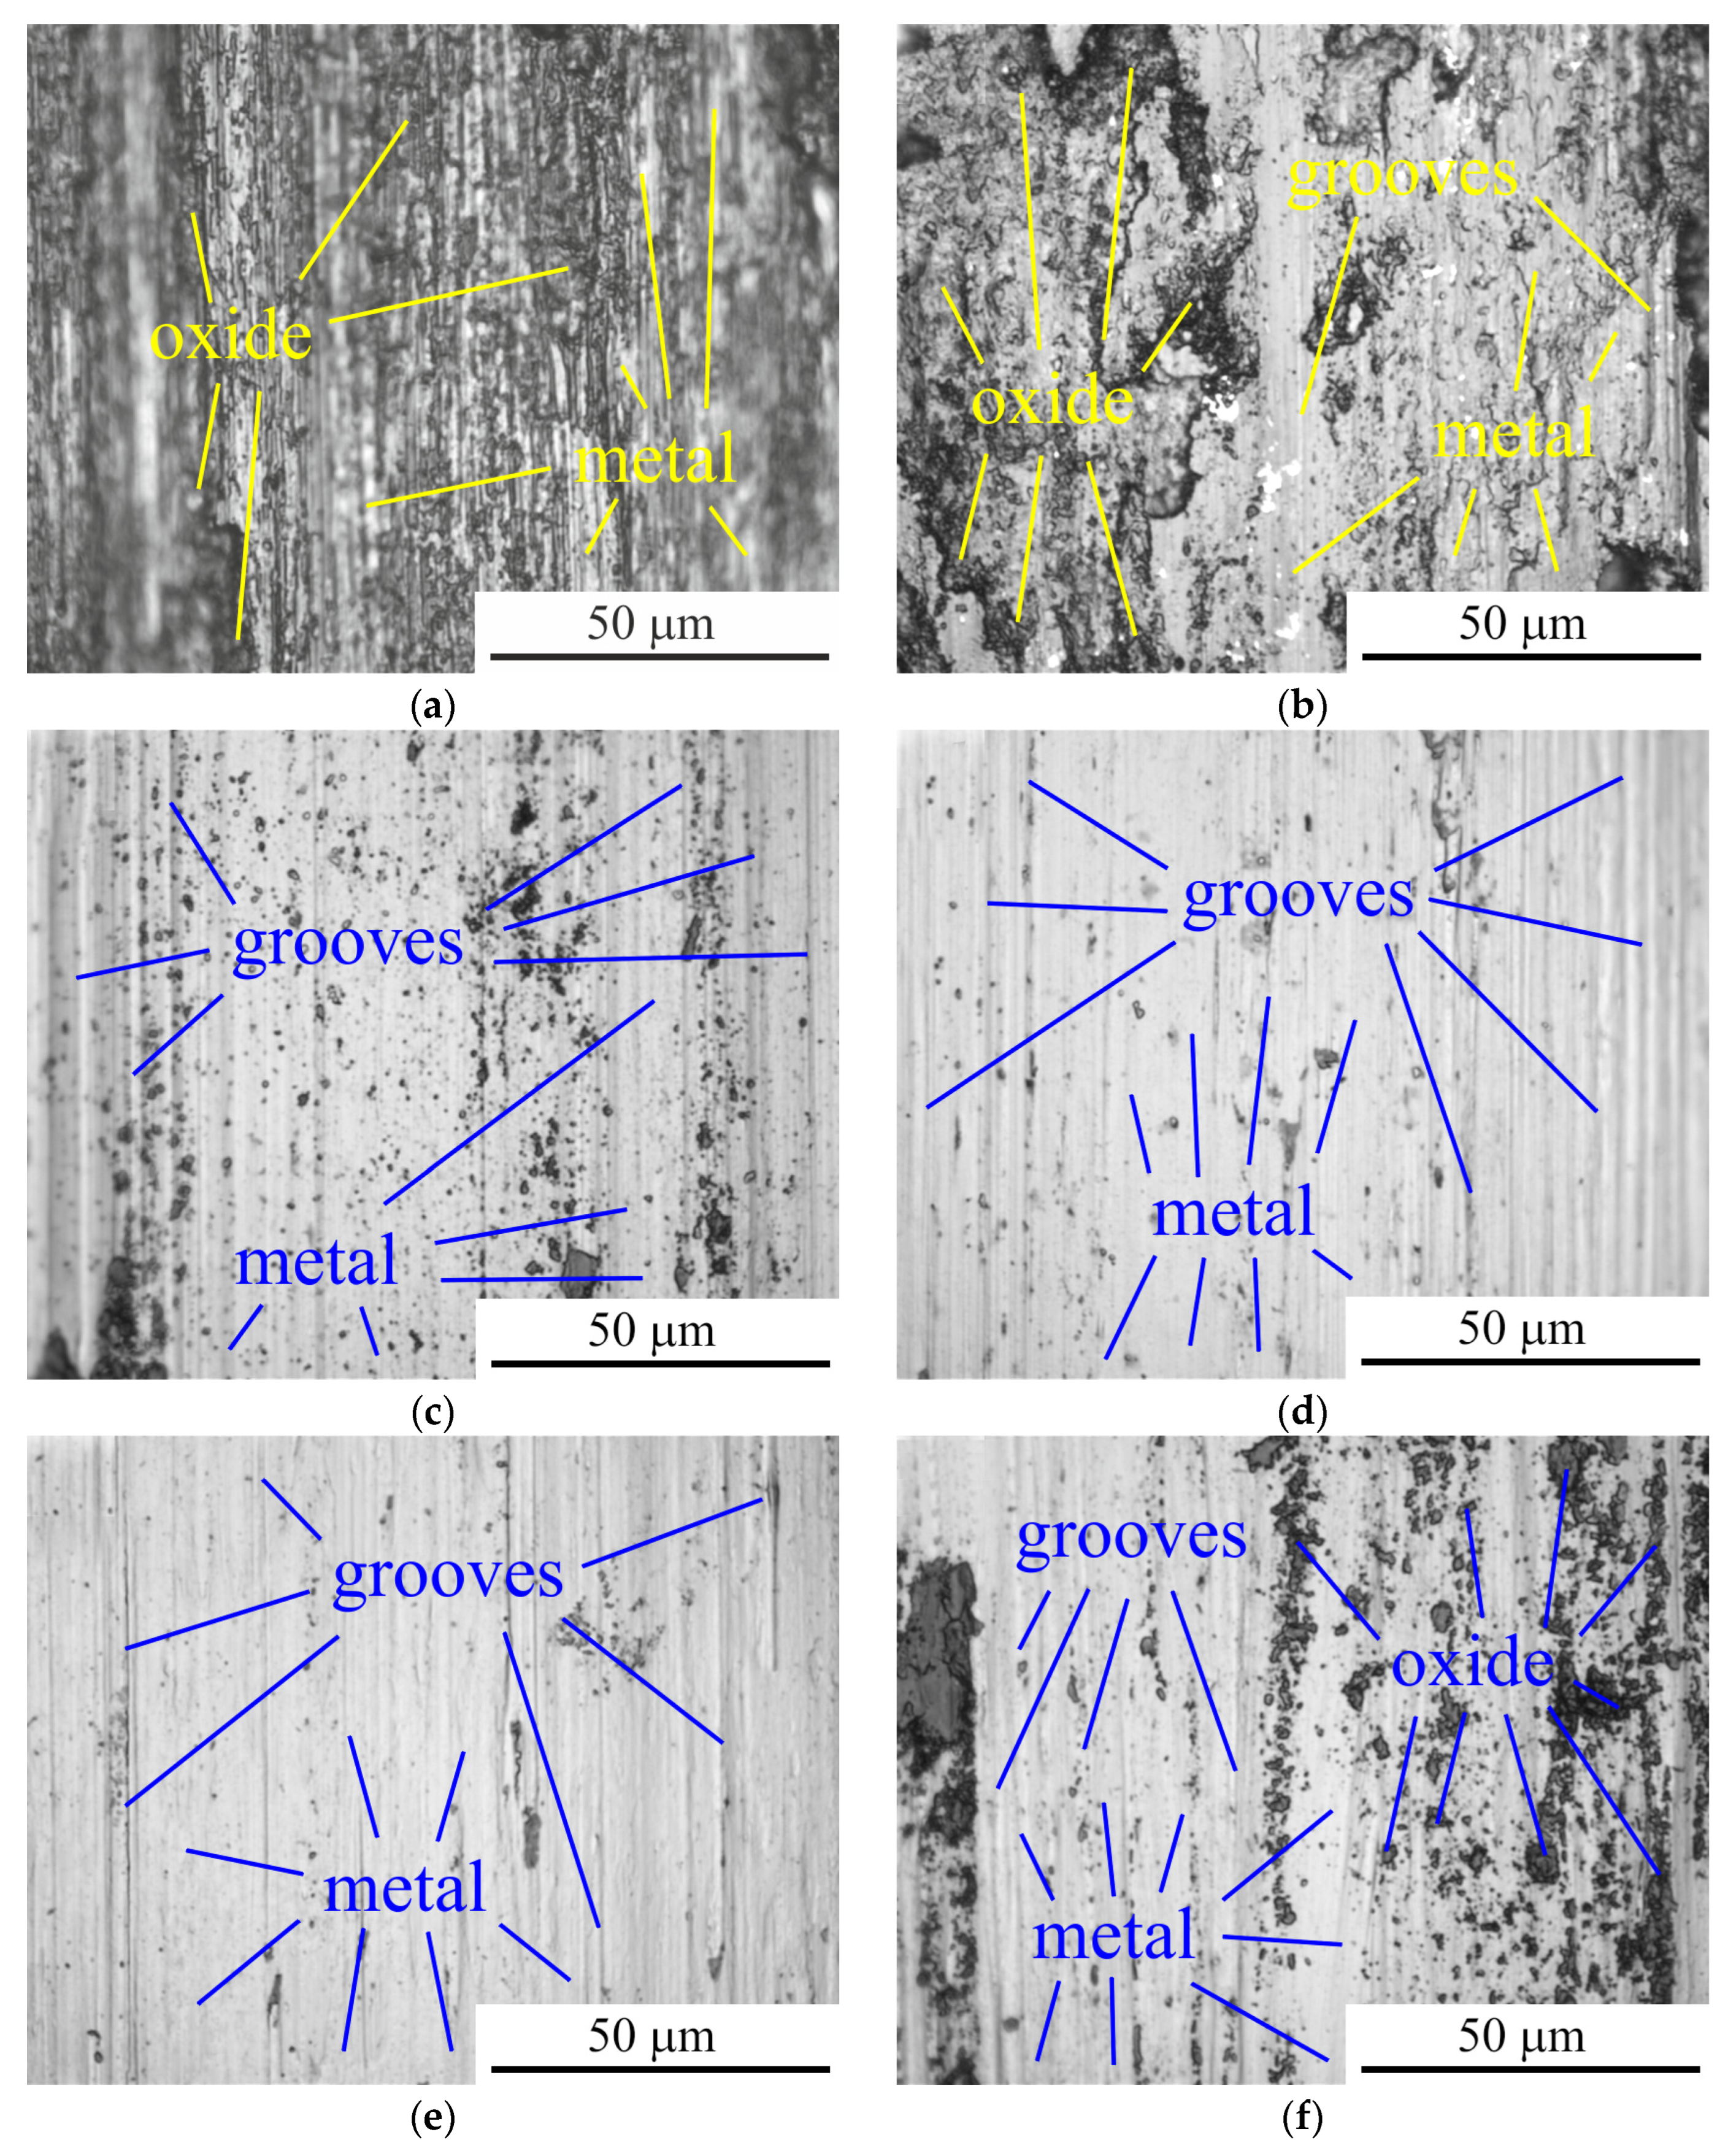
3.5. Surface Morphology and Roughness
3.6. Tribological Properties of Samples
4. Conclusions
- 1.
- The possibility of increasing the hardness and wear resistance of the surface of 90CrSi tool steel by PEN followed by PEP has been demonstrated. The influence of electrophysical parameters of treatment on the composition, structure, morphology, and tribological properties of the steel surface was studied.
- 2.
- Structural changes in the surface of 90CrSi steel after PEN were revealed. Regardless of the polarity of the workpiece, an oxide layer with different phase composition and morphology is formed on the surface as a result of high-temperature oxidation of steel in electrolyte vapor. The formed oxide layers after APEN have a lower density compared to CPEN, which is explained by the process of anodic dissolution of steel and the formation of vacancies and pores. As a result of anodic dissolution, the surface roughness after APEN is reduced by 2.7 times. Free vacancies and pores in the oxide layer favor nitrogen diffusion: the diffusion coefficient during anodic treatment is 2.50 μm2/s, while after CPEN its value is 0.30 μm2/s. Consequently, after APEN, a nitride layer is formed under the oxide layer, which is not detected after CPEN. In both cases, martensite is formed as a result of quenching, and the microhardness increases to 1110–1120 HV. Due to incomplete martensitic transformation, retained austenite and cementite are identified in the surface layers.
- 3.
- It has been established that as a result of PEP, oxide layers having morphological inhomogeneities in the form of cracks, chips, and various irregularities are partially removed. The preservation of the nitride layer occurs only with PEP in a sulfate electrolyte for 1 min when surface passivation inhibits the electrochemical dissolution of steel. Under other PEP conditions, the nitride layer dissolves, and the roughness increases due to uneven etching. A denser oxide layer after cathodic treatment with PEP is removed more uniformly, which is accompanied by a decrease in roughness by 1.7 times. It was noted that under any PEP conditions after APEN and CPEN, the strengthened layer is preserved.
- 4.
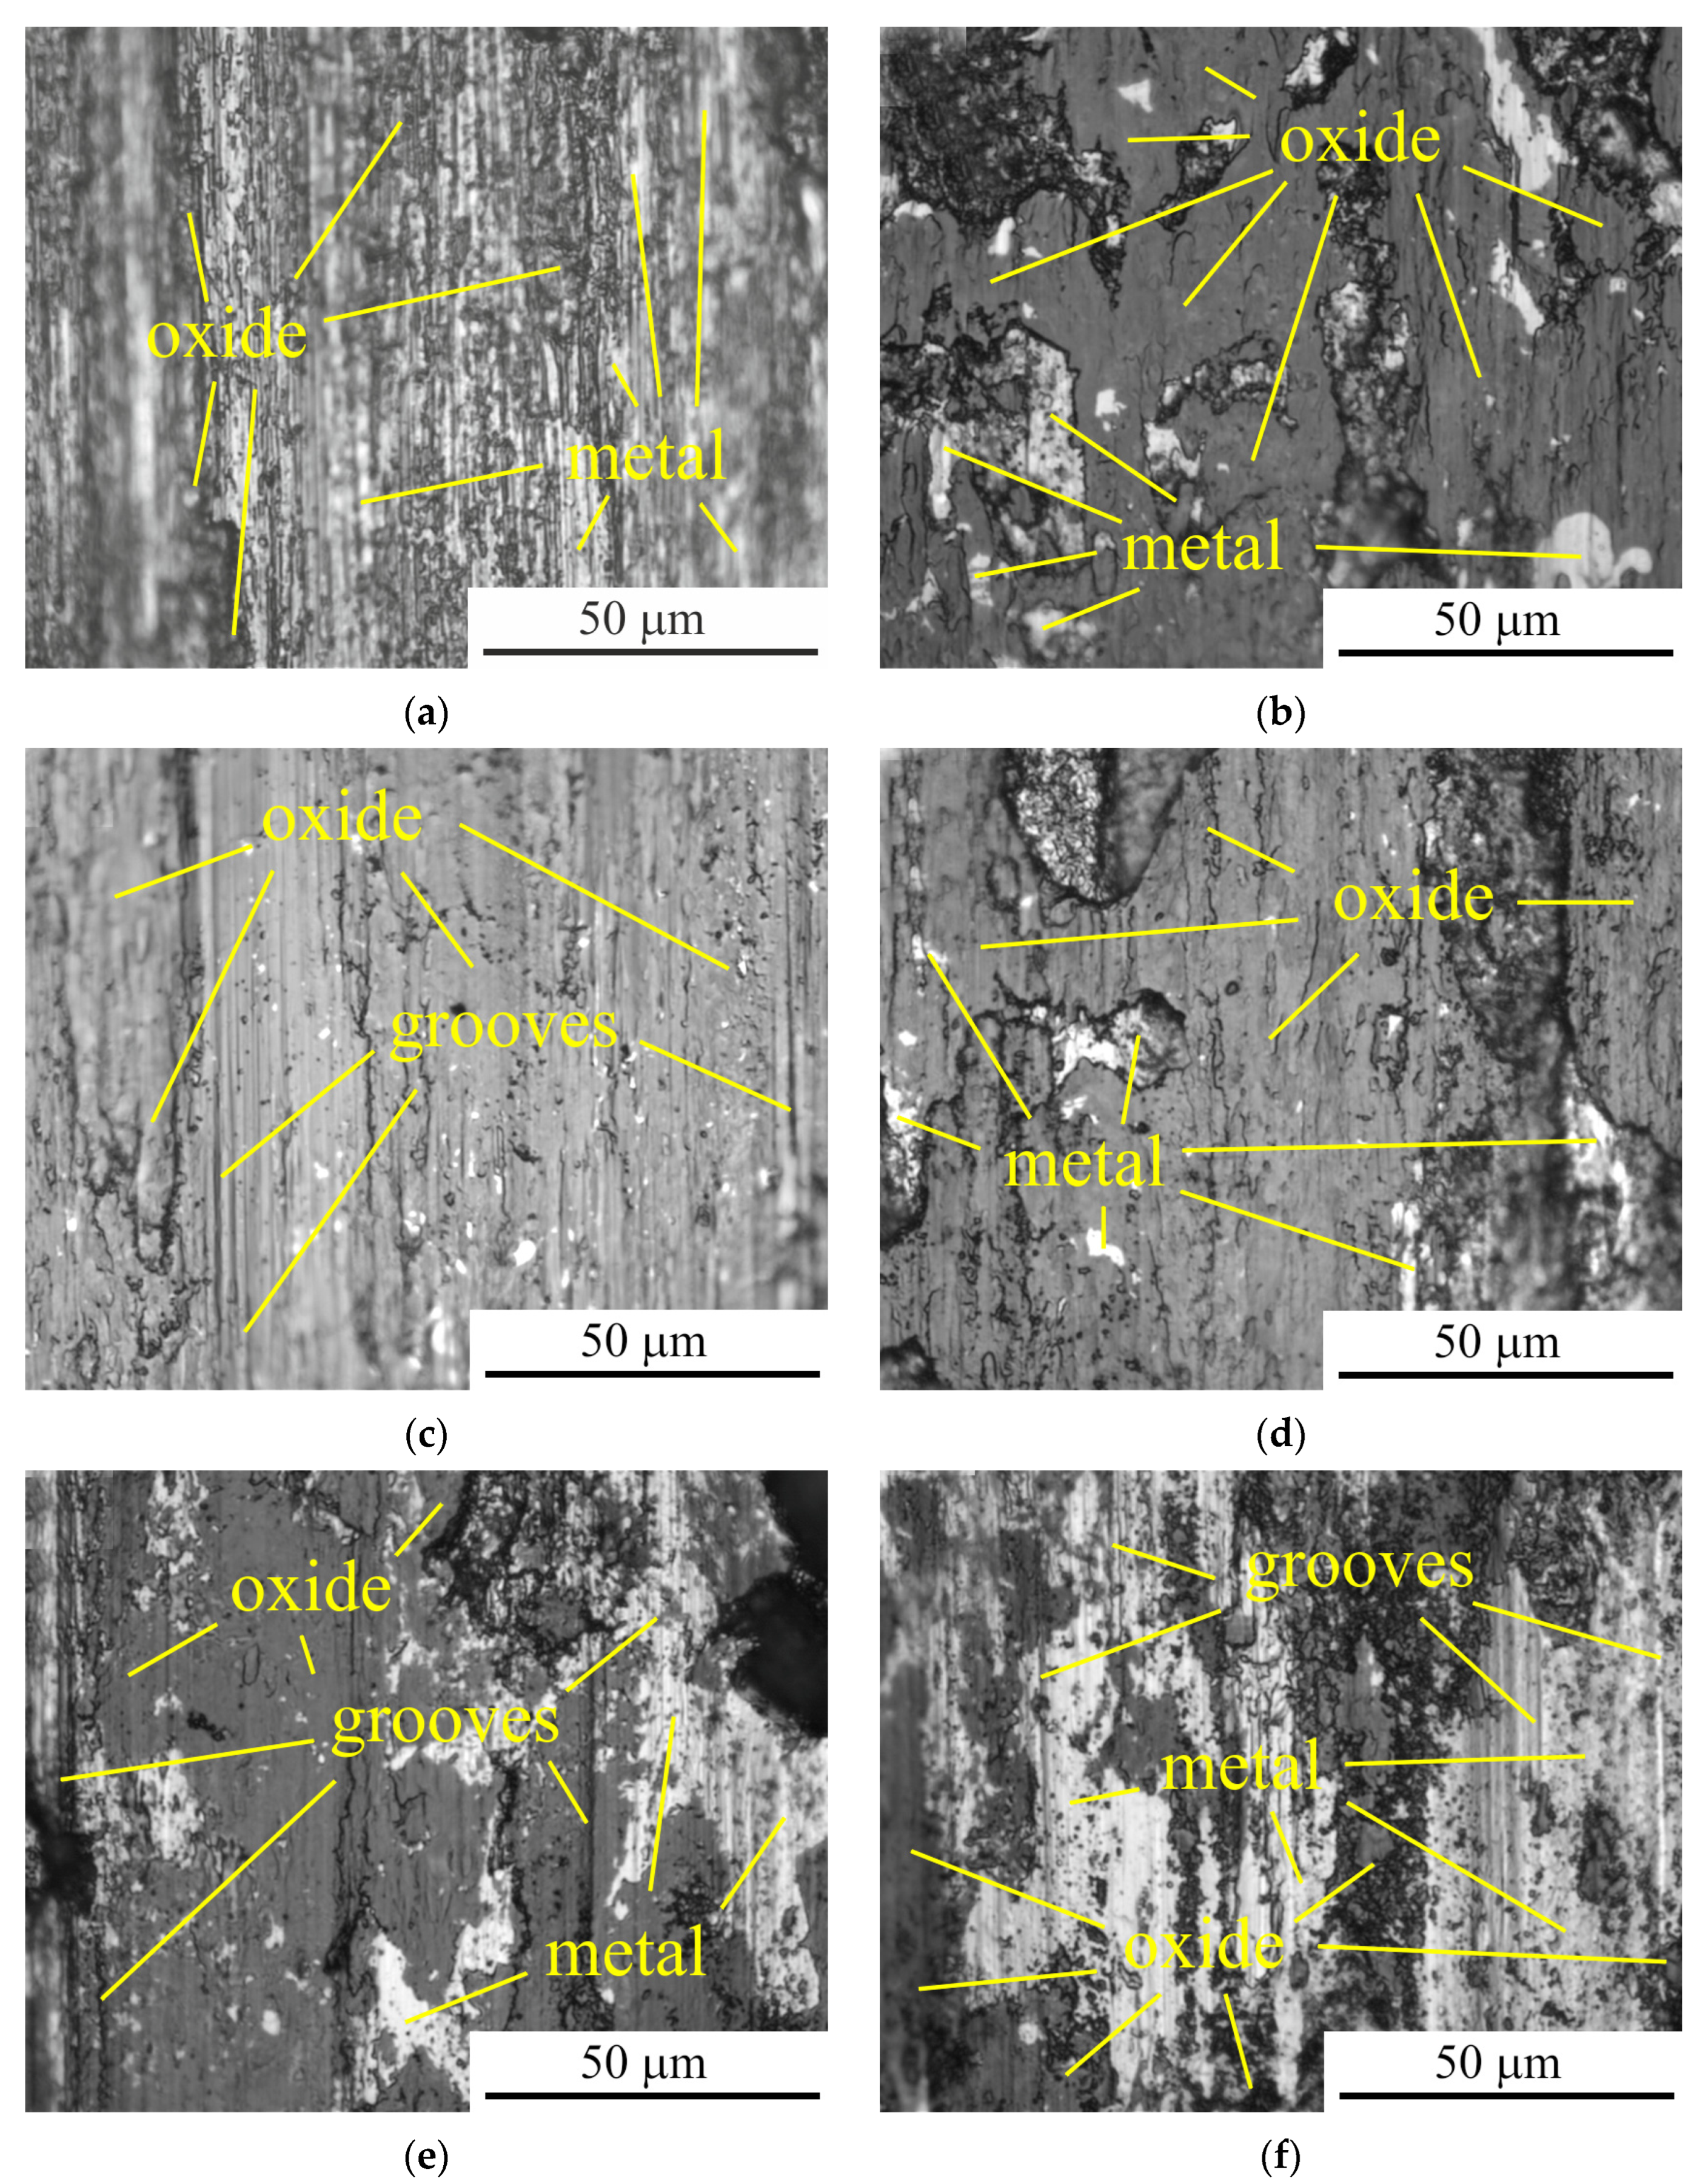
- The features of the tribological behavior of the steel surface after processing at various PET parameters were determined. Wear of the surface of 90CrSi steel after APEN and subsequent PEP is accompanied by the formation of plastically deformed microvolumes of metal, which, upon repeated exposure, lead to the formation of wear particles and separation of the base material. In contrast, after CPEN and subsequent PEP, denser oxide layers take the load and, while slowly deteriorating, act as friction lubricants. This leads to the concentration of strains in a thin surface oxide layer and is reflected in a decrease in the relative penetration of the sample into the surface of the counterbody by 1.7 times after CPEN compared to the untreated sample, while after APEN, this figure decreases by 1.1 times. Similarly, the bearing capacity of a steel surface after CPEN followed by PEP is significantly higher than after APEN followed by PEP: in the first case, the Kragelsky-Kombalov criterion decreases by 1.4–1.5 times, and in the second case, it increases by 1.4–1.6 times compared to an untreated surface. The nature of wear is reflected in an increase in the friction coefficient by 1.3–1.5 times after APEN and subsequent PEP and in a decrease by 1.2 times after CPEN and two times after subsequent PEP. Despite significant differences in wear patterns, all modified samples showed an increase in wear resistance: 5–9 times after APEN followed by PEP, 16 times after CPEN, and up to 32 times after subsequent PEP. In all cases, the disruption of frictional bonds occurs through the plastic displacement of the material, and the wear mechanism is classified as fatigue wear during dry friction and plastic contact.
Author Contributions
Funding
Institutional Review Board Statement
Informed Consent Statement
Data Availability Statement
Acknowledgments
Conflicts of Interest
References
- Ishkinyaev, E.D.; Khriptovich, E.V.; Voronov, V.D.; Petrovskiy, V.N.; Shiganov, I.N.; Shchekin, A.S.; Gavrikov, A.A. Modeling of laser surface modification processes of tool steel to predict the temperature distribution and modification zone. J. Phys. Conf. Ser. 2021, 2036, 012038. [Google Scholar] [CrossRef]
- Zhou, J.Z.; Fu, Y.H.; Xu, H.Y.; Zhang, Y.K.; Yang, J.C. Investigation into the Effects of Laser Surface Hardening on CrWMn Steel. Key Eng. Mater. 2004, 259–260, 502–506. [Google Scholar] [CrossRef]
- Yu, S.; Zhang, G.; Pan, Y.; Dia, J.; Su, B.; Chen, L.; Lin, H.; Luo, R. Laser heat treatment of CrWMn steel. Jinshu Rechuli/Heat Treat. Met. 1986, 10, 20–24. [Google Scholar]
- Nguyen, A.-T.; Le, X.-H.; Nguyen, V.-T.; Phan, D.-P.; Tran, Q.-H.; Nguyen, D.-N.; Nguyen, M.-C.; Vu, N.-P. Optimizing Main Process Parameters When Conducting Powder-Mixed Electrical Discharge Machining of Hardened 90CrSi. Machines 2021, 9, 375. [Google Scholar] [CrossRef]
- Stepankin, I.N.; Pazdniakou, E.P. Effect of Retained Austenite on the Wear Resistance of C80W1 and 90CrSi5 Tool Steels. J. Frict. Wear 2021, 42, 239–245. [Google Scholar] [CrossRef]
- Lashkarara, S.; Fazlali, A.; Ghaseminezhad, K.; Fleck, C.; Salavati, M. Mechanism of plasma electrolytic oxidation in Mg3ZnCa implants: A study of double-layer formation and properties through nanoindentation. Sci. Rep. 2024, 14, 7380. [Google Scholar] [CrossRef] [PubMed]
- Hoseini, A.; Yarmand, B. Photoelectrocatalytic and photocorrosion behavior of MoS2- and rGO-containing TiO2 bilayer photocatalyst immobilized by plasma electrolytic oxidation. J. Alloys Compd. 2024, 984, 173976. [Google Scholar] [CrossRef]
- Yang, D.; Sun, H.; Wang, J.; Ji, G.; Duan, H.; Xiang, Y.; Fan, Y. The formation and stripping mechanism of oxide film on Ti6Al4V alloy surface during electrolytic plasma polishing. Surf. Coat. Technol. 2024, 478, 130469. [Google Scholar] [CrossRef]
- Witzke, K.; Kensbock, R.; Willsch, C.U.; Fricke, K.; Bekeschus, S.; Metelmann, H.-R. Mechanical and Plasma Electrolytic Polishing of Dental Alloys. Materials 2023, 16, 6222. [Google Scholar] [CrossRef]
- An, S.; Hansen, L.; Wolff, T.; Foest, R.; Fröhlich, M.; Quade, A.; Stankov, M.; Kersten, H. Energetic characterization during plasma electrolytic polishing of cemented tungsten carbide. J. Appl. Phys. 2023, 134, 033305. [Google Scholar] [CrossRef]
- Wu, J.; Liu, R.; Xue, W.; Wang, B.; Jin, X.; Du, J. Analyses of quenching process during turn-off of plasma electrolytic carburizing on carbon steel. Appl. Surf. Sci. 2014, 316, 102–107. [Google Scholar] [CrossRef]
- Belkin, P.N.; Kusmanov, S.A.; Zhirov, A.V.; Belkin, V.S.; Parfenyuk, V.I. Anode Plasma Electrolytic Saturation of Titanium Alloys with Nitrogen and Oxygen. J. Mat. Sci. Technol. 2016, 32, 1027–1032. [Google Scholar] [CrossRef]
- Kusmanov, S.A.; Smirnov, A.A.; Silkin, S.A.; Belkin, P.N. Increasing wear and corrosion resistance of low-alloy steel by anode plasma electrolytic nitriding. Surf. Coat. Technol. 2016, 307, 1350. [Google Scholar] [CrossRef]
- Jiang, Y.F.; Bao, Y.F.; Yang, K. Effect of C/N concentration fluctuation on formation of plasma electrolytic carbonitriding coating on Q235. J. Iron Steel Res. Int. 2012, 19, 39–45. [Google Scholar] [CrossRef]
- Shen, D.J.; Wang, Y.L.; Nash, P.; Xing, G.Z. A novel method of surface modification for steel by plasma electrolysis carbonitriding. Mater. Sc. Eng. A 2007, 458, 240–243. [Google Scholar] [CrossRef]
- Rastkar, A.R.; Shokri, B. Surface modification and wear test of carbon steel by plasma electrolytic nitrocarburizing. Surf. Interface Anal. 2012, 44, 342–351. [Google Scholar] [CrossRef]
- Taheri, P.; Dehghanian, C.; Aliofkhazraei, M.; Rouhaghdam, A.S. Nanocrystalline Structure Produced by Complex Surface Treatments: Plasma Electrolytic Nitrocarburizing, Boronitriding, Borocarburizing, and Borocarbonitriding. Plasma Process. Polym. 2007, 4, S721–S727. [Google Scholar] [CrossRef]
- Pohrelyuk, I.M.; Tkachuk, O.V.; Proskurnyak, R.V.; Kuznetsov, O.V.; Gnilitskyi, Y.M. Morphology and Corrosion Properties of Hydroxyapatite Coating on VT6 Titanium Alloy. Mater. Sci. 2023, 58, 781–787. [Google Scholar] [CrossRef]
- Kusmanov, S.A.; Dyakov, I.G.; Belkin, P.N.; Gracheva, I.A.; Belkin, V.S. Plasma electrolytic modification of the VT1-0 titanium alloy surface. J. Surf. Investig. X-ray Synchrotron Neutron Tech. 2015, 9, 98–104. [Google Scholar] [CrossRef]
- Kuroda, P.A.B.; Cardoso, G.C.; Rossi, M.C.; Afonso, C.R.M.; Grandini, C.R. Analyzing PEO anodization time to monitor coatings phases, composition, morphology, thickness, and microhardness during the growth of TiO2 pores on the CP-Ti surface. Mater. Lett. 2024, 363, 136226. [Google Scholar] [CrossRef]
- Valizade, N.; Sabour Rouh Aghdam, A.; Jarjoura, G. Corrosion and biological study on biofunctionalized porous coating on titanium produced by plasma electrolytic oxidation. Colloids Surf. A Physicochem. Eng. Asp. 2024, 688, 133567. [Google Scholar] [CrossRef]
- Bayatanova, L.; Rakhadilov, B.; Kurbanbekov, S.; Skakov, D.; Popova, N. Fine structure of low-carbon steel after electrolytic plasma treatment. Mater. Test. 2021, 63, 842–847. [Google Scholar] [CrossRef]
- Chongyang, N.; Tianlin, Z.; Yue, X.; Lixia, Y.; Guixiang, W. Study on preparation and friction characteristics of steel 1045 modified layer based on plasma electrolytic carbonitriding. Mater. Today Commun. 2022, 33, 104518. [Google Scholar] [CrossRef]
- Kusmanov, S.A.; Tambovskiy, I.V.; Silkin, S.A.; Kusmanova, I.A.; Belkin, P.N. Anode plasma electrolytic borocarburising of alpha + beta-titanium alloy. Surf. Interfaces 2020, 21, 100717. [Google Scholar] [CrossRef]
- Kang, Q.-F.; Yang, W.-M.; Wei, K.-X.; Wang, D.-D.; Liu, X.-L.; Hu, J. Development of a Novel Plasma Aluminum-nitriding Methodology and Its Effect on the Microstructure and Properties for 42CrMo Steel. Surf. Technol. 2023, 52, 394–400. [Google Scholar] [CrossRef]
- Yang, Q.; Fan, X.; Huang, J. Microstructure and properties of plasma electrolytic nitrocarburizing coating on 40Cr steel. Jinshu Rechuli/Heat Treat. Met. 2012, 37, 77–80. [Google Scholar]
- Zhurerova, L.G.; Rakhadilov, B.K.; Popova, N.A.; Kylyshkanov, M.K.; Buranich, V.V.; Pogrebnjak, A.D. Effect of the PEN/C surface layer modification on the microstructure, mechanical and tribological properties of the 30CrMnSiA mild-carbon steel. J. Mater. Res. Technol. 2020, 9, 291–300. [Google Scholar] [CrossRef]
- Yaghmazadeh, M.; Dehghanian, C. Surface Hardening of AISI H13 Steel Using Pulsed Plasma Electrolytic Carburizing (PPEC). Plasma Process. Polym. 2009, 6, S168–S172. [Google Scholar] [CrossRef]
- Alnakhaei, G.A.; Dehghanian, C.; Alavi, S.H. Evaluation of morphological and tribological properties of nanocrystalline nitrocarburised coating produced on AISI H13 carbon steel by pulsed plasma electrolytic saturation (PPES) technique. Trib. Mater. Surf. Interfaces 2011, 5, 82–87. [Google Scholar] [CrossRef]
- Hua, X.-Z.; Zhou, L.; Cui, X.; Zou, A.-H.; Xu, W.-B.; Zhou, X.-L. The Effect of Ammonia Water on the Microstructure and Performance of Plasma Electrolytic Saturation Nitriding Layer of 38CrMoAl Steel. Phys. Proc. 2013, 50, 304–314. [Google Scholar] [CrossRef]
- Fan, X.; Huang, J.; Yang, Q.; Gan, J. Plasma electrolytic carbonitriding of 20CrMnTi steel. Adv. Mater. Res. 2011, 154–155, 1393–1396. [Google Scholar] [CrossRef]
- Skakov, M.; Zhurerova, L.; Scheffler, M. Influence of regimes electrolytic plasma processing on phase structure and hardening of steel 30CrMnSi. Adv. Mater. Res. 2013, 601, 79–83. [Google Scholar] [CrossRef]
- Wu, J.; Xue, W.; Wang, B.; Jin, X.; Du, J.; Li, Y. Characterization of carburized layer on T8 steel fabricated by cathodic plasma electrolysis. Surf. Coat. Technol. 2014, 245, 9–15. [Google Scholar] [CrossRef]
- Wu, J.; Deng, J.; Dong, L.; Hou, D. Direct growth of oxide layer on carbon steel by cathodic plasma electrolysis. Surf. Coat. Technol. 2018, 338, 63–68. [Google Scholar] [CrossRef]
- Kumruoglu, L.C.; Ozel, A. Plasma electrolytic saturation of 316L stainless steel in an aqueous electrolyte containing urea and ammonium nitrate. Mater. Technol. 2013, 47, 307–310. [Google Scholar]
- Yerokhin, A.L.; Leyland, A.; Tsotsos, C.; Wilson, A.D.; Nie, X.; Matthews, A. Duplex surface treatments combining plasma electrolytic nitrocarburising and plasma-immersion ion-assisted deposition. Surf. Coat. Technol. 2001, 142–144, 1129–1136. [Google Scholar] [CrossRef]
- Taheri, P.; Dehghanian, C. A phenomenological model of nanocrystalline coating production using plasma electrolytic saturation (PES) technique. Trans. B Mech. Eng. 2009, 16, 87–91. [Google Scholar]
- Kazerooni, N.A.; Bahrololoom, M.E.; Shariat, M.H.; Mahzoon, F.; Jozaghi, T. Effect of ringer’s solution on wear and friction of stainless steel 316L after plasma electrolytic nitrocarburising at low voltages. J. Mater. Sci. Technol. 2011, 27, 906–912. [Google Scholar] [CrossRef]
- Nie, X.; Tsotsos, C.; Wilson, A.; Yerokhin, A.L.; Leyland, A.; Matthews, A. Characteristics of a plasma electrolytic nitrocarburising treatment for stainless steels. Surf. Coat. Technol. 2001, 139, 135–142. [Google Scholar] [CrossRef]
- Taheri, P.; Dehghanian, C. Wear and corrosion properties of nanocrystalline coatings on stainless steel produced by plasma electrolytic nitrocarburizing. Int. J. Mat. Res. 2008, 99, 92–100. [Google Scholar] [CrossRef]
- Skakov, M.; Yerygina, L.; Scheffler, M. Impact of Electrolytic-Plasma Nitriding on 34CrNi1Mo Steel Surface Layer Properties. Appl. Mech. Mater. 2015, 698, 439–443. [Google Scholar] [CrossRef]
- Belkin, P.; Kusmanov, S.; Naumov, A.; Parkaeva, Y. Anodic Plasma Electrolytic Nitrocarburizing of Low-Carbon Steel. Adv. Mater. Res. 2013, 704, 31–36. [Google Scholar] [CrossRef]
- Apelfeld, A.; Borisov, A.; Dyakov, I.; Grigoriev, S.; Krit, B.; Kusmanov, S.; Silkin, S.; Suminov, I.; Tambovskiy, I. Enhancement of Medium-Carbon Steel Corrosion and Wear Resistance by Plasma Electrolytic Nitriding and Polishing. Metals 2021, 11, 1599. [Google Scholar] [CrossRef]
- Shelekhov, E.V.; Sviridova, T.A. Programs for X-ray analysis of polycrystals. Metal Sci. Heat Treat. 2000, 42, 309–313. [Google Scholar] [CrossRef]
- Grazulis, S.; Chateigner, D.; Downs, R.T.; Yokochi, A.T.; Le Bail, A. Crystallography open database—An open-access collection of crystal structures. J. Appl. Crystallogr. 2009, 42, 726–729. [Google Scholar] [CrossRef] [PubMed]
- National Standard of the Russian Federation. Geometrical Product Specifications (GPS). Moscow, Standartinform. 2015. Available online: http://docs.cntd.ru/document/1200116337 (accessed on 10 July 2024).
- Kragelsky, I.V.; Mihin, N.M. Friction Units of Machines: Reference; Engineering Manufacture: Moscow, Russia, 1984. [Google Scholar]
- Kragelsky, I.V.; Dobychin, M.N.; Kombalov, V.S. Friction and Wear Calculation Methods; Pergamon Press: Oxford, UK, 1982; p. 62. Available online: https://books.google.ru/books?id=QLcgBQAAQBAJ&hl=ru0 (accessed on 10 July 2024).


| Element | C | Cr | Si | Mn | Ni | S | P | Mo | W | V | Ti | Cu | Fe |
|---|---|---|---|---|---|---|---|---|---|---|---|---|---|
| wt.% | 0.85–0.95 | 0.95–1.25 | 1.2–1.6 | 0.3–0.6 | ≤0.4 | ≤0.03 | ≤0.03 | ≤0.2 | ≤0.2 | ≤0.15 | ≤0.03 | ≤0.3 | balance |
| APEN | CPEN |
|---|---|
| 2.50 μm2/s | 0.30 μm2/s |
| Electrolyte for PEP | PEP Time (min) | Δm (mg) | Ra (μm) | Rz (μm) | μ | Tfr (°C) | Δmfr (mg) | h/r | Δ |
|---|---|---|---|---|---|---|---|---|---|
| Untreated | 1.00 ± 0.10 | 7.22 ± 0.51 | 0.361 | 51 | 28.40 | 0.080 ± 0.002 | 0.30 ± 0.01 | ||
| APEN | 32.5 | 0.37 ± 0.07 | 2.12 ± 0.43 | 0.464 | 102 | 3.16 | 0.071 ± 0.001 | 0.42 ± 0.01 | |
| NH4Cl + C3H8O3 | 1 | 25.8 | 3.19 ± 0.56 | 20.20 ± 3.03 | 0.532 | 111 | 5.29 | 0.072 ± 0.001 | 0.44 ± 0.01 |
| 2 | 67.4 | 3.84 ± 0.98 | 24.21 ± 4.91 | 0.506 | 104 | 5.07 | 0.078 ± 0.002 | 0.47 ± 0.01 | |
| (NH4)2SO4 | 1 | 18.9 | 0.38 ± 0.05 | 1.96 ± 0.13 | 0.511 | 125 | 5.02 | 0.072 ± 0.001 | 0.48 ± 0.01 |
| 2 | 34.4 | 0.54 ± 0.24 | 5.42 ± 3.15 | 0.426 | 106 | 3.11 | 0.075 ± 0.002 | 0.45 ± 0.01 | |
| Electrolyte for PEP | PEP Time (min) | Δm (mg) | Ra (μm) | Rz (μm) | μ | Tfr (°C) | Δmfr (mg) | h/r | Δ |
|---|---|---|---|---|---|---|---|---|---|
| Untreated | 1.00 ± 0.10 | 7.22 ± 0.51 | 0.361 | 51 | 28.4 | 0.080 ± 0.002 | 0.30 ± 0.01 | ||
| CPEN | 101 | 1.16 ± 0.11 | 6.94 ± 0.57 | 0.300 | 99 | 1.8 | 0.048 ± 0.001 | 0.21 ± 0.04 | |
| NH4Cl + C3H8O3 | 1 | 54.1 | 1.13 ± 0.25 | 6.92 ± 0.91 | 0.309 | 92 | 1.6 | 0.048 ± 0.001 | 0.21 ± 0.04 |
| 2 | 82.1 | 0.68 ± 0.07 | 3.45 ± 0.26 | 0.263 | 79 | 1.8 | 0.046 ± 0.001 | 0.22 ± 0.04 | |
| (NH4)2SO4 | 1 | 47.6 | 1.67 ± 0.32 | 9.80 ± 1.78 | 0.169 | 130 | 0.9 | 0.041 ± 0.001 | 0.20 ± 0.04 |
| 2 | 93.1 | 0.68 ± 0.16 | 3.56 ± 0.74 | 0.244 | 78 | 1.4 | 0.045 ± 0.001 | 0.22 ± 0.04 | |
Disclaimer/Publisher’s Note: The statements, opinions and data contained in all publications are solely those of the individual author(s) and contributor(s) and not of MDPI and/or the editor(s). MDPI and/or the editor(s) disclaim responsibility for any injury to people or property resulting from any ideas, methods, instructions or products referred to in the content. |
© 2024 by the authors. Licensee MDPI, Basel, Switzerland. This article is an open access article distributed under the terms and conditions of the Creative Commons Attribution (CC BY) license (https://creativecommons.org/licenses/by/4.0/).
Share and Cite
Grigoriev, S.N.; Tambovskiy, I.V.; Mukhacheva, T.L.; Kusmanova, I.A.; Podrabinnik, P.A.; Khmelevsky, N.O.; Suminov, I.V.; Kusmanov, S.A. Features of Increasing the Wear Resistance of 90CrSi Tool Steel Surface under Various Electrophysical Parameters of Plasma Electrolytic Treatment. Metals 2024, 14, 994. https://doi.org/10.3390/met14090994
Grigoriev SN, Tambovskiy IV, Mukhacheva TL, Kusmanova IA, Podrabinnik PA, Khmelevsky NO, Suminov IV, Kusmanov SA. Features of Increasing the Wear Resistance of 90CrSi Tool Steel Surface under Various Electrophysical Parameters of Plasma Electrolytic Treatment. Metals. 2024; 14(9):994. https://doi.org/10.3390/met14090994
Chicago/Turabian StyleGrigoriev, Sergey N., Ivan V. Tambovskiy, Tatiana L. Mukhacheva, Irina A. Kusmanova, Pavel A. Podrabinnik, Nikolay O. Khmelevsky, Igor V. Suminov, and Sergei A. Kusmanov. 2024. "Features of Increasing the Wear Resistance of 90CrSi Tool Steel Surface under Various Electrophysical Parameters of Plasma Electrolytic Treatment" Metals 14, no. 9: 994. https://doi.org/10.3390/met14090994
APA StyleGrigoriev, S. N., Tambovskiy, I. V., Mukhacheva, T. L., Kusmanova, I. A., Podrabinnik, P. A., Khmelevsky, N. O., Suminov, I. V., & Kusmanov, S. A. (2024). Features of Increasing the Wear Resistance of 90CrSi Tool Steel Surface under Various Electrophysical Parameters of Plasma Electrolytic Treatment. Metals, 14(9), 994. https://doi.org/10.3390/met14090994