Abstract
The objective of this study is to clarify the effect of spherical cementite (θ) precipitation on the occurrence of delayed fracture in 1.5 GPa grade tempered martensitic steels. Constant load tests were performed with a cathodically charged specimen. A 1GPa-load was applied to the specimen, and cathodic charging was performed in 3% NaCl + 3 g/L NH4SCN solution. The specimen of steel without spherical θ did not fracture at the current density of 5 A·m−2 or even by increasing to 50 A·m−2. On the other hand, the specimen of steel with spherical θ fractured after 0.2 h at 5 A·m−2. The strain around the spherical θ after 30%-rolling observed by transmission electron backscatter diffraction showed that the local deformation around the spherical θ was larger than that in the whole measurement field by 3.05 × 10¹⁴ m−2 in terms of geometrically necessary dislocation density. In the hydrogen desorption curve by thermal desorption analysis, steel with spherical θ after 30%-rolling showed a larger hydrogen desorption peak around 250 °C than steel without spherical θ. The value of the activation energy of the 250 °C-peak was 109.2 kJ·mol−1. From these results, the 250 °C-peak is inferred to be hydrogen at the disordered interface of θ/tempered martensite. Transmission electron microscopy observation showed cracks and voids on the spherical θ near the delayed fracture surface. These results indicate that the precipitation of spherical θ facilitates the occurrence of delayed fracture. Cracks appear to form around spherical θ.
1. Introduction
In recent years, the strength of steel sheets has been increased in order to reduce the weight of structural members for automobiles and to improve crash safety. The hot stamping process is attracting attention as one of the methods to solve the decrease in formability caused by high strength. However, laser processing is used in the trimming process after hot stamping, and the high cost is an issue. Trimming by punching or shearing instead of laser processing can reduce the cost [1,2], but the shear edge of high-strength steel sheets is highly strained and has tensile residual stress. Therefore, there is a concern about delayed fracture, in which hydrogen in the environment enters the shear surface and causes a crack [3,4]. Factors that cause delayed fracture include hydrogen absorption, high-strength microstructures, and stress. It is important to model the delayed fracture of the shear surface to be able to guide the development of materials that can be applied to cold shear processing.
Various theories have been proposed for the effect of hydrogen on delayed fracture. However, a unified understanding has not yet been reached. One approach to suppressing delayed fracture is to supplement irreversible hydrogen by precipitating fine carbides and to suppress hydrogen at grain boundaries and other microstructures vulnerable to delayed fracture [5,6,7]. However, the shear end faces deform plastically, and the microstructure and hydrogen behavior are expected to change.
Spherical cementite (θ) precipitation is one of the factors that improve the microstructure of the shear end face. Maeda et al. found that the void formation due to θ can be quantitatively evaluated by kernel average misorientation (KAM) [8]. Inoue et al. found that finer θ shows the smaller punching fracture surface roughness [9]. Saito et al. clarified from the results of finite element method (FEM) that the increase in stress triaxiality around θ causes void formation during punching [10]. The authors found that spherical θ precipitation accelerated void formation at the same tensile strength, resulting in early fracture and suppressing the amount of work hardening of the punched surface [11]. From the above, spherical θ reduces the strain on the entire shear end face but causes local deformation around θ.
As a result of the change in the hydrogen storage behavior of θ due to processing, Takai et al. performed cold-drawing of pure iron and eutectoid steel with different θ lengths by changing the surface reduction ratio [12]. In the temperature rise desorption analysis (TDA), in addition to the hydrogen peak at low temperatures measured by TDA, a new peak was observed at high temperatures only for the pearlitic steel and drawn specimens. It is inferred that dislocations deposited at the θ interface increase the disordered interface between θ and ferrite, which become a new hydrogen trap site with a strong bonding force. The activation energies of the low-temperature and high-temperature peaks were reported to be 20~46 kJ·mol−1 and 64~93 kJ·mol−1, respectively. However, it is not yet known whether the local deformation of the tempered martensite phase around θ also forms disordered interfaces in shear processing or whether the disordered interfaces affect the delayed fracture behavior.
From the above, the change in delayed fracture behavior due to local deformation around θ has not yet been clarified in the delayed fracture characteristics of shear end faces. Local deformation around θ is expected to make the microstructure around θ brittle to hydrogen and fracture and to promote delayed fracture. However, in shear, it is difficult to separate the local deformation around θ from the strain and residual stress at the shear edge due to θ. It was thought that the effect of spherical θ could be clarified by comparing the delayed fracture conditions of a steel with spherical θ and a steel with the same strength and without spherical θ at the same strain and stress.
The application of shearing after hot stamping of 1.5 GPa tempered martensitic steel sheets contributes to cost reduction. However, the delayed fracture caused by large strain and tensile residual stress at the sheared edge of the steel sheet remains unresolved. The precipitation of spheroidal θ can improve the sheared edge of the steel sheet. However, spheroidal θ promotes void formation at the edge during fracture, causing early rupture and suppressing work hardening. The impact of spheroidal θ precipitation on delayed fracture is unknown. To simulate the delayed fracture behavior at the cross-section of the steel sheet, the specimens were cold-rolled by 30% and subjected to a constant load test with a tensile stress of 1 GPa. Therefore, this study aims to elucidate the effect of spheroidal θ precipitation on the occurrence of delayed fracture by investigating the conditions under which delayed fracture occurs as well as investigating the microstructure around spheroidal θ and the state of hydrogen.
2. Methods
2.1. Specimen
Tempered martensitic steel sheets were used as specimens, which were supplied from the JFE Steel Corporation (Chiba, Japan). Table 1 shows the major alloying elements of the specimens. In the following, steel sheets without spherical θ precipitation will be referred to as “steel without spherical θ” while steel sheets with spherical θ precipitation will be referred to as “steel with spherical θ”. After vacuum melting, the sheet was hot rolled and cold rolled to a thickness of 2.0 mm. After cold rolling, the steel was held at 800 °C for 600 s in an alumina fluidized bed furnace then immediately water-cooled. After water-cooling, the steel with spherical θ was tempered at 500 °C, and the steel without spherical θ was tempered at 460 °C for 300 s. The microstructures of the supplied steel sheets were observed by scanning electron microscope (SEM) (JSM-6500F, JEOL Ltd., Tokyo, Japan). Steel sheets with and without spherical θ were tested for tensile strength. JIS No. 5 specimens (gage width of 25 mm, gage length of 30 mm) were tested by universal testing machine (AG-X/R, Shimadzu Co., Kyoto, Japan) at a tensile speed of 10 mm/min.

Table 1.
Main alloying elements of specimens (ladle analysis, mass%).
2.2. Evaluation Method of Delayed Fracture Characteristics
The specimens for the constant load test (CLT) were prepared. The supplied steel sheets were cold rolled at a reduction rate of 30% by the Japan Cross Rolling Co. The steel sheets were cold rolled from 2.0 mm to 1.4 mm using Φ60 mm rolls. In the following, this process is referred to as “30%-rolling”. This is to simulate the operation of mechanical trimming. The specimens for the CLT were processed from the steel sheets after 30%-rolling. Figure 1 shows the geometry of the specimens for the CLT. Both sides of the steel sheets were ground (PSG-63DX, Okamoto Machine Tool Works, Ltd., Gunma, Japan) to a thickness of 1 mm. The CLT specimens were prepared from the ground steel sheets by NC milling (GR400, OKK Corporation, Hyogo, Japan).
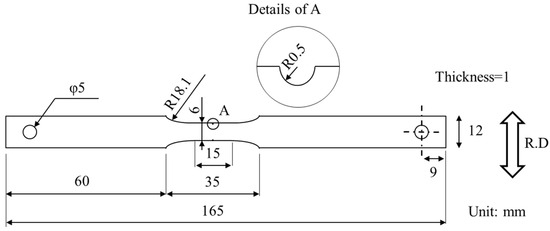
Figure 1.
Geometry of specimen for CLT. (R.D.: rolling direction).
Delayed fracture characteristics were evaluated by CLT conducted by the JFE Techno-Research Corporation (number of tensile times for each current density condition N = 1). Hydrogen was added to the CLT specimen by the cathodic charging method [13,14,15]. Figure 2 shows a schematic diagram of the evaluation method for delayed fracture. First, the specimens were charged with hydrogen for 24 h without applying any stress. In the cathodic charging method, platinum wire was used as the anode, and 3% NaCl + 3 g/L NH4SCN solution was used as the solution. The current density was 5 A·m−2 for 24 h. After 24 h, the samples were subjected to stress, while hydrogen charging was continued in the liquid in the same manner (only the portion labeled in Figure 2 and Figure 3, the middle 165 mm of the specimen, was impregnated with the liquid). The area of the specimens immersed in the solution is approximately 18 cm2. The leverage ratio of the load was 10, and a weight of 500N was loaded by a weight of 50 kg so that the stress was 1 GPa at the notch [16,17]. The time to fracture was measured. The test time was continued either until the sample fractured or for 96 h when the sample did not fracture. In the case of fracture, the next test was performed at reduced current density. If it did not fracture, the next test was performed at increased current density.
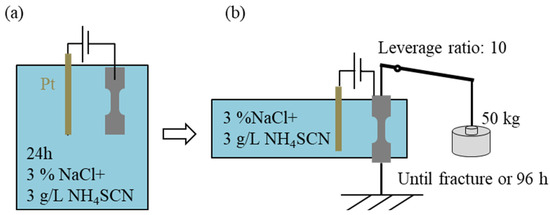
Figure 2.
Schematic diagram of evaluation method of delayed fracture. (a) Hydrogen charged without loading, and (b) hydrogen charged with loading.
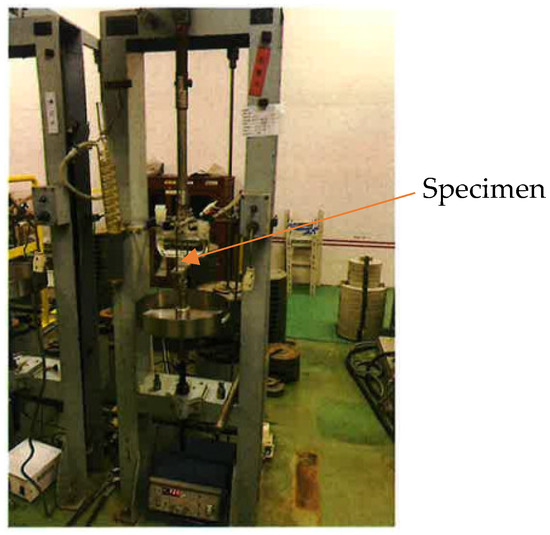
Figure 3.
Simulated experiment of creep failure under CLT conditions.
2.3. Observation of Microstructure around Spherical θ
The microstructure around the spherical θ was observed by scanning electron microscopy (SEM) and electron backscatter diffraction (EBSD). The steel sheets before and after 30%-rolling were cut out so that the R.D.–N.D. surface could be observed. The cut specimens were polished to a mirror finish and etched by 3% nital. The center of the sheets thickness was observed by SEM (JSM-6500F, JEOL).
The crystal orientation of the steel sheets was measured by focused ion beam (FIB) and transmission EBSD by the JFE Techno Research Corporation (Tokyo, Japan). Steel with spherical θ after 30%-rolling was used as the test specimen. Thin films were cut out from the steel sheets by FIB (Versa 3D DualBeam, FEI Company, Hillsboro, OR, USA) so that the R.D.–N.D. plane was observed. For transmission EBSD, an SEM (Supa40 VP, ZEISS, Oberkochen, Germany) and an EBSD Detector(Hikari High Speed EBSD Detector, TSL, Kanagawa, Japan). A 3μm-square area was measured with a step size of 10 nm, using α and θ as analytic phases, and α phases with confidence index values of 0.1 or higher were analyzed by OIM Analysis™ (ver.7.3.1, EDAX, Pleasanton, CA, USA).
2.4. Analysis of Hydrogen in Steel Sheets
The hydrogen in the specimen was measured by temperature desorption analysis (TDA) by the JFE Techno Research Corporation. JTF-20AL (J-Science Lab Co., Ltd., Kyoto, Japan) was used as the TDA. Specimens which were cut after CLT were analyzed from steel sheets before and after 30%-rolling and after CLT. The current density of the hydrogen charge was the maximum current density that did not fracture in the CLT. The hydrogen charge time of the specimens before and after 30%-rolling was 24 h. The dimensions of all specimens were 6 mm wide, 15 mm long, and 1 mm thick. The specimens were heated from −100 °C to 600 °C at a rate of 100 °C/h. Only the steel with spherical θ after 30%-rolling was heated at a rate of 150 °C/h and 200 °C/h in addition to 100 °C/h. The hydrogen desorption rate against temperature was measured for each specimen.
2.5. Observation of Fracture Surface
Fracture surfaces of tensile specimens and CLT specimens of steel with spherical θ were observed by SEM (JSM-6500F, JEOL). The CLT specimen was used at a current density of 5 A·m−2 and was observed around the center of the specimen. The vicinity of the fracture surface was observed using FIB and transmission electron microscopy (TEM) by the JFE Techno Research Corporation. Carbon protective film was prepared on the fracture surface, and the thin film including the fracture surface was cut out by FIB (FB-2100, Hitachi High-Tech, Tokyo, Japan). TEM (HF-2000, Hitachi High-Tech) was used to observe the electron diffraction patterns on the fracture surface and the microstructure around the spherical θ.
3. Results
3.1. Material Properties
Figure 4 shows the microstructures of the tempered martensitic steel sheets. The bright part is θ and dark part is martensite; the diameter of the spherical θ is less than 1 μm. Both steels contain fine θ dispersed in matrix, which precipitated during tempering.
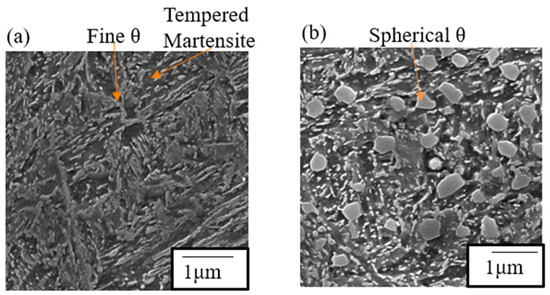
Figure 4.
Microstructure of the tempered martensitic steel for (a) steel without spherical θ and (b) steel with spherical θ.
Figure 5 shows the engineering stress–strain curves by tensile tests for steels with and without spherical θ. The tensile strength, the yield strength, and the fracture strain of steel without spherical θ were 1483 MPa, 1225 MPa, and 0.103, and for steel with spherical θ were 1474 MPa, 1203 MPa, and 0.087, respectively. The tensile strengths are thought to be identical. The elongation was smaller in steel with spherical θ. Young’s Moduli of both steels were approximately 204 GPa.
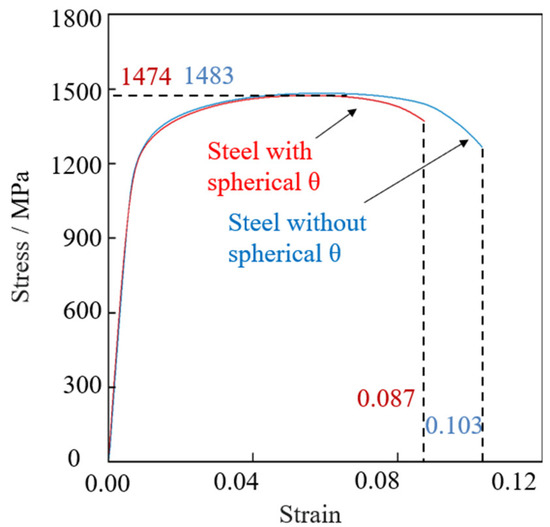
Figure 5.
Engineering stress–strain curves by tensile tests for steels with and without spherical θ.
3.2. Delayed Fracture Conditions
Figure 6 shows the delayed fracture conditions of steel sheets with and without spherical θ in CLT. The specimen of steel without spherical θ did not fracture at 5A·m−2 or even by increasing the current density to 50 A·m−2. On the other hand, the specimen of steel with spherical θ fractured after 0.2 h at 5 A·m−2. With decreasing the current, the fracture time became longer, and there was no fracture occurred after 96 h at 0.6 A·m−2.
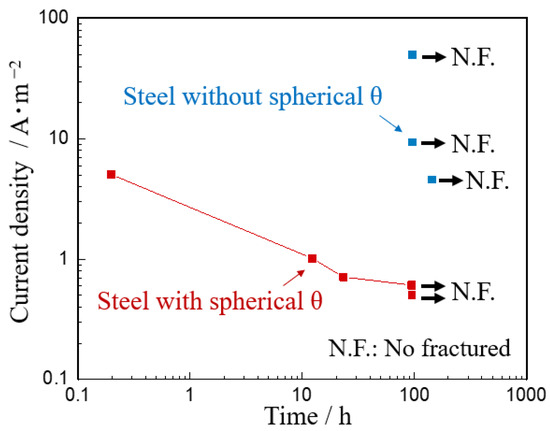
Figure 6.
Delayed fracture time of steels with and without spherical θ.
3.3. Microstructure around Spherical θ
Figure 7 shows the microstructure of tempered martensitic steel after 30%-rolling. The spherical θ was almost undeformed by 30%-rolling. No deformation of the spherical θ itself and no voids around the spherical θ were observed even after rolling.
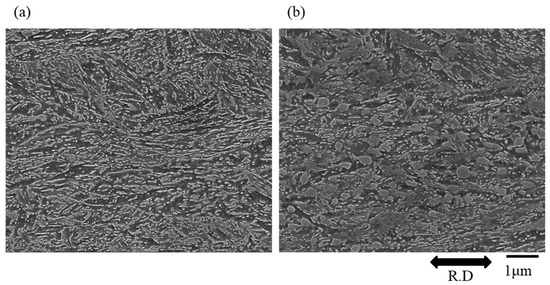
Figure 7.
Microstructure of tempered martensitic steel after 30%-rolling. (a) Steel without spherical θ, and (b) steel with spherical θ. (R.D.: rolling direction).
Based on the obtained crystal orientation data, an inverse pole figure (IPF) map, a phase map, a kernel average misorientation (KAM) map, and a grain reference orientation deviation (GROD) map were created. Figure 8 shows the crystal orientation around spherical θ. The KAM map is a diagram that shows the difference in orientation between neighboring measurement points in a grain. KAM is generally correlated with the amount of strain. The GROD map shows the orientation difference between the measurement point and the average orientation of the entire grain to which the measurement point belongs. GROD is generally correlated with the residual stress [18].
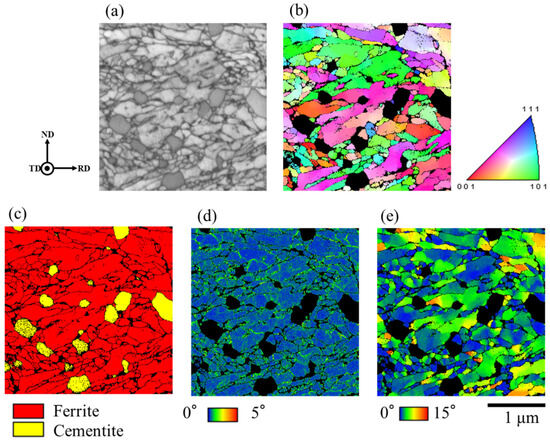
Figure 8.
Crystal orientation around spherical θ of steel with spherical θ after 30%-rolling. (a) Reflected electron image, (b) IPF map, (c) phase map, (d) KAM map, (e) GROD map.
The average grain size of martensitic laths in the EBSD field of view was 0.105 µm. A high GROD value was observed around spherical θ. The average KAM value was 0.56°. The average KAM value around the spherical θ was calculated by trimming about 200 nm around the spherical θ in the entire field of view. The average KAM value around the spherical θ was 0.61°.
3.4. Thermal Desorption Curves
Figure 9 shows hydrogen desorption curves of specimens obtained by TDA. Before 30%-rolling, both steels with and without spherical θ had peaks at a temperature close to 100 °C. This peak is referred to as the 100 °C-peak in the following. The shapes of the 100 °C-peaks in steels with and without spherical θ are thought to be identical. After 30%-rolling, peaks at a temperature close to 250 °C occurred in both steels with and without spherical θ. This peak is referred to as the 250 °C-peak in the following. In steel without spherical θ, the 250 °C-peak was 0.32 ppm, and in steel with spherical θ it was 0.87 ppm. The hydrogen desorption rate of the 250 °C-peak is higher in the steel with spherical θ than in the steel without spherical θ. After the CLT, only the steel with spherical θ had the peak, which was around 400 °C. This peak is referred to as the 400 °C-peak in the following.
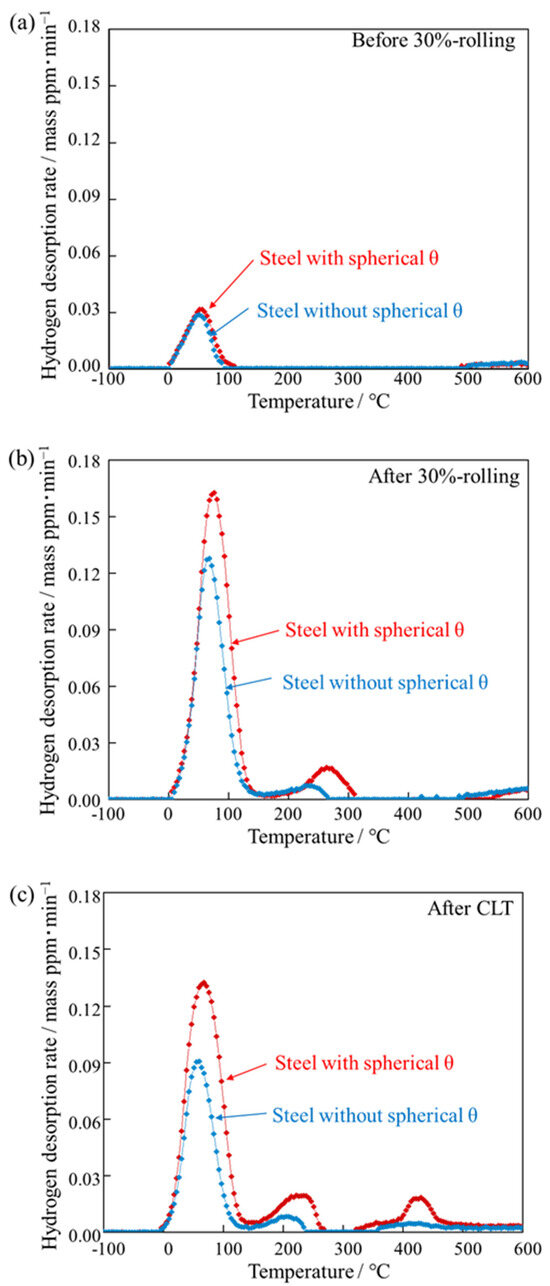
Figure 9.
Hydrogen desorption curves of steels with and without spherical θ obtained by TDA. (a) Before 30%-rolling, (b) after 30%-rolling, (c) after CLT.
Figure 10 shows hydrogen desorption curves of steel with spherical θ after 30%-rolling at different temperature rise rates. As the temperature rate increased, the peaks moved to a higher temperature.
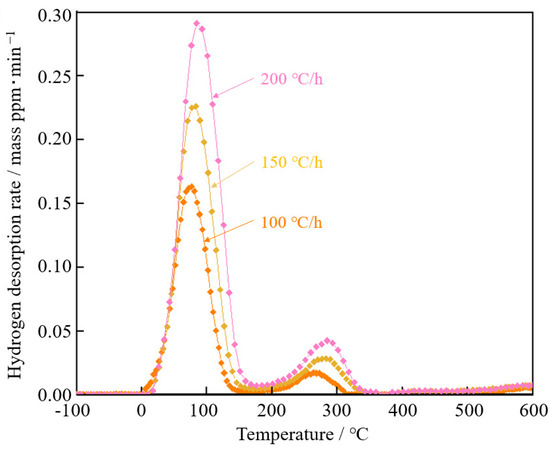
Figure 10.
Hydrogen desorption curves of steel with spherical θ after 30%-rolling at different temperature rise rates.
Various defects in steel, such as dislocations [19], atomic vacancies [20,21], precipitates [22,23], and grain boundaries [24,25] are known to have their own specific hydrogen bonding forces. Therefore, the hydrogen desorption curves from TDA are approximated by the overlap of Gaussian distributions with temperature peaks for each defect, as shown in Equation (1).
Tpi is the peak temperature of the hydrogen desorption rate, ai is the maximum hydrogen release rate of the desorption curve, and bi is the temperature range of the desorption curve.
The activation energy required for desorption from defects can be calculated from the temperature rise rate Φ and the peak temperature Tp, as shown in Equation (2) [26,27].
Eb: activation energy of hydrogen desorption from hydrogen capture sites. : temperature rate. Tp: temperature of peak hydrogen desorption rate. R: gas constant.
The obtained 100 °C-peak and 250 °C-peak were fitted with Gaussian distributions by the least-squares method for each temperature rate, as shown in Figure 11. The peak temperatures of the 100 °C-peak and the 250 °C-peak were obtained. Fitting the peaks was accomplished using a solver function in Excel (Microsoft Excel for Windows ver. 2016). Figure 12 shows the slope of peak temperature and the temperature rate for the calculation of activation energy. The activation energy of the 100 °C-peak and 200 °C-peak were calculated to be 46.7 and 109.2 kJ·mol−1, respectively.
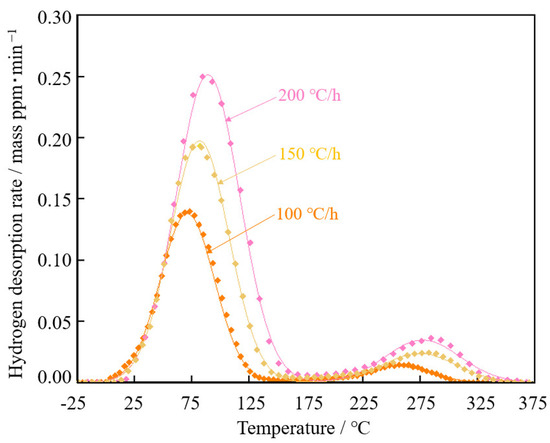
Figure 11.
Fitting curves of Gaussian distributions to the 100 °C-peak and 250 °C-peak of steel with spherical θ after 30%-rolling by the least-squares method for each temperature rate.
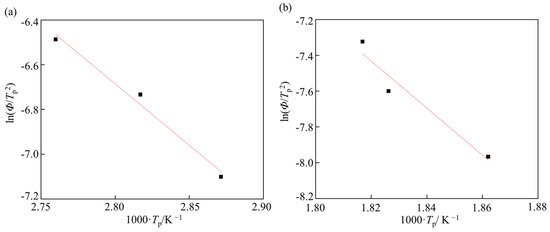
Figure 12.
Slope of peak temperature and temperature rate of steel with spherical θ after 30%-rolling for calculation of activation energy. (a) 100 °C-peak, and (b) 250 °C-peak.
3.5. Fracture Surface of Steel with Spherical θ
In this section, it is discussed how the hydrogen trapping sites around the spherical θ changed due to 30%-rolling by comparing the activation energy and the amount of hydrogen.
Figure 13 shows the fracture surfaces by tensile test, by CLT, and spherical θ on the delayed fracture surface of steel with spherical θ after 30%-rolling. The fracture surface of the tensile test specimen shows mostly dimples, which is a characteristic of ductile fractures in general. The fractured surface of the CLT specimen had a shape like dimples but seemed relatively shallow. In addition to that, spherical shapes with a diameter of about 1 μm and linear streaks with a diameter of 100 nm to 200 nm were observed.
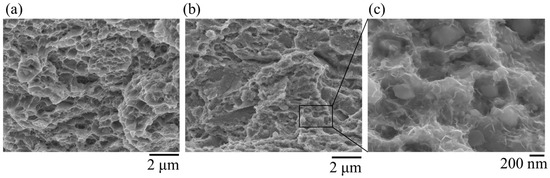
Figure 13.
(a) Fracture surface by tensile test, (b) fracture surface by CLT, (c) spherical θ on the delayed fracture surface.
Figure 14 shows TEM images near the delayed fracture surface of steel with spherical θ. Cracks and voids were generated in the stress direction along the spherical θ interface. The fracture surface parallel to the {011}M crystal plane was observed by electron diffraction pattern (yellow arrow), which was reported as a crack propagation path in a hydrogen-related fracture in lath martensitic steels, and the fracture was characterized as a quasi-cleavage fracture [28]. Figure 13 shows SEM images of fracture surfaces of steel with spherical θ.
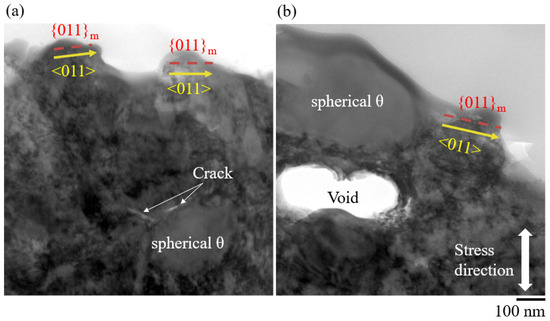
Figure 14.
TEM images near the delayed fracture surface of steel with spherical θ. (a) Cracks along the spherical θ, and (b) voids along the spherical θ.
4. Discussion
4.1. Local Deformation around Spherical θ after 30%-Rolling
SEM observations before (Figure 4) and after 30%-rolling (Figure 7) showed that there was almost no deformation of the spherical θ itself, and the matrix was extended in the rolling direction. EBSD measurements around the spherical θ showed that the KAM value around the spherical θ was 0.05° larger than the entire matrix. The GROD map (Figure 8e), which is proportional to the residual stress, also shows an increase around the spherical θ [24,29]. This suggests that local deformation occurred around the spherical θ. This is thought to be due to local deformation during 30%-rolling and strain caused by volume expansion during the martensitic transformation of austenite.
In the following, it is discussed how much local deformation occurred. The strain around the spherical θ was 0.05° larger than the entire matrix in the KAM value. The KAM value is said to be proportional to the geometrically necessary (GN) dislocation density required for the geometric azimuthal difference in crystal orientation [30].
The GN dislocation density is calculated on the KAM values by Equation (3) [27,31].
: azimuthal difference, b: magnitude of the Burgers vector, d: measurement interval, : constant depending on the dislocation form (a = 1 was used in this research).
The GN dislocation density is calculated to be 3.05 × 10¹⁴ m−2 by substituting the deviation of KAM value by 0.05°, the lattice constant of ferrite as the magnitude of Burgers vector, and the measurement interval of 10 nm into this equation. This suggests that the GN dislocation density increased aerially around the spherical θ after 30%-rolling by about 3.05 × 10¹⁴ m−2.
4.2. Hydrogen State before and after 30%-Rolling
In this section, we describe how the hydrogen absorption around the spherical θ changed by comparing the activation energy and hydrogen content.
The 100 °C-peak appeared regardless of the 30%-rolling, and the activation energy of the 100 °C-peak was 45.7 kJ·mol−1. Lattice defects such as dislocations, θ-interfaces, and various grain boundaries of martensite are considered as trap sites that exist regardless of 30%-rolling. The 100 °C-peak is a hydrogen peak reflecting the lattice defects that exist regardless of 30%-rolling. Table 2 shows the defects and the activation energy required for hydrogen release from defects.
Table 2.
Activation energy required for hydrogen desorption from defects.
In this research, these lattice defects are not compared precisely to the dominant hydrogen trap site. However, the activation energy of the 100 °C-peak was within the range of activation energies of lattice defects (dislocations, θ interfaces, and martensite grain boundaries) that exist regardless of 30%-rolling. Therefore, the 100 °C-peak is hydrogen trapped in lattice defects such as dislocations, θ interfaces, and various martensite grain boundaries. The 100 °C-peaks of both steel sheets before 30%-rolling had almost the same shape, which suggests that the states of hydrogen before 30%-rolling are identical.
In this research, the 250 °C-peak was hydrogen trapped in the disordered interface between θ and tempered martensite. This is because it occurred only after 30%-rolling, and the activation energy was much higher than the lattice defects in the 100 °C-peak.
The value of activation energy in this research was higher than that of the deep-drawn pearlite steel. This is thought to be due to the difference in the matrix and θ shapes [33]. In the case of pearlitic steels, the matrix is ferrite. In this research, the matrix is tempered martensite. Therefore, it is assumed that the dislocation density is relatively high and the unit lattice size has a large variation [33]. The high dislocation density and the large variability of the dislocations make the disordered interface more stable for hydrogen; that is, the activation energy is higher. Also, the shape of θ is thought to make the interface more disordered because the ferrite and θ are parallel in the pearlite steel, while the spherical θ has a curvature.
As described in Section 4.1, the increase in local dislocation density around the spherical θ can be due to the interface being more disordered. In addition, the steel with spherical θ is quenched with precipitated spherical θ during quenching compared to the steel without spherical θ. Therefore, the strain around the spherical θ that forms during the transformation from austenite to martensite is expected to increase the disordered interface. Figure 15 shows a schematic of the hydrogen state in steels with and without spherical θ before and after 30%-rolling. Spherical θ increases the disordered interface between θ and tempered martensite and increases the amount of hydrogen trapped at the disordered interface.
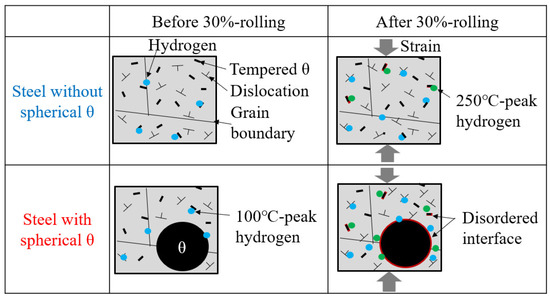
Figure 15.
Schematic of the hydrogen state in steels with and without spherical θ before and after 30%-rolling.
4.3. Promoted Void Generation around Spherical θ by Hydrogen
SEM observation of the steel with spherical θ after 30%-rolling showed that there were almost no voids. However, many voids were generated around the spherical θ near the fracture surface of the CLT specimen. A 400 °C-peak was not formed after 30%-rolling but only in steel with spherical θ after the CLT. The conditions under which the 400 °C-peak was generated were the same as those under which voids were generated. These results suggest that the 400 °C-peak is hydrogen trapped in the voids around the spherical θ.
Since voids were generated by a stress of 1 GPa, which is within the elastic deformation range, it is considered that void formation is easier around the spherical θ. The reason for this is discussed below. Figure 16 shows a schematic diagram of void generation around the spherical θ by hydrogen. The strain and stress around the spherical θ are locally higher than those of the matrix phase. There is hydrogen trapped at the θ-tempered martensite interface and high dislocation density around spherical θ. Therefore, unlike a ductile fracture, hydrogen is generated to fill the vacuum of the voids caused by delamination from spherical θ. This suggests that voids are easily generated around the spherical θ.
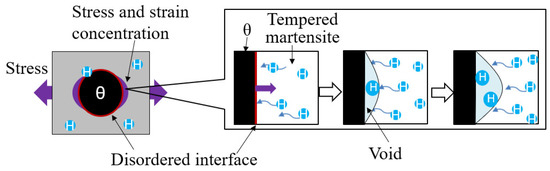
Figure 16.
Schematic diagram of void generation around spherical θ by hydrogen.
4.4. Crack Initiation from Spherical θ
On the fracture surface of steel with spherical θ after CLT, there was a dimple-like shape as shown in the tensile test, a spherical shape less than 1 μm in diameter, and a linear streak of 100 nm~200 nm. The diameter of the spherical θ was found to be less than 1 µm (Figure 4), and the average grain size of the martensitic laths was found to be 105 nm (Figure 8). From the comparison of these dimensions, it is considered that the spherical shape corresponds to spherical θ and the linear streaks correspond to martensite laths. TEM observation showed that voids and cracks were formed around the spherical θ (Figure 14), and quasi-cleavage fracture was observed in the tempered martensite. The roughness of the fracture surface can be attributed to the martensite grain boundaries, such as blocks or packets. The fracture behavior was inferred as shown in Figure 17. In a ductile fracture, as the stress increases, voids form and grow from the spherical θ interface and link together to form a fracture surface with mostly dimpled patterns. In contrast, in delayed fracture, hydrogen induces voids and cracks around the spherical θ at lower stresses. The hydrogen-related quasi-cleavage fracture occurs and propagates on lath boundaries and links together to form a fracture surface with shallow dimple patterns as well as quasi-cleavage patterns.
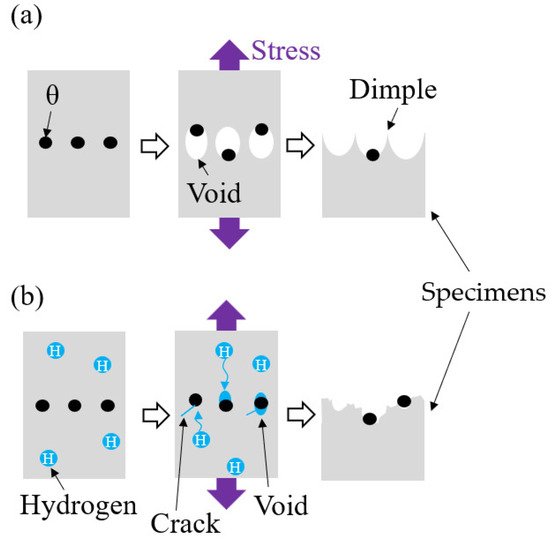
Figure 17.
Schematic diagram of formation fracture surface with spherical θ. (a) Ductile fracture by tensile test, (b) delayed fracture by CLT.
5. Conclusions
In this study, the effect of spherical θ on the occurrence of delayed fracture was investigated. The results showed that steel with spherical θ had the following characteristics compared to steel without spherical θ.
- At 30% strain, 1 GPa stress, and hydrogen charging by the cathodic charging method, the steel sheets fractured at a current density of 0.6 A·m−2 or higher, but the steel sheets without spherical θ did not fracture even at a current density of 50 A·m−2.
- The GN dislocation density around spherical θ increased by 3.05 × 10¹⁴ m−2 after 30%-rolling compared to the entire matrix.
- In the hydrogen desorption curves, the 30%-rolling caused a peak around 250 °C. The amount of hydrogen in the 250 °C-peak was 0.87 mass ppm, while that in the steel without spherical θ was 0.29 mass ppm.
- The value of activation energy required for hydrogen desorption at the 250 °C-peak was 109.2 kJ·mol−1, which was close to the activation energy of 64~93 kJ·mol−1 for the θ/α disordered interface produced by wire drawing in the previous research.
- Voids and cracks were formed around the spherical θ near the fracture surface of the CLT specimen. The fracture surface was parallel to the {011}M crystal plane.
These results indicate that the precipitation of spherical θ facilitates the occurrence of delayed fracture. This is thought to be due to the following mechanisms: Spherical θ causes local deformation of tempered martensite after deformation. Local deformation around a spherical θ enlarges the θ/tempered martensitic disordered interface that occurs after deformation. Local deformation and hydrogen facilitate void formation, resulting in voids and cracks along the spherical θ. A hydrogen-related quasi-cleavage fracture occurs and propagates on lath boundaries and links together to form a fracture surface with shallow dimple patterns as well as quasi-cleavage patterns.
Author Contributions
Conceptualization, K.S., J.I. and S.S.; methodology, J.I. and K.Y.; software, J.I. and S.W.; validation, J.I.; formal analysis, S.K. and S.W.; investigation, J.I., S.W., K.S., S.K., K.Y. and S.S.; resources, K.Y. and S.S.; data curation, S.K. and J.I.; writing—original draft preparation, J.I. and S.W.; writing—review and editing, S.K., K.Y. and S.W.; visualization, J.I. and S.W.; supervision, K.S.; project administration, K.Y. and S.S.; funding acquisition, K.Y. and S.S. All authors have read and agreed to the published version of the manuscript.
Funding
This research was funded by JFE Steel Corporation.
Data Availability Statement
The raw data supporting the conclusions of this article will be made available by the authors on request.
Conflicts of Interest
The authors declare that this study received funding from JFE Steel Corporation. The funder had the following involvement with the study:methodology, investigation, writing—review and editing, funding acquisition.
References
- Kim, J.-Y.; Yoon, S.-C.; Lee, M.-G. Enhanced Hydrogen Delayed Fracture of 1.5 GPa Hot Stamping Steel Sheet with Sheared Surface by Double Punching Method. Int. J. Precis. Eng. Manuf. 2023, 24, 173. [Google Scholar] [CrossRef]
- Hong, M.-P. Hot Stamping Parts Shear Mold Manufacturing via Metal Additive Manufacturing. Appl. Sci. 2022, 12, 1158. [Google Scholar] [CrossRef]
- Chan, S.T.; Varchanis, S.; Haward, S.J.; Shen, A.Q. Perspective on edge fracture. J. Rheol. 2023, 67, 949. [Google Scholar] [CrossRef]
- Basak, S.; Kim, C.; Jeong, W.; Jung, Y.I.; Lee, M.G. Numerical Prediction of Sheared Edge Profiles in Sheet Metal Trimming Using Ductile Fracture Modeling. Int. J. Mech. Sci. 2022, 219, 107109. [Google Scholar] [CrossRef]
- Deng, Y.; Sun, W.; Yang, Y.; Zhan, H.; Yan, K.; Zeng, G. Effects of Mg2Sn Precipitation on the Age-Hardening and Deformation Behaviour of a Mg-Sn-Al-Zn Alloy. Mater. Sci. Eng. A 2023, 867, 144714. [Google Scholar] [CrossRef]
- Kimura, Y.; Moronaga, T.; Inoue, T. Influence of Thermomechanical Treatment on Delayed Fracture Property of Mo-Bearing Medium-Carbon Steel. ISIJ Int. 2022, 62, 377. [Google Scholar] [CrossRef]
- Li, C.; Wei, J.; Jin, J.; Yan, H.; Shan, Z.; Mao, Y.; Chen, R. The Effect of Precipitates on the Fracture Behavior and Tensile Properties of Mg–14Gd–0.5 Zr (wt.%) Alloy. J. Mater. Sci. Technol. 2024, 180, 226. [Google Scholar] [CrossRef]
- Maeda, M.; Shimamura, J.; Suzuki, S. Effect of Cementite Dispersion on Void Formation Process in Spheroidize-Annealed Steels. ISIJ Int. 2018, 58, 1490. [Google Scholar] [CrossRef]
- Saito, K.; Inoue, C.; Ikegawa, J.; Yamazaki, K.; Goto, S.; Takamura, M.; Mihara, S.; Suzuki, S. Effects of Size and Distribution of Spheroidized Cementite on Void Initiation in the Punched Surface of Medium-Carbon Steel. Metall. Mater. Trans. A 2020, 51, 4499. [Google Scholar] [CrossRef]
- Saito, K.; Inoue, C.; Ikegawa, J.; Yamazaki, K.; Goto, S.; Takamura, M.; Mihara, S.; Suzuki, S. Prediction Method of Void Distribution near Punched Surface of Medium-Carbon Steel Sheet using Scrap. ISIJ Int. 2021, 61, 41. [Google Scholar] [CrossRef]
- Ikegawa, J.; Saito, K.; Yamazaki, K.; Suzuki, S. In Proceedings of the 179th ISIJ Meeting, Tokyo, Japan, 17–19 March 2020; p. 18. Available online: https://www.isij.or.jp/english/meeting/data/en-pastmeeting-179.pdf (accessed on 6 April 2024).
- Takai, K.; Watanuki, R. Hydrogen in Trapping States Innocuous to Environmental Degradation of High-Strength Steels. ISIJ Int. 2003, 43, 520. [Google Scholar] [CrossRef]
- Liu, S.; Wu, W.; Fu, H.; Li, J. Equivalence in Evaluating Hydrogen-Assisted Fracture Strength of Slow Strain Rate Tensile and Constant Load Tensile for Three Precipitation-Hardened Martensitic Stainless Steels: Effect of Large-Sized Particles. Corros. Sci. 2023, 215, 111050. [Google Scholar] [CrossRef]
- Zhang, C.; Hui, W.; Zhao, X.; Zhang, Y.; Zhao, X. Hydrogen-Induced Delayed Fracture Behaviour of V+ Nb-Microalloyed High-Strength Bolt Steel with Internal and Environmental Hydrogen. Corros. Sci. 2022, 209, 110710. [Google Scholar] [CrossRef]
- Liu, P.Y.; Zhang, B.; Niu, R.; Lu, S.L.; Huang, C.; Wang, M.; Chen, Y.S. Engineering Metal-Carbide Hydrogen Traps in Steels. Nat. Commun. 2024, 15, 724. [Google Scholar] [CrossRef] [PubMed]
- Senuma, T.; Takemoto, Y.; Hojo, T. Control of Heterogeneous Microstructure for Improving Delayed Fracture Resistance of Ultrahigh Strength Hot Stamping Steel Sheets. Tetsu-to-Hagane 2019, 105, 51. [Google Scholar] [CrossRef]
- Mori, K.I. Review of Shearing Processes of High Strength Steel Sheets. J. Manuf. Mater. Process. 2020, 4, 54. [Google Scholar] [CrossRef]
- Keller, R.R.; Geiss, R.H. Transmission EBSD from 10 nm Domains in a Scanning Electron Microscope. J. Microsc. 2012, 245, 245. [Google Scholar] [CrossRef]
- Oriani, R.A. The Diffusion and Trapping of Hydrogen in Steel. Acta Metall. 1970, 18, 147. [Google Scholar] [CrossRef]
- Myers, S.M.; Picraux, S.T.; Stoltz, R.E. Defect Trapping of Ion-Implanted Deuterium in Fe. J. Appl. Phys. 1979, 50, 5710. [Google Scholar] [CrossRef]
- Myers, S.M.; Follstaedt, D.M.; Besenbacher, F.; Böttiger, J. Trapping and Surface Permeation of Deuterium in He-Implanted Fe. J. Appl. Phys. 1982, 53, 8734. [Google Scholar] [CrossRef]
- Pressouyre, G.M.; Bernstein, I.M. A Quantitative Analysis of Hydrogen Trapping. Metall. Trans. A 1978, 9, 1571. [Google Scholar] [CrossRef]
- Hagi, H. Diffusion Coefficient of Hydrogen in Iron Free from Trapping by Dislocations and Impurities. J. Jpn. Inst. Met. Mater. 1993, 57, 742. [Google Scholar] [CrossRef][Green Version]
- Choo, W.Y.; Lee, J.Y. Thermal Analysis of Trapped Hydrogen in Pure Iron. Metall. Trans. A 1982, 13, 135. [Google Scholar] [CrossRef]
- Okano, H.; Takagi, S. Identification of Hydrogen Trapping Sites in a Strained Ferritic-Martensitic Dual Phase Steel. Tetsu-to-Hagane 2018, 104, 27. [Google Scholar] [CrossRef]
- Kakimoto, R.; Koyama, M.; Tsuzaki, K. EBSD- and ECCI-Based Assessments of Inhomogeneous Plastic Strain Evolution Coupled with Digital Image Correlation. ISIJ Int. 2019, 59, 2334. [Google Scholar] [CrossRef]
- Kobayashi, N.; Koyama, M.; Yamamura, M.; Hojo, T.; Akiyama, E. Cr Effects on the Local Plasticity Evolution and Fracture Behaviors of Ni–Cr Alloys Tensile-Tested under Hydrogen Charging. Mater. Trans. 2023, 64, 212. [Google Scholar] [CrossRef]
- Shibata, A.; Momotani, Y.; Murata, T.; Matsuoka, T.; Tsuboi, M.; Tsuji, N. Microstructural and Crystallographic Features of Hydrogen-Related Fracture in Lath Martensitic Steels. Mater. Sci. Technol. 2017, 33, 1524. [Google Scholar] [CrossRef]
- Kimura, H.; Wang, Y.; Akiniwa, Y.; Tanaka, K. Misorientation Analysis of Plastic Deformation of Austenitic Stainless Steel by EBSD and X-Ray Diffraction Methods. Trans. Jpn. Soc. Mech. Eng. Ser. A 2005, 71, 1722. [Google Scholar] [CrossRef]
- Ashby, M.F. The Deformation of Plastically Non-Homogeneous Materials. Philos. Mag. 1970, 21, 399. [Google Scholar] [CrossRef]
- Gao, H.; Huang, Y.; Nix, W.D.; Hutchinson, J.W. Mechanism-Based Strain Gradient Plasticity—I. Theory. J. Mech. Phys. Solids 1999, 47, 1239. [Google Scholar] [CrossRef]
- Hirth, J.P. Effects of Hydrogen on the Properties of Iron and Steel. Metall. Trans. A 1980, 11, 861. [Google Scholar] [CrossRef]
- Kobayashi, N.; Koyama, M.; Yamamura, M.; Hojo, T.; Akiyama, E. Cr Effects on the Local Plasticity Evolution and Fracture Behaviors of Ni-Cr Alloys Tensile-Tested under Hydrogen Charging. J. Jpn. Inst. Met. Mater. 2022, 86, 77. [Google Scholar] [CrossRef]
Disclaimer/Publisher’s Note: The statements, opinions and data contained in all publications are solely those of the individual author(s) and contributor(s) and not of MDPI and/or the editor(s). MDPI and/or the editor(s) disclaim responsibility for any injury to people or property resulting from any ideas, methods, instructions or products referred to in the content. |
© 2024 by the authors. Licensee MDPI, Basel, Switzerland. This article is an open access article distributed under the terms and conditions of the Creative Commons Attribution (CC BY) license (https://creativecommons.org/licenses/by/4.0/).