
Mechanical Properties of 7075-T6 Aluminum Alloy in Electrically Assisted Forming


Abstract
1. Introduction
2. Experimental Equipment and Materials
2.1. Experimental Materials
2.2. Experimental Equipment
- (1)
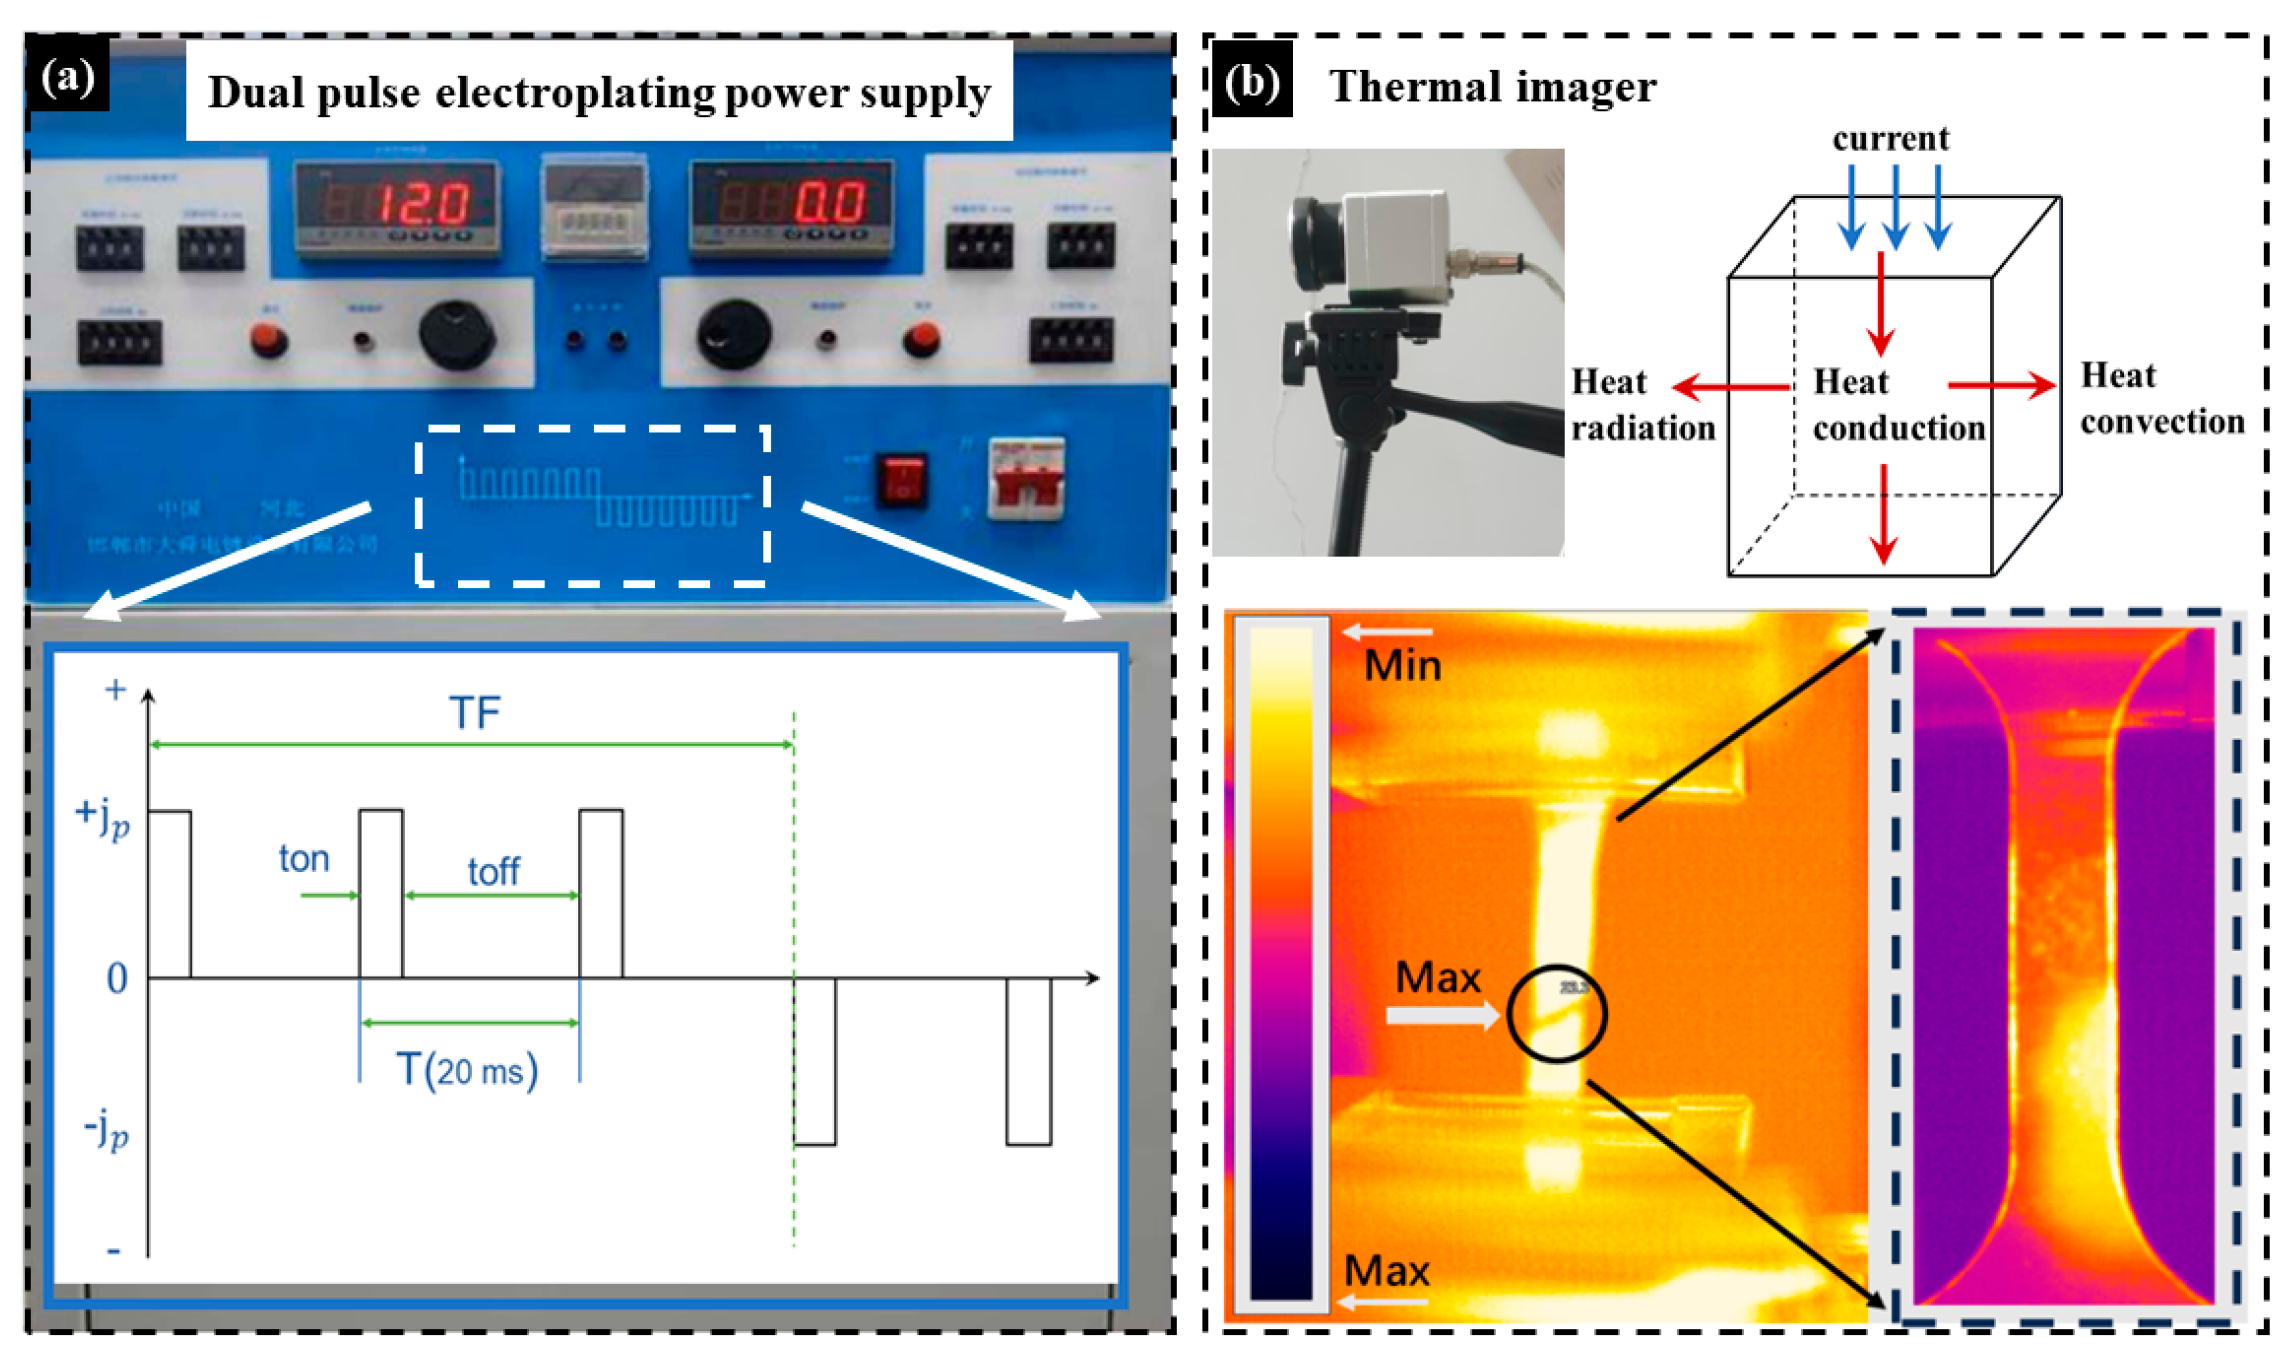
- Pulse power supply and thermal imager
- (2)
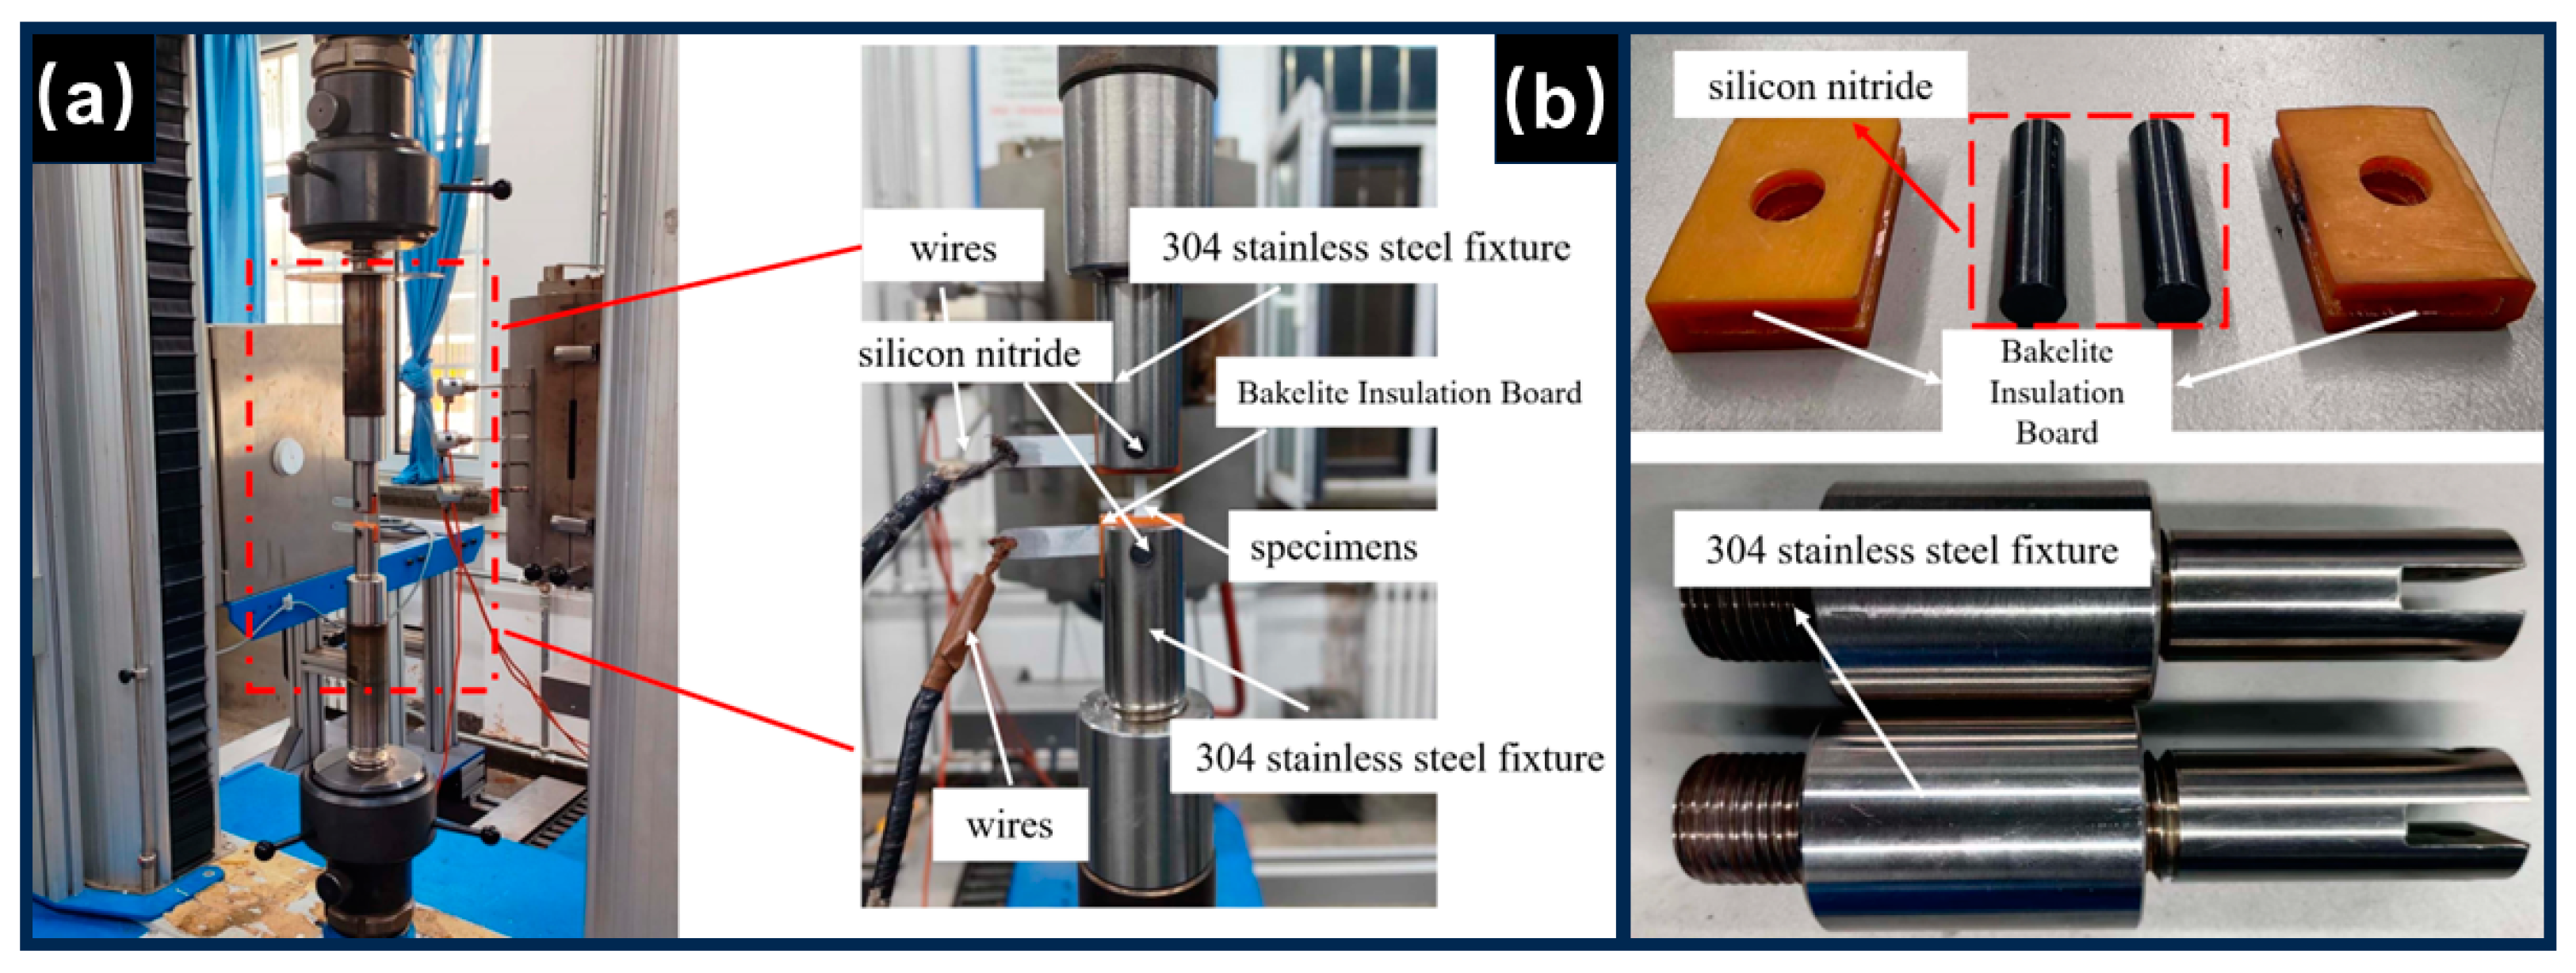
- Electrically assisted tensile platform
2.3. Experimental Principle
2.4. Experimental Arrangement
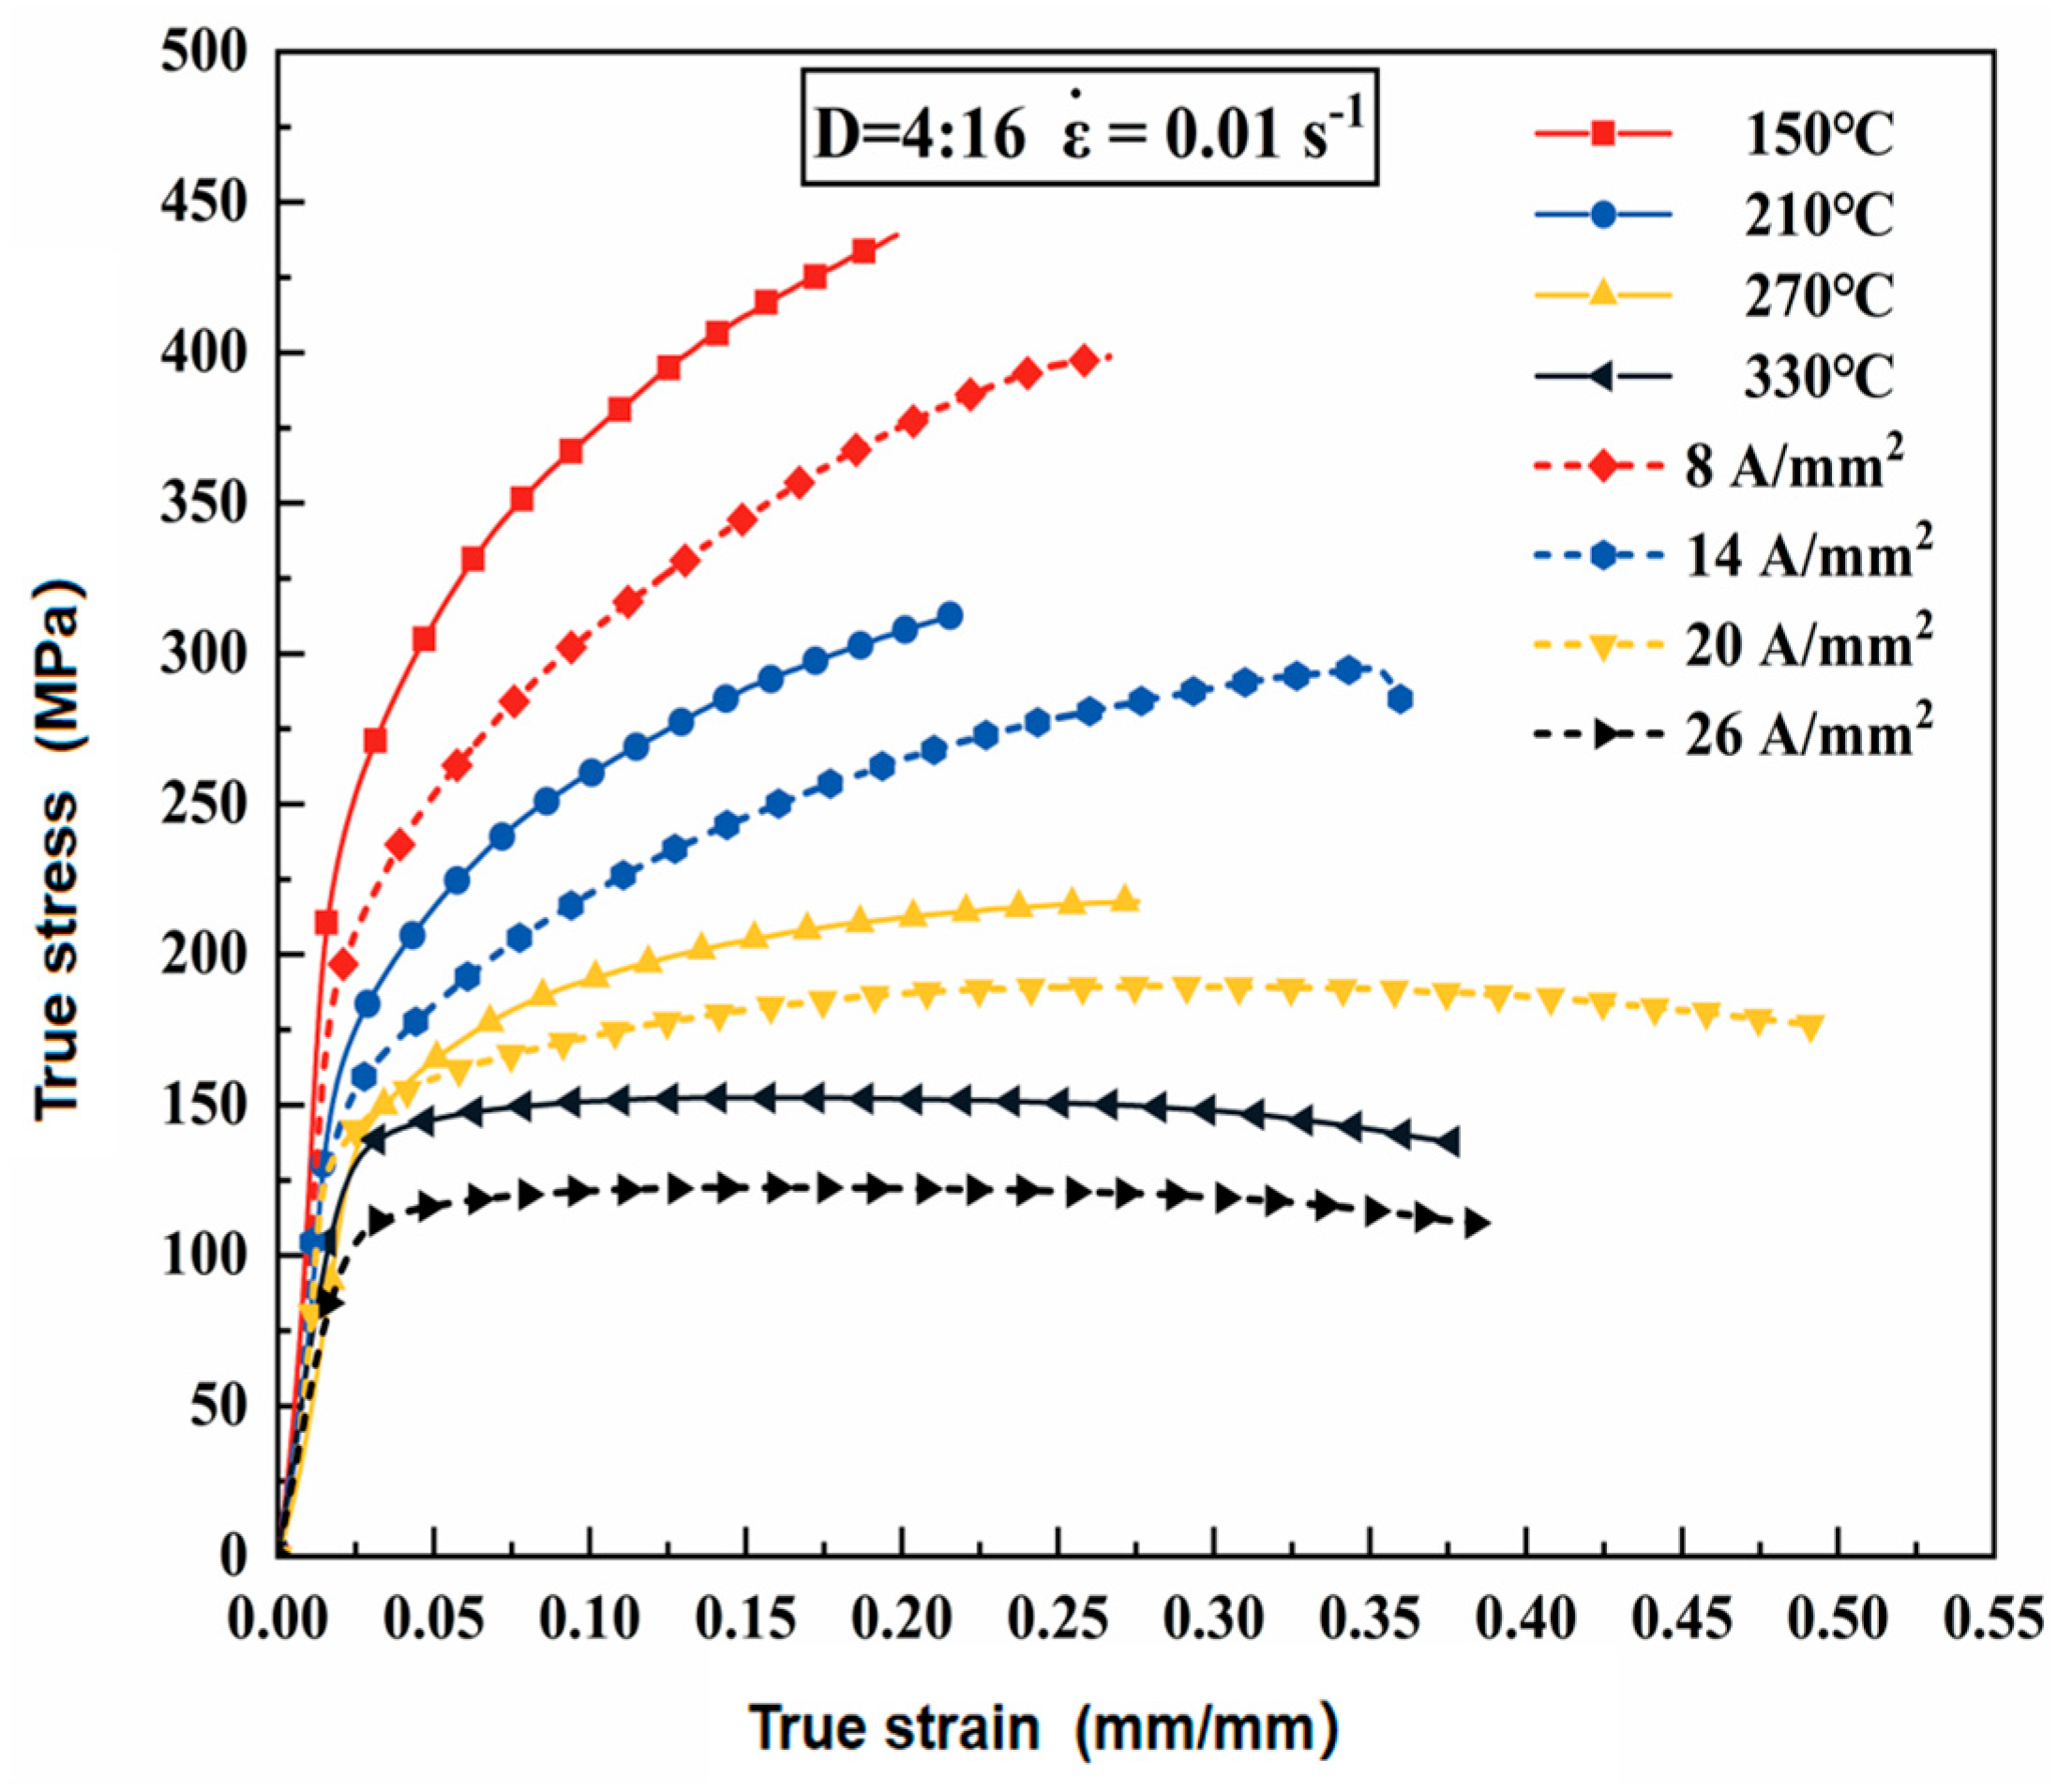
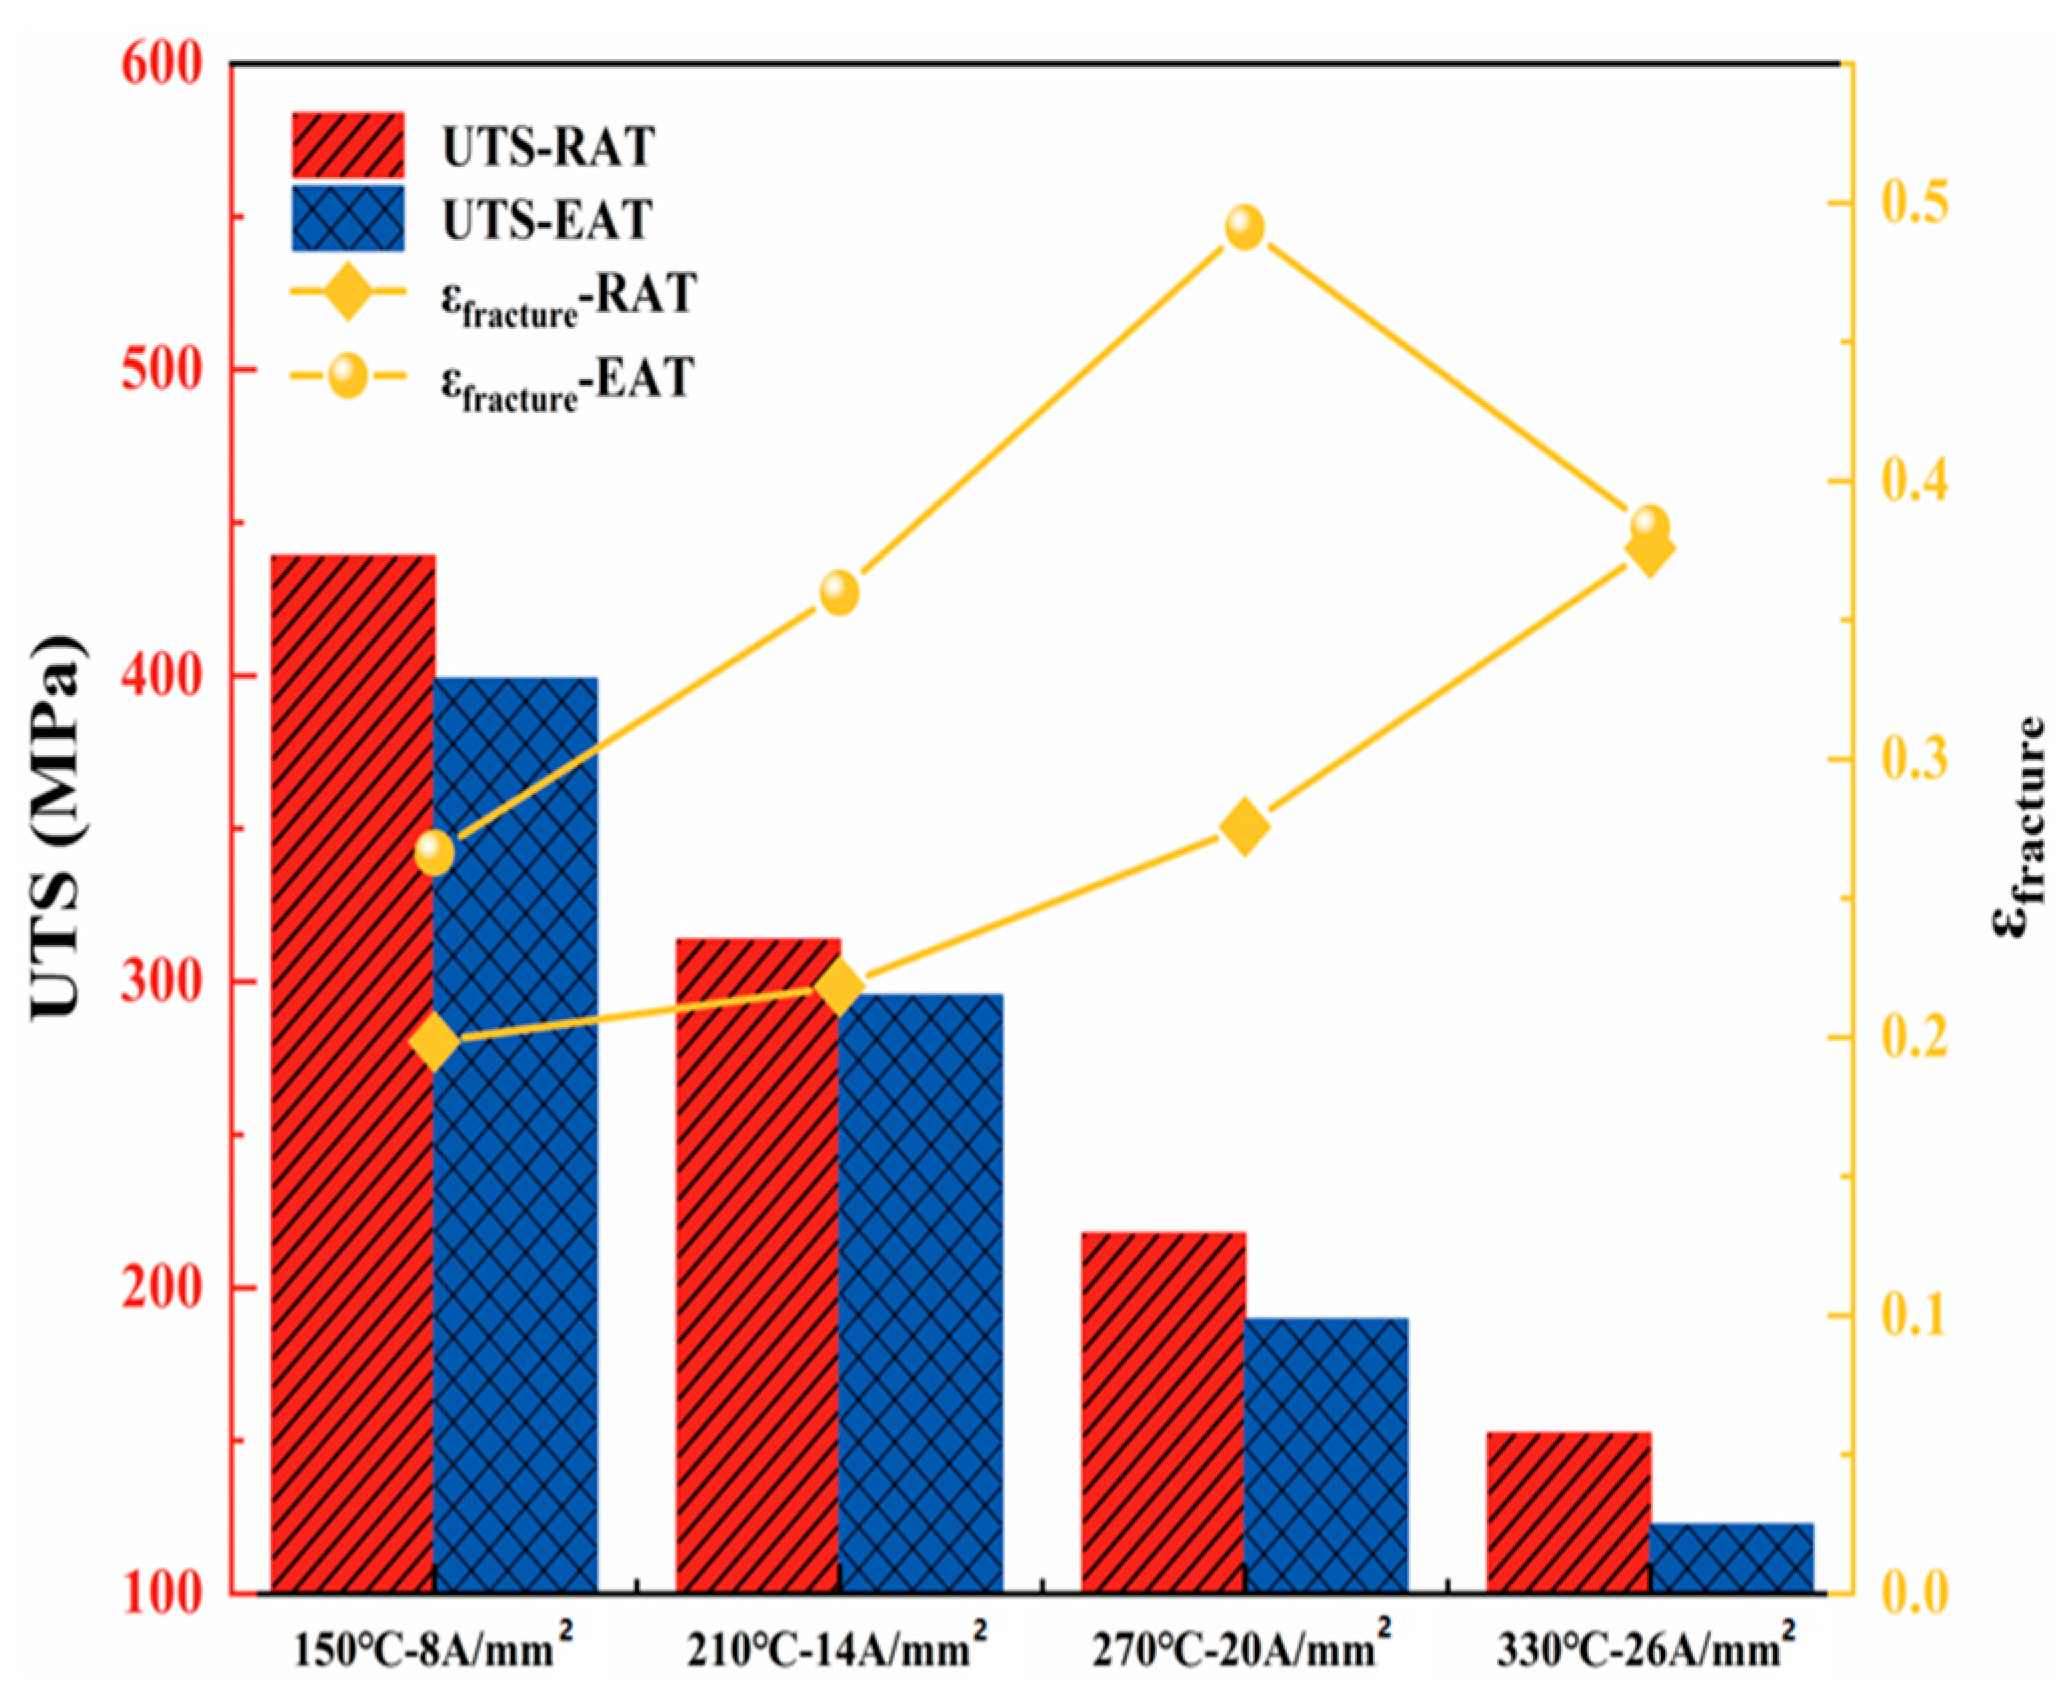
2.5. Experimental Results
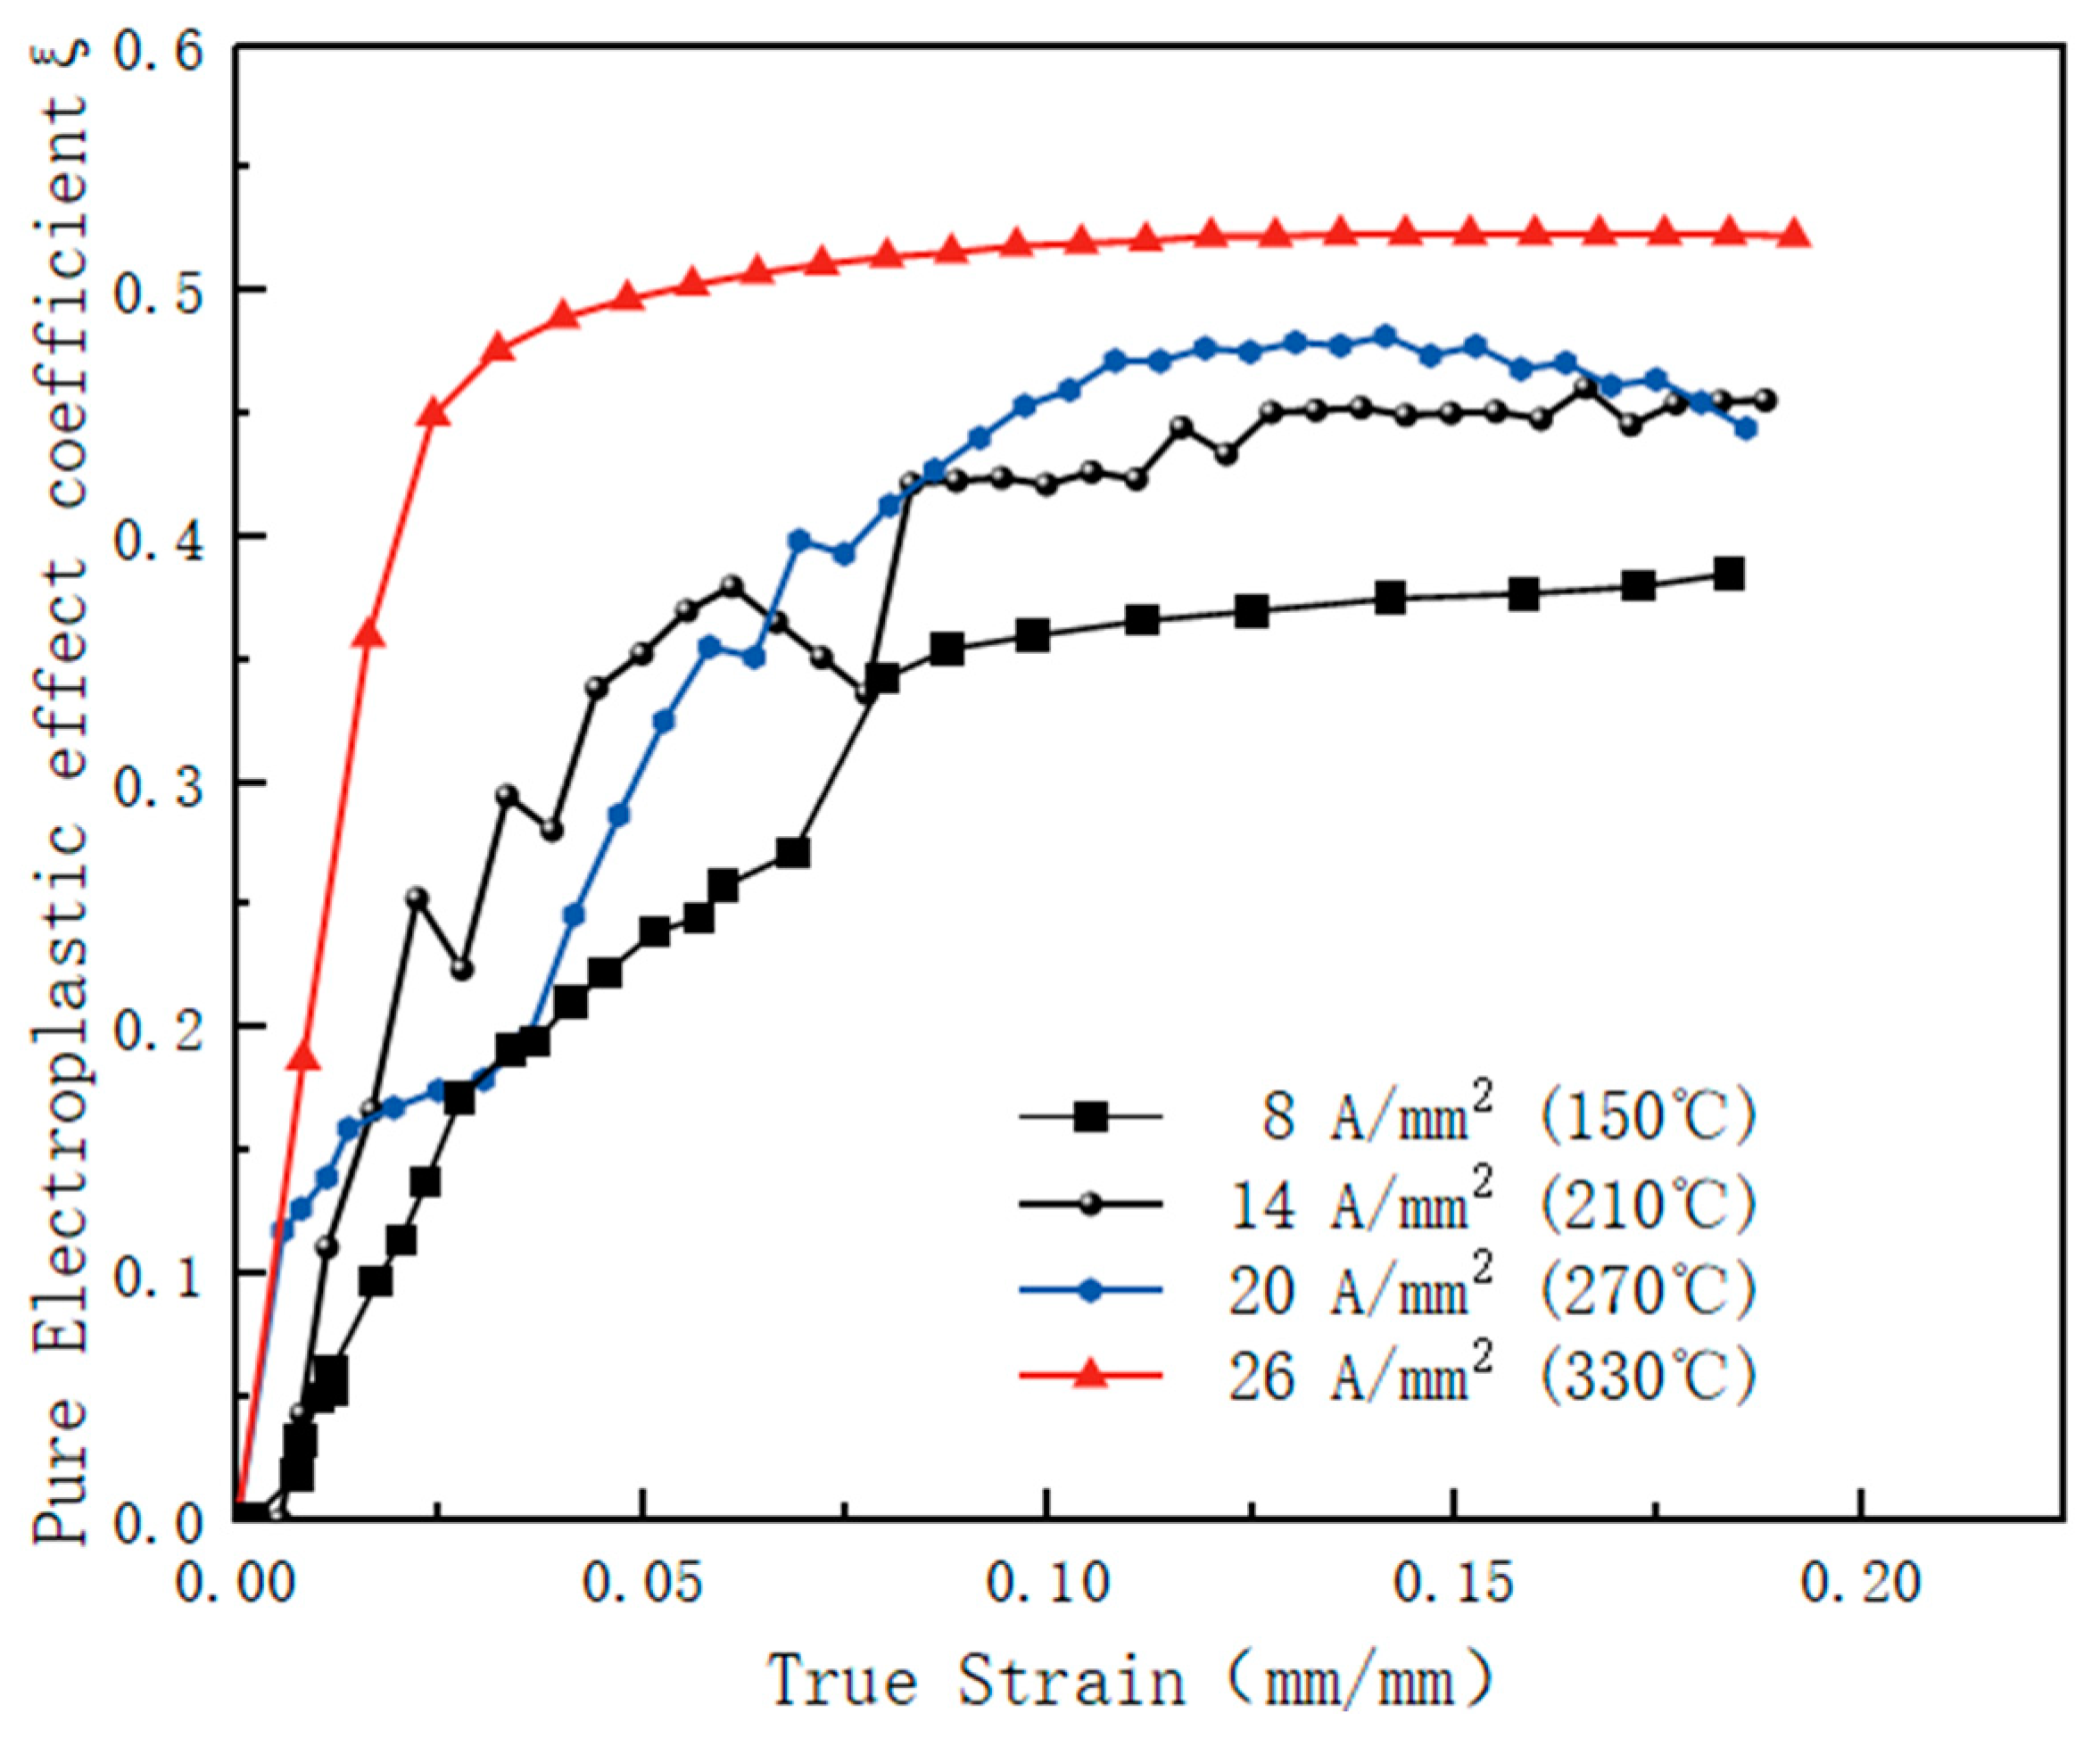
2.6. Electroplastic Effect Coefficient Solution
- (1)
- Electroplastic effect decoupling
- (2)
- Electroplastic effect coefficient solution and law
3. 7075-T6 Electroplasticity Constitutive Equations
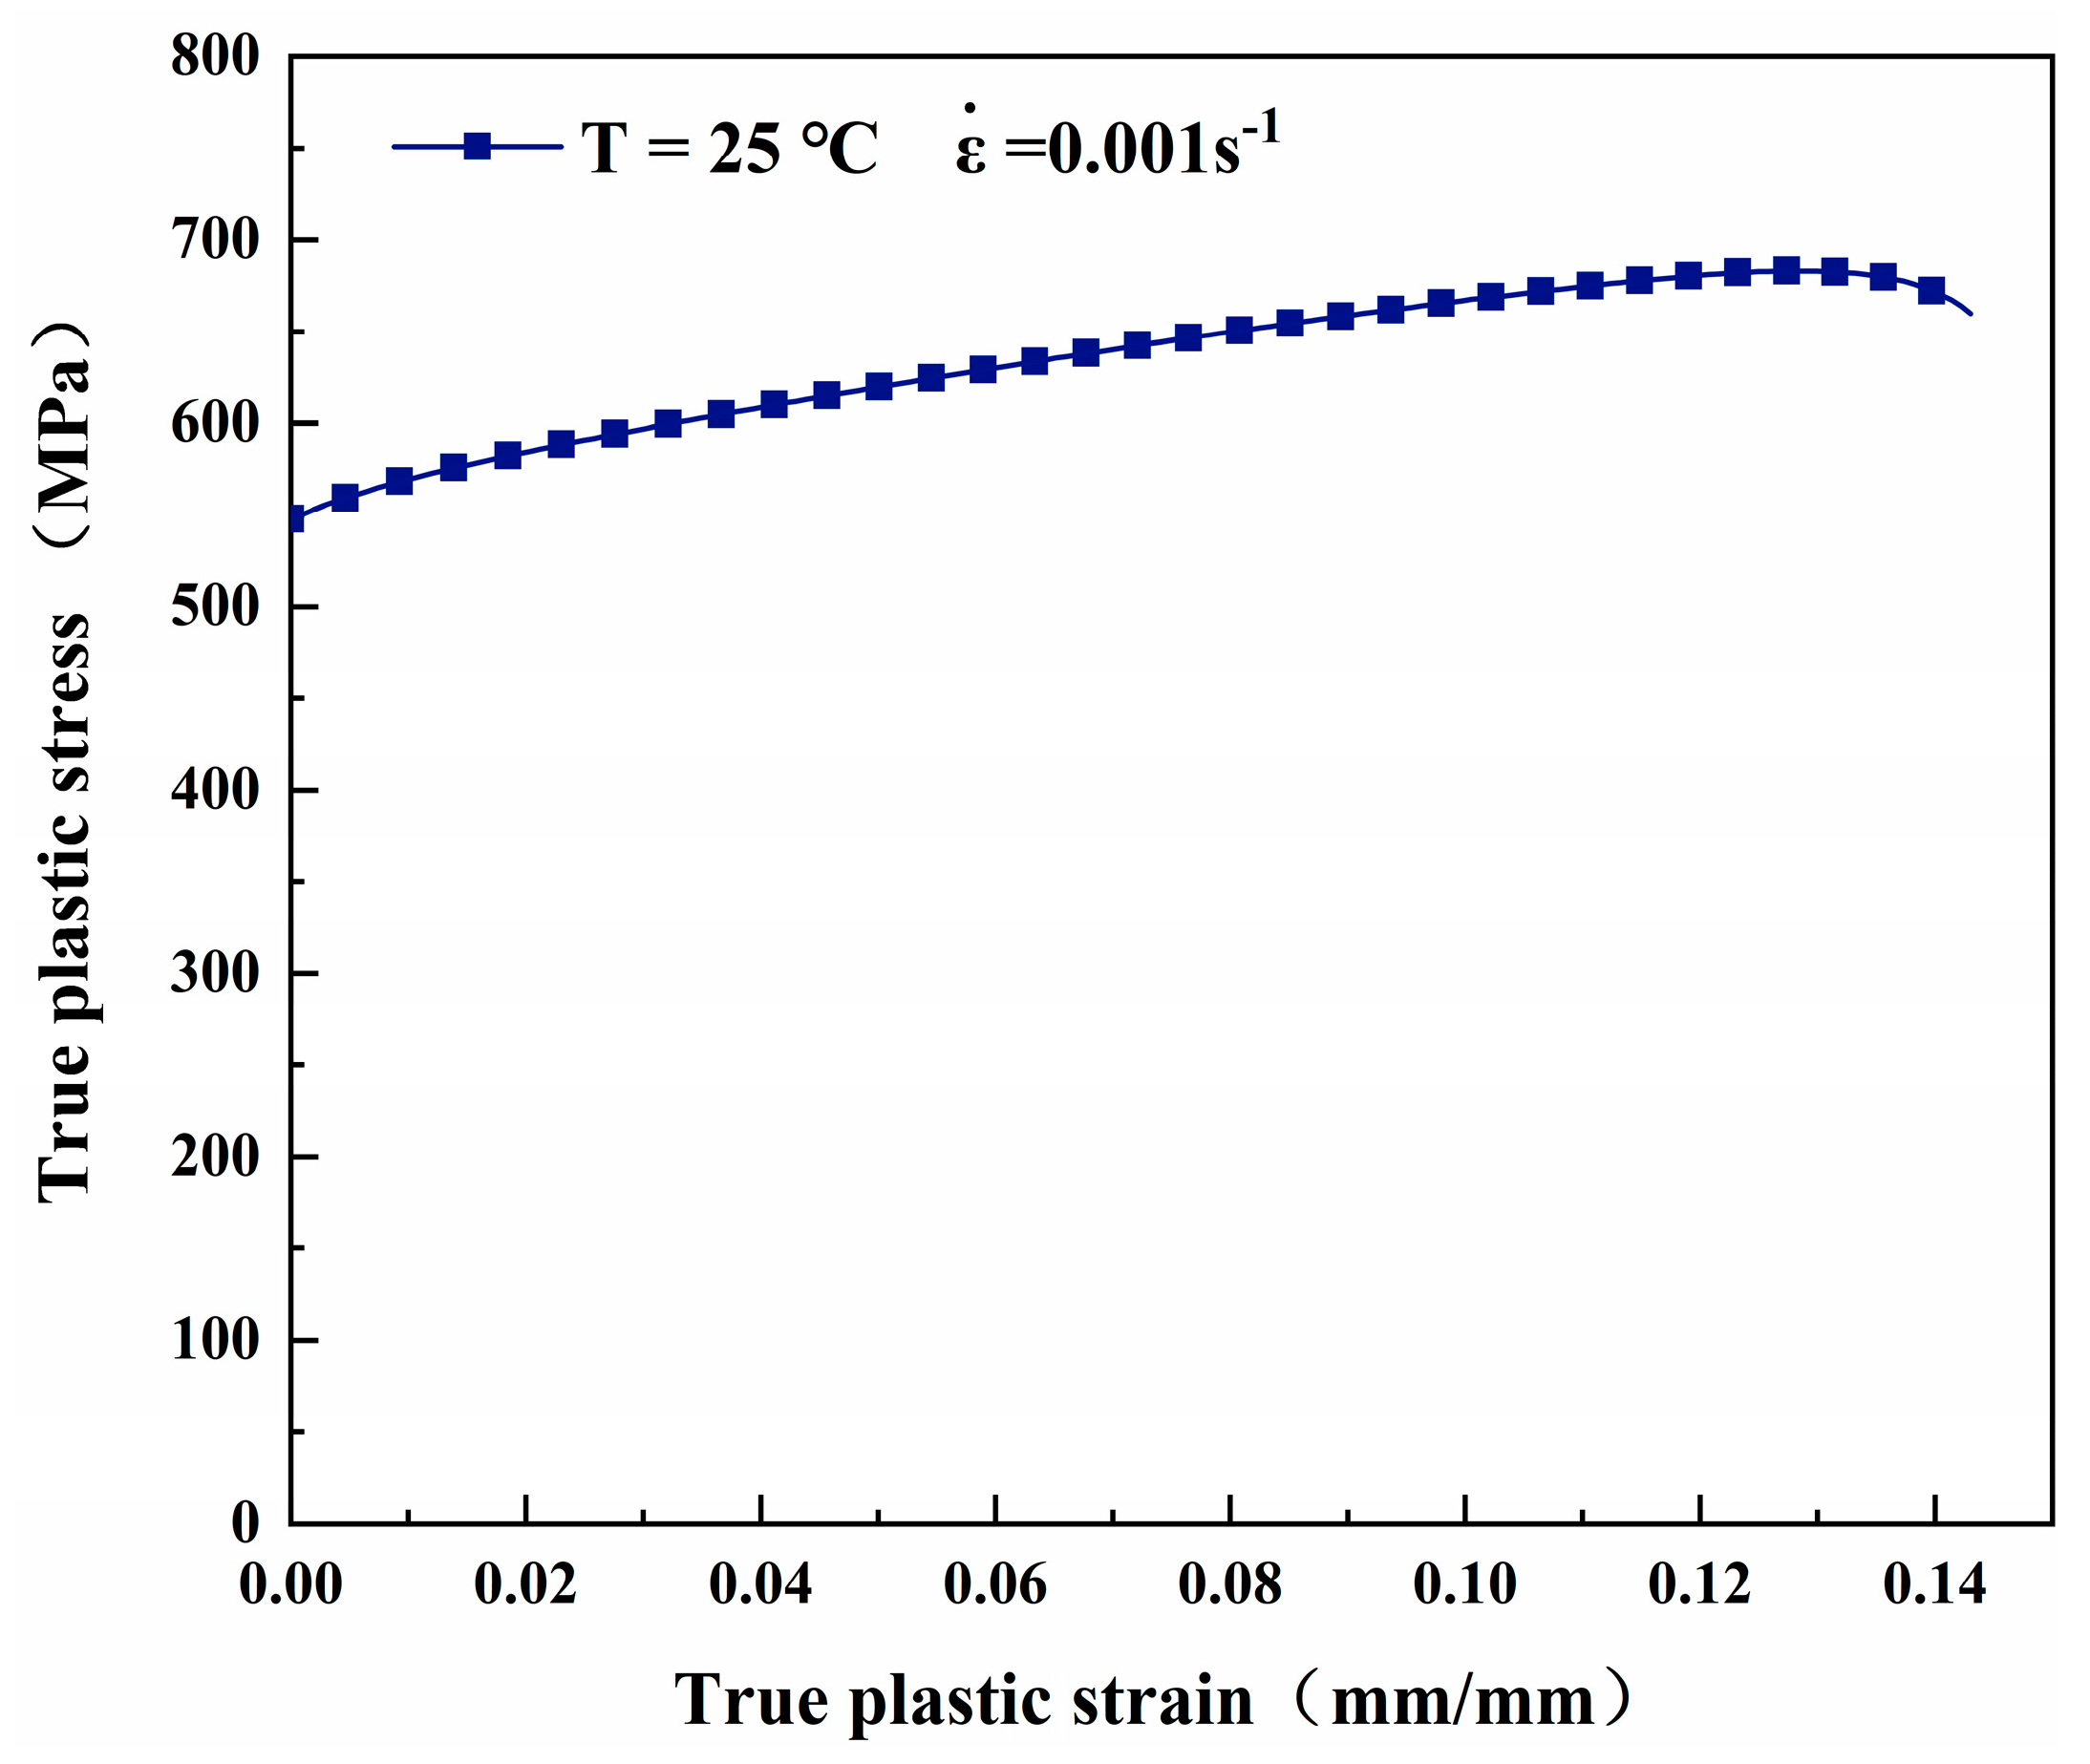
3.1. Johnson–Cook Constitutive Equation
3.2. Electrothermal Conversion
- (1)
- Conversion of electrical energy and thermal energy
- (2)
- Thermoelectric conversion functions
- (3)
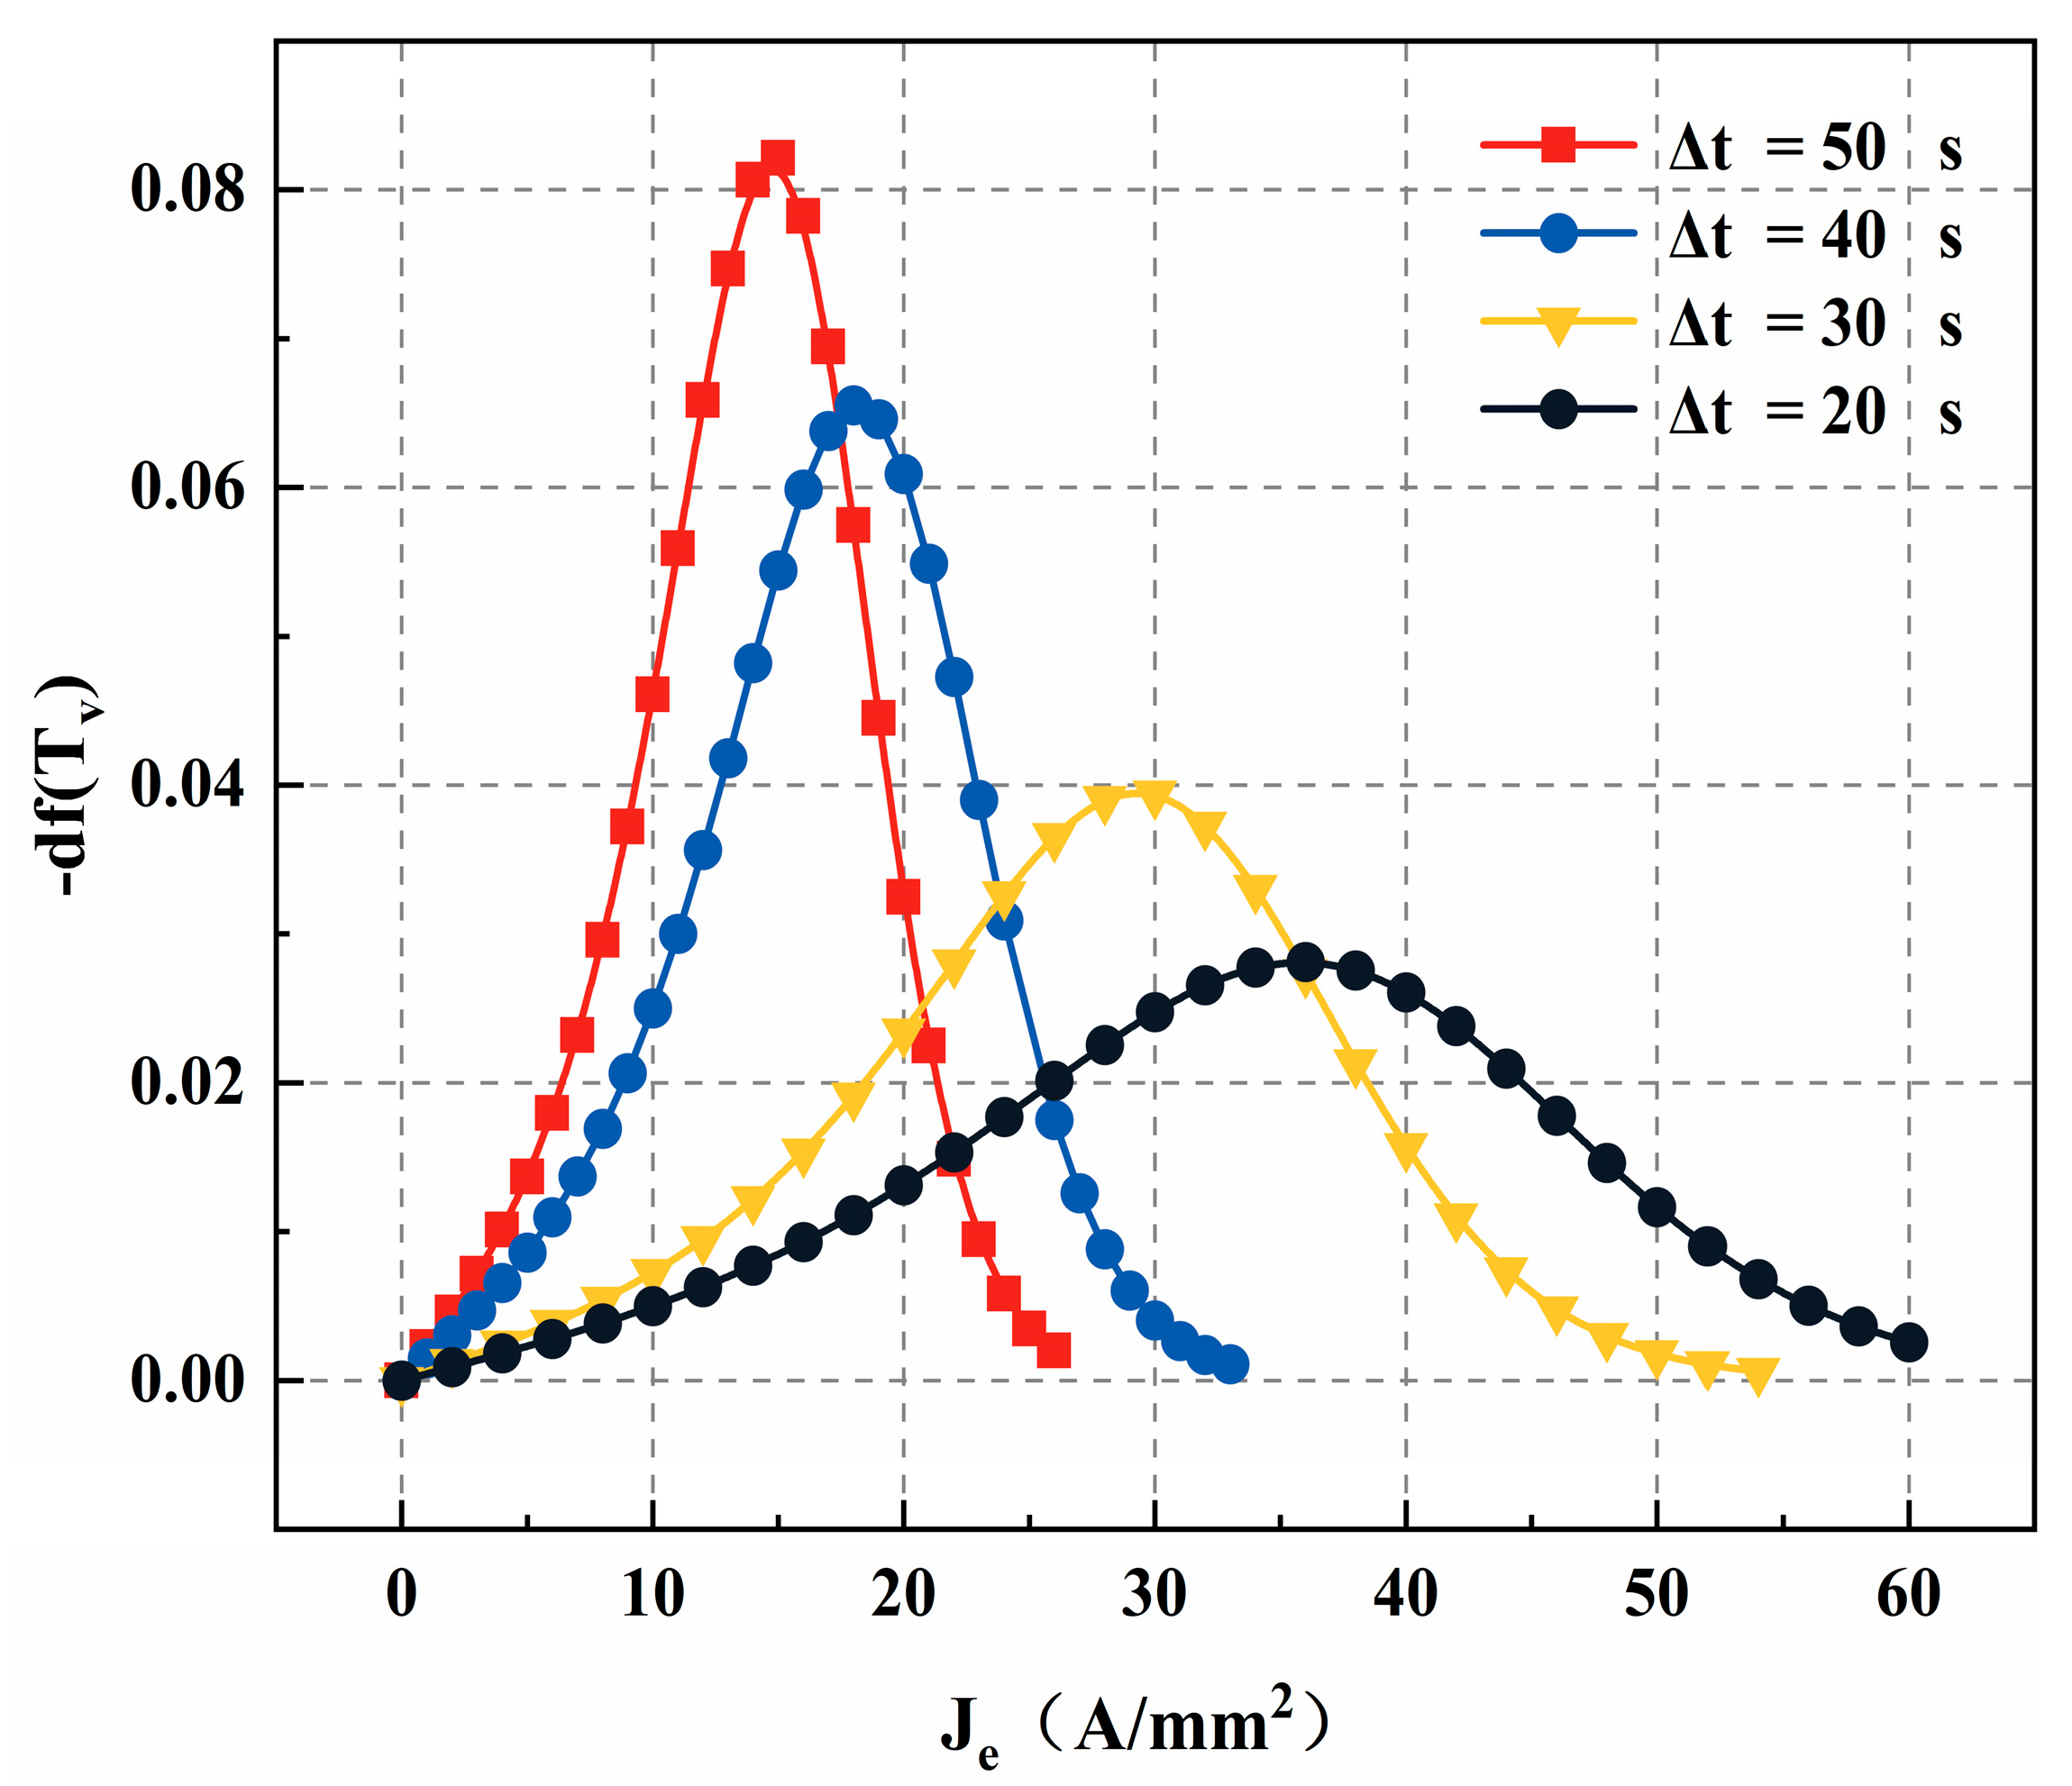
- Current density threshold
3.3. Electroplasticity Constitutive Equations
- (1)
- EA-Johnson–Cook constitutive equations
- (2)
- Determination of strain-hardening function
- (3)
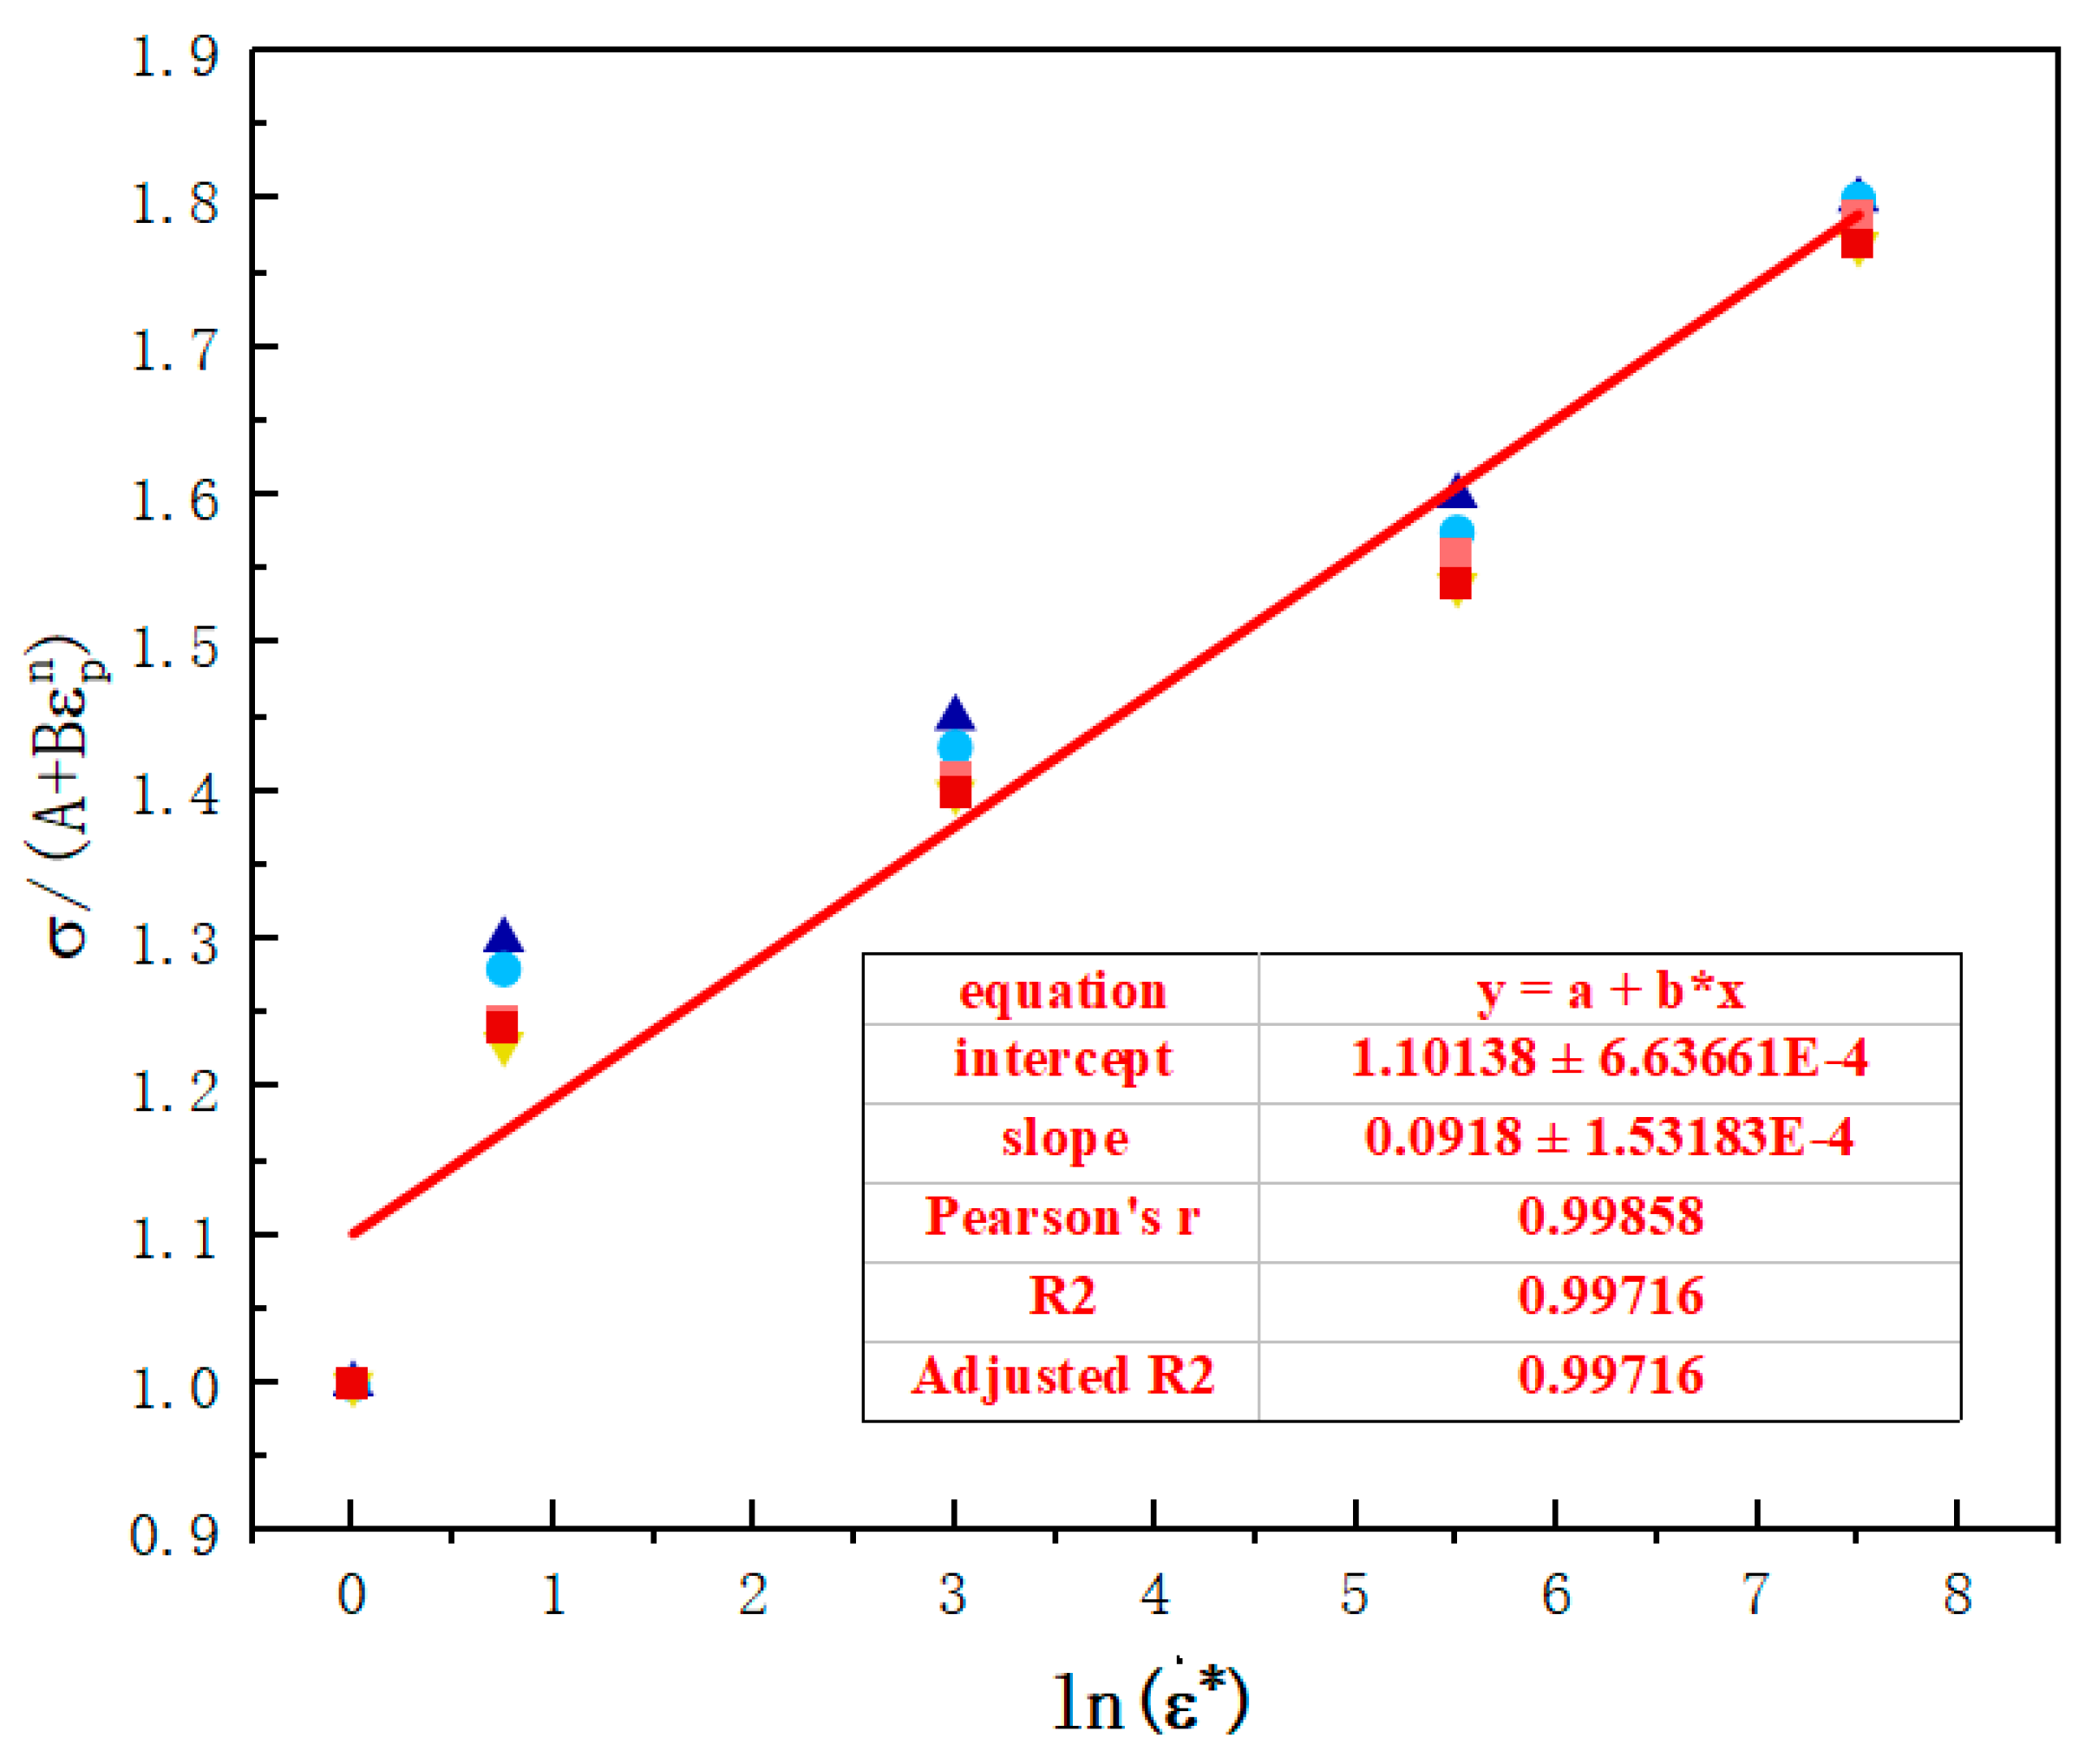
- Determination of strain rate parameters
- (4)
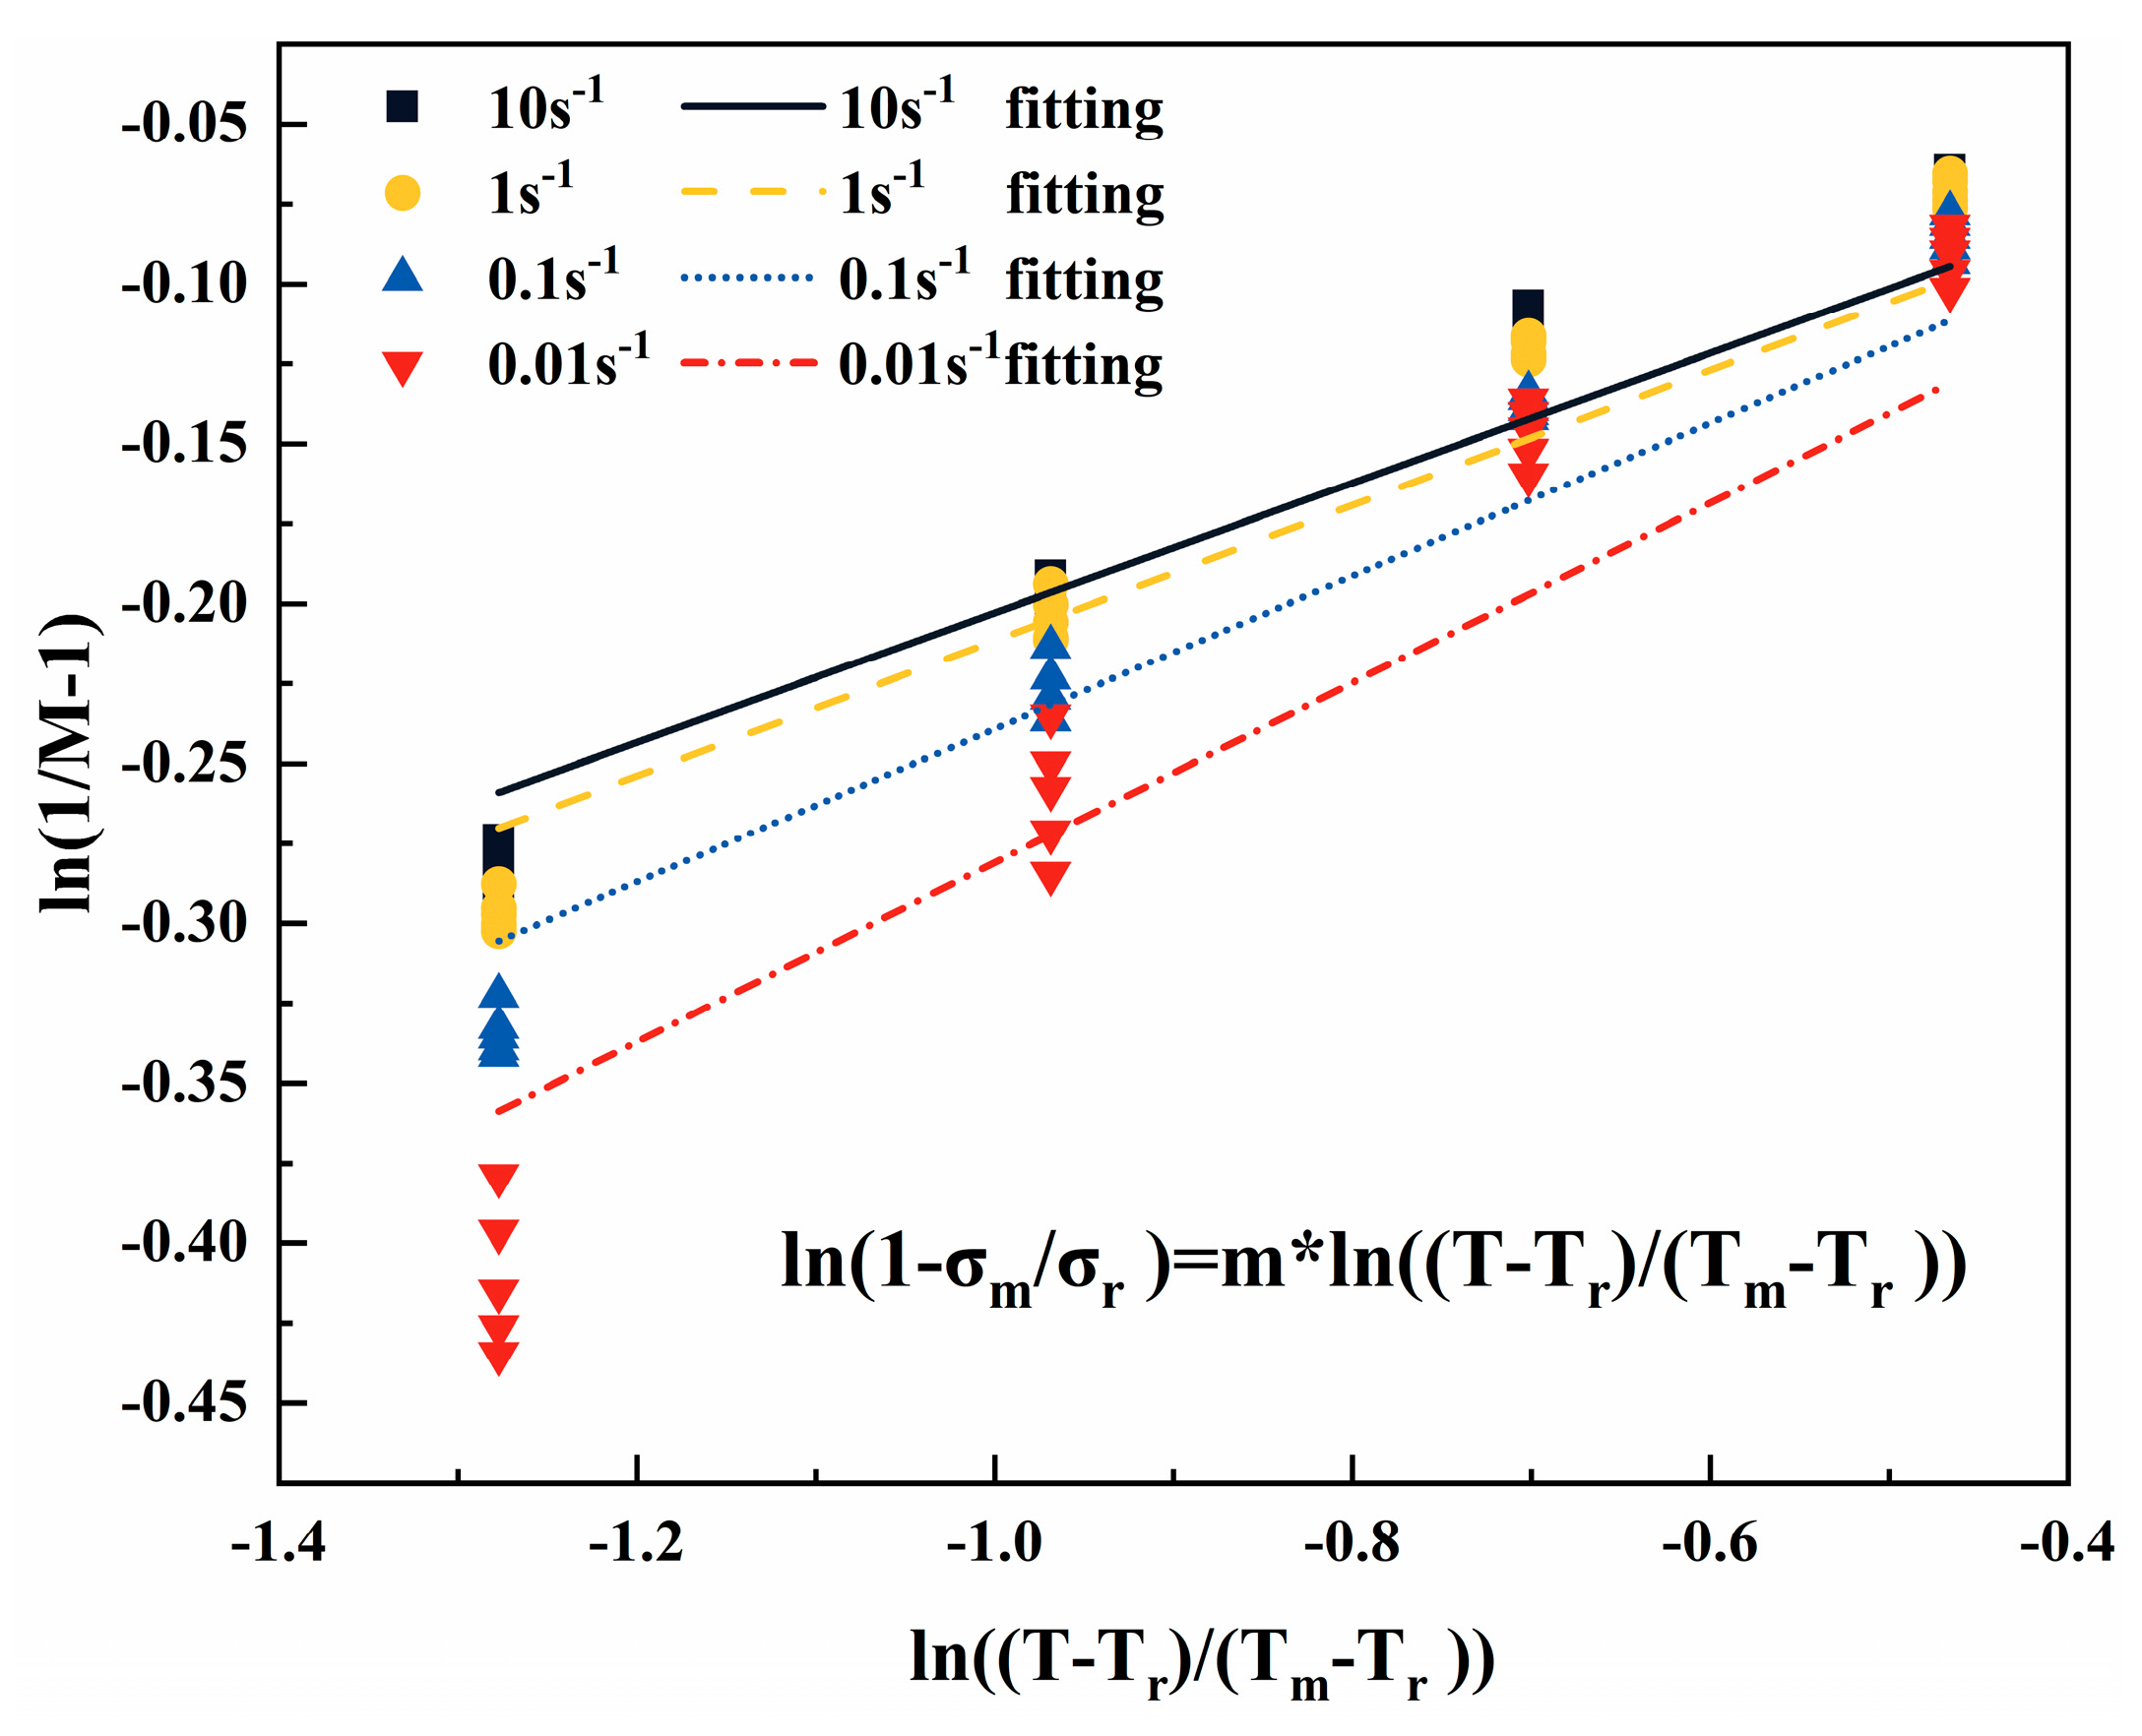
- Solution of thermal-softening parameter m
- (5)
- The electrothermal conversion function
4. Numerical Simulation of Uniaxial Tensile
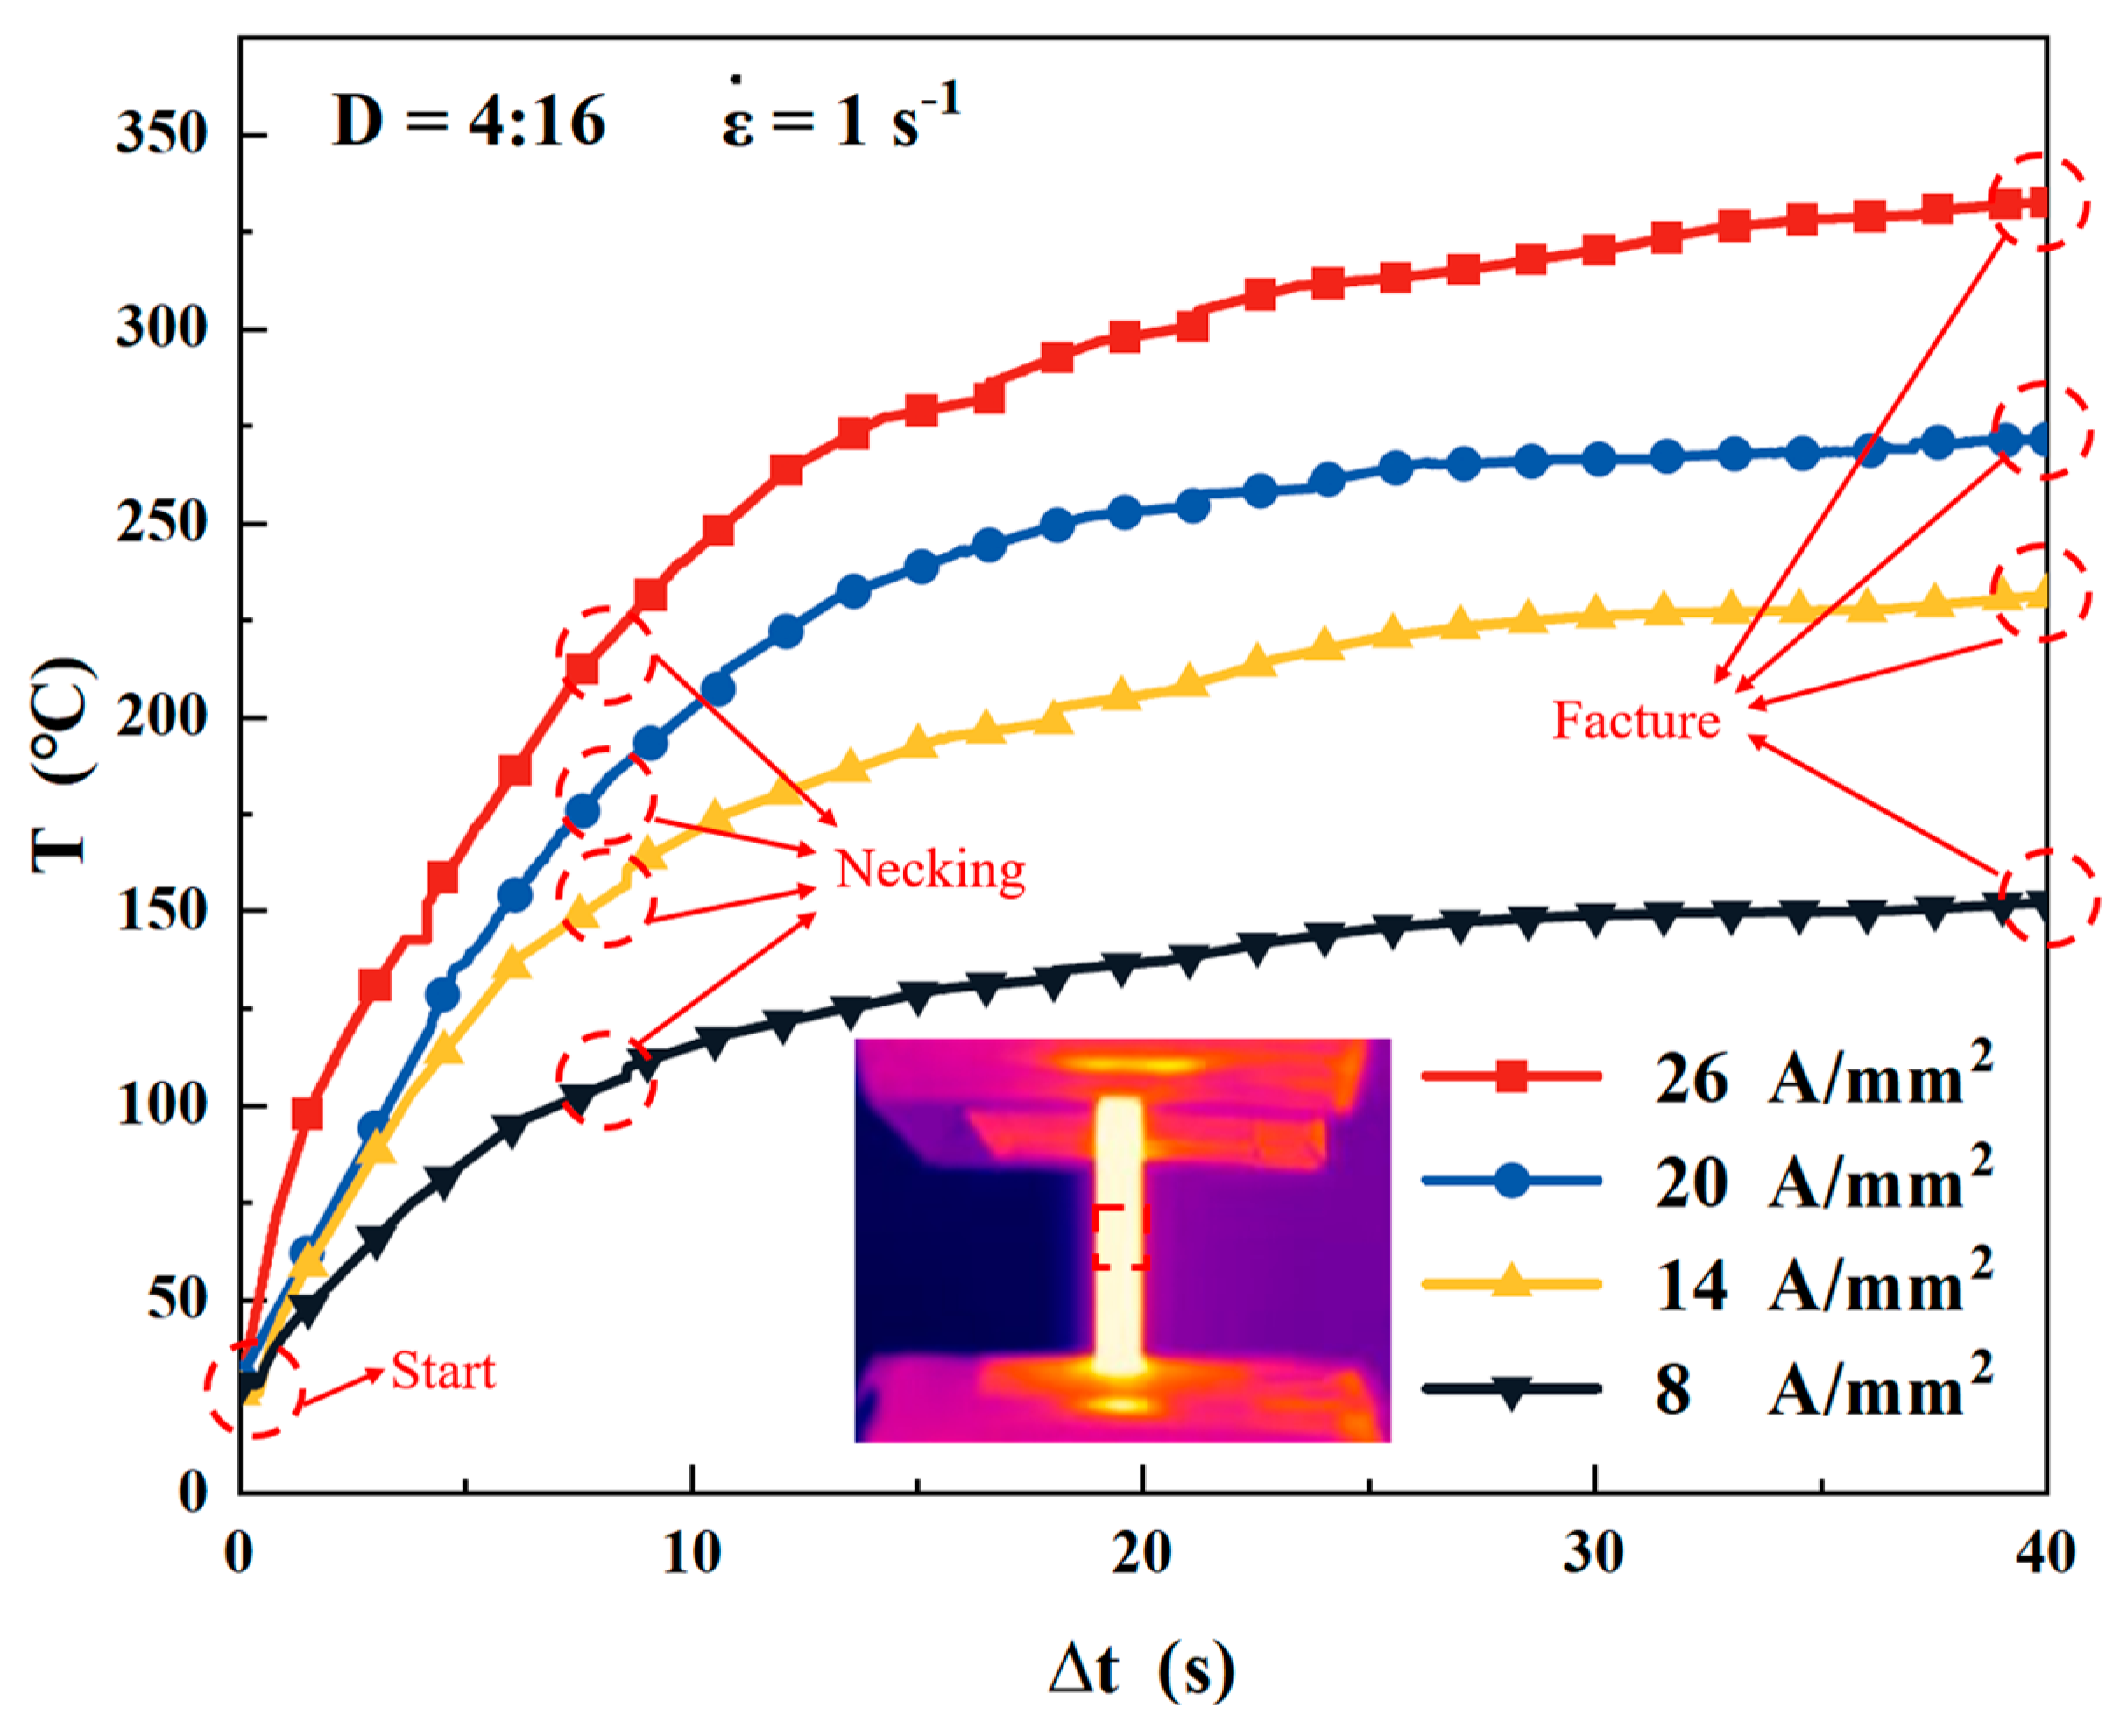
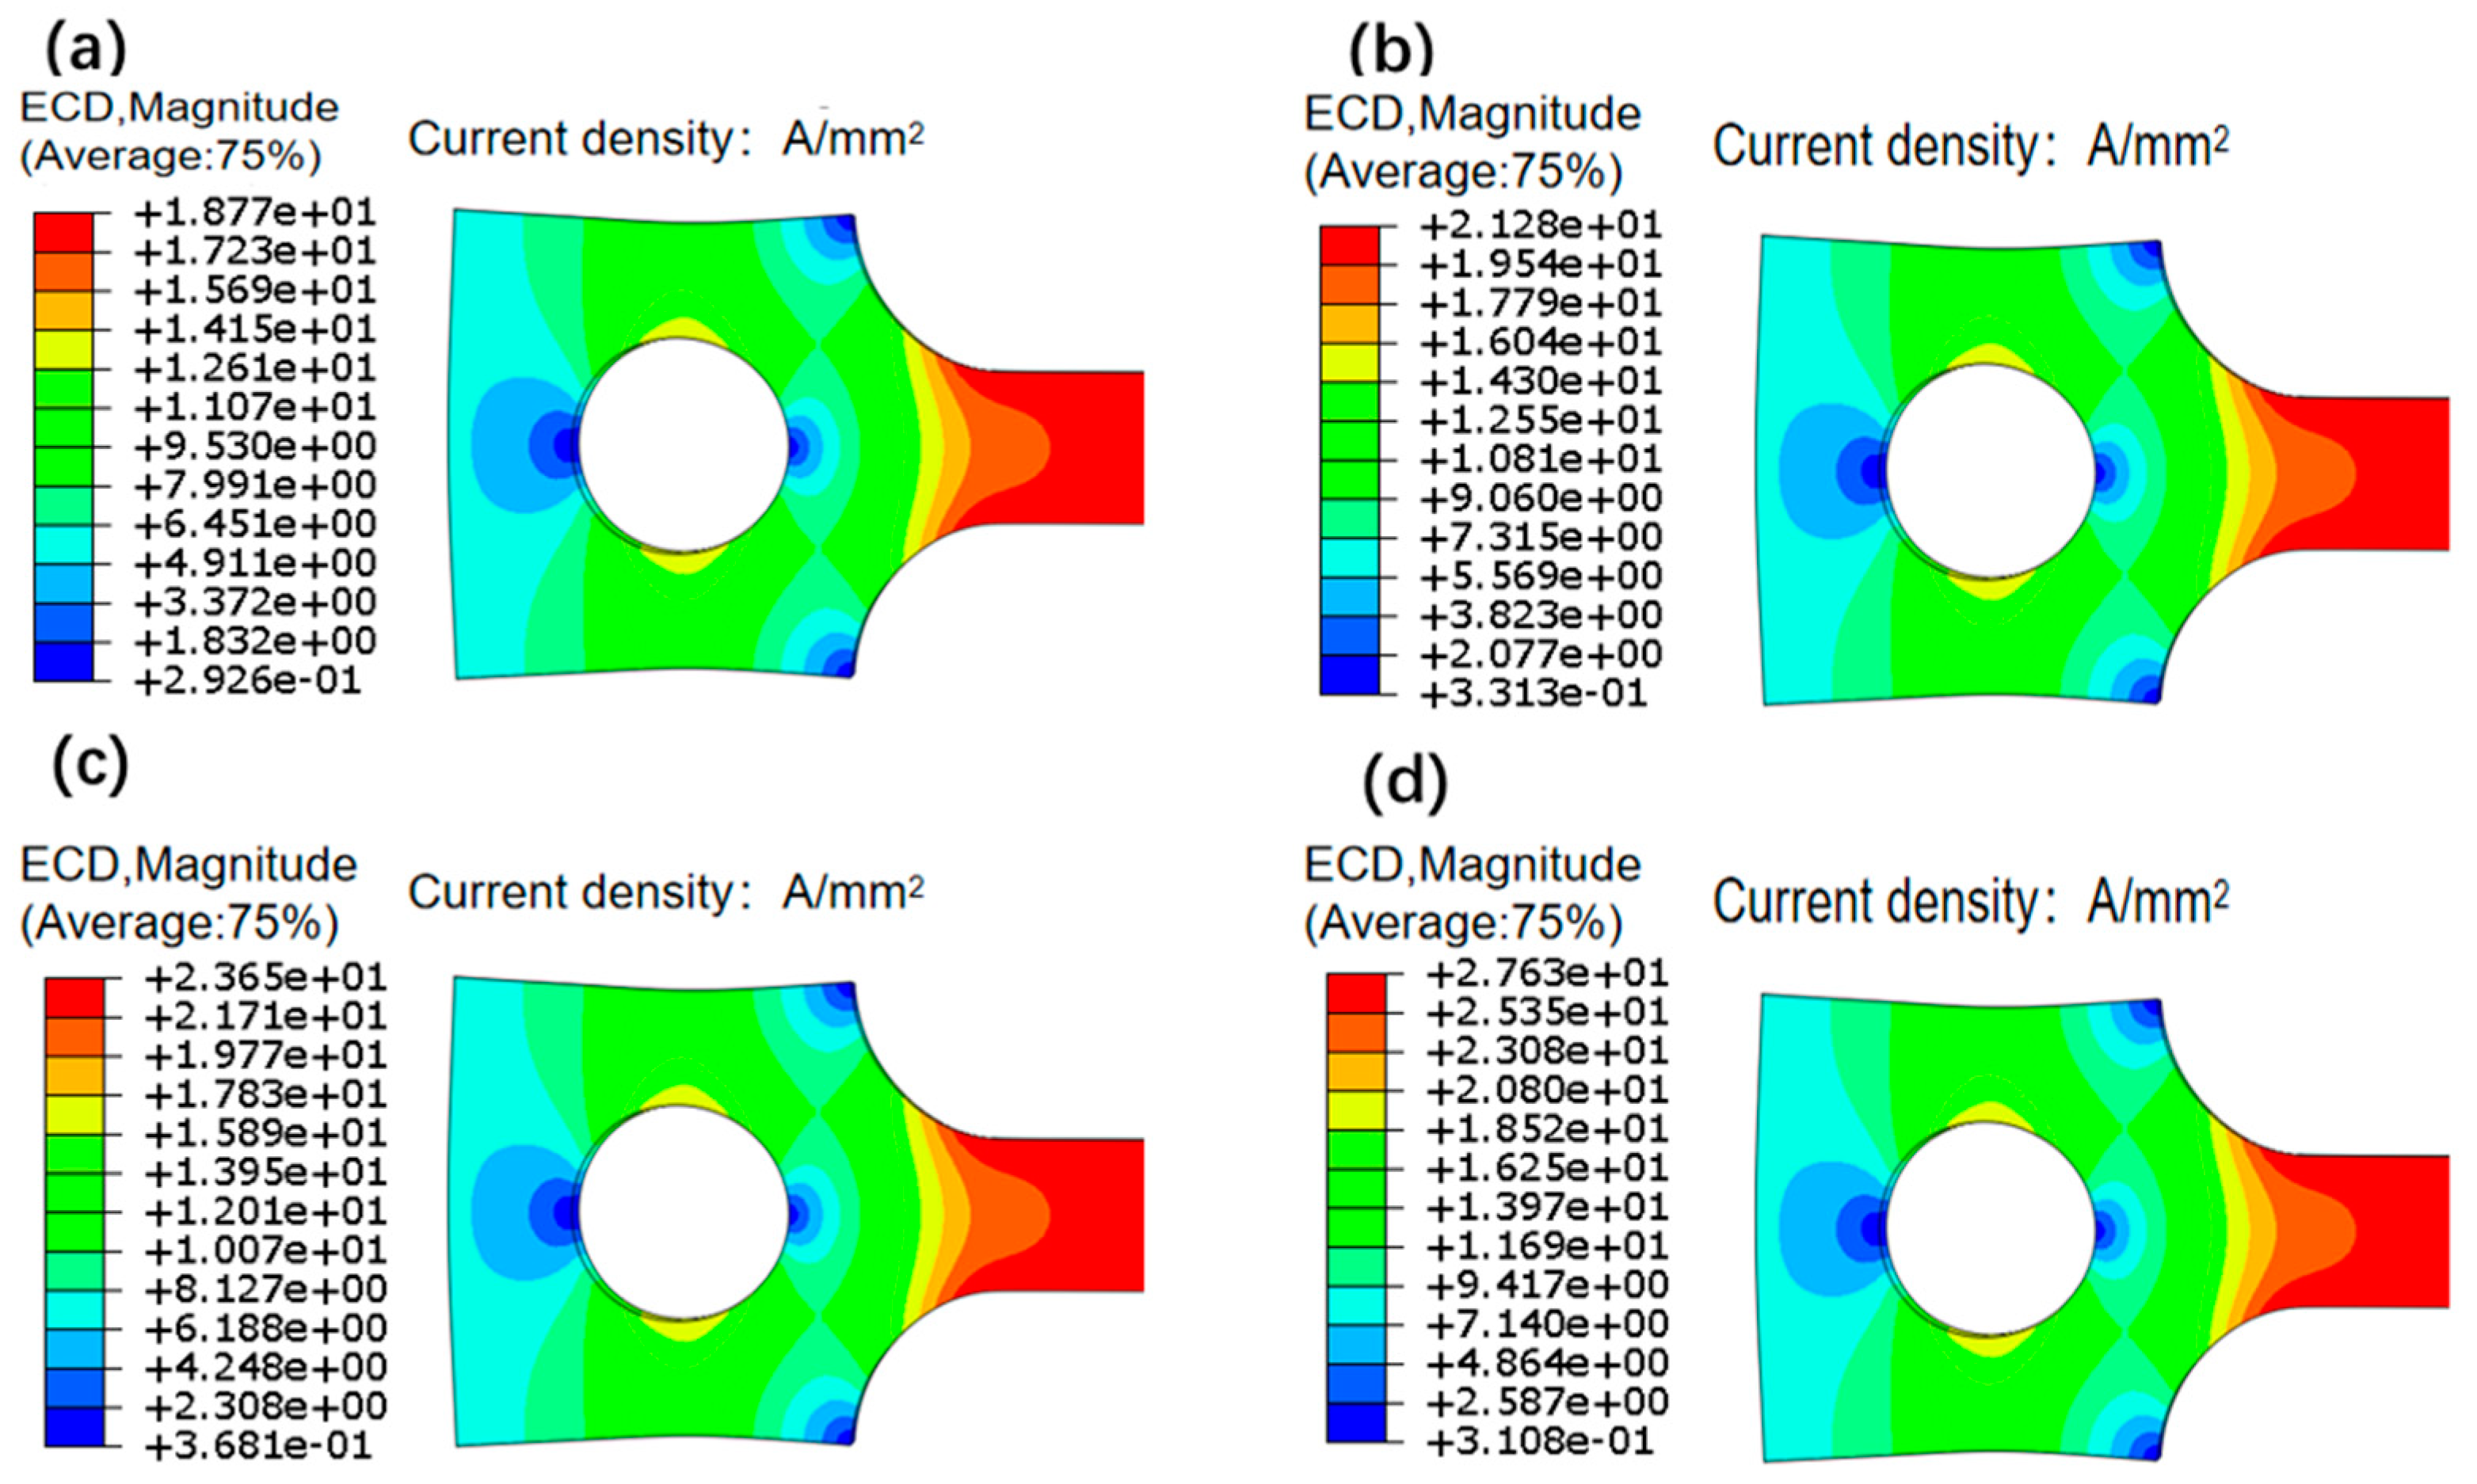
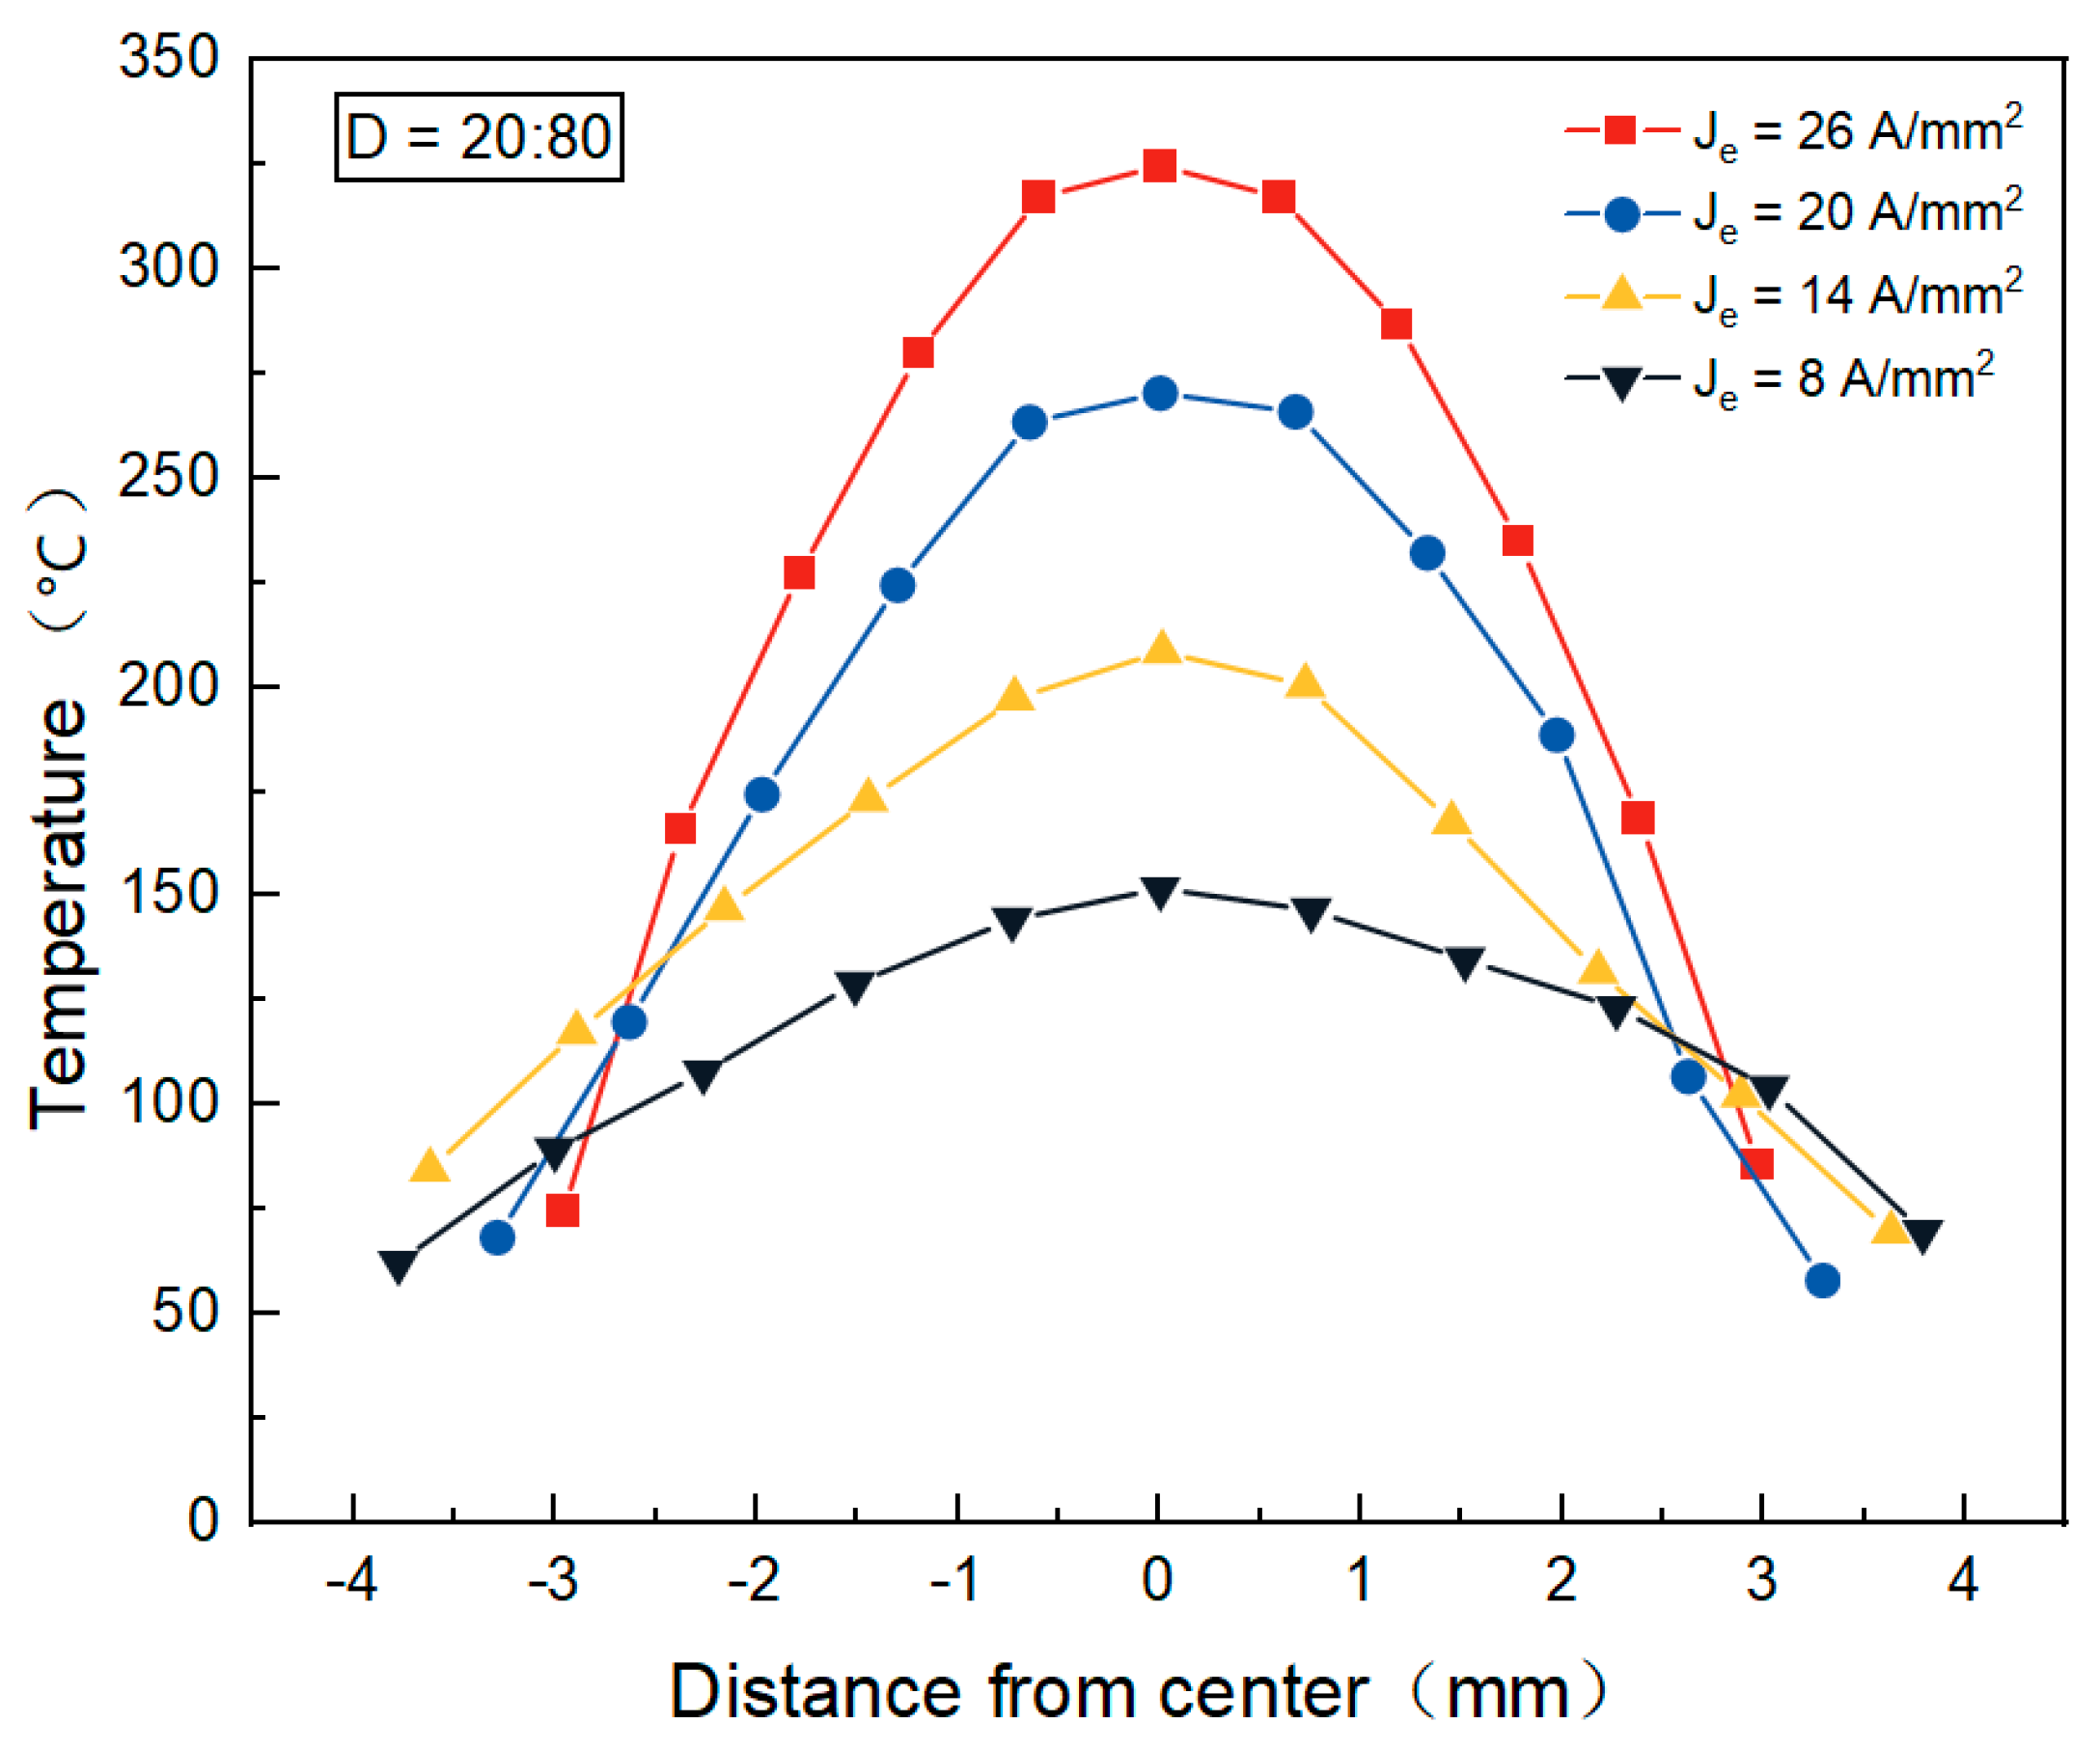
4.1. Analysis of Current and Temperature Field During Pulsed Current Loading Process
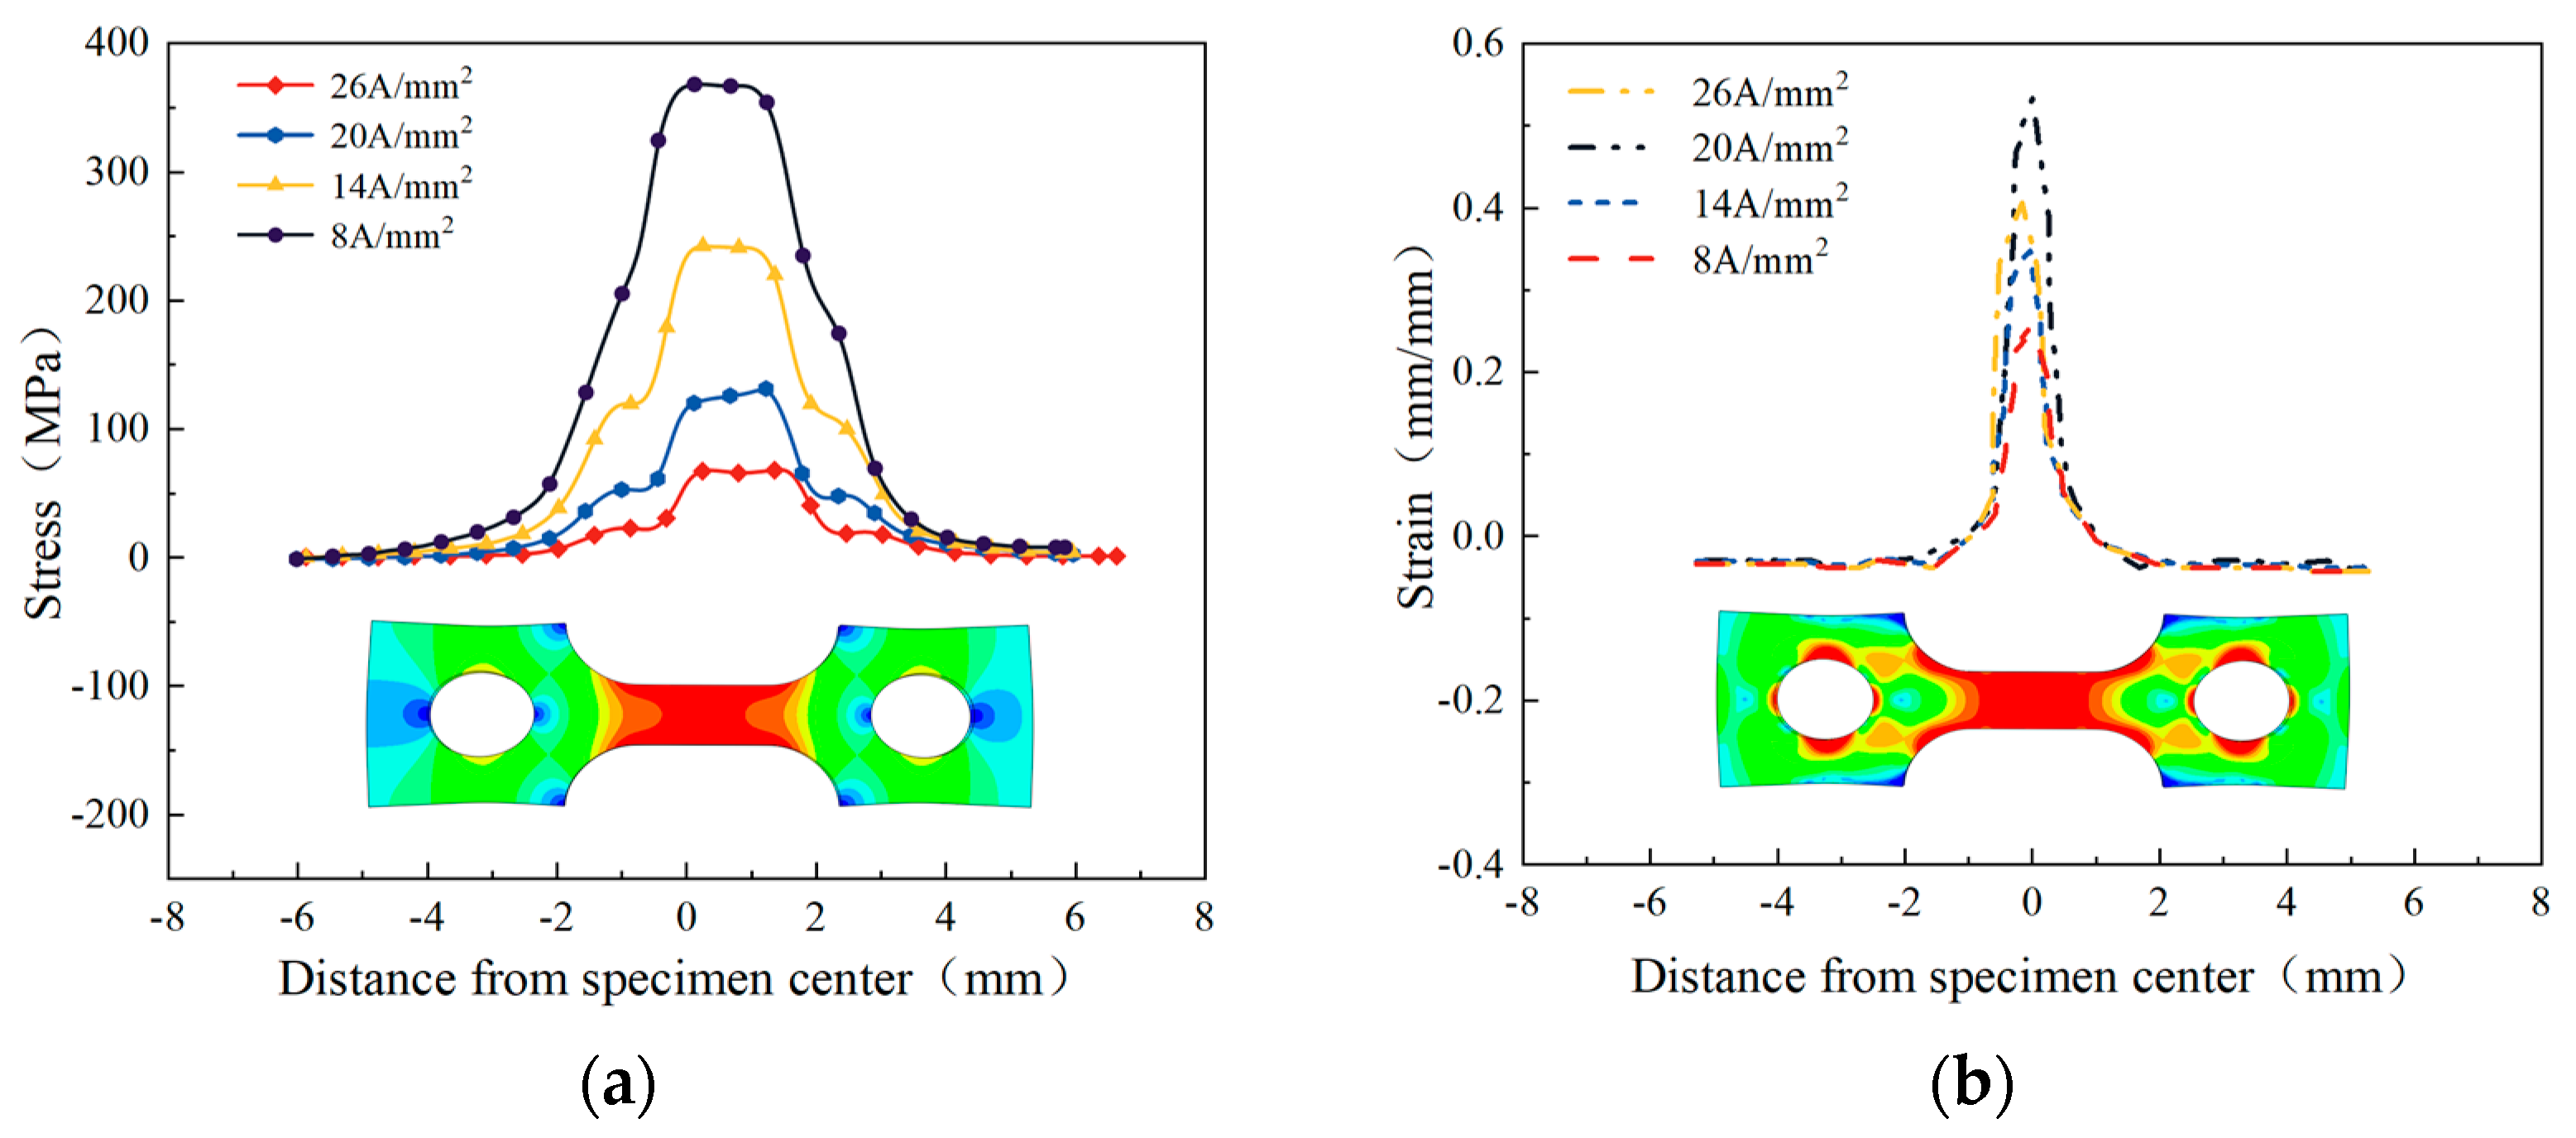
4.2. Stress and Strain Field Analysis During Pulsed Current Loading Process
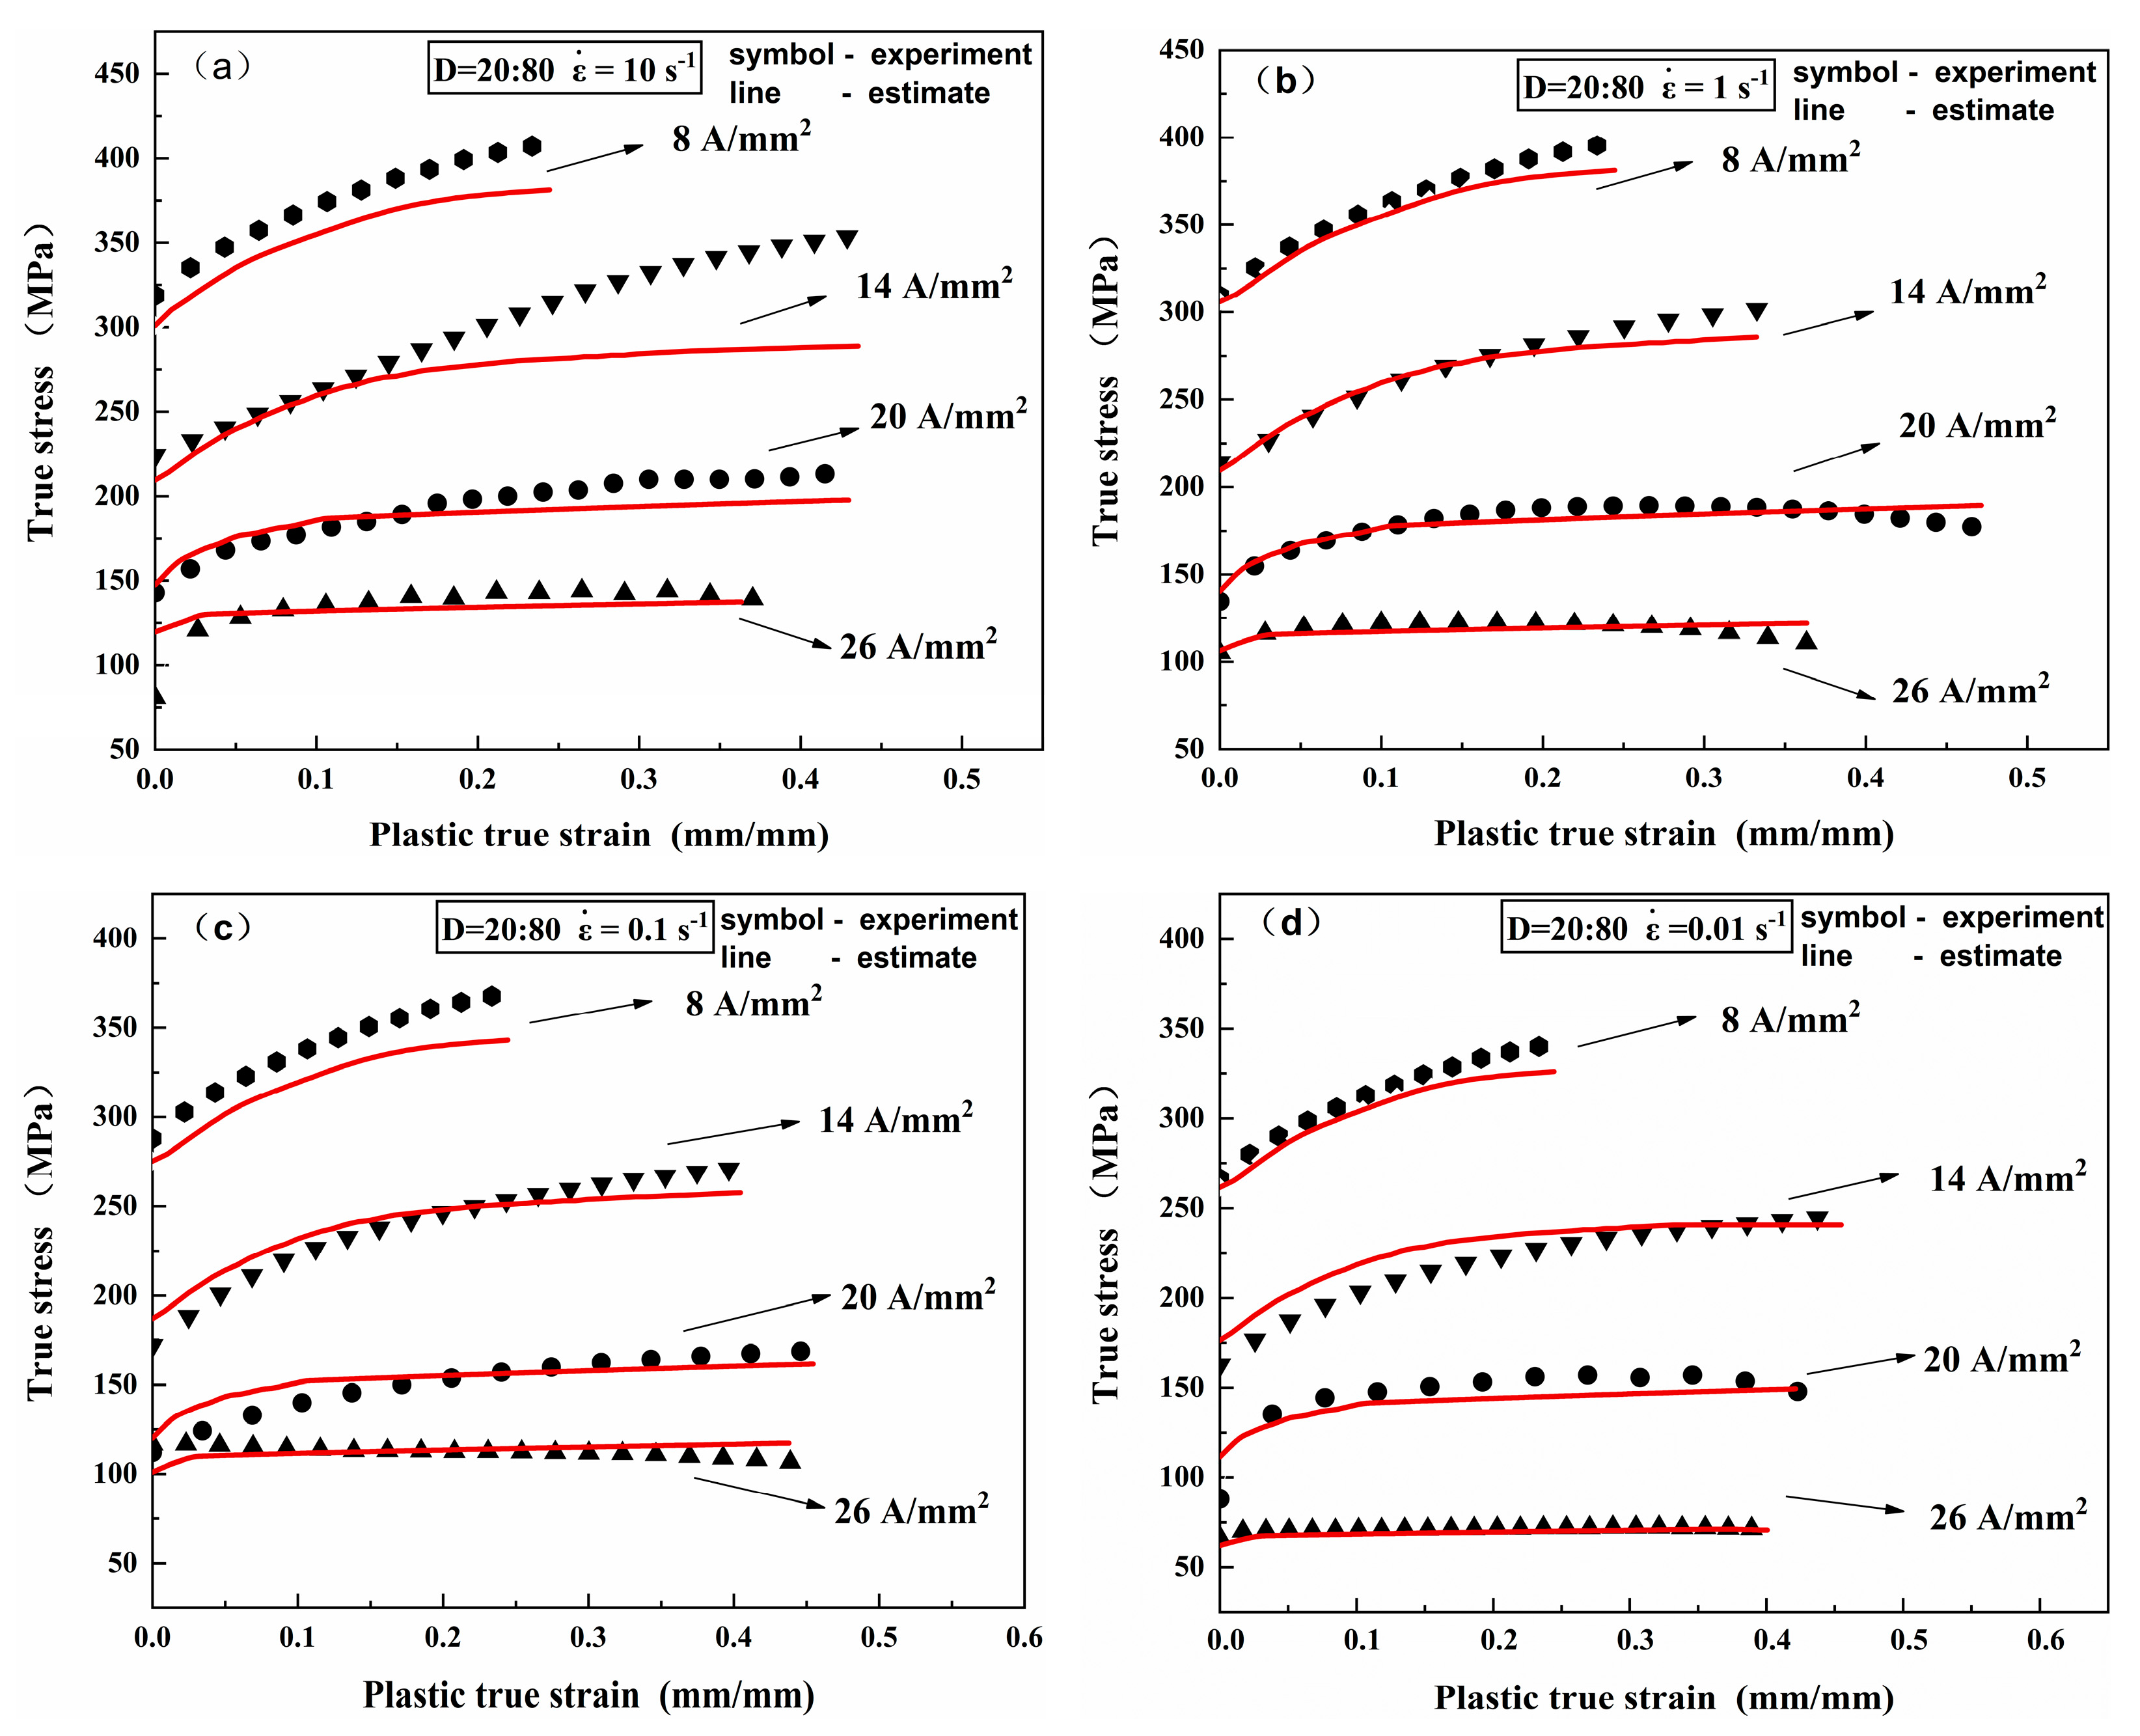
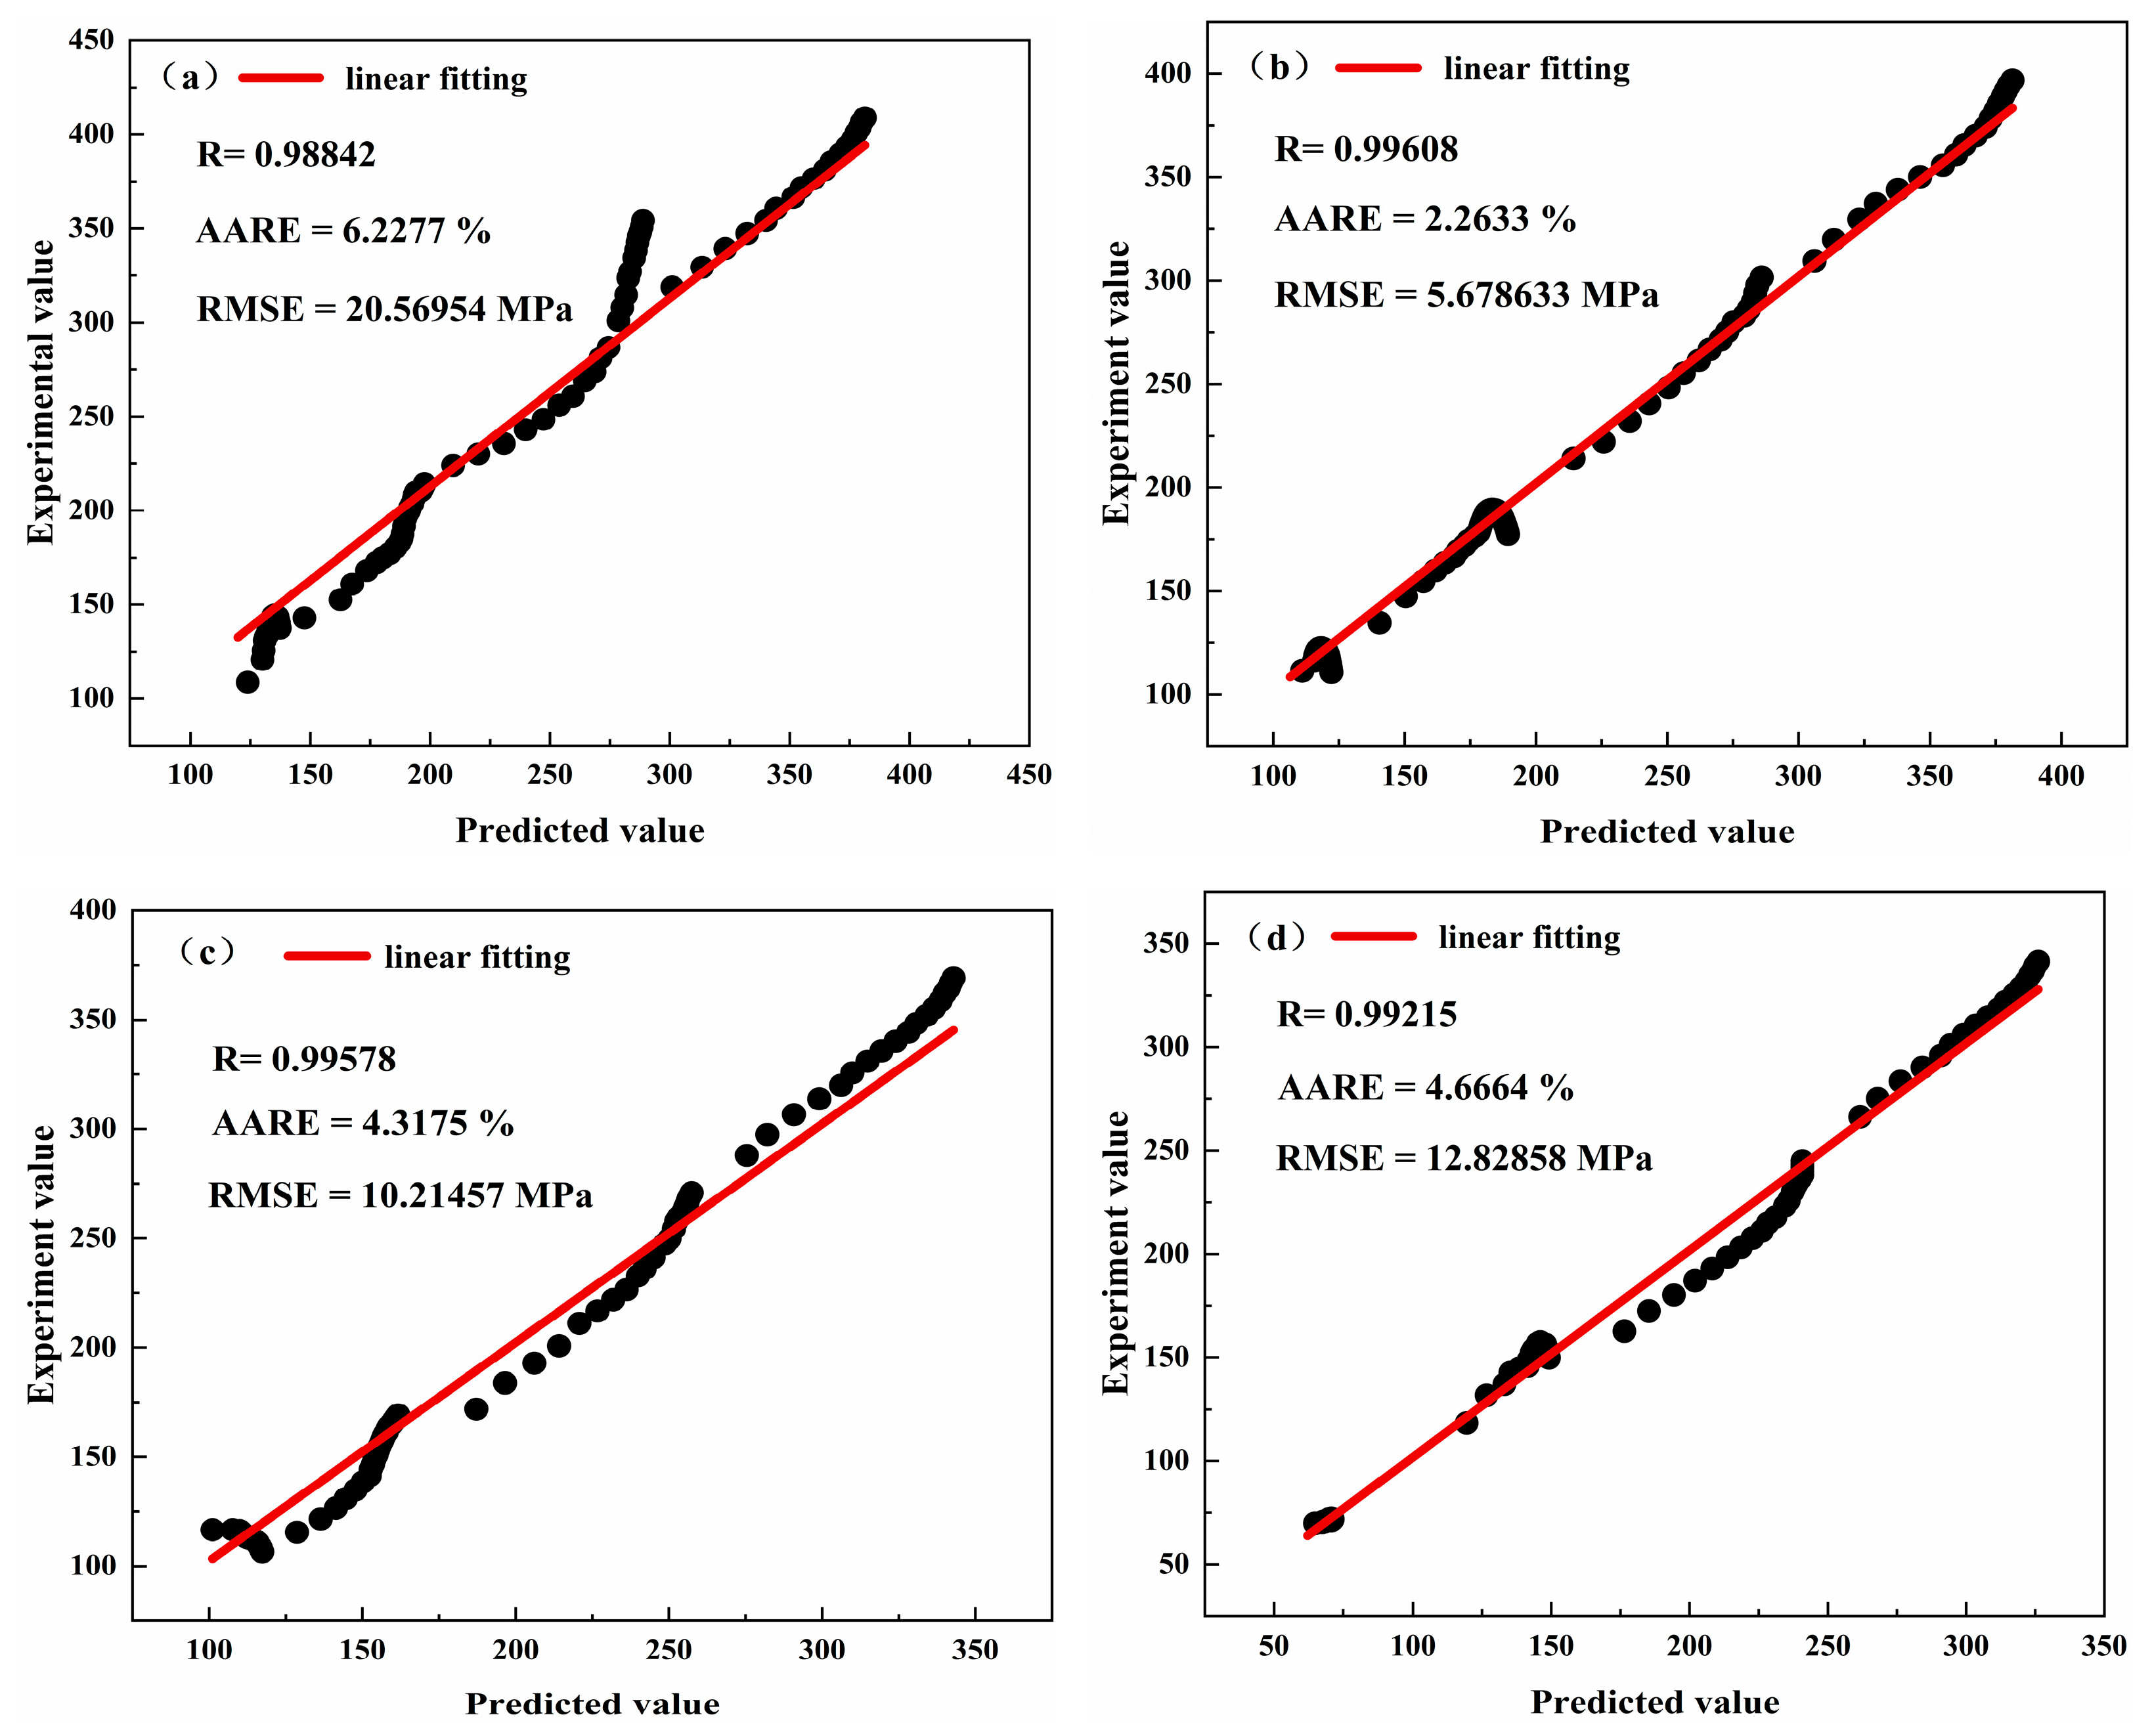
4.3. Comparison of Experimental and Predicted Values
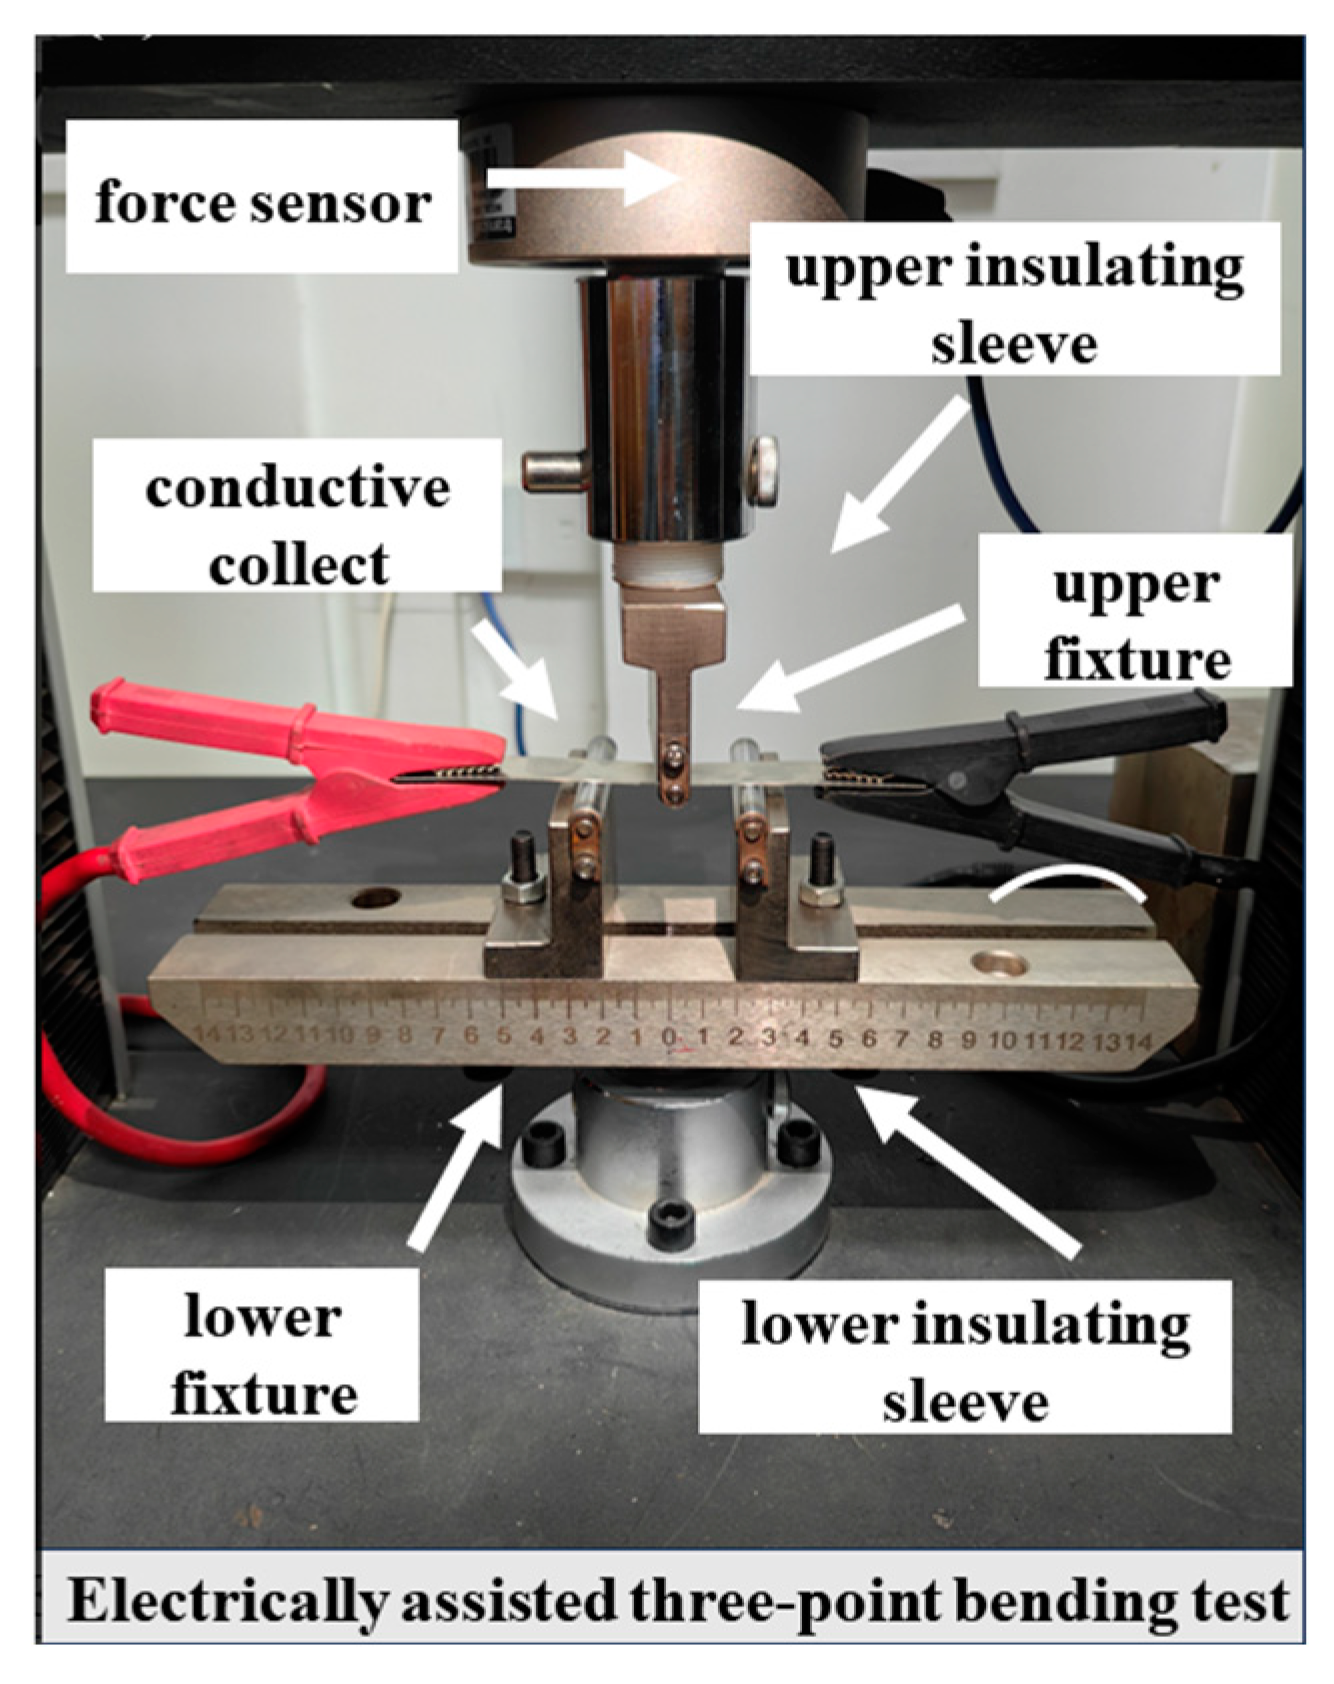
4.4. Electrically Assisted Three-Point Bending Platform Construction
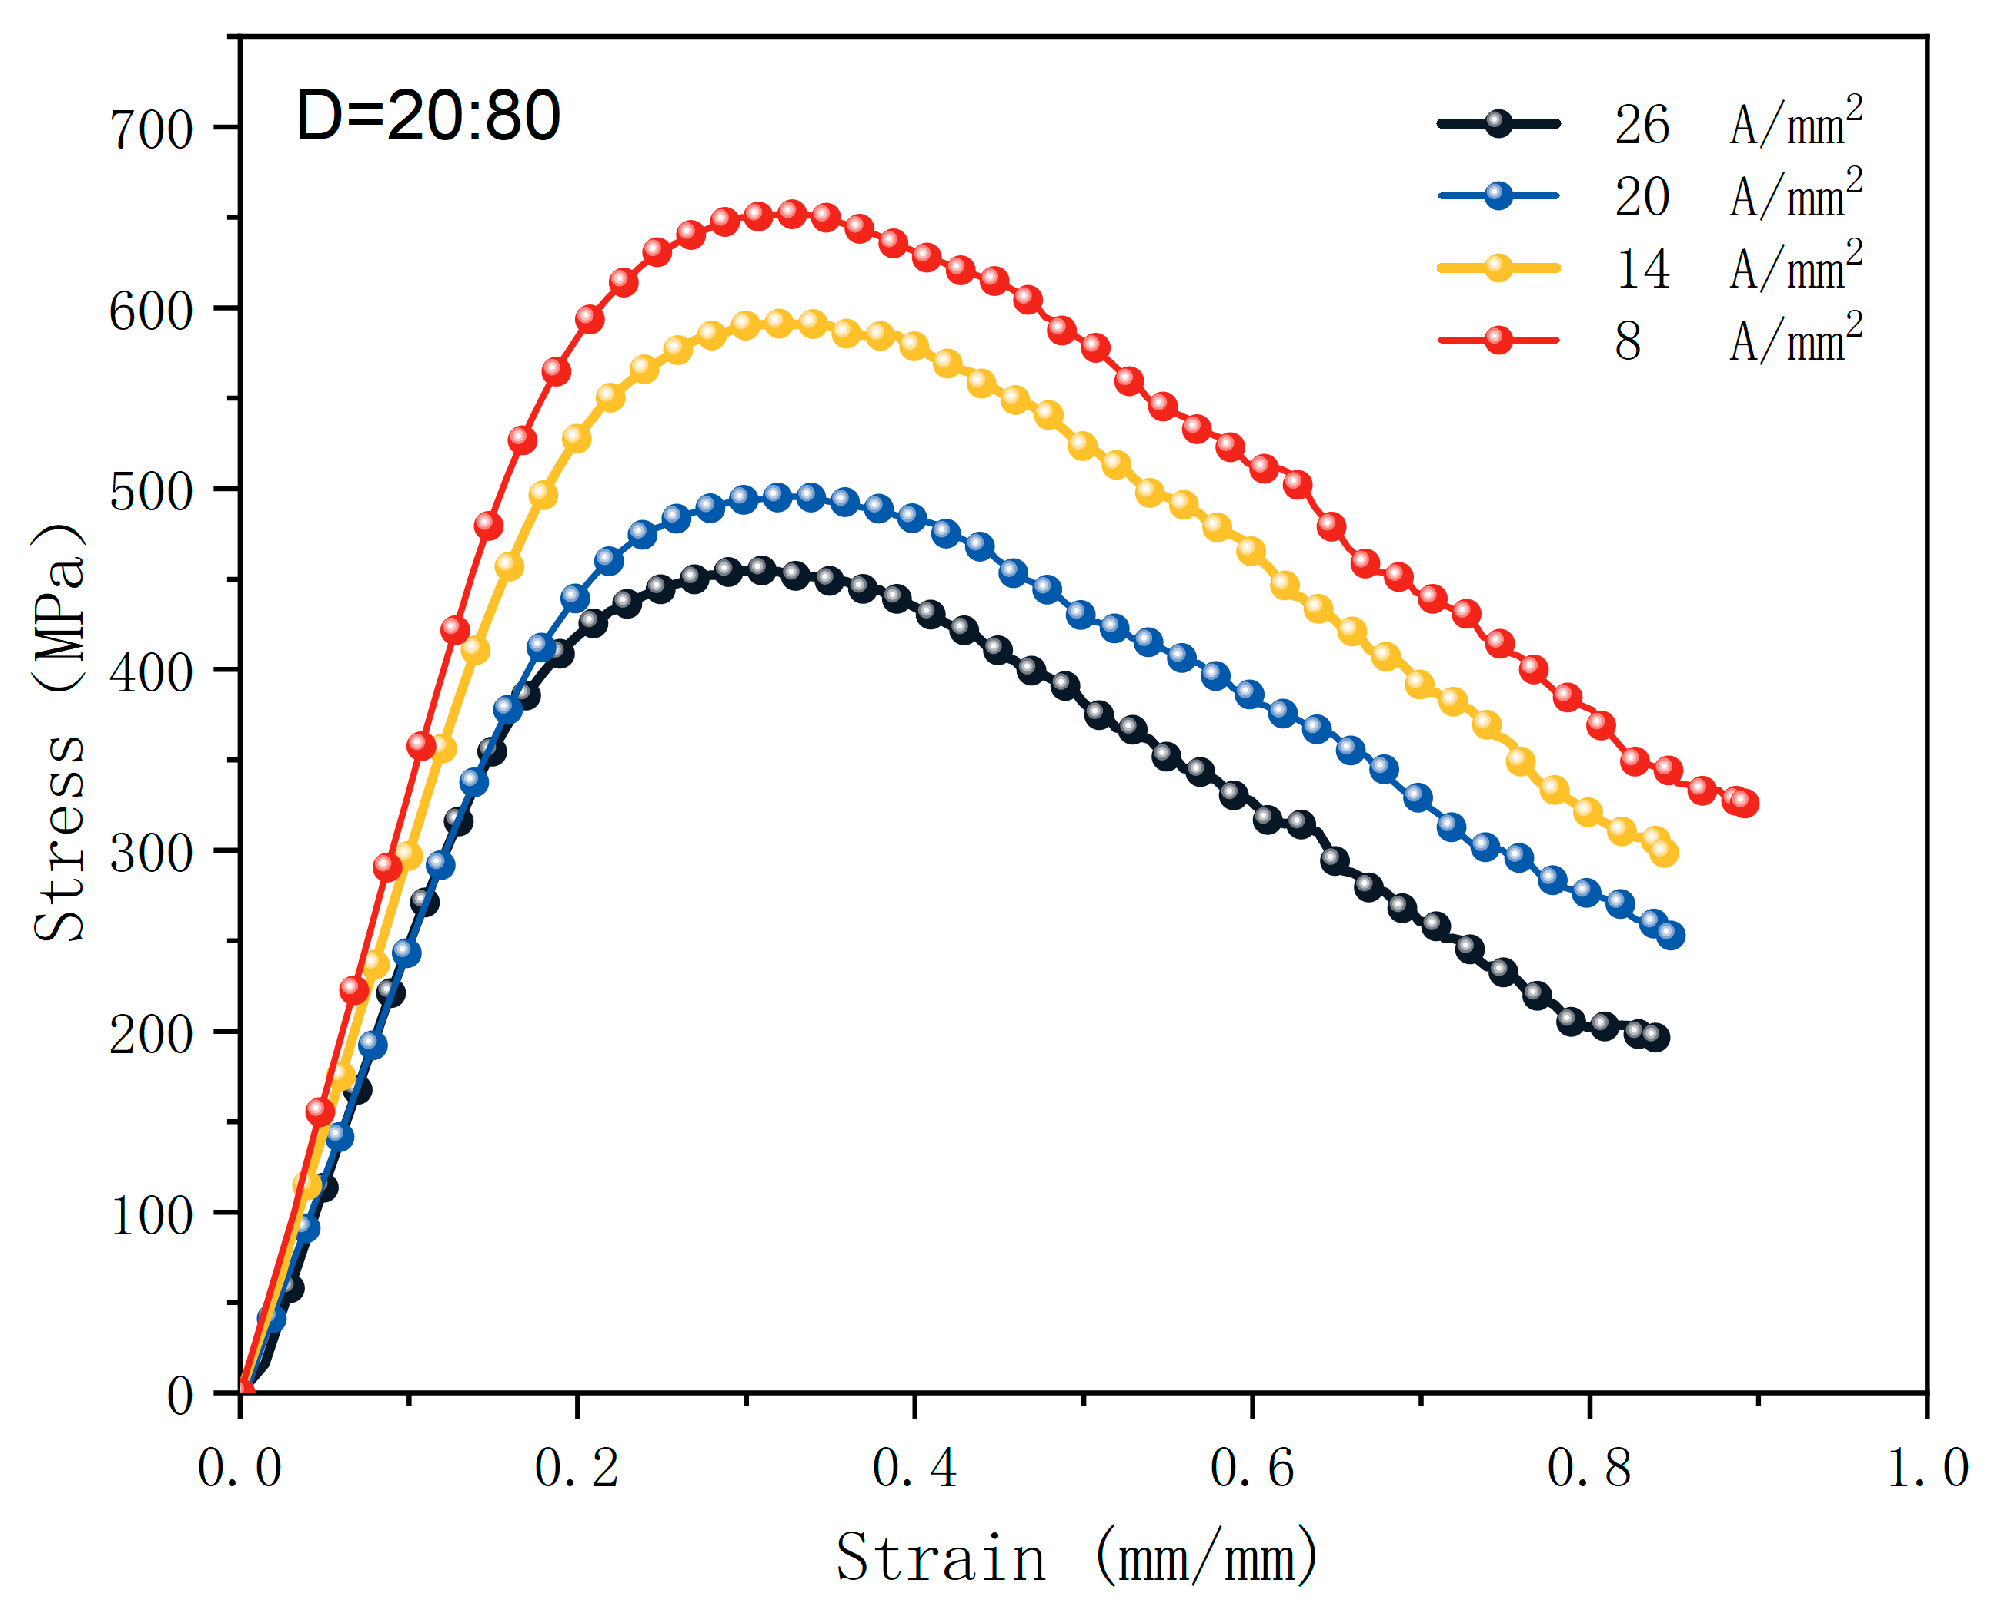
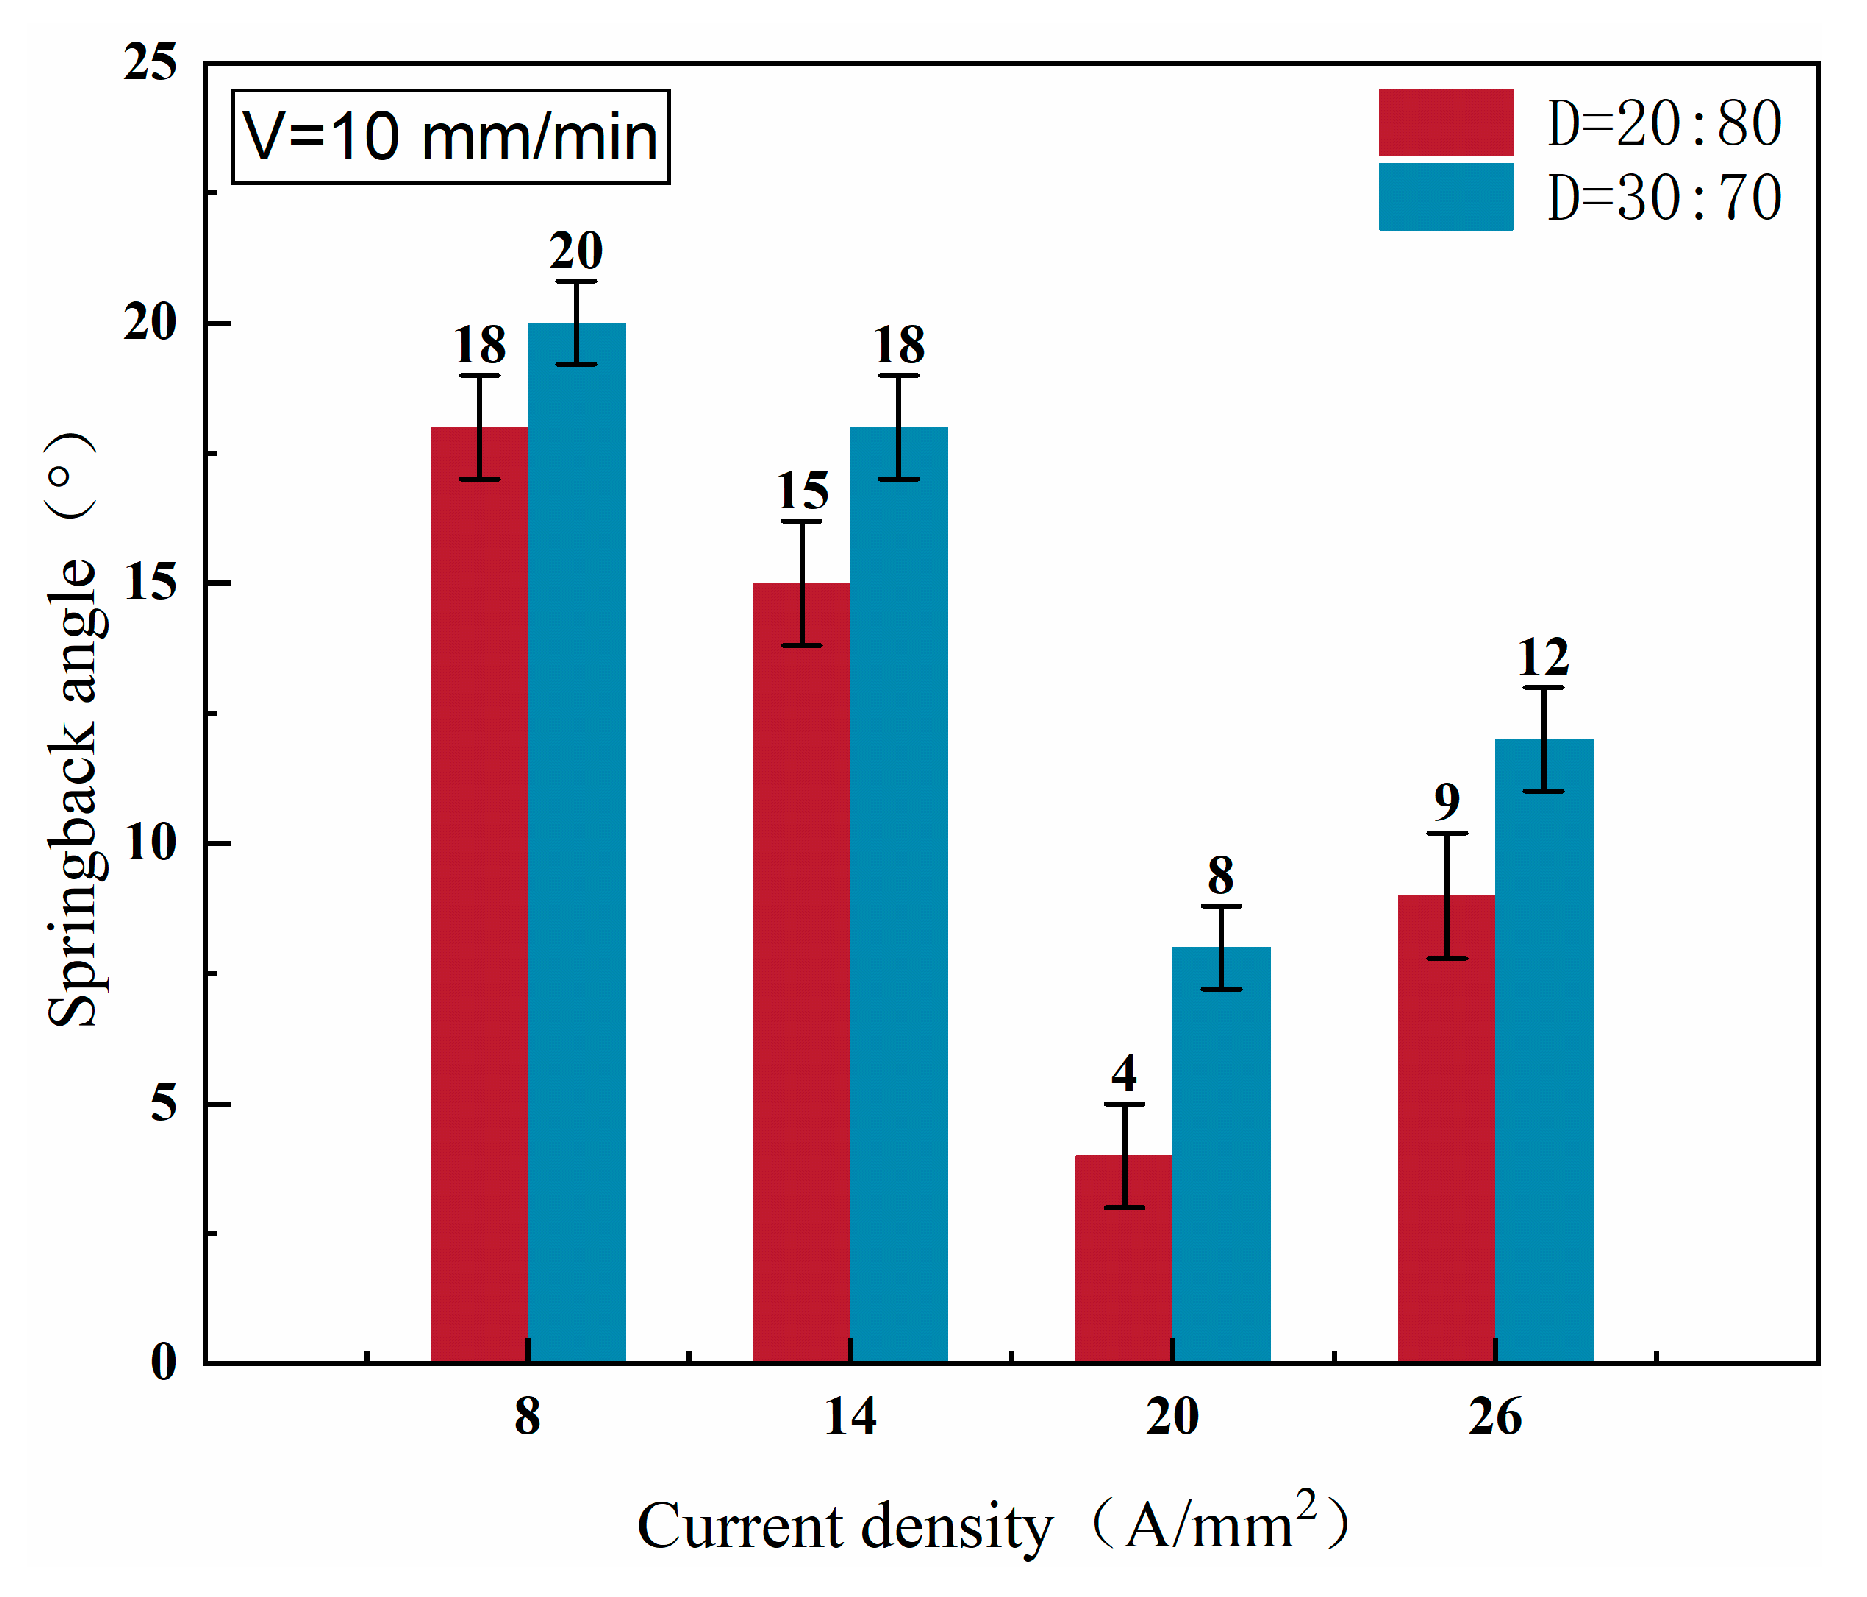
4.5. Effect of Different Current Densities on Stress-Strain and Angle of Rebound
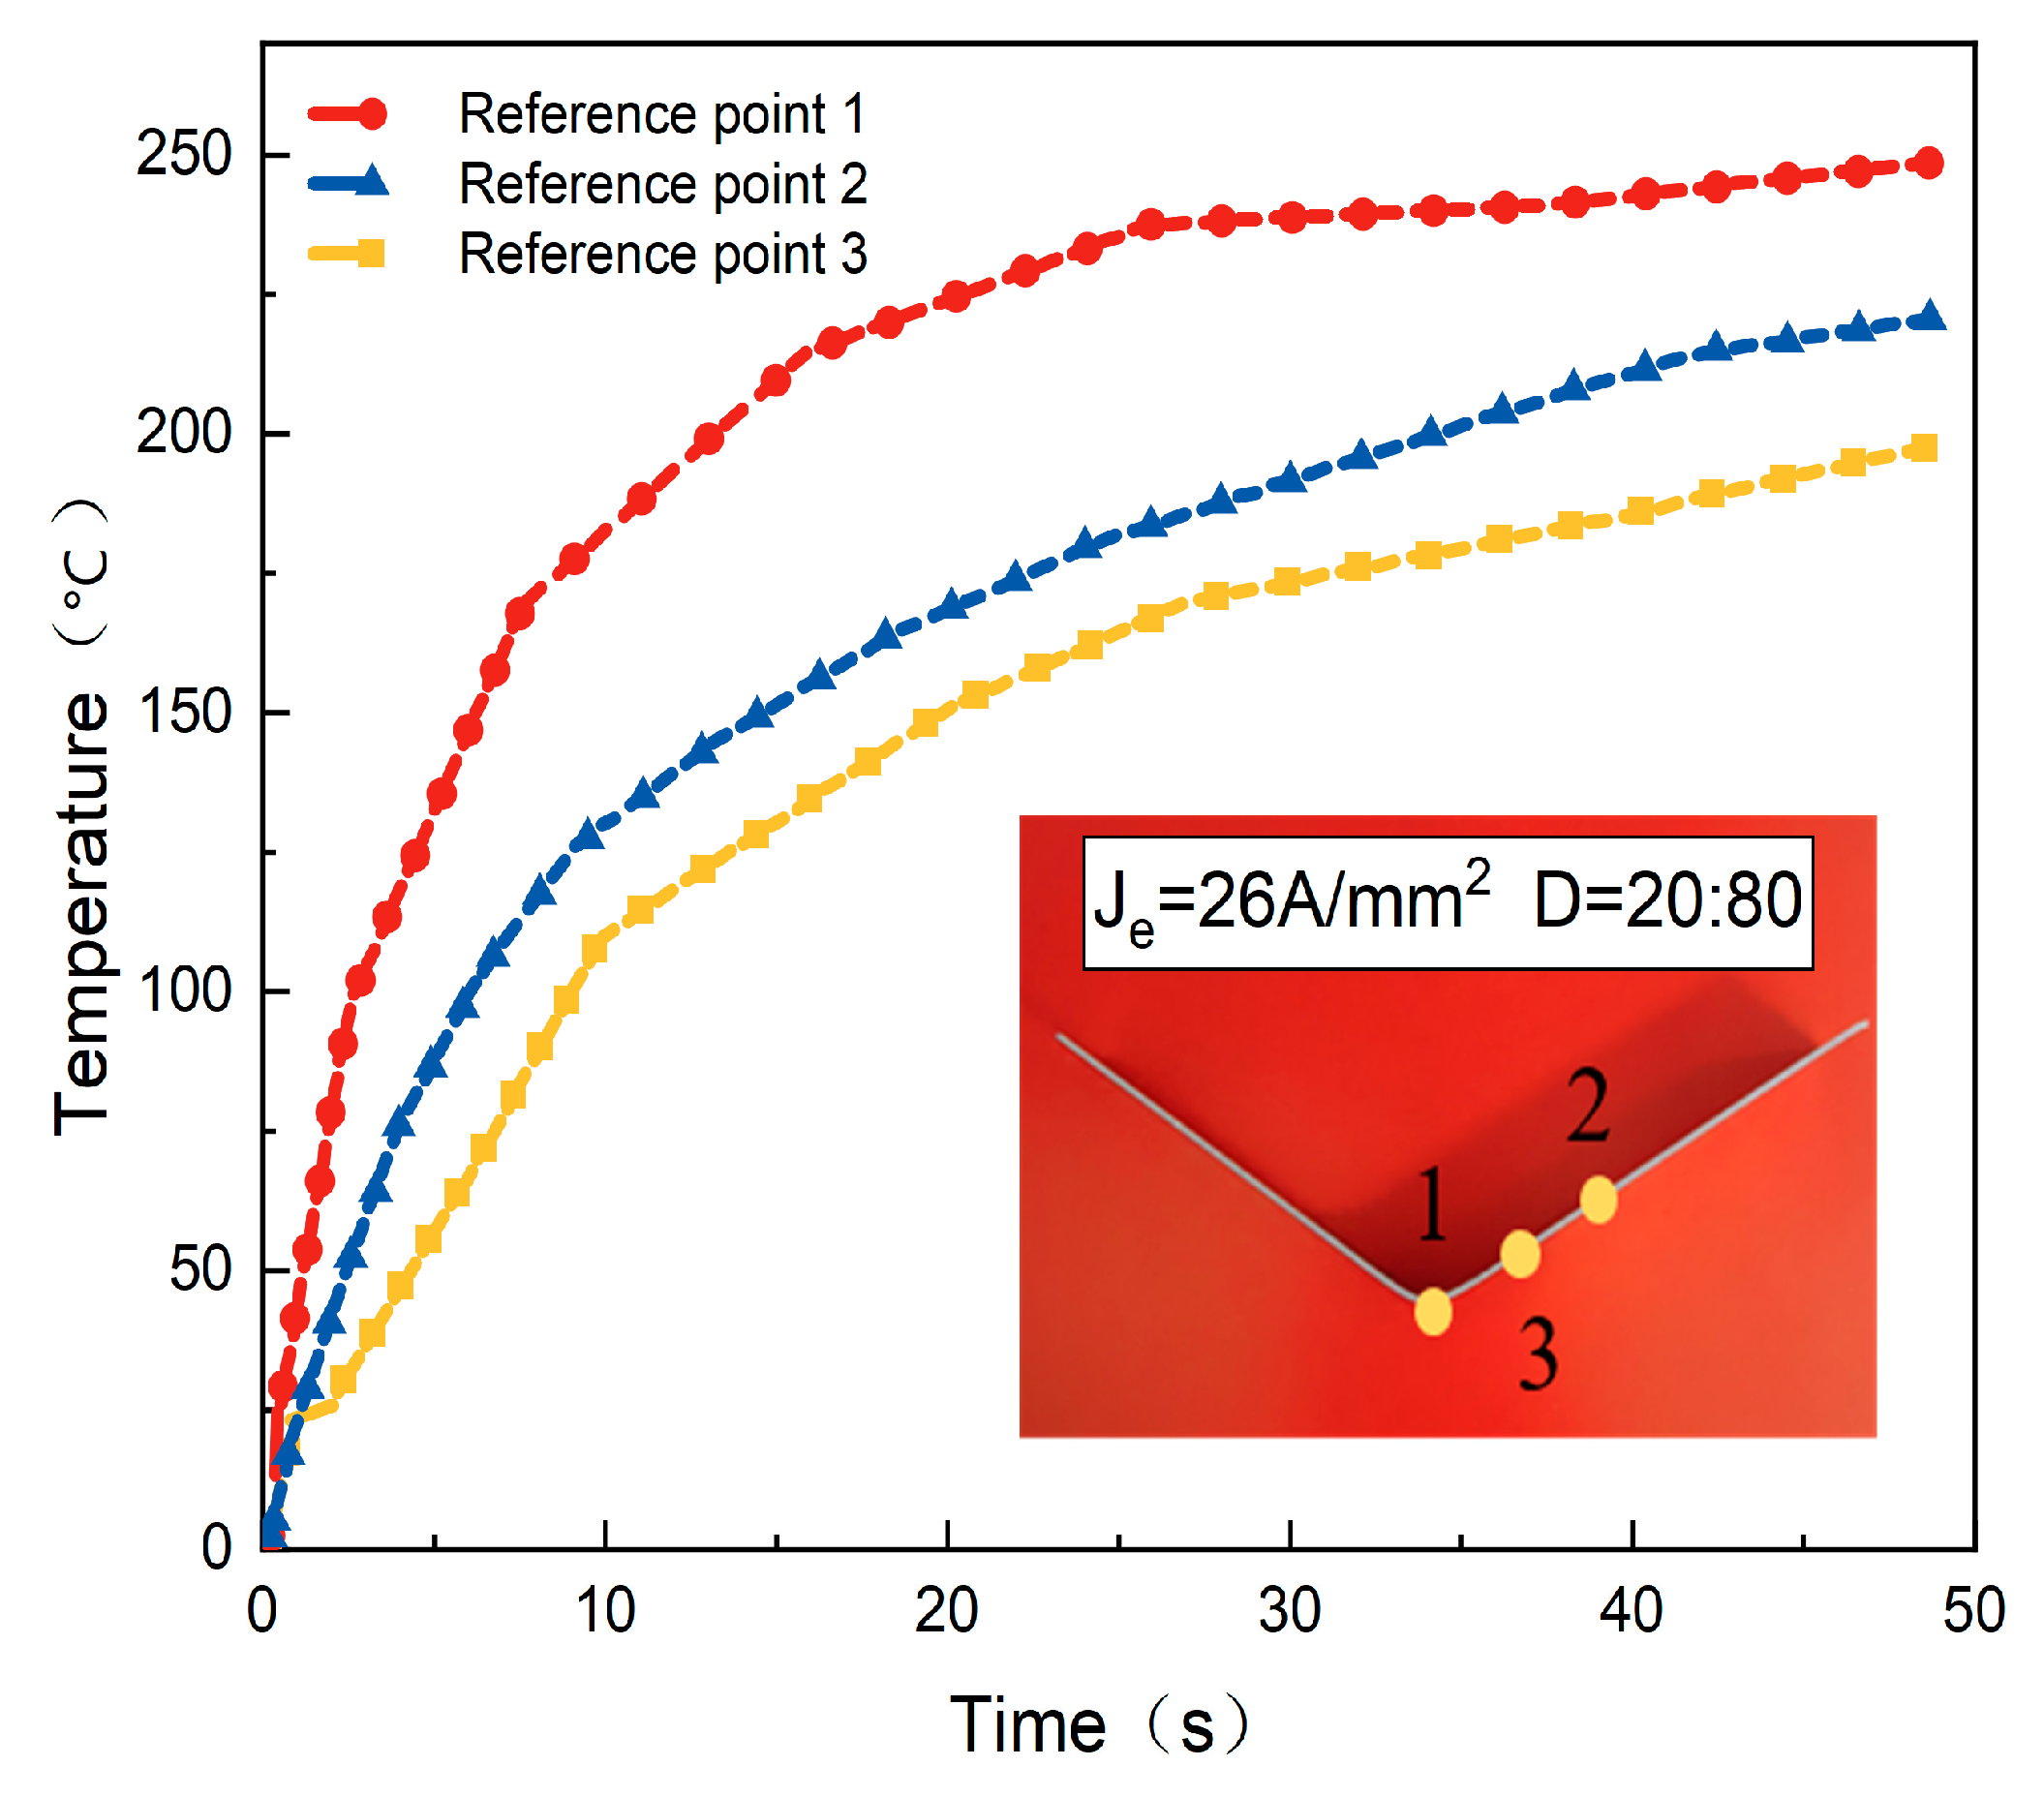
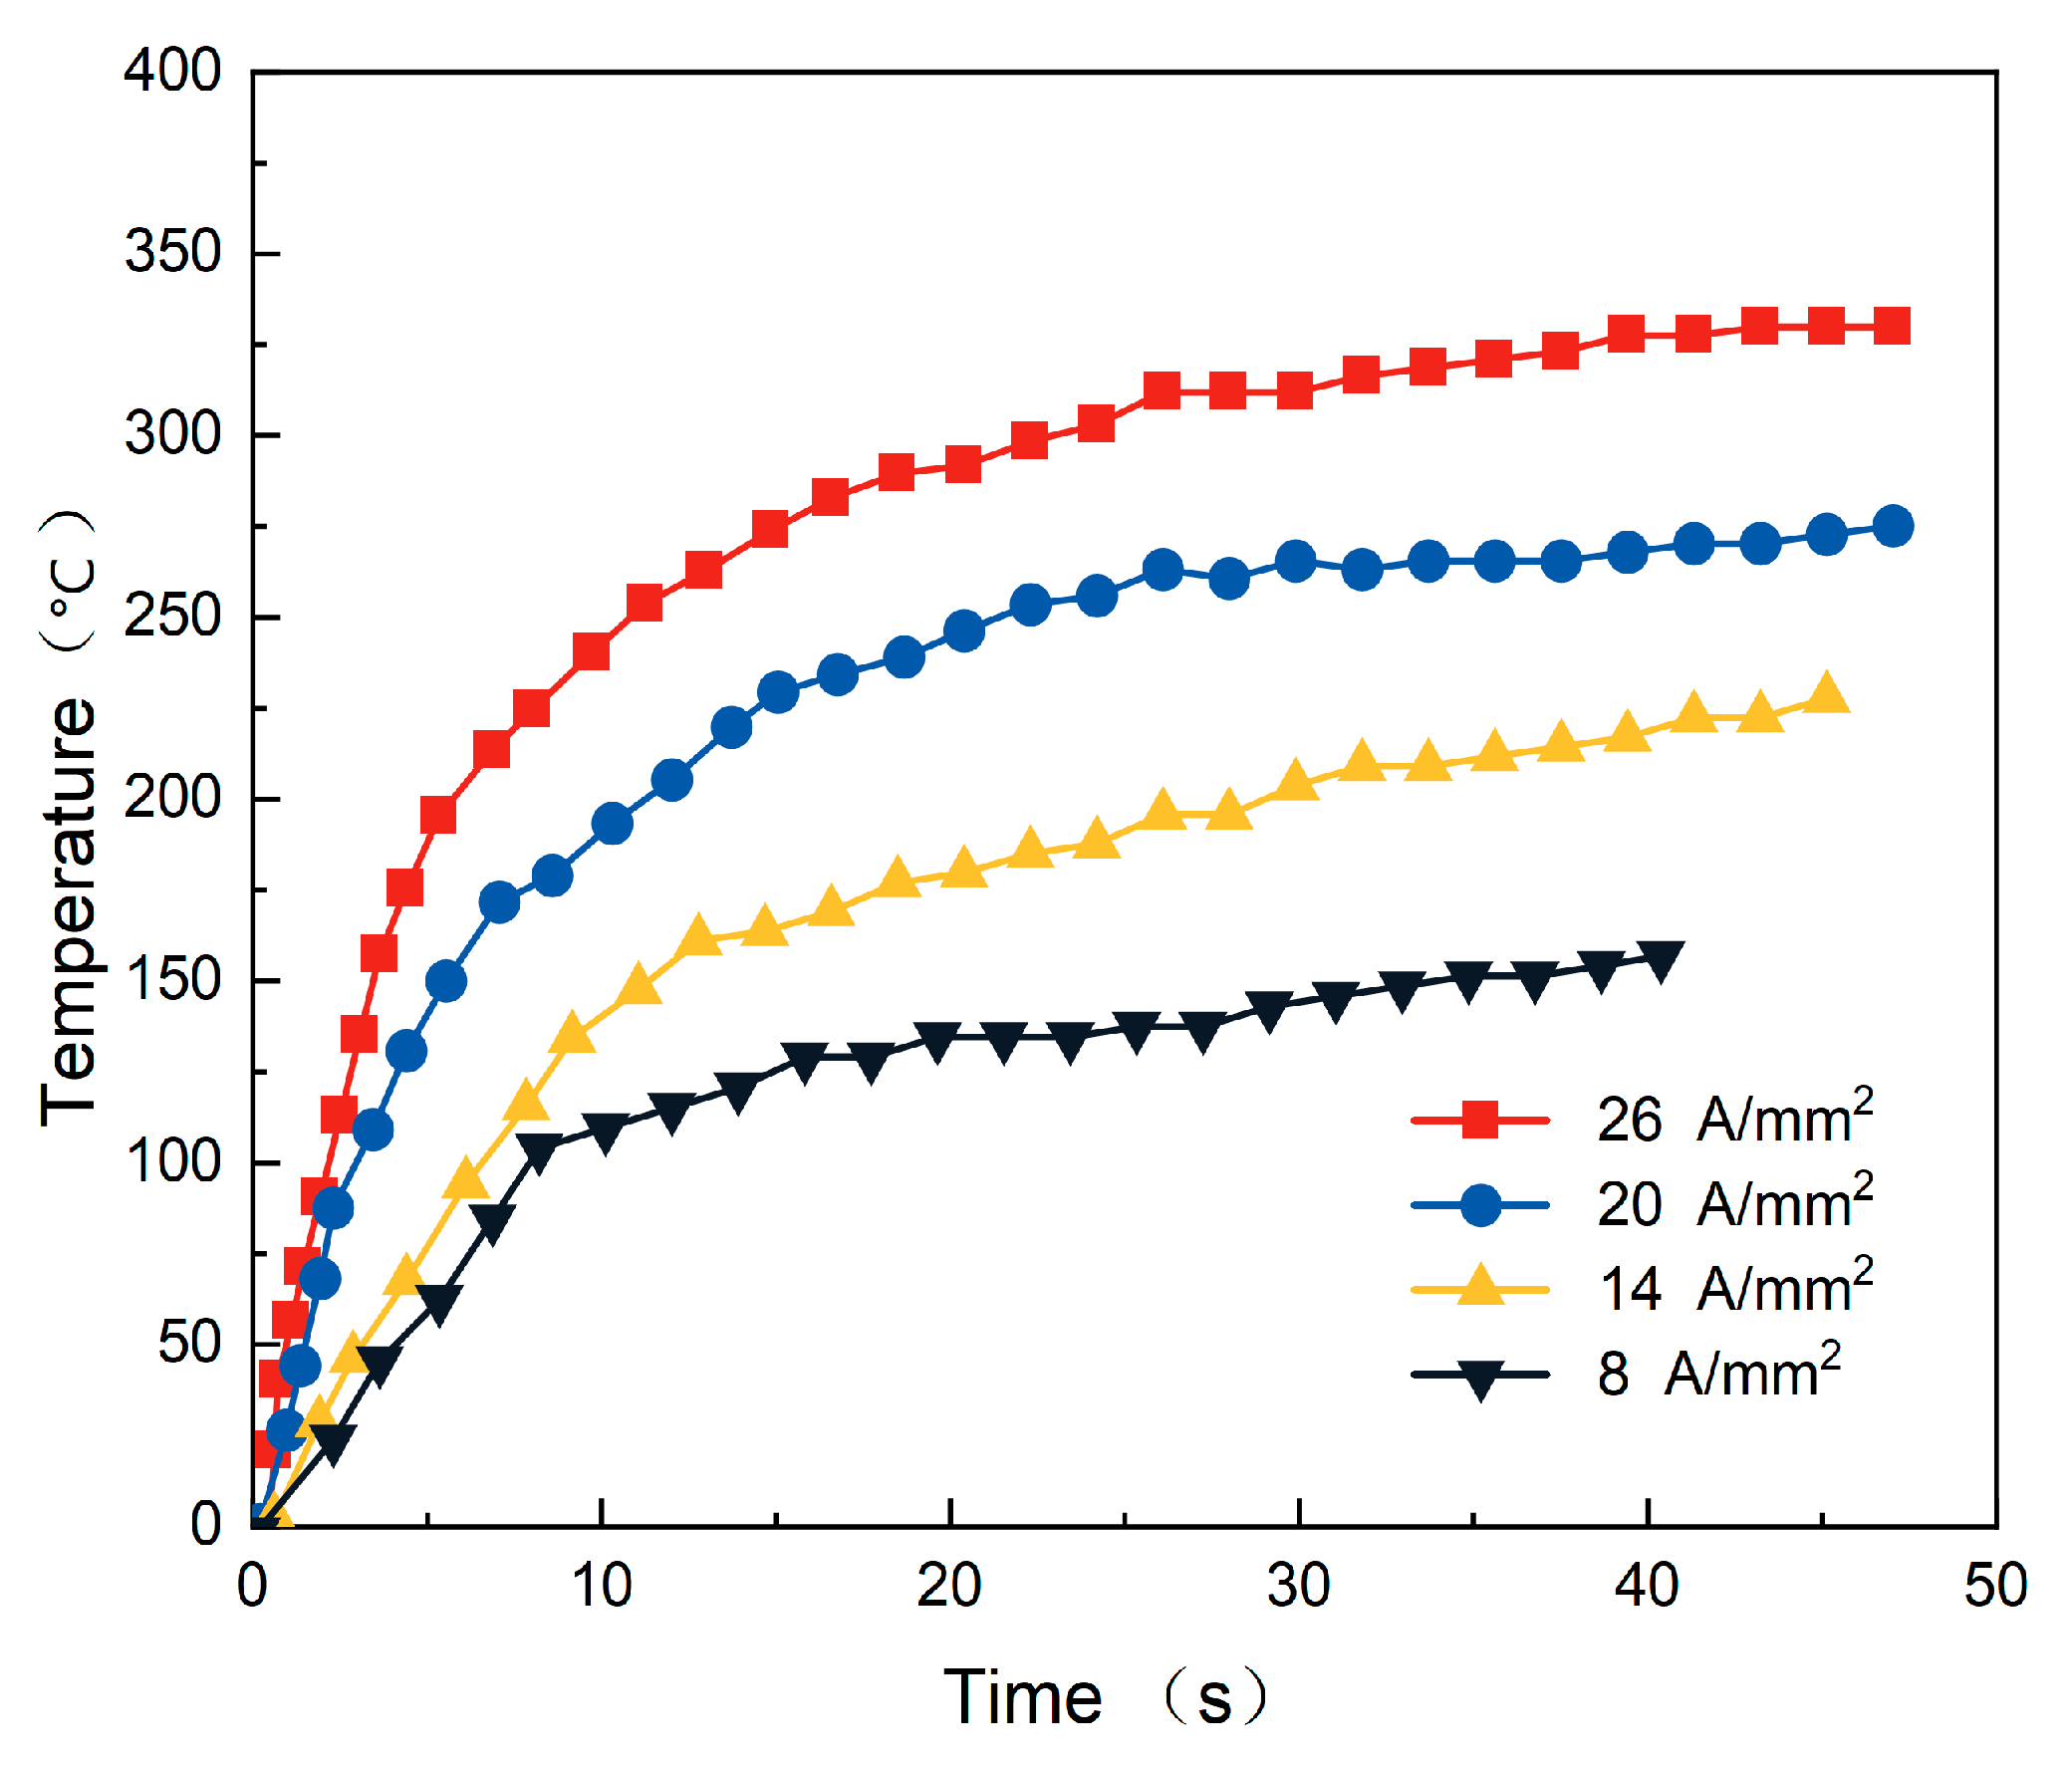
4.6. Effect of Different Current Densities on Temperature
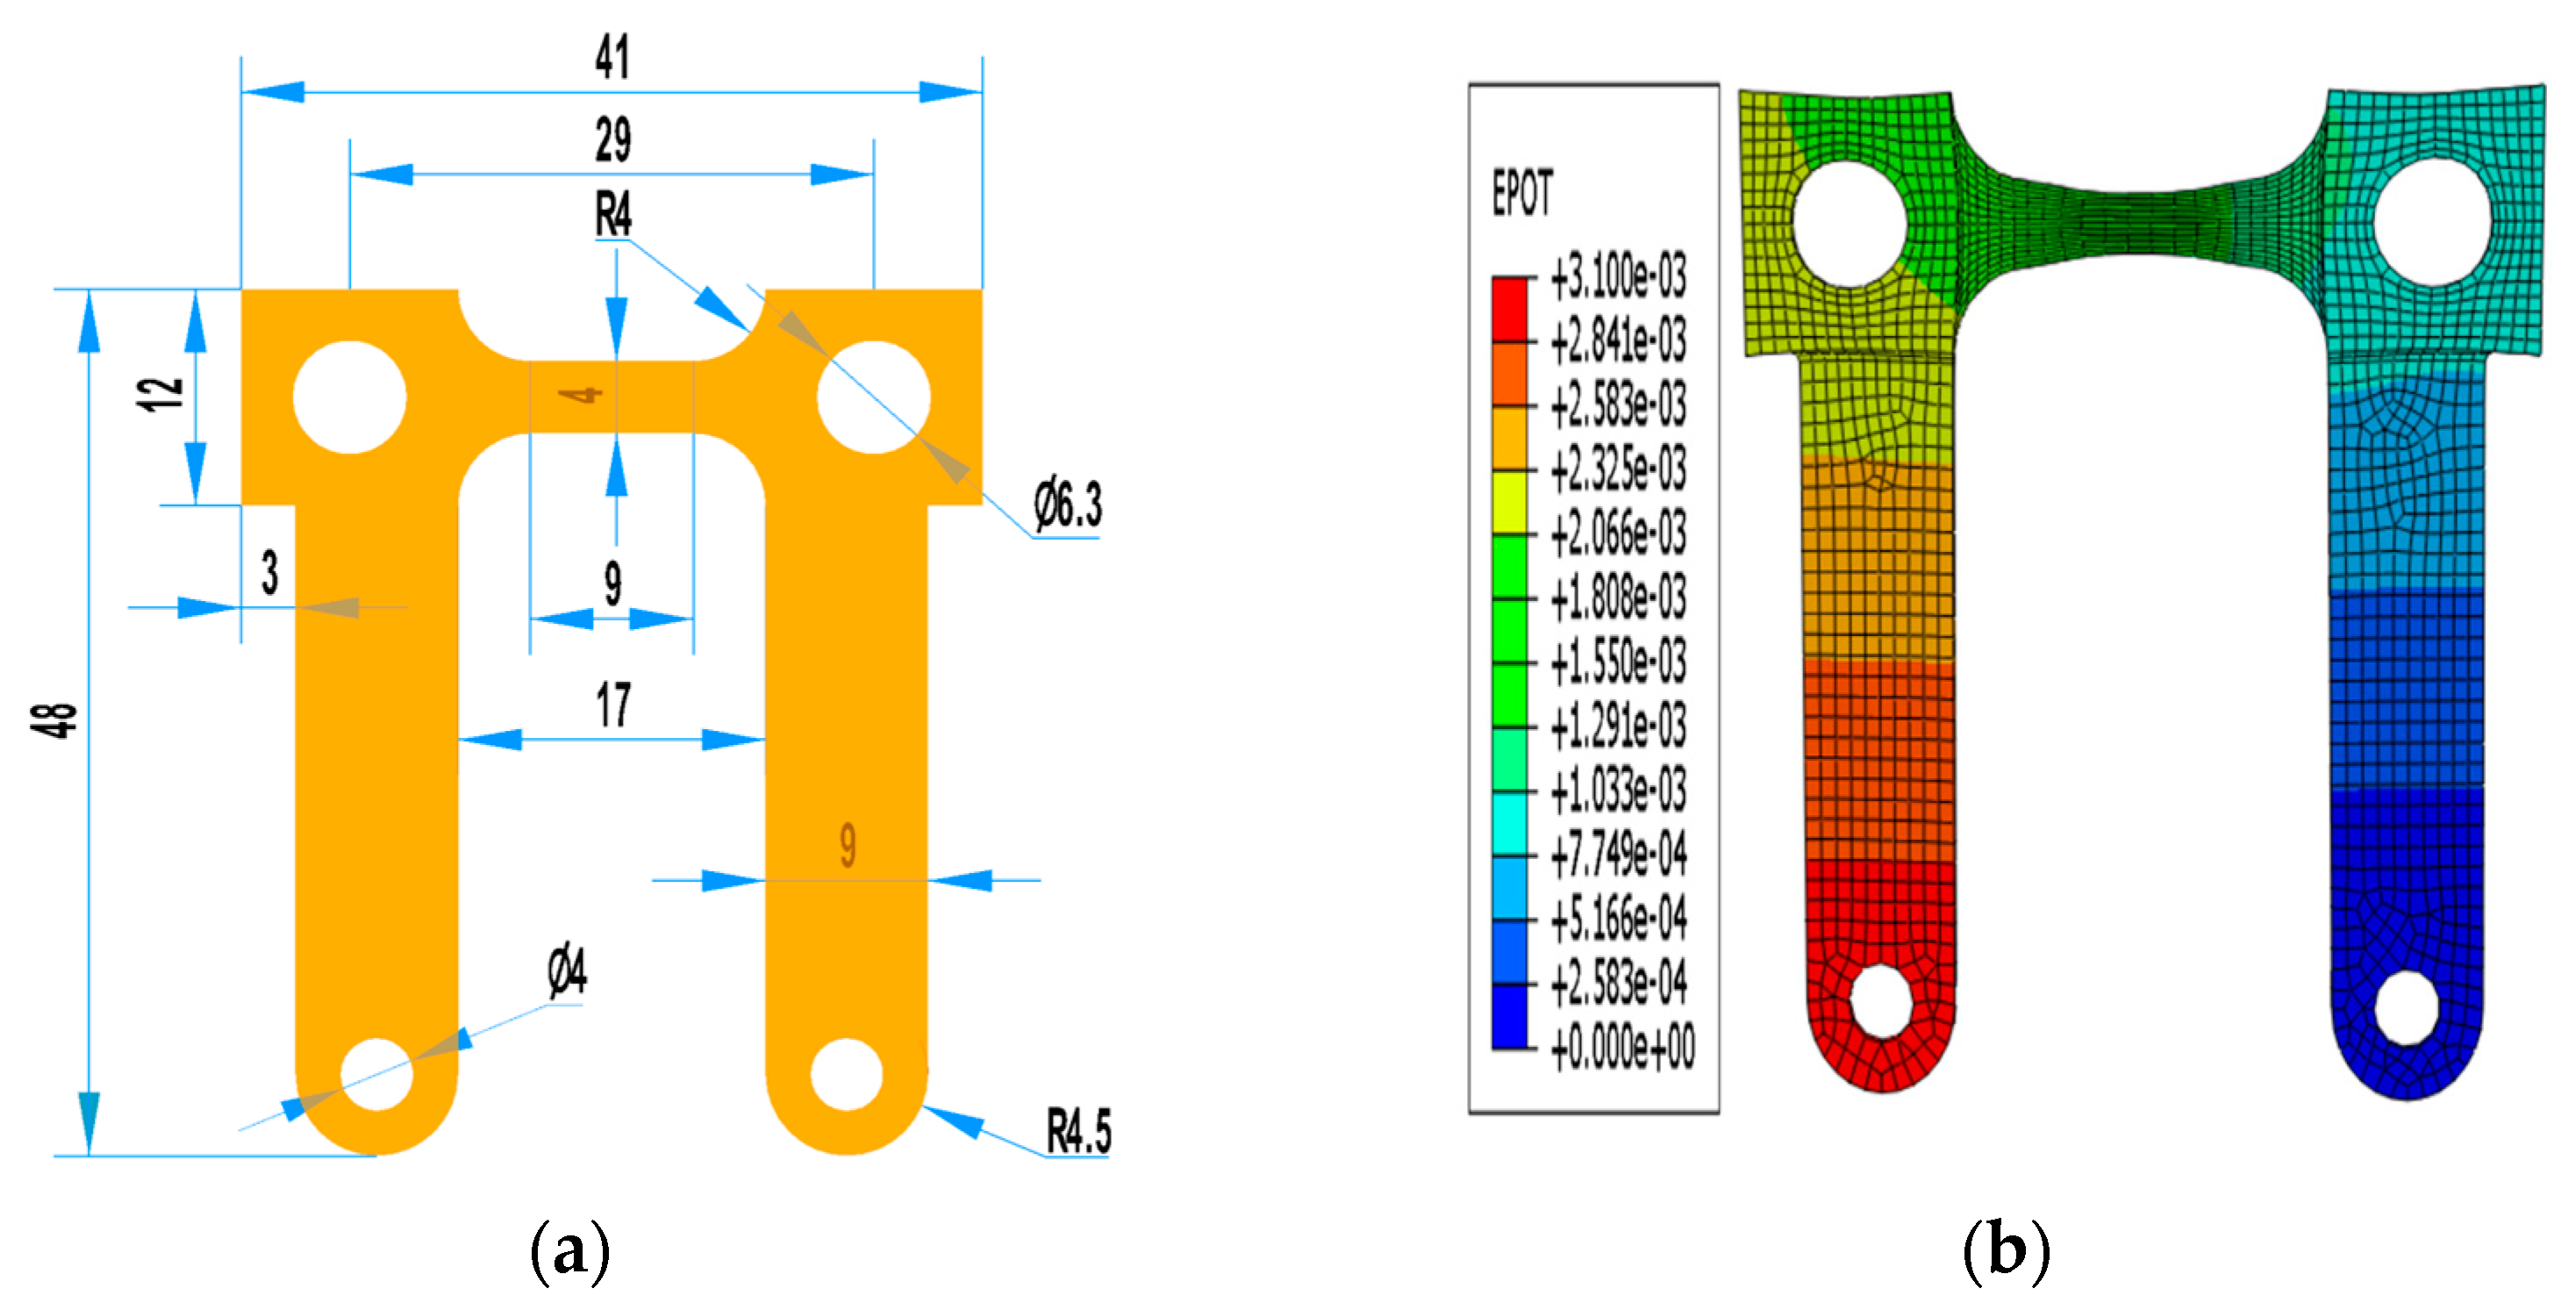
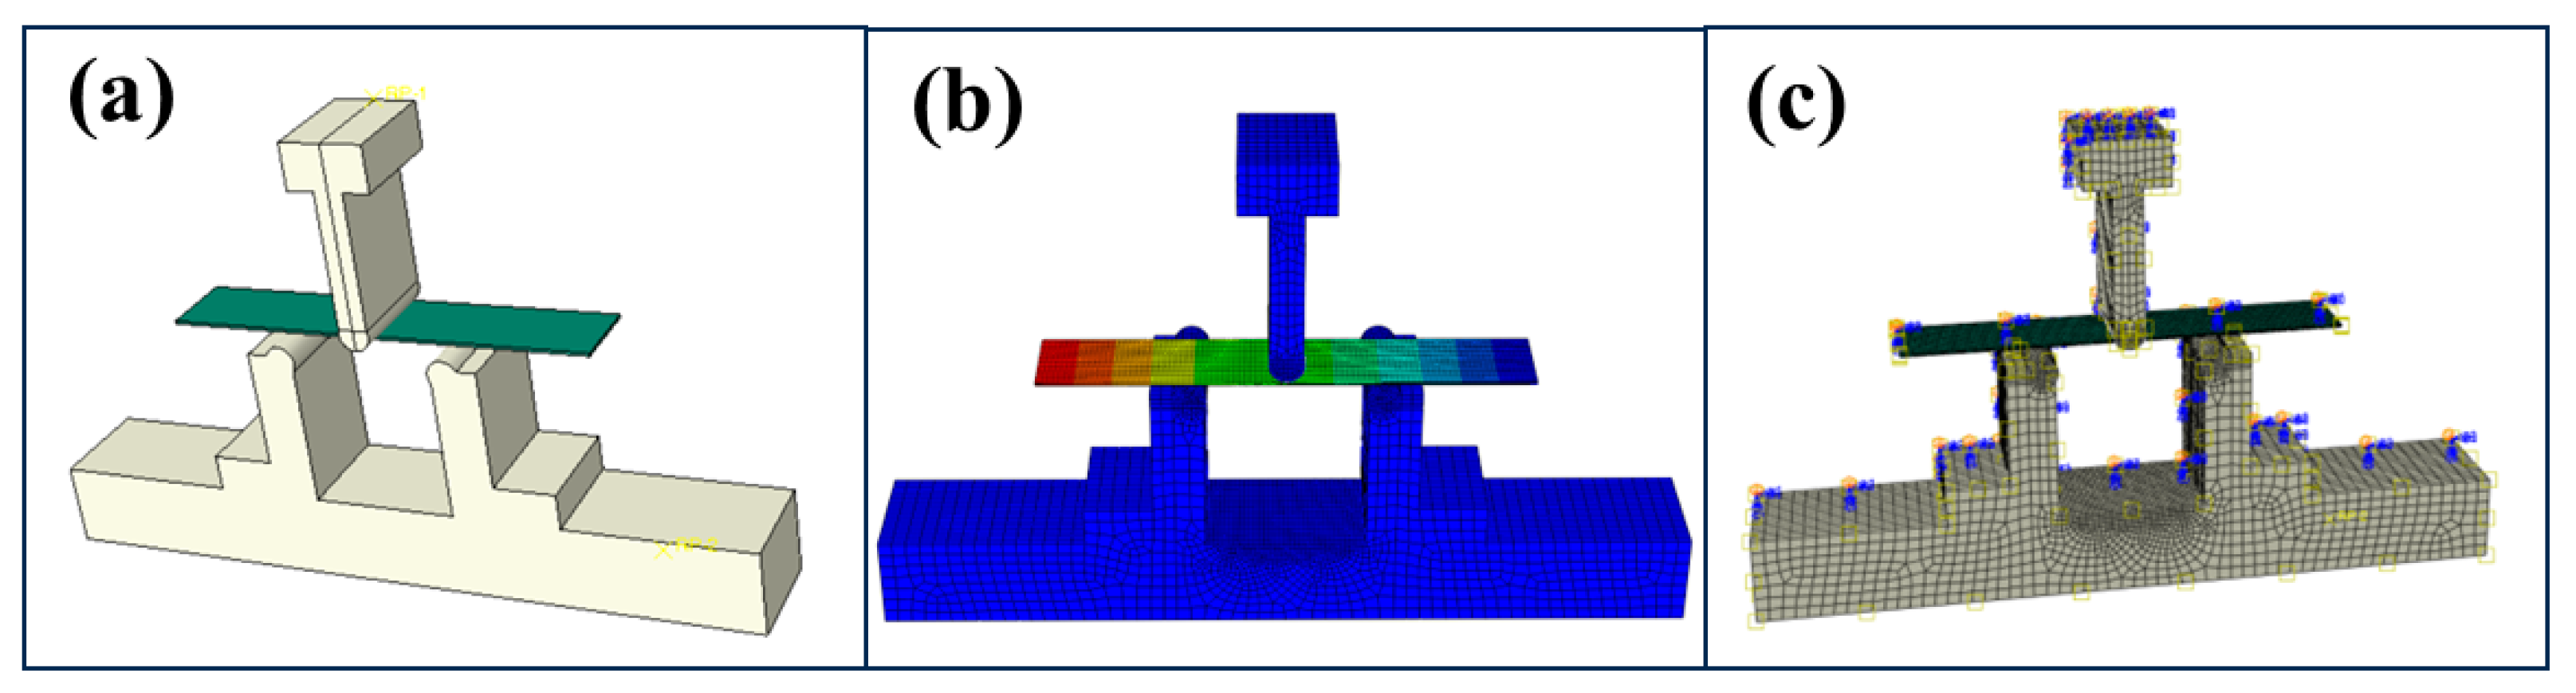
4.7. Numerical Simulation of Three-Point Bending
- (1)
- Modeling and Material Properties
- (2)
- Mesh division and rigid body constraints
- (3)
- Boundary conditions and analysis step
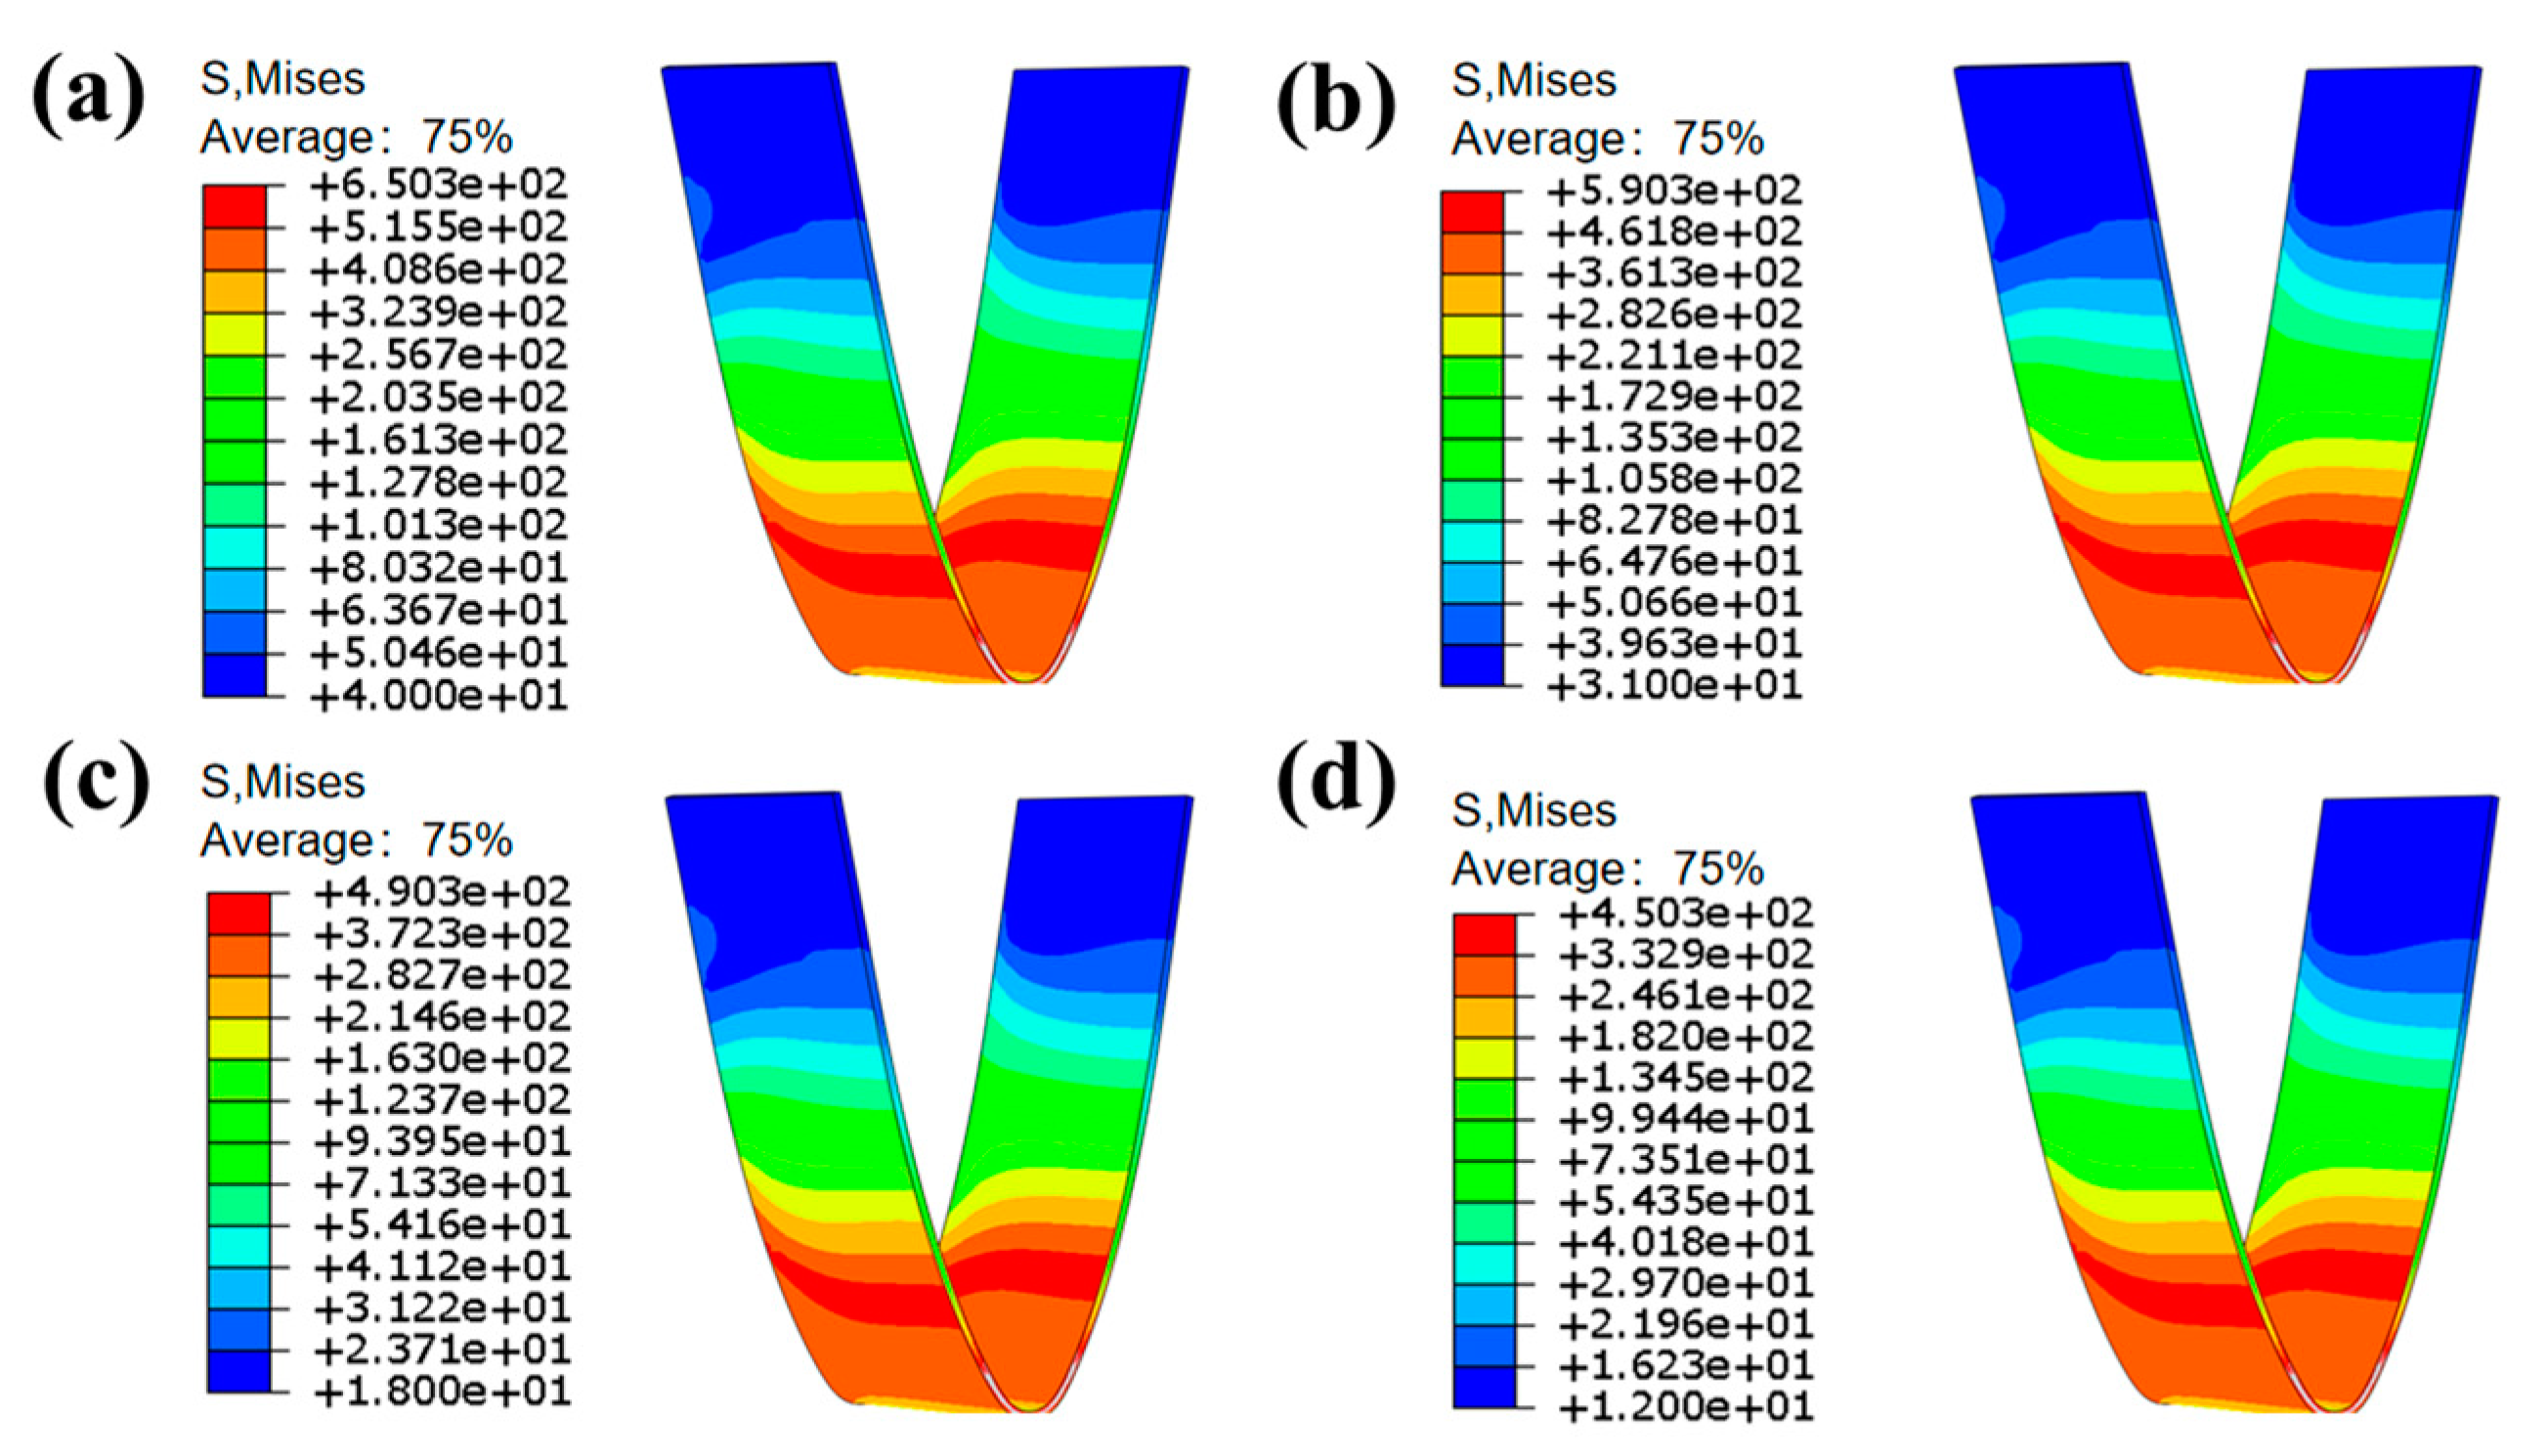
4.8. Bending Stress Field Analysis
5. Conclusions
- (1)
- Based on the electrically assisted tensile test platform, the variation law of yield strength of the 7075-T6 aluminum alloy was obtained. The yield strength decreases with the increase in the current density.
- (2)
- Through the decoupling of thermal and non-thermal effects, it was found that compared with traditional electric furnace heating, electrically assisted heating reduces yield strength and increases elongation. The higher the current density, the greater the electroplastic effect coefficient, and pure electroplasticity can be used to reduce the forming temperature.
- (3)
- A thermal electroplasticity constitutive equations was constructed, and through subroutine and error analysis, it was found that the correlation between strain rate 1 s−1 was as high as 0.99, with a minimum average relative error of 2.26% and a root mean square error of 5.68 MPa.
- (4)
- The verification of the electrically assisted three-point bending example shows that, as the current density increases, the springback angle decreases, the rebound suppression effect is better, the bending stress decreases with the increase in the current density, and the yield cross-section of stress significantly decreases.
Author Contributions
Funding
Data Availability Statement
Acknowledgments
Conflicts of Interest
References
- Dalong, L.; Yanting, L.; Enlin, Y.; Yi, H.; Feng, L. Theoretical and experimental study of the drawing force under a current pulse. Int. J. Adv. Manuf. Technol. 2018, 97, 1047–1051. [Google Scholar] [CrossRef]
- Li, C.; Xu, Z.; Peng, L.; Lai, X. An electric-pulse-assisted stamping process towards springback suppression and precision fabrication of micro channels. Int. J. Mech. Sci. 2022, 218, 107081. [Google Scholar] [CrossRef]
- Stolyarov, V.; Misochenko, A. A Pulsed Current Application to the Deformation Processing of Materials. Materials 2023, 16, 6270. [Google Scholar] [CrossRef] [PubMed]
- Liu, J.; Jia, D.; Fu, Y.; Kong, X.; Lv, Z.; Zeng, E.; Gao, Q. Electroplasticity effects: From mechanism to application. Int. J. Adv. Manuf. Technol. 2023, 131, 3267–3286. [Google Scholar] [CrossRef]
- Lv, Z.; Zhou, Y.; Zhan, L.; Zang, Z.; Zhou, B.; Qin, S. Electrically assisted deep drawing on high-strength steel sheet. Int. J. Adv. Manuf. Technol. 2020, 112, 763–767. [Google Scholar] [CrossRef]
- Mai, J.; Peng, L.; Lin, Z.; Lai, X. Experimental study of electrical resistivity and flow stress of stainless steel 316L in electroplastic deformation. Mater. Sci. Eng. A 2011, 528, 3539–3544. [Google Scholar] [CrossRef]
- Tskhondiya, G.A.; Beklemishev, N.N. Simulating the effect of a high density electric current pulse on the stress field during plastic deformation. Int. J. Mater. Form. 2011, 5, 157–162. [Google Scholar] [CrossRef]
- Okazaki, K.; Kagawa, M.; Conrad, H. A study of the electroplastic effect in metals. Scr. Metall. 1978, 12, 1063–1068. [Google Scholar] [CrossRef]
- Molotskii, M.; Fleurov, V. Magnetic effects in electroplasticity of metals. Phys. Rev. B 1995, 52, 15829. [Google Scholar] [CrossRef]
- Goldman, P.D.; Motowidlo, L.R.; Galligan, J.M. The absence of an electroplastic effect in lead at 4.2 K. Scr. Metall. 1981, 15, 353–356. [Google Scholar] [CrossRef]
- Fan, R.; Magargee, J.; Hu, P.; Cao, J. Influence of grain size and grain boundaries on the thermal and mechanical behavior of 70/30 brass under electrically-assisted deformation. Mater. Sci. Eng. A 2013, 574, 218–225. [Google Scholar] [CrossRef]
- Magargee, J.; Morestin, F.; Cao, J. Characterization of Flow Stress for Commercially Pure Titanium Subjected to Electrically Assisted Deformation. J. Eng. Mater. Technol. 2013, 135, 041003. [Google Scholar] [CrossRef]
- Roh, J.H.; Seo, J.J.; Hong, S.T.; Kim, M.J.; Han, H.N.; Roth, J.T. The mechanical behavior of 5052-H32 aluminum alloys under a pulsed electric current. Int. J. Plast. 2014, 58, 84–99. [Google Scholar] [CrossRef]
- Hu, L.; Jiang, S.; Zhou, T.; Tu, J.; Shi, L.; Chen, Q.; Yang, M. Multiscale Modeling of Polycrystalline NiTi Shape Memory Alloy under Various Plastic Deformation Conditions by Coupling Microstructure Evolution and Macroscopic Mechanical Response. Materials 2017, 10, 1172. [Google Scholar] [CrossRef]
- Ao, D.; Chu, X.; Yang, Y.; Lin, S.; Gao, J. Effect of electropulsing on springback during V-bending of Ti-6Al-4V titanium alloy sheet. Int. J. Adv. Manuf. Technol. 2018, 96, 3197–3207. [Google Scholar] [CrossRef]
- Wang, X.; Xu, C.; Li, Y.; Wang, B. Respective roles of the thermal and electromigration effect in AZ31 Mg alloy during low-frequency electropulsing tension. J. Alloys Compd. 2020, 846, 156074. [Google Scholar] [CrossRef]
- Dinh, K.A.; Hong, S.T.; Choi, S.J.; Kim, M.J.; Han, H.N. The Effect of Pre-strain and Subsequent Electrically Assisted Annealing on the Mechanical Behaviors of Two Different Aluminum Alloys. Int. J. Precis. Eng. Manuf. 2020, 21, 2345–2358. [Google Scholar] [CrossRef]
- Fu, J.; Ma, D.; Fan, L.; Yu, Z.; Yin, H.; Ma, C. Tribological Properties of Solid Lubricant WS(2) in Dimples on the Cylinder of Diesel Engine at High Temperature. Materials 2022, 15, 8161. [Google Scholar] [CrossRef] [PubMed]
- Jordan, A.; Kinsey, B.L. Investigation of thermal and mechanical effects during electrically-assisted microbending. J. Mater. Process. Technol. 2015, 221, 1–12. [Google Scholar] [CrossRef]
- Wagner, K.C.; Byrd, G.D. Evaluating the effectiveness of clinical medical librarian programs: A systematic review of the literature. J. Med. Libr. Assoc. 2012, 92 (Suppl. S4), J. [Google Scholar]
- Shi, C.; Mao, W.; Chen, X.G. Evolution of activation energy during hot deformation of AA7150 aluminum alloy. Mater. Sci. Eng. A 2013, 571, 83–91. [Google Scholar] [CrossRef]
- Islam, Z.; Wang, B.; Haque, A. Current density effects on the microstructure of zirconium thin films. Scr. Mater. 2018, 144, 18–21. [Google Scholar] [CrossRef]
- Li, X.; Yang, W.; Xu, D.; Ju, K.; Chen, J. A new ductile fracture criterion considering both shear and tension mechanisms on void coalescence. Int. J. Damage Mech. 2020, 30, 374–398. [Google Scholar] [CrossRef]
- Xu, S.; Xiao, X.; Zhang, H.; Cui, Z. Electroplastic Effects on the Mechanical Responses and Deformation Mechanisms of AZ31 Mg Foils. Materials 2022, 15, 1339. [Google Scholar] [CrossRef]
- Song, P.; Li, X.; Ding, W.; Chen, J. Electroplastic Tensile Behavior of 5A90 Al–Li Alloys. Acta Metall. Sin. (Engl. Lett.) 2014, 27, 642–648. [Google Scholar] [CrossRef]
- Indhiarto, I.; Shimizu, T.; Yang, M. Effect of Peak Current Density on Tensile Properties of AZ31B Magnesium Alloy. Materials 2021, 14, 1457. [Google Scholar] [CrossRef]
- Dobras, D.; Bruschi, S.; Simonetto, E.; Rutkowska-Gorczyca, M.; Ghiotti, A. The Effect of Direct Electric Current on the Plastic Behavior of AA7075-T6 Aluminum Alloy in Different States of Hardening. Materials 2020, 14, 73. [Google Scholar] [CrossRef] [PubMed]
- Shang, H.; Wang, S.; Zhou, L.; Lou, Y. Neural network-based ductile fracture model for 5182-O aluminum alloy considering electroplastic effect in electrically-assisted processing. Eng. Fract. Mech. 2023, 290, 109476. [Google Scholar] [CrossRef]
- Zhou, Y.; Zhu, R.; Zuo, X.; Xie, W. Tribo-electrical behaviors of CNTs-MoS2/Cu composites under sliding electrical contact with brass. Tribol. Int. 2023, 180, 108207. [Google Scholar] [CrossRef]
- Zhao, Y.C.; Wan, M.; Meng, B.; Xu, J.; Shan, D.B. Pulsed current assisted forming of ultrathin superalloy sheet: Experimentation and modeling. Mater. Sci. Eng. A 2019, 767, 138412. [Google Scholar] [CrossRef]
- Ruszkiewicz, B.J.; Grimm, T.; Ragai, I.; Mears, L.; Roth, J.T. A Review of Electrically-Assisted Manufacturing With Emphasis on Modeling and Understanding of the Electroplastic Effect. J. Manuf. Sci. Eng. 2017, 139, 110801. [Google Scholar] [CrossRef]
- Zhou, M.; Lin, Y.C.; Deng, J.; Jiang, Y.Q. Hot tensile deformation behaviors and constitutive model of an Al–Zn–Mg–Cu alloy. Mater. Des. 2014, 59, 141–150. [Google Scholar] [CrossRef]
- Sheng, Y.; Hua, Y.; Wang, X.; Zhao, X.; Chen, L.; Zhou, H.; Wang, J.; Berndt, C.C.; Li, W. Application of High-Density Electropulsing to Improve the Performance of Metallic Materials: Mechanisms, Microstructure and Properties. Materials 2018, 11, 185. [Google Scholar] [CrossRef] [PubMed]
- Xu, Z.; Guo, P.; Peng, L.; Lai, X. Electroplasticity mechanism study based on dislocation behavior of Al6061 in tensile process. J. Alloys Compd. 2022, 910, 164890. [Google Scholar]
- Lu, J.; Song, Y.; Zhou, P.; Lin, J. Rheological behavior and dynamic softening mechanism of AA7075-T6 sheet under isothermal tensile deformation. J. Mater. Res. Technol. 2020, 9, 9784–9797. [Google Scholar] [CrossRef]
- Xia, J.; Dou, S. Theory and finite element simulation analysis of plate U-bending forming. Mech. Des. Manuf. 2022, 238–241. [Google Scholar]


| Element | Cu | Mg | Fe | Ti | Zn | Si | Cr | Al |
|---|---|---|---|---|---|---|---|---|
| Quality score | 1.63 | 3.161 | 0.1309 | 0.2113 | 6.10 | 0.03 | 0.22 | Balanced |
| Tensile Strength (MPa) | Yield Strength (MPa) | Elongation (%) | Elastic Modulus (GPa) |
|---|---|---|---|
| 547.5 | 490.7 | 13.4 | 70 |
| Current Density ) | Pulse Frequency (HZ) | Title Strain Rate (s−1) | Temperature (°C) |
|---|---|---|---|
| 8 | 200 | 0.01 | 150 |
| 14 | 200 | 0.1 | 210 |
| 20 | 200 | 1 | 270 |
| 26 | 200 | 10 | 330 |
| Percentage of Electrophysical Effects ) | ) | ) | ) | ) |
|---|---|---|---|---|
| Thermoplastic (%) | 48.882 | 50.029 | 66.986 | 75.726 |
| Electrically plasticized | 50.254 | 52.859 | 69.817 | 80.481 |
| Purely electro plastic | 5.025 | 5.353 | 4.056 | 5.908 |
| 8 | 0.385 |
| 14 | 0.461 |
| 20 | 0.482 |
| 26 | 0.523 |
| 12.81 × 10⁻⁹ | 9.454 × 10⁵ | 5.19 × 10⁻⁵ | 477 |
| Strain Rate | m | R | R2 | R2 After Adjustment |
|---|---|---|---|---|
| 10 s−1 | 0.203 | 0.98999 | 0.98009 | 0.97904 |
| 1 s−1 | 0.212 | 0.99327 | 0.98402 | 0.98318 |
| 0.1 s−1 | 0.239 | 0.99327 | 0.98658 | 0.98588 |
| 0.01 s−1 | 0.281 | 0.98541 | 0.97104 | 0.96952 |
| Strain Rate | ||
|---|---|---|
| 10 s−1 | 0.24925 | 1.69977 |
| 1 s−1 | 0.25495 | 1.38498 |
| 0.1 s−1 | 0.37355 | 1.34597 |
| 0.01 s−1 | 0.82821 | 1.33816 |
Disclaimer/Publisher’s Note: The statements, opinions and data contained in all publications are solely those of the individual author(s) and contributor(s) and not of MDPI and/or the editor(s). MDPI and/or the editor(s) disclaim responsibility for any injury to people or property resulting from any ideas, methods, instructions or products referred to in the content. |
© 2025 by the authors. Licensee MDPI, Basel, Switzerland. This article is an open access article distributed under the terms and conditions of the Creative Commons Attribution (CC BY) license (https://creativecommons.org/licenses/by/4.0/).
Share and Cite
Dou, S.; Liu, Z.; Li, Z.; Shi, H.; Zhou, K.; Xia, J. Mechanical Properties of 7075-T6 Aluminum Alloy in Electrically Assisted Forming. Metals 2025, 15, 117. https://doi.org/10.3390/met15020117
Dou S, Liu Z, Li Z, Shi H, Zhou K, Xia J. Mechanical Properties of 7075-T6 Aluminum Alloy in Electrically Assisted Forming. Metals. 2025; 15(2):117. https://doi.org/10.3390/met15020117
Chicago/Turabian StyleDou, Shasha, Zhuang Liu, Zhijun Li, Haojie Shi, Kang Zhou, and Jiansheng Xia. 2025. "Mechanical Properties of 7075-T6 Aluminum Alloy in Electrically Assisted Forming" Metals 15, no. 2: 117. https://doi.org/10.3390/met15020117
APA StyleDou, S., Liu, Z., Li, Z., Shi, H., Zhou, K., & Xia, J. (2025). Mechanical Properties of 7075-T6 Aluminum Alloy in Electrically Assisted Forming. Metals, 15(2), 117. https://doi.org/10.3390/met15020117