
Non-Destructive Determination of Surface Residual Stresses in Electron Beam Welded AISI 410 Martensitic Stainless Steel Using the Magnetic Barkhausen Noise Technique


Abstract
1. Introduction
2. Materials and Methods
2.1. Preparation and Microstructure Characterization of Specimens
2.2. Fixture Design and Welding Process
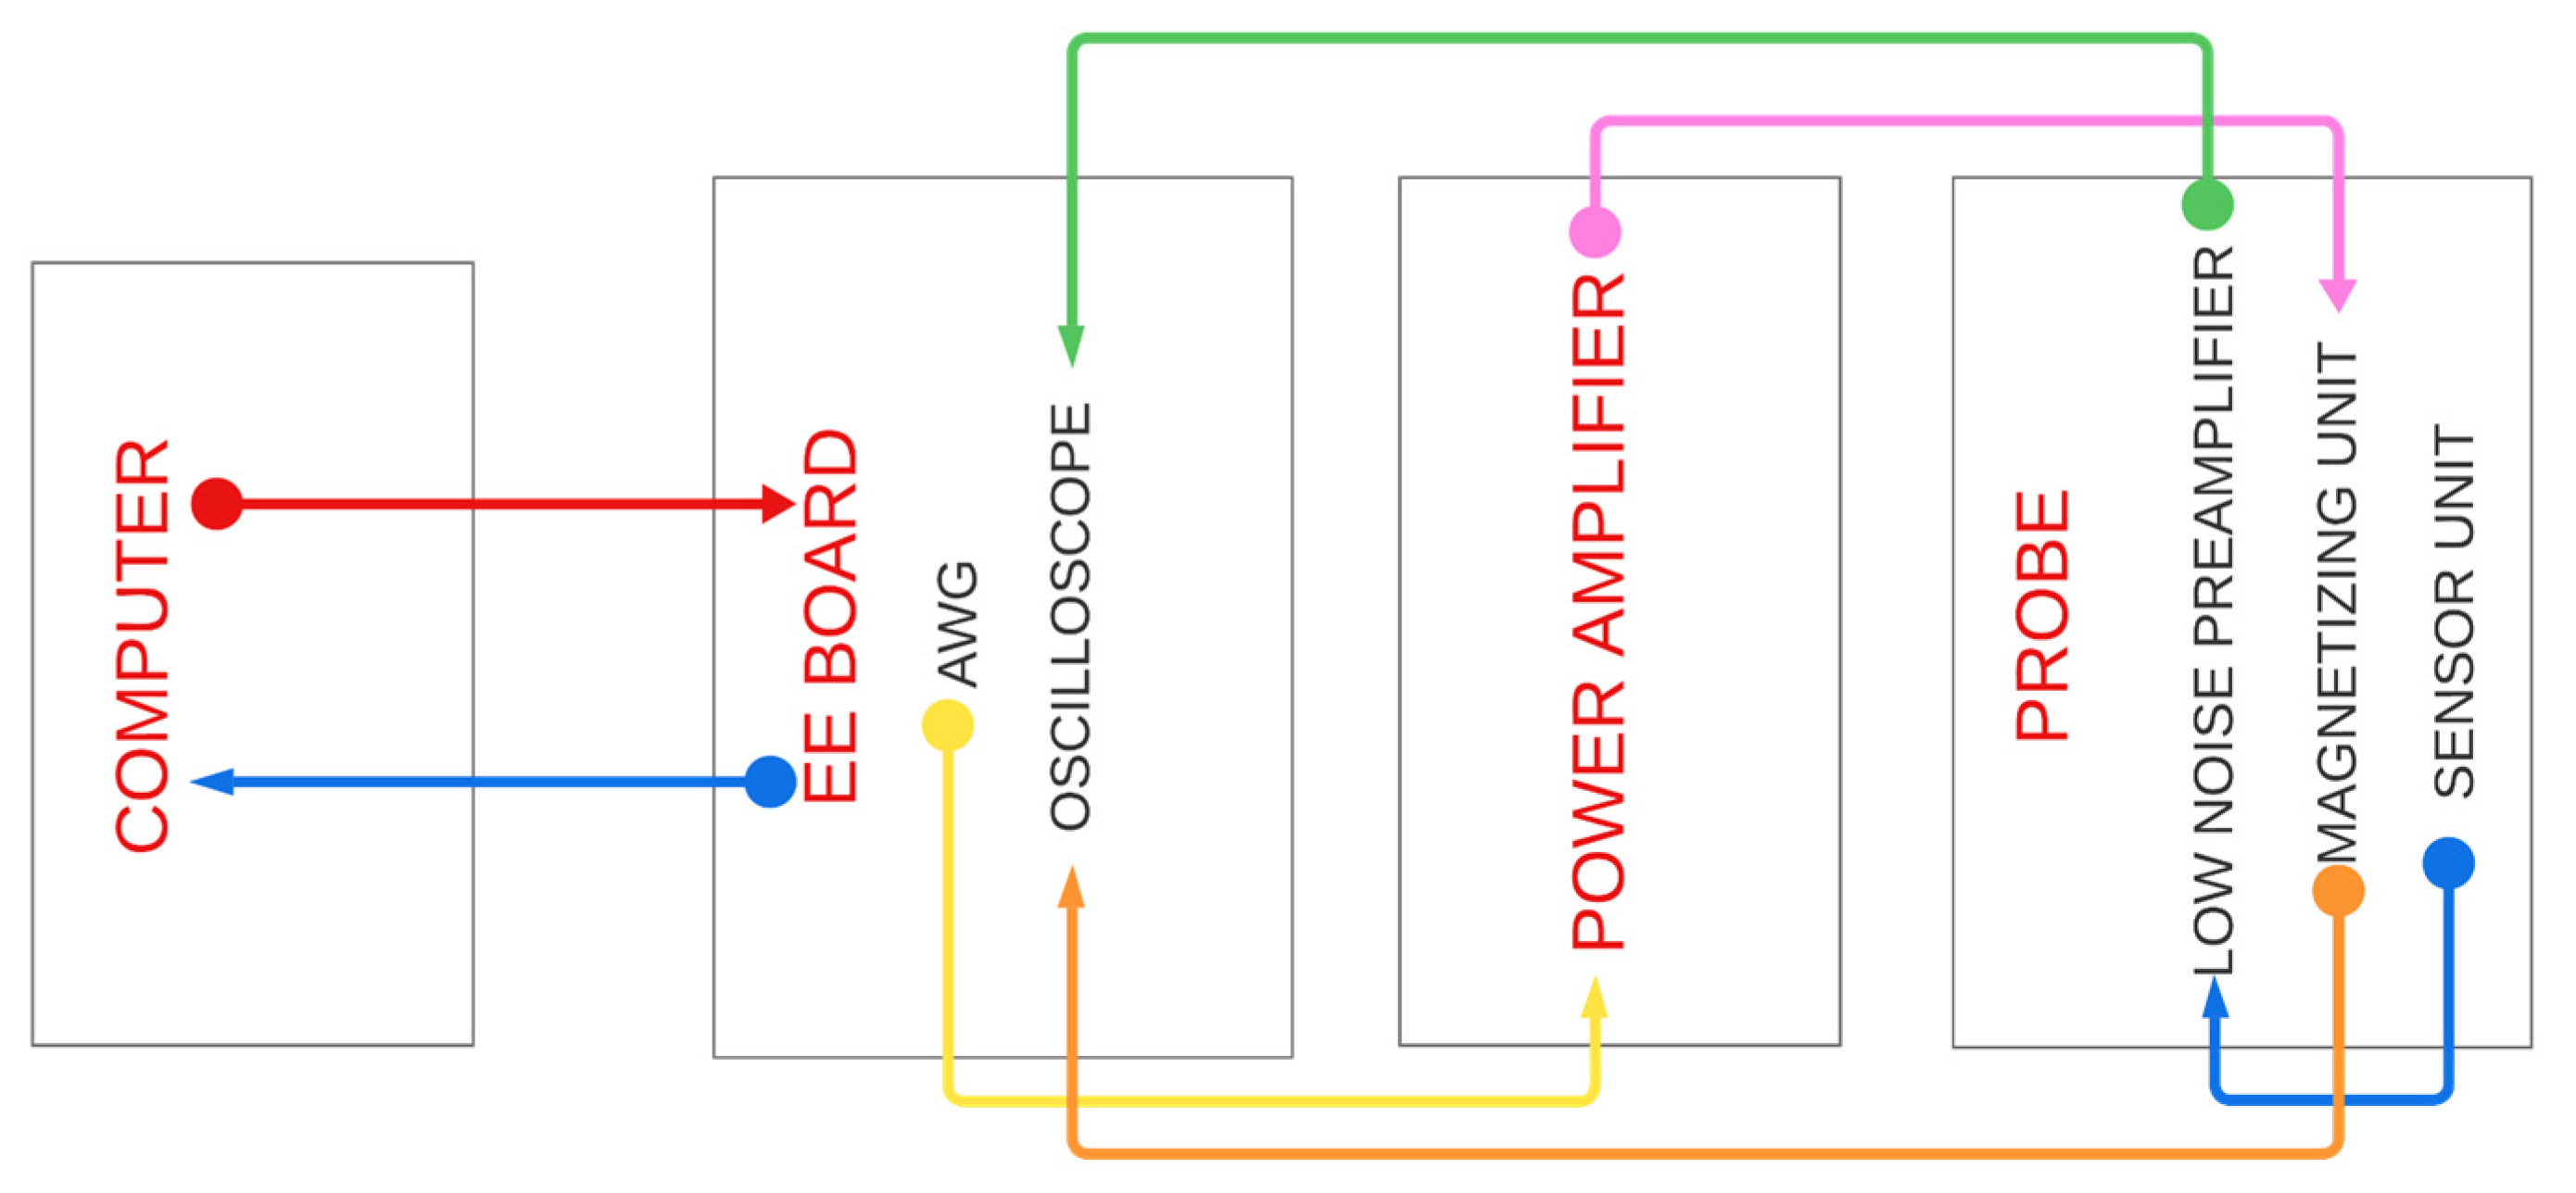
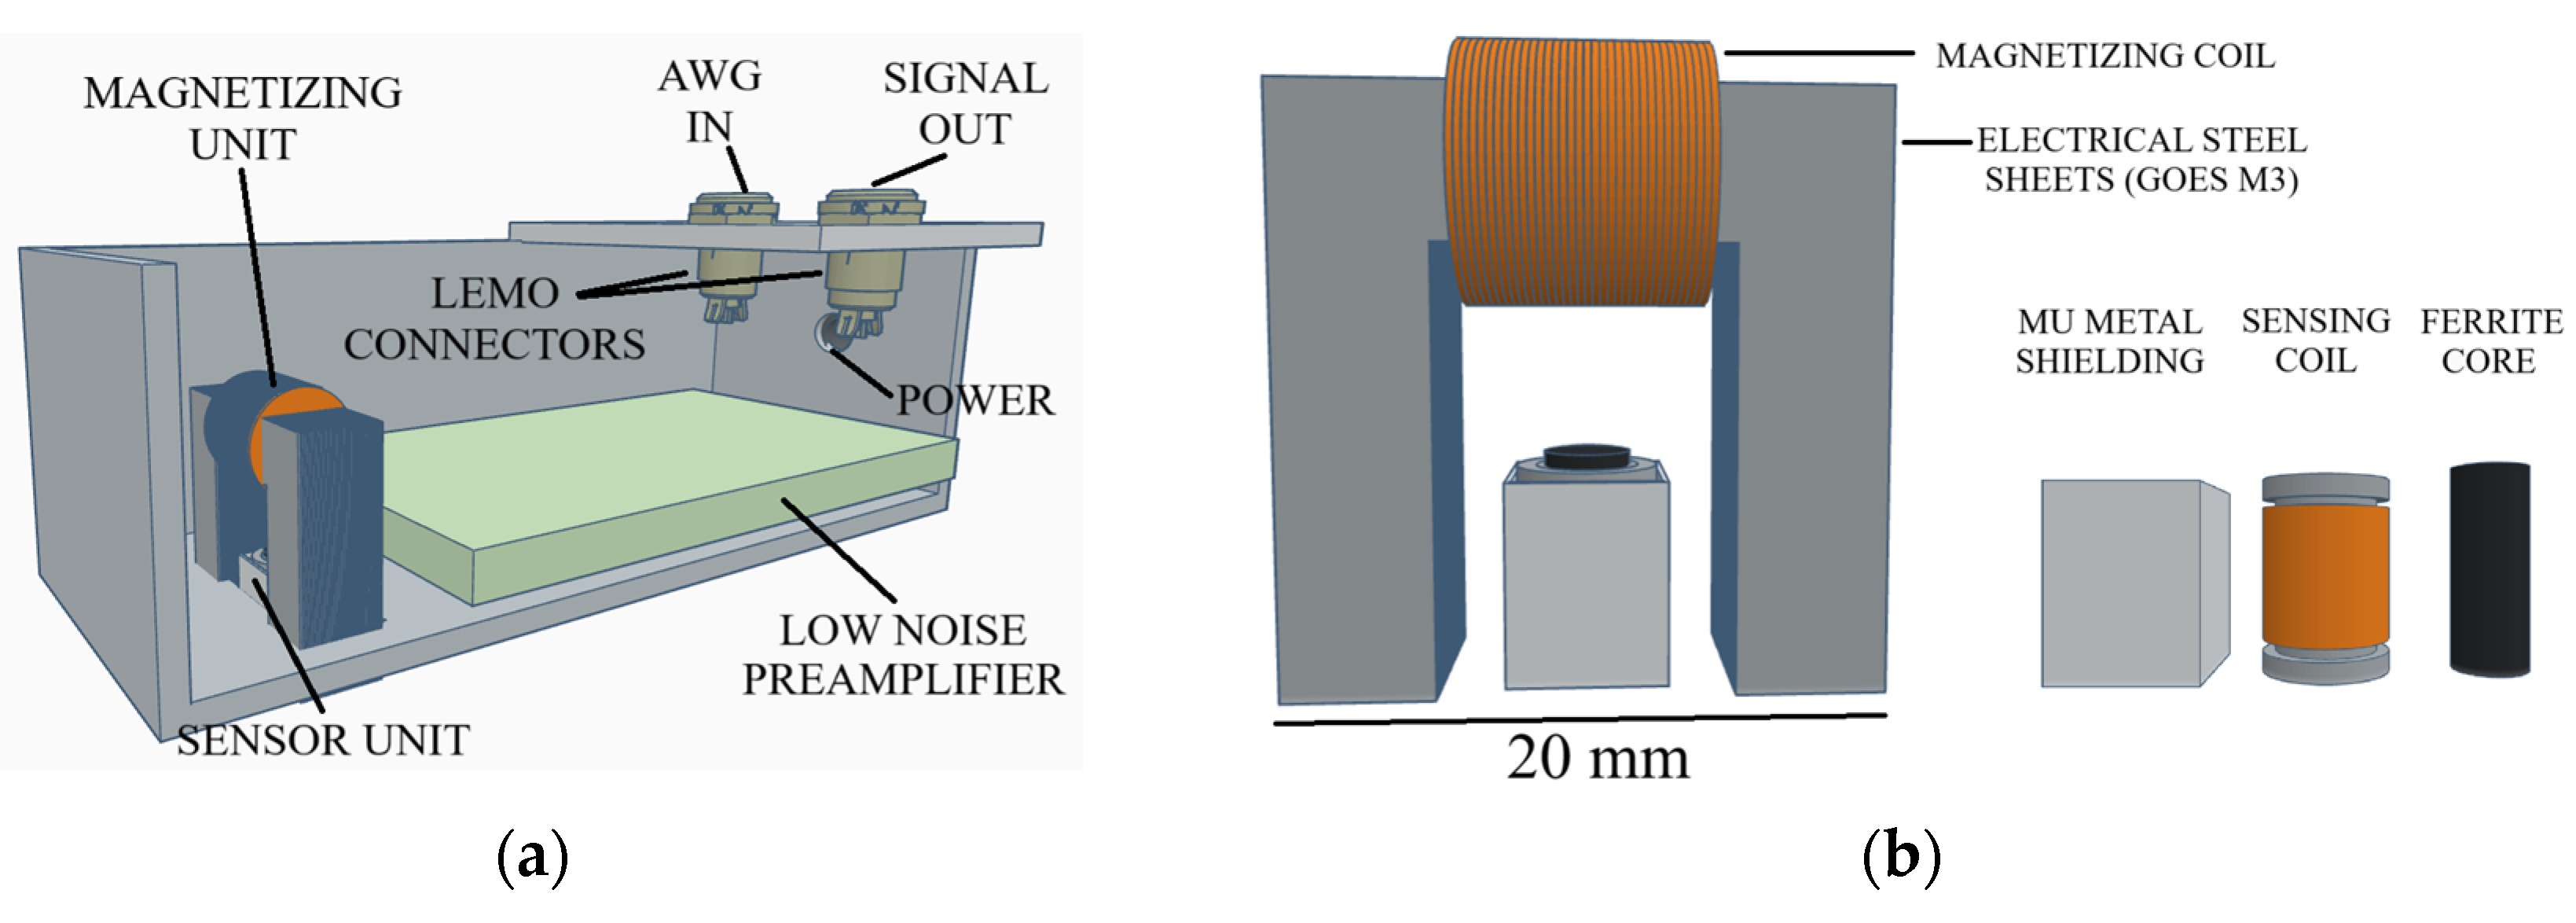
2.3. Magnetic Barkhausen Noise (MBN) Measurements
3. Results and Discussion
4. Conclusions
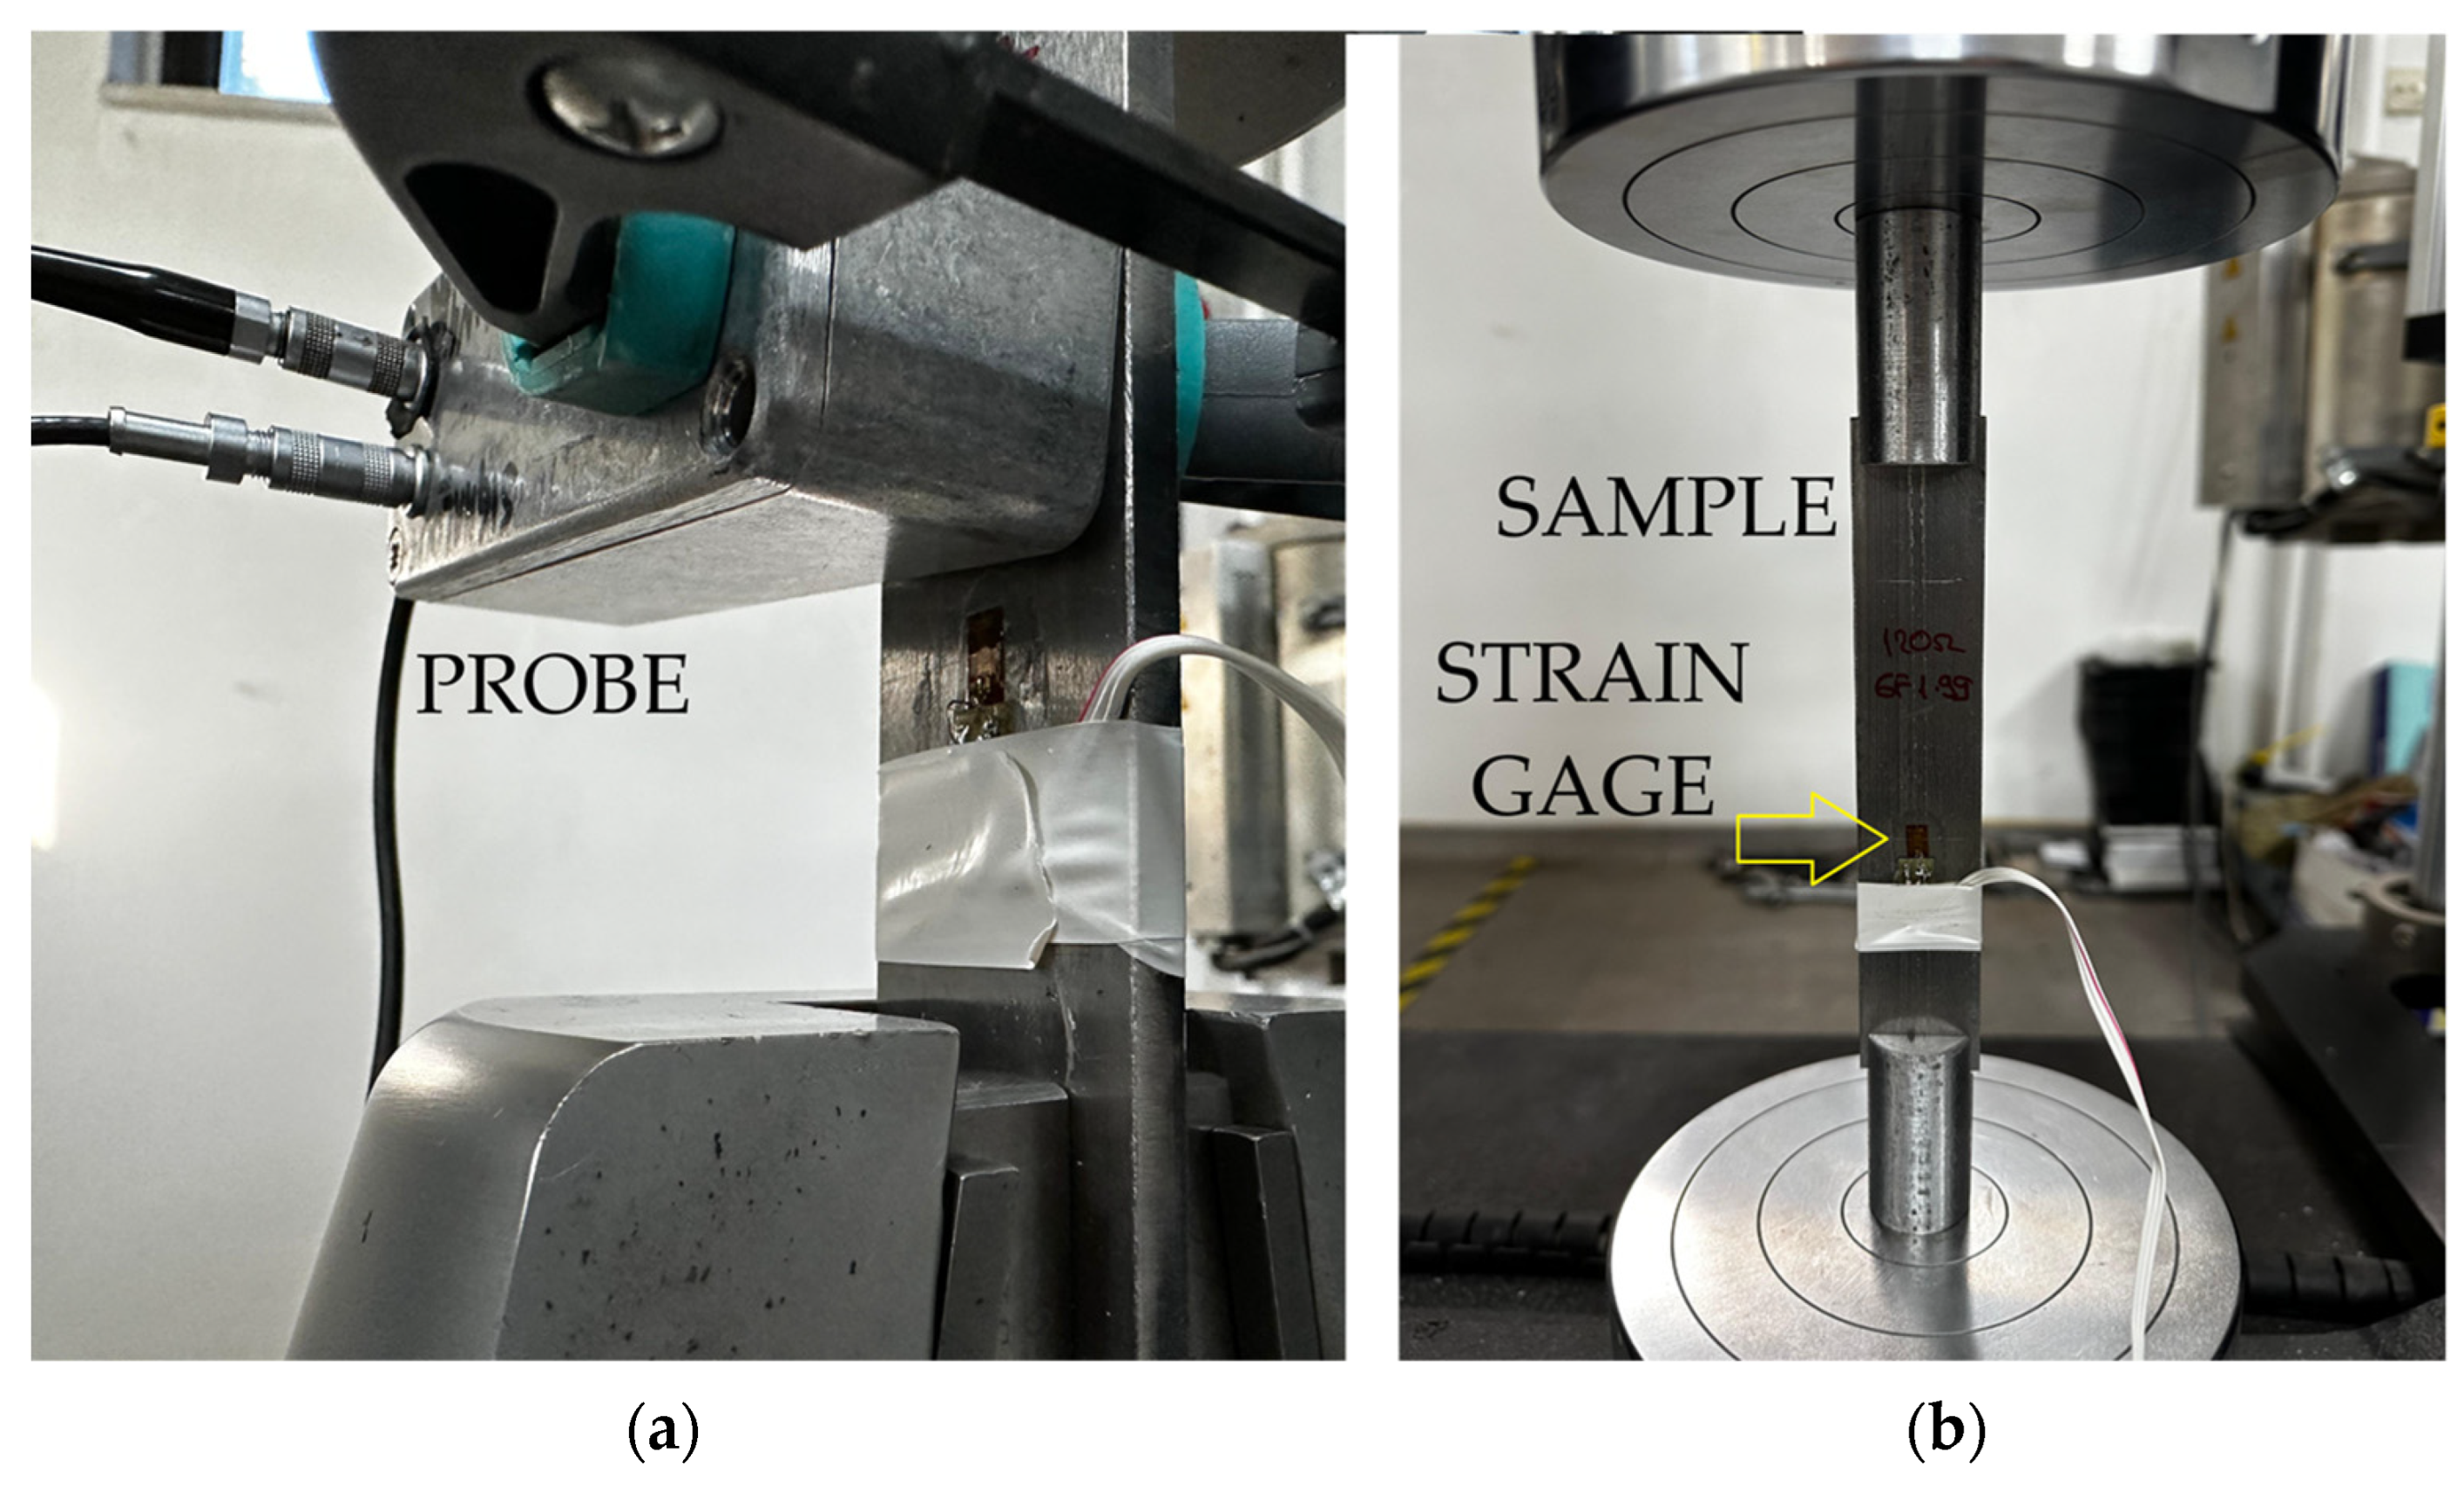
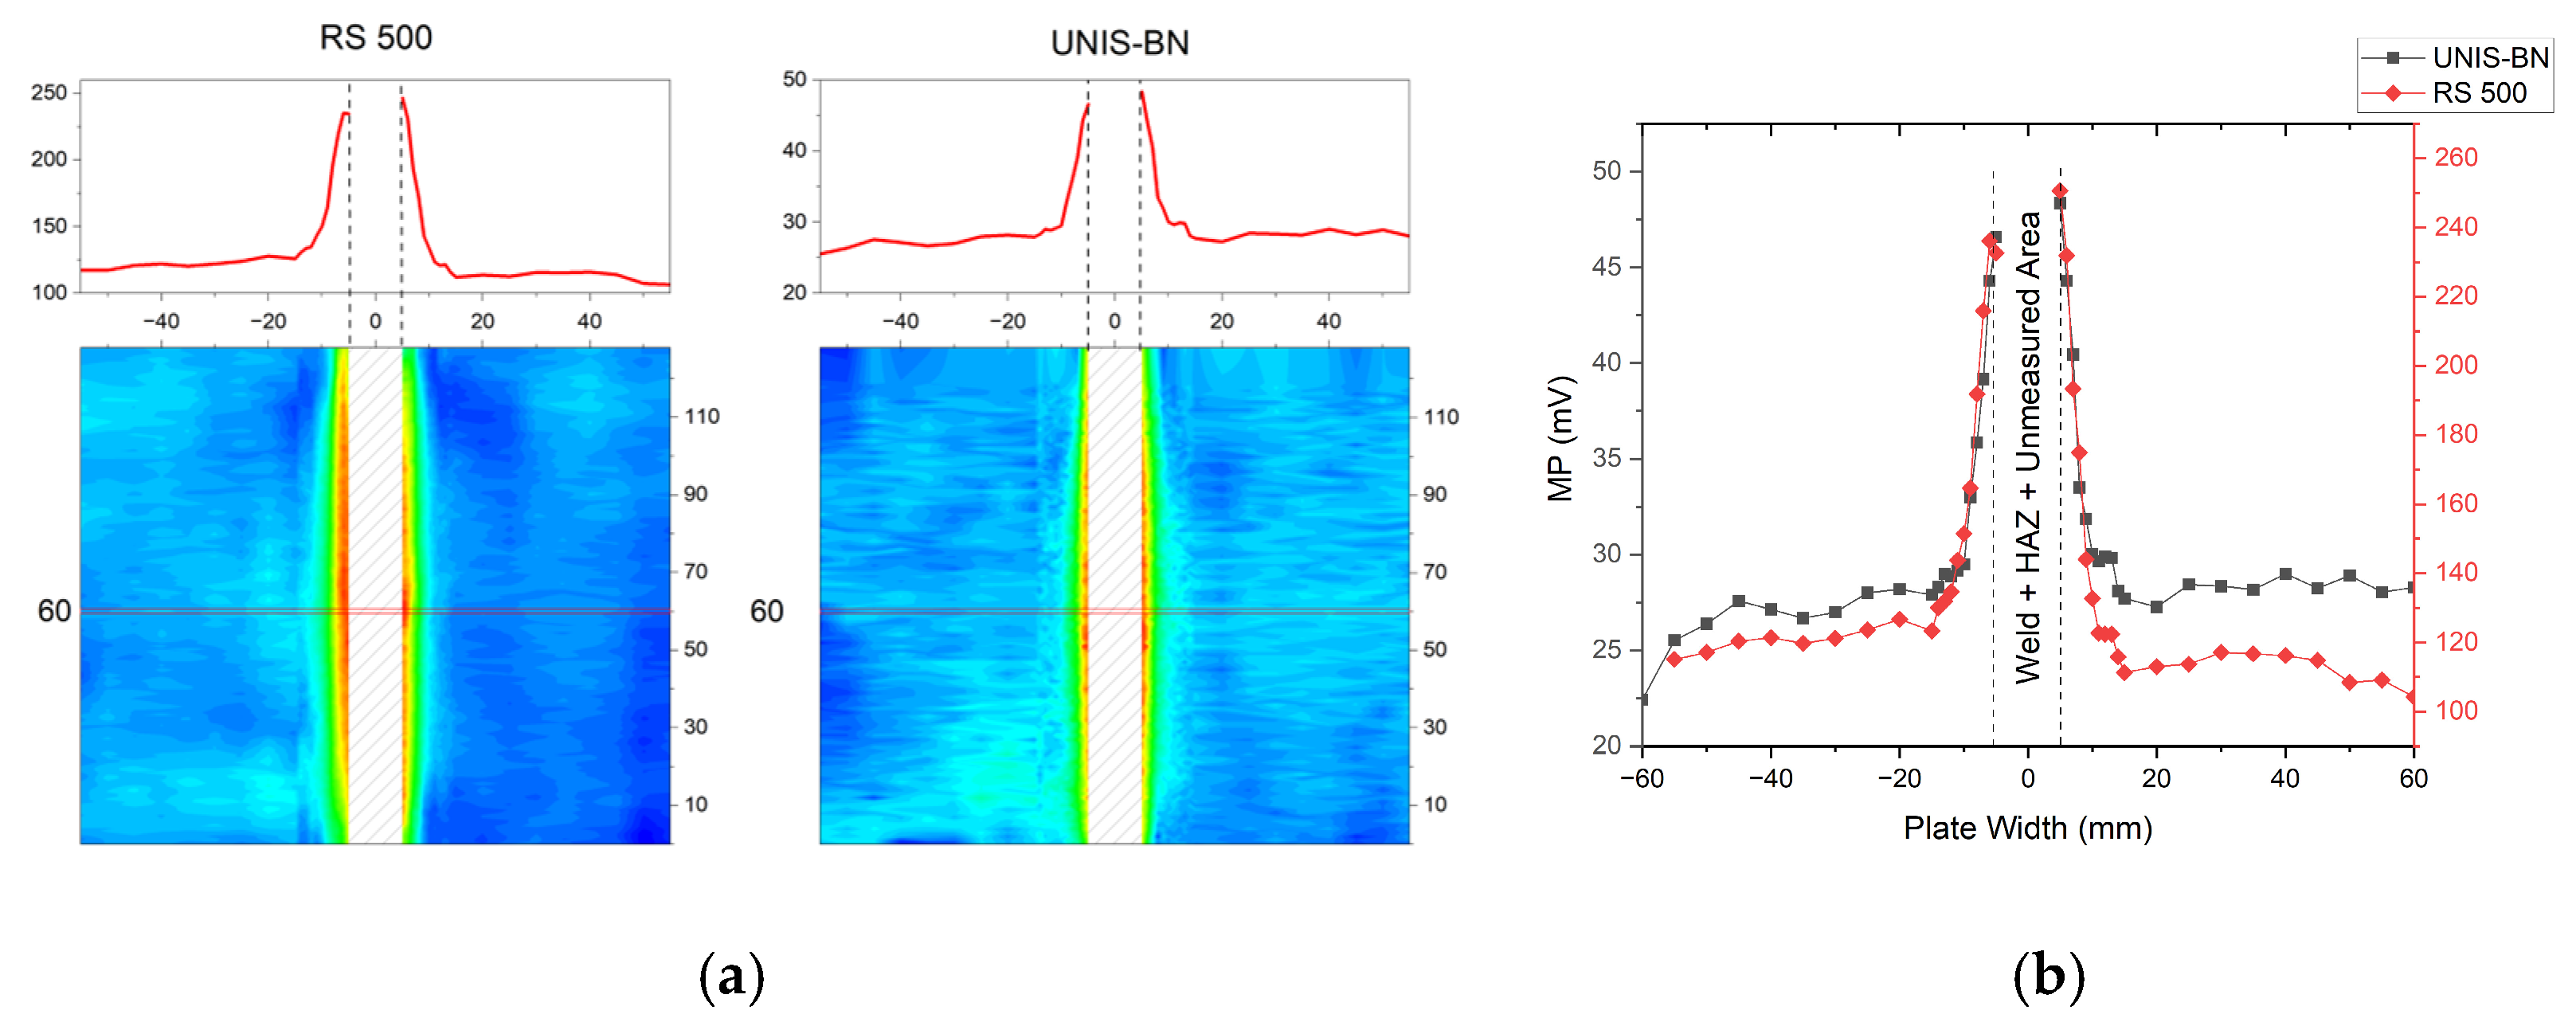
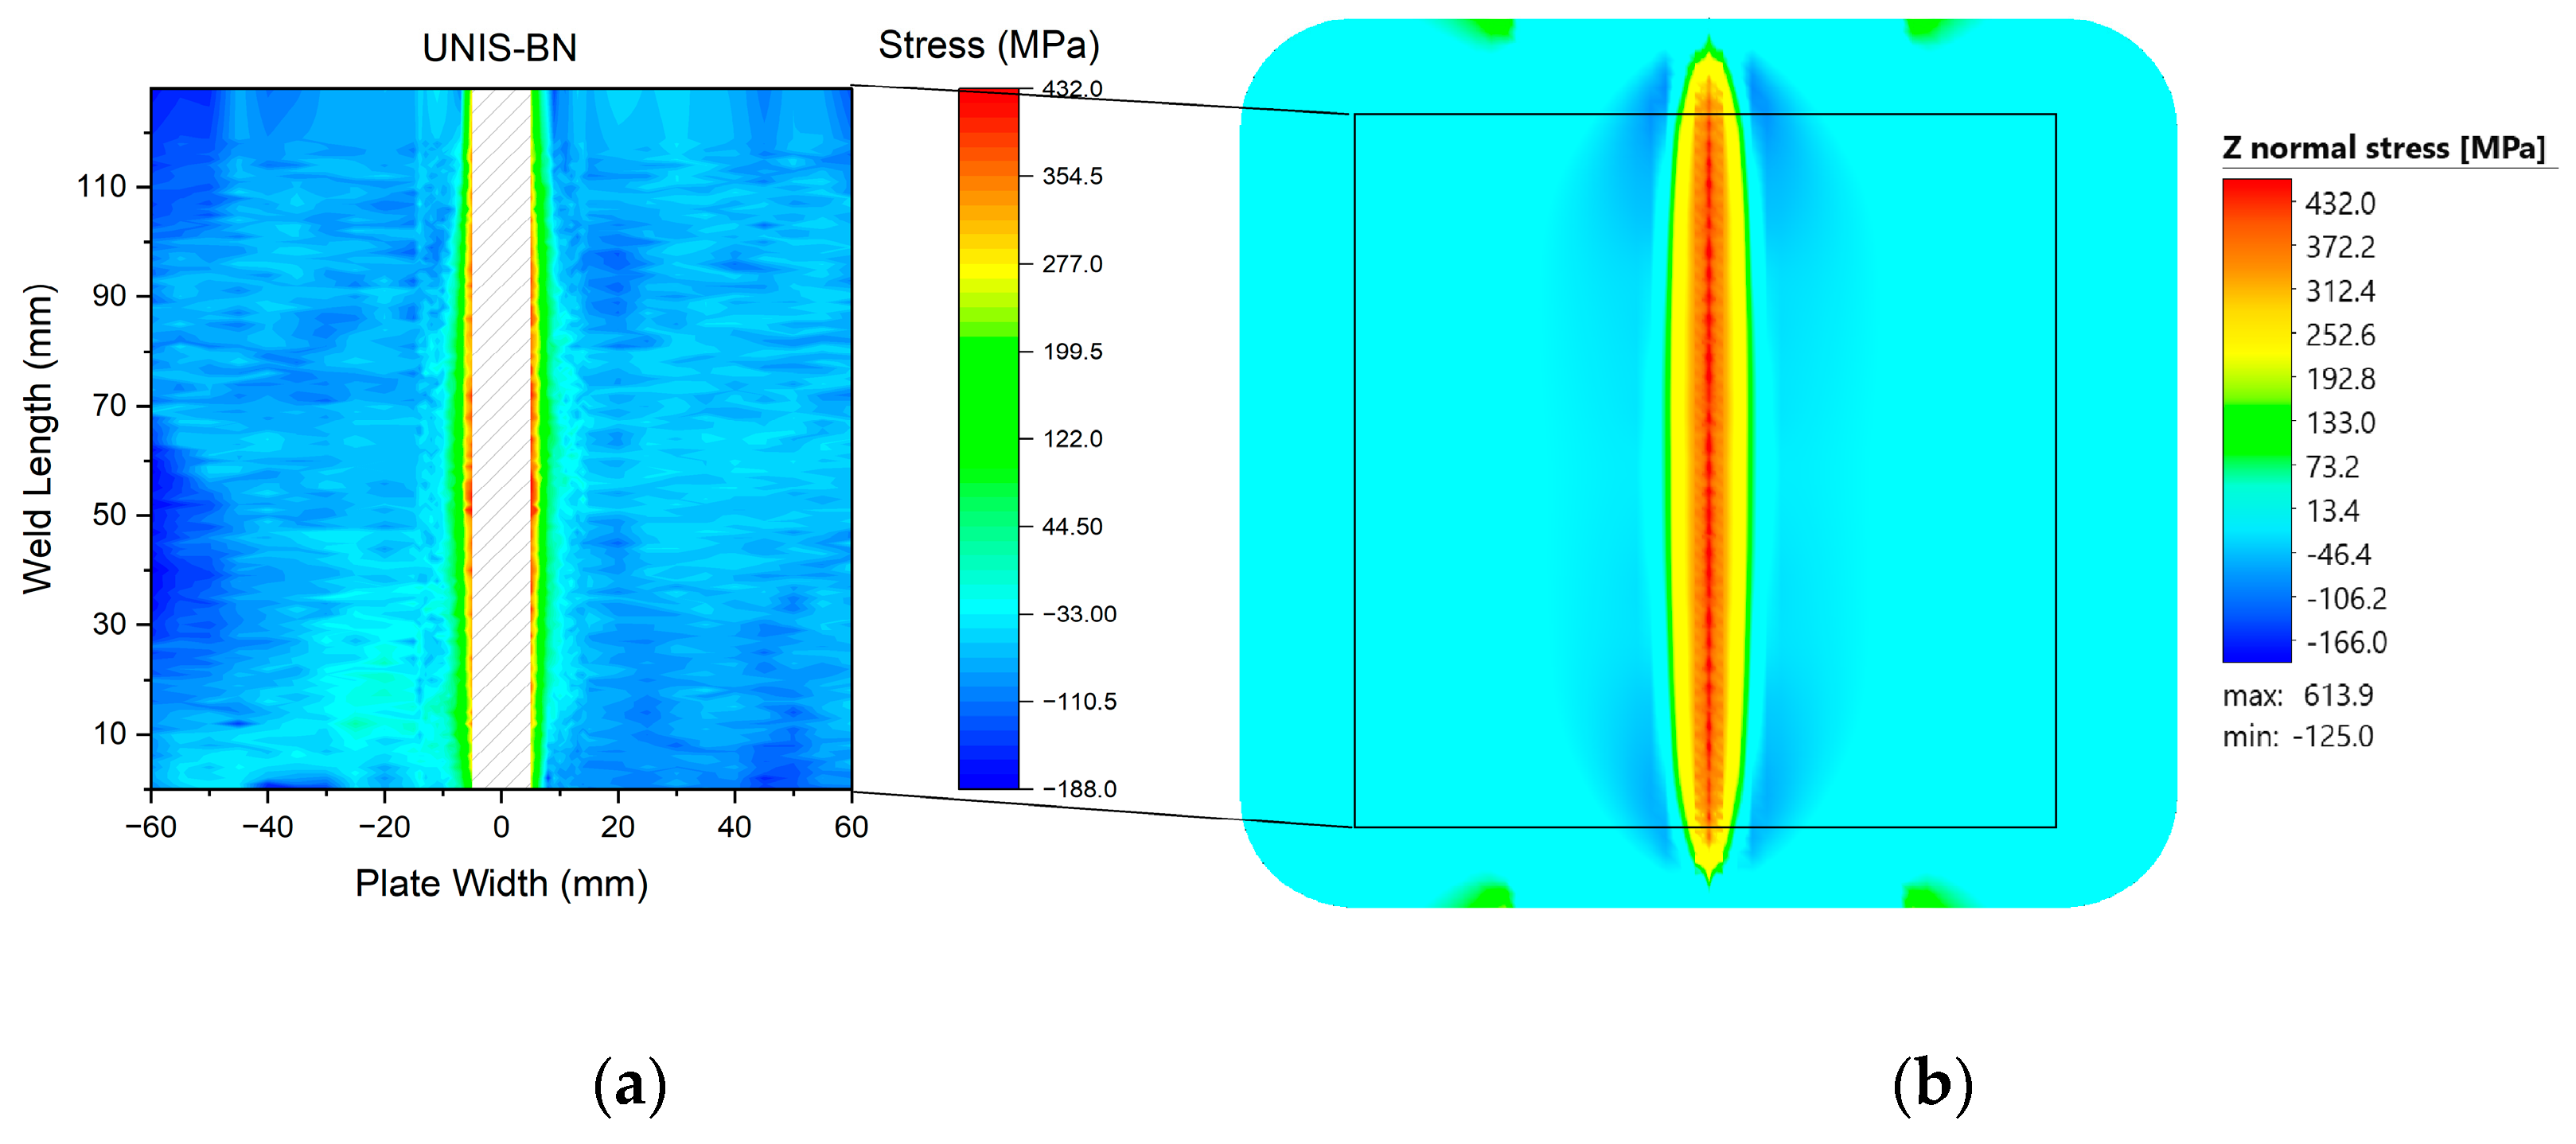
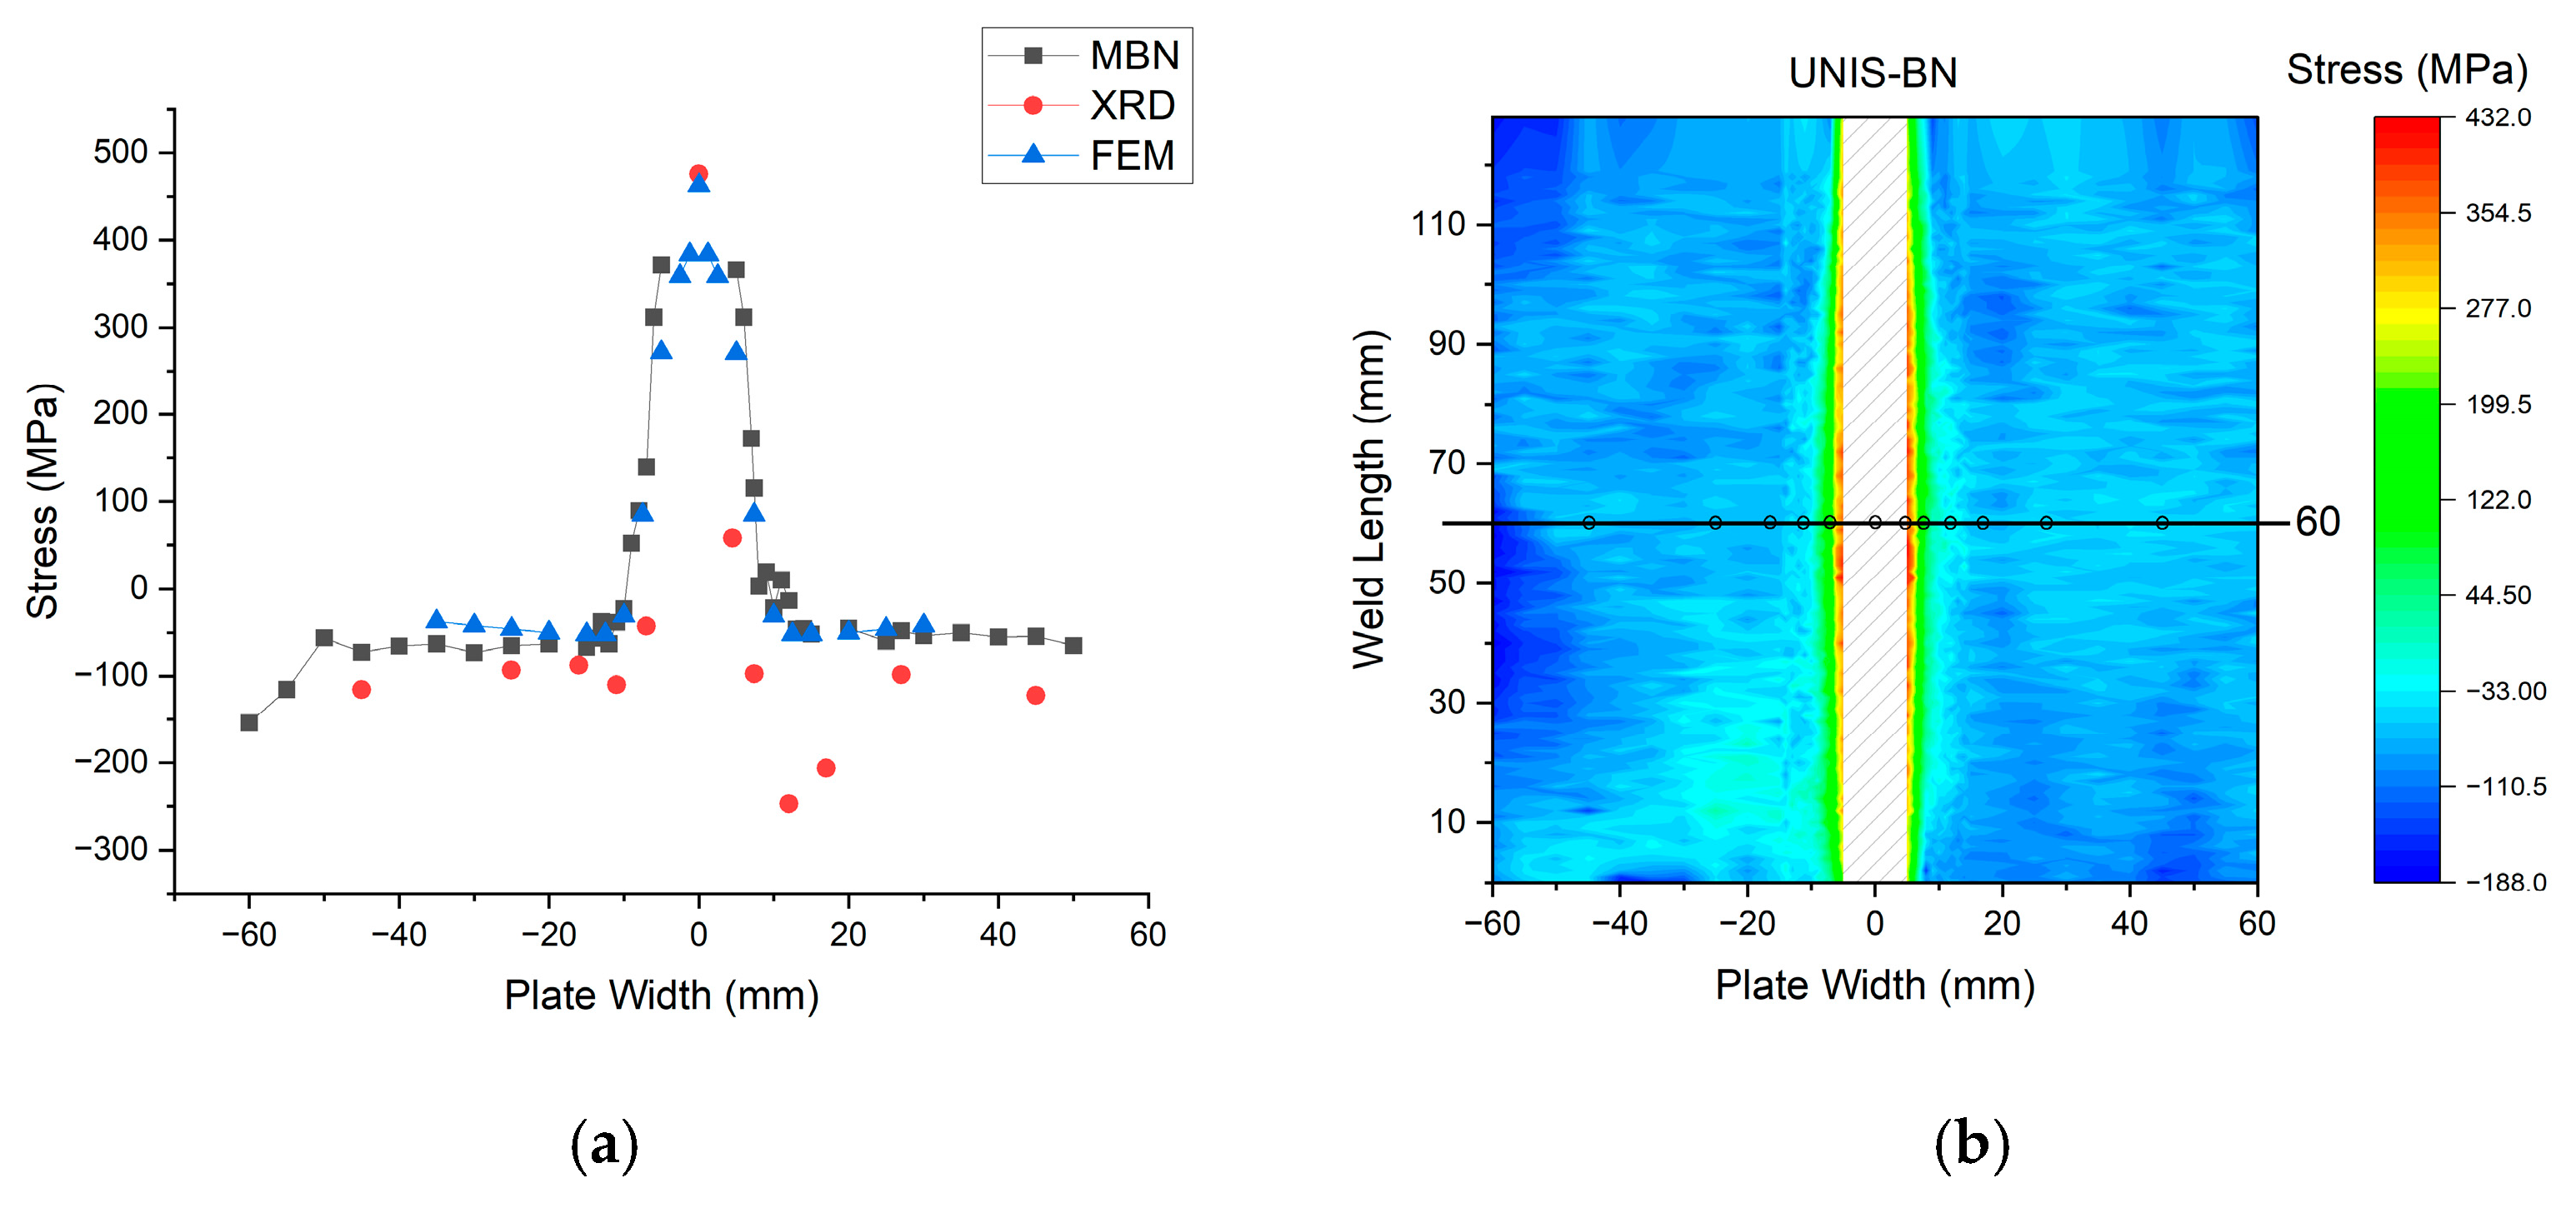
- A device and calibration setup has been developed for the non-destructive measurement of surface residual stresses. Using the developed MBN system, residual stresses of approximately 350 MPa were measured at a distance of 5 mm in both directions from the weld. These tensile stresses were balanced throughout the base material at around −50 MPa. The results are consistent with the XRD measurements and FE simulations.
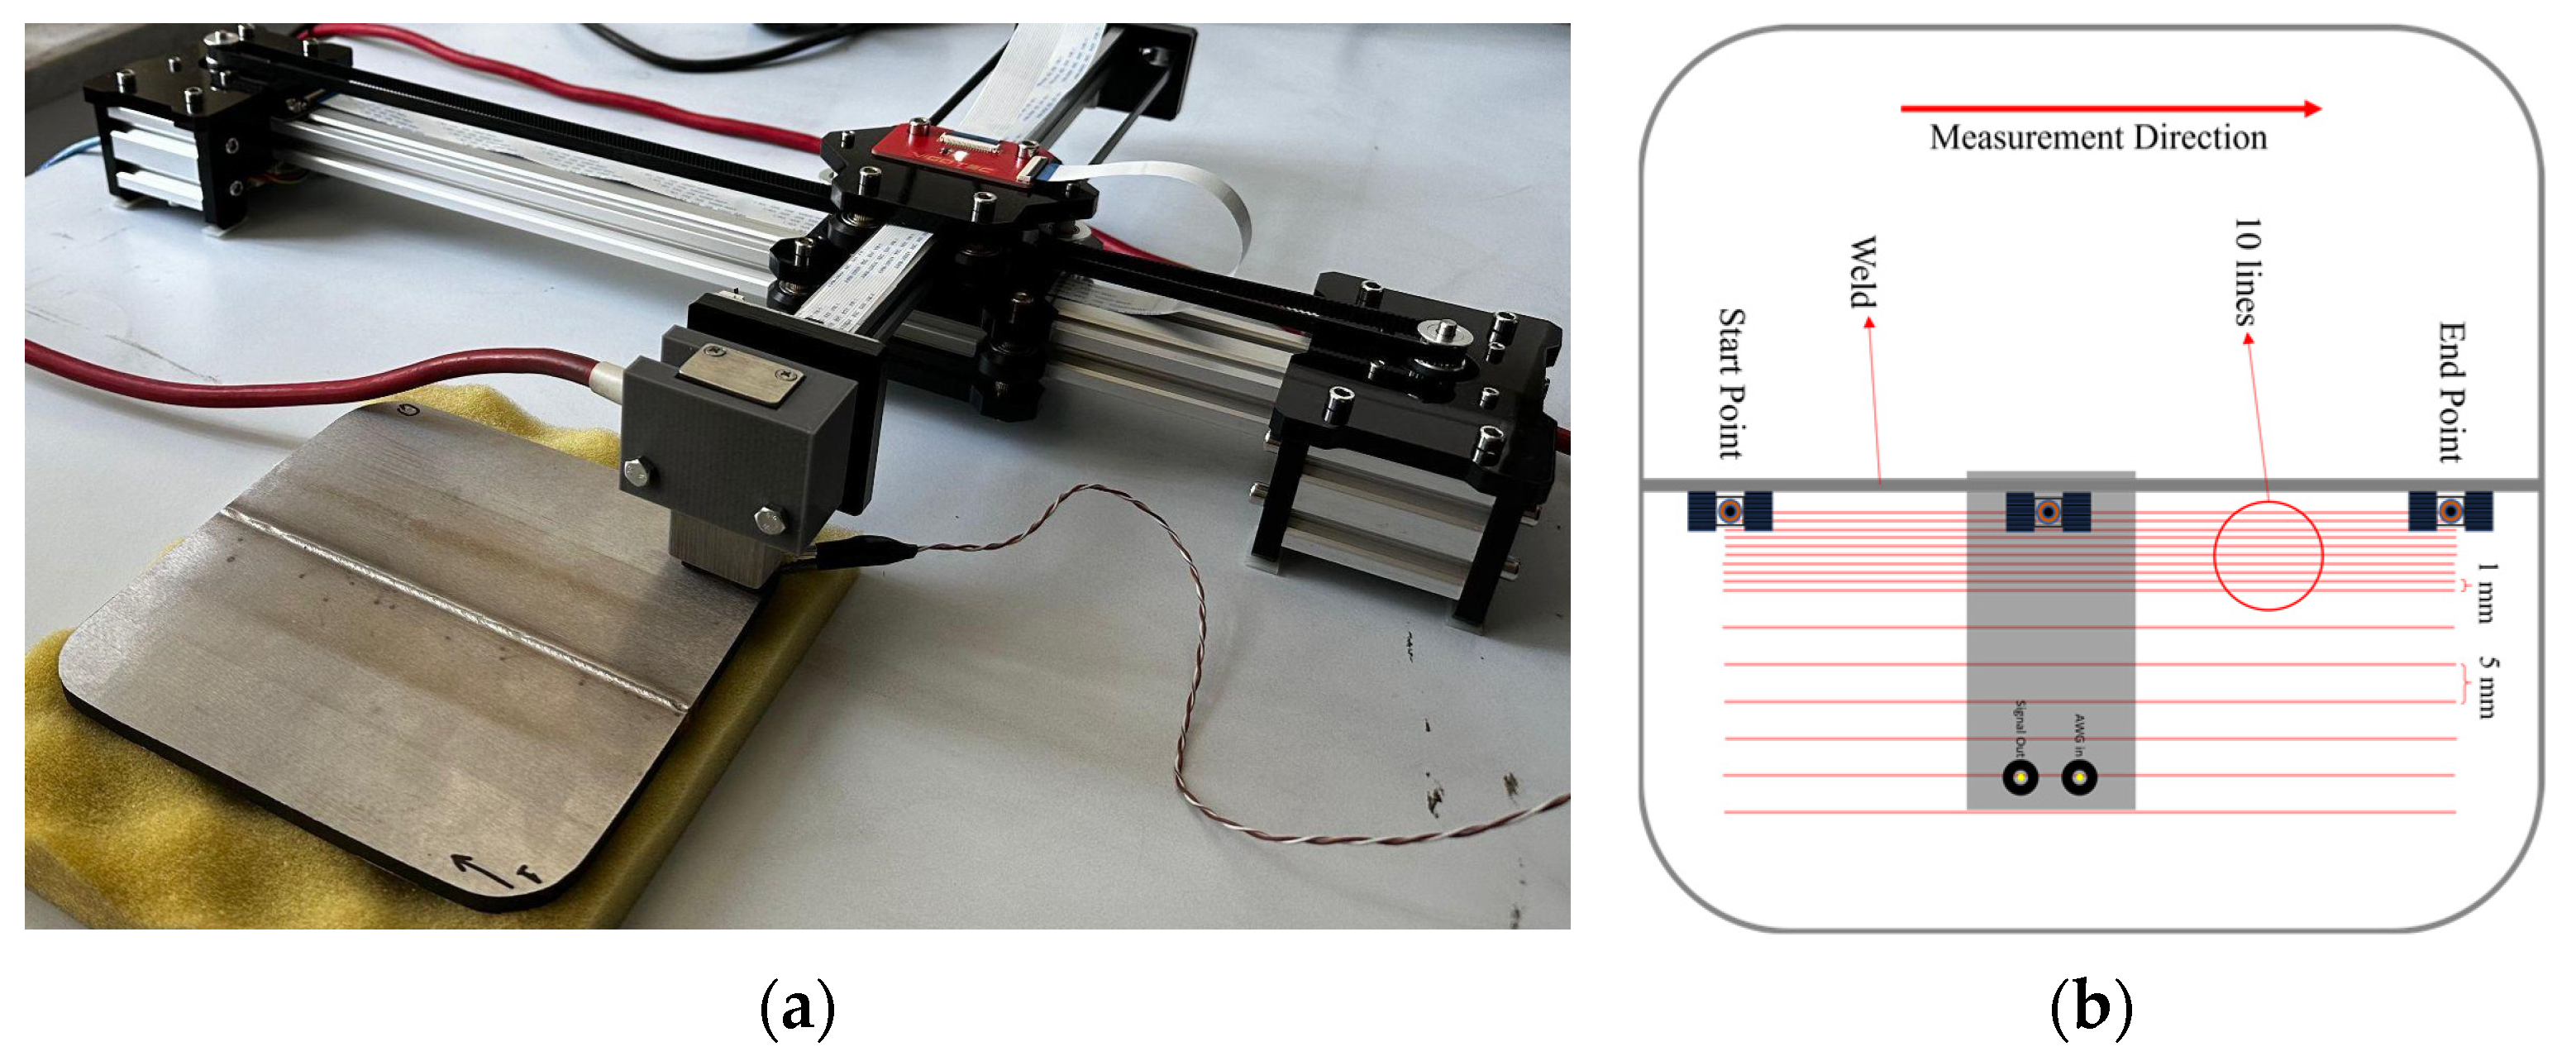
- The proposed C-scan mode of the developed system has proven to be an effective way to obtain fast, reliable, and easily interpretable residual stress maps. It can significantly reduce inspection time and costs in industrial applications.
- There remain some challenges for further improvement. First, to increase the surface resolution and microstructural analysis, the development of smaller probes and sensors will be beneficial. Second, reference samples should be prepared for different MBN measurement system manufacturers for a standardized calibration procedure. Lastly, the development of a more straightforward and effective calibration system for field applications is a potential avenue for future research.
Author Contributions
Funding
Institutional Review Board Statement
Data Availability Statement
Acknowledgments
Conflicts of Interest
Abbreviations
| MBN | Magnetic Barkhausen Noise |
| AISI | American Iron and Steel Institute |
| XRD | X-Ray Diffraction |
| RMS | Root Mean Square |
| SEM | Scanning Electron Microscopy |
| EDS | Energy Dispersive Spectrometry |
| EBW | Electron Beam Welding |
| AWG | Arbitrary Waveform Generator |
| AWG | American Wire Gauge |
| TIG | Tungsten Inert Gas |
| MIG | Metal Inert Gas |
References
- Lippold, J.C.; Kotecki, D.J. Welding Metallurgy and Weldability of Stainless Steels; Wiley-VCH: Weinheim, Germany, 2005; p. 376. [Google Scholar]
- Singh, R. Welding, Corrosion-Resistant Alloys—Stainless Steel. In Applied Welding Engineering; Butterworth-Heinemann: Oxford, UK, 2020; pp. 251–271. [Google Scholar]
- Çalık, A.; Uçar, N. Microstructure and Tensile Properties of AISI 410 Stainless Steel Welded TIG Method. Int. J. Comput. Exp. Sci. Eng. 2023, 9, 394–397. [Google Scholar]
- Casalino, G.; Angelastro, A.; Perulli, P.; Casavola, C.; Moramarco, V. Study on The Fiber Laser/TIG Weldability of AISI 304 and AISI 410 Dissimilar Weld. J. Manuf. Process 2018, 35, 216–225. [Google Scholar] [CrossRef]
- Węglowski, M.S.; Błacha, S.; Phillips, A. Electron beam welding—Techniques and trends—Review. Vacuum 2016, 130, 72–92. [Google Scholar] [CrossRef]
- Tóth, T.; Hesse, A.C.; Kárpáti, V.; Mertinger, V.; Dilger, K. Microstructural and Mechanical Properties of Electron Beam Welded Super Duplex Stainless Steel. Weld World 2024, 68, 1929–1940. [Google Scholar] [CrossRef]
- Geľatko, M.; Vandžura, R.; Botko, F.; Hatala, M. Electron Beam Welding of Dissimilar Stainless Steel and Maraging Steel Joints. Materials 2024, 17, 5769. [Google Scholar] [CrossRef]
- Feng, G.; Wang, Y.; Luo, W.; Hu, L.; Deng, D. Comparison of Welding Residual Stress and Deformation Induced by Local Vacuum Electron Beam Welding and Metal Active Gas Arc Welding in a Stainless Steel Thick-Plate Joint. J. Mater. Res. Technol. 2021, 13, 1967–1979. [Google Scholar] [CrossRef]
- Yelbay, H.I.; Gür, C.H.; Çam, I. Non-Destructive Determination of Residual Stress State in Steel Weldments by Magnetic Barkhausen Noise Technique. NDT E Int. 2010, 43, 29–33. [Google Scholar] [CrossRef]
- Li, X.; Liu, J.; Wu, H.; Miao, K.; Wu, H.; Li, R.; Liu, C.; Fang, W.; Fan, G. Research Progress of Residual Stress Measurement Methods. Heliyon 2024, 10, e28348. [Google Scholar] [CrossRef]
- Gür, C.H. Review of Residual Stress Measurement by Magnetic Barkhausen Noise Technique. Mater. Perform. Charact. 2018, 7, 504–525. [Google Scholar] [CrossRef]
- Sarafan, S.; Wanjara, P.; Gholipour, J.; Champliaud, H. Global and Local Characteristics of an Autogenous Single Pass Electron Beam Weld in Thick Gage UNS S41500 Steel. Mater. Sci. Eng. A 2016, 666, 360–371. [Google Scholar] [CrossRef]
- Gurruchaga, K.; Lasaosa, A.; Artetxe, I.; Martínez-de-Guerenu, A. Grinding Burn Detection via Magnetic Barkhausen Noise Analysis Independently of Induction Hardened Depth. Materials 2023, 16, 2127. [Google Scholar] [CrossRef]
- Wang, X.; Cai, Y.; Liu, X.; He, C. Quantitative Prediction of Surface Hardness in Cr12MoV Steel and S136 Steel with Two Magnetic Barkhausen Noise Feature Extraction Methods. Sensors 2024, 24, 2051. [Google Scholar] [CrossRef] [PubMed]
- Neslušan, M.; Bahleda, F.; Minárik, P.; Zgútová, K.; Jambor, M. Non-Destructive Monitoring of Corrosion Extent in Steel Rope Wires Via Barkhausen Noise Emission. J. Magn. Magn. Mater. 2019, 484, 179–187. [Google Scholar] [CrossRef]
- Neslušan, M.; Minárik, P.; Čep, R.; Ondruš, J.; Pitoňák, M.; Zgútová, K. Measurement of Bearing Capacity of Steel Road Barrier Flange Via Barkhausen Noise Emission. Eng. Fail. Anal. 2024, 156, 107804. [Google Scholar] [CrossRef]
- Hristoforou, E.V. Permeability Sensors for Magnetic Steel Structural Health Monitoring. Sensors 2025, 25, 606. [Google Scholar] [CrossRef]
- Staub, A.; Scherer, M.; Zehnder, P.; Spierings, A.B.; Wegener, K. Residual Stresses Measurements in Laser Powder Bed Fusion Using Barkhausen Noise Analysis. Materials 2022, 15, 2676. [Google Scholar] [CrossRef]
- Aerospace Recommended Practice ARP4462; Barkhausen Noise Inspection for Detecting Grinding Burns in High Strength Steel Parts. SAE International: Warrendale, PA, USA, 2024.
- Avila, J.A.; Conde, F.F.; Pinto, H.C.; Rodriguez, J.; Grijalba FA, F. Microstructural and Residuals Stress Analysis of Friction Stir Welding of X80 Pipeline Steel Plates Using Magnetic Barkhausen Noise. J. Nondestruct. Eval. 2019, 38, 86. [Google Scholar] [CrossRef]
- Rößler, M.; Putz, M.; Hochmuthv, C.; Gentzen, J. In-Process Evaluation of The Grinding Process Using a New Barkhausen Noise Method. Procedia CIRP 2021, 99, 202–207. [Google Scholar] [CrossRef]
- Vourna, P.; Ktena, A.; Tsakiridis, P.E.; Hristoforou, E. A Novel Approach of Accurately Evaluating Residual Stress and Microstructure of Welded Electrical Steels. NDT E Int. 2015, 71, 33–42. [Google Scholar] [CrossRef]
- Liskevych, O.; Fiorin, A.P.F.; Almeida, E.M.; de Feijó, G.F.; de Oliveira, R.L.M.; de Macêdo, M.C.S. An Experimental Approach for Correlation of the Magnetic Barkhausen Noise to Microstructural Changes and Residual Stress in Welding Joints. Soldag. Inspeção 2024, 29, e2908. [Google Scholar] [CrossRef]
- Garstka, T.; Szota, P.; Mróz, S.; Stradomski, G.; Gróbarczyk, J.; Gryczkowski, R. Calibration Method of Measuring Heads for Testing Residual Stresses in Sheet Metal Using the Barkhausen Method. Materials 2024, 17, 4584. [Google Scholar] [CrossRef]


| Voltage (kV) | Current (mA) | Velocity (mm/s) | Working Distance (mm) | Focus | Pulse | Slope In (mm) | Slope Out (mm) |
|---|---|---|---|---|---|---|---|
| 40 | 42 | 10 | 300 | Surface-4 mA | None | 10 | 10 |
| Device | Voltage (V) | Frequency (Hz) | Amplification | Magnetization | Filtering (kHz) |
|---|---|---|---|---|---|
| Microscan RS 500-2 S1-101-11-01 probe | 10 | 125 | 10 | 10 | 70–200 |
| UNIS-BN | 3 | 100 | - | - | 10–100 |
| C | Cr | Mn | Si | P | S | Mo | Ni | V | Al | Cu | Fe |
|---|---|---|---|---|---|---|---|---|---|---|---|
| 0.14 | 11.69 | 0.46 | 0.45 | 0.014 | 0.010 | 0.03 | 0.15 | 0.024 | 0.010 | 0.12 | Bal. |
| Spectrum Label | Cr | Fe | Si |
|---|---|---|---|
| S1 | 60.7 | 39.3 | 0 |
| S2 | 58.9 | 41.1 | 0 |
| S3 | 14.8 | 84.1 | 1.1 |
| S4 | 12.3 | 86.6 | 1.1 |
| S5 | 11.2 | 87.7 | 1.1 |
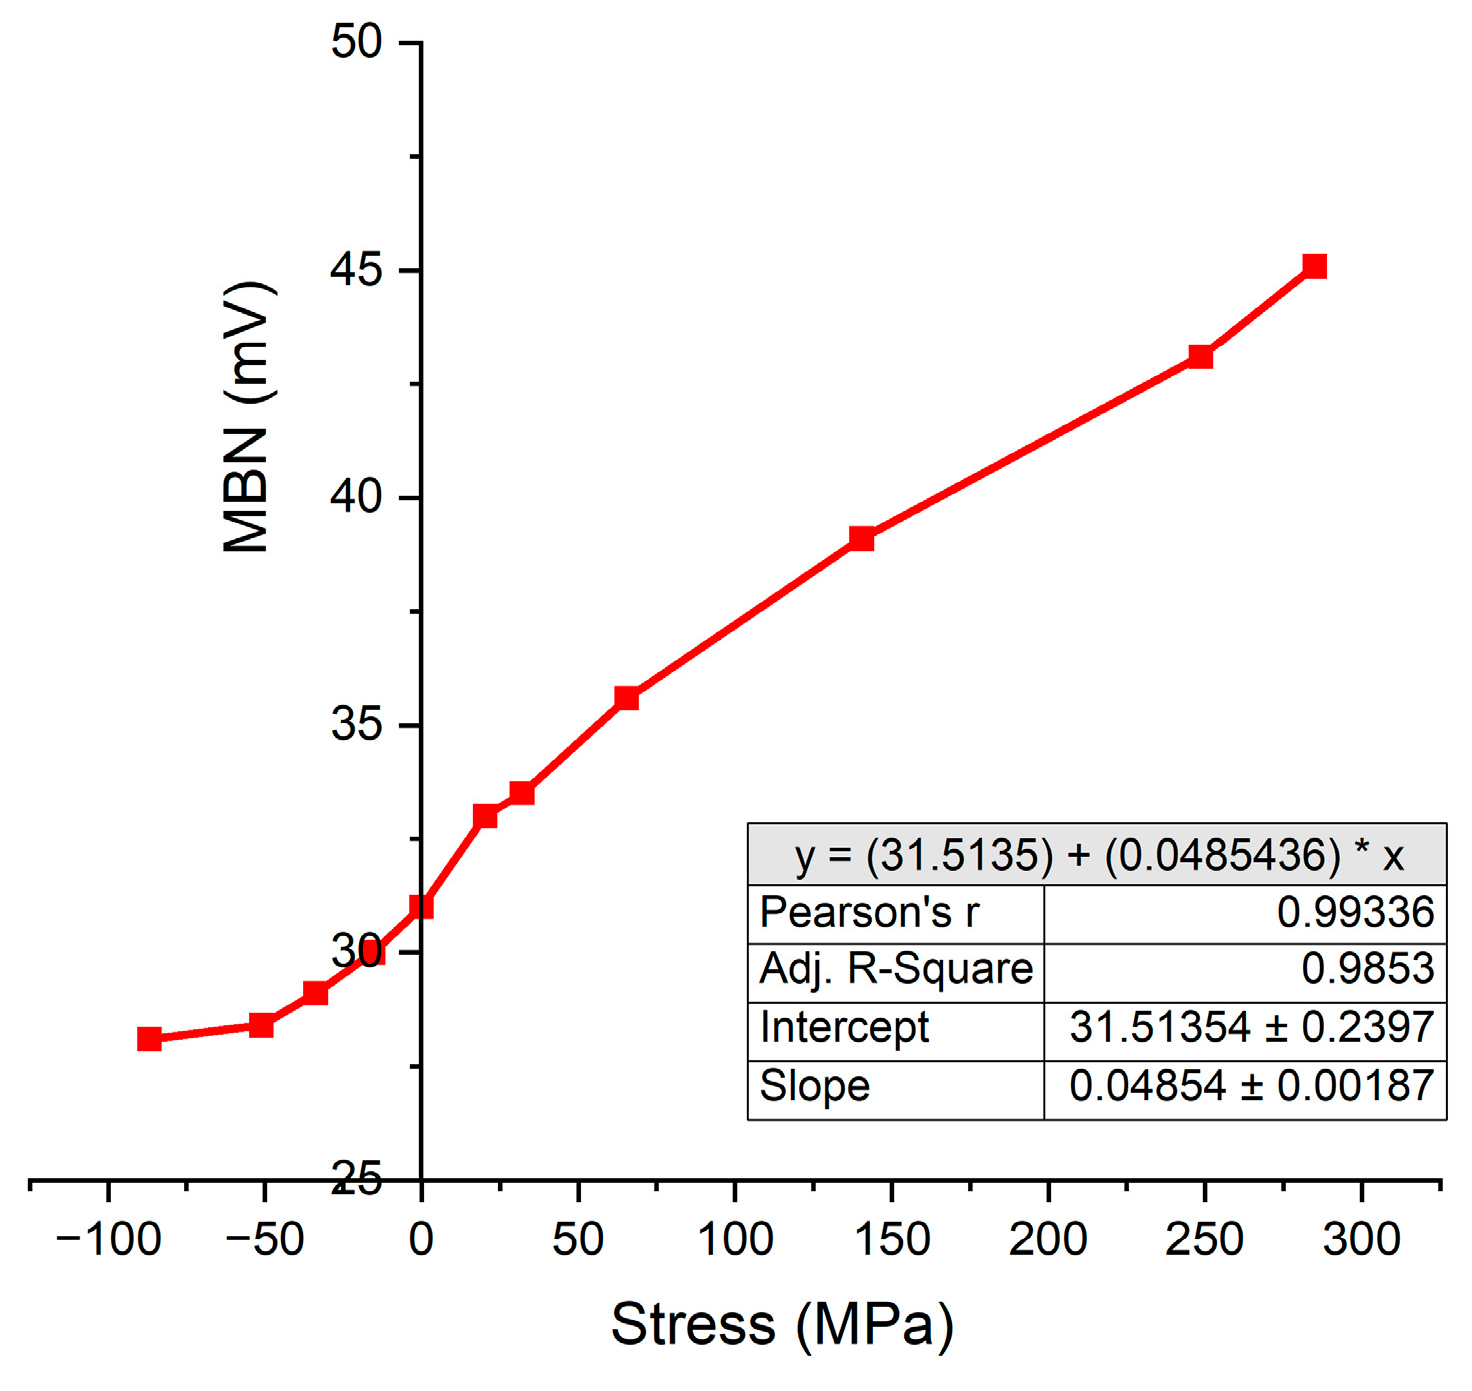
| Load Type | Load (kN) | Strain (µm/m) | MBN (mV) | Stress (MPa) |
|---|---|---|---|---|
| Compression | 10 | −365 | 28.1 | −87 |
| 5 | −215 | 28.4 | −51 | |
| 3 | −142 | 29.1 | −34 | |
| 1 | −65 | 30 | −15 | |
| No Load | 0 | 0 | 31 | 0 |
| Tension | 3 | 85 | 33 | 20 |
| 5 | 135 | 33.5 | 32 | |
| 10 | 275 | 35.6 | 65 | |
| 20 | 590 | 39.1 | 140 | |
| 30 | 1045 | 43.1 | 249 | |
| 35 | 1200 | 45.1 | 285 |
Disclaimer/Publisher’s Note: The statements, opinions and data contained in all publications are solely those of the individual author(s) and contributor(s) and not of MDPI and/or the editor(s). MDPI and/or the editor(s) disclaim responsibility for any injury to people or property resulting from any ideas, methods, instructions or products referred to in the content. |
© 2025 by the authors. Licensee MDPI, Basel, Switzerland. This article is an open access article distributed under the terms and conditions of the Creative Commons Attribution (CC BY) license (https://creativecommons.org/licenses/by/4.0/).
Share and Cite
Yelbay, H.İ.; Gür, C.H. Non-Destructive Determination of Surface Residual Stresses in Electron Beam Welded AISI 410 Martensitic Stainless Steel Using the Magnetic Barkhausen Noise Technique. Metals 2025, 15, 305. https://doi.org/10.3390/met15030305
Yelbay Hİ, Gür CH. Non-Destructive Determination of Surface Residual Stresses in Electron Beam Welded AISI 410 Martensitic Stainless Steel Using the Magnetic Barkhausen Noise Technique. Metals. 2025; 15(3):305. https://doi.org/10.3390/met15030305
Chicago/Turabian StyleYelbay, Hasan İlker, and Cemil Hakan Gür. 2025. "Non-Destructive Determination of Surface Residual Stresses in Electron Beam Welded AISI 410 Martensitic Stainless Steel Using the Magnetic Barkhausen Noise Technique" Metals 15, no. 3: 305. https://doi.org/10.3390/met15030305
APA StyleYelbay, H. İ., & Gür, C. H. (2025). Non-Destructive Determination of Surface Residual Stresses in Electron Beam Welded AISI 410 Martensitic Stainless Steel Using the Magnetic Barkhausen Noise Technique. Metals, 15(3), 305. https://doi.org/10.3390/met15030305