Article

Study on Slag Phase Control of Thermal Reduction of Spodumene

1
Key Laboratory for Nonferrous Vacuum Metallurgy of Yunnan Province, Kunming University of Science and Technology, Kunming 650093, China
2
National Engineering Research Center of Vacuum Metallurgy, Kunming University of Science and Technology, Kunming 650093, China
3
Faculty of Metallurgical and Energy Engineering, Kunming University of Science and Technology, Kunming 650093, China
4
State Key Laboratory of Complex Nonferrous Metal Resources Clean Utilization, Kunming University of Science and Technology, Kunming 650093, China
5
National Engineering Laboratory for Vacuum Metallurgy, Kunming University of Science and Technology, Kunming 650093, China
*
Authors to whom correspondence should be addressed.
Metals 2025, 15(3), 322; https://doi.org/10.3390/met15030322
Submission received: 19 February 2025 / Revised: 12 March 2025 / Accepted: 13 March 2025 / Published: 15 March 2025

Abstract

:
Aiming at the problems of low utilization rate of spodumene resources and serious environmental pollution, our team proposes a clean process to produce manganese-silicon alloy for lithium enrichment by carbothermal reduction of spodumene. In this process, the melting point and viscosity of the slag phase are very high, which affects the slag discharge and slag–metal separation. Therefore, this experiment considers the addition of CaO as a slagging agent based on the previous process and tests and analyzes the slag phase under different CaO contents. When the CaO content is 30%, the slag phase is mainly Ca2Al2SiO7; the reduction rate of lithium is 99.02%; the direct yield of the alloy is 89.12%; and the melting point of the slag is 1260 °C. It can melt and wrap the alloy before removing the alloy, which has heat preservation and oxidation resistance. The viscosity of the slag at 1360 °C is 0.11 Pa·s, which is within the optimum viscosity range of the slag in actual industrial production. Experiments show that the addition of CaO is beneficial to the removal of lithium and the separation of slag and metal, which lays a good foundation for the industrialization development of the previous process and improves the economic benefits of the whole process.

Graphical Abstract

1. Introduction

Since the discovery of lithium in the 1890s, with the development of science and technology, lithium and its compounds have been widely used. From 2017 to 2025, the global demand for lithium has been expected to increase by 8% per year on average [1] mainly for use in lithium batteries, ceramics and glass, and lubricants [2].
Lithium extraction technology mainly includes salt lake lithium extraction and ore lithium extraction [3,4,5]. There are more than 150 kinds of lithium-containing ores known in the world, and very few of them have mining value. Common ores include spodumene (LiAlSi2O6), lepidolite (KLi2Al(Al, Si)3O10(F,OH)2), lithium feldspar (LiAlSi4O10), and lithium nepheline (LiAlSiO4) [6,7]. Spodumene is the main lithium-containing silicate mineral. The crystal is often granular, plate-like, and columnar [8], and the color is gray, light green, pink, purple, blue-green, and so on [9]. There are three basic crystal structures of spodumene: α-LiAlSi2O6, β-LiAlSi2O6, and γ-LiAlSi2O6 [10]. Natural spodumene is an α-type of monoclinic crystal system with a stable structure [11,12]. Because of its high lithium grade and large reserves, spodumene has always been the most widely used mineral in lithium extraction from ore [13,14].
The lithium extraction process of spodumene mainly includes the acid method, alkali method, pressure cooking method, limestone roasting method, salt roasting method, and chlorination roasting method [15,16]. Among them, the “sulfuric acid method” [17] in the acid method is relatively mature. The process first calcines spodumene at a temperature of 1050–1150 °C to transform it into β-spodumene. The transformed spodumene is mixed with excess sulfuric acid (93–98%), and the amount of sulfuric acid is 140% of the theoretical amount at 250–300 °C for acid roasting. The production process is easy to control, and the product quality is stable and reliable. At present, it is the mainstream process for lithium extraction from ore. The acidified clinker is stirred and leached with deionized water. The leaching solution is added with CaCO3 to quickly adjust the PH value to 6.5–7.0, and then the leaching solution is further added with Na2CO3 or CaO. The purified solution is evaporated and concentrated to increase the concentration of lithium sulfate in the solution. Na2CO3 is added to the concentrated solution and heated to a certain temperature to precipitate lithium in the form of Li2CO3 [18,19]. The process basically includes calcination, acid roasting, leaching, purification, evaporation, and lithium precipitation [20,21,22,23]. In this process, the leaching rate of lithium can reach about 98% [24], but a large amount of concentrated sulfuric acid is used, which produces a lot of sulfur trioxide fumes, and about 90% of the aluminum-silicon oxide in the ore enters the slag phase. According to the spodumene concentrate with 6% Li2O content, 1 ton of Li2CO3 is produced, resulting in 10 tons of hazardous waste residue and 8 tons of high-salt wastewater [25,26,27], which has a serious impact on the environment. Therefore, our team proposes a process: lithium enrichment by the carbothermal reduction of spodumene ore and the preparation of manganese-silicon alloy [28]. According to this process, it can be concluded that the addition of manganese dioxide can reduce the reaction temperature of the carbothermic reduction of spodumene and improve the feasibility of the reaction. Previously, our team has studied related processes: comprehensive utilization of spodumene ore through pyrometallurgical process with Fe2O3 addition [29] and experimental and mechanism research on carbothermal reduction of spodumene ore via vacuum [30].
In the production process of lithium and manganese-silicon alloy by carbothermic reduction of spodumene ore, the residue after carbothermic reduction contains more Al2O3, SiC, and SiO2, which makes the melting point of the slag phase higher, which will cause difficulty in slag discharge and affect the separation between slag and alloy. Therefore, we consider the addition of a slagging agent to improve the performance of the slag, reduce the viscosity of the slag phase, and separate the slag better. When extracting the required metals from the ore, the addition of appropriate slagging agents can increase the reduction rate of the ore for some reactions [31]. Commonly used slagging agents include CaO, SiO2, and CaF2 [32]. From a comprehensive point of view, since CaO can react with SiO2 and Al2O3 in spodumene [33], it is widely available and has good thermal stability. It can withstand high temperature without obvious decomposition or deformation and is environmentally friendly. Therefore, in this experiment, CaO was selected as the slagging agent. In order to explore the direct recovery rate of manganese-silicon alloy, the reduction rate of lithium, and the regulation of the slagging agent on the slag phase to reduce the melting point and viscosity of the slag phase, the reduction residue after the experiment was taken out, and the alloy was separated from the slag. The quality of the alloy and the viscosity and melting point of the slag phase were analyzed.

2. Materials and Methods

2.1. Spodumene

X-ray diffraction (XRD) was used to analyze the crystal phase of spodumene produced at a certain location. The results show that the ore is composed of spodumene LiAlSi2O6 and quartz SiO2, as shown in Figure 1 (left). The SEM-EDS spectrum analysis of the raw material spodumene shows that the coincidence degree of Al, Si, and O elements in the ore was high, as shown in Figure 1 (right). Since SEM-EDS is difficult to accurately measure the Li element, combined with XRD analysis, it is concluded that the main phase in the ore was LiAlSi2O6, and there was a small amount of K, Na, and Fe elements.
Because of the small atomic radius and low atomic mass of lithium, XRF cannot characterize lithium. Inductively coupled plasma optical emission spectrometry (ICP-OES) was used to quantitatively analyze the major chemical constituents in spodumene. The results are presented in Table 1.
The results show that the Li2O content of lithium pyroxene was 3.83%, SiO2 content was 72.50%, Al2O3 content was 18.60%, and Fe2O3 content was 0.95%, which was consistent with the analysis determined by SEM-EDS plots.

2.2. Coke

After experimental exploration, it was found that with the use of coke carbon (Baiyun Carbon Factory Ningxia, China) at 80 mesh, the adhesion is better when pressing the material, the degree of reduction during the reaction is higher, and the coke carbon has the advantages of high carbon fixation value, low volatile matter, and water content. After the test, the fixed carbon content of coke was 86.04%. The ash content was 12.03%. The volatile matter content was 1.44%; the moisture content was 0.49%, which met the requirements of this experiment. The chemical composition of char and ash are shown in Table 2 and Table 3, respectively.

2.3. Other Raw Materials

The manganese dioxide (Sinopharm Chemical Reagent Co., Ltd., Shanghai, China) and calcium oxide (Sinopharm Chemical Reagent Co., Ltd., Shanghai, China) used in this experiment are all analytical grade.

2.4. Experimental Methods

The experiment was based on the extraction of lithium from spodumene added with manganese dioxide. The composition and content of the slag phase were determined, and the average value was calculated under optimal process conditions (1600 °C, holding time 6 h). The content distribution of the main components in the slag phase was obtained. As shown in Table 4, the silicon-aluminum ratio is determined to be about 1.4, so we fixed the silicon–aluminum ratio at 1.4 to calculate different alkalinity (R—alkaline oxide/acid oxide) and determined the amount of CaO added by alkalinity.
The crushed spodumene and coke were sieved to obtain spodumene with particle size ≤ 0.15 mm and coke with particle size ≤ 0.18 mm, respectively. The crushed and sieved spodumene, manganese dioxide, coke (wLiAlSi2O6:wMnO2:wC = 5:5:4), and CaO with different alkalinity were mixed uniformly and pressed under a pressure of 15 MP to obtain a cylindrical block with a diameter of 30 mm. The material block was placed into a graphite crucible, and the crucible was placed into a vacuum vertical reaction furnace for gas washing so that the furnace was full of nitrogen-protective gas. It began to heat. From the pre-process, we could learn from the reaction of the optimal temperature of 1600 °C under the heat preservation of 6 h, so we focused on the consideration of the conditions of heat preservation of 6 h when heated to 1600 °C. At the end of the experiment, we turned off the power switch and waited for the temperature in the furnace to drop to room temperature before turning off the water cooler and oil cooler.

3. Results

3.1. Theoretical Analysis

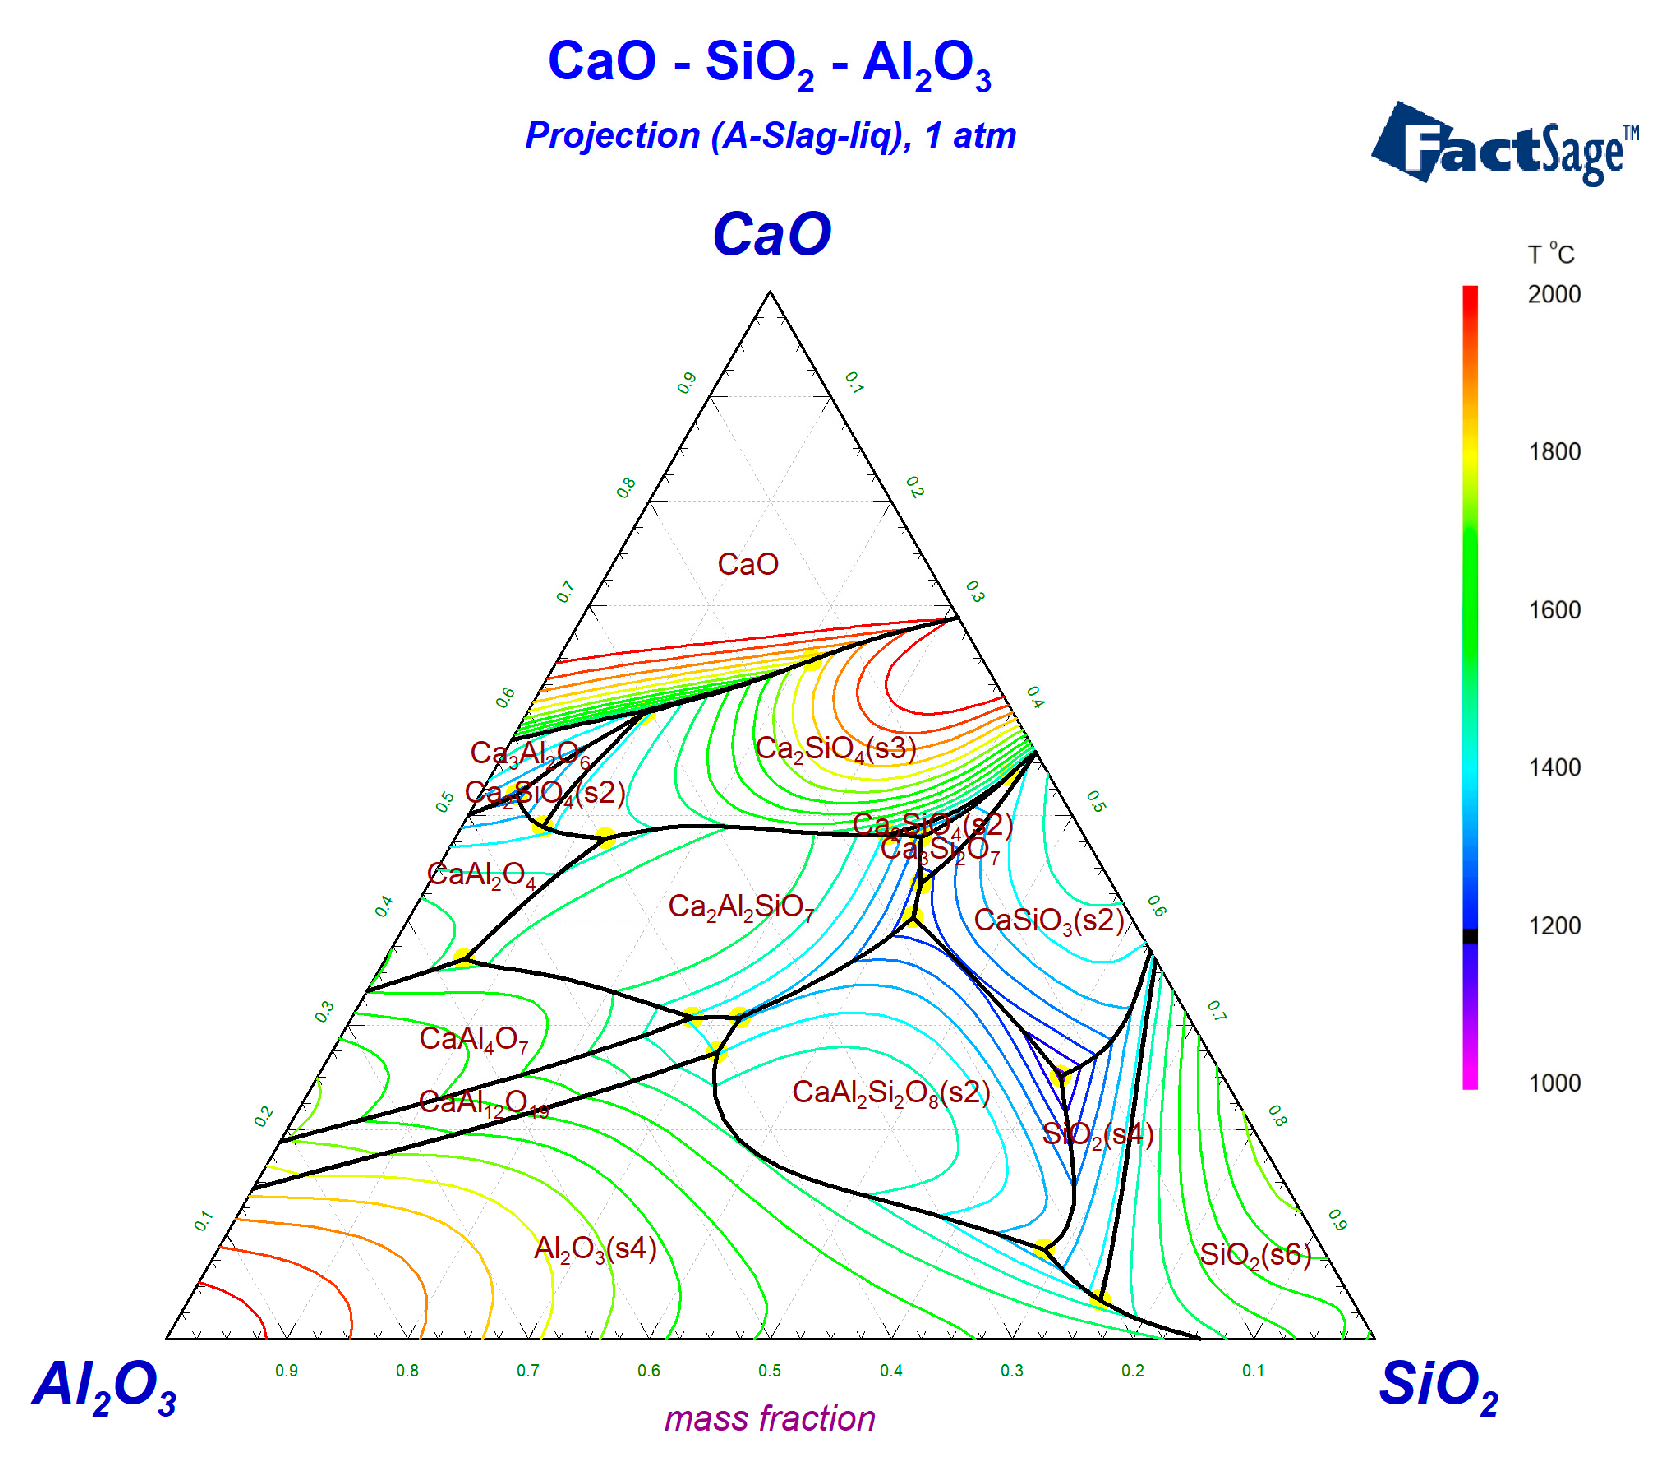
3.1.1. C-A-S Ternary Phase Diagram

The CaO-Al2O3-SiO2 ternary phase diagram was simulated using FactSage7.2, as shown in Figure 2.
From the phase diagram of the ternary system, it can be seen that different substances were formed with Al2O3 and SiO2 when the ratio of silicon to aluminum was fixed and the content of CaO in the slag was different, which provides a theoretical basis for the phase generated by XRD analysis. According to the phase diagram, we can see that Ca2SiO4, Ca2Al2SiO7, and Ca2Al2SiO8 could be obtained in the slag at 1600 °C.

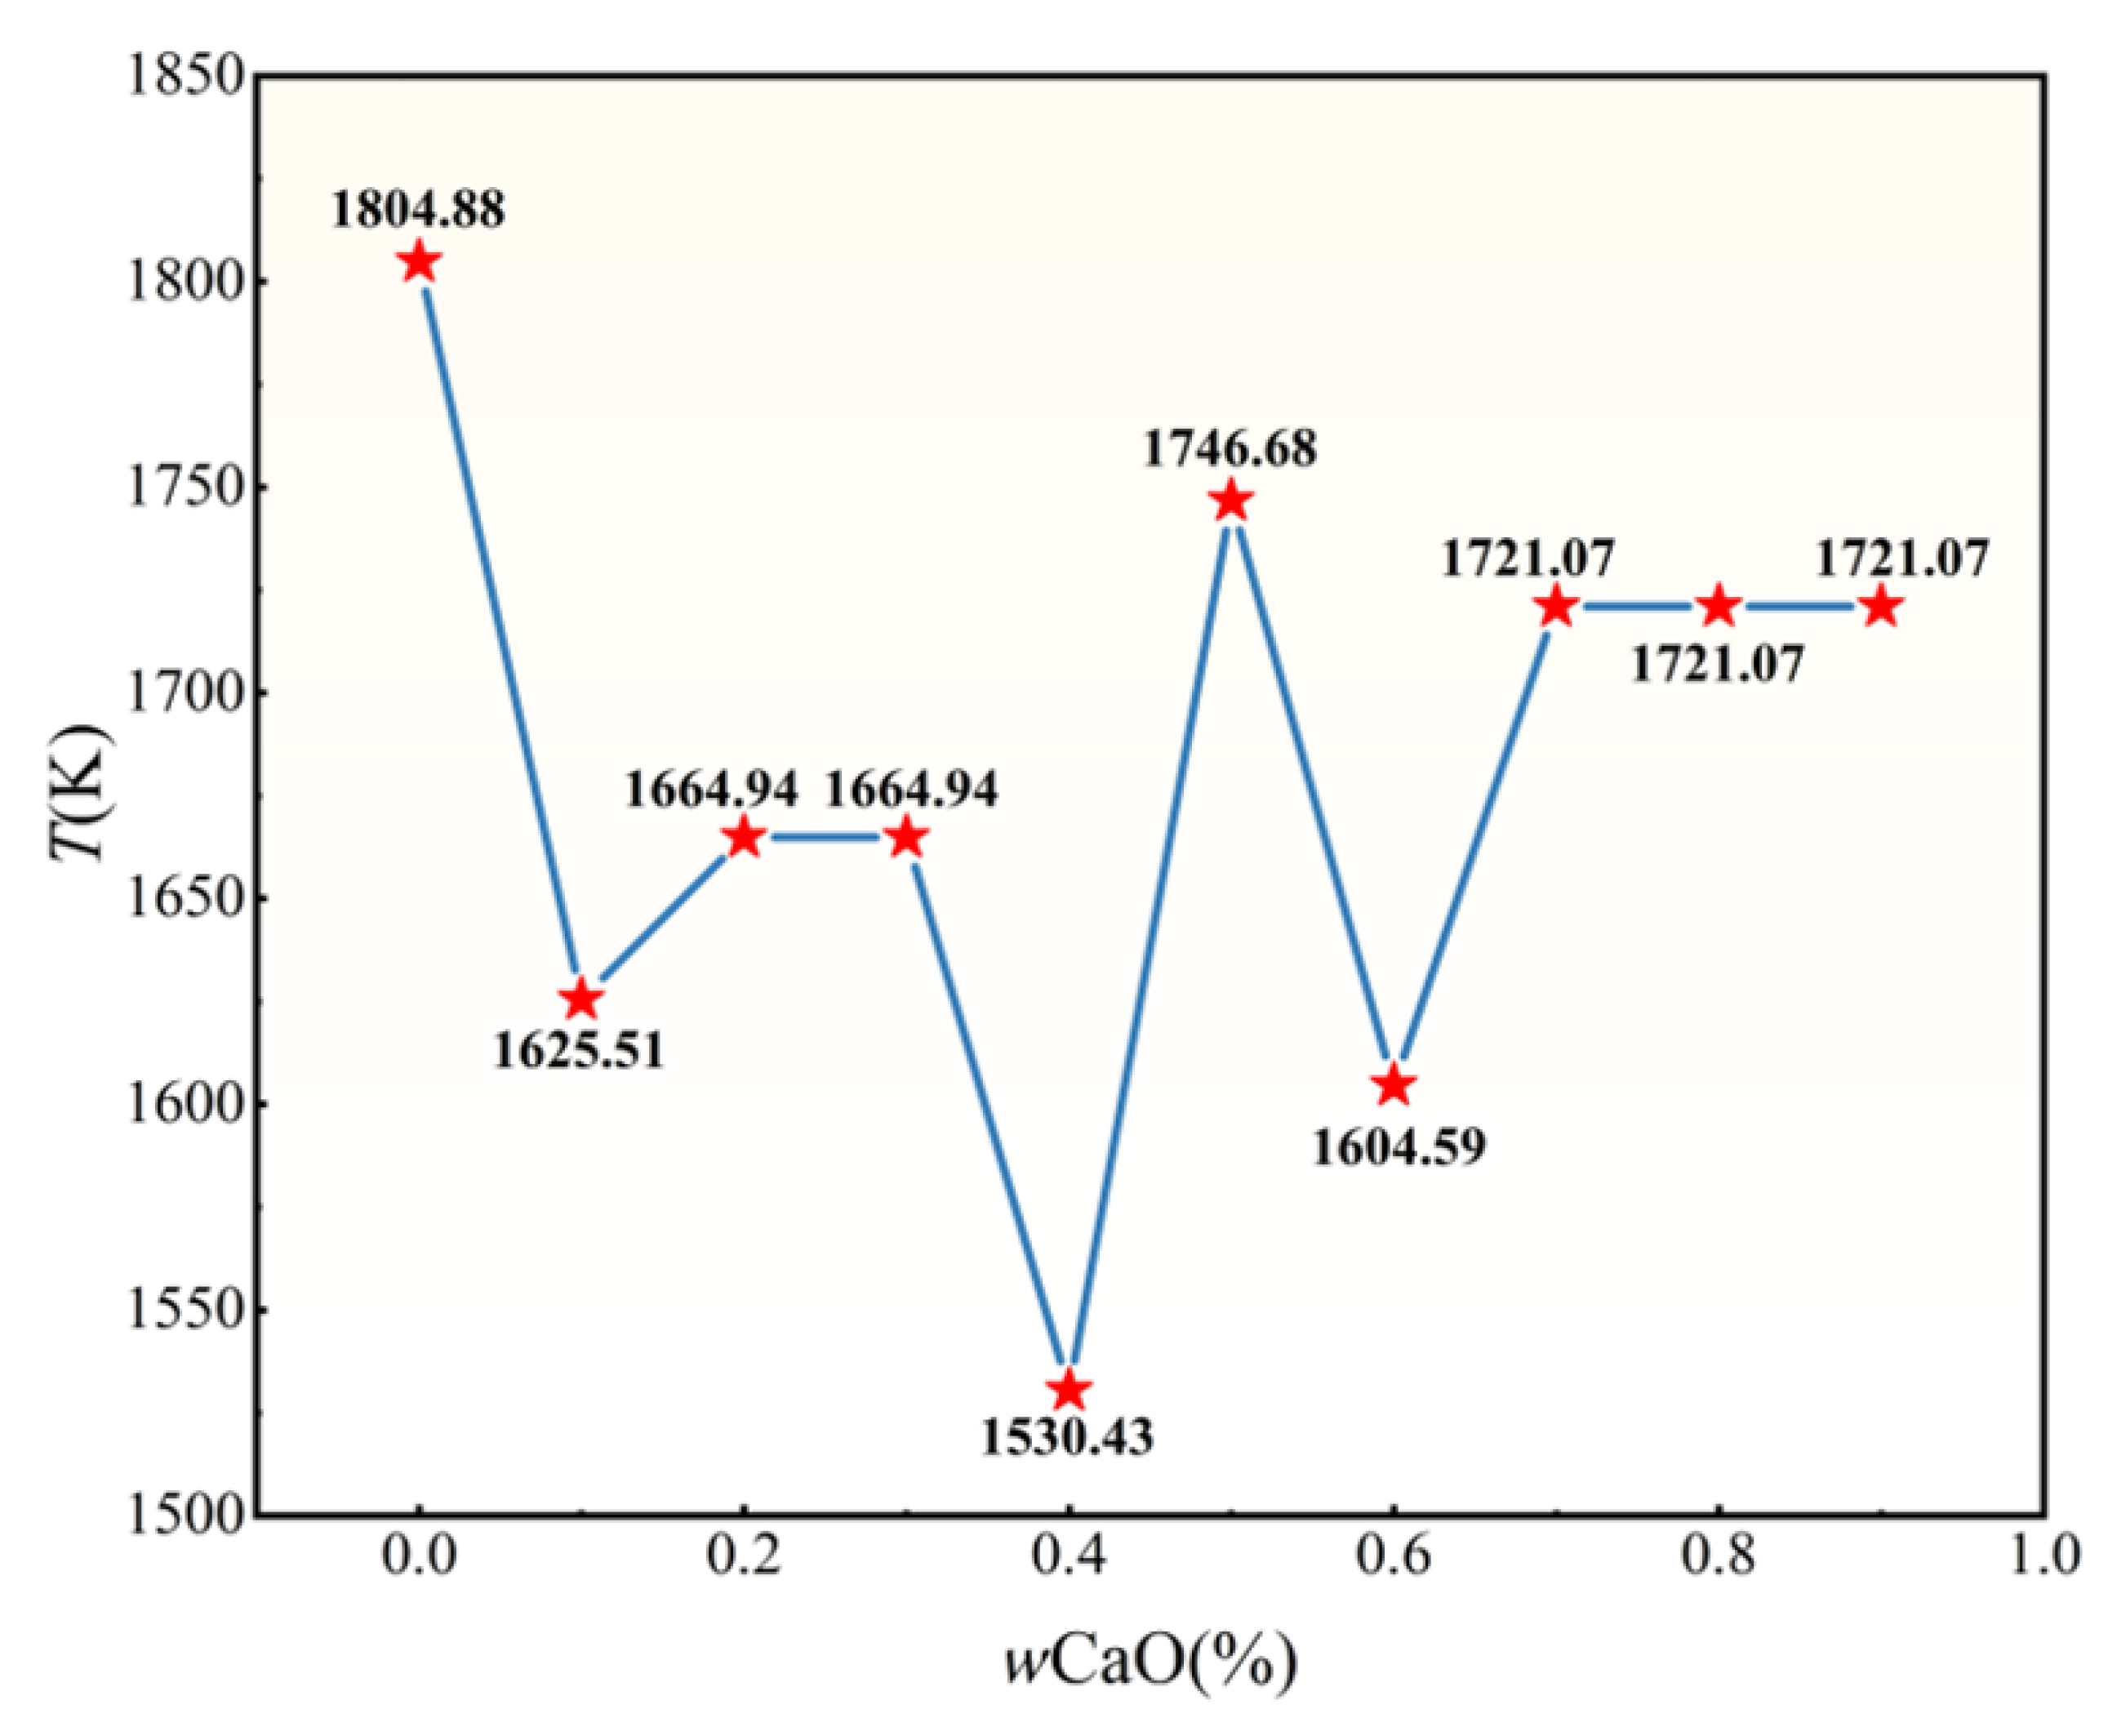
3.1.2. Analysis of the Melting Point of the Slag Phase at Different Calcium Oxide Contents

The melting point results of the C-A-S ternary system with different ratios in the theory were calculated by the phase diagram, and the results of the theoretical analysis of the melting point were plotted to obtain Figure 3. The melting point of the C-A-S ternary system changes with the ratio of calcium oxide. In the figure, we can see that the melting point of the slag phase first decreases and then increases with the increase of calcium oxide, while the melting point of the slag is small between 5% and 45% and between 55% and 65%.

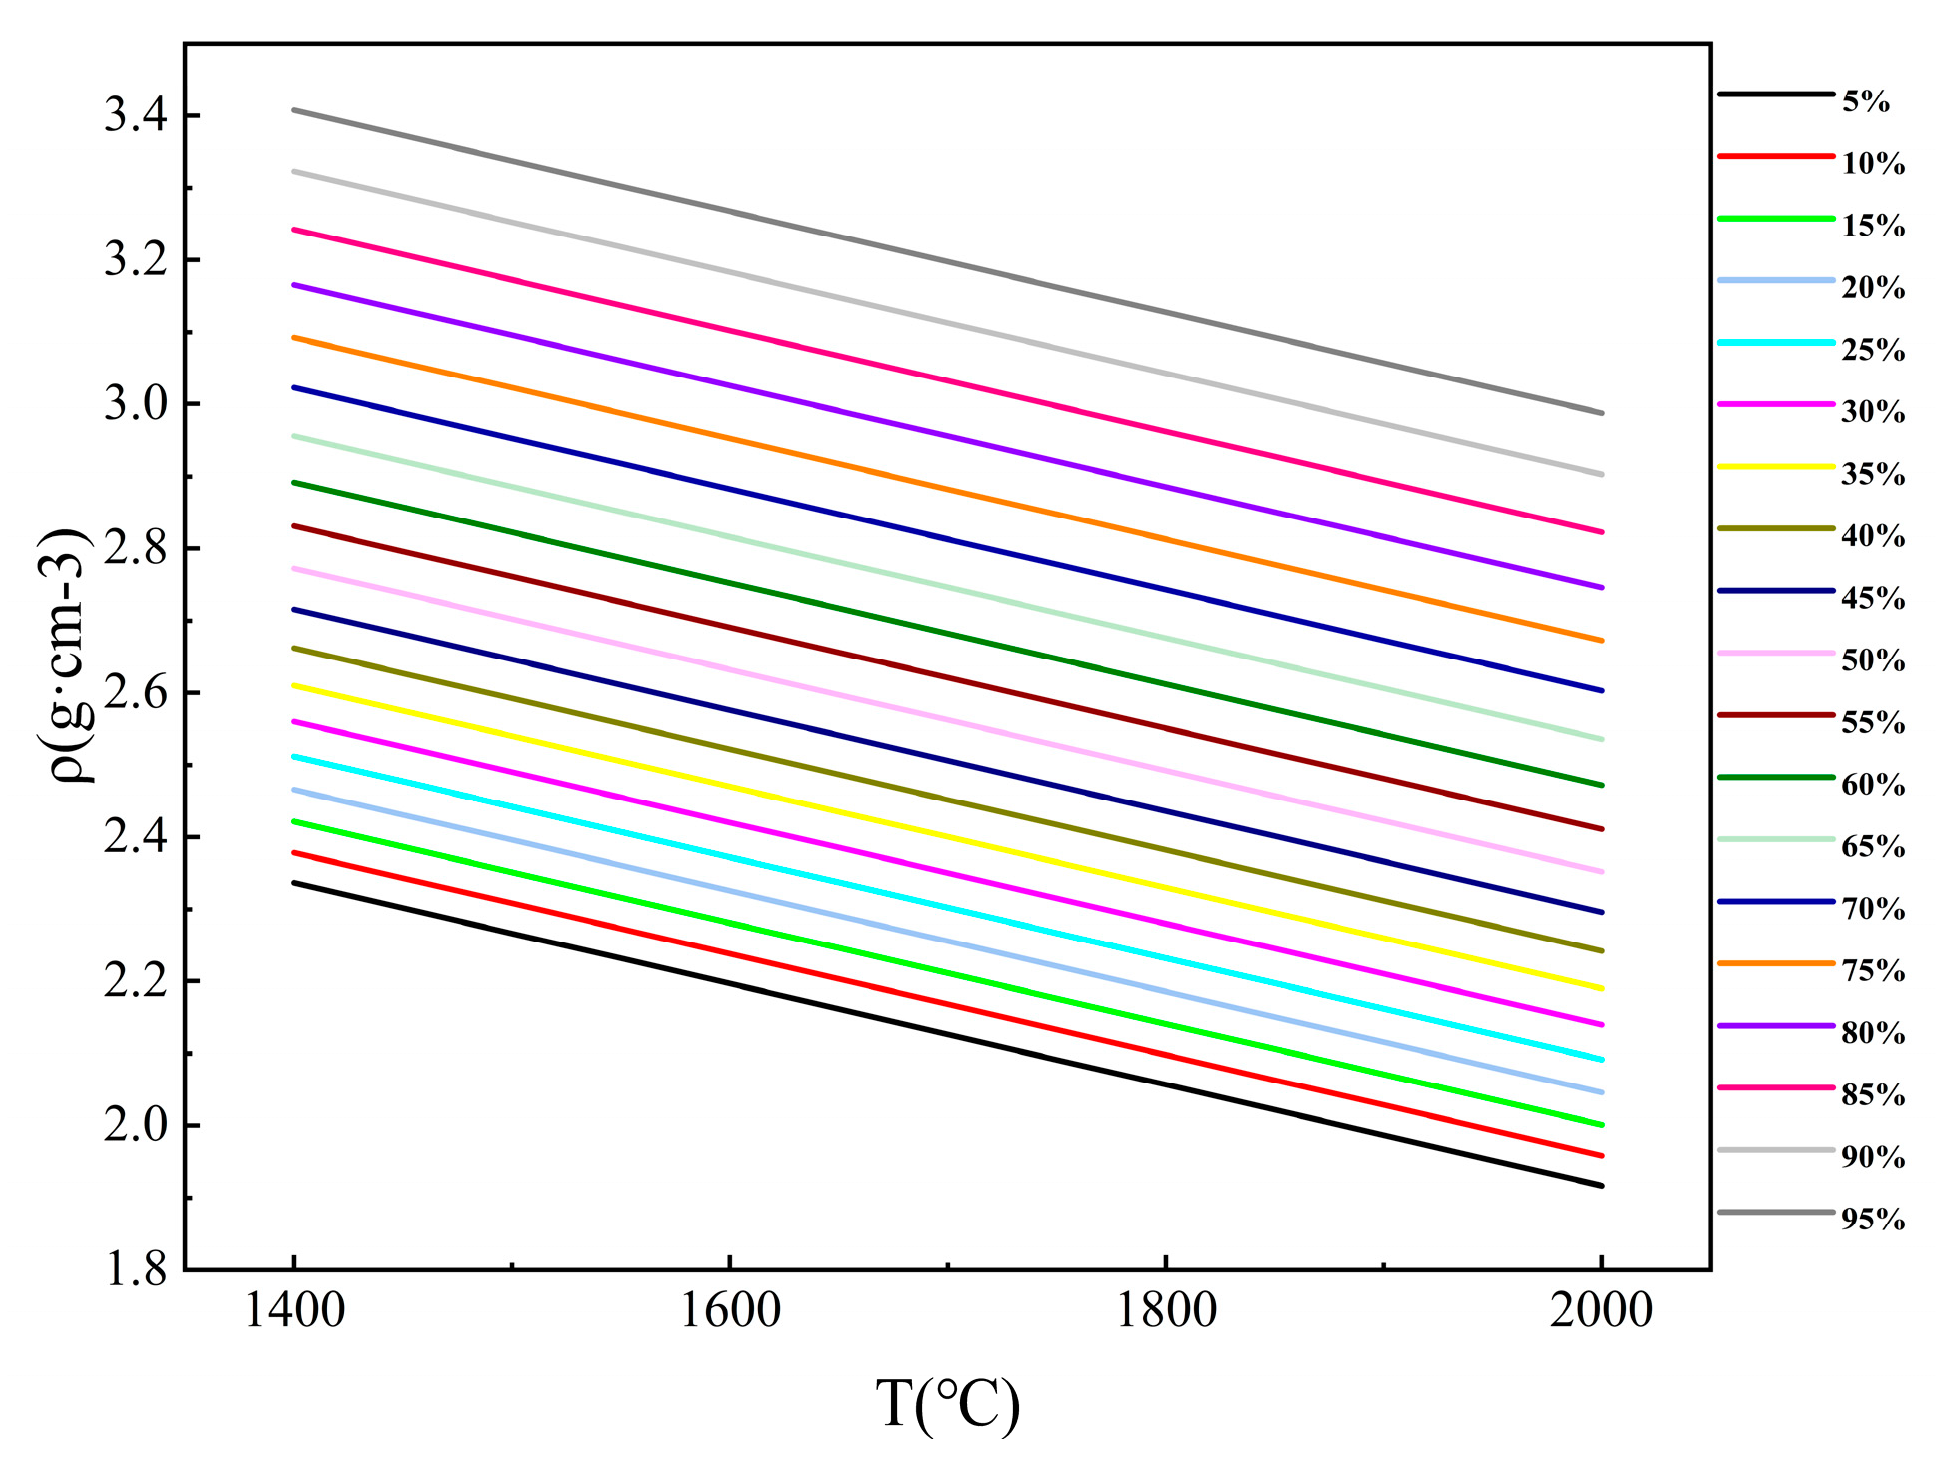
3.1.3. Analysis of Slag Phase Density Under Different Calcium Oxide Content

According to the FactSage7.2, the density under different CaO content was calculated, as shown in Figure 4. It can be seen intuitively from the figure that the density of slag decreases with the increase in temperature, but with the increase of CaO content in slag, the density of slag increases gradually. The density of the slag is about 2.1–3.3 g/cm3, and the density of the manganese-silicon alloy is generally 6.3 g/cm3, so all the calcium oxide content meets the requirements.

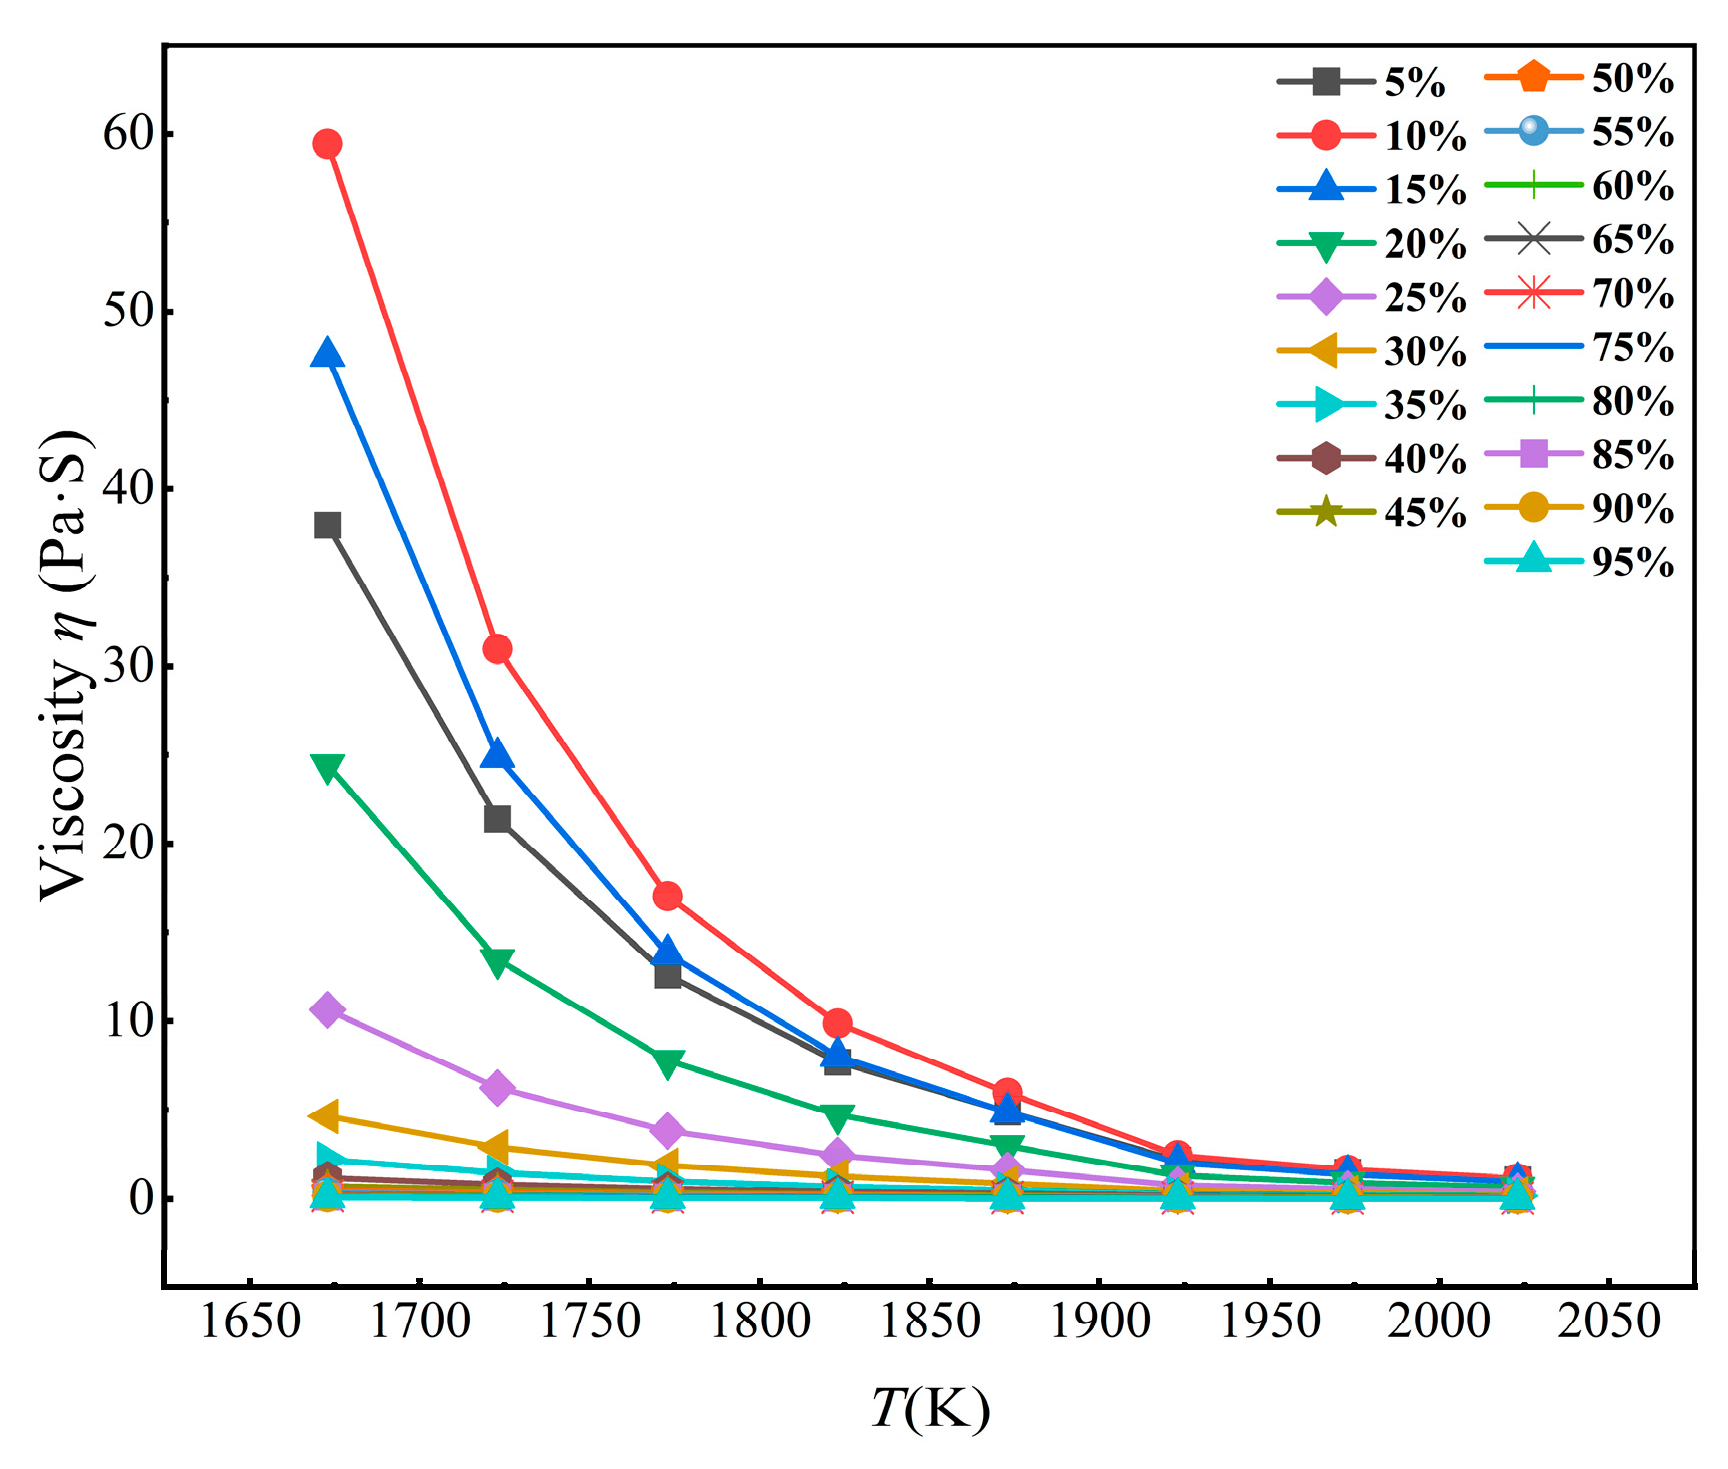
3.1.4. Viscosity Analysis of Slag Phase at Different Calcium Oxide Content

The viscosity of molten slag in industrial production is generally between 0.1 and 0.5 Pa·s, and the flowability is good. Between 1.5 and 2 Pa·s, it hardly meets the melting requirements; a viscosity greater than 3 Pa·s will hinder the melting process and make the slag difficult to discharge. When it is greater than 10 Pa·s, the melting process can hardly proceed normally, but the viscosity value can not be less than 0.1 Pa·s. A viscosity less than 0.1 Pa·s will cause splashing [34].
The relationship between different CaO contents, temperature, and viscosity was calculated using FactSage7.2 software. The calculation results are plotted in Figure 5. From the figure, it is very easy to see that the viscosity generally decreases with the increase in temperature. As the calcium oxide content increases, the increase in viscosity gradually decreases. Overall, the viscosity gradually decreases as the calcium oxide content increases. The higher the temperature, the greater the decrease.
Since the previous process reaction was carried out at 1600 °C, we will mainly discuss the viscosity of slags with different CaO contents at 1600 °C, i.e., 1873 K. It is not difficult to see from the table that as the CaO content increases, the viscosity of the slag gradually decreases. When the CaO content is less than 20%, the viscosity of the slag is greater than 3 Pa·s, the viscosity is too high, and the flowability is poor. When the CaO content is between 30% and 60%, the viscosity of the slag is about 0.1~1, and the fluidity of the slag is better to meet the requirements. If the CaO content is more than 60%, the viscosity of the slag is less than 0.1, and the viscosity is too low, which easily causes spattering and affects the service life of the furnace body. For safety reasons, the content cannot be more than 60%. The theoretical analysis shows that the CaO content between 20% and 40% is the best choice, but in the actual experiment, the slag will contain some impurities, such as SiC, which will change the viscosity of the slag.
Based on the theoretical analysis, considering the safety of the experiment, the CaO contents of 5%, 10%, 15%, 20%, 25%, 30%, 35%, 40%, 45%, and 50% were selected as the gradient for the experiment, and the experiment was carried out at 1600 °C for 6 h.

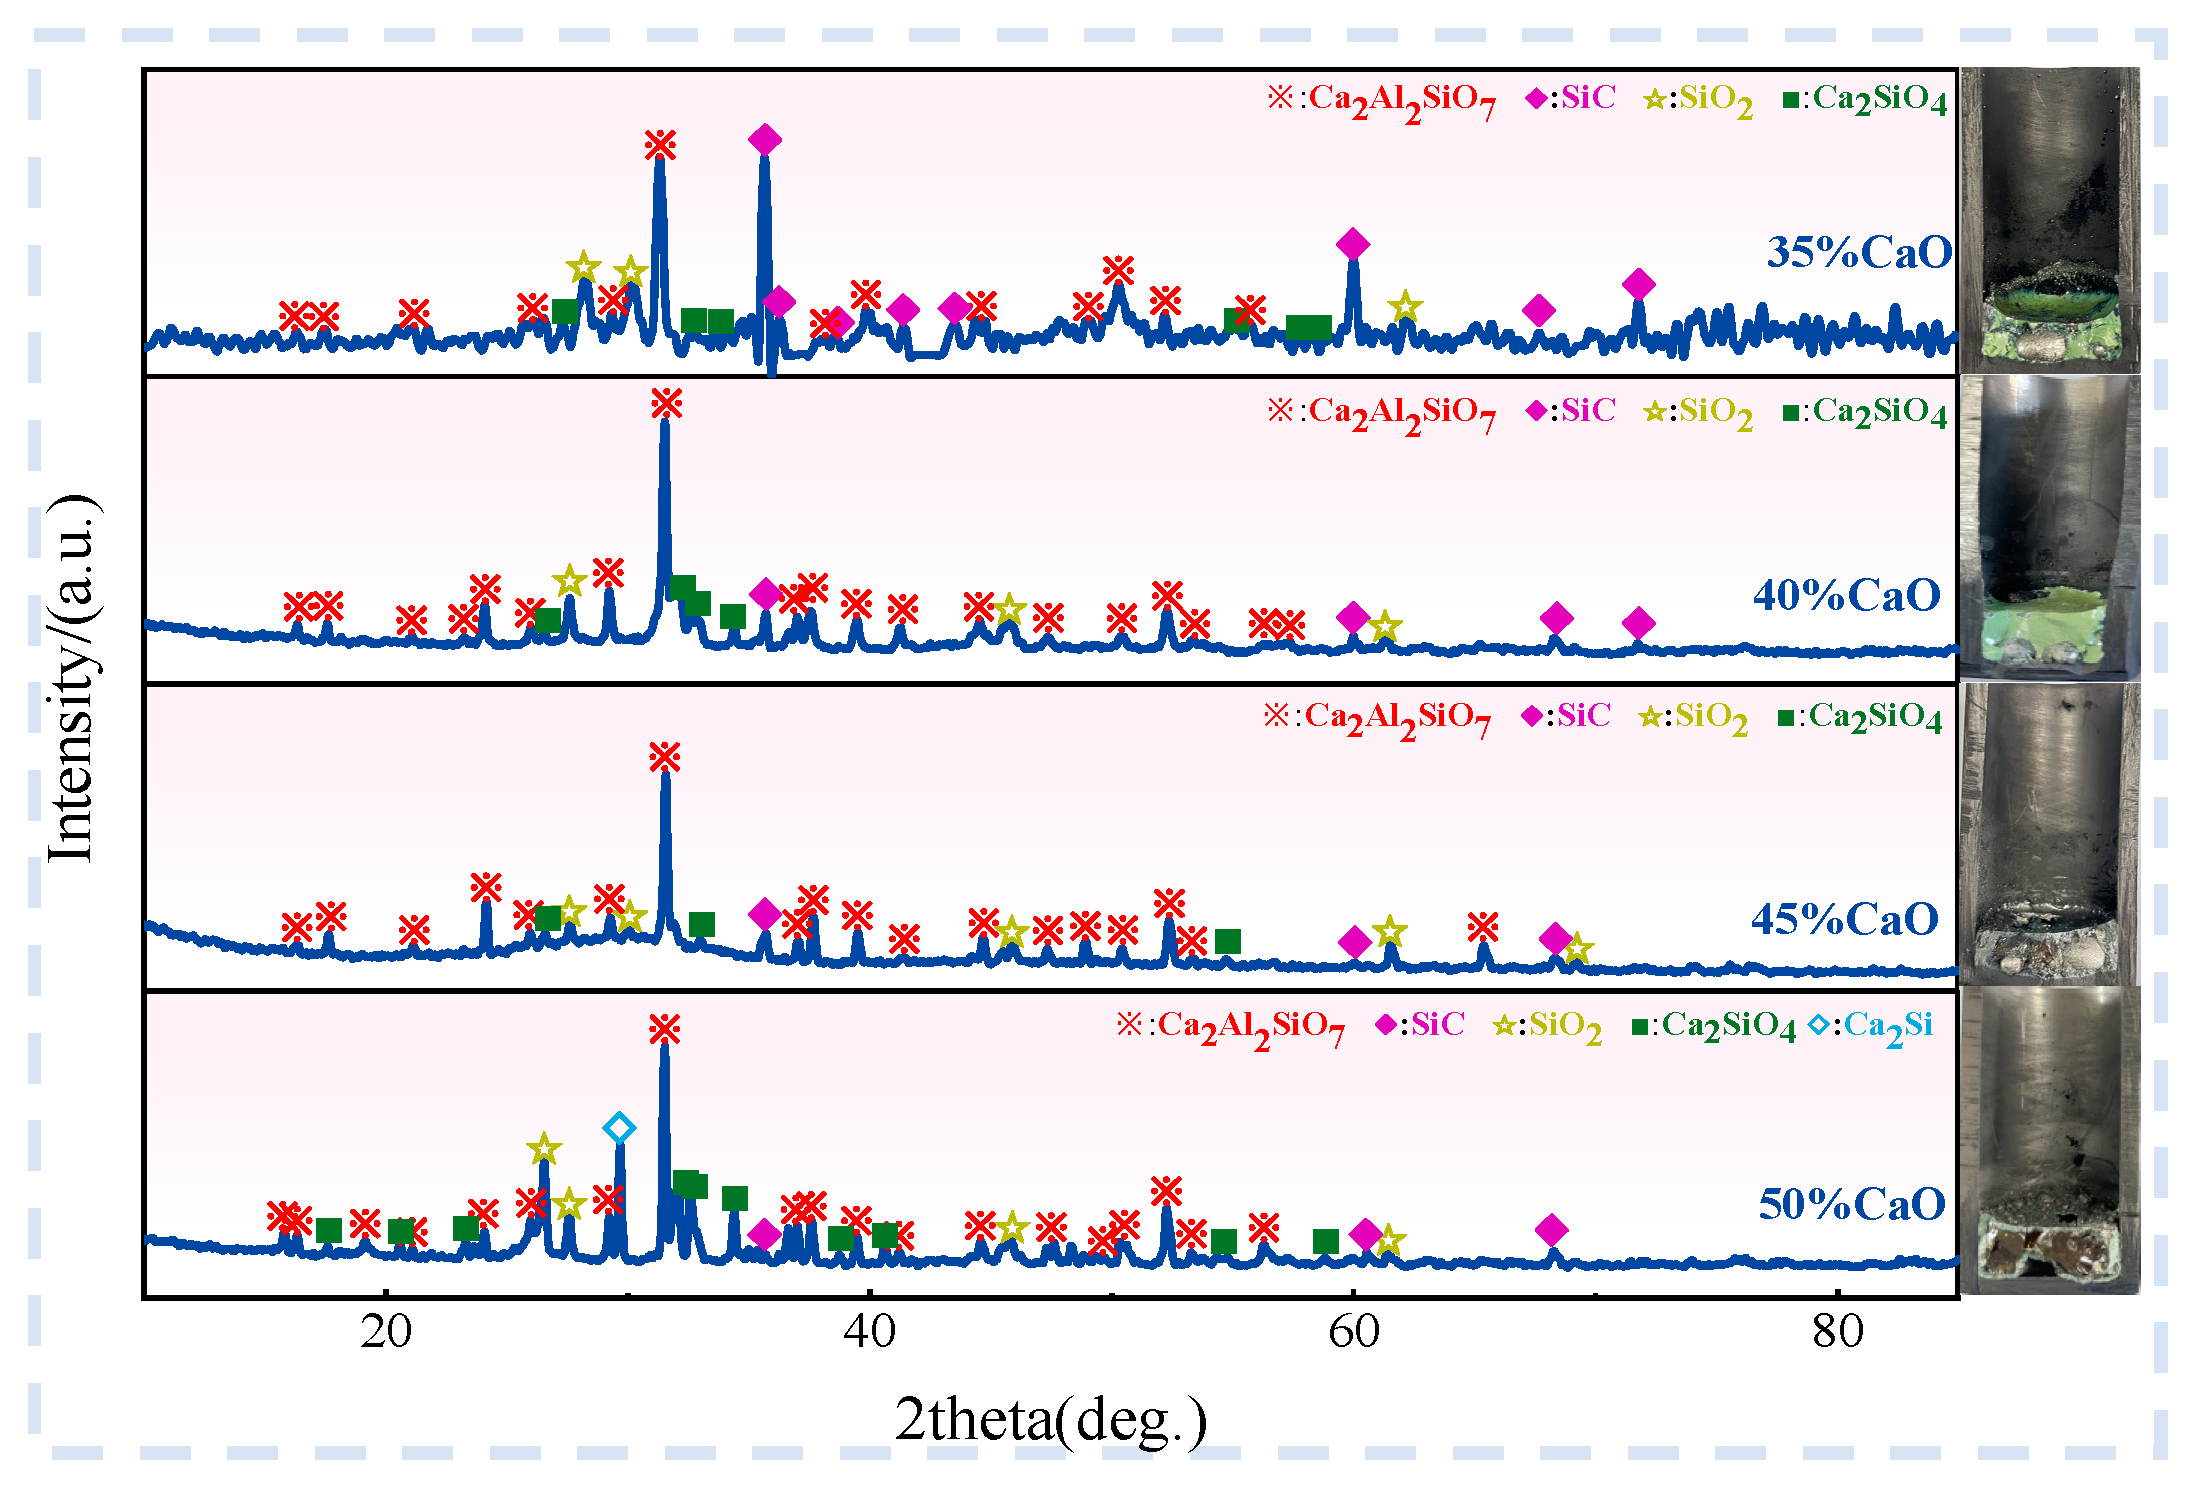
3.2. Effect of Calcium Oxide Slagging Agent on Phase Control of Spodumene Carbothermic Reduction Slag and Condensate Analysis After Reduction

The slag obtained at different CaO contents was analyzed. The results are shown in Figure 6. It is easy to see from Figure 6 that without the addition of CaO, the alloy could not be completely aggregated, and the slag contained many metal particles. After the addition of CaO, the alloy aggregation is more obvious. When the amount of CaO added is 5–30%, the whole alloy is formed. There is no obvious metal block or metal ball in the slag. The alloy and slag phase are obviously layered, and the slag surrounds the alloy or slag in the upper layer of the alloy. At 35–45%, the alloy starts to disperse, and no whole alloy appears; at 50%, the alloy does not accumulate, and many metal particles are scattered in the slag because of excessive calcium oxide, which makes the direct yield of the alloy low.
It can be seen from the figure that when CaO is not added, the slag contains LiAlSiO4, and the spodumene does not react completely. The presence of Mn5Si3 in the slag phase indicates that the slag–metal separation is not thorough enough, and there are Al2O3, SiO2, and SiC. When the CaO content is 5%, the main products of the slag are LiAlSiO4, Ca2Al2SiO7, SiO2, SiC, and a small amount of Ca2SiO4 and Al2O3. There is no Mn5Si3 phase in the slag, indicating that the alloy is aggregated, but the spodumene is not yet fully reacted. When the CaO content is 10%, the LiAlSiO4 phase disappears, and the spodumene reaction is basically completed at this CaO content, indicating that the addition of CaO promotes the decomposition of spodumene and makes the reaction more thorough, but there is still a small amount of Al2O3 in the slag phase. The Al2O3 phase in the slag is all in the slag when the CaO content is 20%, and the Al2O3 disappears when the CaO content is 25%, indicating that the Al2O3 has been converted into a new phase, i.e., Ca2Al2SiO7. When the CaO content is 30%, the alloy has the best aggregation effect, and the main products of the slag are Ca2Al2SiO7, some SiC, SiO2, and a small amount of Ca2SiO4. When the CaO content is 35–45%, the main products of the slag are Ca2Al2SiO7, SiC, SiO2, and Ca2SiO4, and there is no Mn5Si3 phase in the slag. There are alloy blocks, but the alloy aggregation effect is not good. When the CaO content is 50%, the Ca2SiO4 peak in the slag increases, and a small amount of Ca2Si appears. There is no obvious alloy block; all are scattered metal particles.
Because of the small amount of feed and low lithium content in the raw material, it was difficult to collect the lithium-rich ash effectively, so we collected the lithium-rich ash after many experiments. The collected lithium-rich ash was subjected to XRD detection, as shown in Figure 7. From the figure, we can see that Li mainly existed in the form of Li2SiO3, which was due to the formation of eutectic compounds between Li2O and SiO2 at 1301 K–1474 K [35]. Li in the raw material was removed in the form of Li vapor, and Li2O was formed in the presence of air, which reacted with SiO2 to form Li2SiO3. The content of Li2O in the condensate detected by an atomic absorption spectrophotometer was 4.31%, which was 10.81 times higher than that of the raw material spodumene.

3.3. The Reduction Rate of Lithium and the Direct Yield of Manganese-Silicon Alloy

ϑ Li = ( 1 ω L i m 1 M L i m 0 ) × 100 %
The reduction rate of Li is represented by ϑ Li , M L i is the content of Li in spodumene, and m0 is the mass of spodumene in the feed. ω L i is the content of Li in the reduction residue, and m1 is the mass of the reduction residue.
β Mn-Si = m Mn-Si M Mn-Si × 100 %
where β Mn-Si is the direct yield of Mn-Si, m Mn-Si is the mass of Mn-Si and M Mn-Si is the mass of Mn-Si in the raw material.
The lithium reduction rate at different CaO contents is shown in Figure 8a. Five groups of experiments were carried out for each CaO content; the highest lithium reduction rate was drawn into a line chart, and the rest was drawn in a scatter diagram. It can be seen from the diagram that the reduction rate of lithium increases with the increase in CaO content, indicating that the addition of CaO can promote the reduction of lithium.
The direct yield of manganese-silicon alloy under different CaO content is shown in Figure 8b. The highest direct yield of manganese-silicon alloy under each CaO content is plotted as a line graph, and the rest is plotted as a scatter graph. It can be seen from the figure that the direct yield of manganese-silicon alloy under different CaO contents gradually increases and then starts to decrease.
In general, the direct yield of manganese-silicon alloy is the highest when the CaO content is 30%, and the reduction rate of lithium does not increase by more than 0.5% when the CaO content is 30%, indicating that the raw material spodumene reacts completely after this content.

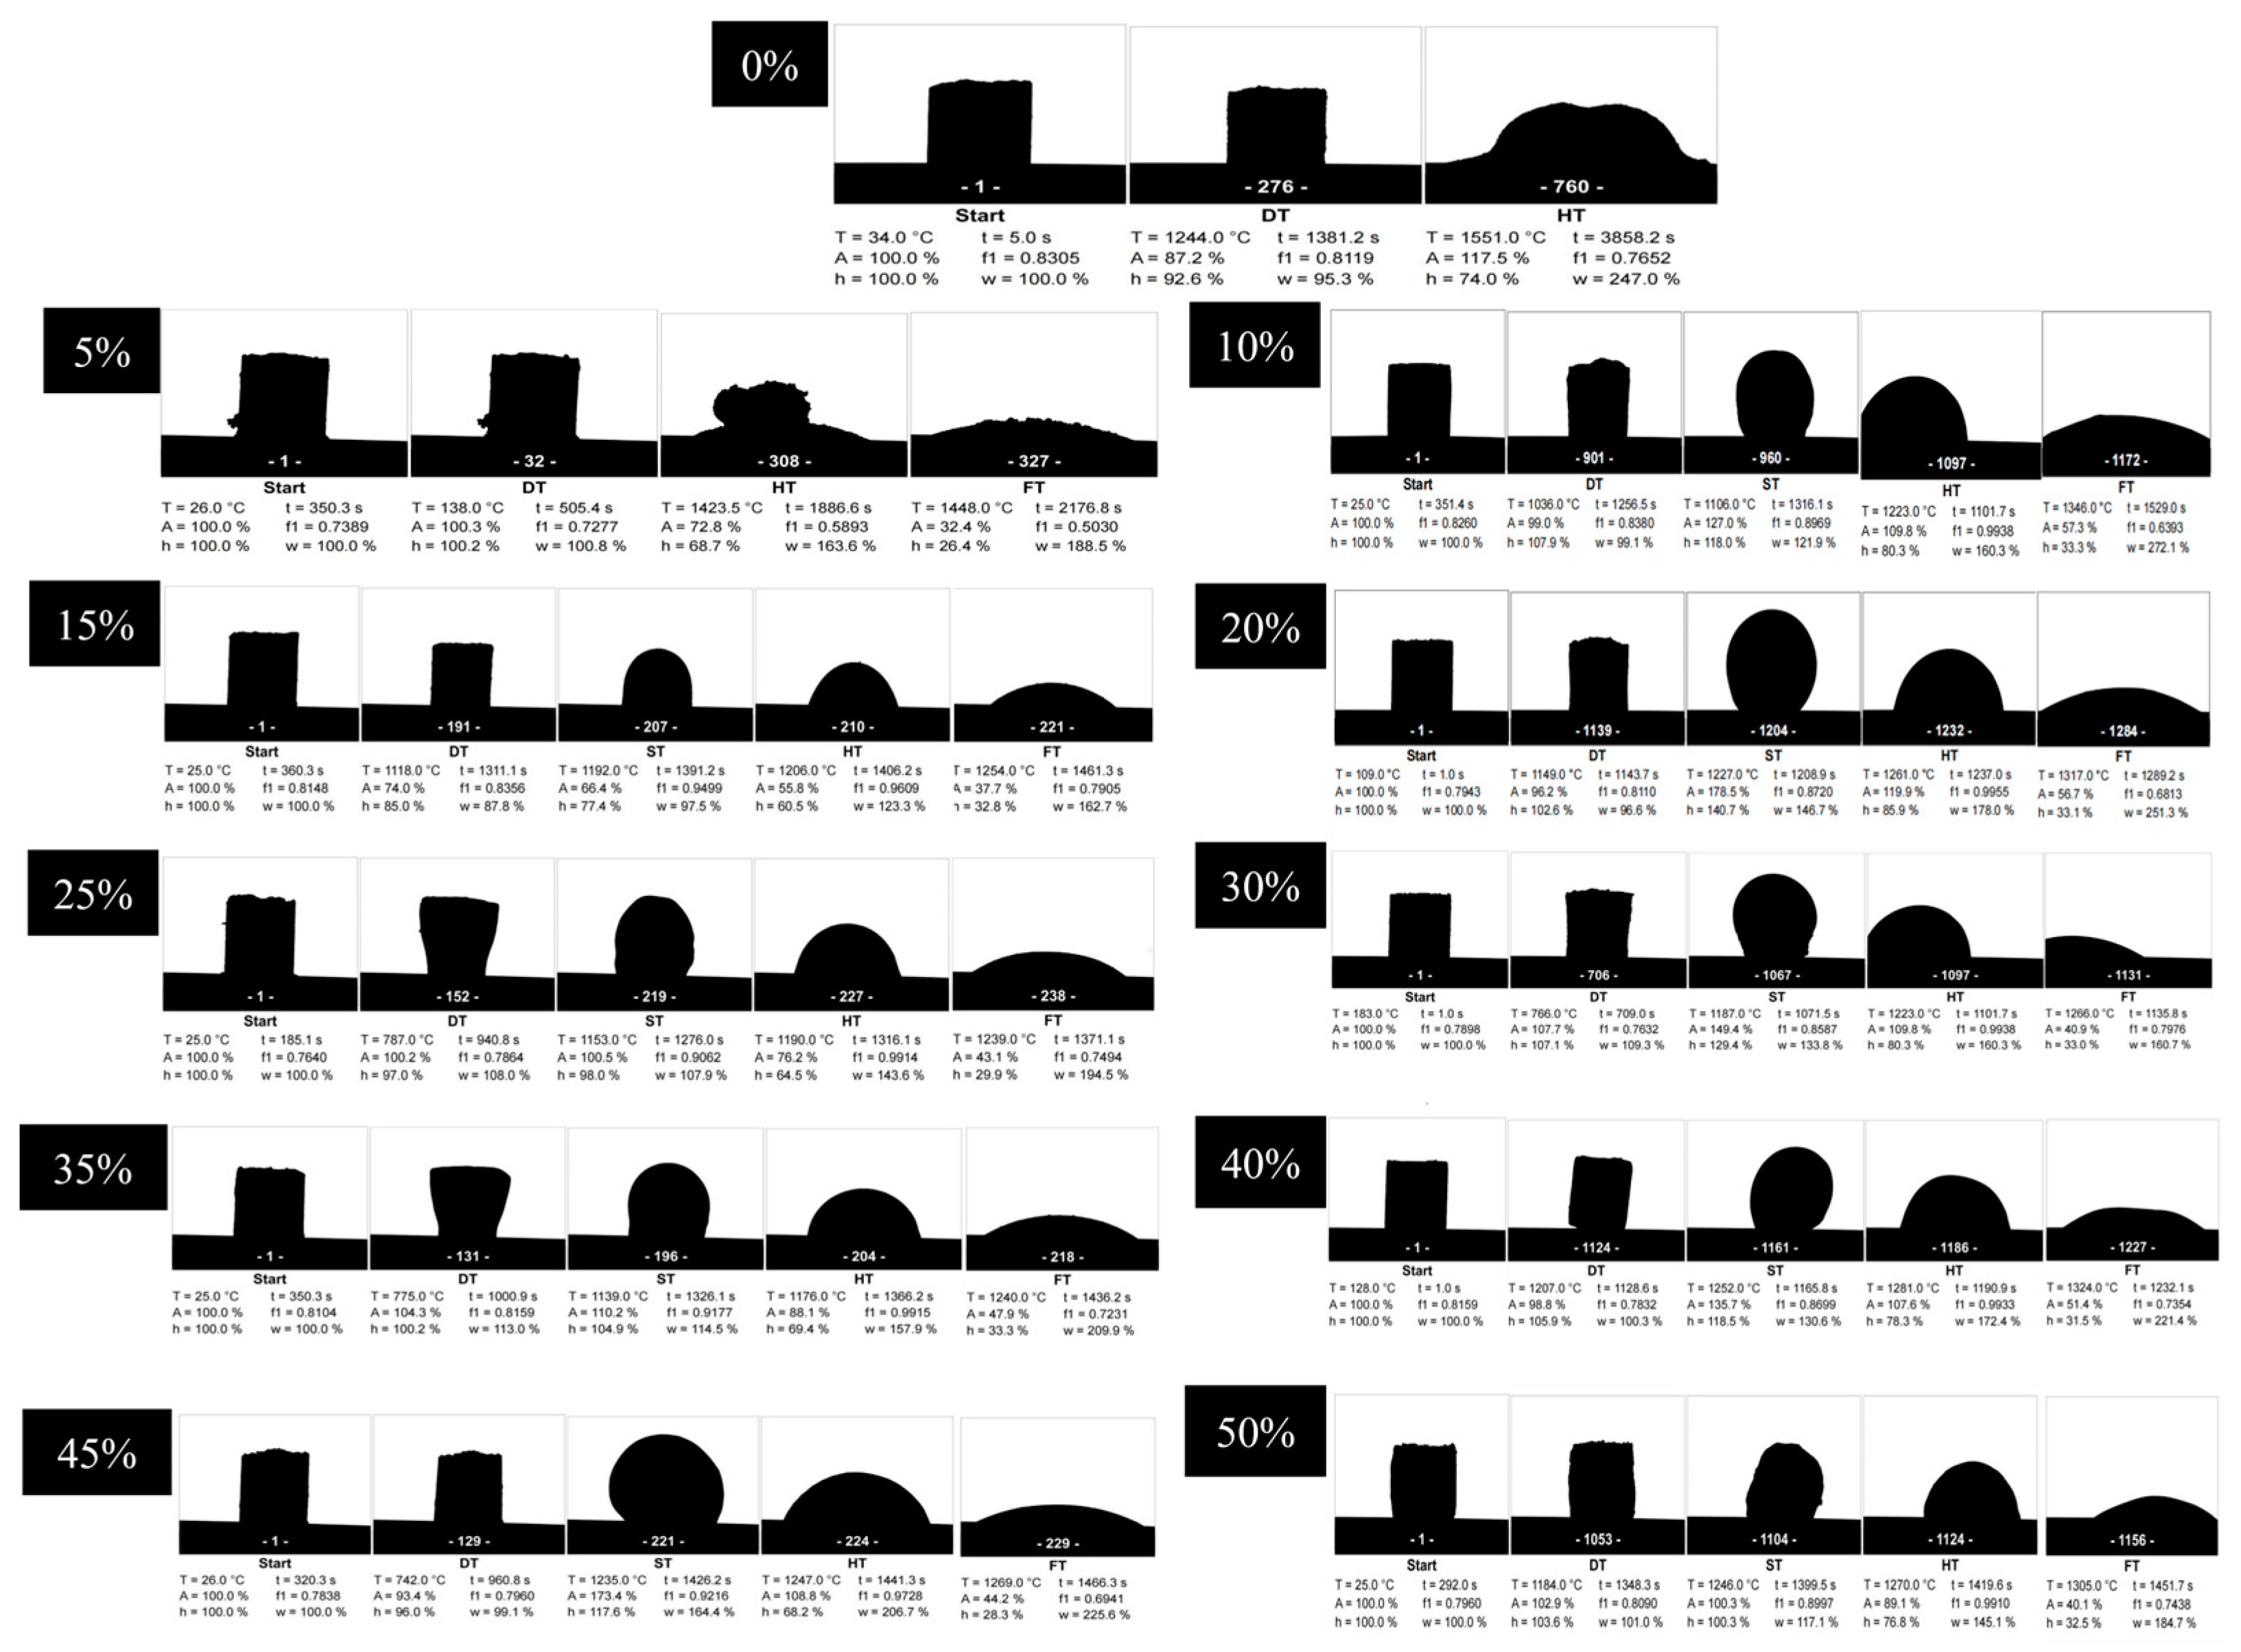
3.4. Melting Point Analysis

The melting slag of the experiment was sampled and ground, and the melting point of the sintering slag with different CaO ratios was detected using the German HESSE type (model EM301-M17) high-temperature melting point detector. About 1 g of the slag was placed on the press. The column of material shown in the diagram was pressed under 18 MPa pressure and observed under the melting point detector. The results are shown in Figure 9.
It can be seen from Figure 9 that when CaO was not added, the initial melting temperature of the slag was not measured, and the maximum test temperature of the equipment was 1600 °C. Therefore, the melting point of the slag phase should be higher than 1600 °C when CaO is not added. When the calcium oxide content was 5–50%, the initial melting temperature of the slag was 1448 °C, 1346 °C, 1254 °C, 1317 °C, 1239 °C, 1266 °C, 1240 °C, 1324 °C, 1269 °C, 1305 °C, respectively. The melting point decreases, increases, and then decreases with the increase in the amount of calcium oxide, which is consistent with the theoretical analysis results. There was a small amount of SiC in the slag, which led to a small difference between the melting point and the theory. The melting point of slag with 5–25% CaO content shows a downward trend. When the CaO content is 25–35%, the melting point is low. When the CaO content is 25%, the melting point of the slag is the lowest at 1239 °C. When the CaO content is 35–40%, the melting point of the slag generally increases. When the CaO content is 35%, the melting point of the slag is lower at 1240 °C.
According to the XRD, physical map, lithium reduction rate, and direct recovery rate of manganese-silicon alloy, when the content of CaO is 30%, the melting point of slag is 1266 °C, and the melting point of Mn5Si3 is 1320 °C [36]. The slag can be melted first to surround the alloy, which plays a role in heat preservation and air insulation for the metal melt, reducing the oxidation of metal; the lithium reduction rate is 99.02%. The highest direct yield of manganese-silicon alloy is 89.12%, the alloy aggregation effect is the best, and the slag–metal separation is obvious. Therefore, it is considered that the CaO content of 30% is the best CaO addition.

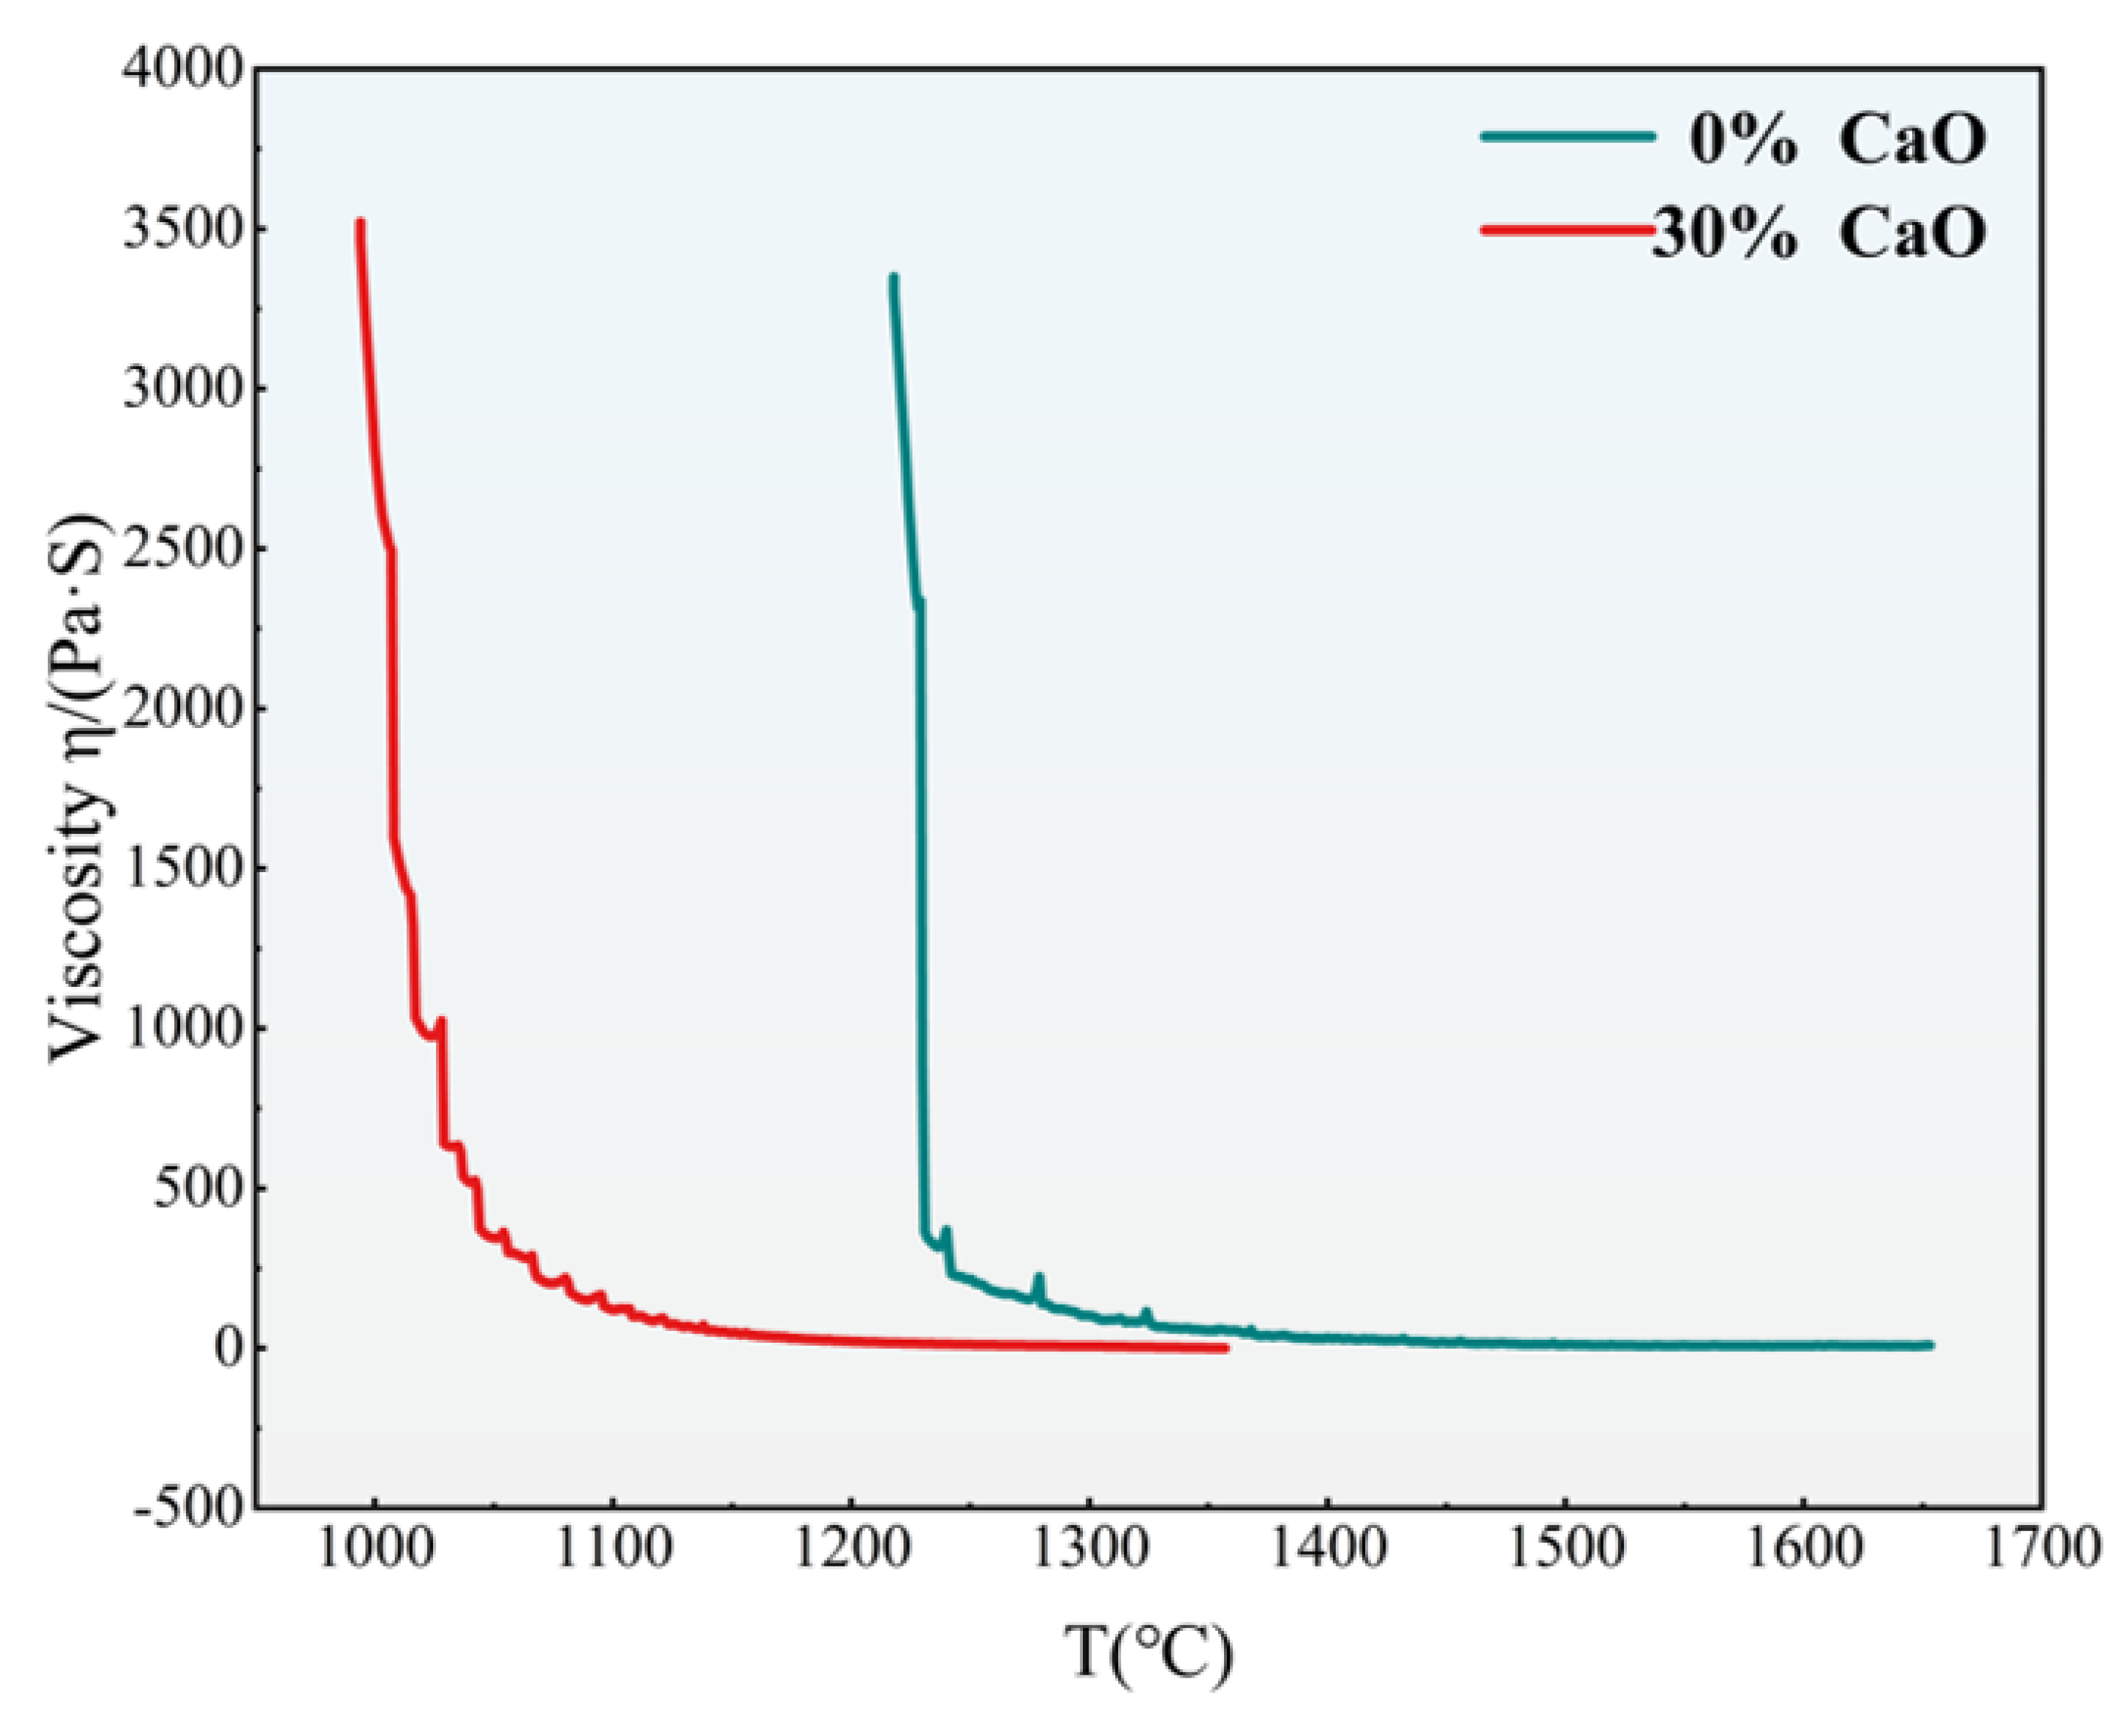
3.5. Viscosity Analysis

Based on the XRD, lithium reduction rate, alloy direct yield, and melting point detection, the optimum CaO addition amount was analyzed when the CaO content was 30%. Therefore, we chose the optimum CaO content, that is, when the CaO content is 30%, to analyze the viscosity of the slag without calcium oxide.
After collecting the slag with two CaO content values, 45 g each was taken and placed in a graphite crucible. The graphite crucible was placed in a viscosity detector to begin heating. When the slag phase began to melt, the rotor was lowered to touch the top of the slag phase. When the slag phase was completely melted, the rotor was fully immersed, and the rotor speed was controlled at 5 ppm. Viscosity was measured during the cooling process. The test results are plotted in Figure 10. It can be seen that the addition of CaO is effective in reducing the viscosity of the slag phase. When CaO is not added, the viscosity of the slag phase is high before 1240 °C, and the viscosity gradually decreases with increasing temperature. After 1400 °C, the viscosity tends to be softer. At 1650 °C, the viscosity of the slag is 9.37 Pa·s, which is close to the industrial metallurgical process. At a slag viscosity of 10 Pa·s, the slag is difficult to discharge. At the same temperature, the viscosity of the slag phase when the CaO content is 30% is lower than that of the slag when the calcium oxide is not added. At 1360 °C, the viscosity of the slag is 0.11 Pa·s, reaching the most suitable slag viscosity in industrial production. This indicates that the existence of Ca2+ makes the Al2O3 with a higher melting point in the slag phase become the calcium aluminum silicon slag with lower melting point viscosity, namely, Ca2Al2SiO7, and Ca2+ will crack the silicon-oxygen ions in the raw material spodumene into simple silicon-oxygen ions, reduce the viscosity, and reach the best range of fluidity in the actual industrial production.

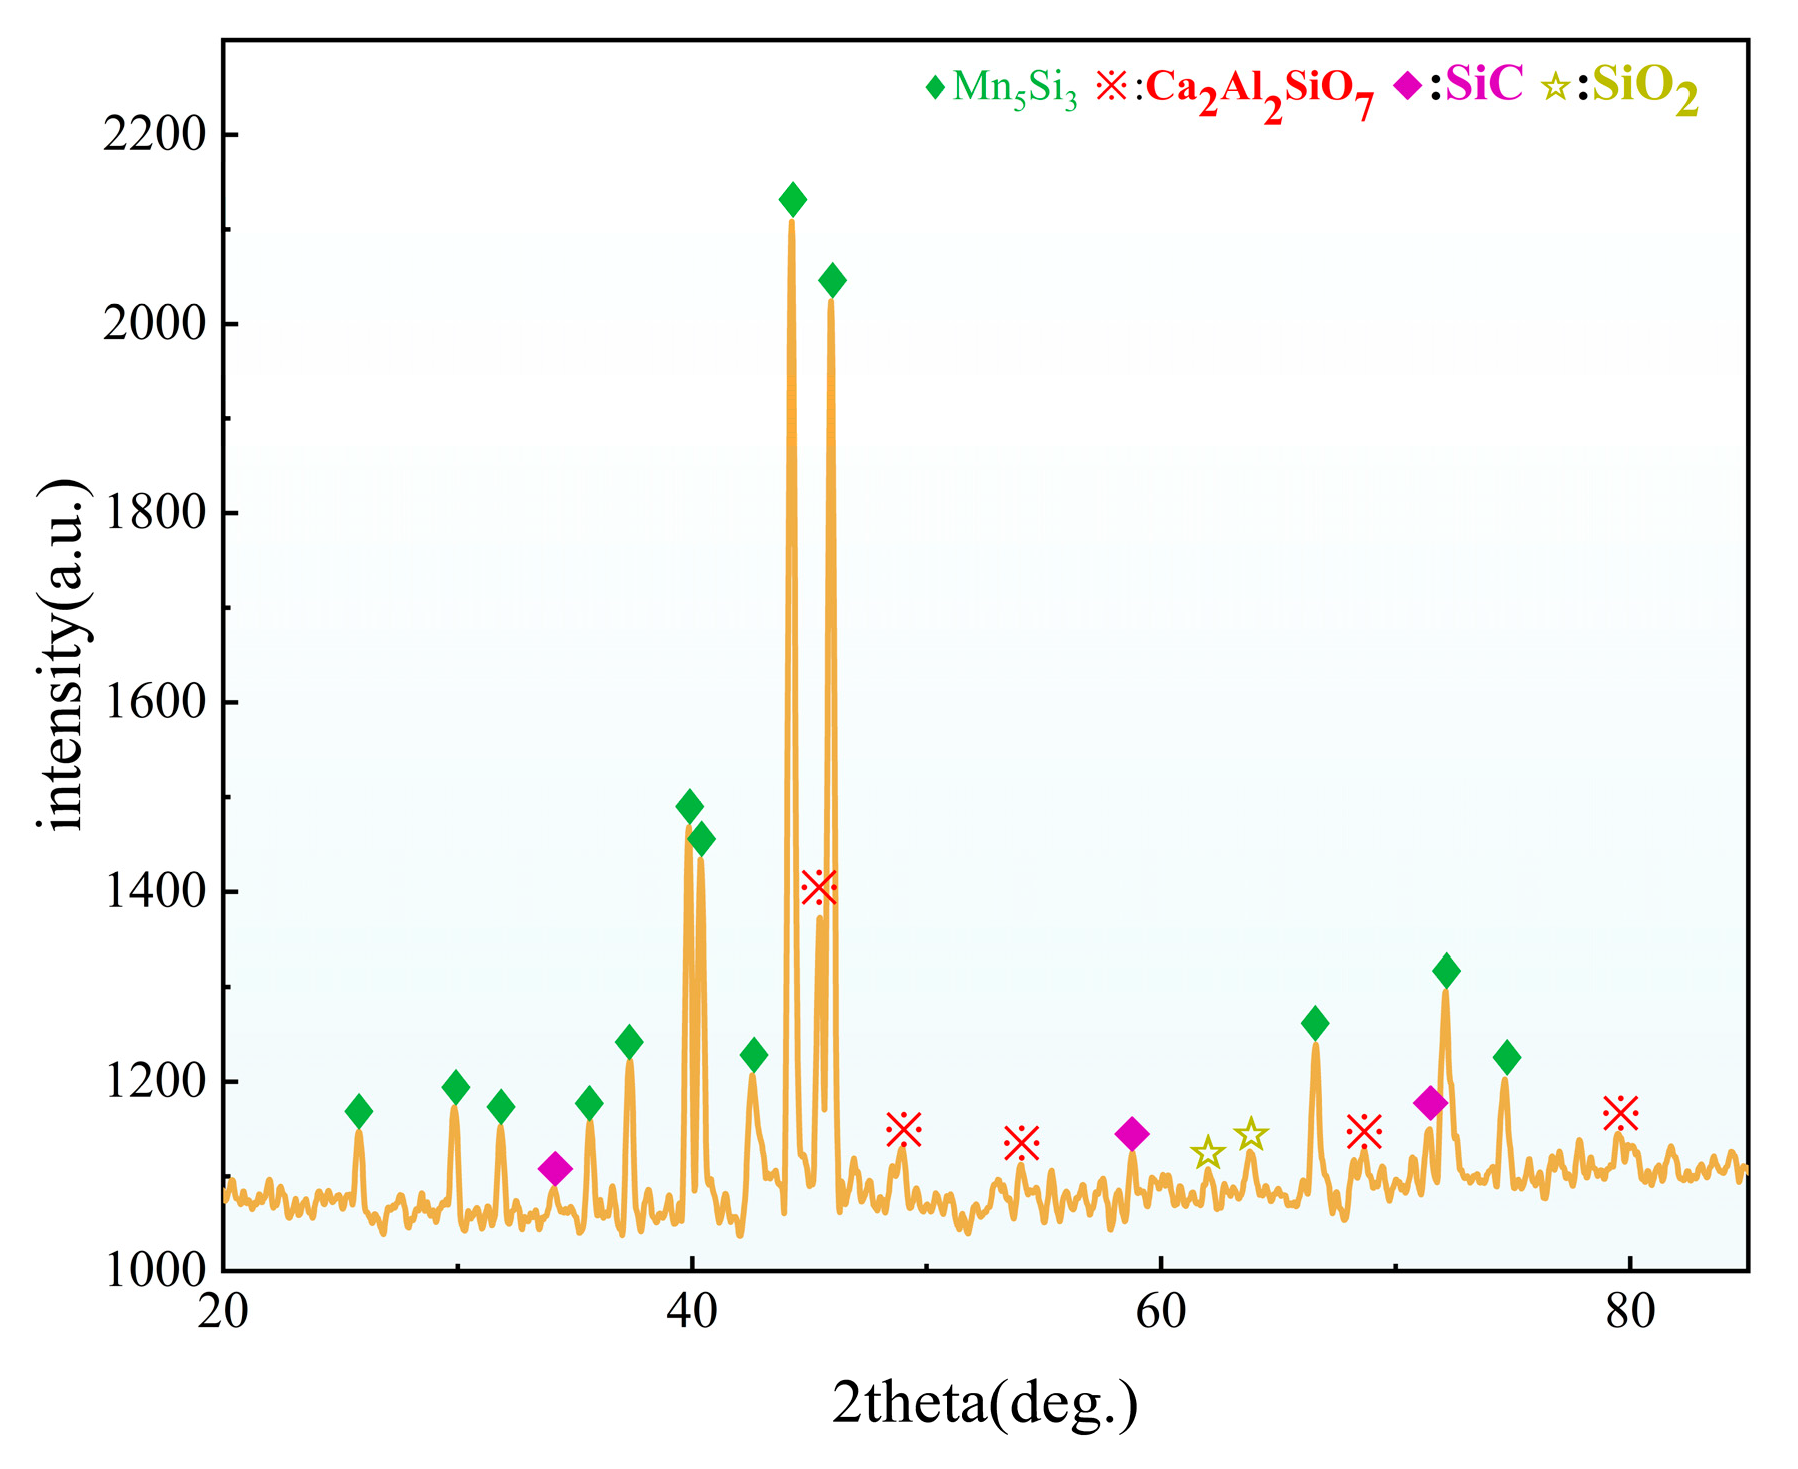
3.6. The Slag Phase and Chemical Composition of the Alloy with 30% CaO Content and the Alloy XRD

According to the optimum CaO content of 30%, the composition analysis of the alloy and slag phase is shown in Table 5 and Table 6. A small amount of slag may adhere to the surface during the detection of the alloy, so the composition of the slag phase is shown, as shown in Figure 11.

3.7. Electron Microscopy Analysis

The slag and alloy with 30% CaO content were analyzed by SEM-EDS, and the results are shown in Figure 12.
The alloy has a bright white, smooth surface with no cracks or other defects, and the alloy quality is better. Figure 12b,c show that the coincidence degree of Mn and Si is high.
Figure 12d–i are the SEM-EDS diagrams of the slag. Point 1 is scanned, and the results are shown in Figure 12e. Combined with XRD analysis, the compounds at this point are Ca2Al2Si2O7 and Ca2SiO4. The four elements of Ca, Al, Si, and O in the surface scan of the slag have a high degree of coincidence. Combining the surface scan results and the point scan results of the slag, it can be seen that the slag mainly contains Ca2Al2Si2O7, which is consistent with the XRD analysis results.

4. Discussion

According to the experimental results, we can see that the addition of CaO can effectively improve the properties of slag. According to the literature, when CaO is added as a slagging agent, the highly active CaO first destroys the bond position in the structure of the raw material spodumene, promotes the reduction of metal lithium, and increases the reduction rate of lithium [37]. It shows that too much CaO destroys the bond between Mn and Si [38], and the excessive addition of CaO makes the excess Ca combine with Al and Si to form Ca2Al2SiO7 and Ca2SiO4, which is not conducive to the growth of the alloy and reduces the formation of the alloy, which is consistent with the analysis in XRD and physical map. It can be seen from XRD that Li exists in the form of Li2SiO3. Li2SiO3 can be leached by acid (0.75 mol/L) under normal pressure for 1 h, and Na2CO3 (225 g/L) is added to the reactor at a speed of 1.5 mL/min and precipitated at 90 °C for 1 h [39].

5. Conclusions

From the perspective of melting point and viscosity, the theoretical calculation and analysis shows that when the CaO content exceeds 50%, the viscosity is too small. In order to prevent the spattering, considering the safety of the experiment, 5%, 10%, 15%, 20%, 25%, 30%, 35%, 40%, 45%, and 50% were selected for the experiments. The experimental results show that the addition of CaO can achieve better slag-metal separation. Compared with the absence of CaO, the reduction rate of lithium can be increased by 0.46% to 1.89%, and the direct yield of the alloy is 0.41% to 2.65%. It is demonstrated that the addition of a slagging agent is beneficial for the removal of lithium and the separation of slag and metal.
Based on the analysis of XRD, slag-metal separation state, lithium reduction rate, alloy direct recovery rate, melting point, and viscosity, the slag-metal separation effect is best when the CaO content is 30%. The lithium reduction rate is 99.02%. The highest direct recovery of the alloy is 89.12%. The lower melting point is 1266 °C, and the slag can be melted first to surround the alloy, which plays a role in heat preservation and air insulation for the metal melt, reducing the oxidation of the metal; it is 0.11 Pa·s at 1360 °C, which is in line with the most suitable viscosity range in industrial production, so the optimum CaO addition is 30%.
Experiments show that the addition of CaO can solve the problems of high viscosity and melting point of the slag phase in the early process and improve the reduction rate of lithium and the direct yield of the alloy, which provides a preliminary basis for future industrial production. The slag phase after CaO addition mainly contains Ca2Al2Si2O7 and a small amount of Ca2SiO4. According to the literature, Ca2Al2Si2O7 and Ca2SiO4 can be used to produce luminescent materials, cement, and other products. Further research can be conducted to improve the economic benefits of the overall process.

Author Contributions

X.L.: conceptualization, visualization, investigation, data curation, writing—original draft. T.Q.: conceptualization, methodology, funding acquisition. Y.D.: project administration. M.Y.: writing—review and editing, Y.Z.: formal analysis. S.W.: supervision. All authors have read and agreed to the published version of the manuscript.

Funding

This research was funded by Research on the key technology of producing ultra-wide aluminum foil for pharmaceutical packaging with high efficiency and short process (KKBD202352016) and Key technologies and equipment for high-end utilization of waste superalloy recycling (KKGF202352018).

Data Availability Statement

The data presented in this study are available upon request from the corresponding author due to related studies are ongoing.

Conflicts of Interest

The authors declare no conflicts of interest, The funders had no role in the design of the study: in the collection, analyses, or interpretation of data; in the writing of the manuscript; or in the decision to publish the results.

Abbreviation

The following abbreviation is used in this manuscript:
C-A-SCaO-Al2O3-SiO2

References

  1. Vikström, H.; Davidsson, S.; Höök, M. Lithium availability and future production outlooks. Appl. Energy 2013, 110, 252–266. [Google Scholar] [CrossRef]
  2. Mineral Commodity Summaries 2021; U.S. Geological Survey: Reston, VA, USA, 2021; Volume 200, pp. 82–83. [CrossRef]
  3. Roy, T.; Plante, B.; Benzaazoua, M.; Demers, I. Geochemistry and mineralogy of a spodumene-pegmatite lithium ore at various mineral beneficiation stages. Miner. Eng. 2023, 202, 108312. [Google Scholar] [CrossRef]
  4. Swain, B. Recovery and recycling of lithium: A review. Sep. Purif. Technol. 2016, 172, 388–403. [Google Scholar] [CrossRef]
  5. Yanjia, Z.; Xiaodong, T.; Dayong, Q.; Jingjing, L.; Hong, W. Research progress of technology of lithium extraction. Sep. Purif. Technol. 2024, 359, 130561. [Google Scholar] [CrossRef]
  6. Tadesse, B.; Makuei, F.; Albijanic, B.; Dyer, L. The beneficiation of lithium minerals from hard rock ores: A review. Miner. Eng. 2019, 131, 170–184. [Google Scholar] [CrossRef]
  7. Sebastian, A.; Lagache, M.J.A.M. Experimental study of lithium-rich granitic pegmatites; Part I, Petalite + albite + quartz equilibrium. Am. Mineral. 1991, 76, 205–210. [Google Scholar]
  8. Dessemond, C.; Lajoie-Leroux, F.; Soucy, G.; Laroche, N.; Magnan, J.-F. Spodumene: The Lithium Market, Resources and Processes. Minerals 2019, 9, 334. [Google Scholar] [CrossRef]
  9. Göd, R. The spodumene deposit at “Weinebene”, Koralpe, Austria. Miner. Depos. 1989, 24, 270–278. [Google Scholar] [CrossRef]
  10. Kesler, S.E.; Gruber, P.W.; Medina, P.A.; Keoleian, G.A.; Everson, M.P.; Wallington, T.J. Global lithium resources: Relative importance of pegmatite, brine and other deposits. Ore Geol. Rev. 2012, 48, 55–69. [Google Scholar] [CrossRef]
  11. Demartin, F.; Gay, H.D.; Gramaccioli, C.M. The crystal structure of a mineral related to paulkerrite. Z. Fur Krist. Mater. 1993, 208, 57–72. [Google Scholar] [CrossRef]
  12. Skinner, B.J., Jr. Crystal chemistry of beta-spodumene solid solutions on the join Li2O.Al2O3-SiO2. Am. J. Sci. 1960, 258, 312. [Google Scholar]
  13. Friedman-Rudovsky, J. Dreams of a Lithium Empire. Science 2011, 334, 896–897. [Google Scholar] [CrossRef]
  14. Karrech, A.; Azadi, M.R.; Elchalakani, M.; Shahin, M.A.; Seibi, A.C. A review on methods for liberating lithium from pegmatities. Miner. Eng. 2020, 145, 106085. [Google Scholar] [CrossRef]
  15. Gao, T.; Fan, N.; Chen, W.; Dai, T. Lithium extraction from hard rock lithium ores(spodumene, lepidolite, zinnwaldite, petalite): Technology, resources, environment and cost. China Geol. 2023, 6, 137–153. [Google Scholar]
  16. Meng, F.; McNeice, J.; Zadeh, S.S.; Ghahreman, A. Review of Lithium Production and Recovery from Minerals, Brines, and Lithium-Ion Batteries. Miner. Process. Extr. Metall. Rev. 2021, 42, 123–141. [Google Scholar] [CrossRef]
  17. Salakjani, N.K.; Singh, P.; Nikoloski, A.N. Acid roasting of spodumene: Microwave vs. conventional heating. Miner. Eng. 2019, 138, 161–167. [Google Scholar] [CrossRef]
  18. Kuang, G.; Liu, Y.; Li, H.; Xing, S.; Li, F.; Guo, H. Extraction of lithium from β-spodumene using sodium sulfate solution. Hydrometallurgy 2018, 177, 49–56. [Google Scholar] [CrossRef]
  19. Salakjani, N.K.; Singh, P.; Nikoloski, A.N. Production of Lithium—A Literature Review Part 1: Pretreatment of Spodumene. Miner. Process. Extr. Metall. Rev. 2019, 41, 335–348. [Google Scholar] [CrossRef]
  20. Botto, I.L. Structural and spectroscopic properties of leached spodumene in the acid roast processing. Mater. Chem. Phys. 1985, 13, 423–436. [Google Scholar] [CrossRef]
  21. Rosales, G.D.; Ruiz, M.d.C.; Rodriguez, M.H. Novel process for the extraction of lithium from β-spodumene by leaching with HF. Hydrometallurgy 2014, 147–148, 1–6. [Google Scholar] [CrossRef]
  22. Talens Peiró, L.; Villalba Méndez, G.; Ayres, R.U. Lithium: Sources, Production, Uses, and Recovery Outlook. JOM 2013, 65, 986–996. [Google Scholar] [CrossRef]
  23. Tian, Q. Study on Extraction Technology of Lithium Carbonate from Spodumene Ore. Master’s Thesis, Central South University, Changsha, China, 2012. [Google Scholar]
  24. Tian, Q.; Chen, B.; Chen, Y.; Ma, L.; Shi, X. Study on sulfuric acid roasting and leaching process of spodumene. Rare Met. 2011, 35, 6. [Google Scholar]
  25. Lajoie-Leroux, F.; Dessemond, C.; Soucy, G.; Laroche, N.; Magnan, J.-F. Impact of the impurities on lithium extraction from β-spodumene in the sulfuric acid process. Miner. Eng. 2018, 129, 1–8. [Google Scholar] [CrossRef]
  26. Wang, X.; Hu, H.; Liu, M.; Li, Y.; Tang, Y.; Zhuang, L.; Tian, B. Comprehensive utilization of waste residue from lithium extraction process of spodumene. Miner. Eng. 2021, 170, 106986. [Google Scholar] [CrossRef]
  27. Xiao, M.S.; Wang, S.H.; Zhang, Q.F.; Zhang, J.W. Leaching mechanism of the spodumene sulphuric acid process. Rare Met. 1997, 16, 37–45. [Google Scholar]
  28. Yang, M.; Yan, K.; Ji, R.; Cui, X.; Zhang, W.; Qu, T. Lithium Enrichment by the Carbothermal Reduction of Spodumene Ore and the Preparation of Manganese-Silicon Alloy. Minerals 2022, 12, 1324. [Google Scholar] [CrossRef]
  29. Du, H.; Shi, L.; Lyu, F.; Zhang, X.-P.; Yang, M.-l.; Yan, K.; Qu, T. Comprehensive utilization of spodumene ore through pyrometallurgical process with Fe2O3 addition. J. Cent. South Univ. 2023, 30, 1831–1840. [Google Scholar] [CrossRef]
  30. Fei, L.; Hao, D.; Lei, S.; Yuan, T.; Xiao-Pan, Z.; Tao, Q.; Bin, Y.; Yong-Nian, D. Experimental and mechanism research on carbothermal reduction of spodumene ore via vacuum. Mater. Res. Express 2021, 8, 016505. [Google Scholar] [CrossRef]
  31. Ma, S.F.; Zhang, G. Leaching process of vanadium from argillaceous vanadium ore using calcified roasting study on roasting technology. Chin. J. Rare Met. 2007, 31, 813–817. [Google Scholar]
  32. He, Q.; Wen, J.; Yang, G.; Xu, F.; Xu, M.; Chen, Z.; Wu, J.; Ma, W. Impurity Aluminum Removal in Industrial Silicon by CaO-SiO2-CaF2 Slagging Refining. Silicon 2023, 15, 5445–5453. [Google Scholar] [CrossRef]
  33. Song, Y.; Zhao, T.; He, L.; Zhao, Z.; Liu, X. A promising approach for directly extracting lithium from α-spodumene by alkaline digestion and precipitation as phosphate. Hydrometallurgy 2019, 189, 105141. [Google Scholar] [CrossRef]
  34. Bronsch, A. Viscosity of Slags. 2017, 72, 86–90. Available online: https://nbn-resolving.org/urn:nbn:de:bsz:105-qucosa-229196 (accessed on 12 March 2025).
  35. Kracek, F.C. The Binary System Li2O–SiO2. J. Phys. Chem. 1929, 34, 2641–2650. [Google Scholar] [CrossRef]
  36. Zhao, N.; Zhang, C. Practical Technical Manual of Ferroalloy Production; Metallurgical Industry Press: Beijing, China, 2003. [Google Scholar]
  37. Hu, A.M.; Li, M.; Mao, D.L. Growth behavior, morphology and properties of lithium aluminosilicate glass ceramics with different amount of CaO, MgO and TiO2 additive. Ceram. Int. 2008, 34, 1393–1397. [Google Scholar] [CrossRef]
  38. Maramba, B.; Eric, R.H. Phosphide capacities of ferromanganese smelting slags. Miner. Eng. 2008, 21, 132–137. [Google Scholar] [CrossRef]
  39. Qiu, S.; Liu, C.; Yu, J. Conversion from α-spodumene to intermediate product Li2SiO3 by hydrothermal alkaline treatment in the lithium extraction process. Miner. Eng. 2022, 183, 107599. [Google Scholar] [CrossRef]
Figure 1. (left) XRD analysis. (right) SEM-EDS spectrum of the spodumene used in the experiment. (a) SEM images; (b) SEM images; (c) Al element distribution; (d) Si element distribution; (e) O element distribution; (f) K element distribution; (g) Na element distribution; (h) Fe element distribution.
Metals 15 00322 g001
Figure 2. CaO-Al2O3-SiO2 ternary phase diagram.
Metals 15 00322 g002
Figure 3. Melting point diagram of C-A-S slag with different CaO ratios.
Metals 15 00322 g003
Figure 4. The density change diagram of slag with different CaO contents.
Metals 15 00322 g004
Figure 5. Viscosity change diagram of C-A-S slag with different CaO ratios.
Metals 15 00322 g005
Figure 6. XRD analysis diagram of reduction residue with different CaO contents.
Metals 15 00322 g006aMetals 15 00322 g006b
Figure 7. Condensate XRD analysis.
Metals 15 00322 g007
Figure 8. (a) Lithium reduction rate at different calcium oxide contents. (b) Direct yield of the manganese-silicon alloy at different contents of calcium oxide.
Metals 15 00322 g008
Figure 9. Determination results of high-temperature melting point detector after reaction with different CaO contents (Start: initial state; DT: initial deformation temperature; ST: initial softening temperature-1/4 ball point; HT: initial melting temperature-1/2 ball point; FT: initial melting temperature).
Metals 15 00322 g009
Figure 10. Viscosity analysis.
Metals 15 00322 g010
Figure 11. XRD analysis of alloys.
Metals 15 00322 g011
Figure 12. SEM-EDS images of the alloy and slag: (a) SEM images; (b) Si element distribution; (c) Mn element distribution; (d) SEM images; (e) one-point sweep spectrogram; (f) Al element distribution; (g) Si element distribution; (h) Ca element distribution; (i) O element distribution.
Metals 15 00322 g012
Table 1. Quantitative analysis of major elements of spodumene.
ComponentLi2OSiO2A12O3Fe2O3Na2OK2OCaOOthers
Content (wt%)3.8372.5018.600.950.360.620.013.13
Table 2. Char carbon composition table.
ComponentFixed CarbonAshVolatilesMoisture
Content (wt%)86.0412.031.440.49
Table 3. Ash composition table.
ComponentSiO2Al2O3CaOFe2O3
Content (wt%)1.611.910.930.31
Table 4. Content of main components in slag after reaction without additives.
Al2O3 (wt%)SiO2 (wt%)SiC (wt%)CaO (wt%)MnO (wt%)Fe2O3 (wt%)Others (wt%)
35.26247.9847.82.6952.8002.1191.34
Table 5. Analysis of slag phase composition under 30% CaO content.
Ca2Al2SiO7
(wt%)
SiO2 (wt%)Ca2SiO4 (wt%)Fe2O3 (wt%)MgO (wt%)Li2O (wt%)Other (wt%)
78.7112.451.500.510.290.0097596.53
Table 6. The composition of the alloy was analyzed at 30% CaO content.
Mn5Si3 (wt%)Ca2Al2SiO7 (wt%)SiO2 (wt%)Other
87.937.883.131.06
Disclaimer/Publisher’s Note: The statements, opinions and data contained in all publications are solely those of the individual author(s) and contributor(s) and not of MDPI and/or the editor(s). MDPI and/or the editor(s) disclaim responsibility for any injury to people or property resulting from any ideas, methods, instructions or products referred to in the content.

