
Mechanical Properties Simulation of Aluminum Alloy Sheet Using SSP and CPFEM

Abstract
1. Introduction
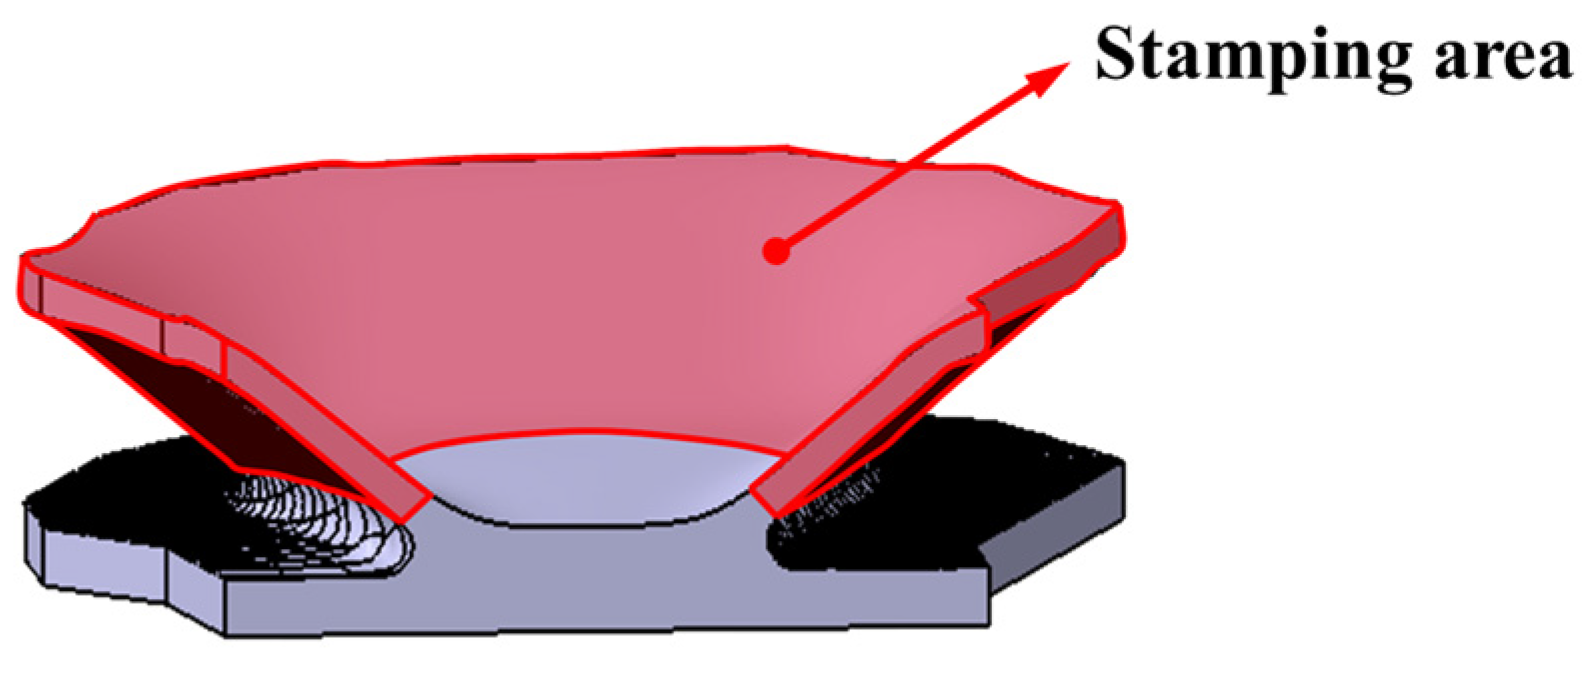
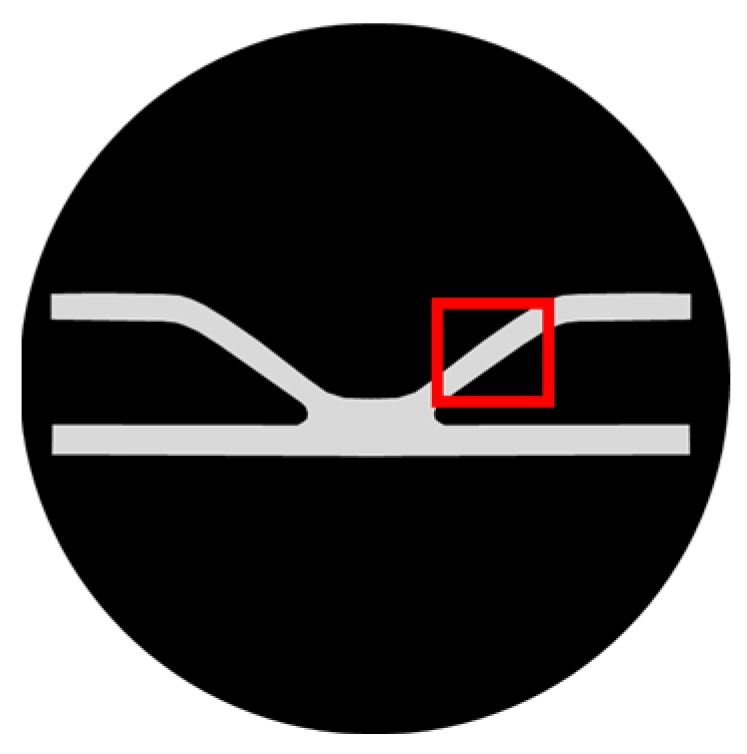
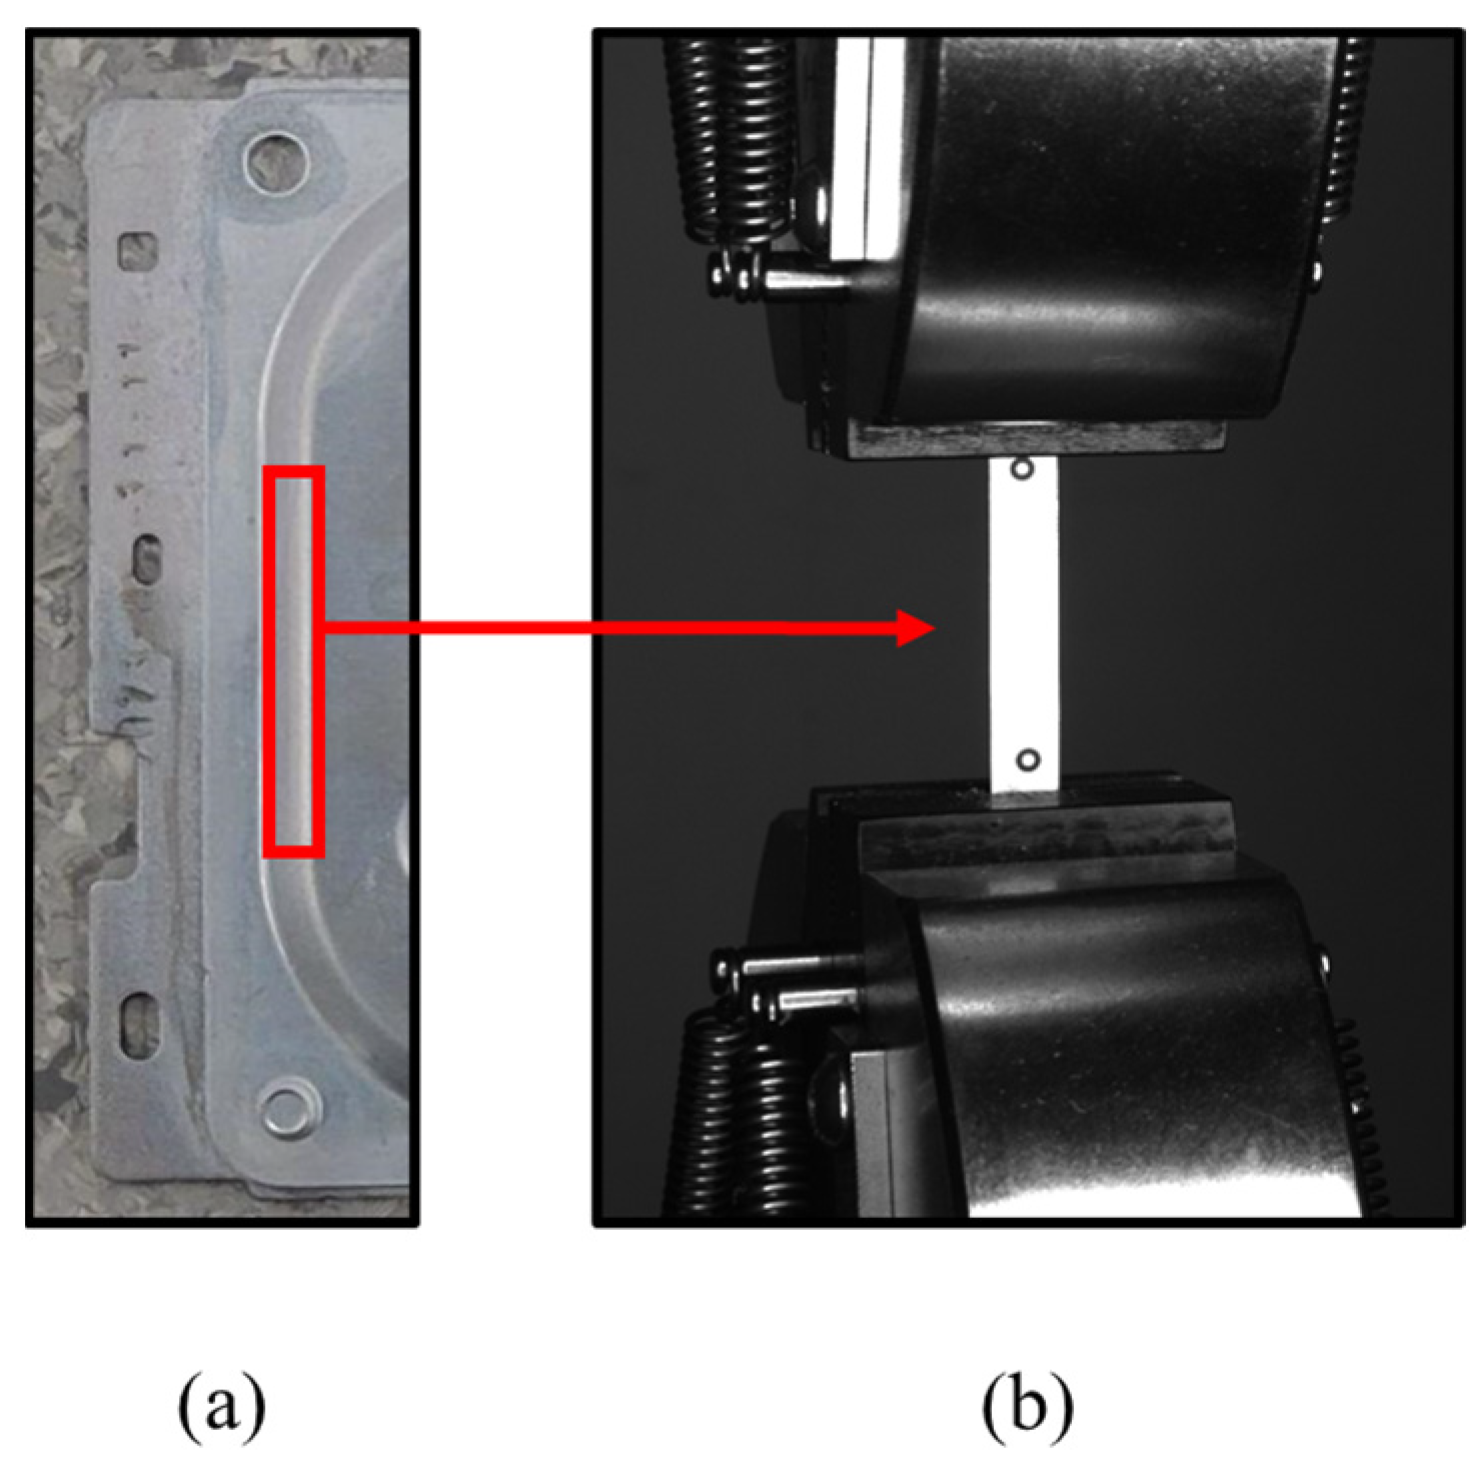
2. Experiments
2.1. EBSD Testing and Crystal Orientation Acquisition
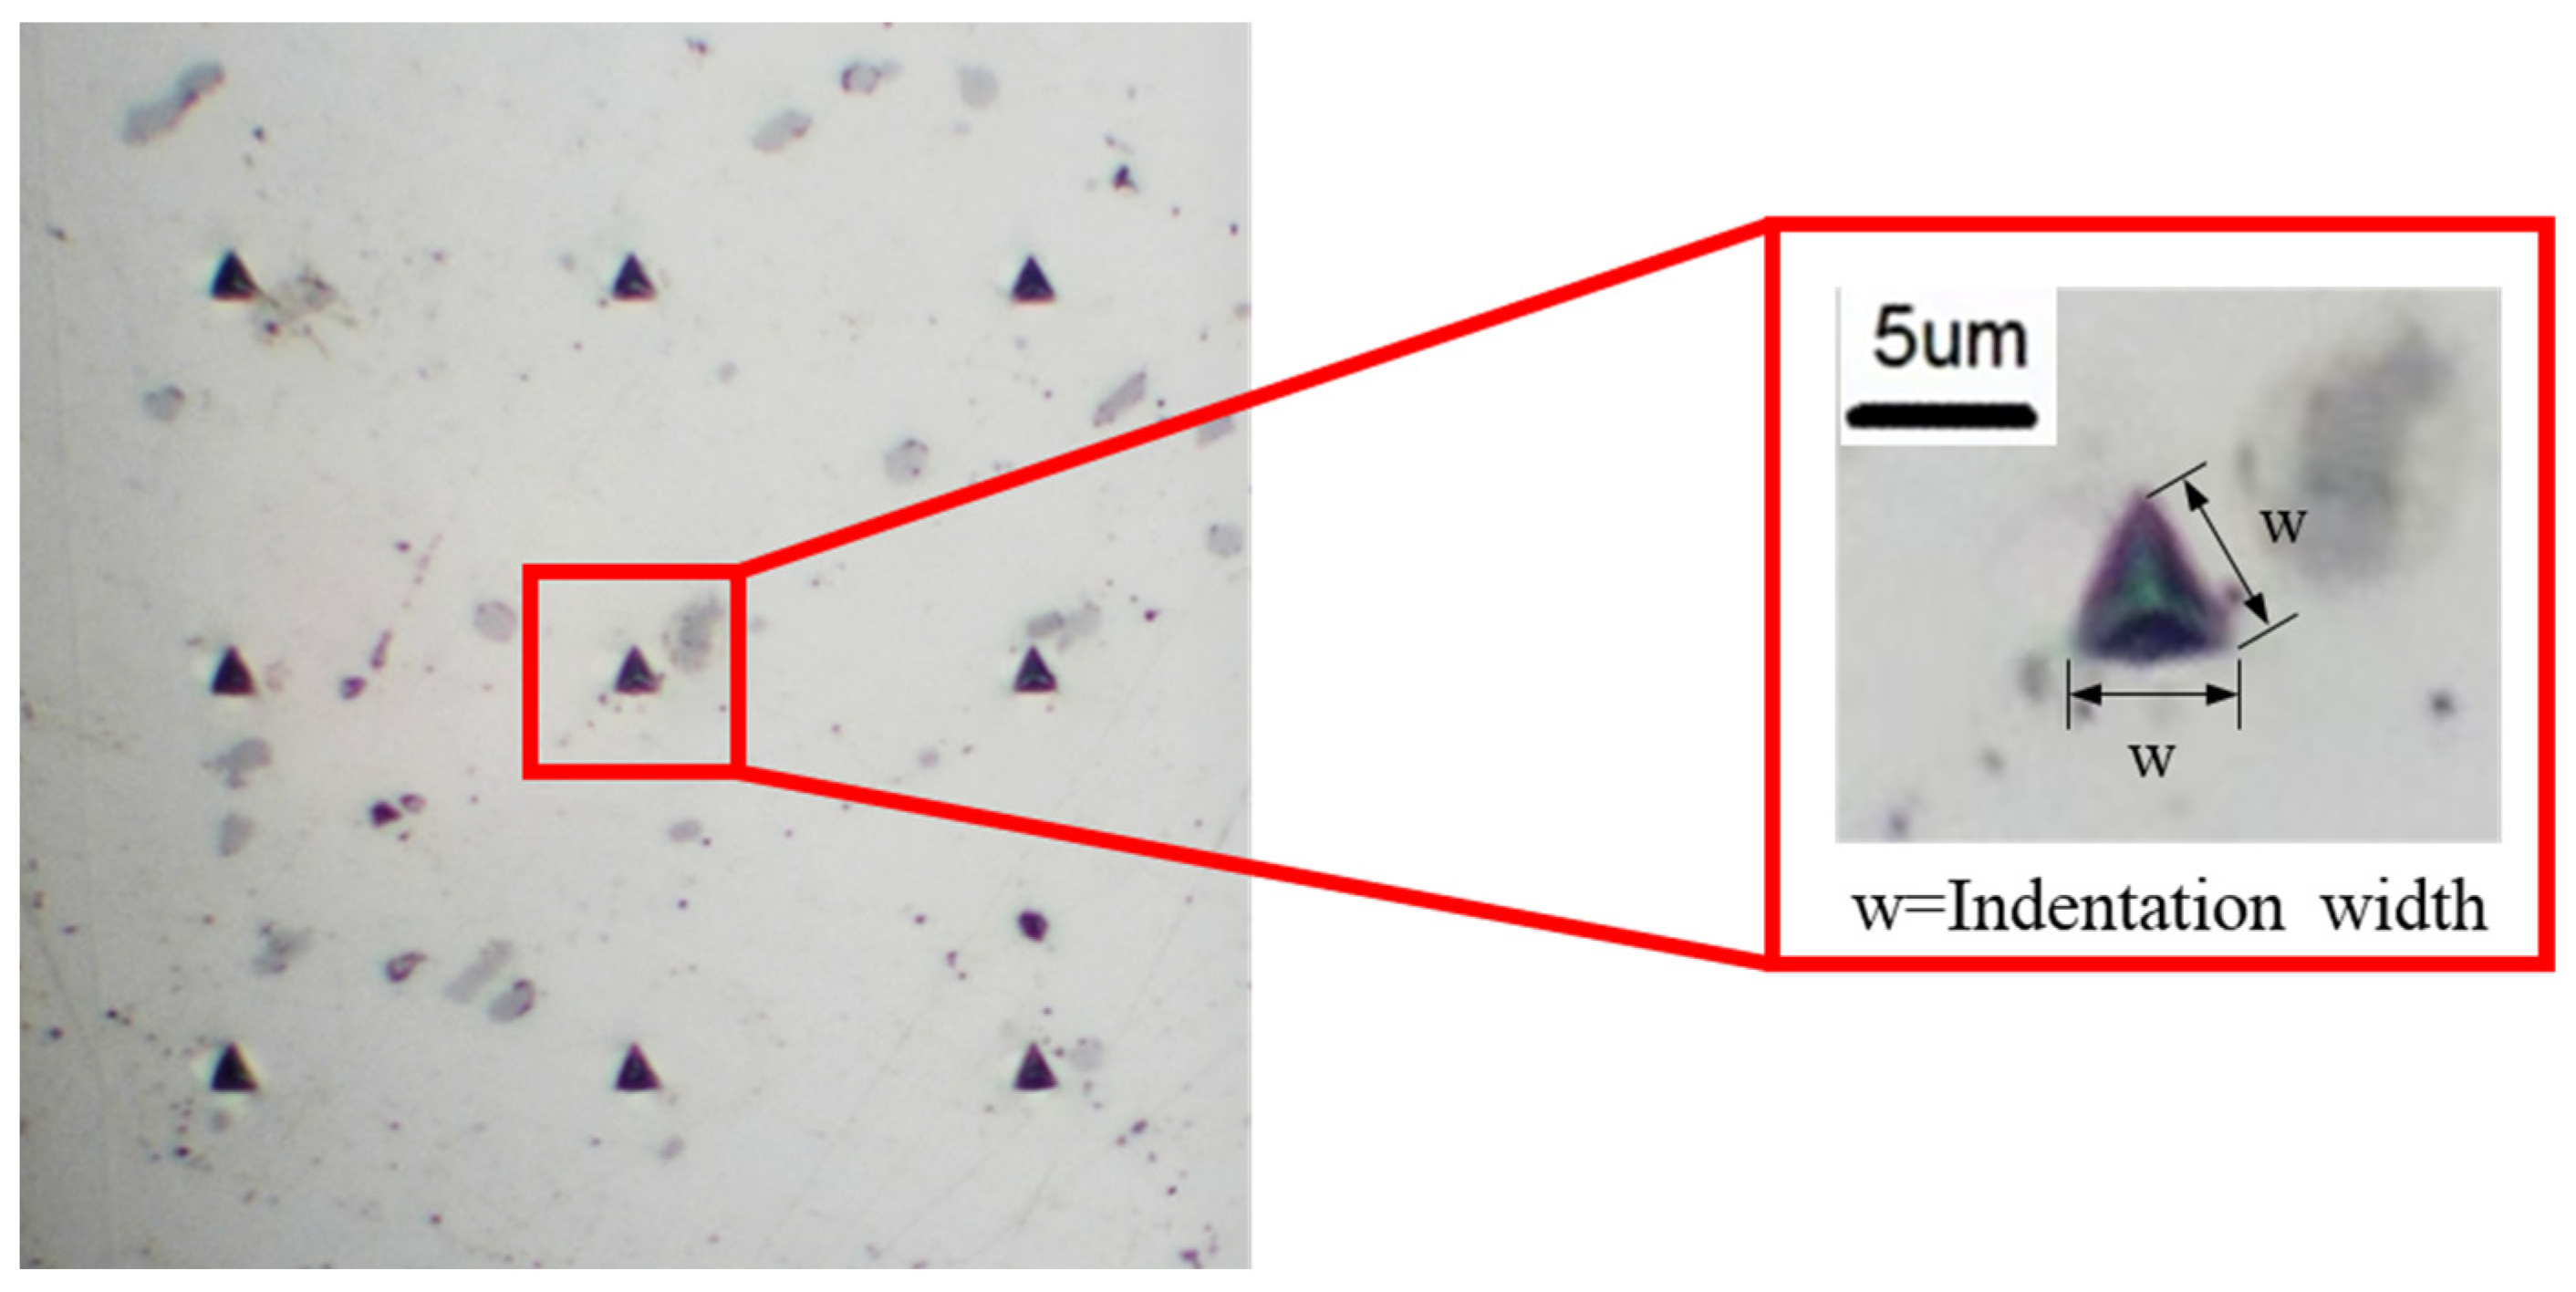
2.2. Nanoindentation Experiments
2.3. Uniaxial Tensile Tests
3. Numerical Modeling
3.1. Single-Crystal Plasticity Constitutive Model
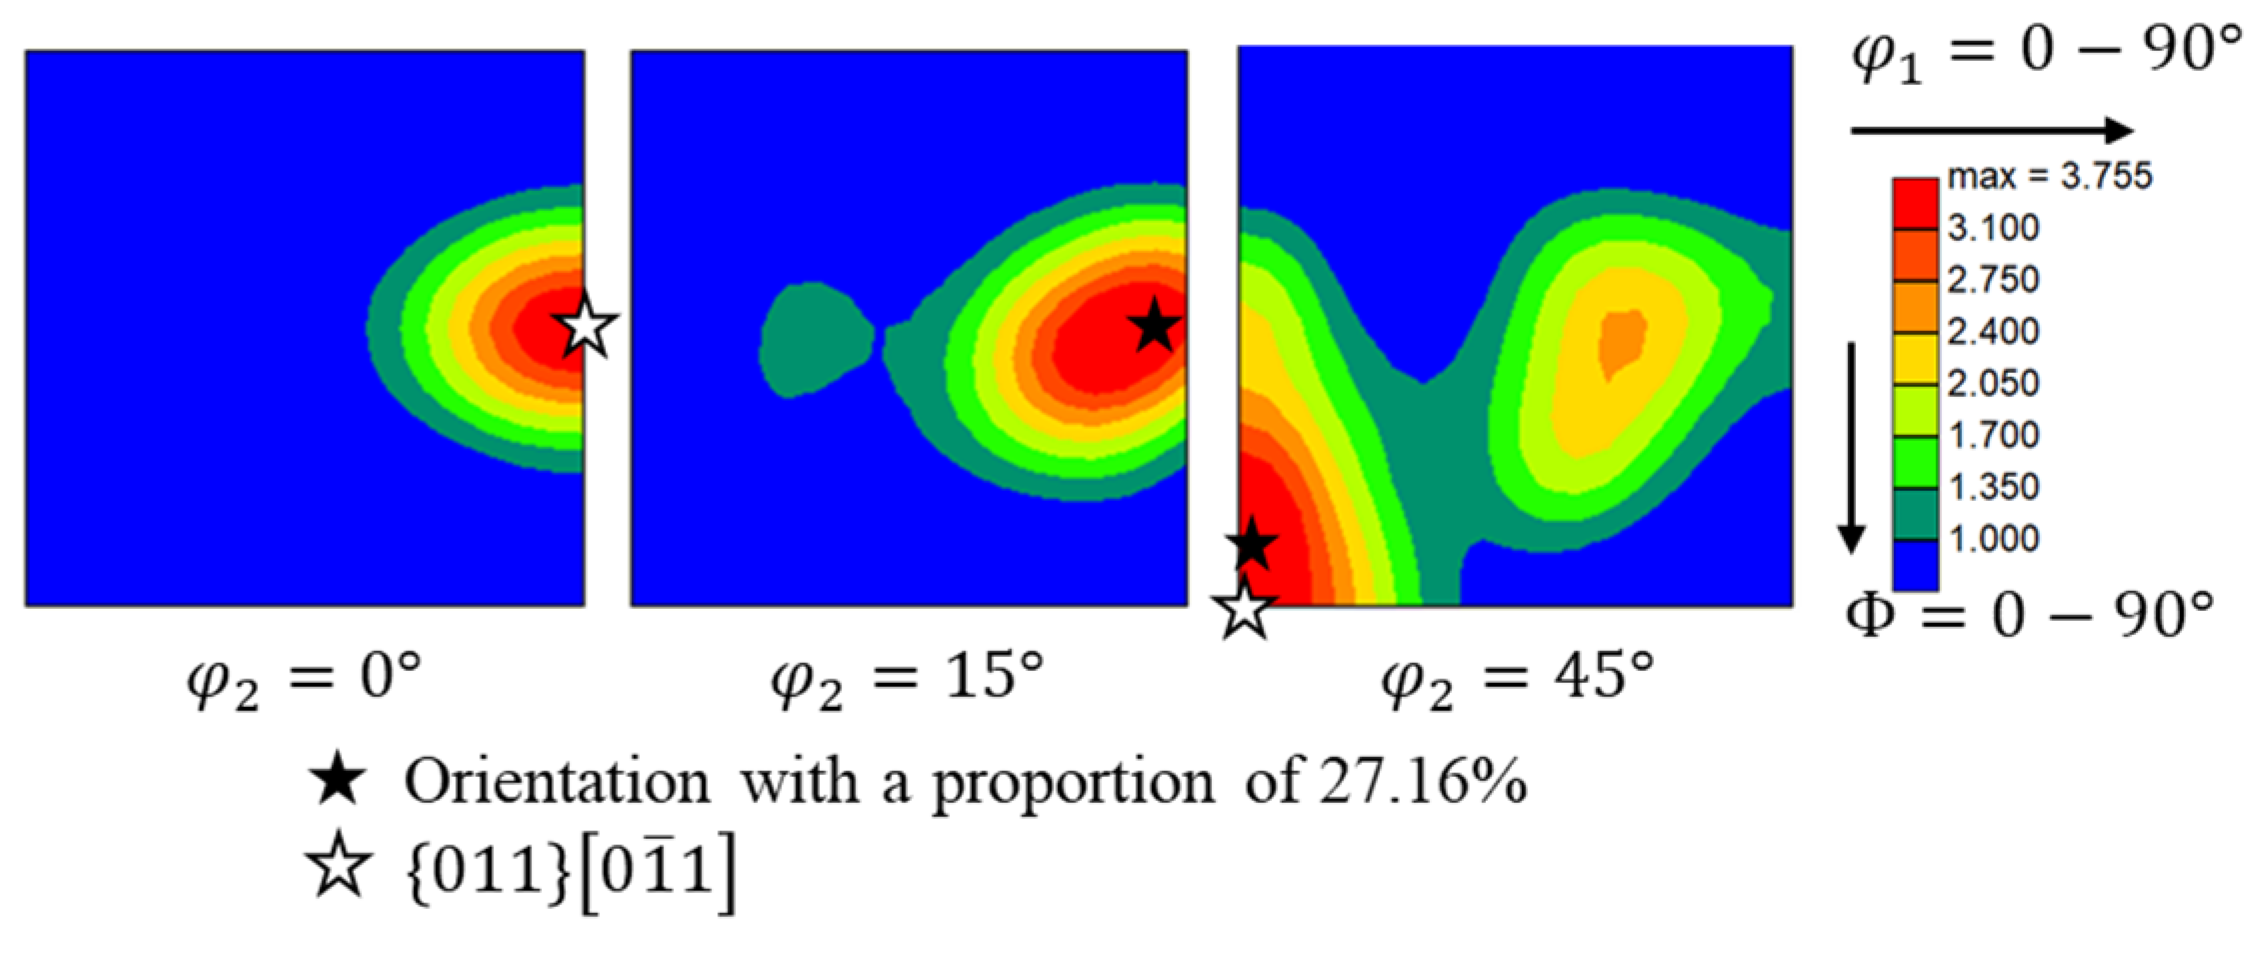
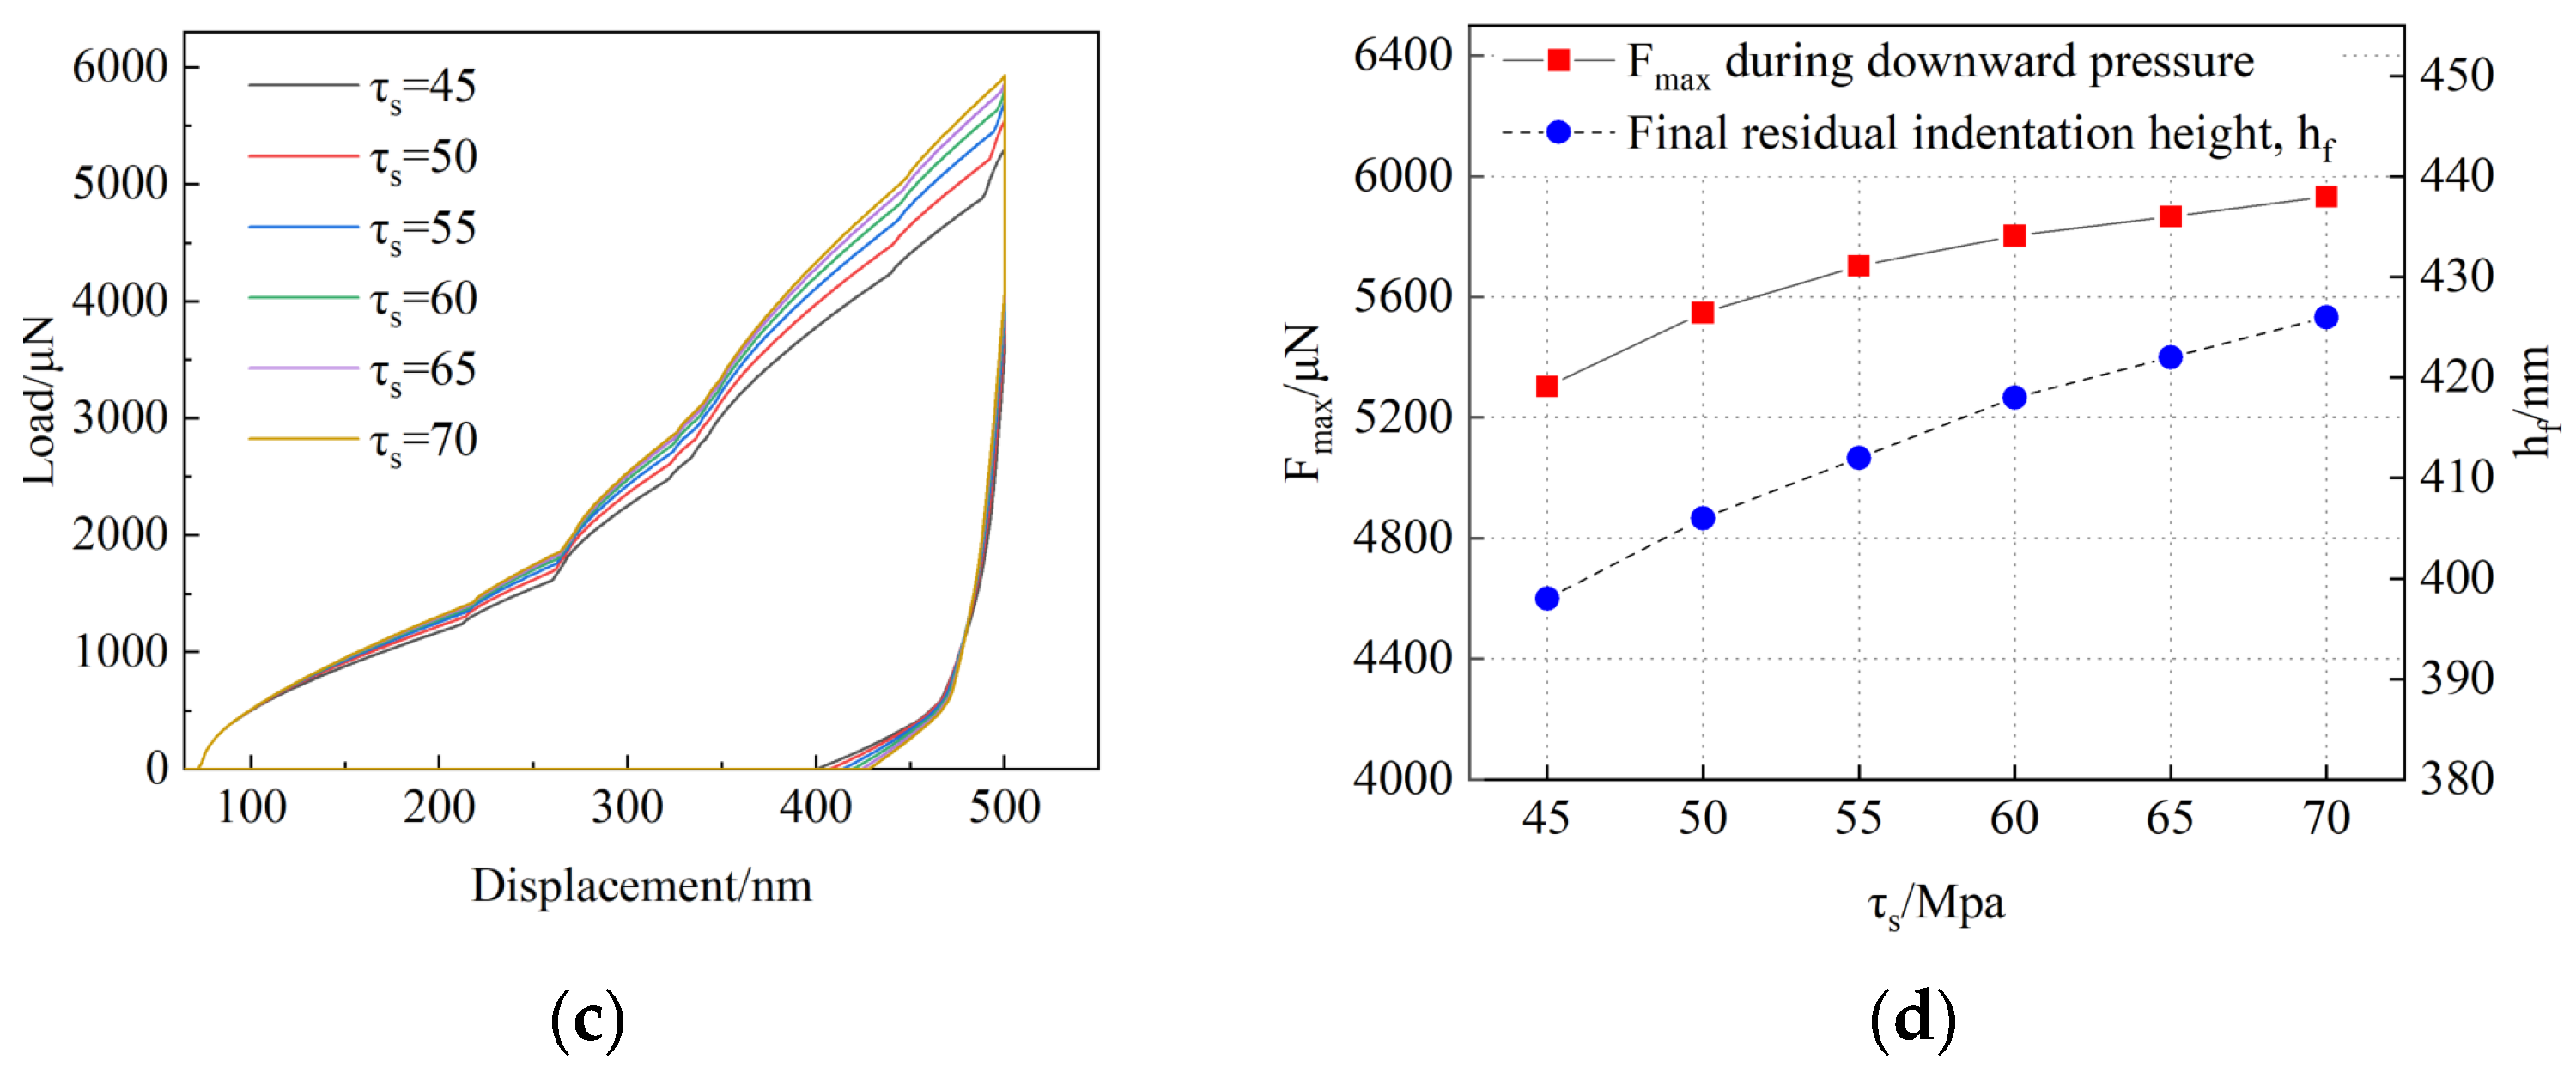
3.2. Selection of Crystal Plasticity Constitutive Parameters
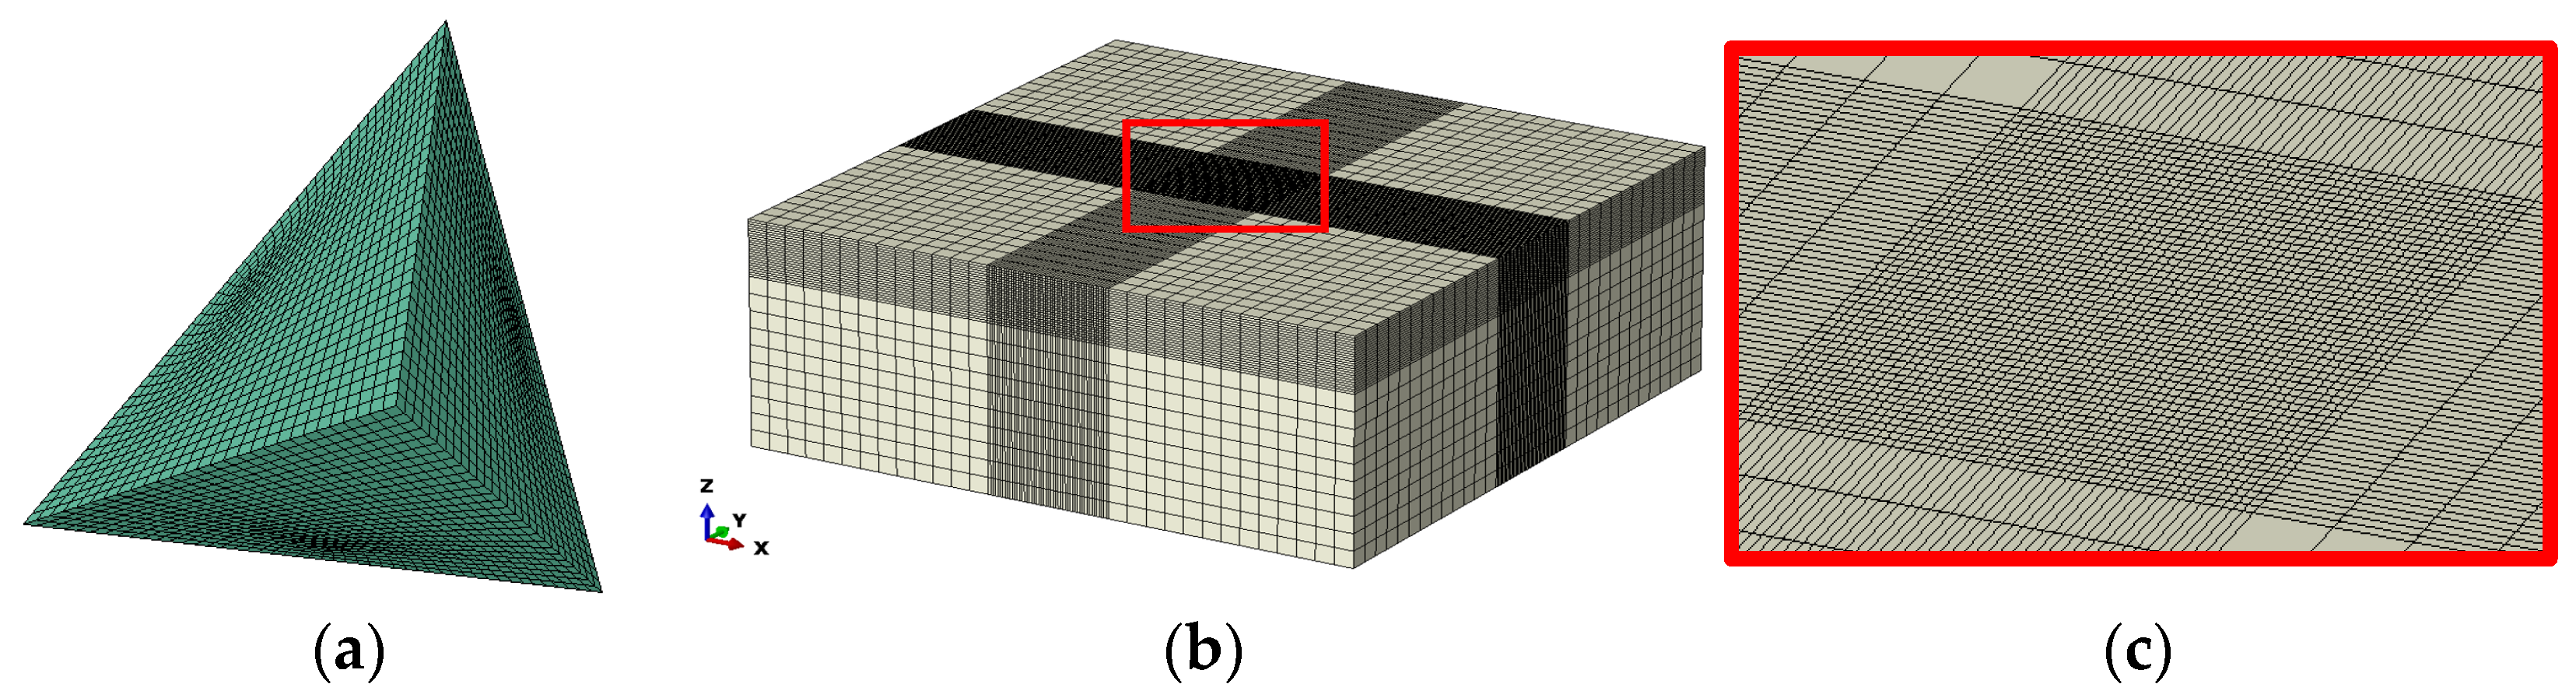
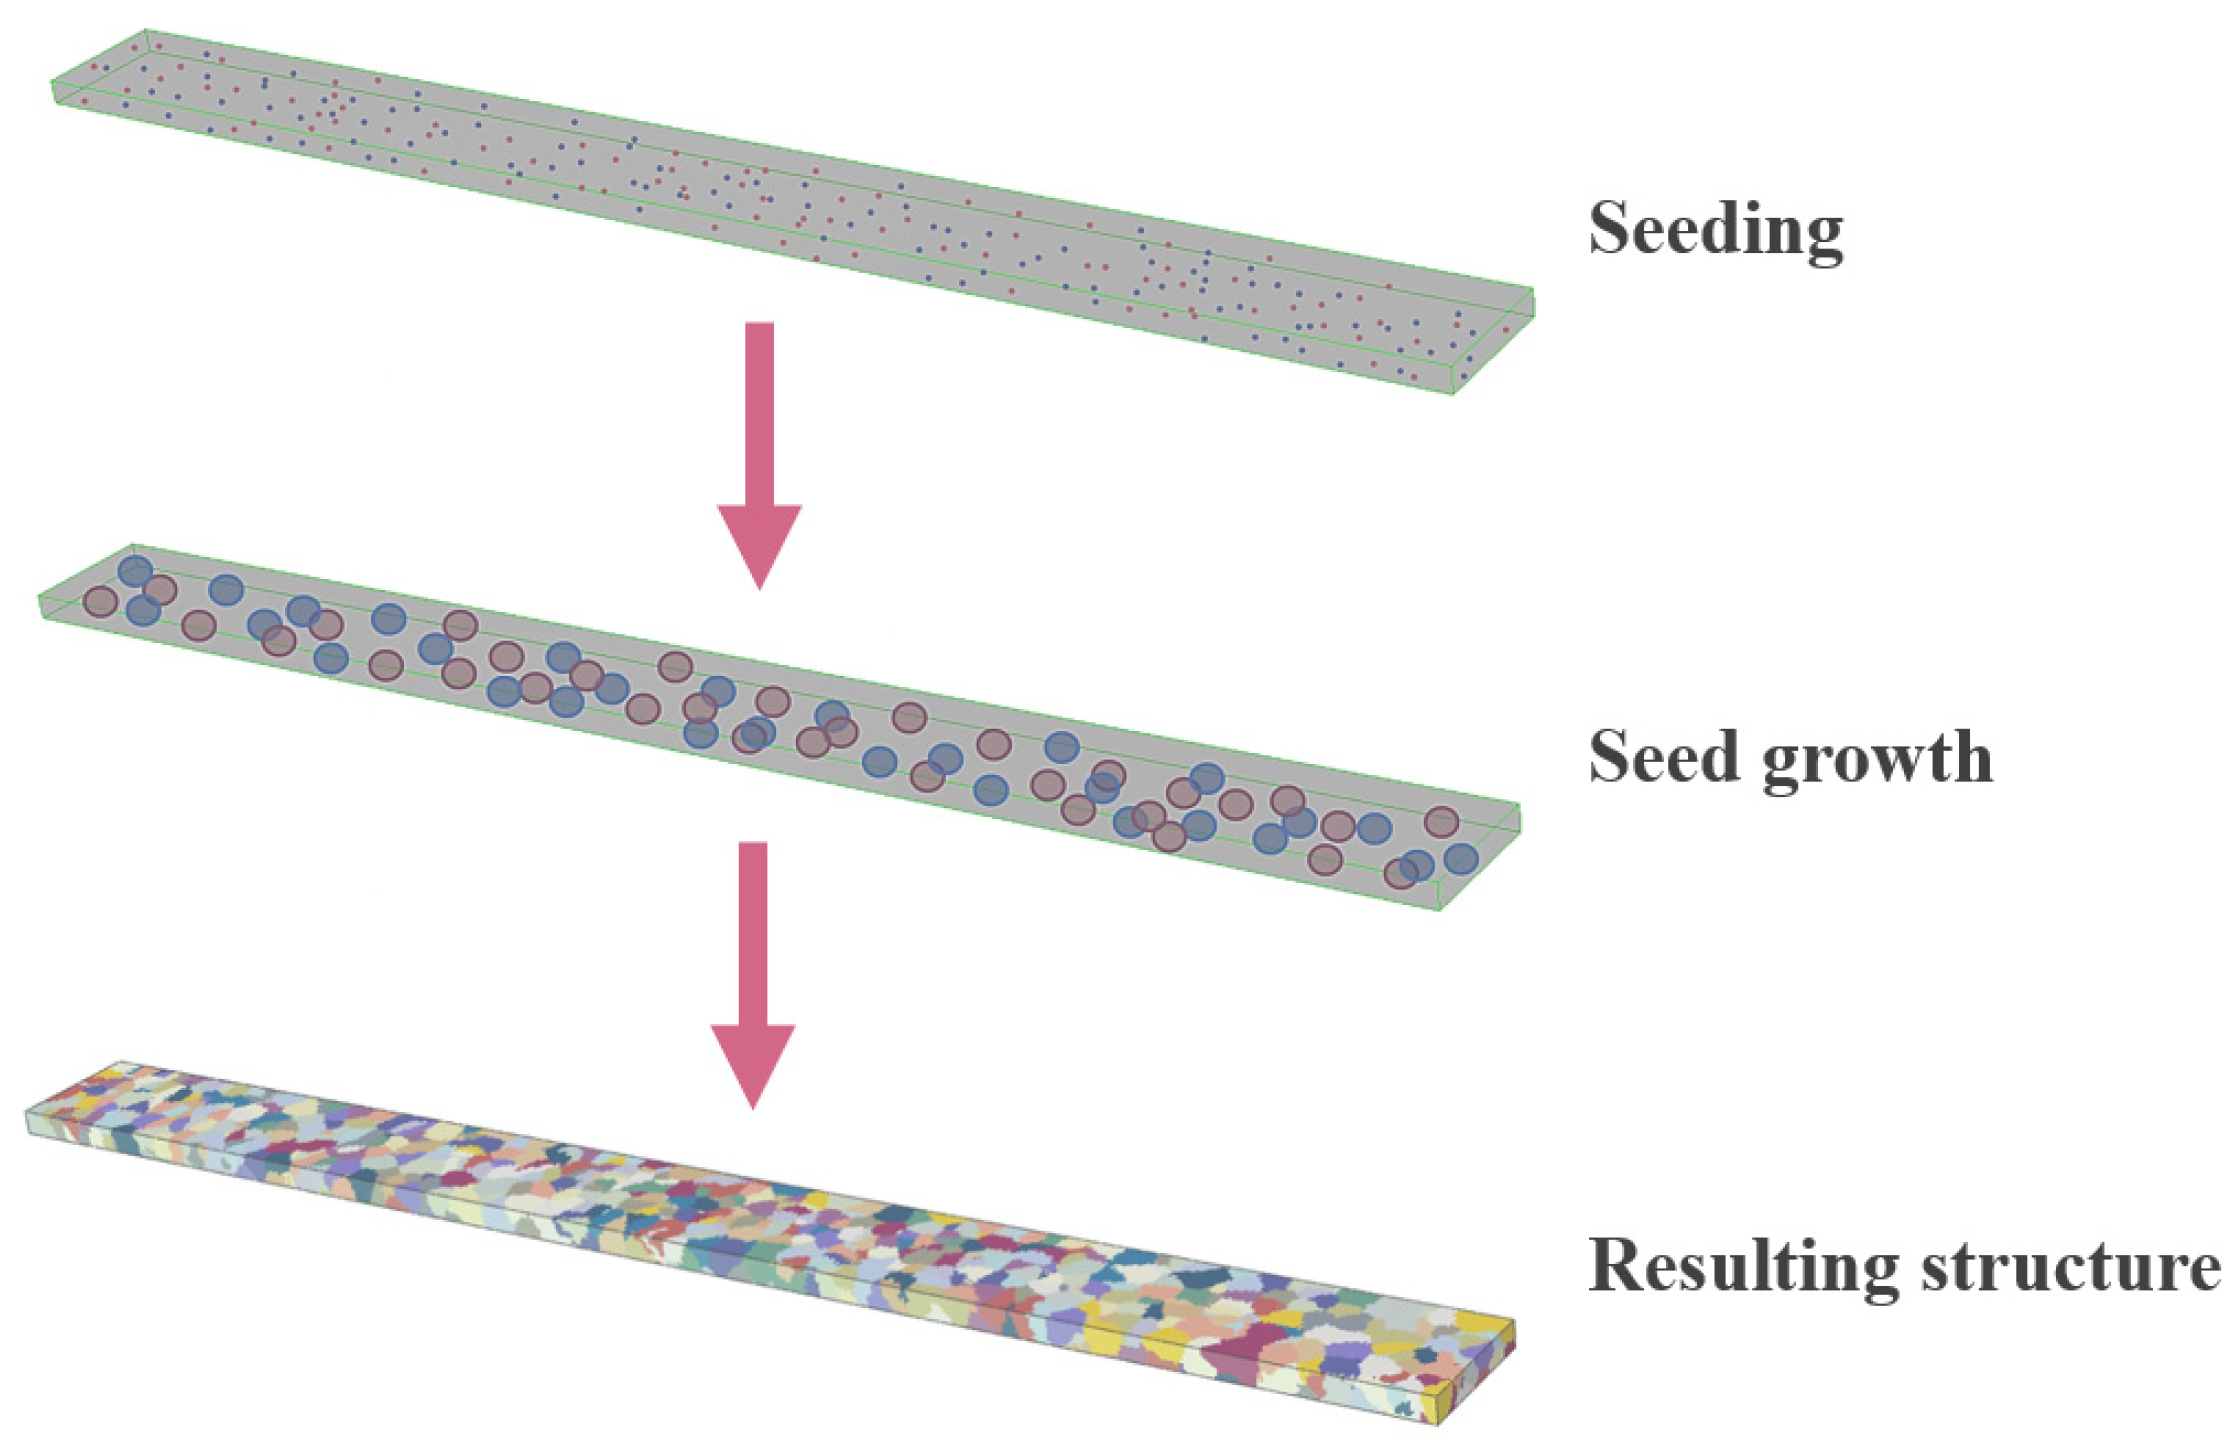
3.3. Development of a Polycrystalline Model
4. Results and Discussion
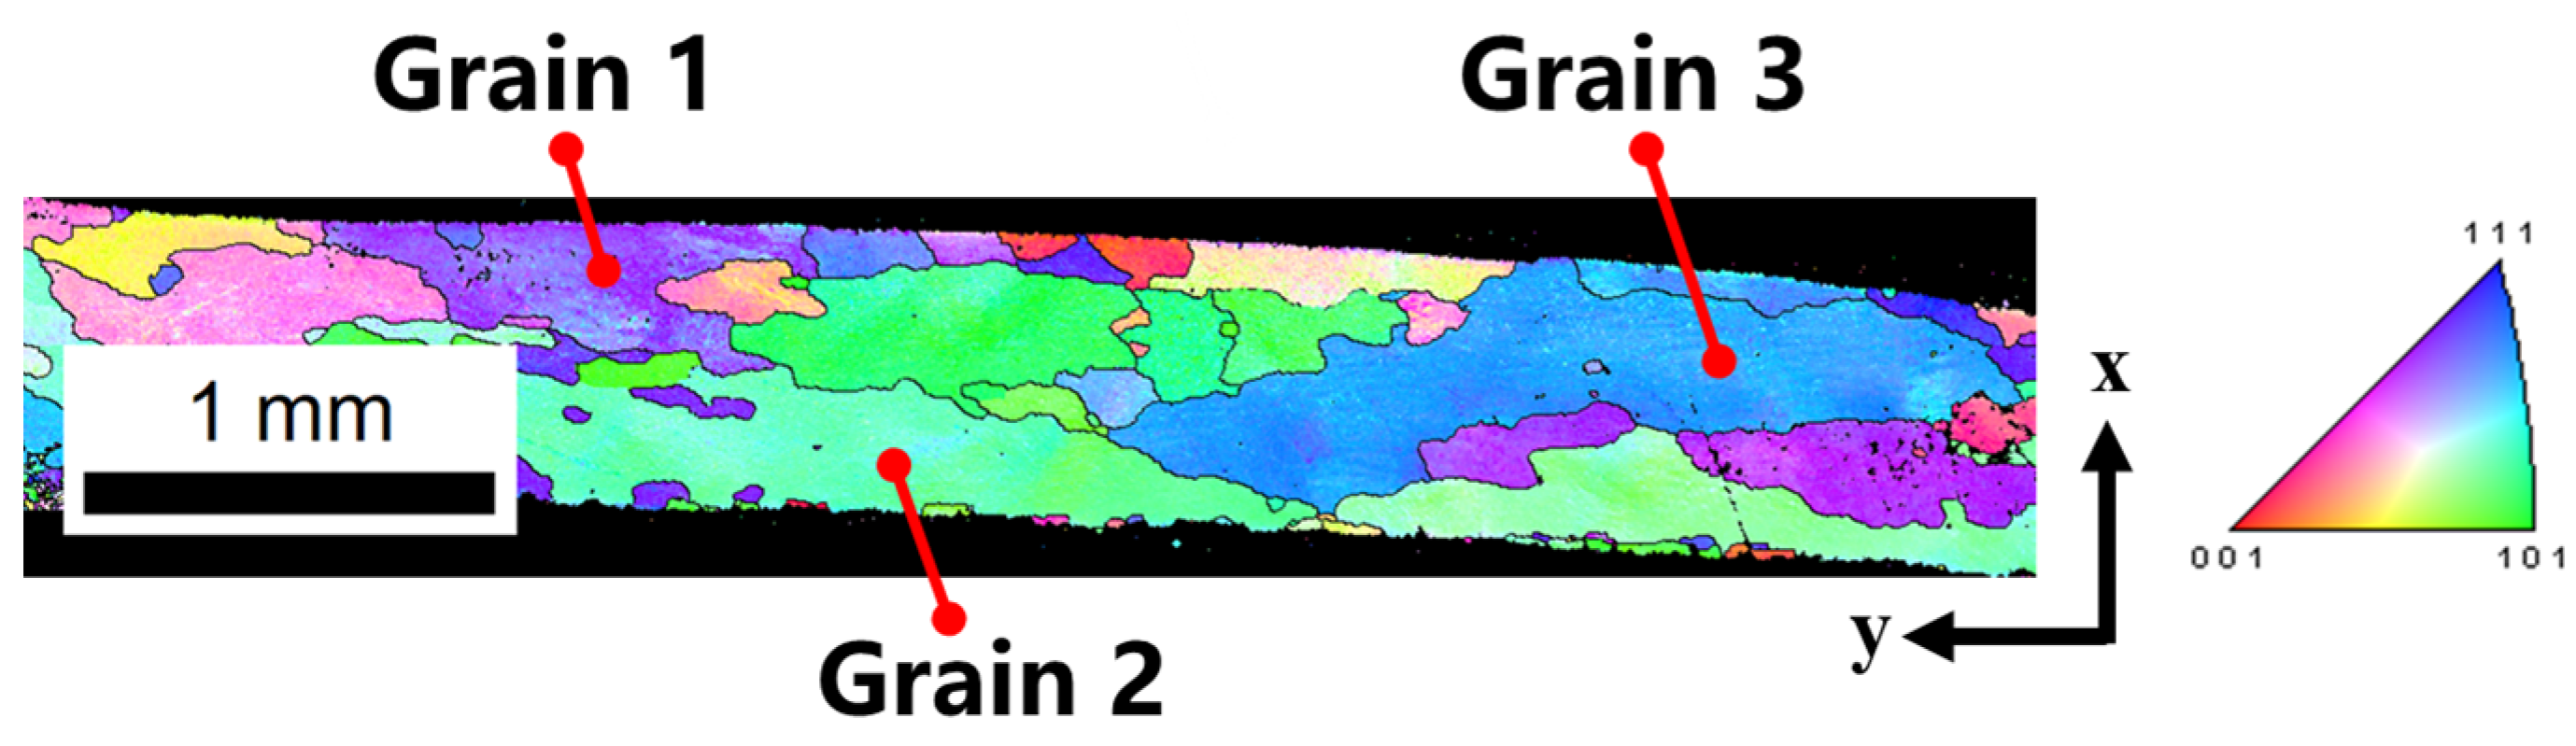
4.1. Microstructure and Crystal Orientation
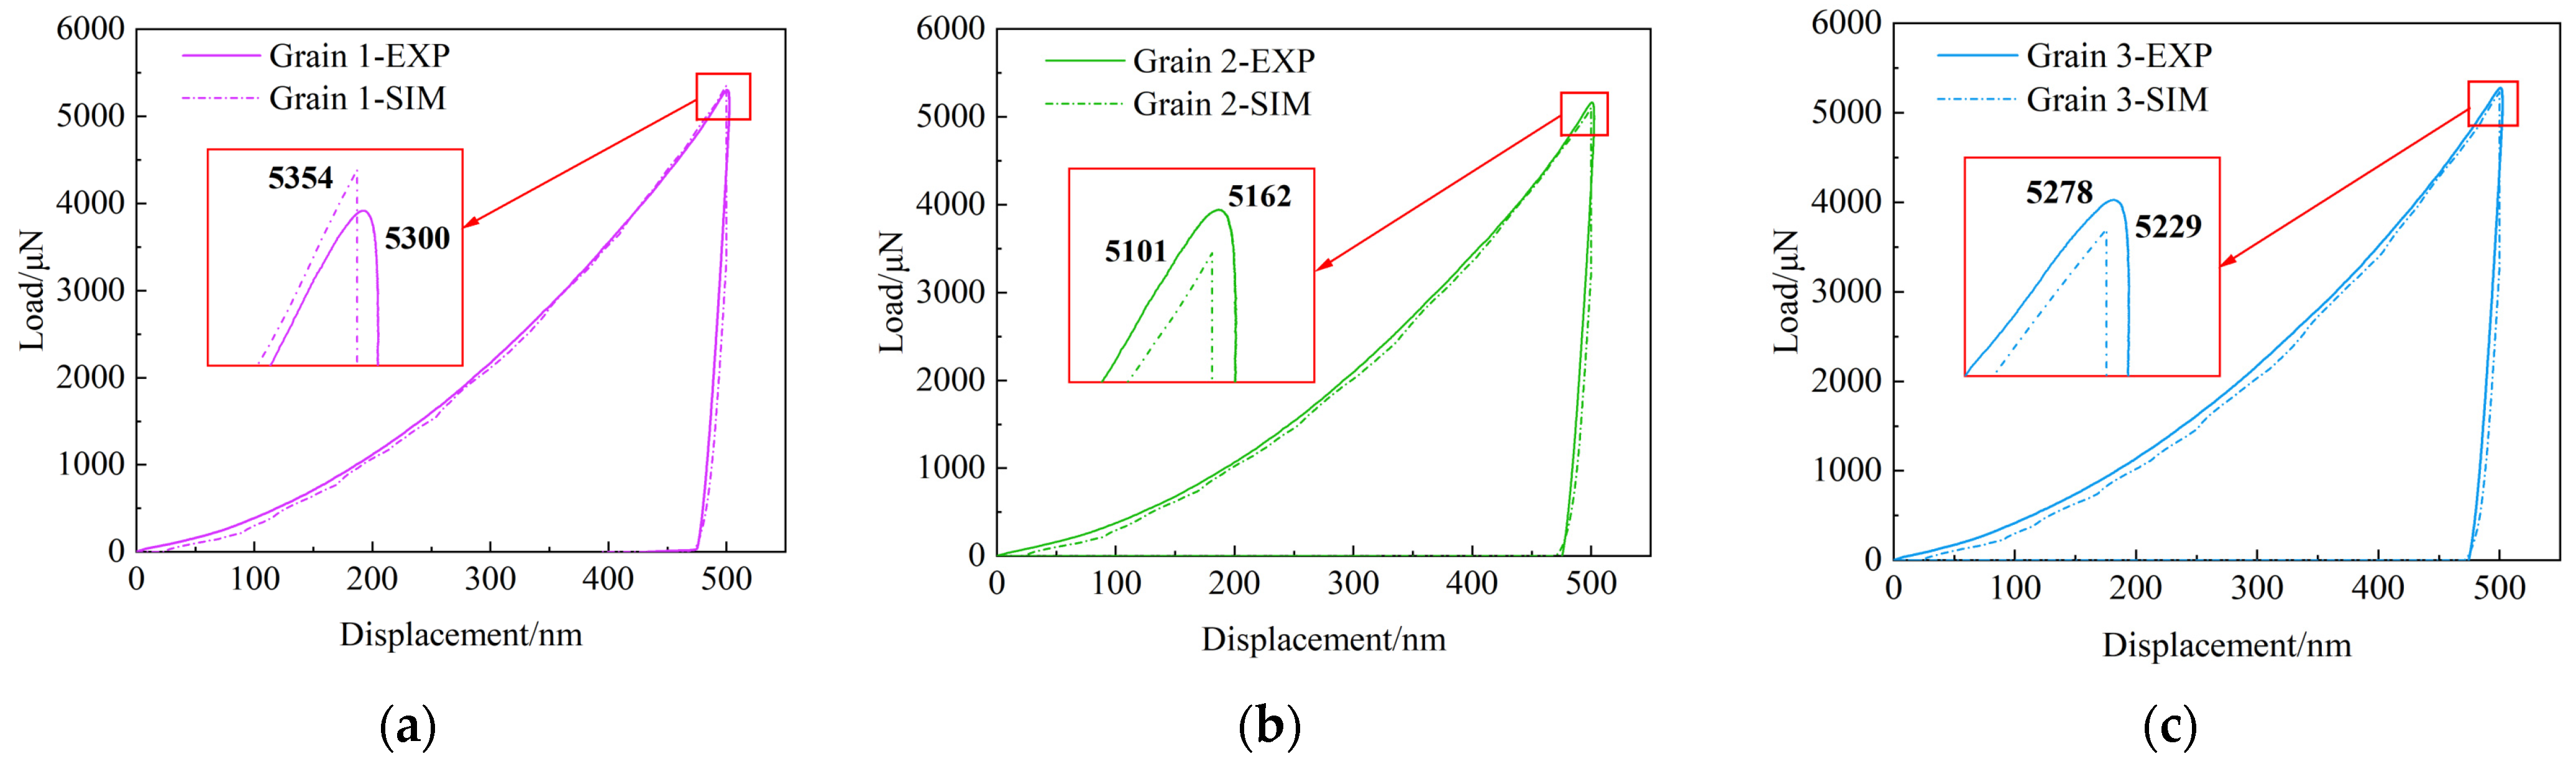
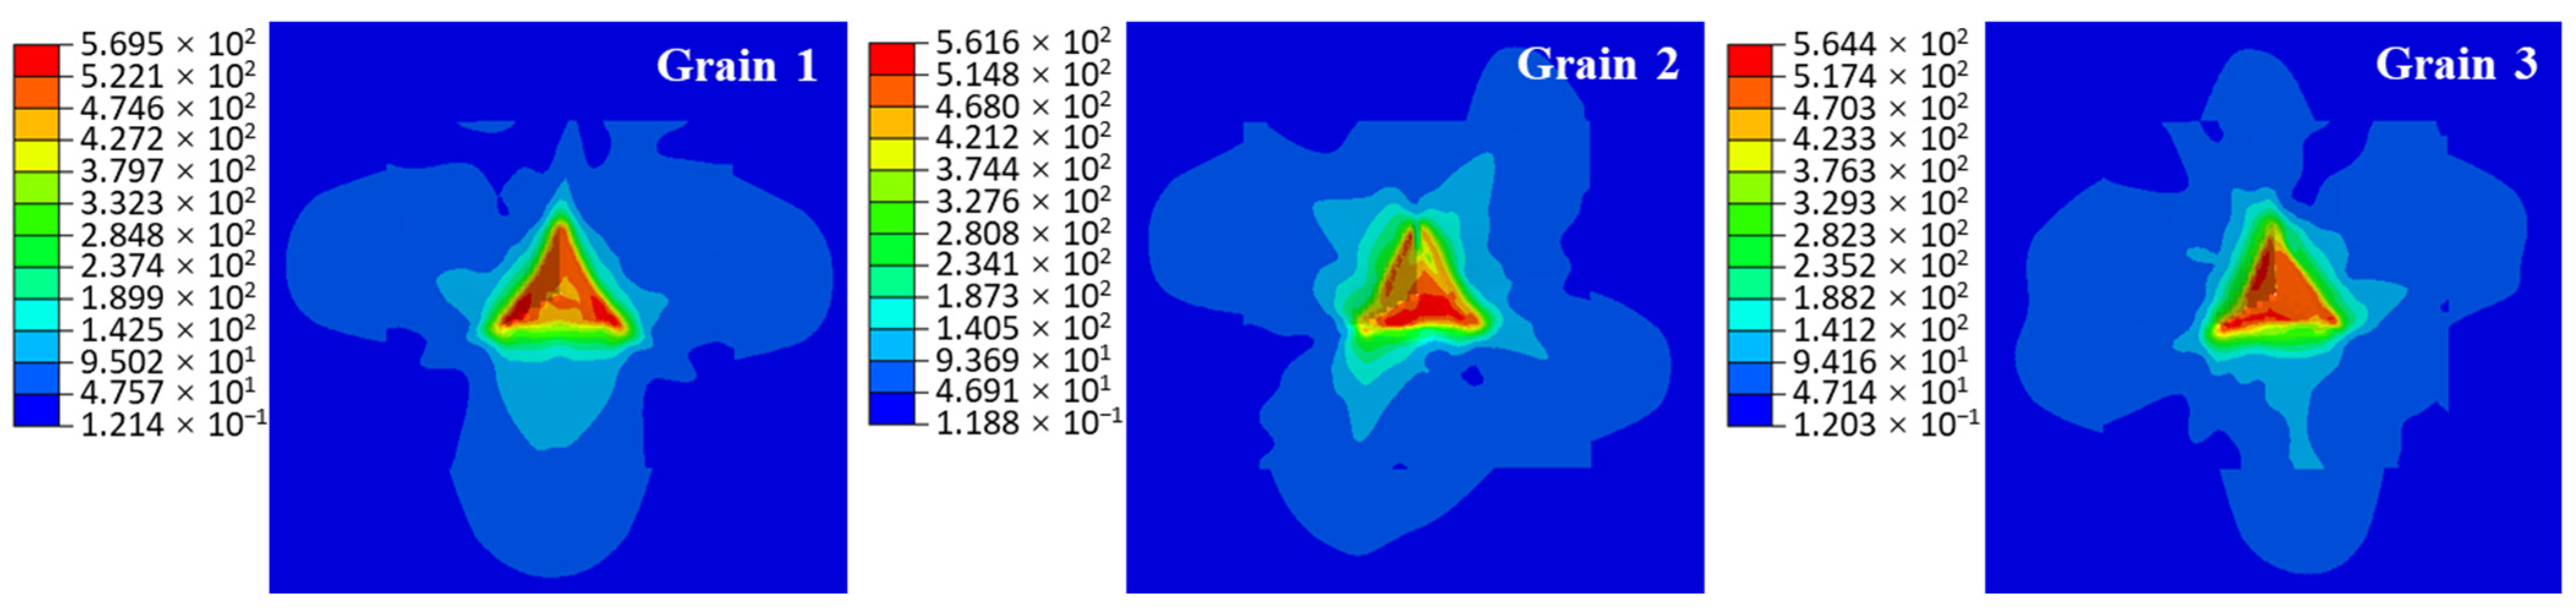
4.2. Results of Nanoindentation Simulation
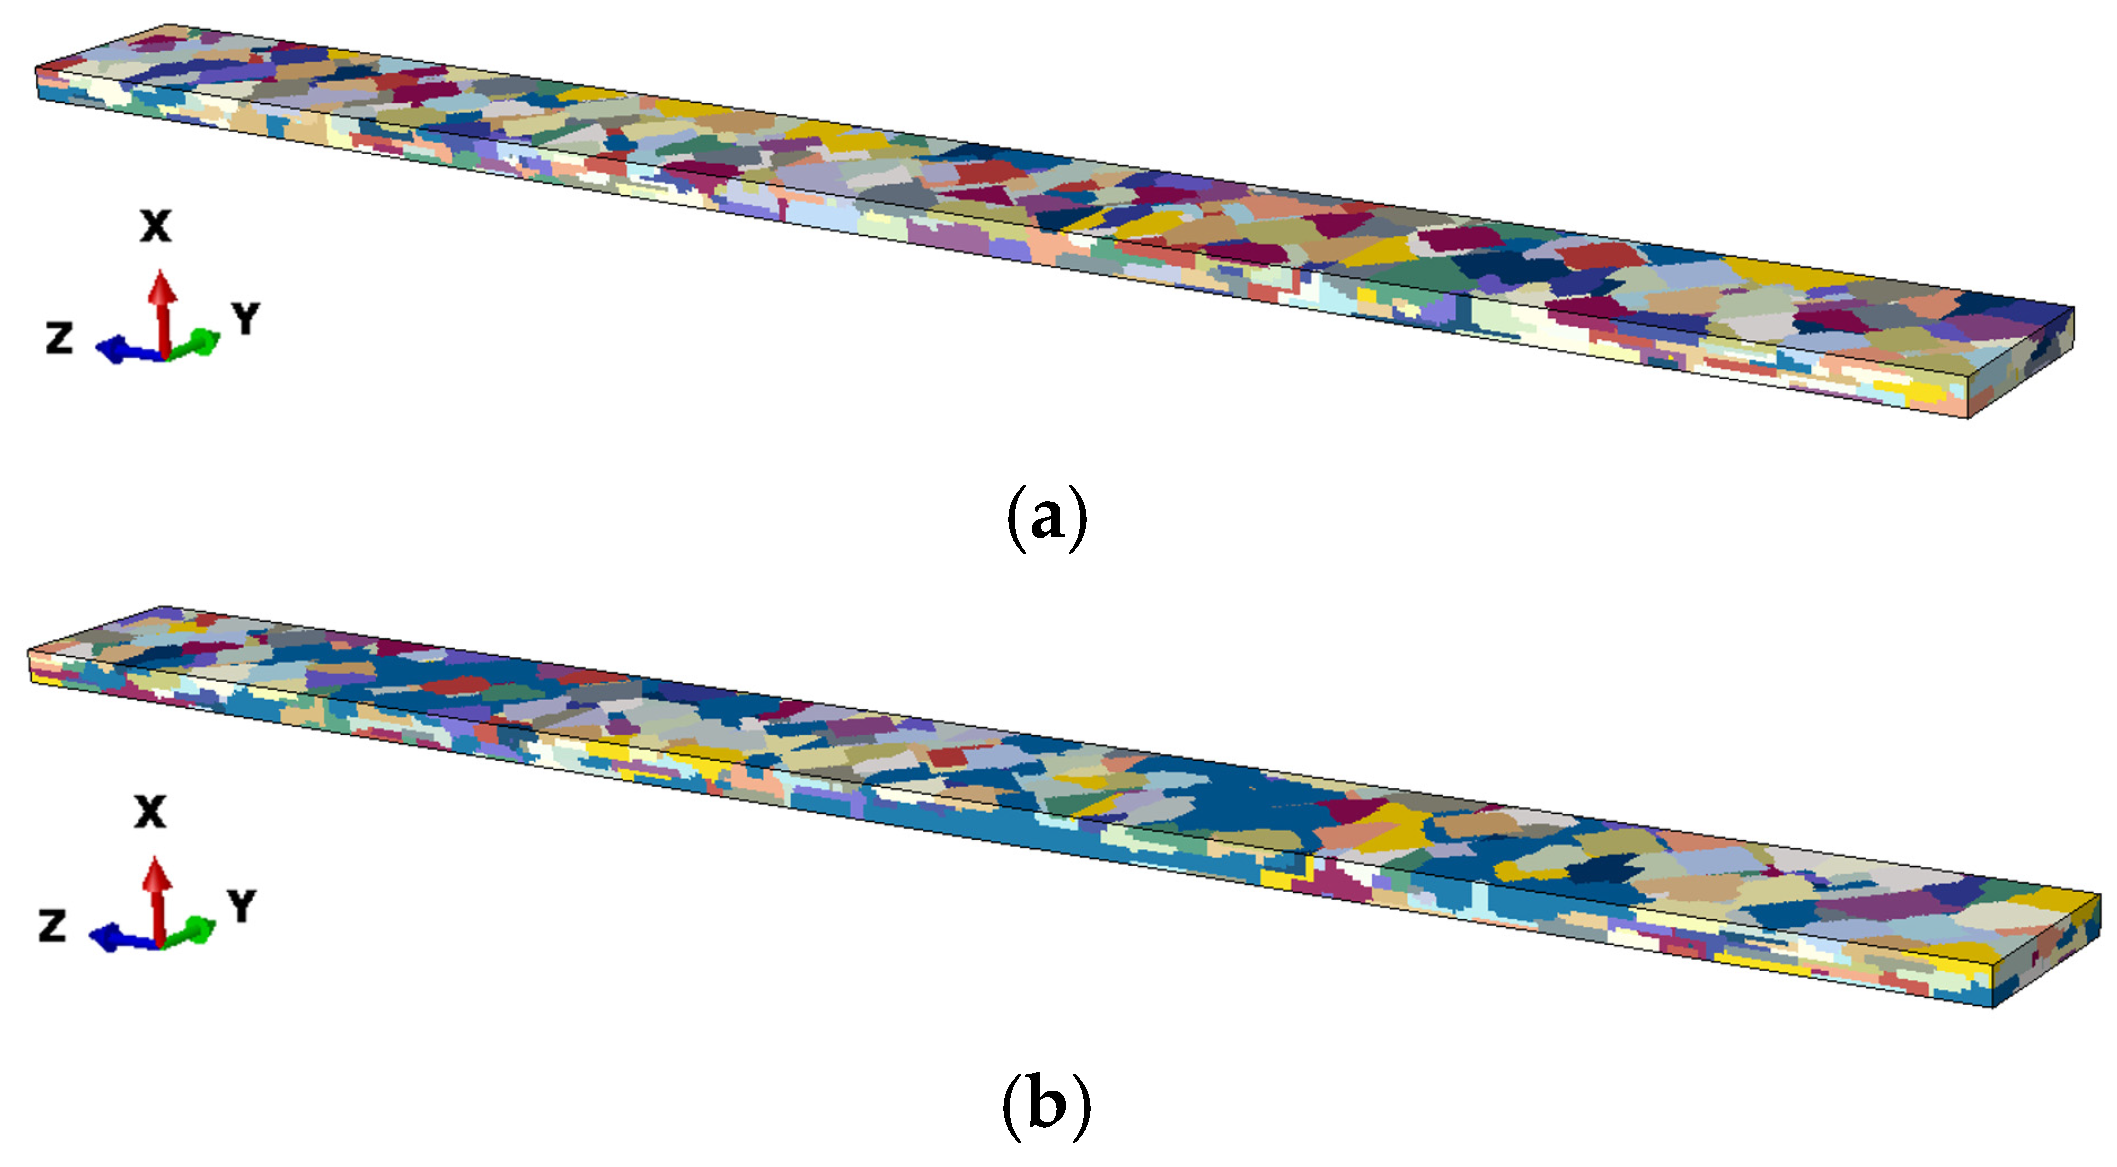
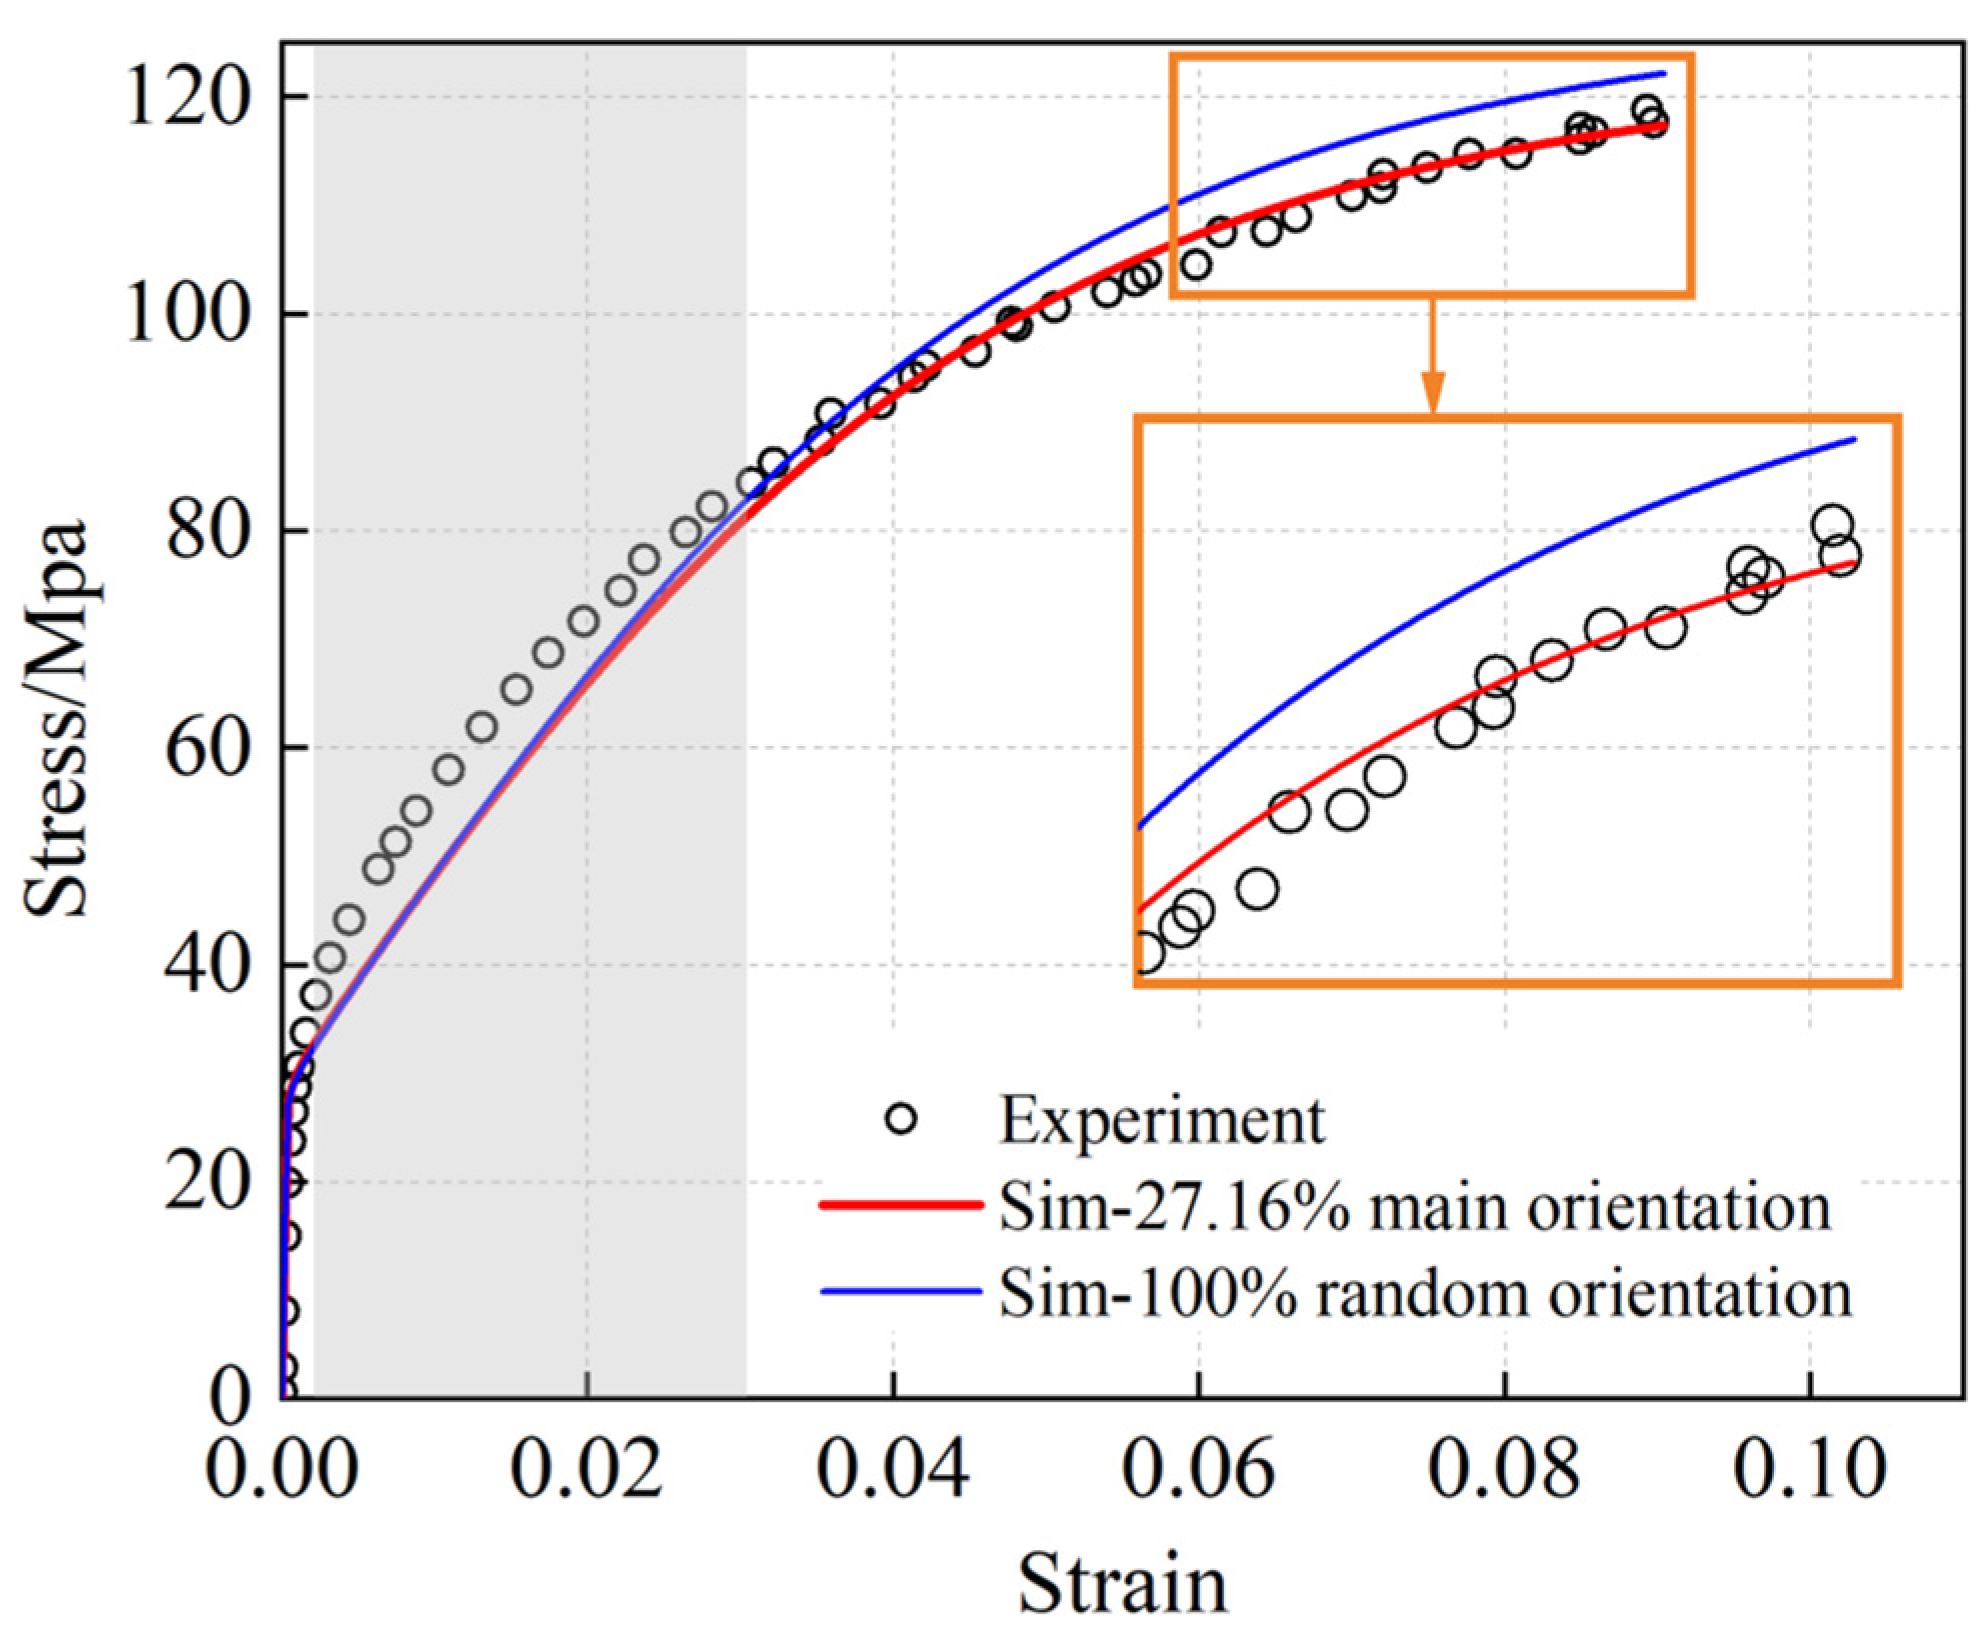
4.3. Polycrystalline Tensile Simulation
5. Conclusions
Author Contributions
Funding
Data Availability Statement
Acknowledgments
Conflicts of Interest
References
- Peng, L.; Zhang, R.; Xu, Z.; Lai, X. Plastic Deformation Forming of Metallic Bipolar Plate—Part 2: Implementation and Application. Encycl. Mater. Met. Alloys 2022, 4, 278–307. [Google Scholar]
- Peng, L.; Zhang, R.; Xu, Z.; Lai, X. Plastic Deformation Forming of Metallic Bi-Polar Plate—Part 1: Theoretical Basis and Fundamental. Encycl. Mater. Met. Alloys 2022, 4, 260–277. [Google Scholar]
- Su, H.; Wang, J.; Liu, C.; Yan, C.; Tian, G.; Yang, Z.; Xue, C.; Yang, X.; Li, Q.; Li, X.; et al. Orientation dependence of intracrystalline and grain boundary deformation behavior in Mg-2Y using nanoindentation and CPFEM. J. Alloys Compd. 2024, 994, 174688. [Google Scholar] [CrossRef]
- Tan, R.; Wang, Z.; Wu, S.; Liu, W.; Jiang, B. Unveiling orientation dependence of anisotropic plasticity in polycrystalline copper by nanoindentation. Nanotechnology 2023, 34, 465707. [Google Scholar] [CrossRef] [PubMed]
- Dhala, S.; Mishra, S.; Tewari, A.; Alankar, A. Analyses of orientation dependent nanoindentation response of pseudoelastic NiTi alloy using a crystal plasticity model. Mech. Mater. 2019, 135, 1–12. [Google Scholar] [CrossRef]
- Wang, Y.; Raabe, D.; Klüber, C.; Roters, F. Orientation dependence of nanoindentation pile-up patterns and of nanoindentation microtextures in copper single crystals. Acta Mater. 2004, 52, 2229–2238. [Google Scholar] [CrossRef]
- Zhang, P.; Karimpour, M.; Balint, D.; Lin, J.; Farrugia, D. A controlled Poisson Voronoi tessellation for grain and cohesive boundary generation applied to crystal plasticity analysis. Comput. Mater. Sci. 2012, 64, 84–89. [Google Scholar] [CrossRef]
- Li, L.; Shen, L.; Proust, G.; Moy, C.K.S.; Ranzi, G. Three-dimensional crystal plasticity finite element simulation of nanoindentation on aluminium alloy 2024. Mater. Sci. Eng. A-Struct. Mater. Prop. Microstruct. Process. 2013, 579, 41–49. [Google Scholar] [CrossRef]
- Romanova, V.; Balokhonov, R. A method of step-by-step packing and its application in generating 3D microstructures of polycrystalline and composite materials. Eng. Comput. 2019, 37, 241–250. [Google Scholar] [CrossRef]
- Sergeev, M.V.; Balokhonov, R.R.; Romanova, V.A.; Emelianova, E.S. Numerical simulation of deformation and fracture in polycrystalline aluminum at different strain rates. In Proceedings of the International Conference on Advanced Materials with Hierarchical Structure for New Technologies and Reliable Structures, Tomsk, Russia, 1–5 October 2019. [Google Scholar]
- Ha, S.; Jang, J.-H.; Kim, K. Finite element implementation of dislocation-density-based crystal plasticity model and its application to pure aluminum crystalline materials. Int. J. Mech. Sci. 2017, 120, 249–262. [Google Scholar] [CrossRef]
- Herrera-Solaz, V.; Cepeda-Jimenez, C.M.; Perez-Prado, M.T.; Segurado, J.; Niffenegger, M. The influence of underlying microstructure on surface stress and strain fields calculated by crystal plasticity finite element method. Mater. Today Commun. 2020, 24, 101176. [Google Scholar] [CrossRef]
- Ye, C.; Chen, J.; Xu, M.; Wei, X.; Lu, H. Multi-scale simulation of nanoindentation on cast Inconel 718 and NbC precipitate for mechanical properties prediction. Mater. Sci. Eng. A 2016, 662, 385–394. [Google Scholar] [CrossRef]
- Kim, J.-B.; Yoon, J.W. Necking behavior of AA 6022-T4 based on the crystal plasticity and damage models. Int. J. Plast. 2015, 73, 3–23. [Google Scholar] [CrossRef]
- Yan, B.; Jiang, S.; Hu, L.; Zhang, Y.; Sun, D. Crystal plasticity finite element simulation of NiTi shape memory alloy under canning compression based on constitutive model containing dislocation density. Mech. Mater. 2021, 157, 103830. [Google Scholar] [CrossRef]
- Peng, C.-T.; Liu, M.; Lu, C.; Li, H. The Determination of Self Hardening Parameters of Twinning Induced Plasticity Steel via Crystal Plasticity Modeling. J. Comput. Theor. Nanosci. 2015, 12, 2523–2530. [Google Scholar] [CrossRef]
- Goto, K.; Watanabe, I.; Ohmura, T. Determining suitable parameters for inverse estimation of plastic properties based on indentation marks. Int. J. Plast. 2019, 116, 81–90. [Google Scholar] [CrossRef]
- Xiao, X.; Chen, L.; Yu, L.; Duan, H. Modelling nano-indentation of ion-irradiated FCC single crystals by strain-gradient crystal plasticity theory. Int. J. Plast. 2019, 116, 216–231. [Google Scholar] [CrossRef]
- ISO 14577-1:2015; Metallic Materials—Instrumented Indentation Test for Hardness and Materials Parameters—Part 1: Test Method. ISO: Geneva, Switzerland, 2015.
- Rice, J.R. Inelastic constitutive relations for solids: An internal-variable theory and its application to metal plasticity. J. Mech. Phys. Solids 1971, 19, 433–455. [Google Scholar] [CrossRef]
- Peirce, D.; Asaro, R.J.; Needleman, A. Material rate dependence and localized deformation in crystalline solids. Acta Metall. 1983, 31, 1951–1976. [Google Scholar] [CrossRef]
- Fang, Q.; Chen, Y.; Li, J.; Jiang, C.; Liu, B.; Liu, Y.; Liaw, P.K. Probing the phase transformation and dislocation evolution in dual-phase high-entropy alloys. Int. J. Plast. 2019, 114, 161–173. [Google Scholar] [CrossRef]
- Wang, H.; Lee, H.-W.; Kang, S.-H.; Kim, D.-K. Crystal Plasticity Finite Element Analyses on the Formability of AA6061 Aluminum Alloy with Different Ageing Treatments. Metals 2024, 14, 503. [Google Scholar] [CrossRef]
- Aghabalaeivahid, A.; Shalvandi, M. Microstructure-based crystal plasticity modeling of AA2024-T3 aluminum alloy defined as the α-Al, θ-Al2Cu, and S-Al2CuMg phases based on real metallographic image. Mater. Res. Express 2021, 8, 106521. [Google Scholar] [CrossRef]
- Shiraiwa, T.; Briffod, F.; Enoki, M. Prediction of Fatigue Crack Initiation of 7075 Aluminum Alloy by Crystal Plasticity Simulation. Materials 2023, 16, 1595. [Google Scholar] [CrossRef]
- Li, J.; Wu, X.; Jiang, H. Crystal Plasticity Finite Element Simulation of Grain Evolution Behavior in Aluminum Alloy Rolling. Materials 2024, 17, 3749. [Google Scholar] [CrossRef] [PubMed]
- Li, A.; Hu, W.; Li, H.; Zhan, Z.; Meng, Q. A crystal plasticity-based microdamage model and its application on the tensile failure process analysis of 7075 aluminum alloy. Mater. Sci. Eng. A 2023, 884, 145541. [Google Scholar] [CrossRef]
- Zhang, Z.; Li, Z.; Tang, S.; Ma, Y.; Liu, W. Predicting the in-plane mechanical anisotropy of 7085 aluminum alloys through crystal plasticity simulations and machine learning. Mater. Today Commun. 2024, 38, 108381. [Google Scholar] [CrossRef]
- Han, F.; Tang, B.; Yan, X.; Peng, Y.; Kou, H.; Li, J.; Deng, Y.; Feng, Y. Indentation Pileup Behavior of Ti-6Al-4V Alloy: Experiments and Nonlocal Crystal Plasticity Finite Element Simulations. Metall. Mater. Trans. A 2017, 48, 2051–2061. [Google Scholar] [CrossRef]
- Mesarovic, S.D.; Fleck, N.A. Spherical indentation of elastic–plastic solids. Proc. R. Soc. Lond. Ser. A Math. Phys. Eng. Sci. 1999, 455, 2707–2728. [Google Scholar] [CrossRef]
- Huang, Y. A User-Material Subroutine Incorporating Single Crystal Plasticity in the ABAQUS Finite Element Program, Mech Report 178; Harvard University: Cambridge, MA, USA, 1991; pp. 1–46. [Google Scholar]
- Neveau, M.L.; Meier, W.R.; Park, H.; Thompson, M.J.; Bibhanshu, N.; Böcher, C.; Fishman, T.; Weiss, D.; Chisholm, M.F.; Rios, O.; et al. Secondary phase increases the elastic modulus of a cast aluminum-cerium alloy. Commun. Mater. 2024, 5, 185. [Google Scholar] [CrossRef]
- Shuman, D.J.; Costa, A.L.M.; Andrade, M.S. Calculating the elastic modulus from nanoindentation and microindentation reload curves. Mater. Charact. 2007, 58, 380–389. [Google Scholar] [CrossRef]
- Dao, M.; Chollacoop, N.; Van Vliet, K.J.; Venkatesh, T.A.; Suresh, S. Computational modeling of the forward and reverse problems in instrumented sharp indentation. Acta Mater. 2001, 49, 3899–3918. [Google Scholar] [CrossRef]


| Parameter | Value Range |
|---|---|
| /Mpa | 20~200 |
| /Mpa | 50~700 |
| /Mpa | 90~900 |
| 1~3 |
| H | k | l | u | v | w | Proportion |
|---|---|---|---|---|---|---|
| −0.737 | −0.177 | 0.653 | 0.671 | −0.068 | 0.739 | 27.16% |
| Normalized Miller Indices | Grain 1 | Grain 2 | Grain 3 |
|---|---|---|---|
| h | −0.473 | 0.637 | −0.390 |
| k | 0.426 | −0.209 | −0.664 |
| l | 0.771 | 0.742 | 0.638 |
| u | 0.584 | 0.693 | 0.806 |
| v | −0.503 | −0.267 | 0.088 |
| w | 0.637 | −0.670 | 0.585 |
| /MPa | /MPa | /MPa |
|---|---|---|
| 115,600 | 62,400 | 32,700 |
| Grain 1 | Grain 2 | Grain 3 | Average | |
|---|---|---|---|---|
| Young’s modulus/GPa | 79.83 | 80.34 | 80.21 | 80.13 |
| /MPa | /MPa | /MPa | |
|---|---|---|---|
| 290 | 22 | 56 | 2.6 |
| Indentation Width | Grain 1 | Grain 2 | Grain 3 |
|---|---|---|---|
| EXP-average indentation width/μm | 3.45 | 3.49 | 3.46 |
| SIM- indentation width/μm | 3.51 | 3.52 | 3.51 |
| Errors/% | 1.74 | 0.72 | 1.45 |
| Grain 1 | Grain 2 | Grain 3 | |
|---|---|---|---|
| /MPa | 29.88 | 28.96 | 29.81 |
| 0.4012 | 0.3876 | 0.3987 |
Disclaimer/Publisher’s Note: The statements, opinions and data contained in all publications are solely those of the individual author(s) and contributor(s) and not of MDPI and/or the editor(s). MDPI and/or the editor(s) disclaim responsibility for any injury to people or property resulting from any ideas, methods, instructions or products referred to in the content. |
© 2025 by the authors. Licensee MDPI, Basel, Switzerland. This article is an open access article distributed under the terms and conditions of the Creative Commons Attribution (CC BY) license (https://creativecommons.org/licenses/by/4.0/).
Share and Cite
Wang, W.; Li, T.; Wang, G.; Luneau, F.; Henner, M. Mechanical Properties Simulation of Aluminum Alloy Sheet Using SSP and CPFEM. Metals 2025, 15, 323. https://doi.org/10.3390/met15030323
Wang W, Li T, Wang G, Luneau F, Henner M. Mechanical Properties Simulation of Aluminum Alloy Sheet Using SSP and CPFEM. Metals. 2025; 15(3):323. https://doi.org/10.3390/met15030323
Chicago/Turabian StyleWang, Wei, Ting Li, Guobin Wang, François Luneau, and Manuel Henner. 2025. "Mechanical Properties Simulation of Aluminum Alloy Sheet Using SSP and CPFEM" Metals 15, no. 3: 323. https://doi.org/10.3390/met15030323
APA StyleWang, W., Li, T., Wang, G., Luneau, F., & Henner, M. (2025). Mechanical Properties Simulation of Aluminum Alloy Sheet Using SSP and CPFEM. Metals, 15(3), 323. https://doi.org/10.3390/met15030323