Article

Hot Deformation Behaviors and Dynamic Softening Mechanisms of As-Cast XM-19 Super Austenitic Stainless Steel

1
School of Materials Science and Engineering, Henan University of Science and Technology, Luoyang 471023, China
2
National Joint Engineering Research Center for Abrasion Control and Molding of Metal Materials, Henan University of Science and Technology, Luoyang 471003, China
*
Author to whom correspondence should be addressed.
Metals 2025, 15(3), 334; https://doi.org/10.3390/met15030334
Submission received: 28 January 2025 / Revised: 10 March 2025 / Accepted: 17 March 2025 / Published: 19 March 2025

Abstract

:
The hot deformation behaviors and dynamic softening mechanisms of XM-19 super austenitic stainless steel (SASS) were investigated using the isothermal compression test in the temperature range from 1025 to 1250 °C and a compression rate of 0.01–10 s−1. A hot processing map with a strain of 0.9 was constructed, and the analysis results show that the optimal thermal deformation parameters are a temperature range of 1200–1250 °C and a strain rate range of 0.03–0.2 s−1. The thermal activation energy at 0.7 strain is calculated to be 614.3 kJ/mol by developing constitutive equations under various deformation parameters, which is essentially higher than the range of thermal deformation activation energy of typical austenitic stainless steels. At a high temperature of 1250 °C, the synergistic effect of adiabatic heating and increased dislocation density drives the recrystallization fraction to surge from 20% to 78% as the strain rate rises from 0.01 to 10 s−1, while at a fixed strain rate of 0.1 s−1, the increase in deformation temperature from 1025 °C to 1250 °C promotes dynamic recrystallization (DRX), leading to a parallel rise in recrystallization fraction to 25%. The nucleation mechanism of XM-19 SASS is primarily driven by discontinuous dynamic recrystallization (DDRX), with a supporting role of continuous dynamic recrystallization (CDRX). The contribution of CDRX decreases gradually with increasing deformation temperature.

1. Introduction

XM-19 super austenitic stainless steel (SASS) is an excellent-performance austenitic stainless steel. On account of its great strength, excellent corrosion resistance and outstanding low-temperature toughness, XM-19 SASS is widely used in fields such as aerospace, marine engineering, and chemical equipment [1,2]. Compared with traditional 3xx series austenitic stainless steels, XM-19 SASS contains a higher proportion of Cr, Ni, Mo and N elements, demonstrating excellent microstructure stability and remarkable advantages in strength and corrosion resistance [3]. However, in the actual production process, XM-19 SASS usually needs to be treated by high-temperature forging or hot rolling, but its high proportion (up to 42%) of alloying elements may lead to segregation, thus affecting the hot deformation behavior [4]. The complex alloy composition gives it poor thermoplasticity and large deformation resistance at high temperatures, which further increase the difficulty in its thermal deformation.
Dynamic recovery (DRV), dynamic recrystallization (DRX), and dynamic precipitation (DPN) processes are often involved in the complicated hot deformation behaviors of metal materials, with dynamic recrystallization being crucial for enhancing performance [5]. The key factors influencing DRX include the material state (such as stacking fault energy (SFE), chemical composition, size and distribution of the second phase, etc.) and external deformation conditions [6,7,8,9,10,11]. The dynamic softening mechanism during the hot deformation of SASS is currently the subject of extensive research. Xu et al. [5] investigated the DRX mechanism of 7Mo SASS under hot deformation. It was found that as the Z value decreases, the high SFE leads to dislocation slip, which becomes the predominant deformation mechanism. The dynamic softening mechanism of 7Mo SASS changed from DRV to DDRX co-existing with CDRX, and eventually CDRX dominated. At the same time, the σ phase produced by strain-induced precipitation promoted the generation of CDRX. Hu et al. [12] found that the recrystallized grains of 7Mo-0.37N-RE SASS, after solution treatment and pre-deformation, were finer and more uniformly distributed during the hot deformation process. Pre-deformation can enhance the DRV, provide favorable conditions for the nucleation of recrystallized grains, and promote the nucleation of grains by increasing the dislocation density, thus accelerating the DDRX. Wang et al. [13] investigated the influence of the internal orientation of the alloy on the DRX during the hot deformation process of SASS. It was found that the hot working performance of SASS was the best when the angle was 0° between the loading direction and the solidification direction of the cylindrical crystal. The primary DRX mechanism changed depending on the deformation circumstances, even though samples with varying internal orientations showed equal recrystallization methods. Han et al. [14] observed that during the hot deformation of 254SMO SASS, recrystallized grains were formed through “bowing out” at grain boundaries, and that a high temperature and high rate could accelerate the recrystallization rate. At present, research on the high-temperature deformation behavior of XM-19 SASS is still relatively limited, especially systematic studies on the DRX mechanism. Although some studies have shown that XM-19 SASS has good plasticity and strength at high temperatures [15], its hot deformation mechanism, flow stress characteristics, construction of thermal processing maps and DRX mechanism still need to be further explored. Therefore, the study of the hot deformation behavior and microstructure evolution mechanism of XM-19 SASS is not only helpful for understanding the high-temperature deformation characteristics of the alloy, but it also provides a theoretical foundation for the establishment of its hot working parameters and optimizing its workability and reliability in practical applications.
A hot deformation test of XM-19 SASS was conducted in this study, and the hot deformation behavior is described in the deformation temperature range of 1025–1250 °C and the strain rate range of 0.01–10 s−1. The constitutive model with strain compensation was developed based on the true stress–strain curve, and the hot processing map was constructed to accurately describe the rheological properties of XM-19 SASS at high temperatures. The process of microstructure evolution under various deformation circumstances and the dynamic softening mechanism were investigated by microstructure analysis.

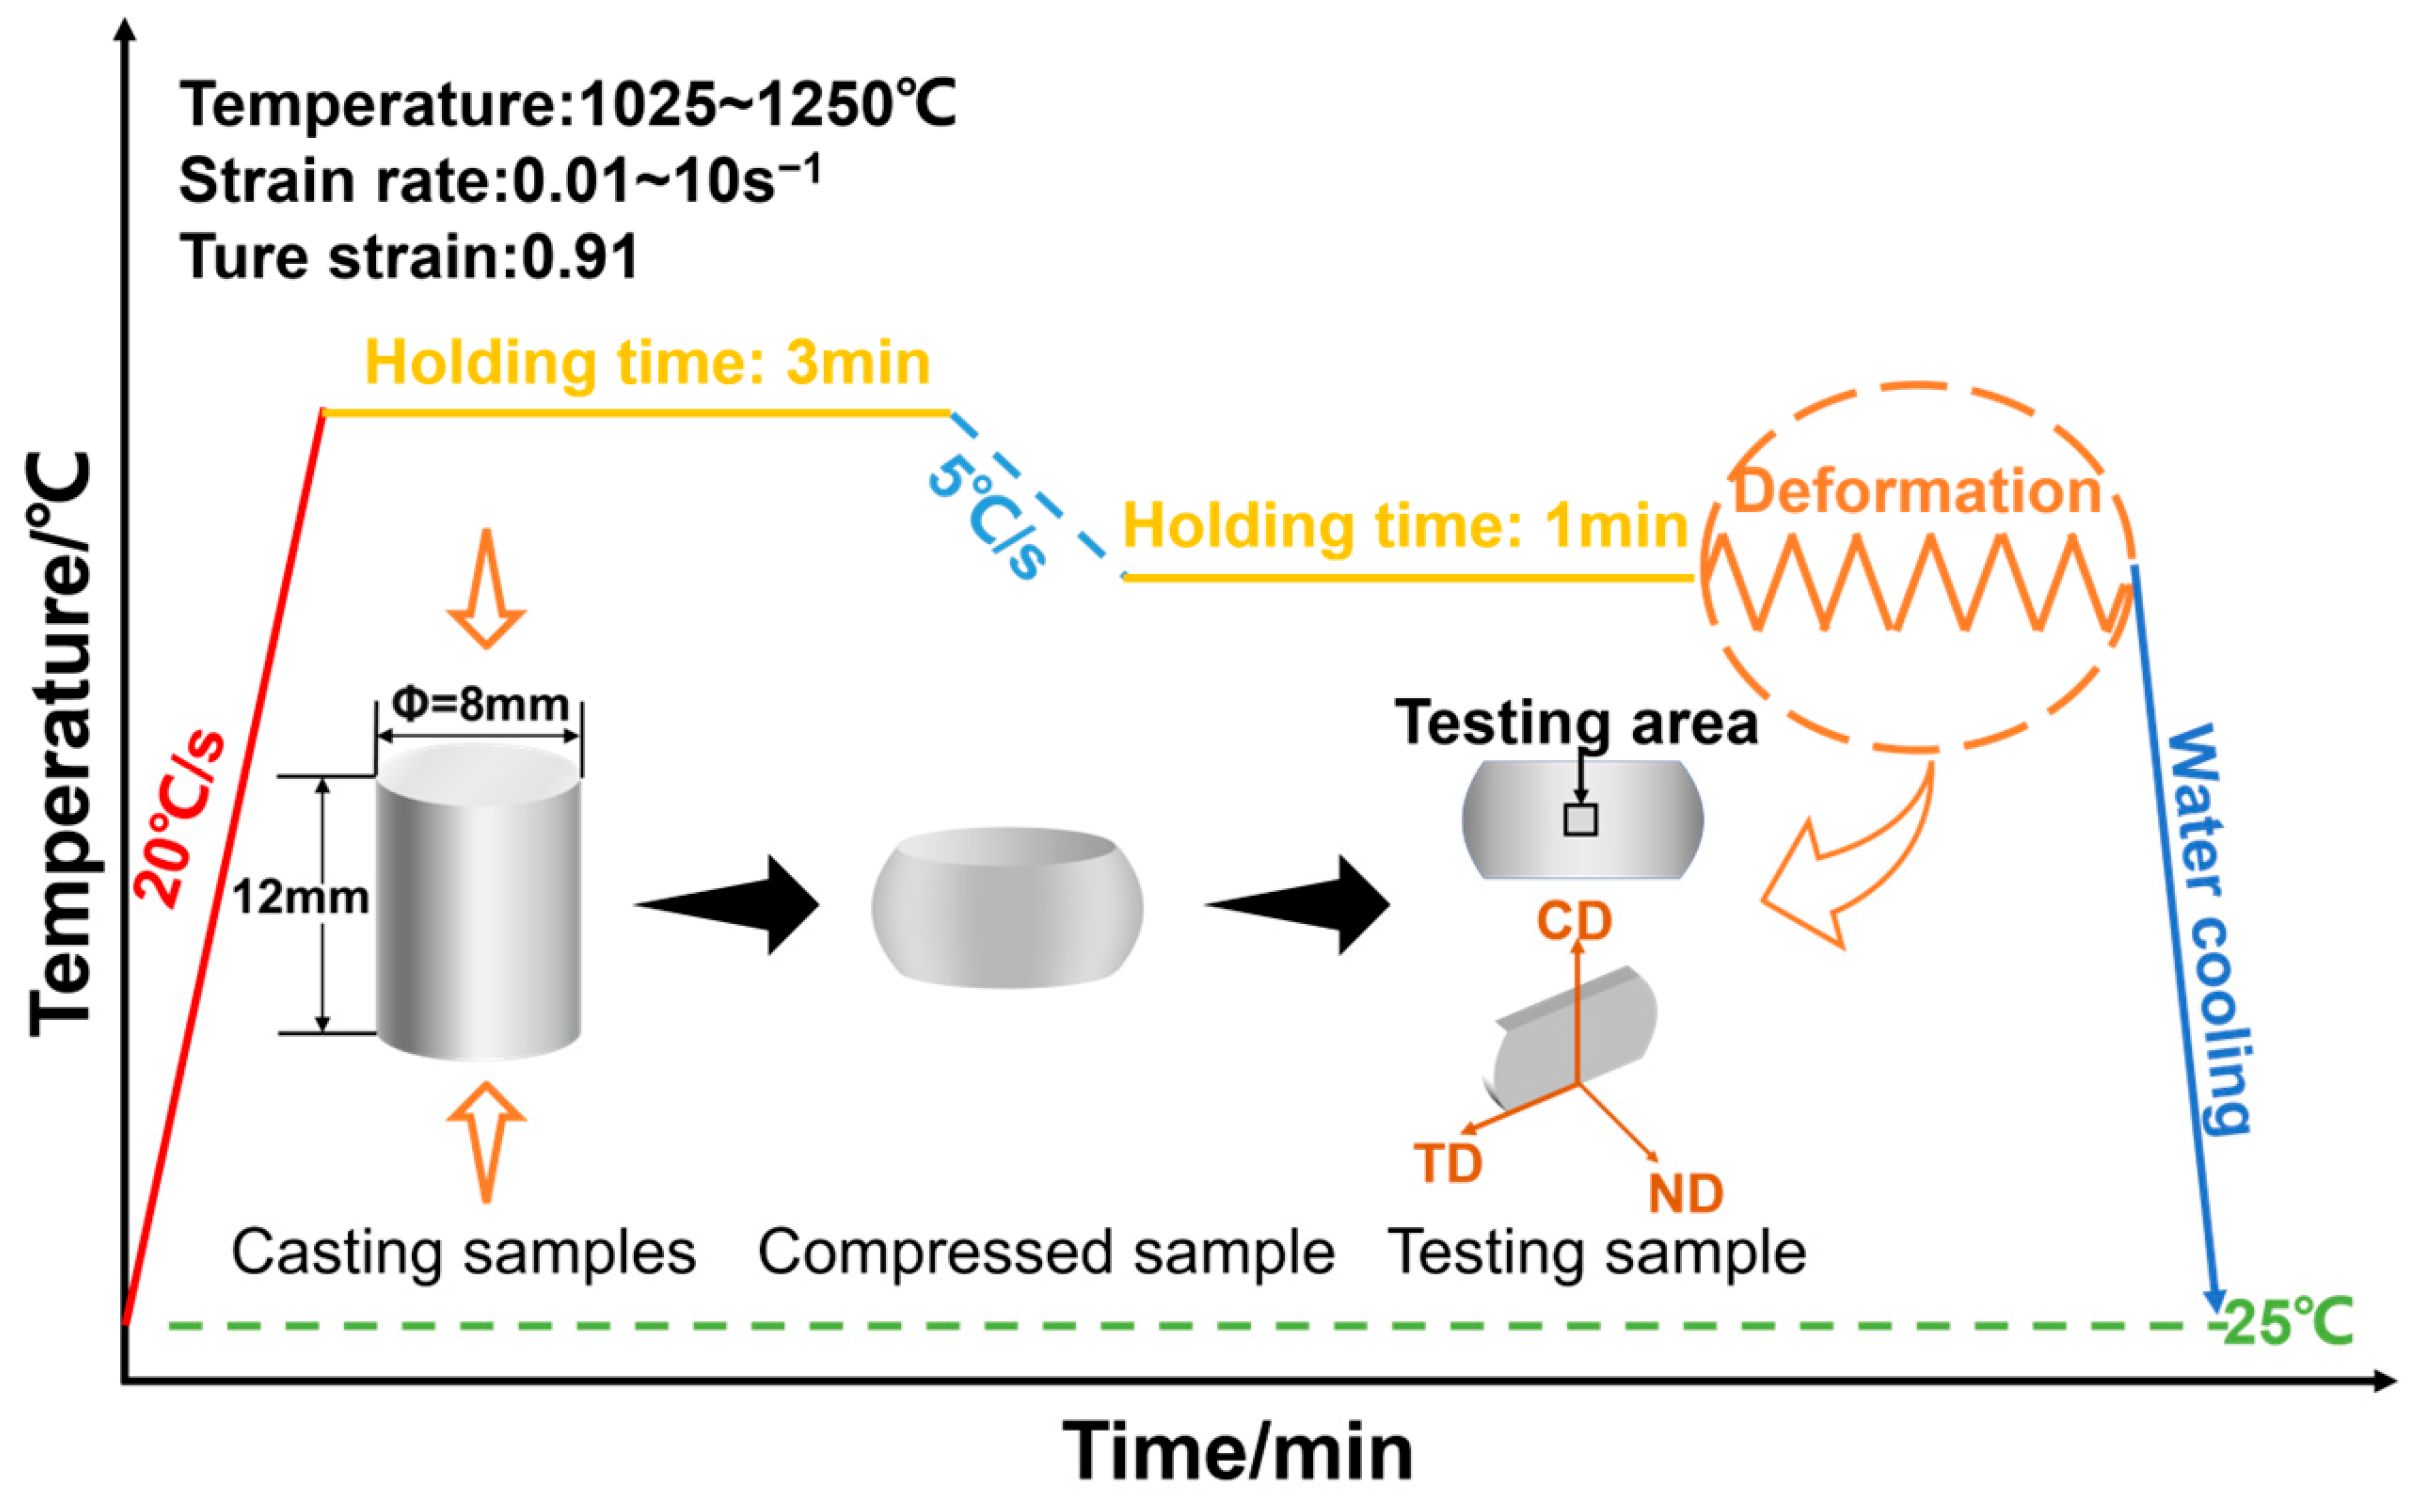
2. Materials and Methods

The experimental material is cast XM-19 SASS, and its chemical composition was determined using a direct reading spectrometer (OBLF-QSN750, OBLF Corporation, Dortmund, Germany), as shown in Table 1. After vacuum smelting and casting, the test steel underwent homogenization treatment by being held at 1190 °C for 23 h and then water-cooled to room temperature to obtain a single austenitic structure. The homogenized test steel was cut into 8 mm × 12 mm cylindrical compressed samples by wire cutting, and the surface was ground to improve the surface quality of the samples. The hot compression test was then conducted using the Gleeble-1500 thermal simulation testing machine (DSI, St. Paul, MN, USA). Figure 1 shows the process flow of the XM-19 SASS hot compression test, along with a schematic diagram of the sample’s hot deformation process.
The DRX mechanism of XM-19 SASS was studied by electron backscatter diffraction (EBSD), and the recrystallization grain size, distribution and grain boundary orientation difference of the samples after hot deformation were analyzed. The phase composition of cast XM-19 SASS was analyzed using a Cu target X-ray diffractometer (Bruker-D8, Bruker AXS, Karlsruhe, Germany) with a testing voltage of 40 kV, a testing current of 40 mA, and a scan speed of 4°/min. The samples were ground successively with sandpaper ranging from 800 to 2000 grit and polished with diamond grinding paste ranging from W3.5 to W1.0. They were then etched for 1–2 min using diluted aqua regia (HCl:HNO3:H2O = 3:1:4) and subsequently examined for microstructural observation using an optical microscope (BX53MRF-S, Olympus Corporation, Tokyo, Japan). The EBSD data collection area was first polished using an argon ion polisher (JEOL IB-19530 CP, JEOL Corporation, Tokyo, Japan), with the voltage set to 6.5 kV and the polishing time set to 25 min. The sample was subjected to the EBSD test using JEOL JSM-IT800 equipment (JEOL Corporation, Tokyo, Japan), which had a 20 kV acceleration voltage and a 0.9 μm step size.

3. Results and Discussion

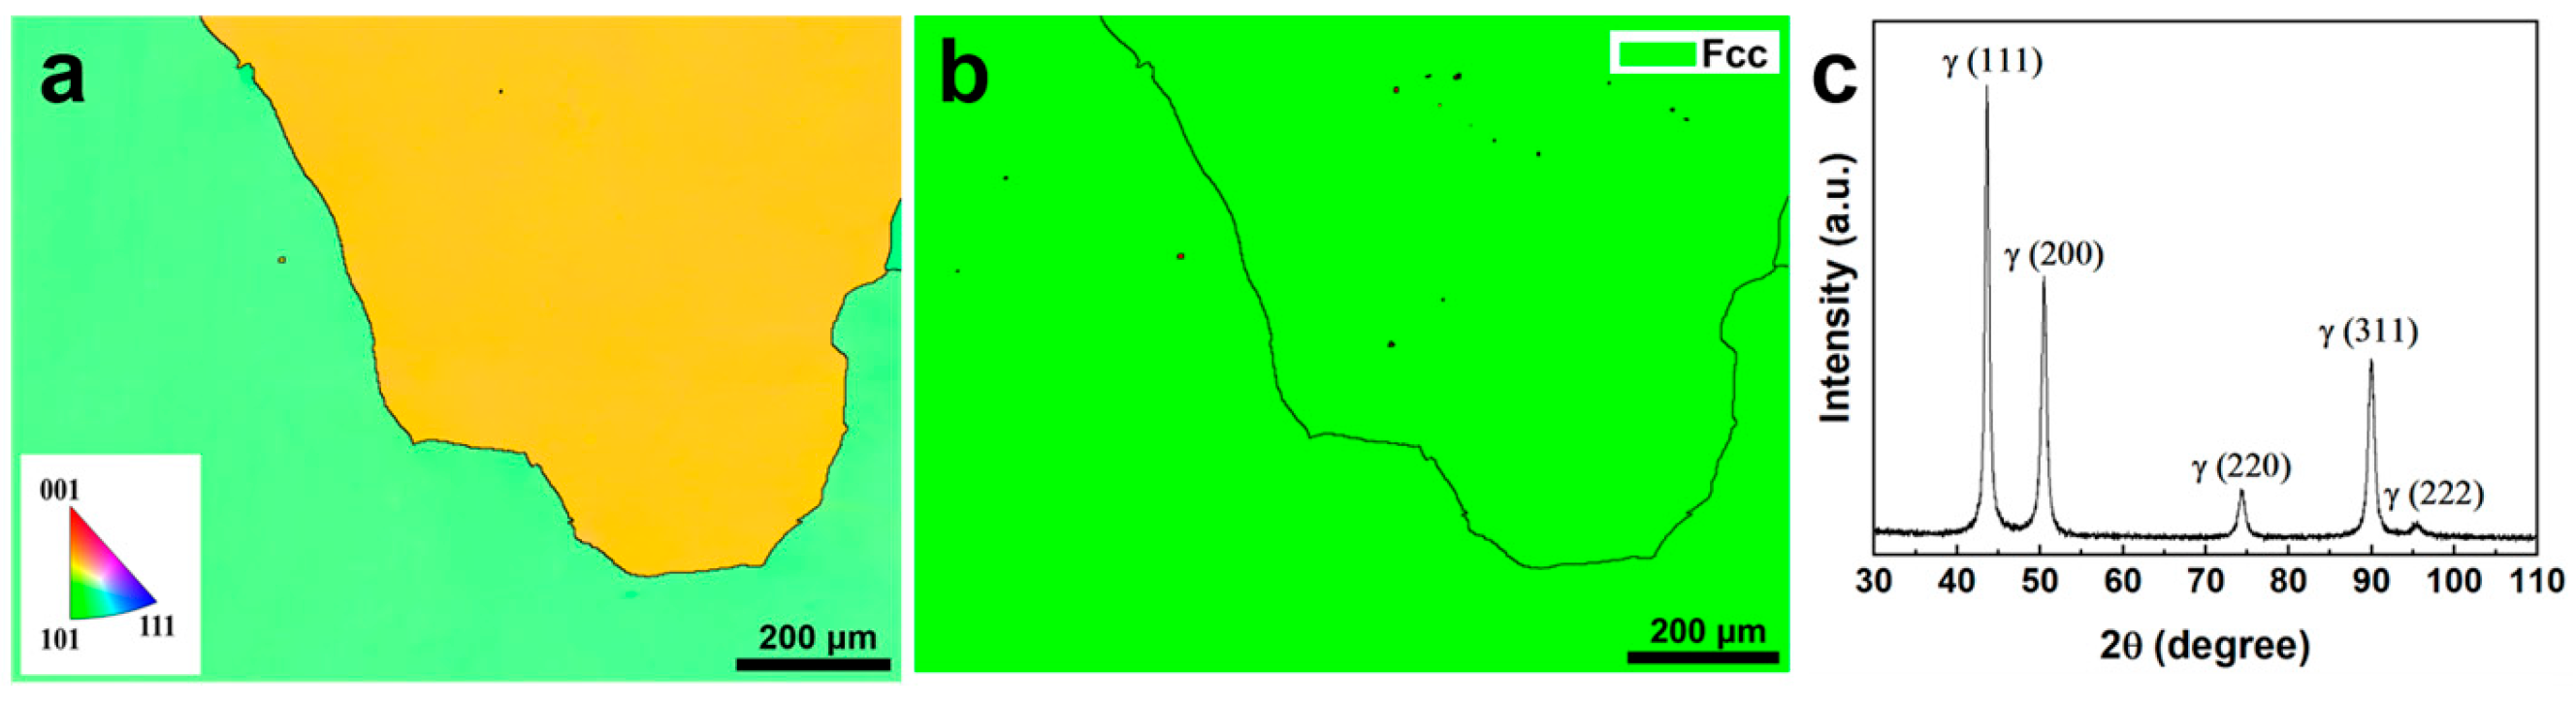
3.1. Initial Microstructure

Figure 2 shows the microstructure and XRD result of XM-19 SASS before hot deformation. The microstructure reveals that it consists of coarse grains, and the grains exhibit a single orientation feature (Figure 2a). Analysis of the PH diagram (Figure 2b) and XRD pattern (Figure 2c) confirms that the material has a single austenitic structure before hot deformation.

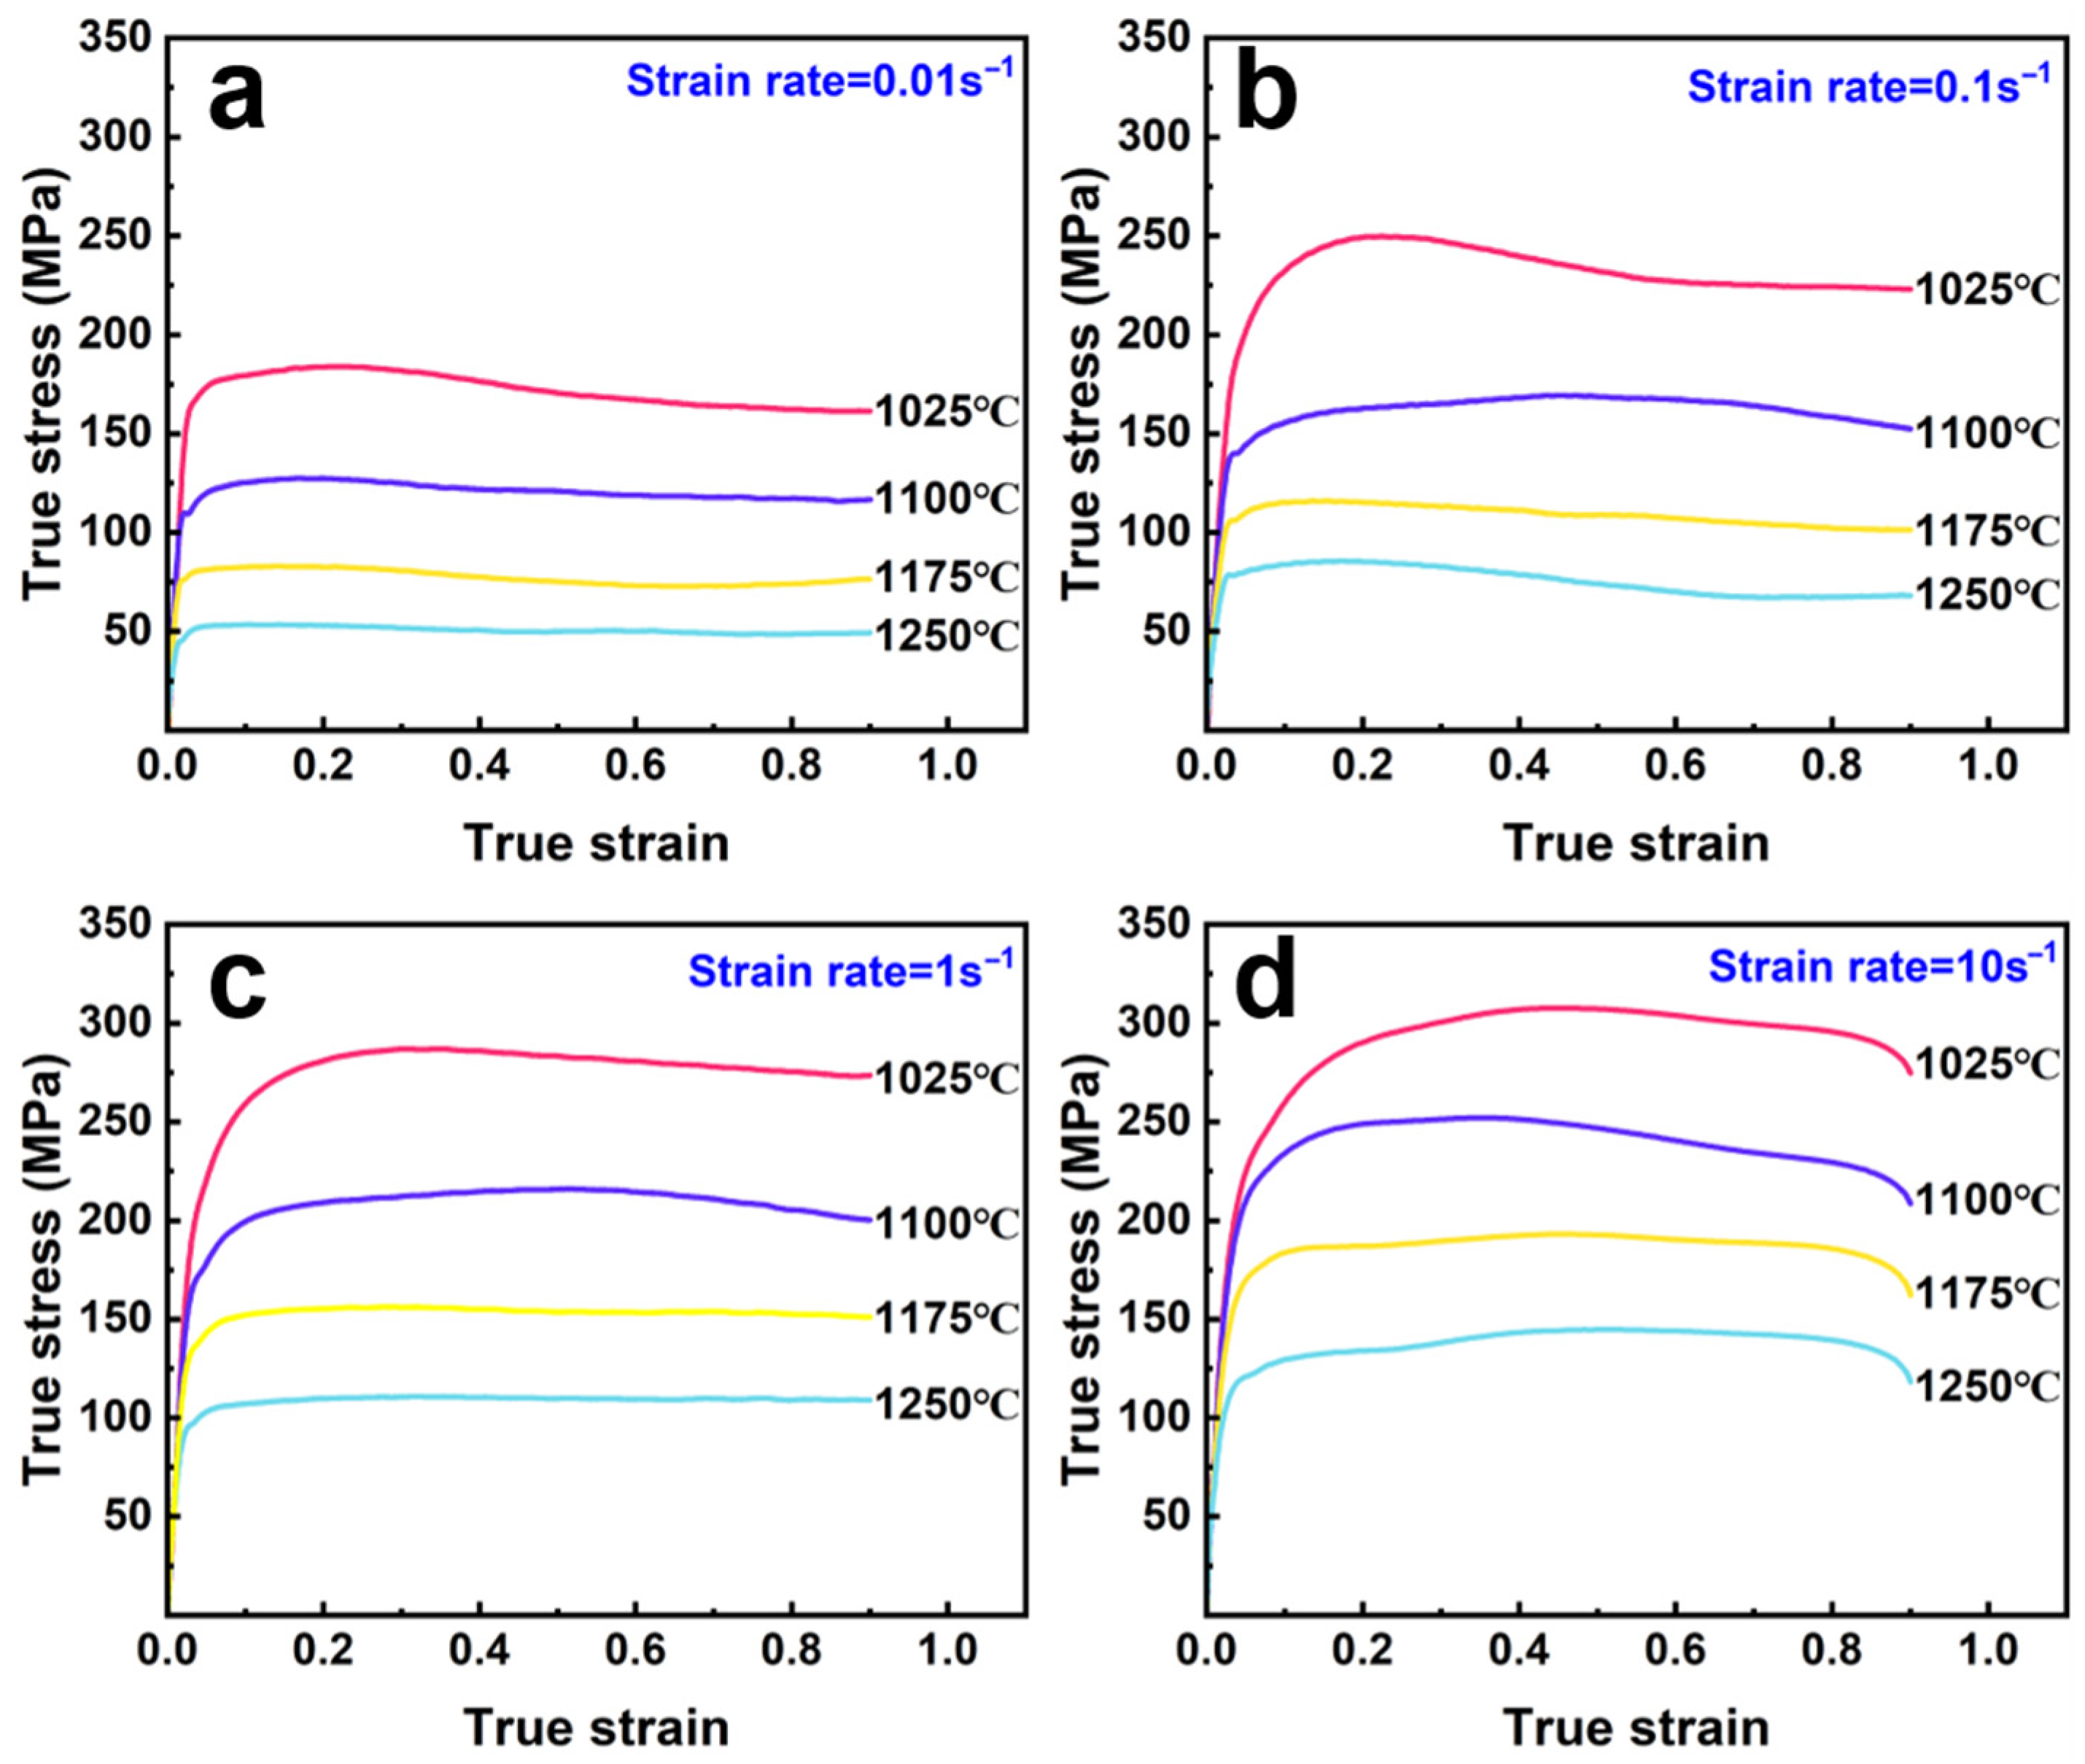
3.2. True Stress–Strain Curves and Flow Behaviors

Figure 3 presents the true stress–strain curves of XM-19 SASS in the temperature interval of 1025–1250 °C and the strain rate range of 0.01–10 s−1. The flow stress curves of the alloys show a similar trend and include three main stages: work hardening, dynamic softening and stabilization. The variation in flow stress is closely associated with the interplay between work hardening and dynamic softening mechanism and reflects the microstructure’s evolution during the hot deformation process [16]. In the course of the initially occurring period of deformation, the flow stress increases rapidly as the strain rises. The work hardening effect, which comes from a boost in dislocation density and dislocation tangle, is responsible for this phenomenon. As the strain increases, the cross-slip and climb of dislocations will promote DRV and DRX, thereby significantly reducing the flow stress [17]. The flow stress stabilizes when the strengthening effect of work hardening is matched with the softening effects of DRX and DRV.
The flow stress exhibits a high sensitivity to variations in strain rate and temperature, manifesting that the flow stress increases with the increase in strain rate and the decrease in deformation temperature. As the temperature rises, the flow stress falls at the same strain rate. This is attributed to the increase in atomic kinetic energy at elevated temperatures, which weakens the interatomic bonding, enhances the thermally activated movement of dislocations, and elevates the atomic transition frequency, thereby reducing the effective stress required for dislocation motion [18]. At low strain rate (0.01 s−1), the alloy has sufficient time to undergo DRX and DRV, maintaining a low flow stress through dislocation annihilation and grain boundary migration. However, at high strain rate (10 s−1), DRV is limited, leading to increased dislocation accumulation in the alloy, creating strong interactions that hinder dislocation motion, thus intensifying the work hardening effect and increasing the flow stress [19].

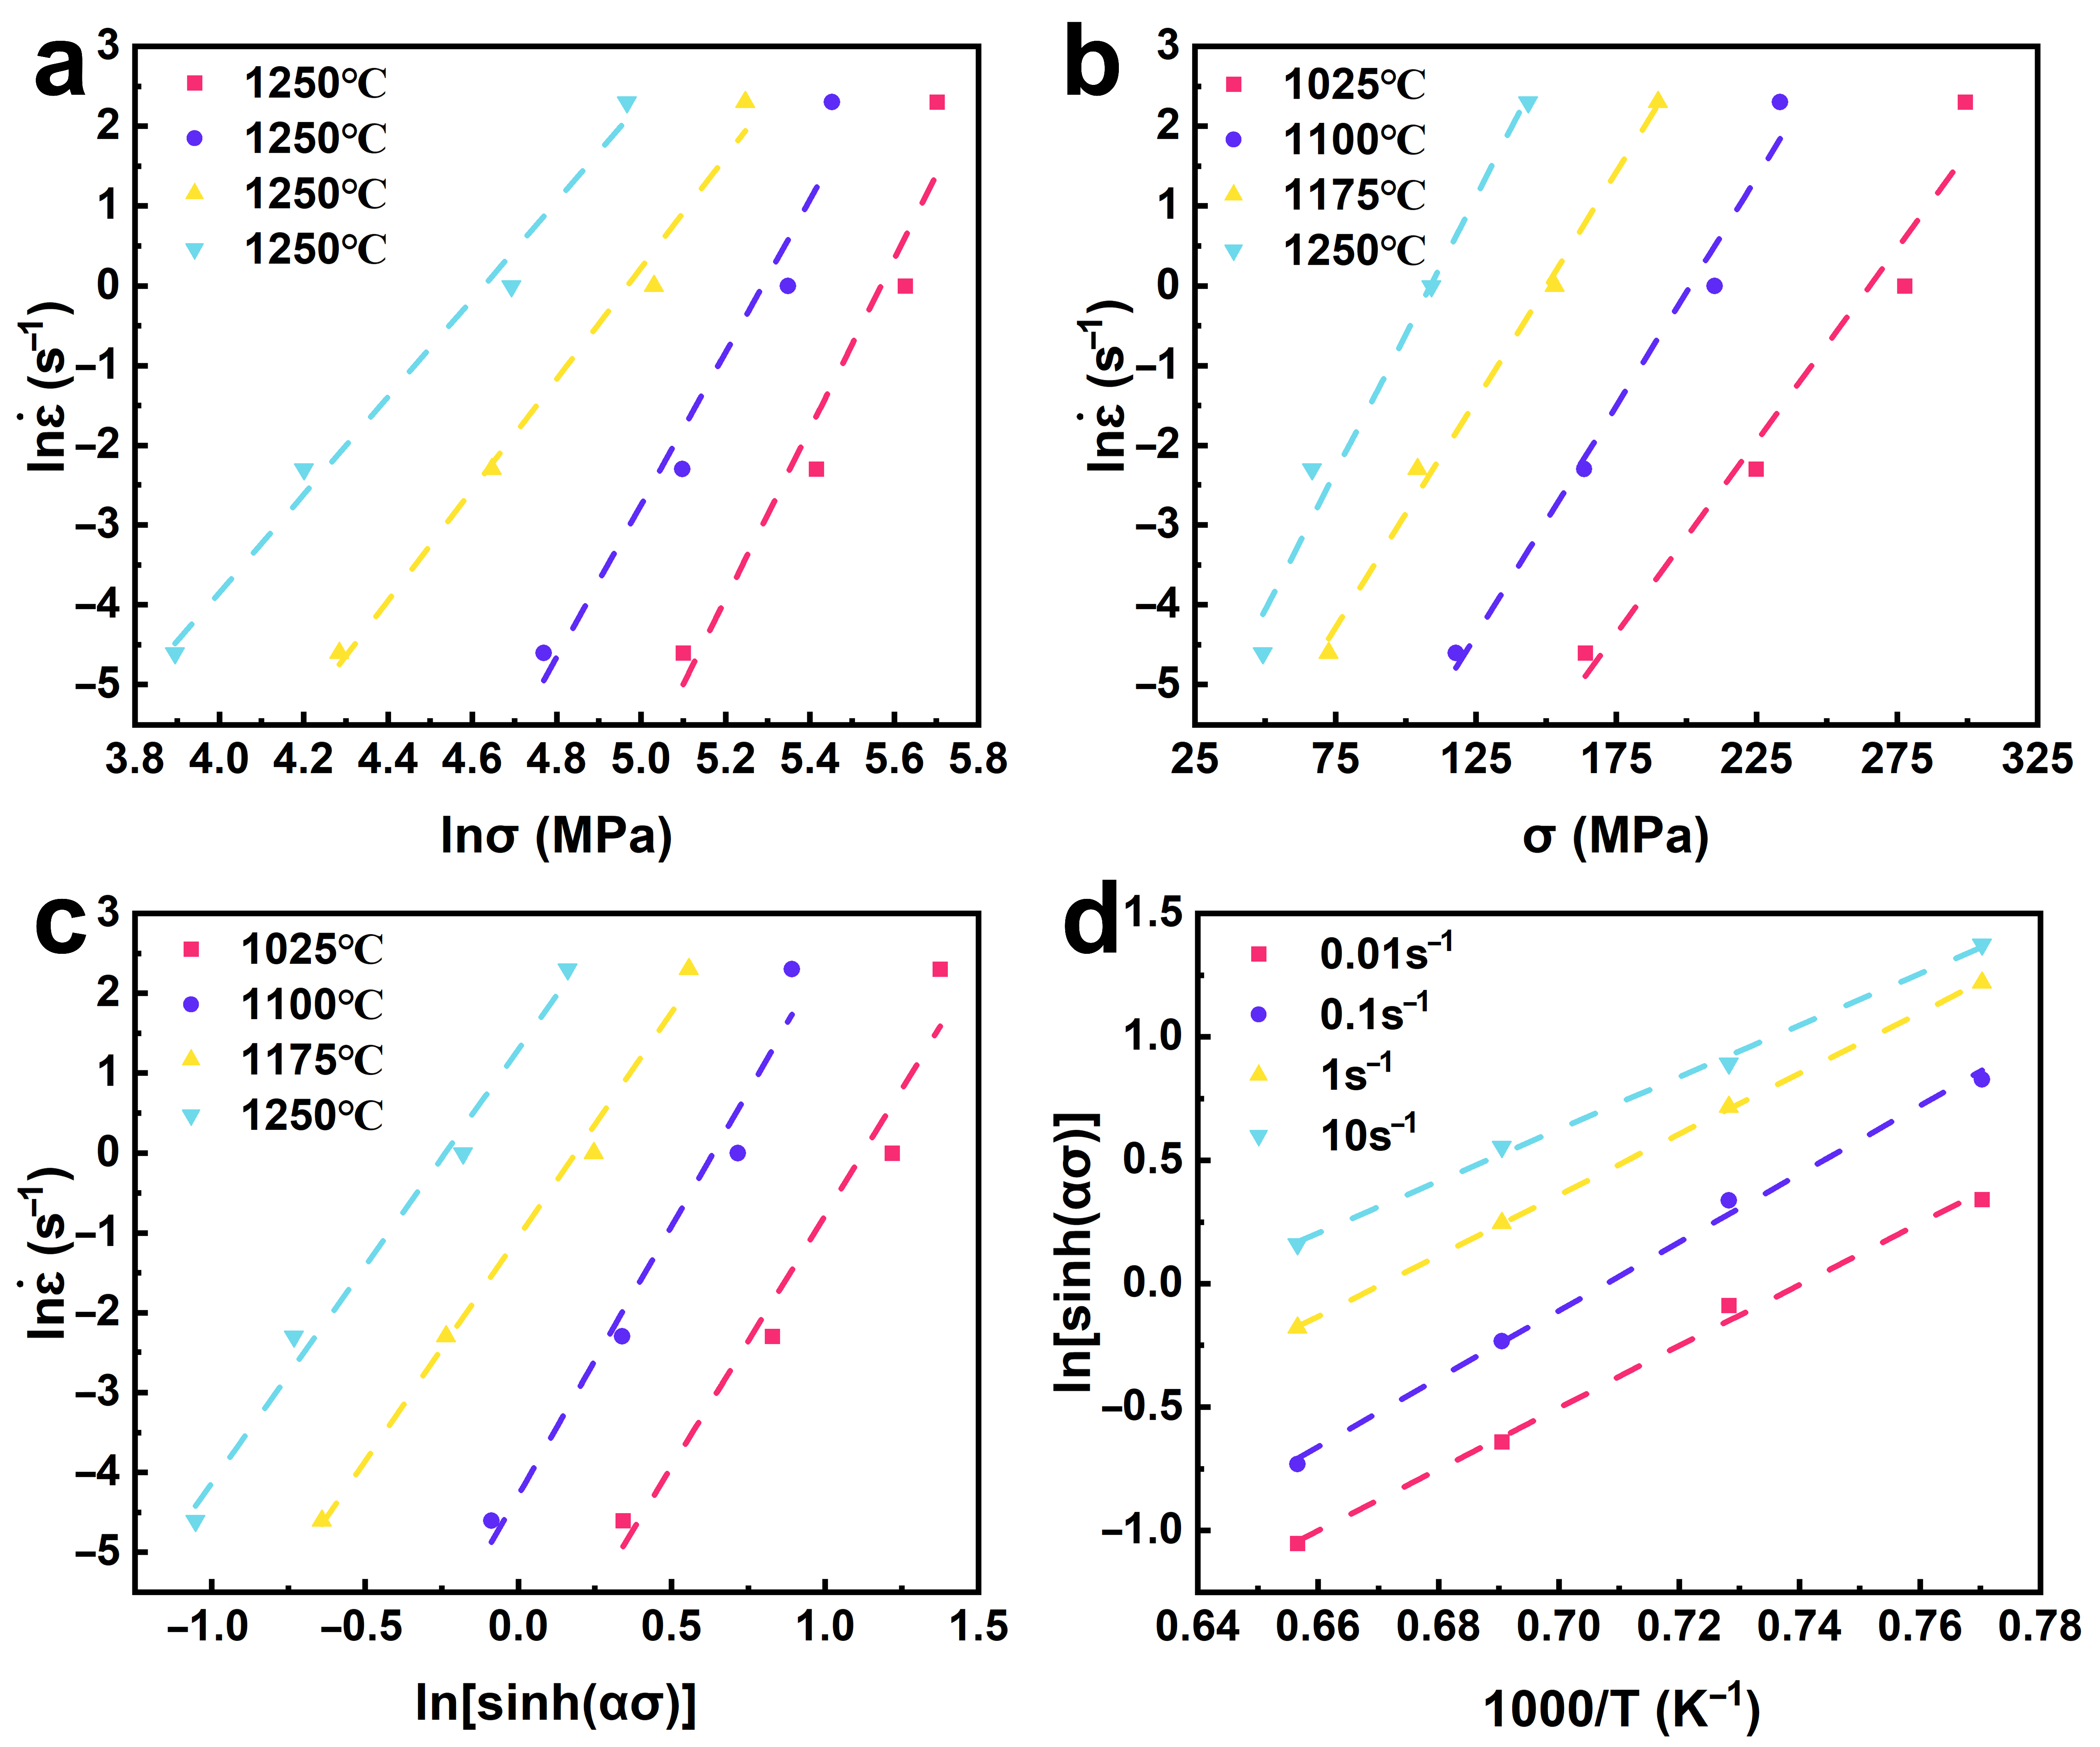
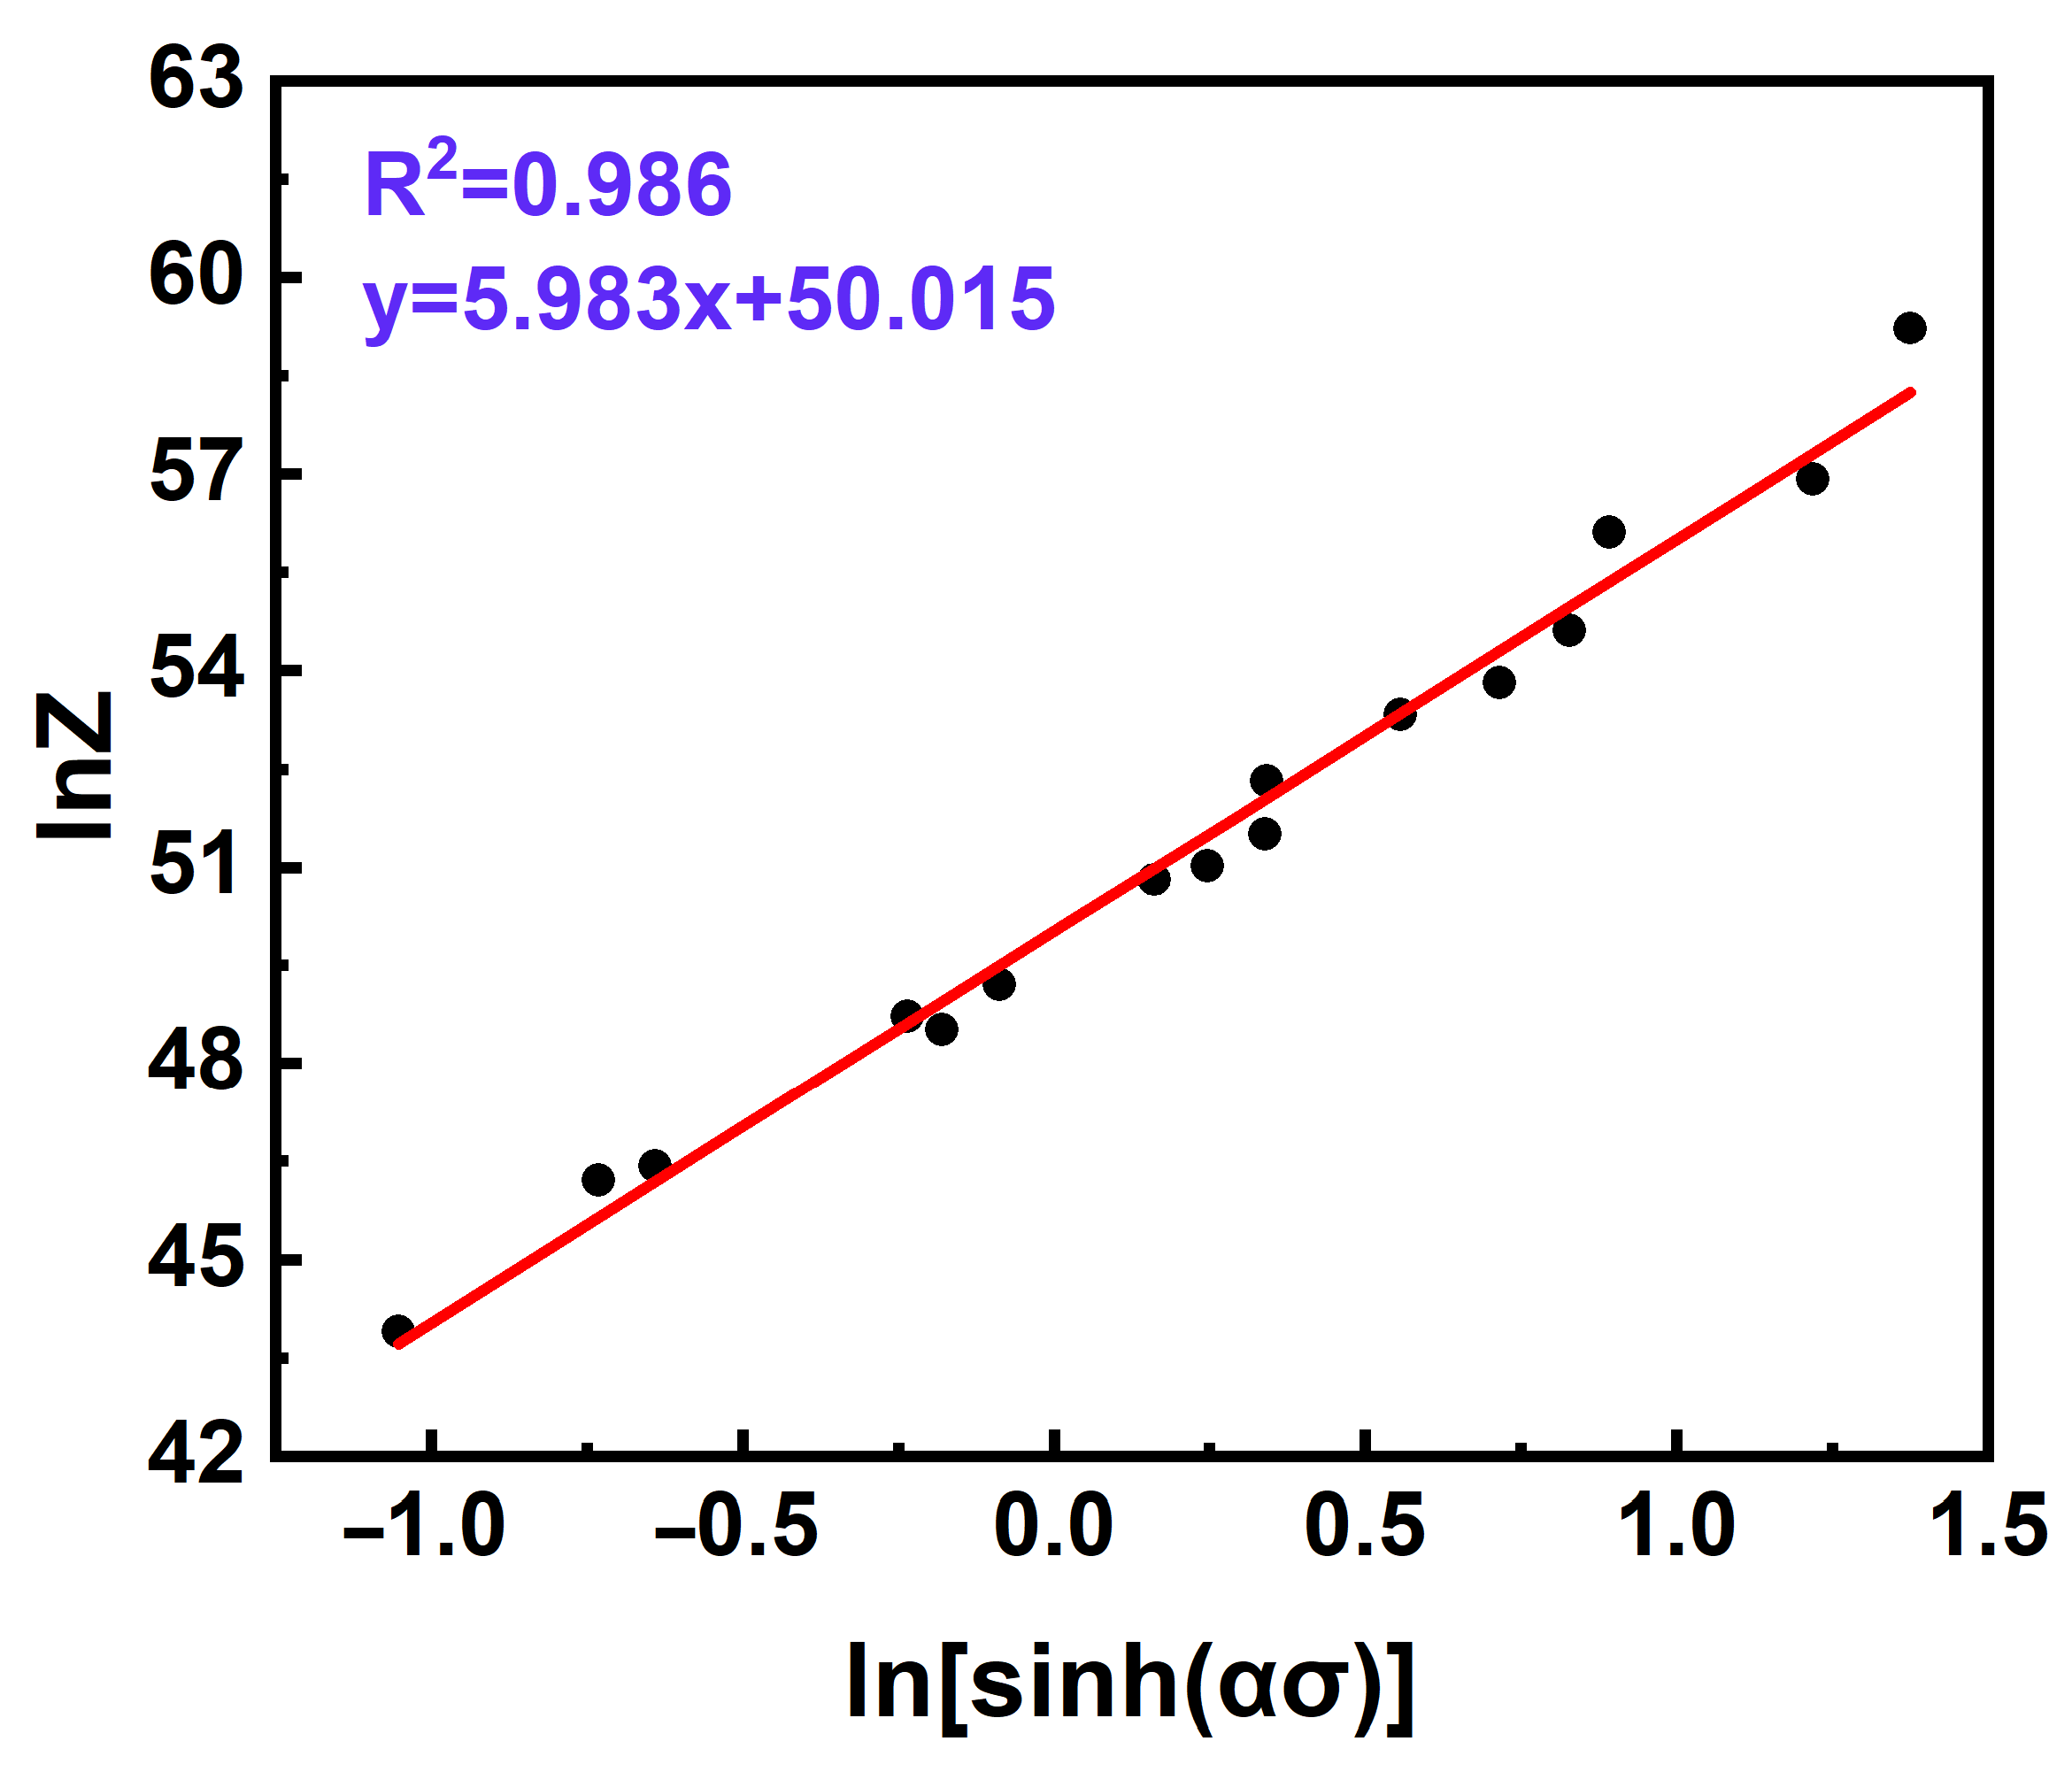
3.3. Establishment of Constitutive Model

The microstructure change and the micro-scale deformation mechanism govern the hot deformation behavior of metallic materials, which is essentially a thermal activation process [20]. The temperature (T), rate of deformation ( ε ˙ ) and amount of compression (ε) are the key factors that affect the hot deformation of XM-19 (SASS), among which temperature and rate of deformation are very significant. The variation of deformation parameters and rheological stresses during the hot deformation of metals is described by the Arrhenius constitutive model, which is a hyperbolic sine-type function that was proposed by Sellars and Tegart. Under a variety of stressful situations, the equations generally present three different expressions [21]:
ε ˙ = A 1 σ n 1 e x p Q R T         α σ < 0.8
ε ˙ = A 2 e x p β σ e x p Q R T         α σ > 1.2
ε ˙ = A [ s i n h α σ ] n e x p Q R T     f o r   a l l   α σ
In Equations (1)–(3), the material constants A1, A2, A, n, n1, β, α = β/n1 are independent of the deformation temperature. Q is the thermal activation energy, kJ mol−1; ε ˙ is compression speed, s−1; σ is the flow stress at different strains, MPa. T represents the test temperature, K. R represents the universal gas constant, which has a value of 8.314 J mol−1 K−1.
Equations (4)–(6) can be obtained by simultaneous natural logarithmic transformation on both sides of Equations (1)–(3).
l n ε ˙ = l n A 1 Q R T + n 1 l n σ
ln ε ˙ = l n A 2 Q R T + β σ
l n ε ˙ = l n A Q R T + n l n [ s i n h ( α σ ) ]
The expressions for n1, β, and n are as follows:
n 1 = l n ε ˙ l n σ T β = l n ε ˙ σ T n = l n ε ˙ l n s i n h α σ T
The flow stress values of XM-19 SASS under the true strain of 0.7 (Table 2) were used to ascertain the parameters of the constitutive equation in this investigation. According to Equation (7), in the case of a constant deformation temperature, the values of n1 and β are determined by the linear relationships between l n σ l n ε ˙ and σ l n ε ˙ , respectively. The slopes of the four lines in Figure 4a,b correspond to n1 and β, yielding values of n1 = 8.32645 and β = 0.057963, with α = 0.006962 obtained.
At all stress levels, with a constant strain rate, the partial derivative of 1/T is calculated according to Equation (3), leading to the following expression for the thermal activation energy Q:
Q = R n S = l n [ s i n h α σ ] 1 / T ε ˙
Figure 4c,d show the scatter plots and linear regression fitting curves of l n ε ˙ l n s i n   h α σ and l n s i n   h α σ 1000 / T of XM-19 SASS. The slope values derived from these relationships are averaged to obtain the values of n and S, which are 6.02447 and 12.265, respectively. As a result, the thermal activation energy of heat distortion of XM-19 SASS at 0.7 strain is 614.3 kJ/mol, which is considerably more than the 350–500 kJ/mol range of thermal activation energy of austenitic stainless steels suggested by HJ Mcqueen et al. [22]. The statistical data from Table 3 also shows that the thermal activation energy of XM-19 SASS is significantly higher than that of other super austenitic stainless steels. This difference is due to the high proportion of alloying elements, such as Cr, Ni, Mo, and N, in the XM-19 super austenitic stainless steel. The addition of these elements increases the material’s complexity and raises the activation energy for dislocation motion and grain boundary migration [23,24].
The Zener–Holloman parameter (Z) of the temperature compensation strain rate factor can be used to indicate how the deformation temperature (T) and compression speed (s−1) affect the hot deformation behavior of XM-19 SASS during hot deformation [30]:
Z = ε ˙ e x p Q R T = A [ s i n h ( α σ ) n 2 ]
By calculating natural logarithms of both sides of Equation (10), the following formula can be obtained:
l n Z = l n A + n 2 l n s i n h α σ
The calculated Q value of thermal activation energy is substituted into Equation (10) to obtain the corresponding Z value. The scatter plots are drawn according to Equation (11), and its linear relationship is shown in Figure 5. The slope of the linear regression fitting line is the value of n2, and the calculated result is 5.9829, which is close to the above-mentioned value of n. Furthermore, the A value can be obtained by the intercept of the fitting straight line, and the calculation result is 5.456 × 10²¹. The calculated n2 value in this study is greater than 5, and combined with the thermal deformation activation energy, it indicates that the main deformation mechanism is screw dislocation cross-slip driven by local stress and assisted by thermal activation [31,32,33].
Based on the preceding analysis, the Arrhenius constitutive equation of hyperbolic sine function can be obtained of XM-19 SASS under the condition of 0.7 true strain by substituting all the calculated material parameters into Equation (3).
ε ˙ = 5.456 × 10 21 s i n h 0.00696 σ 5.9829 e x p 613323 R T

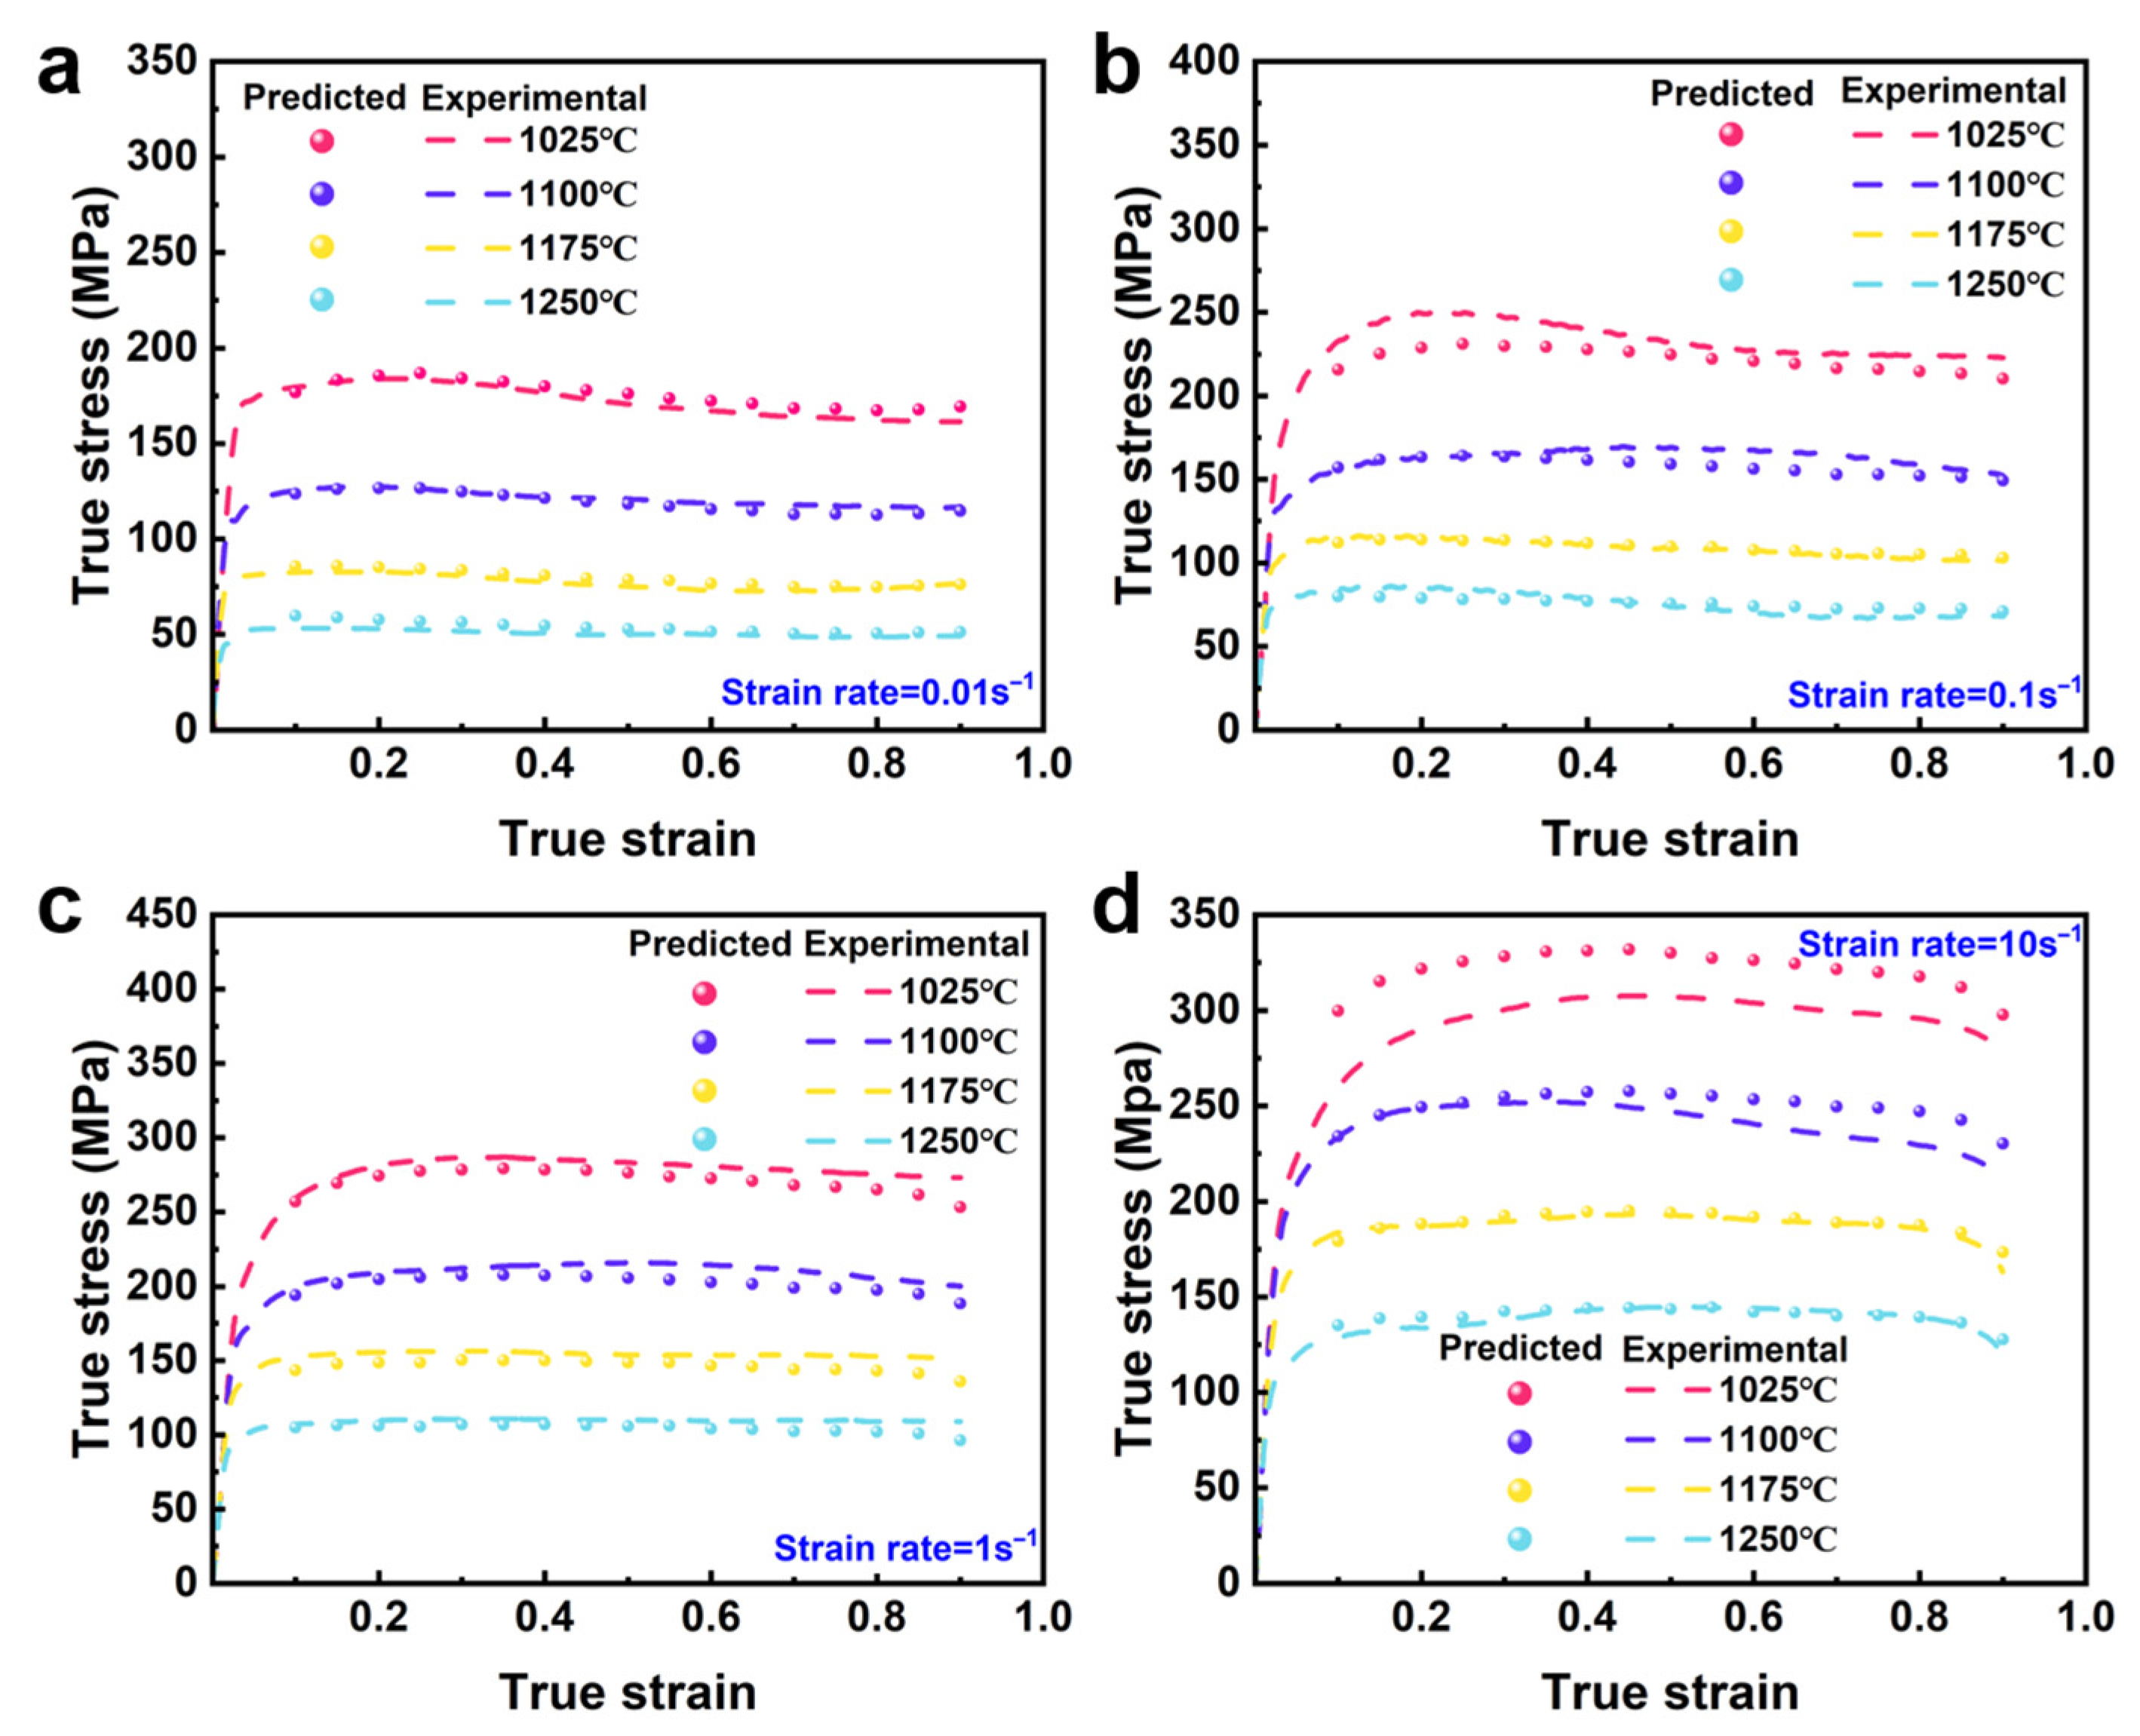
3.4. Strain Compensation

Equation (11) is an Arrhenius constitutive equation based on flow stress, strain rate and deformation temperature under the condition of 0.7 true strain. Nevertheless, this equation fails to illustrate the influence of strain on the flow stress of the alloy [34]. Through the study of XM-19 SASS, it is found that material constants α, Q, n and lnA all decrease at first and then increase with the increase in strain, as shown in Figure 6. Therefore, the influences of strain, compression speed, and deformation temperature are crucial considerations in creating an accurate constitutive model in order to more precisely forecast the alloy’s flow stress. The material constant value in the true strain range of 0.1–0.9 is found in this study by repeating the same calculation steps with 0.05 as the strain increment. The eight-quintic polynomial function is used to fit the material parameters. The coefficients of the polynomial function of the fitting results are shown in Table 4. The fitted polynomial equations are as follows:
α = A 0 + A 1 ε + A 2 ε 2 + A 3 ε 3 + A 4 ε 4 + A 5 ε 5 + A 6 ε 6 + A 7 ε 7 + A 8 ε 8 Q = B 0 + B 1 ε + B 2 ε 2 + B 3 ε 3 + B 4 ε 4 + B 5 ε 5 + B ε 6 + B 7 ε 7 + B 8 ε 8 n = C 0 + C 1 ε + C 2 ε 2 + C 3 ε 3 + C 4 ε 4 + C 5 ε 5 + C 6 ε 6 + C 7 ε 7 + C 8 ε 8 l n A = D 0 + D 1 ε + D 2 ε 2 + D 3 ε 3 + D 4 ε 4 + D 5 ε 5 + D 6 ε 6 + D 7 ε 7 + D 8 ε 8
Combining the polynomial Equation (12) with Equations (6) and (9), the following expression of flow stress under various thermal deformation circumstances is obtained in order to confirm the precision and dependability of the established constitutive equation:
σ = 1 α l n Z A 1 n + Z A 2 n + 1 1 2
Figure 7 illustrates a comparison between the measured flow stress and the flow stress predicted by the constitutive model, demonstrating a high consistency between the predicted and experimental values, particularly at high temperatures. The accuracy of the constitutive equation was comprehensively evaluated by comprehensive correlation coefficient R, root mean square error (RMSE) and average relative error (AARE) [35]:
R = i = 1 N σ e i σ ¯ e i × σ p i σ ¯ p i i = 1 N σ e i σ ¯ e i 2 × i = 1 N σ p i σ ¯ p i 2
A A R E % = 1 N i = 1 N σ e i σ p i σ e i × 100 %
R M S E = 1 N i = 1 N σ e i σ p i 2
In the above Equations (14)–(16), σ e i , σ e i ¯ , σ p i and σ p i ¯ represent the experimental and average experimental flow stress values, and the predicted and average predicted flow stress values, respectively, as N represents the number of data points. As shown in Figure 8, the predicted value of the constitutive model has a good positive correlation with the experimental data, as seen by the fitted straight line’s slope of 0.984, near to 1. The calculated R, AARE and RMSE are 98.51%, 3.92% and 4.84%, respectively, indicating that the actual data and the predicted outcomes of the constructed constitutive model are extremely consistent, and can effectively reflect the flow stress change of XM-19 SASS under thermal deformation conditions.

3.5. Hot Processing Map of XM-19 SASS

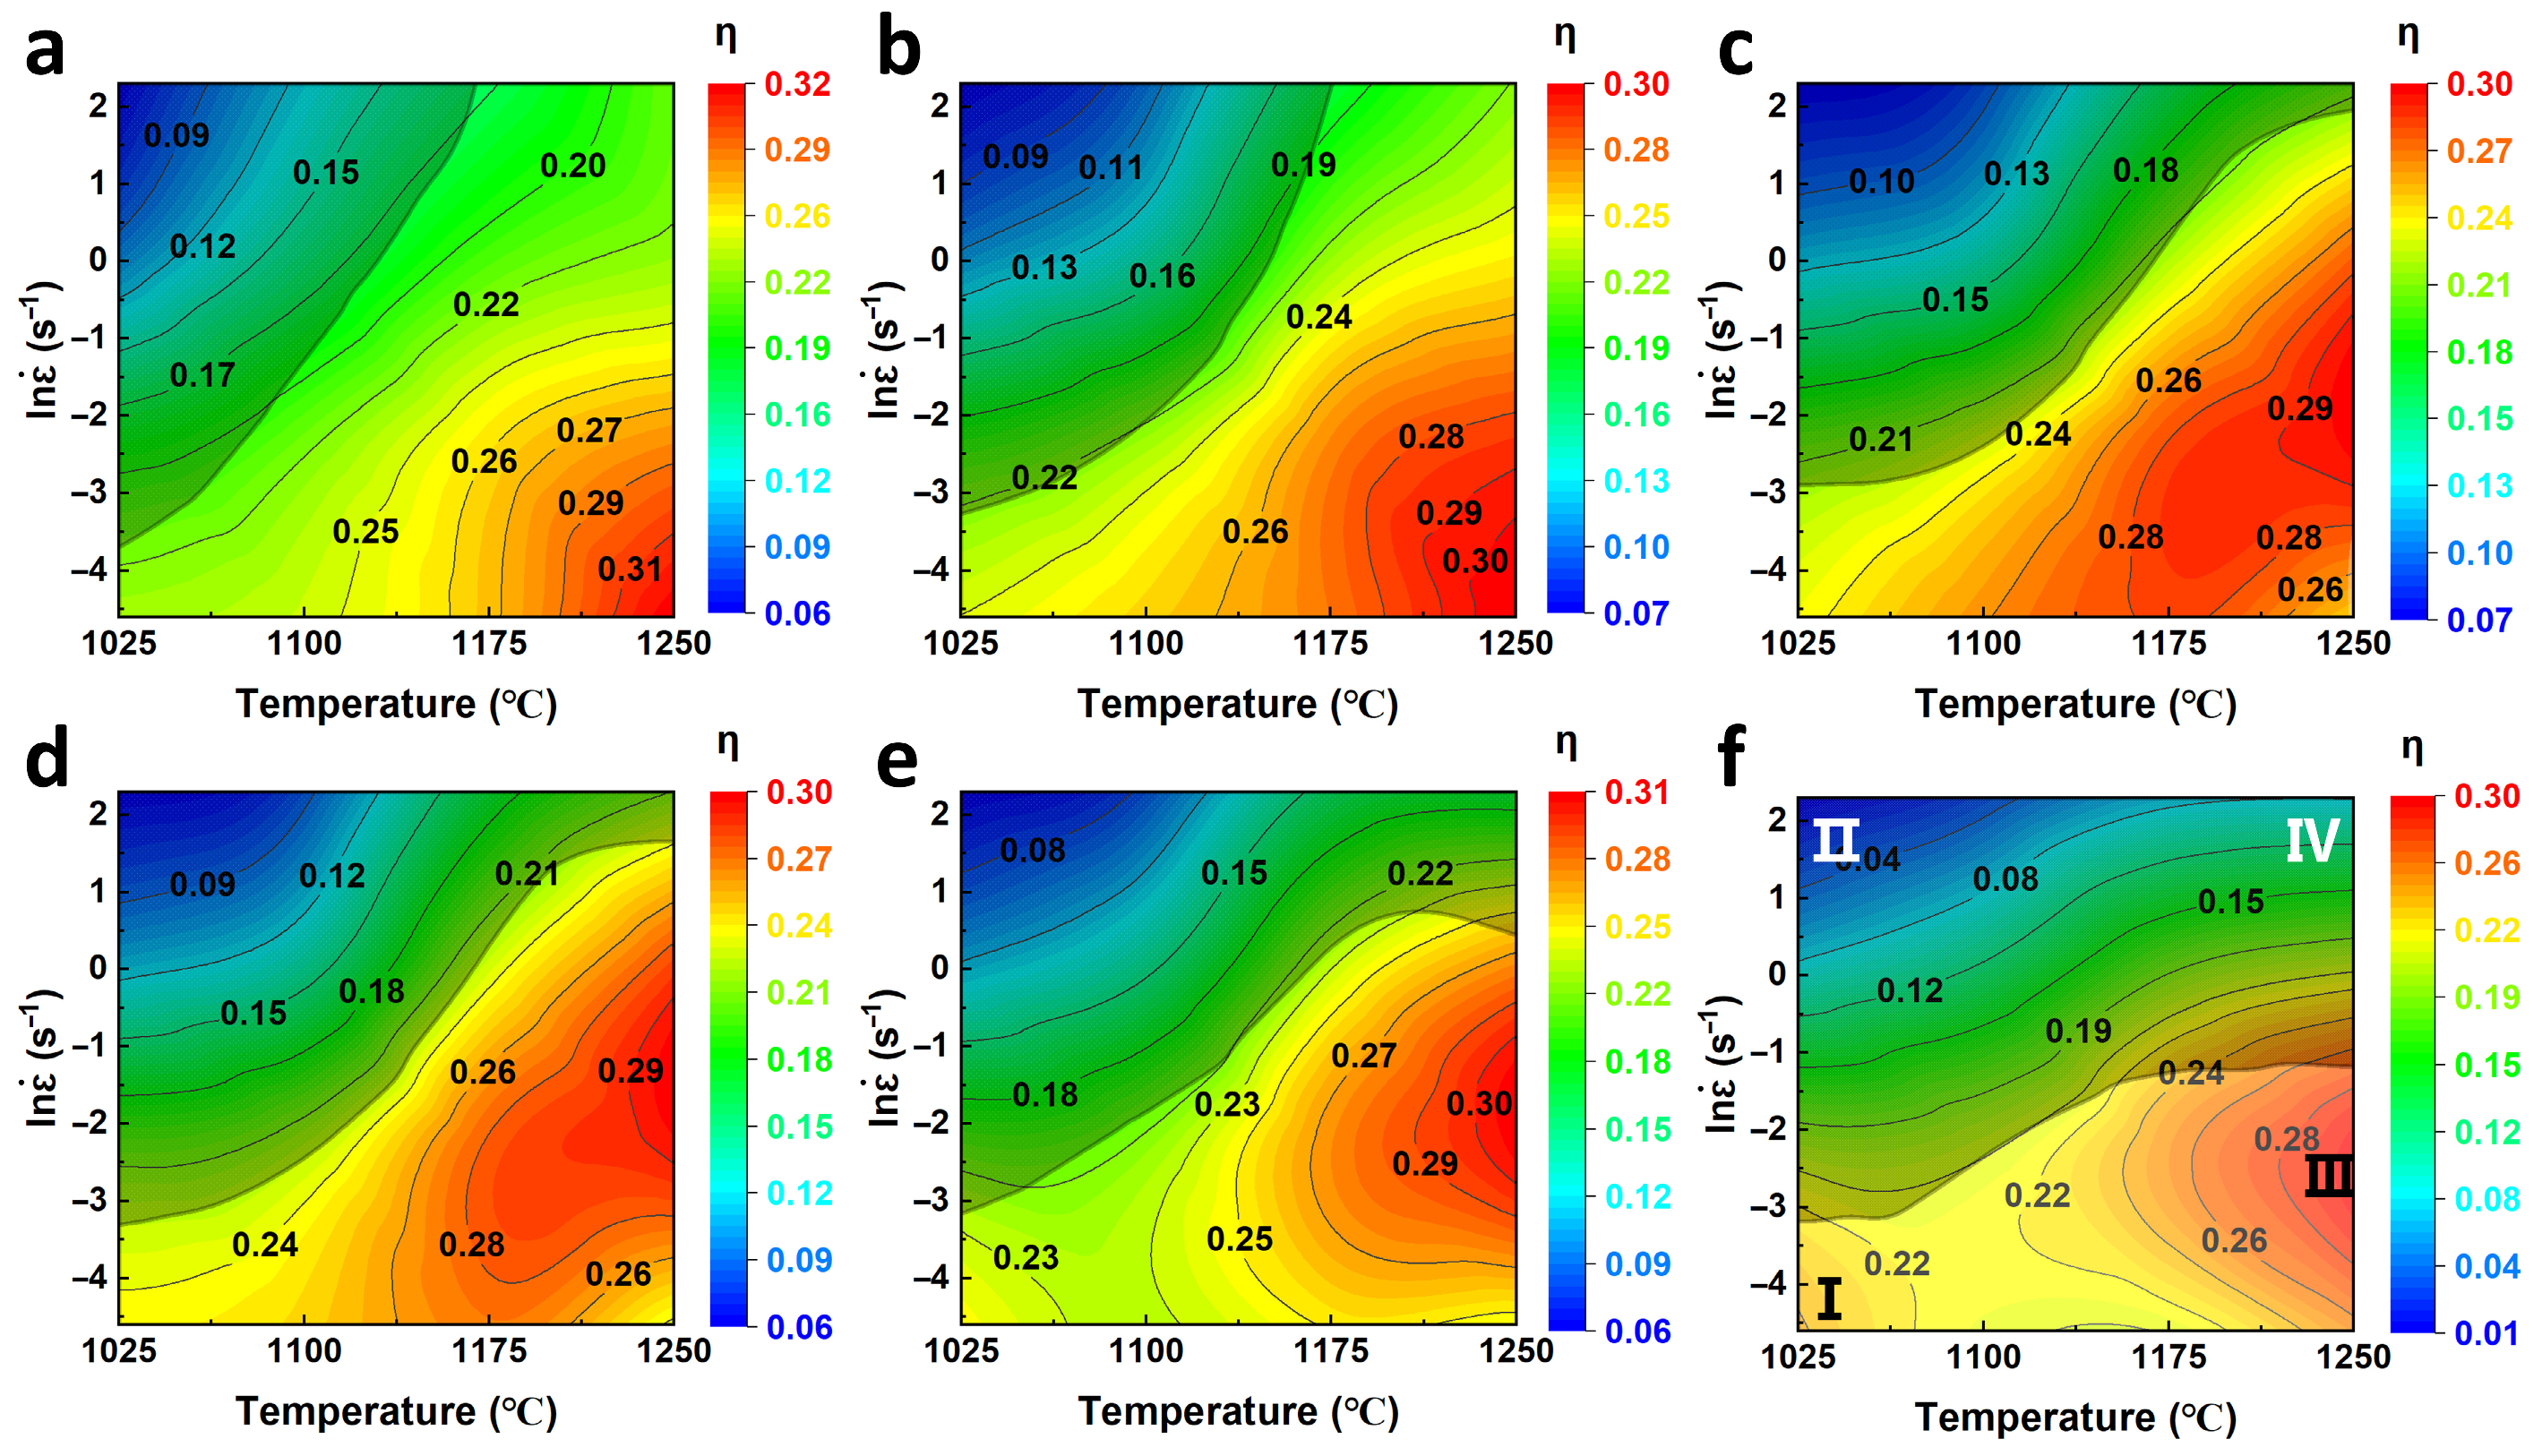
3.5.1. Construction of Hot Processing Map

According to hot processing map theory base on the Dynamic material model (DMM), the power dissipation (G) from the plastic deformation process and the power dissipation covariate (J) from the evolution among the microstructure (such as DRV, DRX, and phase transformation) are included in the total energy (P) absorbed by the material during the hot processing of the alloy [25,36]. Equation (17) can be used to express the relationship:
P = σ ε ˙ = G + J = 0 ε ˙ σ d ε ˙ + 0 σ ε ˙ d σ
When the deformation temperature and strain remain unchanged, the relationship between true stress and strain rate is as follows:
σ = K ε ˙ m
where K is the material constant. In which m is the strain rate sensitivity index, reflecting the sensitivity of the alloy to the change in strain rate, which is expressed by Equation (19):
m = J G ε , T = l n σ l n ε ˙ ε , T
The alloy is in its optimal linear dissipation condition when m = 1, and where Jmax = P/2. The power dissipation factor η is included in the non-ideal state to indicate the ratio of the energy dissipated in the ideal state to the energy consumed by the microstructure evolution.
In the state of non-ideal dissipation, the dimensionless power dissipation factor η is introduced to represent the ratio of the energy consumed by the microstructure evolution to the ideal linear dissipation energy. By combining Equations (18) and (19), the expression of η can be obtained:
η = J J m a x = 2 m m + 1
To avoid the instability caused by defects involved in local deformation, internal cracks and adiabatic shear bands in the microstructure evolution, Prasad et al. proposed a dimensionless parameter (ξ), as a rheological instability criterion upon the principle of irreversible mechanical extremum [37]. The mathematical expression of ξ is as follows:
ξ ε ˙ = l n m m + 1 l n ε ˙ + m
When the instability criterion ξ < 0, the alloy is in a state of thermal deformation instability. The hot processing map of XM-19 SASS can be obtained by drawing the three-dimensional instability map of the change in ξ with deformation temperature and strain rate and combining with the power dissipation map. The three-dimensional power dissipation diagram and the flow instability diagram may be created by drawing the changes in ξ and η under various deformation conditions, respectively. The hot processing map of XM-19 can then be created by combining the two.

3.5.2. Analysis of Hot Processing Map

The hot processing maps of the test steel in the range of 0.4–0.9 true strain were established respectively, as shown in Figure 9. The dark shadow in figure area represents the instability zone (ξ < 0), and the contour line does the η value. The performance in hot processing is enhanced with an elevated η value. In the high-temperature and low-velocity regions, the value of η is relatively high, fluctuating between 0.28 and 0.31, as demonstrated in Figure 9a–f. As the true strain increases, the instability region undergoes a gradual extension from the high-strain-rate zone at low temperatures to the high-strain-rate zone across all temperatures. This may be because DRX is more obvious with the increase in strain, which can effectively reduce the flow stress and encourage the plastic flow of XM-19 SASS. But it also leads to uneven local strain, resulting in rheological instability and local instability. The optimal hot deformation parameters of XM-19 SASS are 1200−1250 °C and 0.03–0.2 s−1, and the high η value is not in the unstable region when the true strain is 0.9.
The microstructure of several regions in the XM-19 SASS hot processing map at a real strain of 0.9 is displayed in Figure 10. As observed in Figure 10a, the hot deformation of XM-19 SASS in Zone II shows flow instability (red arrows). Under this deformation condition, the grains are elongated to form a necklace structure, with a small amount of discontinuous dynamic recrystallization appearing at the grain boundary. Combined with Figure 9f, it becomes evident that the power dissipation factor in Zone II is the lowest, in the dangerous area of hot working. In this zone, hot working is likely to cause unstable flow, leading to affecting material forming stability. Although the low temperature and low-rate zone (Zone I) is located in the safe processing area, similar to Zone II, there is still unstable flow. This may be because DRX is not enough to reduce stress concentration, resulting in unstable local flow. Zone III facilitates the growth of recrystallized grains and is advantageous for the occurrence of DRX, as shown in Figure 10c. Following growth, the original austenite grains are entirely taken over by the recrystallized grains. The power dissipation factor of material reaches its maximum value at this point. Figure 10d shows the dangerous processing area (Zone IV) at high temperatures and high strain rates. Within the context of this particular scenario, although the recrystallization rate is the highest, due to the formation of a mixed structure of substantial deformation grains along with DRX grains, hot working may lead to an uneven microstructure in the material, which is not conducive to subsequent processing.

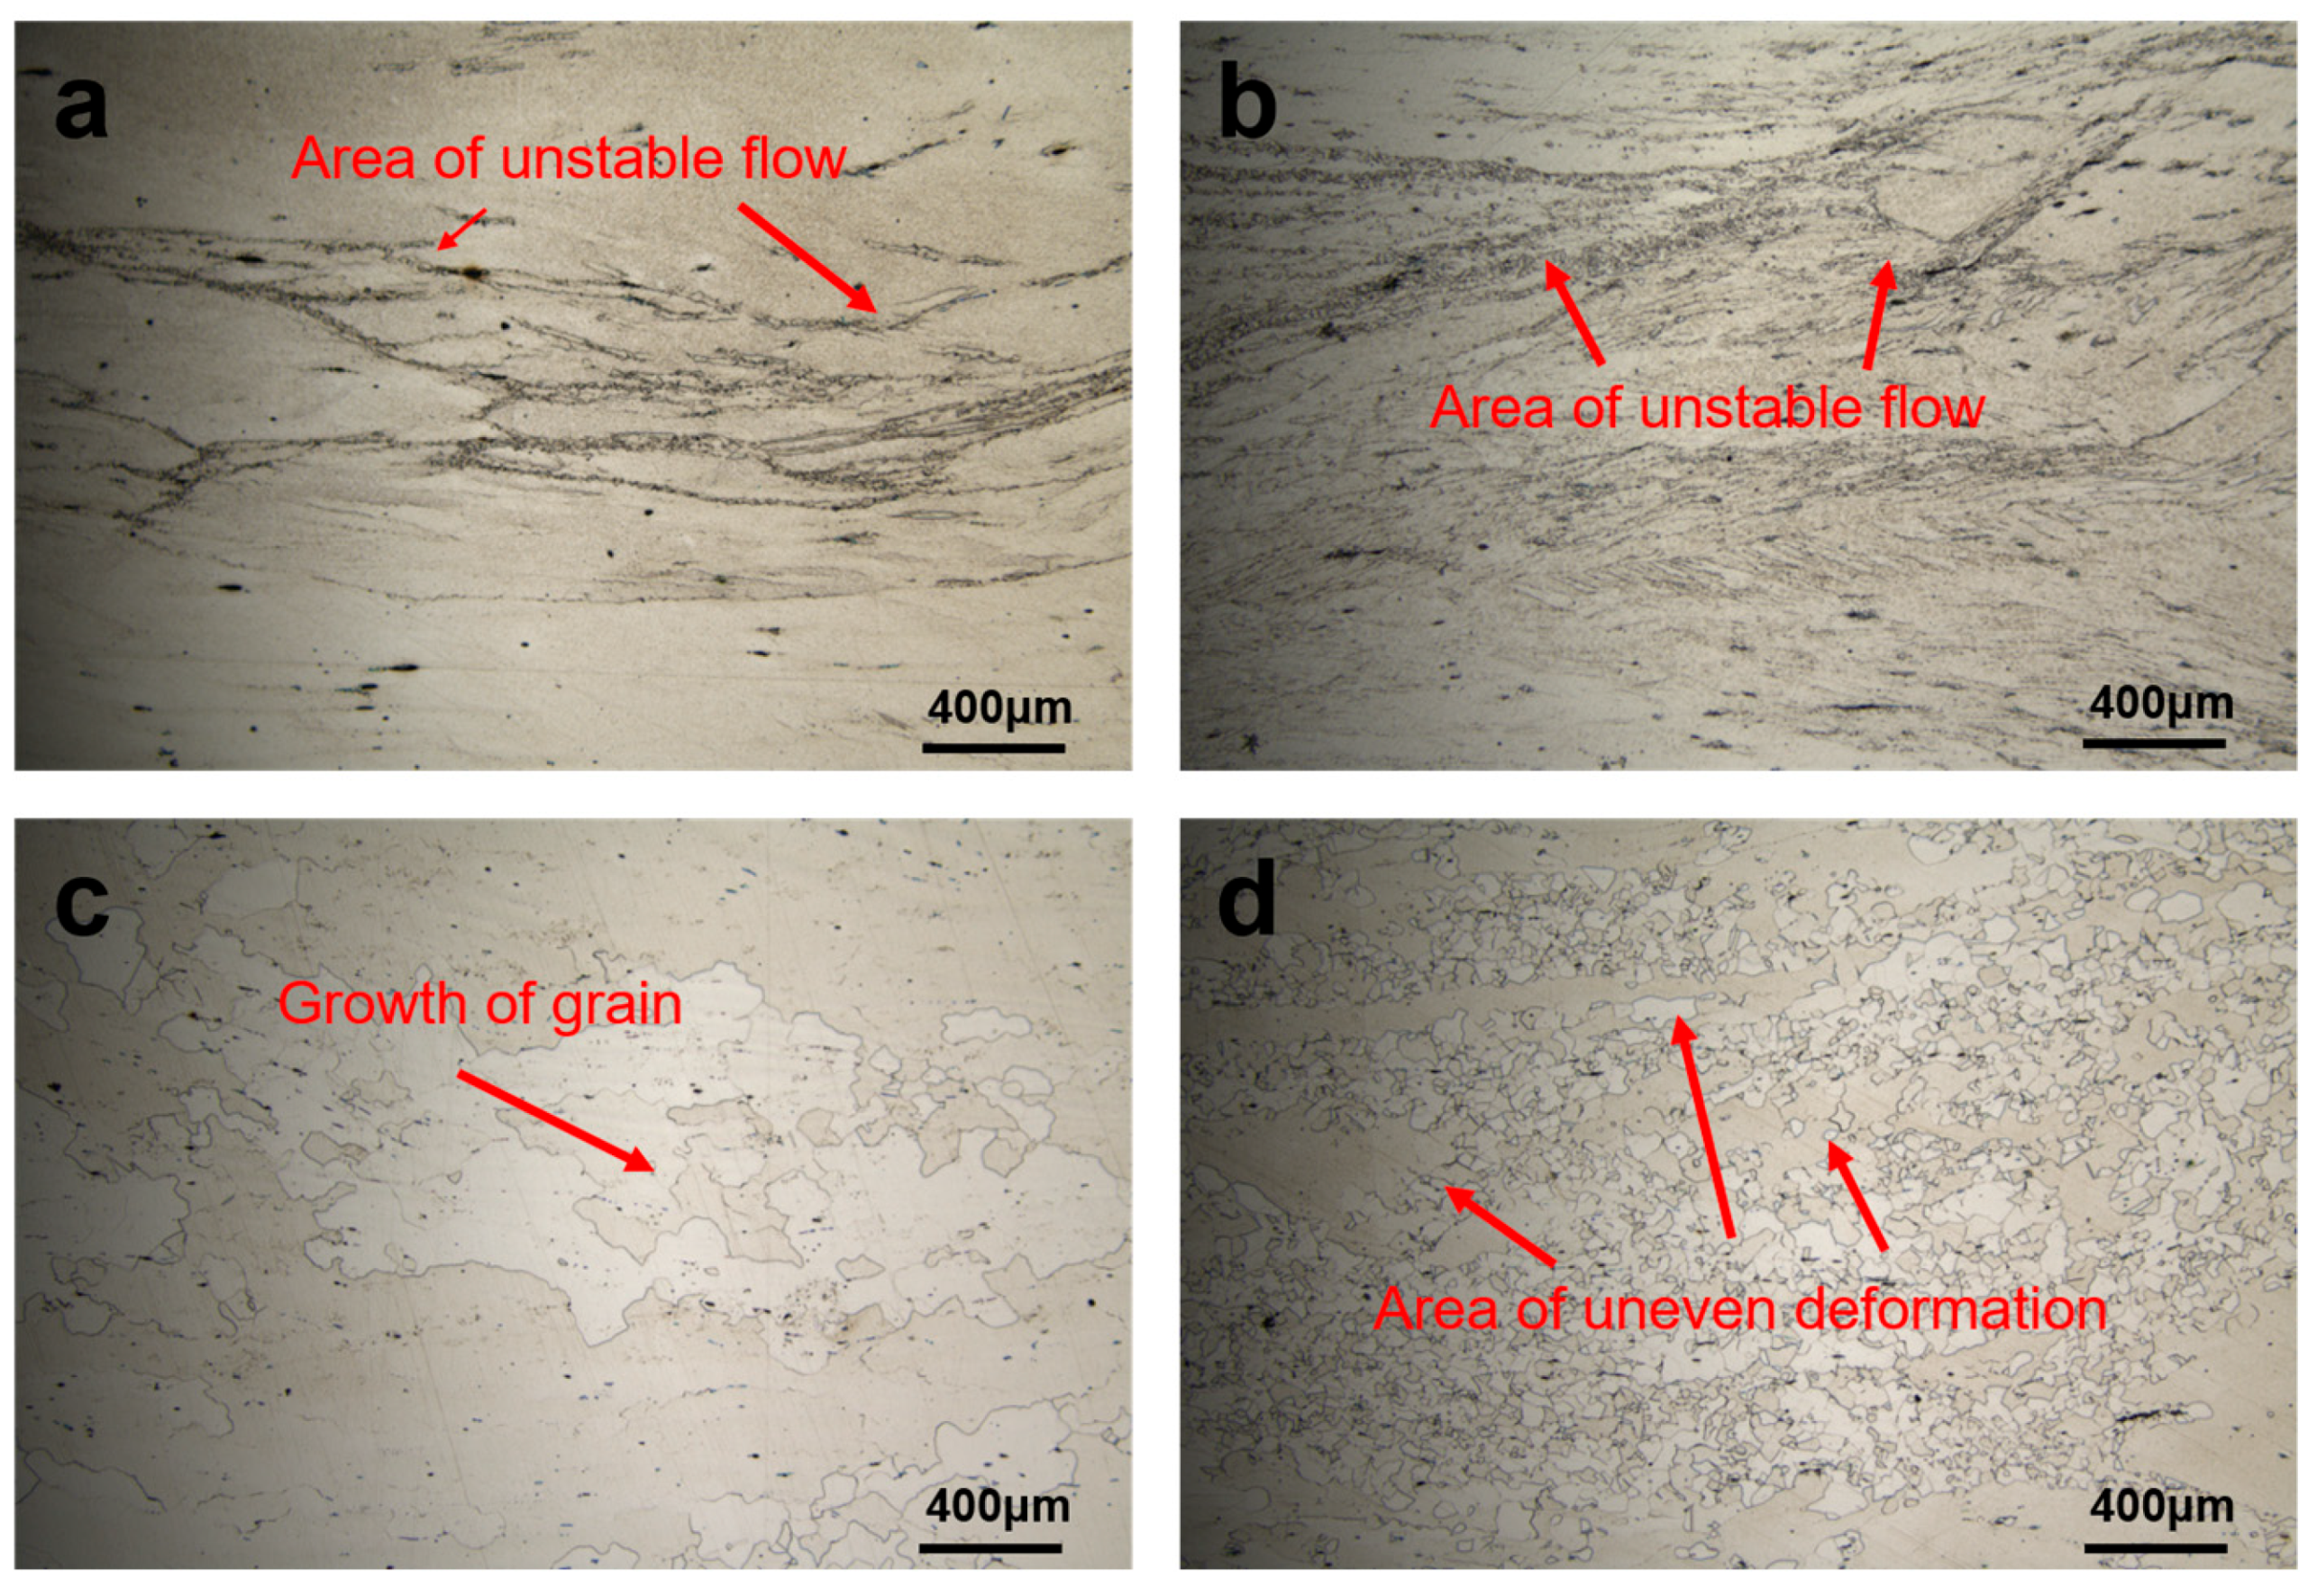
3.6. Microstructural Evolution

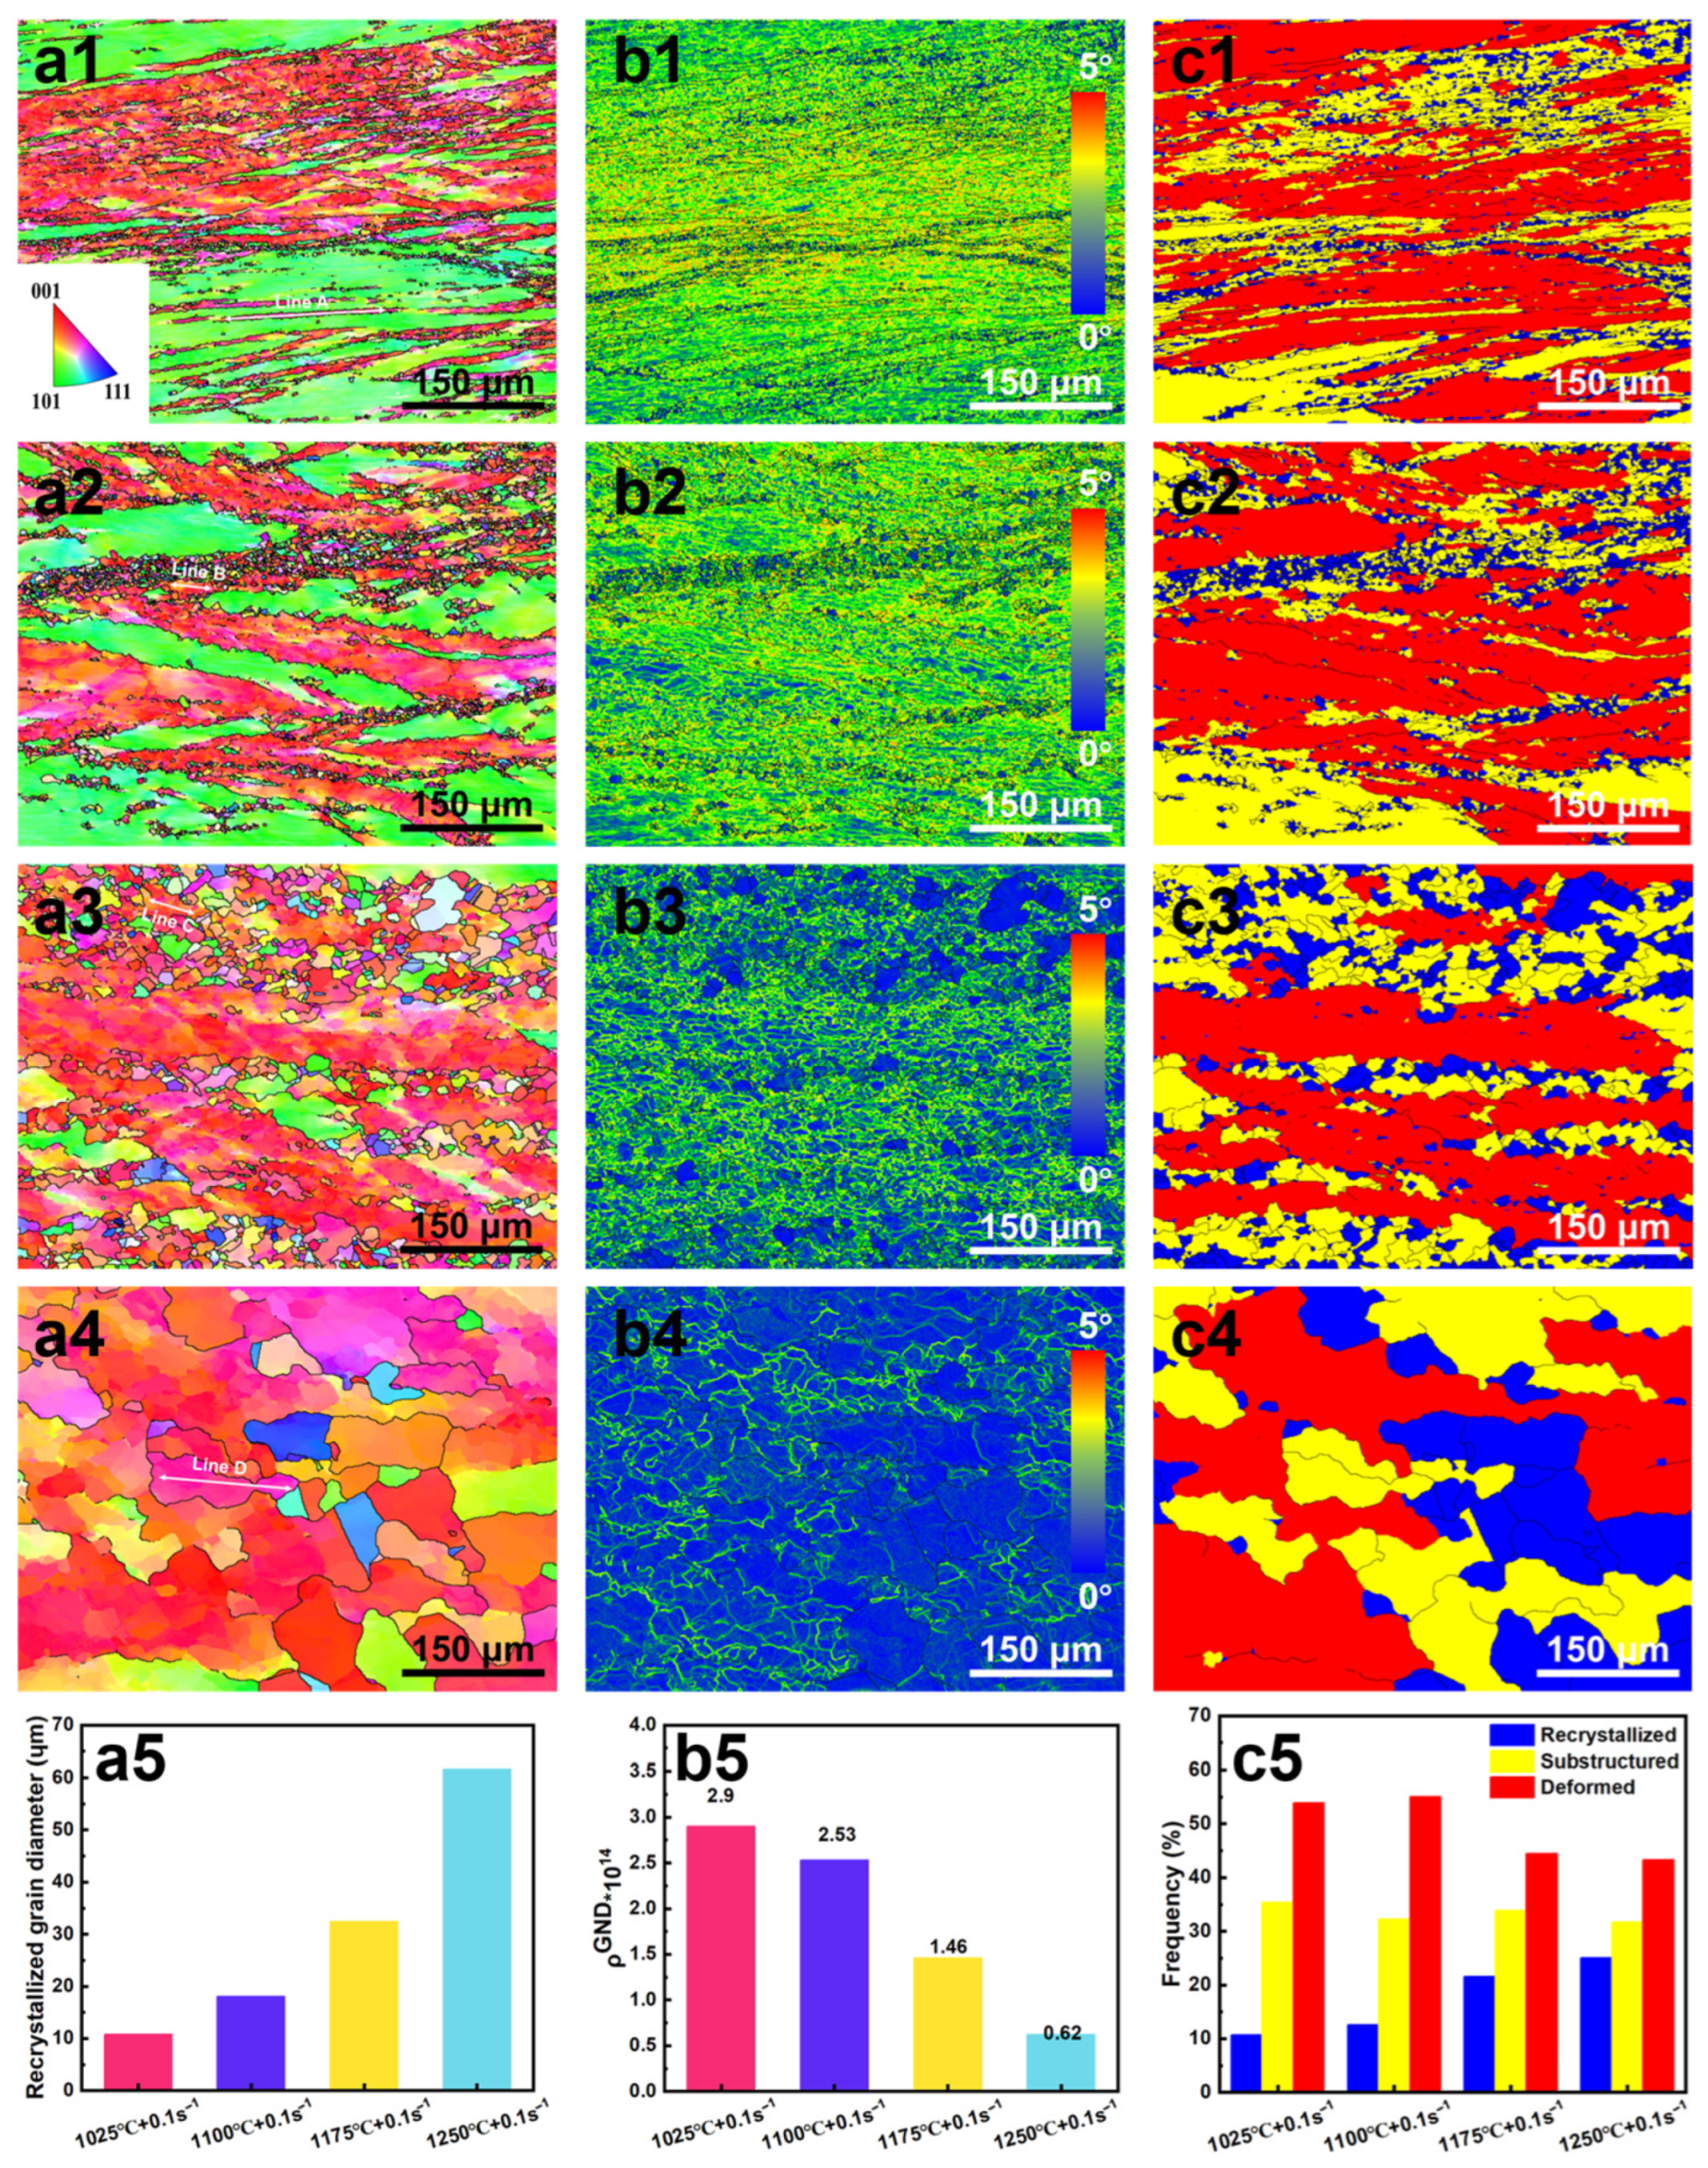
3.6.1. Effect of Deformation Temperature on Microstructure Evolution

The deformation temperature is a critical factor in the thermal deformation of XM-19 SASS at the same strain rate, as demonstrated by the true stress–strain curve in Figure 3. As shown in Figure 11a1–a4 the microstructure of the sample shows significant differences at various temperatures when the strain rate is 0.1 s−1. The typical necklace structure is visible at temperatures from 1025 to 1100 °C, and there are a few DRX grains at the grain boundaries that are tiny and unevenly distributed. As the temperature increases, the grains progressively transform into equiaxed crystals, while the necklace structure eventually vanishes. Figure 11a5 demonstrates that the DRX grain size increases significantly with the temperature rise. This is attributed to the fact that high temperature can provide more thermal activation energy, which is conducive to enhancing the driving force of DRX, promoting grain boundary migration and the occurrence of DRX [34]. Figure 11b1–b5 shows the distribution of kernel average misorientation (KAM) and the change in the density of geometrically necessary dislocations (GND) at different deformation temperatures at a strain rate of 0.1 s−1. The transition from red to yellow and then to green indicates that the local orientation difference decreases gradually, reflecting the changing trend in dislocation density. The values of KAM and GND decrease gradually with the increase in temperature. When the deformation temperature rises from 1025 to 1250 °C, the GND value drop from 2.9 × 10¹⁴/m2 to 0.62 × 10¹⁴/m2. High temperature has contributed to the emergence of DRV and DRX. Dislocations are consumed in the process of dynamic recovery and rearrangement by slip, climb and cross-slip, which promotes grain boundary migration and the formation of new grains. It shows that the DRX in the process of thermal deformation is softened through dislocation consumption [38].
Figure 11c1–c5 shows the grain orientation extension (GOS) distribution at different temperatures and the ratio of recrystallized grains, sub-grains and deformed grains. Studies have shown that recrystallized grains typically exhibit low dislocation density and lattice distortion energy, with a GOS ≤ 2°. Conversely, the GOS values of the sub-grains typically range from 2° to 7°, while those of the deformed grains are >7°. Therefore, the microstructure after hot deformation can be divided into three regions: the blue region represents recrystallized grains, the yellow region represents sub-grains, and the grains in the red region are deformed grains. As shown in Figure 11c5, the recrystallization rate increases gradually with the increase in temperature. When the deformation temperature is 1025 °C, the recrystallization rate is only 11%. Nevertheless, the rate of recrystallization significantly increases to 25% when the temperature is raised to 1250 °C. This phenomenon can be attributed to the promotion of atomic diffusion at elevated temperatures, the acceleration of dislocation movement, and the activation of additional atoms in the non-equilibrium state. These atoms are easy to migrate to lower energy levels, which promotes the formation of DRX grains [39]. Combined with Figure 11b1–b4, it can be seen that the high dislocation density inside the sub-grains and at the grain boundary provides the nucleation site of recrystallization. At the same time, the high-energy state of the sub-grains drives the transformation to recrystallized grains with less deformation, which helps reduce the overall system energy of the material and optimize the microstructure of the material.

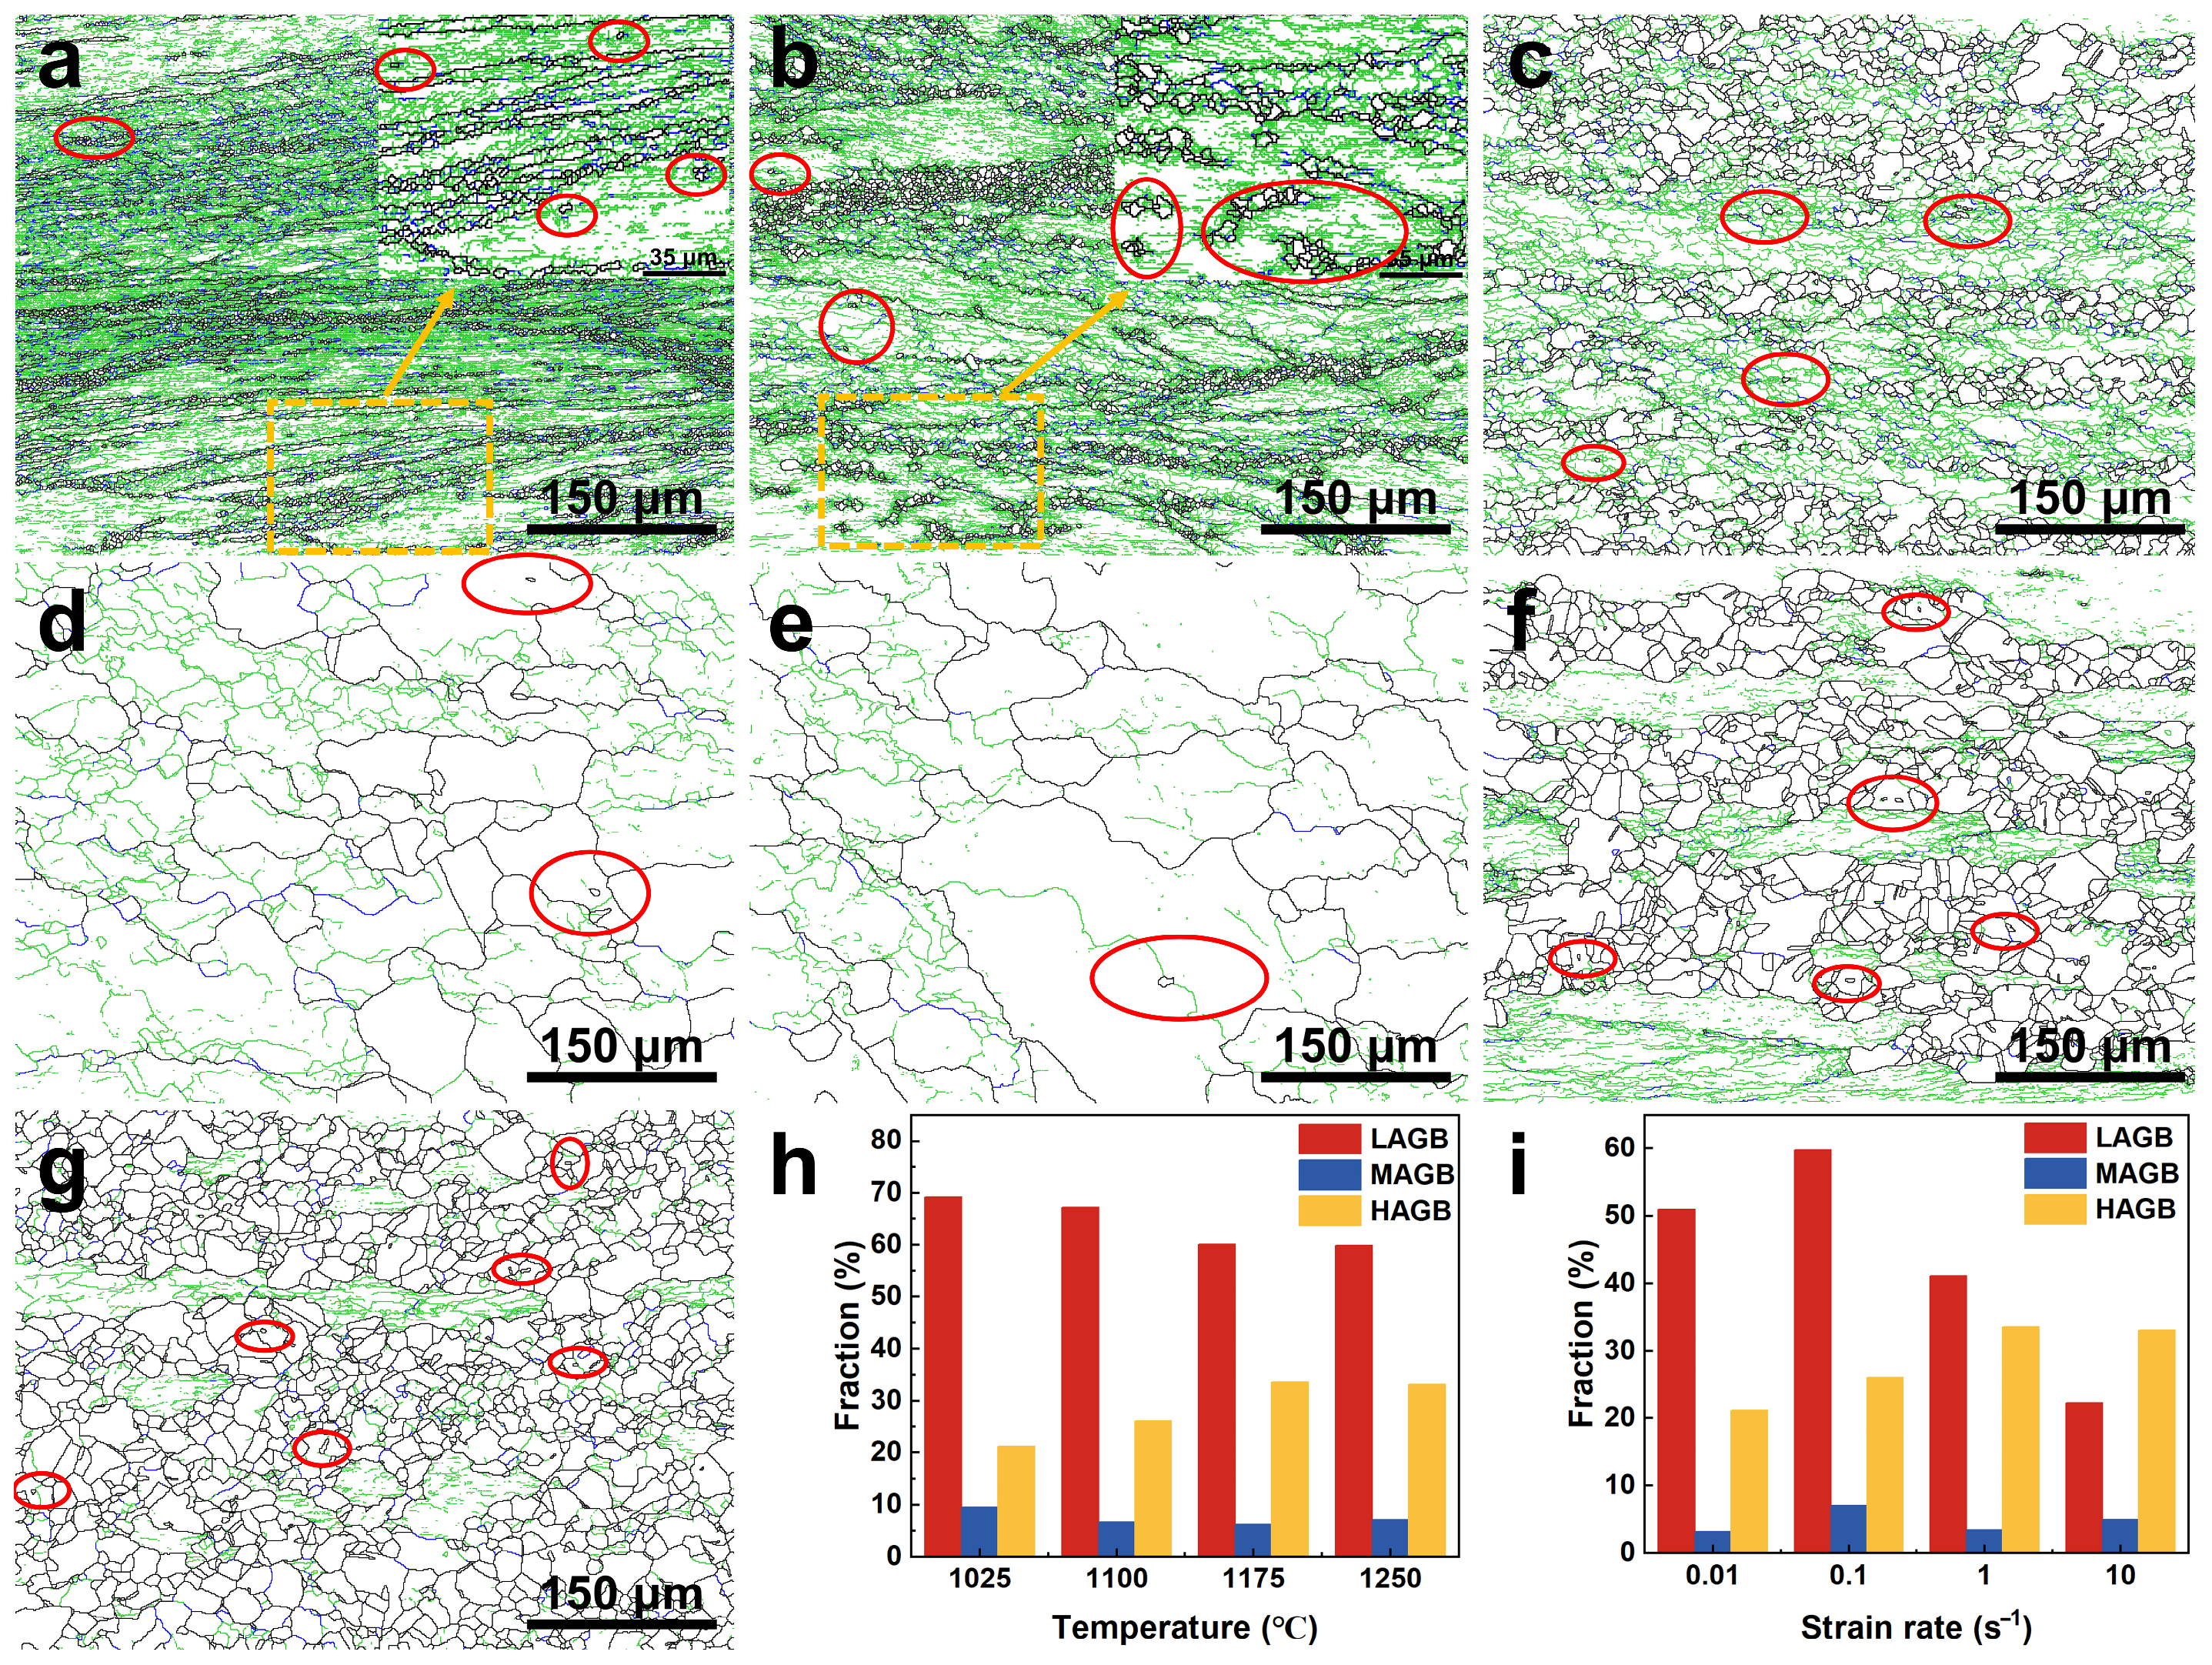
3.6.2. Effect of Strain Rate on Microstructure Evolution

Figure 12 shows the IPF, KAM, GOS distribution maps, grain size change map and grain proportion map of XM-19 SASS after hot deformation at 1250 °C and different strain rates. As shown in Figure 12a1–a5,b1–b5, at low strain rates (0.01–0.1 s−1), there is sufficient time for DRV to proceed fully, with dislocations rearranging to form sub-grain structures, accompanied by grain boundary migration and the coarsening of recrystallized grains, leading to an increase in grain size. As the strain rate increases (0.1–1 s−1), the driving force for DRX intensifies, but due to insufficient time, DRV cannot effectively soften the material, and dislocations rapidly accumulate and tangle, significantly increasing dislocation density. At this point, DRX nucleation accelerates, and the grains gradually refine. When the strain rate further increases to 10 s−1, the high dislocation density and high deformation stored energy promote rapid DRX nucleation, which quickly consumes dislocations, causing an abnormal decrease in dislocation density [40]. However, the very short deformation time limits the growth of recrystallized grains, ultimately resulting in further grain size reduction. As shown in Figure 12c1–c5, at low strain rates, the alloy mainly consists of sub-grains and coarsened DRX grains, whereas at high strain rates, the sub-grain proportion decreases, and the proportion of DRX grains increases from 20% to 78%. This is attributed to the high dislocation density within the sub-grains providing a nucleation driving force for DRX, and the energy accumulated from rapid deformation accelerating the absorption of sub-grains by DRX grains. Additionally, the deformation energy rapidly accumulated at high strain rates and the adiabatic heating caused by deformation further accelerate dislocation motion and grain boundary migration, promoting the dynamic recrystallization process [41,42].

3.7. Dynamic Recrystallization Mechanism

Studies have shown that there are three main forms of nucleation mechanism of DRX: DDRX of nucleation and growth by large-angle migration, CDRX with large-angle grain boundary formation caused by the continuous rotation of sub-grains, and geometric dynamic recrystallization (GDRX) caused by grain elongation, thinning and pinching off [43]. In general, CDRX mainly occurs in high-SFE alloys, and recrystallized grains nucleate and grow within the grains. DDRX usually occurs in alloys with medium and low SFE. Recrystallized grains nucleate at grain boundaries and form a special necklace structure in the microstructure. GDRX is easy to occur in high-level fault energy alloys under high-strain conditions, and no new crystal nuclei are generated [44]. One calculates the SFE of XM-19 SASS according to the following equation [7]:
S F E = 53 + 6.2 N i + 0.7 C r + 3.2 M n + 9.3 M o
Through calculation, the SFE of the steel is 74.54 J/m2, which is not a high-level fault energy alloy and hardly recrystallizes in the form of GRDX. Thus, the primary focus of this research is the nucleation mechanism of DDRX and CDRX for XM-19 SASS.
Figure 13 shows the grain boundary distribution and changing trend in XM-19 SASS under different deformation conditions. LAGBs and HAGBs are represented by black lines and green lines. The grain boundaries with an orientation difference of 10–15° are defined as medium-angle grain boundaries (MAGBs), which are indicated by blue lines. As can be seen from Figure 13a–g, a large number of DRX grains with LAGBs distributed along the deformed grains appear in the microstructure after thermal deformation, showing typical DDRX characteristics. During the process of hot deformation, dislocations slip, stagger and gather in the grain under the action of external force, resulting in a large stress gradient at the grain boundary or sub-grain boundary of the original austenite, which in turn leads to a local stress concentration and bending deformation at the grain boundary or sub-grain boundary. In these local deformation regions, dislocation accumulation drives the distortion-less recrystallized grains to “bow out” from the high-distortion region, and LAGBs gradually transform into HAGBs. Recrystallized grains grow continuously by absorbing dislocations and distorting grains, and finally replacing the original grains. The variation trend of HAGBs and LAGBs (Figure 13h,i) is consistent with the variation in recrystallization rate (Figure 11c5 and Figure 12c5): with the increase in recrystallization rate, LAGBs gradually decrease while HAGBs increase. This shows that LAGBs are gradually replaced by more stable HAGBs in the recrystallization process.
Dislocation substructures with a large number of LAGBs and a small number of HAGBs could be observed in the deformed grains, which are marked with red circles in Figure 13a–g. This indicates that the transformation from LAGBs to HAGBs occurs inside the austenite grains, indicating that the alloy undergoes CDRX during hot deformation. Studies have shown that MAGBs are closely related to the CDRX process, and their changes are important parameters affecting CDRX. The formation, evolution and final transformation of MAGBs into HAGBs are important features of structural evolution during CDRX [45]. As can be seen in Figure 13h, when the strain rate is constant, with the increase in deformation temperature, the proportion of medium-angle grain boundaries decreases. This shows that the role of CDRX weakens with the increase in deformation temperature. When the deformation temperature is constant, the proportion of MAGBs presents a sinusoidal function trend with the increase in strain rate, which proves that CDRX is a dynamic process with the change in strain rate. Under different deformation conditions, the proportion of MAGBs does not exceed 10%, indicating that CDRX plays an auxiliary nucleation role of DRX in the hot deformation process of XM-19 SASS.
Figure 14 shows the internal orientation difference of crystal grains measured along the mark lines in the IPF maps of Figure 11 and Figure 12. As can be seen in Figure 14a–g, the cumulative orientation deviation in sub-grains increases rapidly, and some of them exceeded 15°. The increase in the cumulative orientation deviation indicates that sub-grain rotation occurs inside the grains during deformation, and that LAGBs and MAGBs inside the grains will absorb dislocations and form HAGBs [46]. With the continuous formation of HAGBs in the deformed grains, fine DRX grains are formed, which further proves that CDRX exists in XM-19 SASS during thermal deformation. In addition, as shown in Figure 14h,i, it was also found that the cumulative orientation deviation between sub-grains and the adjacent recrystallization is more than 40°, while the cumulative orientation deviation between the DRX grains is very small. The above results show that during the thermal deformation of XM-19 SASS, CDRX and DDRX occur at the same time, with DDRX as the main process and CDRX as the auxiliary.

4. Conclusions

The hot deformation behavior and dynamic recrystallization mechanism of XM-19 SASS at a deformation temperature of 1025–1250 °C and strain rate of 0.01−10 s−1 were studied. The primary conclusions are summarized as follows:
  • The thermal activation energy of XM-19 SASS at a strain of 0.7 was determined to be 614.3 kJ/mol. Based on the Arrhenius equation, a strain compensation constitutive model was developed. The resulting expression is as follows:
ε ˙ = 5.456 × 10 21 s i n   h 0.00696 σ 5.9829 e x p 613323 R T
2.
Based on the DMM theory, the hot processing map for XM-19 SASS was constructed. In the strain range of 0.4–0.9, the unstable region of XM-19 SASS gradually extended from the low-temperature and high-strain-rate region to the high-strain-rate region at various temperatures. When the true strain was 0.9, the optimal thermal deformation parameters for XM-19 SASS were a deformation temperature of 1200–1250 °C and a strain rate of 0.03–0.2 s−1.
3.
Both strain rate and deformation temperature have an impact on DRX. At a strain rate of 0.1 s−1, the recrystallization fraction of XM-19 SASS increased from 11% to 25% as the deformation temperature rose from 1025 °C to 1250 °C, while at a fixed deformation temperature of 1250 °C, the recrystallization fraction surged from 20% to 78%, with the strain rate increasing from 0.01 s−1 to 10 s−1.
4.
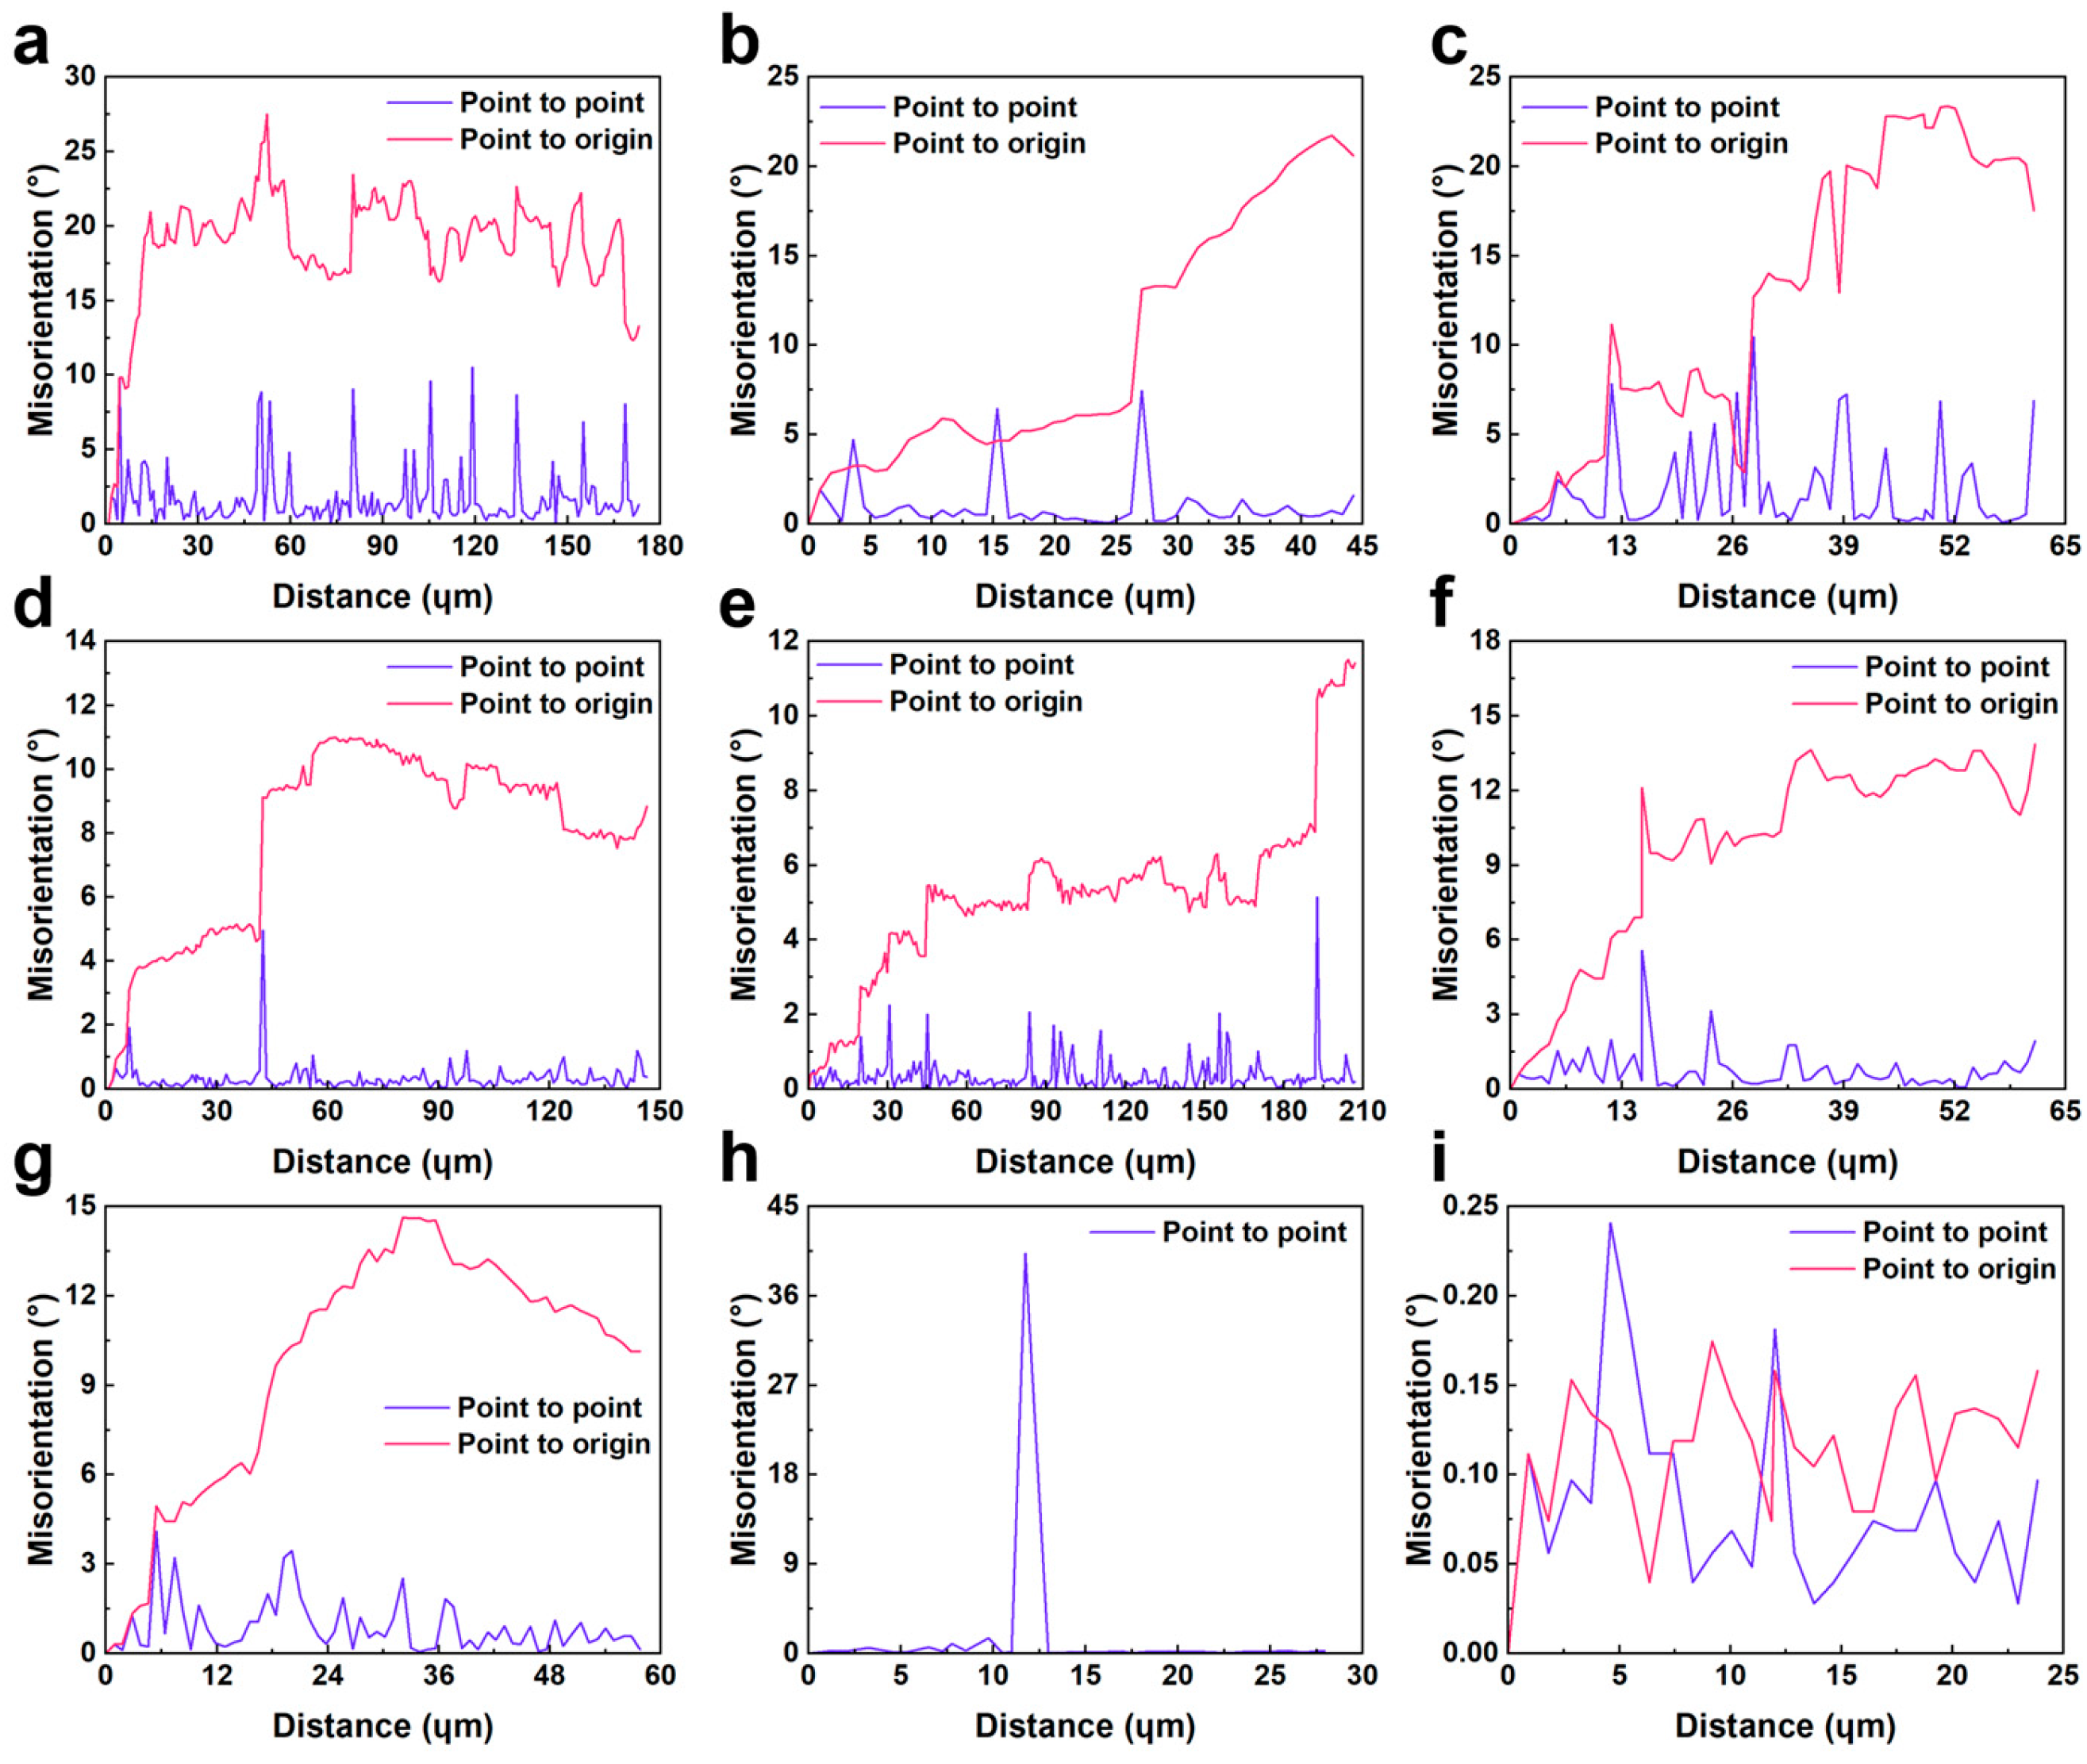
During the thermal deformation of XM-19 SASS, both DDRX and CDRX occur, with DDRX being the dominant mechanism and CDRX acting as a secondary process. The influence of CDRX decreases with increasing deformation temperature and shows dynamic variation with changes in strain rate. The cumulative misorientation within the sub-grains increases rapidly, with some grains exceeding 15°, indicating the occurrence of sub-grain rotation, which further supports the presence of CDRX.

Author Contributions

L.C., conceptualization, methodology, investigation, writing—original draft, and data curation; Y.Z., resources, validation, formal analysis, visualization, data curation, and project administration. L.X., resources, validation, supervision, and project administration. Y.S. writing—review and editing. All authors have read and agreed to the published version of the manuscript.

Funding

This work was supported by National Key Research and Development Program of China (No.2022YFB3705305) and Henan Province key research and development special project (No.231111230400).

Data Availability Statement

The original contributions presented in this study are included in the article. Further inquiries can be directed to the corresponding author.

Conflicts of Interest

The authors declare no conflicts of interest.

References

  1. Nishimura, A.; Ono, Y.; Umezawa, O.; Kumagai, S.; Kato, Y.; Kato, T.; Yuri, T.; Komatsu, M. Study on development policy for new cryogenic structural material for superconducting magnet of fusion reactor. Nucl. Mater. Energy 2022, 30, 101125. [Google Scholar] [CrossRef]
  2. Kato, T.; Kato, Y.; Umezawa, O.; Ono, Y.; Yuri, T.; Nishimura, A.; Kumagai, S. Tensile Properties of 22Cr-12Ni Austenitic Stainless Steel Thick Plates and Bars at Cryogenic Temperatures. IOP Conf. Ser. Mater. Sci. Eng. 2022, 1241, 012001. [Google Scholar] [CrossRef]
  3. Pokrovsky, A.; Fabritsiev, S. Effect of neutron irradiation on tensile properties of austenitic steel XM-19 for the ITER application. J. Nucl. Mater. 2011, 417, 874–877. [Google Scholar] [CrossRef]
  4. Liu, X.; Zhang, C.; Hu, S.; Zhang, L.; Wang, H. Research progress and prospects on the formation mechanism of macrosegregation and shrinkage porosity in large steel ingots. Prog. Nat. Sci. 2024, 34, 470–481. [Google Scholar] [CrossRef]
  5. Xu, S.; He, J.; Zhang, R.; Zhang, F.; Wang, X. Hot deformation behaviors and dynamic softening mechanisms of 7Mo super-austenitic stainless steel with high stacking fault energy. J. Mater. Res. Technol. 2023, 23, 1738–1752. [Google Scholar] [CrossRef]
  6. Lu, J.; Hultman, L.; Holmström, E.; Antonsson, K.H.; Grehk, M.; Li, W.; Vitos, L.; Golpayegani, A. Stacking fault energies in austenitic stainless steels. Acta Mater. 2016, 111, 39–46. [Google Scholar] [CrossRef]
  7. Pierce, D.; Jiménez, J.; Bentley, J.; Raabe, D.; Wittig, J. The influence of stacking fault energy on the microstructural and strain-hardening evolution of Fe–Mn–Al–Si steels during tensile deformation. Acta Mater. 2015, 100, 178–190. [Google Scholar] [CrossRef]
  8. Ghadar, S.; Momeni, A.; Tolaminejad, B.; Soltanalinezhad, M. A comparative study on the hot deformation behavior of 410 stainless and K100 tool steels. Mater. Sci. Eng. A 2019, 760, 394–406. [Google Scholar] [CrossRef]
  9. Hao, X.; Sun, X.; Zhao, T.; Shen, S.; Wang, Y.; Wang, T. Effect of N on hot deformation behavior of high-Mn austenitic steel. J. Mater. Res. Technol. 2023, 27, 4345–4355. [Google Scholar] [CrossRef]
  10. Tian, G.; Xu, L.; Fang, H.; Li, Z.; Li, X.; Zhou, Y.; Wei, S. Deformation behavior and microstructure evolution of TZM alloy with 1.0 wt%ZrO2 under high temperature compression. Int. J. Refract. Met. Hard Mater. 2023, 117, 106382. [Google Scholar] [CrossRef]
  11. Zheng, X.; Yang, L.; Wei, S. Hot compression behavior and recrystallization mechanism of 1.5 wt% Ti3AlC2 ceramic-enhanced Mo alloys with two-dimensional layers. J. Mater. Res. Technol. 2023, 26, 8485–8499. [Google Scholar] [CrossRef]
  12. Hu, X.; Wang, Z.; Wang, L.; Chen, C.; Zhang, F.; Zhang, W. Effect of pre-deformation on hot workability of super austenitic stainless steel. J. Mater. Res. Technol. 2022, 16, 238–250. [Google Scholar] [CrossRef]
  13. Wang, L.; Chen, C.; Li, Z.; Wang, Z.; Lv, B.; Zhang, F. Orientation-dependent dynamic recrystallization of super austenitic stainless steels. J. Mater. Res. Technol. 2021, 15, 6769–6785. [Google Scholar] [CrossRef]
  14. Han, Y.; Wu, H.; Zhang, W.; Zou, D.; Liu, G.; Qiao, G. Constitutive equation and dynamic recrystallization behavior of as-cast 254SMO super-austenitic stainless steel. Mater. Des. 2015, 69, 230–240. [Google Scholar] [CrossRef]
  15. Kass, J.N.; Bell, W.L.; Wang, M.T.; Bobick, J. Influence of recrystallization behavior on the mechanical properties of XM-19 stainless steel (22Cr-13Ni-5Mn-2Mo-0.3N). Met. Trans. A 1979, 10, 715–725. [Google Scholar] [CrossRef]
  16. Hamedani, H.M.; Tolaminejad, B.; Momeni, A.; Sadeghpour, S. Hot deformation behavior and microstructural characterization of a novel high entropy steel. Mater. Sci. Eng. A 2024, 910, 146884. [Google Scholar] [CrossRef]
  17. Hu, Y.; Wang, L.; Ouyang, M.; Hu, Y.; Chu, C. Hot deformation behaviors and dynamic softening mechanism of 6%Si high-silicon austenitic stainless steel. J. Mater. Res. Technol. 2023, 26, 4263–4281. [Google Scholar] [CrossRef]
  18. Zhong, M.; Yu, H.; Wang, Z.; Zhang, X.; Qu, J. Hot deformation behavior and process parameters optimization of GH4738 nickel-based superalloy. J. Mater. Res. Technol. 2024, 33, 7990–8001. [Google Scholar] [CrossRef]
  19. Zeng, X.; Huang, L.; Liu, W.; Luo, J.; Pei, L.; Song, W.; Mi, Z.; Xu, X. Hot deformation behavior and dynamic recrystallization mechanism of GH2132 superalloy. J. Alloys Compd. 2024, 1009, 176798. [Google Scholar] [CrossRef]
  20. Liu, X.; Sun, Y.; Zhang, X.; Li, H.; Li, Z.; He, L. Thermal deformation behavior and microstructure evolution of Fe−8.5Mn−1.5Al light–weight medium manganese steel. J. Mater. Res. Technol. 2023, 26, 6053–6066. [Google Scholar] [CrossRef]
  21. Qi, X.; Chen, C.; Wang, Z.; Li, Y.; Lv, B.; Yang, Z.; Zhang, F. Study on hot workability of a novel Cr + N alloyed high-Mn austenitic steel. Mater. Charact. 2023, 203, 113071. [Google Scholar] [CrossRef]
  22. McQueen, H.J.; Ryan, N.D. Constitutive analysis in hot working. Mater. Sci. Eng. A 2002, 322, 43–63. [Google Scholar] [CrossRef]
  23. Stornelli, G.; Gaggiotti, M.; Mancini, S.; Napoli, G.; Rocchi, C.; Tirasso, C.; Di Schino, A. Recrystallization and Grain Growth of AISI 904L Super-Austenitic Stainless Steel: A Multivariate Regression Approach. Metals 2022, 12, 200. [Google Scholar] [CrossRef]
  24. Sohrabi, M.J.; Roostaei, M.; Mirzadeh, H.; Spieckermann, F.; Geranmayeh, A.R.; Mahmudi, R. Effect of sigma (σ) phase precipitation on the recrystallization kinetics of AISI 904L superaustenitic stainless steel. Vacuum 2024, 220, 112830. [Google Scholar] [CrossRef]
  25. Mirzaei, A.; Zarei-Hanzaki, A.; Haghdadi, N.; Marandi, A. Constitutive description of high temperature flow behavior of Sanicro-28 super-austenitic stainless steel. Mater. Sci. Eng. A 2014, 589, 76–82. [Google Scholar] [CrossRef]
  26. Pu, E.-X.; Zheng, W.-J.; Song, Z.-G.; Xiang, J.-Z.; Wei, X.-P. Optimization of Hot Workability in Superaustenitic Stainless Steel 654SMO. J. Iron Steel Res. Int. 2014, 21, 975–982. [Google Scholar] [CrossRef]
  27. Han, Y.; Liu, G.; Zou, D.; Liu, R.; Qiao, G. Deformation behavior and microstructural evolution of as-cast 904L austenitic stainless steel during hot compression. Mater. Sci. Eng. A 2013, 565, 342–350. [Google Scholar] [CrossRef]
  28. Pu, E.-X.; Feng, H.; Liu, M.; Zheng, W.-J.; Dong, H.; Song, Z.-G. Constitutive Modeling for Flow Behaviors of Superaustenitic Stainless Steel S32654 during Hot Deformation. J. Iron Steel Res. Int. 2016, 23, 178–184. [Google Scholar] [CrossRef]
  29. Xing, J.; Liu, C.; Li, A.; Wang, S.; Zhang, X.; Shi, Y. Microstructural Evolution and Stability of Coarse-Grained S31254 Super Austenitic Stainless Steel during Hot Deformation. Metals 2022, 12, 1319. [Google Scholar] [CrossRef]
  30. Li, X.; Ren, L.; Le, Q.; Jin, P.; Cheng, C.; Wang, T.; Wang, P.; Zhou, X.; Chen, X.; Li, D. The hot deformation behavior, microstructure evolution and texture types of as-cast Mg–Li alloy. J. Alloys Compd. 2020, 831, 154868. [Google Scholar] [CrossRef]
  31. Mirzadeh, H. Quantification of the strengthening effect of reinforcements during hot deformation of aluminum-based composites. Mater. Des. 2015, 65, 80–82. [Google Scholar] [CrossRef]
  32. Saboori, A.; Abdi, A.; Fatemi, S.A.; Marchese, G.; Biamino, S.; Mirzadeh, H. Hot deformation behavior and flow stress modeling of Ti–6Al–4V alloy produced via electron beam melting additive manufacturing technology in single β-phase field. Mater. Sci. Eng. A 2020, 792, 139822. [Google Scholar] [CrossRef]
  33. Langdon, T.G. Identifying creep mechanisms in plastic flow. Int. J. Mater. Res. 2005, 96, 522–531. [Google Scholar] [CrossRef]
  34. Zhao, Y.; Xu, L.; Guo, M.; Li, Z.; Xu, Z.; Ye, J.; Wei, S. Microstructure evolution of W-1.0 m-ZrO2 alloy during high temperature deformation. J. Alloys Compd. 2022, 921, 166153. [Google Scholar] [CrossRef]
  35. Maheshwari, A.K. Prediction of flow stress for hot deformation processing. Comput. Mater. Sci. 2013, 69, 350–358. [Google Scholar] [CrossRef]
  36. Dolzhenko, P.; Tikhonova, M.; Kaibyshev, R.; Belyakov, A. Peculiarities of DRX in a Highly-Alloyed Austenitic Stainless Steel. Materials 2021, 14, 4004. [Google Scholar] [CrossRef]
  37. Zhang, P.; Yan, L.; Shang, X.; Li, G.; Qi, X.; Liu, P.; Li, B.; Wang, X.; Xu, X.; Shang, C. Dynamic recrystallization behavior and microstructure evolution of high-Mn austenitic steel for application in a liquefied natural gas carrier. J. Mater. Res. Technol. 2023, 27, 5479–5488. [Google Scholar] [CrossRef]
  38. Zhao, G.; Tian, Y.; Li, H.; Ma, L.; Li, Y.; Li, J. Microstructure evolution and dynamic recrystallization mechanisms of 316L stainless steel during hot deformation. Arch. Civ. Mech. Eng. 2024, 24, 35. [Google Scholar] [CrossRef]
  39. Sheng, S.; Qiao, Y.; Zhai, R.; Sun, M.; Xu, B. Processing map and dynamic recrystallization behaviours of 316LN-Mn austenitic stainless steel. Int. J. Miner. Met. Mater. 2024, 30, 2386–2396. [Google Scholar] [CrossRef]
  40. Chaudhuri, A.; Behera, A.N.; Sarkar, A.; Kapoor, R.; Ray, R.K.; Suwas, S. Hot deformation behaviour of Mo-TZM and understanding the restoration processes involved. Acta Mater. 2019, 164, 153–164. [Google Scholar] [CrossRef]
  41. Cao, Y.; Di, H.; Zhang, J.; Zhang, J.; Ma, T.; Misra, R. An electron backscattered diffraction study on the dynamic recrystallization behavior of a nickel–chromium alloy (800H) during hot deformation. Mater. Sci. Eng. A 2013, 585, 71–85. [Google Scholar] [CrossRef]
  42. Han, Y.; Zou, D.; Chen, Z.; Fan, G.; Zhang, W. Investigation on hot deformation behavior of 00Cr23Ni4N duplex stainless steel under medium–high strain rates. Mater. Charact. 2011, 62, 198–203. [Google Scholar] [CrossRef]
  43. Huang, K.; Logé, R. A review of dynamic recrystallization phenomena in metallic materials. Mater. Des. 2016, 111, 548–574. [Google Scholar] [CrossRef]
  44. Hornbuckle, B.; Luckenbaugh, T.; Fudger, S.; Roberts, A.; Jannotti, P.; Byun, T.; Hoelzer, D.; Solanki, K.; Darling, K. Role of geometric dynamic recrystallization in nanocrystalline alloys. Materialia 2023, 30, 101807. [Google Scholar] [CrossRef]
  45. Wang, X.; Wang, D.; Jin, J.; Li, J. Effects of strain rates and twins evolution on dynamic recrystallization mechanisms of austenite stainless steel. Mater. Sci. Eng. A 2019, 761, 138044. [Google Scholar] [CrossRef]
  46. Zhang, H.; Zhang, K.; Zhou, H.; Lu, Z.; Zhao, C.; Yang, X. Effect of strain rate on microstructure evolution of a nickel-based superalloy during hot deformation. Mater. Des. 2015, 80, 51–62. [Google Scholar] [CrossRef]
Figure 1. Schematic diagram of the hot compression test process and the sample’s hot deformation process.
Metals 15 00334 g001
Figure 2. Initial microstructure of the XM-19 SASS: (a) IPF map; (b) PH map; (c) XRD pattern.
Metals 15 00334 g002
Figure 3. The true stress–strain curves of XM-19 SASS at different strain rates: (a) 0.01 s−1; (b) 0.1 s−1; (c) 1 s−1; (d) 10 s−1.
Metals 15 00334 g003
Figure 4. The fitting relationship under 0.7 true strain: (a) l n σ l n ε ˙ ; (b) σ l n ε ˙ ; (c) l n [ s i n h α σ ] l n ε ˙ ; (d) 1000 / T l n [ s i n h α σ ] .
Metals 15 00334 g004
Figure 5. Fitting curve of ln(sinh(ασ)) − ln(Z).
Metals 15 00334 g005
Figure 6. The fitting relationship between material parameters and strains: (a) α, (b) Q, (c) n, (d) lnA.
Metals 15 00334 g006
Figure 7. The comparison between experimental and predicted results: (a) 0.01 s−1; (b) 0.1 s−1; (c) 1 s−1; (d) 10 s−1.
Metals 15 00334 g007
Figure 8. The correlation curve of theoretical and experimental values.
Metals 15 00334 g008
Figure 9. Hot processing maps of XM-19 SASS under different strain conditions: (a) 0.4; (b) 0.5; (c) 0.6; (d) 0.7; (e) 0.8; (f) 0.9.
Metals 15 00334 g009
Figure 10. XM-19 SASS in 0.9 true strain hot processing map area: (a) I; (b) II; (c) III; (d) IV.
Metals 15 00334 g010
Figure 11. IPF maps, KAM maps and GOS map of XM-19 SASS at the strain rate of 0.1 s−1 and different temperatures. (a1c1)1025 °C; (a2c2) 1100 °C; (a3c3) 1175 °C; (a4c4) 1250 °C; (a5) recrystallization grain size; (b5) GND values; (c5) GOS values.
Metals 15 00334 g011
Figure 12. IPF maps, KAM maps and GOS maps of XM-19 SASS at the compression temperatures of 1250 °C and strain rates. (a1c1) 0.01 s−1; (a2c2) 0.1 s−1; (a3c3) 1 s−1; (a4c4) 10 s−1; (a5) recrystallization grain size; (b5) GND values; (c5) GOS values.
Metals 15 00334 g012
Figure 13. Boundary maps of the XM-19 SASS under different deformation conditions: (a) 1025 °C, 0.1 s−1; (b) 1100 °C, 0.1 s−1; (c) 1175 °C, 0.1 s−1; (d) 1250 °C, 0.1 s−1; (e) 1250 °C, 0.01 s−1; (f) 1250 °C, 1 s−1; (g) 1250 °C 10 s−1; (h,i) the fraction of LAGBs.
Metals 15 00334 g013
Figure 14. Misorientation angle measured along the lines marked in IPF maps of Figure 11a1–a4 and Figure 12a1–a4: (a) Line A; (b) Line B; (c) Line C; (d) Line D; (e) Line E; (f) Line F; (g) Line G; (h) Line H; (i) Line I.
Metals 15 00334 g014
Table 1. Chemical composition (wt. %) of XM-19 super austenitic stainless steel.
CSiMnCrNiMoVAlNFe
0.0340.495.0222.3211.622.560.140.0010.395Bal.
Table 2. The flow stress values of XM-19 SASS under different deformation conditions when the true strain is 0.7.
ε ε ˙   ( s 1 ) Flow Stress (MPa) at Different Temperature (°C)
1025 °C1100 °C1175 °C1250 °C
0.70.01164.03117.9172.6049.18
0.1224.87163.67104.1966.74
1277.67210.18153.06109.23
10299.26233.43190143.6
Table 3. Comparison with the thermal activation energy of other super austenitic stainless steels.
ReferenceAlloyTemperature Range (°C)Strain Rate Range (s−1)Activation Energy, Q (kJ/mol)
Present WorkXM-19 SASS1025–12500.01–10614.3
[25]Sanicro-28 SASS800–11000.001–0.1509
[26]654SMO SASS950–12000.001–10494
[5]7Mo SASS1000–12000.001–10558.9
[12]7Mo-0.37N-RE SASS900–12000.01–10622–712
[27]904L SASS1000–11500.01–10459.12
[14]254SMO SASS900–12000.01–10577.845
[28]S32654 SASS900–12500.001–10486
[29]S31254 SASS950–12500.001–10542.91
Table 4. The polynomial fitting coefficients of α, n, Q and lnA in Equation (13).
α (MPa)Q (kJ·mol−1)nlnA (s−1)
A09.4841B01180.6C012.529D096.439
A1−63.201B112,735C1−116.43D1−1040.6
A2619.26B2132,010C21043.2D210,737
A3−3211.7B3−697,670C3−5089.3D3−56,586
A49642.5B42,089,300C414,471D4169,190
A5−17,348B5−375,600C5−24,829D5−301,490
A618,502B63,934,700C625,426D6318,420
A7−10,809B7−278,200C7−14,352D7−184,480
A82671.2B8558,520C83446D845,270
Disclaimer/Publisher’s Note: The statements, opinions and data contained in all publications are solely those of the individual author(s) and contributor(s) and not of MDPI and/or the editor(s). MDPI and/or the editor(s) disclaim responsibility for any injury to people or property resulting from any ideas, methods, instructions or products referred to in the content.

