Article

Effect of Extrusion Temperature on the Microstructure and Properties of Biomedical Mg-1Zn-0.4Ca-1MgO Composite

1
School of Materials Science and Engineering, Tianjin University of Technology, Tianjin 300384, China
2
Key Laboratory of Display Materials and Photoelectric Device, Ministry of Education, Tianjin 300384, China
3
National Demonstration Center for Experimental Function Materials Education, Tianjin 300384, China
*
Authors to whom correspondence should be addressed.
Metals 2025, 15(3), 337; https://doi.org/10.3390/met15030337
Submission received: 21 February 2025 / Revised: 19 March 2025 / Accepted: 19 March 2025 / Published: 20 March 2025
(This article belongs to the Special Issue Metal Composite Materials and Their Interface Behavior)

Abstract

:
The effects of extrusion temperatures on the microstructure, mechanical properties, and corrosion performance of biomedical Mg-1Zn-0.4Ca-1MgO composites were systematically investigated. The results indicated that lower extrusion temperatures notably refined the grain size and promoted the formation of numerous nano-scaled secondary phase particles. The grain sizes were 0.8 μm, 1.7 μm, and 3.4 μm for the materials extruded at 280 °C, 310 °C, and 330 °C, which were named ET280, ET310, and ET330. The finest grain size and abundant precipitates enhanced the mechanical properties of the composite with a microhardness of 86.9 HV, a yield strength of 305 MPa, and a fracture elongation of 15.2%. Moreover, the ET280 alloy with ultra-fine grains exhibited the optimal corrosion resistance among these three composites, and its annual corrosion after immersion in Hank’s solution for 14 days was only 0.17 mm/y. The excellent performance in vitro immersion was mainly attributed to the formation of the uniformly dense Ca-P layer on its surface and the contiguous compact Mg(OH)2 layer, which could effectively weaken the contact between the corrosive solution and the Mg matrix.

1. Introduction

The rapid advancement of medical technology has promoted the development of new biodegradable materials in clinical applications. Magnesium (Mg) and its alloys are considered among the most promising biodegradable implant materials [1,2,3,4]. Currently, permanent metallic implants in the human body, such as titanium(Ti) alloys, stainless steel, and cobalt-chromium (Co-Cr) alloys, often mismatch the mechanical properties of natural bone, leading to stress shielding effects [5]. In contrast, Mg alloys possess excellent biocompatibility, close density, and elastic moduli with natural bone [6,7,8]. The total Mg concentration in adult plasma ranges from 0.65 mM to 1.05 mM [9], with a recommended daily intake of approximately 300 mg [10,11,12]. Therefore, Mg alloys are regarded as a promising new category of biodegradable metallic implant materials.
However, current Mg alloys struggle to meet clinical standards due to their relatively low strength and rapid corrosion rate. To enhance the mechanical properties, corrosion resistance, and biocompatibility of Mg alloys, researchers have employed various reinforcement techniques. Among these, alloying with essential elements or incorporating nanoparticles to create composite materials is a common approach to improve the performance of Mg alloys [13].
Zn is one of the essential trace elements in the human body and exhibits good biocompatibility, with a maximum solubility of 6.2 wt.% in Mg. It plays a dual role in solid solution and precipitation strengthening [14,15,16]. The addition of Zn significantly refined the grain size of Mg alloys, increased the volume fraction of the second phase, and thus enhanced the strength of Mg-Zn alloys with increasing Zn content through grain boundary strengthening and Orowan strengthening [17]. Ca is a primary component of bones, and its adequate addition supports bone formation and growth [18]. Additionally, Ca can refine the grain size of Mg alloys through the formation of Mg2Ca and the densified corrosion product layer Mg(OH)2, thereby enhancing mechanical performance and corrosion resistance simultaneously [19,20,21,22,23]. Moderate alloying content can improve the mechanical properties and corrosion resistance of Mg alloys simultaneously, but excessive alloying elements lead to the opposite effect. Previous studies have shown [24,25] that when the Zn content is greater than 4 wt.%, microgalvanic corrosion is serious due to the high potential difference between a large number of second phases and the α-Mg matrix. Similarly, when the Ca content in Mg alloys exceeds 1 wt.%, a large number of Mg2Ca phases were generated, and they were more brittle, which greatly reduced the plasticity of Mg alloys. Moreover, the abundant Mg2Ca phases are prone to being eroded during corrosion, leading to the accelerated degradation of the alloys [26]. For example, Yim et al. [27] found that Mg-0.7Ca had the best mechanical properties and corrosion resistance by comparing the performance of AZ31-xCa (x = 0.3, 0.5, 0.7, 1.0, 2.0, and 5.0 wt.%). Ma et al. [28] investigated the performance of an extruded Mg-xZn-0.2Ca (x = 0, 1.0, 2.0, and 3.0) alloy and found that the Mg-2.0Zn-0.2Ca alloy had the highest tensile and yield strengths of 278 MPa and 230 MPa, respectively, but the Mg-1.0Zn-0.2Ca alloy had the smallest corrosion rate of 1.23 mm/y. Therefore, to some extent, the relationship between the strength and corrosion resistance of Mg alloys is inverted. The low-alloyed Mg alloys become an important choice.
However, only alloying makes it difficult to achieve the requirement for the bone fixation Mg alloys, especially when the total content of the alloying element is at a low level. Previous research has shown that bioactive ceramic particles [29,30,31], such as hydroxyapatite (HA), β-tricalcium phosphate (βTCP) granules, ZrO2, TiO2, and MgO, are more suitable as reinforcements to enhance the mechanical properties and corrosion resistance of biomedical Mg alloys. However, it is difficult to disperse these particles uniformly in the matrix. X. Gu et al. [32] prepared Mg/HA (2–3 μm) composites using powder metallurgy and found that severe agglomeration of HA particles and poor interface bonding with the Mg matrix resulted in reduced mechanical properties. Recently, biodegradable MgO ceramic particles, exhibiting good biocompatibility and strong interfacial bonds with the Mg matrix [33], attracted more attention. Tang et al. [34] explored the influence of MgO on the corrosion resistance of extruded Mg-Zn-Ca alloy and revealed that MgO particles could react with aqueous solution and form Mg(OH)2, which was the same as the product of Mg degradation, resulting in the improvement of the corrosion performance of the alloy. Fan et al. [35] also indicated that the addition of MgO promoted uniform corrosion on the pure Mg surface and hindered the further propagation of corrosion cracks, thereby improving the alloy’s corrosion resistance. Zhao et al. [36] studied the effects of varying MgO contents (0.3~1.0 wt.%) on the performance of micro-alloyed Mg-1Zn-0.5Ca alloys and found that moderate MgO promoted the precipitation of Ca2Mg6Zn3 and Mg2Ca phases during hot extrusion, leading to the enhancement of the alloy’s mechanical properties and corrosion resistance. Therefore, under the premise of ensuring low alloy content, adding MgO particles can not only improve the mechanical properties of Mg alloy but also ensure that Mg alloy has good corrosion resistance.
Due to the high thermal sensitivity of Mg alloys, extrusion temperature has a considerable impact on the material properties. Zhao et al. [37] produced ultrafine-grained Mg-Nd-Zn-Zr alloys through low-temperature extrusion, resulting in significant improvements in strength and elongation. Wang et al. [38] investigated the effect of different extrusion temperatures on the microstructure and tensile properties of Mg-1.2Zn-0.1Ca (wt.%) alloys and found that the alloy extruded at 200 °C exhibited optimal strength and ductility. However, as the extrusion temperature increased, the average grain size of the alloy also increased, and the reduction in dislocation density resulted in decreased mechanical performance at higher temperatures. In contrast, Hu et al. [39] used an extrusion-shear (ES) process to produce AZ61 alloys at different extrusion temperatures, and the results showed that the AZ61 alloy extruded at 440 °C exhibited better corrosion resistance compared to that extruded at 400 °C. The improved corrosion resistance was primarily attributed to the redistribution of intermetallic compounds. Therefore, extrusion temperature had an important influence on the mechanical and corrosion resistance properties of low-alloyed Mg alloys.
Based on this, Mg-1Zn-0.4Ca-1MgO (wt.%) alloys were extruded at different temperatures (280 °C, 310 °C, and 330 °C), referred to as ET280 °C, ET310 °C, and ET330 °C, respectively. The effects of different extrusion temperatures on the microstructure, mechanical properties, and corrosion resistance of the Mg-1Zn-0.4Ca-1MgO composite, as well as the underlying mechanisms, were investigated.

2. Material and Methods

2.1. Material Preparation

High-purity Mg (99.99 wt.%), high-purity Zn (99.99 wt.%), Mg-25Ca (wt.%) master alloy, and synthesized MgO nanoparticles (NPs) were used as raw materials (Longhai Metals, Handan, China).The high-purity Mg was placed in a graphite crucible, and nitrogen (N2) and sulfur hexafluoride (SF6) were used as protective gases while heating the furnace to 700 °C. Concurrently, the high-purity Zn and Mg-25Ca (wt.%) master alloy were preheated in a muffle furnace at 300 °C to ensure surface dryness. Once the pure Mg was fully melted, the preheated high-purity Zn and Mg-25Ca (wt.%) master alloy were added to the graphite crucible, and the melt was heated to 780 °C until all metals were completely melted. Subsequently, the MgO NPs were gradually added into the melt and stirred preliminarily by a long-handled spoon. Then, a high-shear device preheated to 500 °C was used to disperse the mixture at 3500 rpm for 20 min. Whereafter, the melt underwent 20 min of ultrasonic treatment. Finally, the melt was allowed to cool to 730 °C before being cast into a steel mold preheated to 200 °C.
As can be seen from the simulated phase diagram shown in Figure 1, both of Mg2Ca and Ca2Mg6Zn3 phases are abundant at 280 °C, and the content of the Mg2Ca phase reaches the peak level at 310 °C with a slightly Ca2Mg6Zn3 phase. However, there is only the Mg2Ca phase at 330 °C. To distinguish the different precipitates on the microstructure and properties, three extrusions (280 °C, 310 °C, and 330 °C) were adopted. The ingot was then solution-treated at 420 °C for 16 h, followed by water quenching. Then the solution-treated ingots, extrusion cylinder, and extrusion die were all preheated to the extrusion temperatures (280 °C, 310 °C, and 330 °C) and held for 90 min, and the following extrusion was carried out at the corresponding temperatures. The extrusion ram speed and extrusion ratio were 2 mm/s and 29:1, respectively. The casting and extrusion processes are shown schematically in Figure 2. Specific extrusion process parameters are shown in Table 1.
Unavoidable internal stress was generated during the extrusion process, especially at a relatively low temperature. The internal stress was unfavorable to the corrosion resistance of Mg alloys. Therefore, annealing was conducted at 180 °C for 30 min so as to eliminate the internal stress and retain the extruded microstructure.

2.2. Microstructure Characterization

The extruded rods were cut along the extrusion direction (ED) for microstructural observation. The samples were initially ground with sandpapers of grades 800#, 1500#, 3000#, and 5000#, and polished with an automatic grinder (UNIPOL-1000M, Shenyang Kejing Automation Equipment Co., Ltd., Shenyang, China) at a speed of 270 rpm using diamond slurry to achieve a finish of 0.5 μm. The polished samples were etched with a chemical etching solution (Shanghai Aladdin Biochemical Technology Co., Ltd., Shanghai, China), whose composition is detailed in Table 2. The microstructure of the samples was examined using an optical metallographic microscope (OM). Grain sizes were measured using Nano Measurer (v1.2) software based on the low-magnification metallographic images. Phase analysis of the samples was conducted using an X-ray diffractometer (D/MAX/2500, Rigaku Corporation, Tokyo, Japan) with a set voltage of 20 kV and a current of 200 mA. The 2Theta/Theta mode was employed at a scanning angle of 20–80° and a scanning speed of 5°/min. The microstructure of the samples was observed using a field emission scanning electron microscope (FEI-Quanta FEG 250, FEI, Hillsboro, OR, USA), and elemental composition was analyzed using energy-dispersive spectroscopy (EDS). Additionally, the distribution of the second phase was observed using the back-scattered mode of a high-resolution field emission scanning electron microscope (Verios 460L, FEI, USA), with elemental analysis conducted using EDS. Finally, the volume fraction of the second phase in the alloy was quantified in low-magnification macro images using ImageJ software (1.53k), while the dimensions of the second phase were measured in high-magnification micrographs using Nano Measure software.

2.3. Mechanical Properties Test

Hardness testing was conducted using a Vickers hardness tester (HMV-2T, Shimadzu Corporation, Kyoto, Japan) with a load of 490.3 mN applied for 20 s, and the final hardness was the average value of 20 points. The extruded samples were machined into standard tensile specimens according to GB/T 16865-2013 [40], and tensile tests were conducted using an electronic universal testing machine (DDL10). The tensile testing speed was set to 0.5 mm/min, with a gauge length cross-section of 25 mm and a diameter of 5 mm. Each alloy was tested in triplicate to ensure result accuracy.

2.4. Corrosion Properties Test

Electrochemical testing was conducted using an electrochemical workstation (Zahner Zennium, Zahner Kansas City, MO, USA), with Hank’s solution (Table 3) serving as the conductive medium in a water bath (FJS-2) at 37 °C. A three-electrode system was used for testing, where the working electrode, counter electrode, and reference electrode were the sample, graphite electrode, and saturated calomel electrode, respectively. For the impedance and polarization tests, the sample underwent an initial 120 min of open circuit potential (OCP) testing to establish a stable potential. The frequency range for the alternating current impedance tests was from 105 Hz to 10−1 Hz, while polarization tests were performed at a scan rate of 1 mV/s from −500 to 500 mV (relative to OCP). The Nyquist plot was fitted using ZView software (3.0.0.14), and an equivalent circuit was drawn based on the fitting results. The corrosion current density (Icorr) was calculated using the Tafel method in CView software (2.3.0.13). The corrosion rate of the sample was calculated based on the electrochemical test results using Equation (1).
P i = 22.85 × I c o r r
where P i represents the corrosion rate of the alloy, while I c o r r denotes the current density measured by the electrochemical method.
An in vitro immersion test was conducted following ASTM G31-72 [41]. Each sample was first polished using sandpaper with grades 800#, 1500#, 3000#, and 5000#. Three parallel samples were taken for each component, and their initial weight m 0 was recorded. Corrosive solution was added at a ratio of 0.25 mL per mm2 of sample surface area. Hank’s solution was changed every 48 h, with measurements of temperature and pH taken during each change. After immersion for various durations (1, 3, 7, and 14 days), the samples were removed to eliminate corrosion products. A chromic acid solution (200 g/L Cr2O3, 10 g/L Ag(NO3)2, 10 g/L Ba(NO3)2) was used to remove surface corrosion products until the metallic luster was visible. The surface was then cleaned with anhydrous ethanol to remove any remaining chromic acid, followed by ultrasonic cleaning in anhydrous ethanol. After cleaning, the samples were dried, and their post-corrosion weight was recorded as m 1 . Weight loss and the average annual corrosion rate were calculated using Equation (2).
C = k × Δ m ρ × A × T
In this equation, C represents the annual corrosion rate of the material, k is a constant (8.76 × 10⁴), ρ denotes the material density, m is the weight loss, A is the sample surface area (mm2), and T is the immersion time (in hours).

3. Results

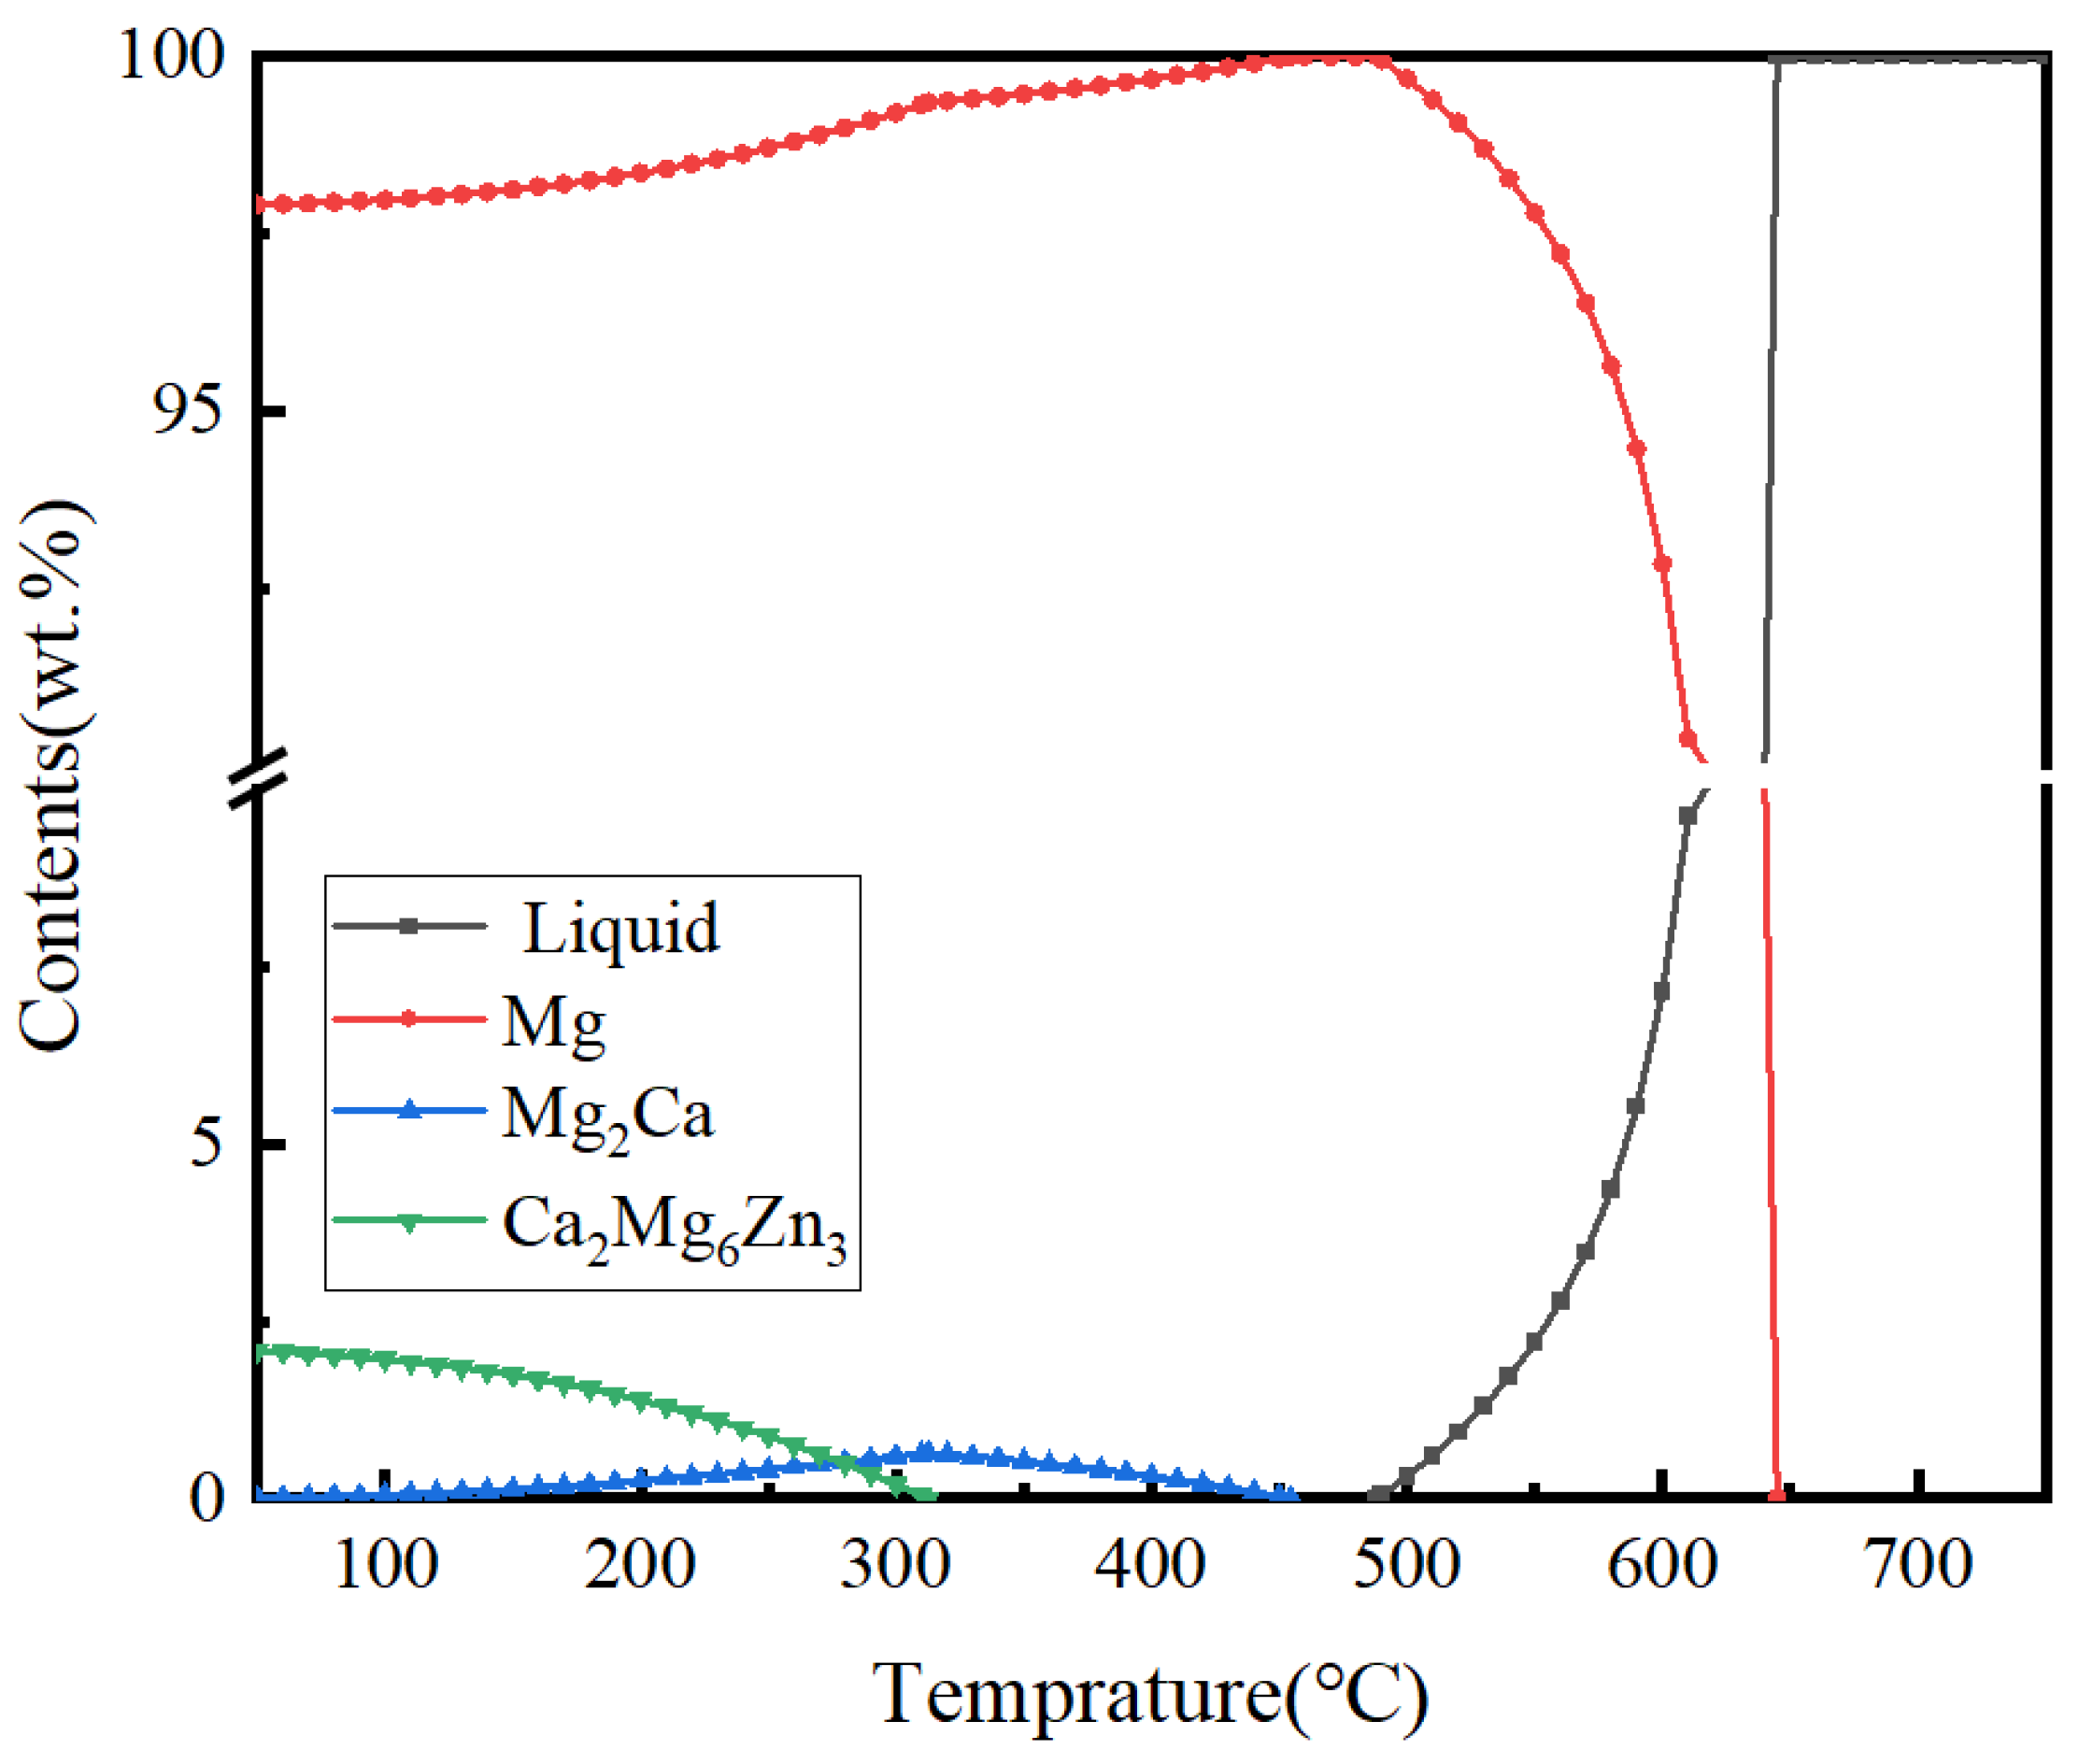
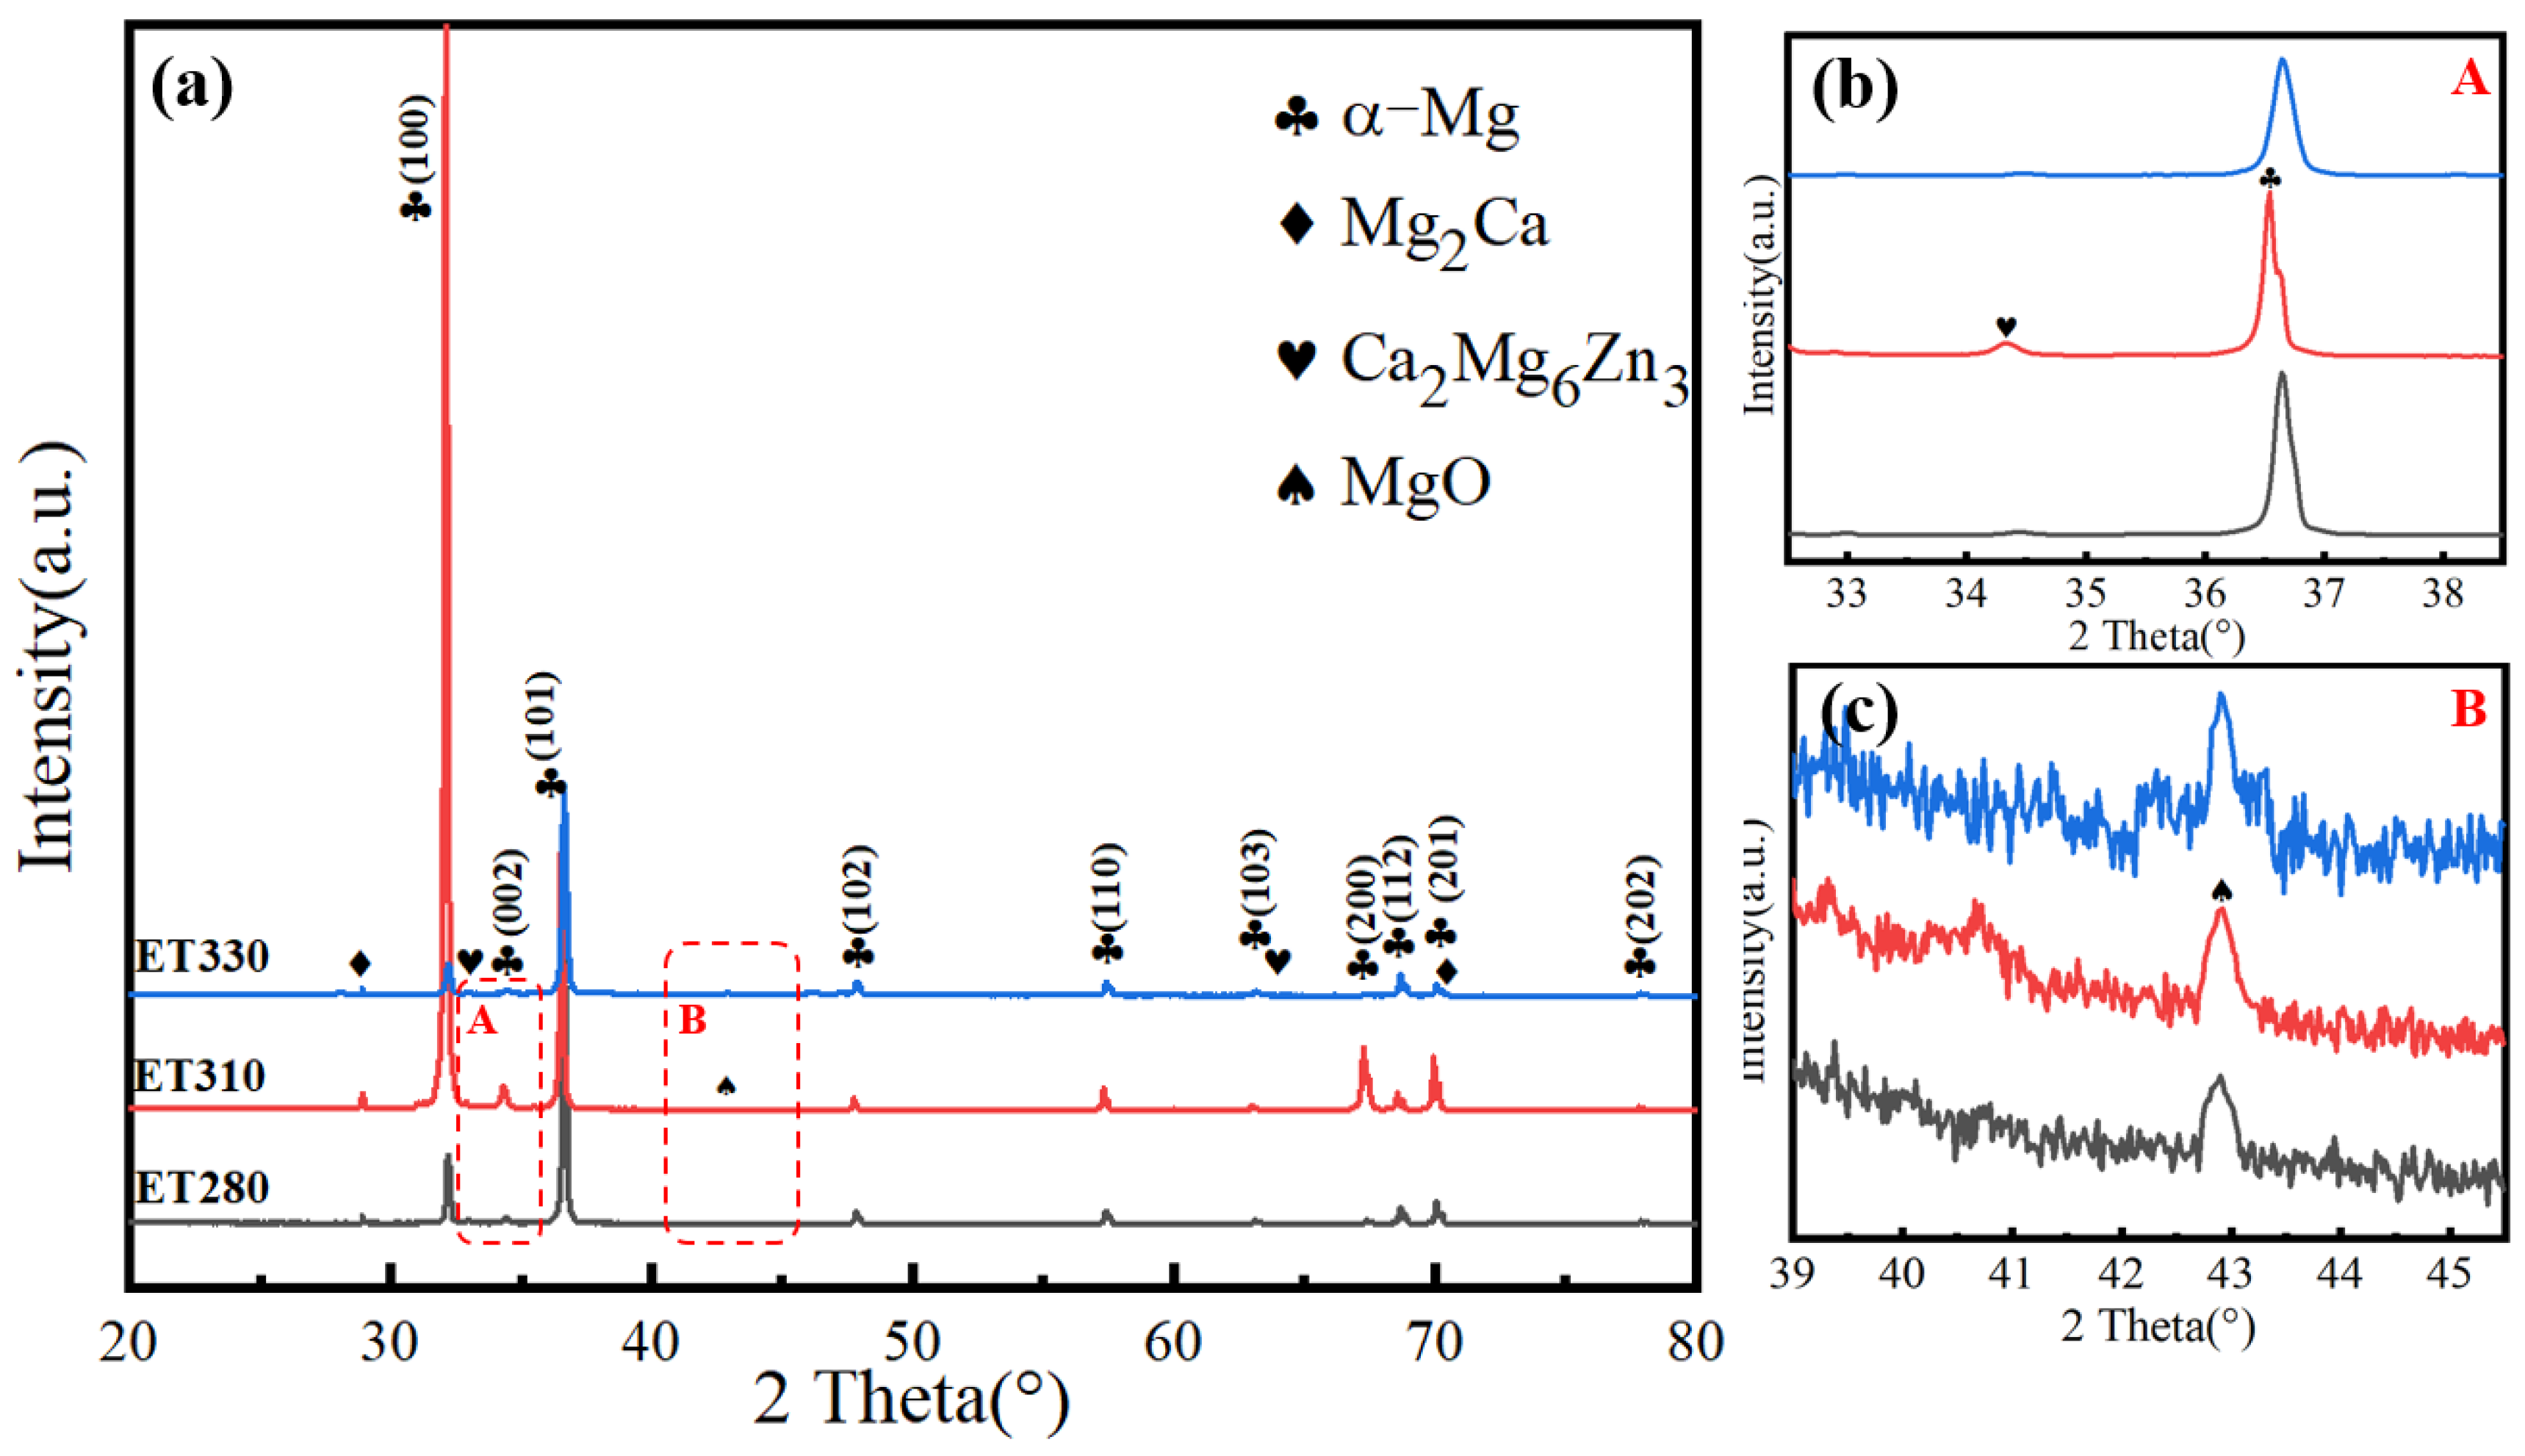
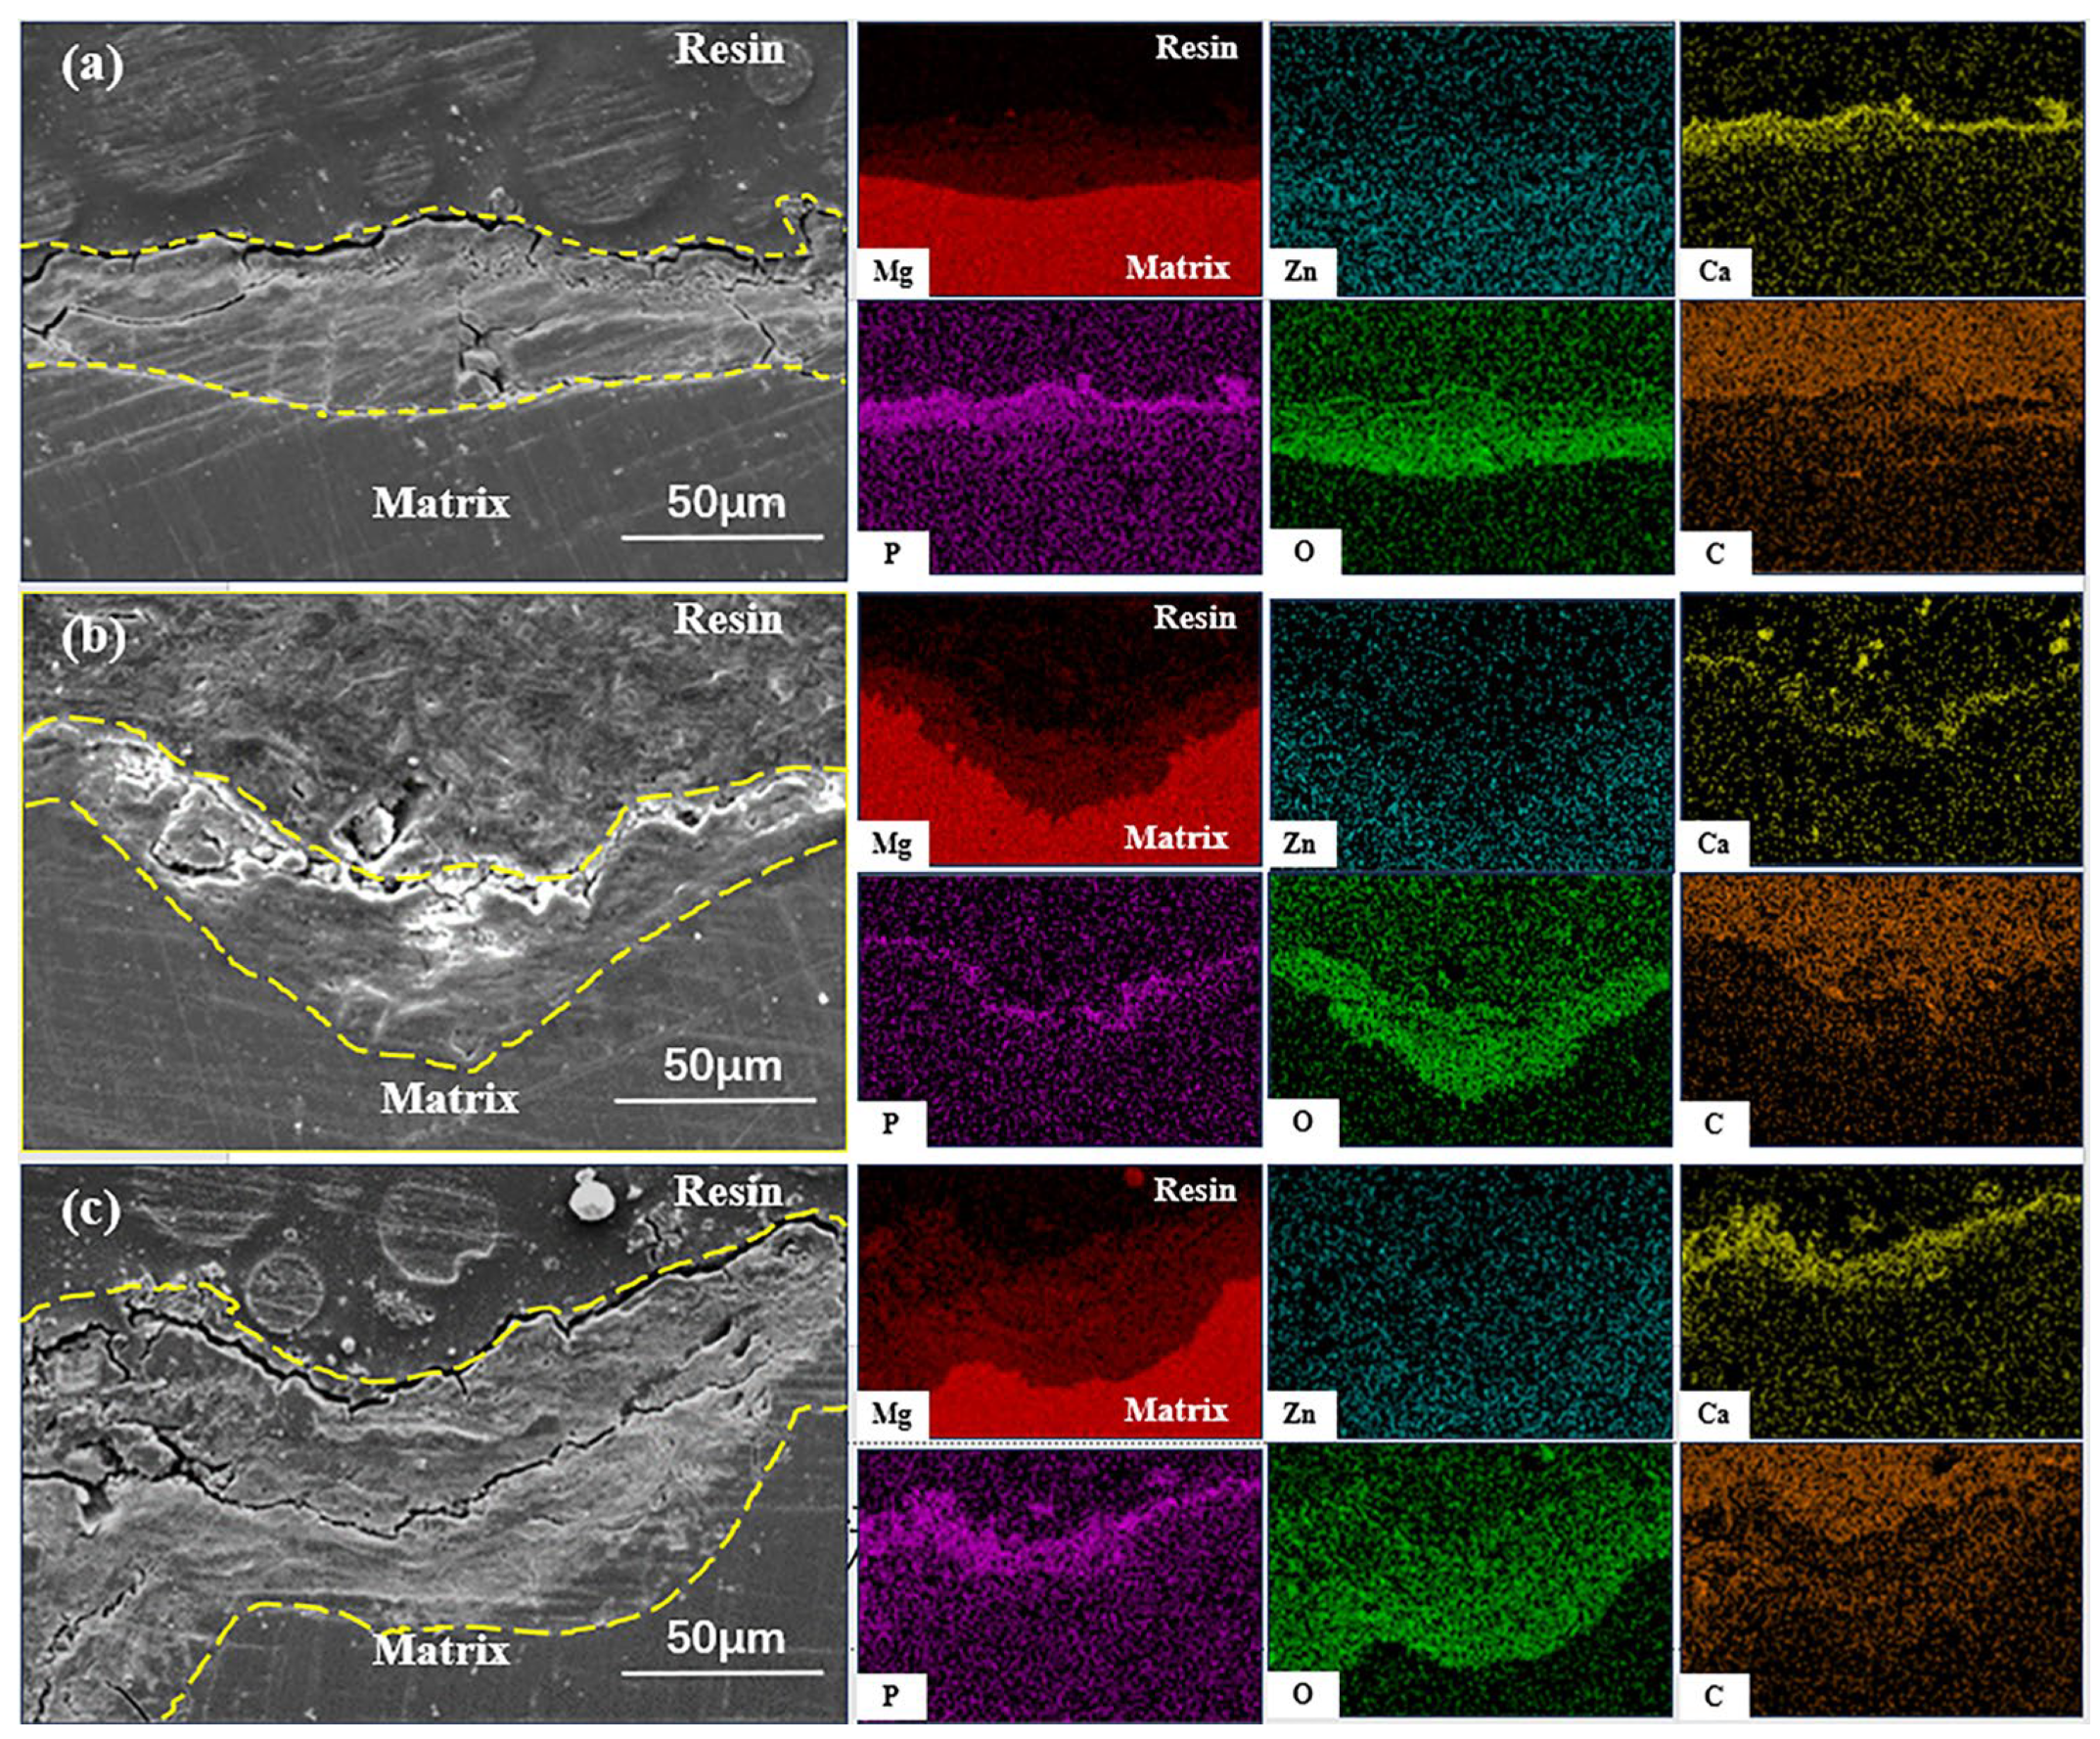
3.1. Microstructure of Extruded Composites

Figure 3 illustrates the microstructural characteristics of Mg-1Zn-0.4Ca-1MgO composites at various extrusion temperatures. The average grain size of Mg-1Zn-0.4Ca-1MgO extruded at 280 °C is 0.77 μm. As shown in Figure 3a, there are about 39% non-dynamic recrystallized (un-DRXed) areas in the sample. The high magnification microstructure in Figure 3d still reveals many un-DRXed regions, indicating that the material lacks sufficient recrystallization energy at lower extrusion temperatures, resulting in a higher proportion of un-DRXed areas. At an extrusion temperature of 310 °C, the grain size of ET310 increases to 1.32 μm, and the area fraction of un-DRXed regions reduces significantly to 27%. When the extrusion temperature was increased to 330 °C, the ZX3 grain grew to 3.44 μm. This sample exhibits almost no un-DRXed areas; that is, nearly all the coarse grains transformed into fine DRXed grains during extrusion. The high magnification microstructure in Figure 3f further shows a relatively uniform grain size distribution except for an elongated grain. Therefore, the high extrusion temperature increases the motivation for recrystallization and leads to grain growth.
Figure 4a shows the XRD diffraction patterns of Mg-1Zn-0.4Ca-1MgO composites at different temperatures. In addition to the α-Mg diffraction peaks, diffraction peaks of Mg2Ca, Ca2Mg6Zn3, and MgO were observed in all three materials. The Mg2Ca diffraction peaks were mainly located at 28.4°. The intensity of the Mg2Ca peaks in ET310 was higher than that in ET280 and ET330 composites. This may be due to the lower extrusion temperature of the ET280 sample, where the Mg2Ca phase is fragmented and difficult to detect. On the contrary, ET330 was extruded at a higher temperature compared to the low-temperature extrusion, and the amount of Mg2Ca precipitated during extrusion was lower. In addition, as shown in Figure 4b, the diffraction peak of the Ca2Mg6Zn3 phase can be detected at 34.4° in all samples. Figure 4c shows a zoomed-in range from 39° to 45.5°, with emphasis on the prominent MgO peak appearing at 42.9°. Zooming in on this region reveals the characteristic MgO peak.
Figure 5 shows the SEM images of Mg-1Zn-0.4Ca-1MgO composites at different extrusion temperatures. Figure 5(a1–a3) shows the distribution of the second phases in ET280, and a large number of fine and uniformly distributed gray particles and a small number of bright, relatively large particles can be observed along ED. Figure 5(b1–b3) shows the distribution of the second phase of ET310. Compared with ET280, the content of the gray phases is slightly decreased and that of the bright phases is larger in size. Figure 5(c1–c3) gives the distribution of the second phase of ET330, and the contents of the two second phases in ET330 are significantly reduced compared with ET280 and ET310. According to the compositions of phases and the XRD results, they are identified to be the Mg2Ca phase and Ca2Mg6Zn3 phase [42].
The contents and sizes of the second phases of the three materials are given in Table 4 and Table 5, respectively. As the extrusion temperature increases, more alloying elements are solidly dissolved in the matrix. According to Table 4, the total content of the second phase in ET280 is 2.16%; Mg2Ca accounts for 0.46%, and Ca2Mg6Zn3 is 1.70%. The total content of the second phase in ET310 is 1.51%, with Mg2Ca accounting for 0.41% and Ca2Mg6Zn3 of 1.10%. The total content of the second phase in ET330 decreases dramatically to 0.28%, with Mg2Ca of 0.08% and Ca2Mg6Zn3 of 0.20%. Due to the lower extrusion temperature, the Mg2Ca phase is fragmented, and the growth dynamics of new precipitates are reduced during extrusion, so the size of the Mg2Ca and Ca2Mg6Zn3 in ET280 is smaller than that of ET310 (Table 5). As for the smallest size of phases in ET330, the main reason was attributed to the high solid solubility of alloying elements, resulting in very few elements in the form of a second phase.

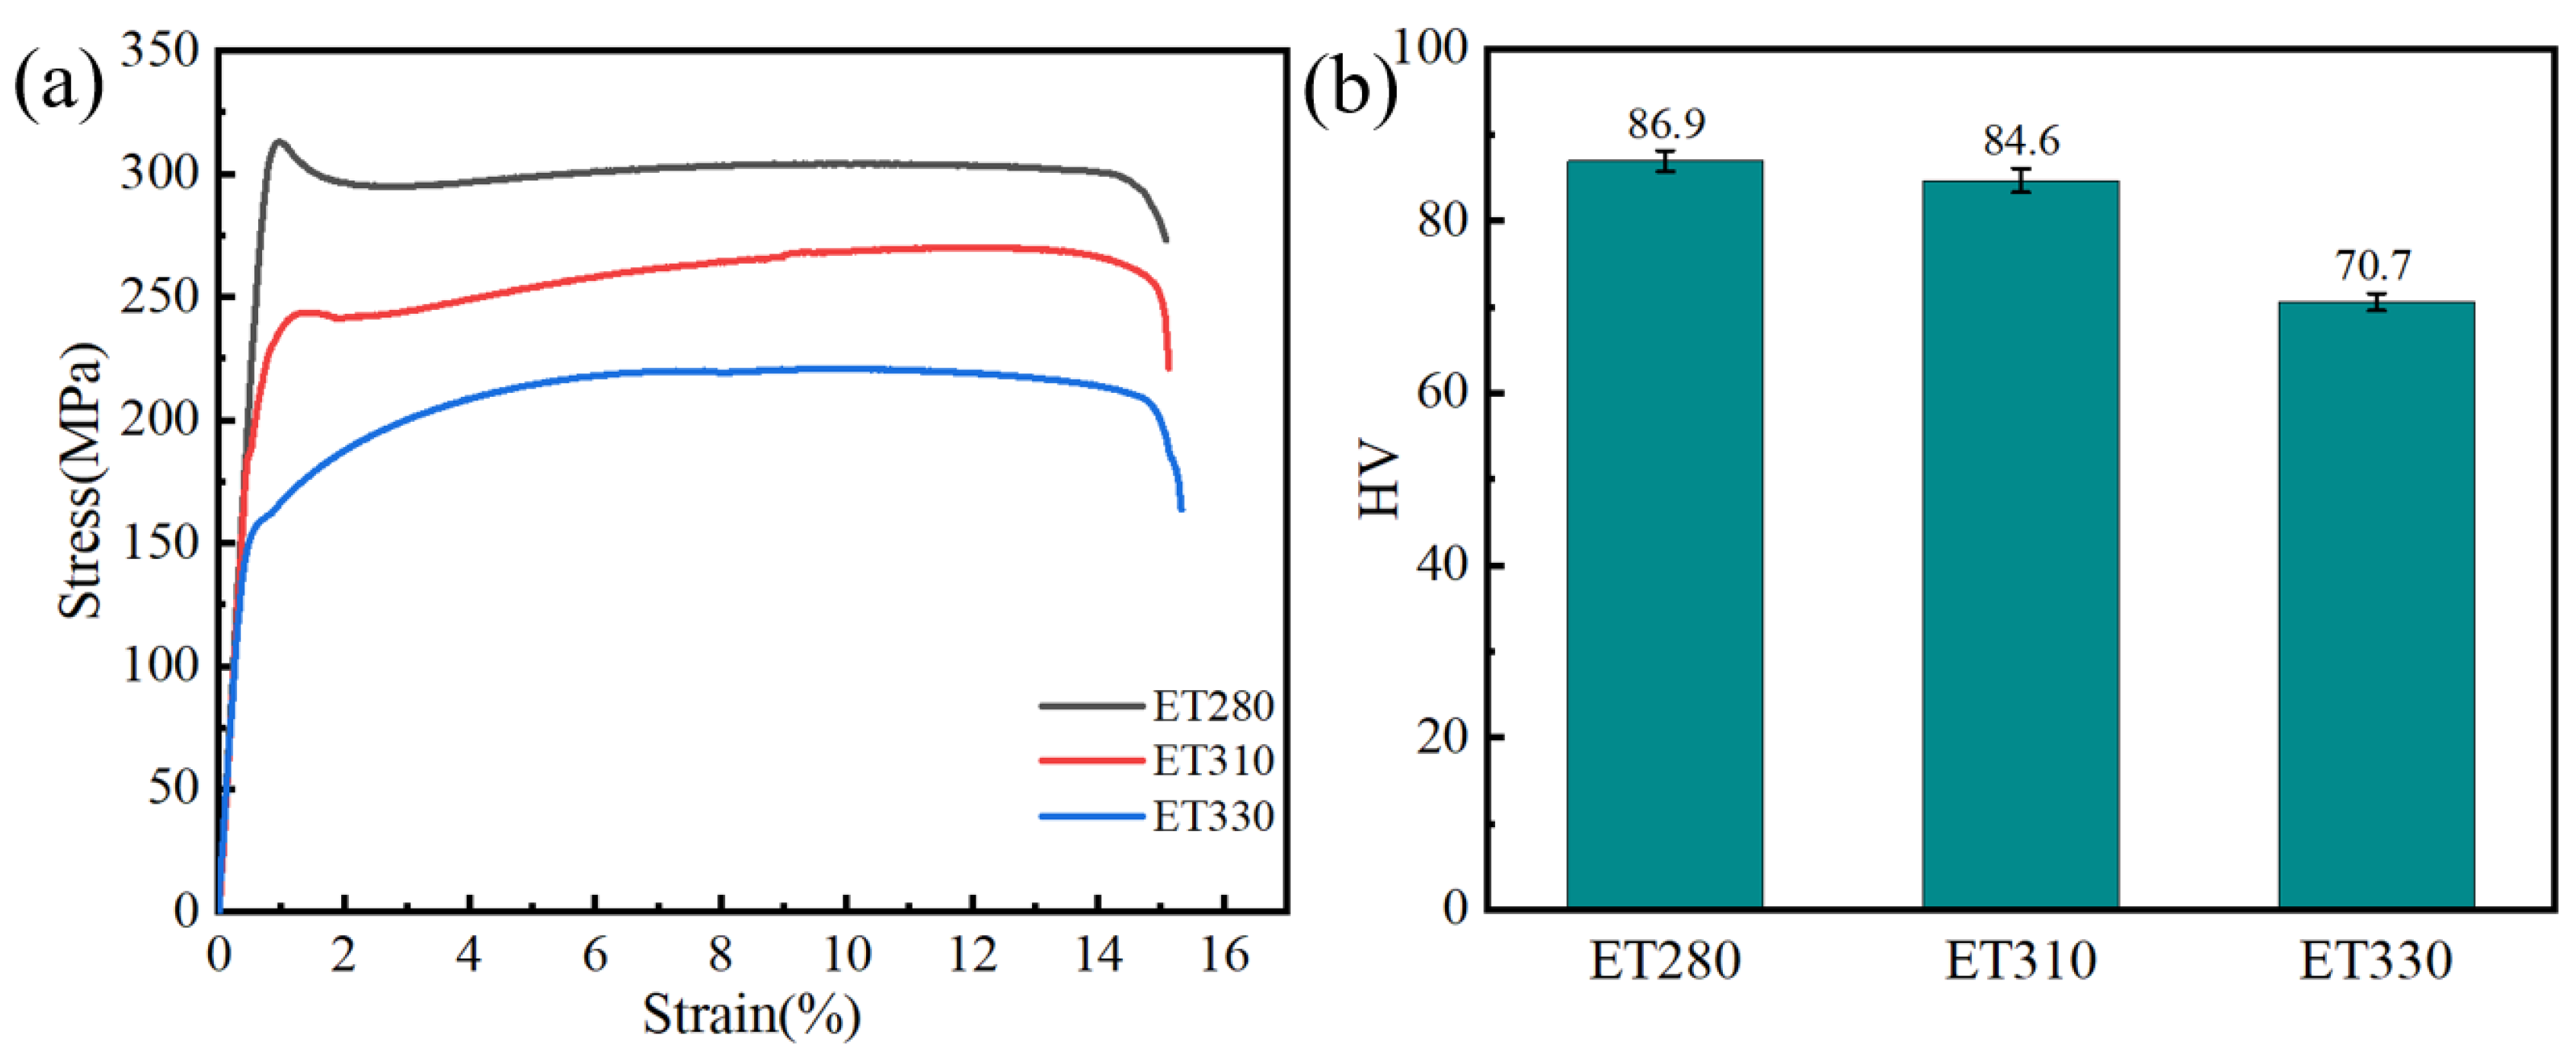
3.2. Mechanical Properties

Figure 6 shows the mechanical properties of Mg-1Zn-0.4Ca-1MgO composites at different extrusion temperatures, and Table 6 shows the specific data. It can be seen that the mechanical strength of Mg-1Zn-0.4Ca-1MgO composites gradually decreases and plasticity increases slightly as the extrusion temperature increases. The ultimate tensile strength (UTS) of ET280 is 312 MPa, the yield strength (YS) is 305 Mpa, and the elongation to fracture (EL) is 15.1%. For ET310, the UTS, YS, and EL are 271 MPa, 249 MPa, and 15.2%. In comparison, ET330 has a UTS of 241 MPa, a YS of 181 MPa, and an EL of 15.4%. Figure 6b shows the microhardness of the three materials, which are 86.9 HV, 84.6 HV, and 70.7 HV, respectively. The microhardness decreases with increasing extrusion temperature, which is in line with the variation of the yield strength.

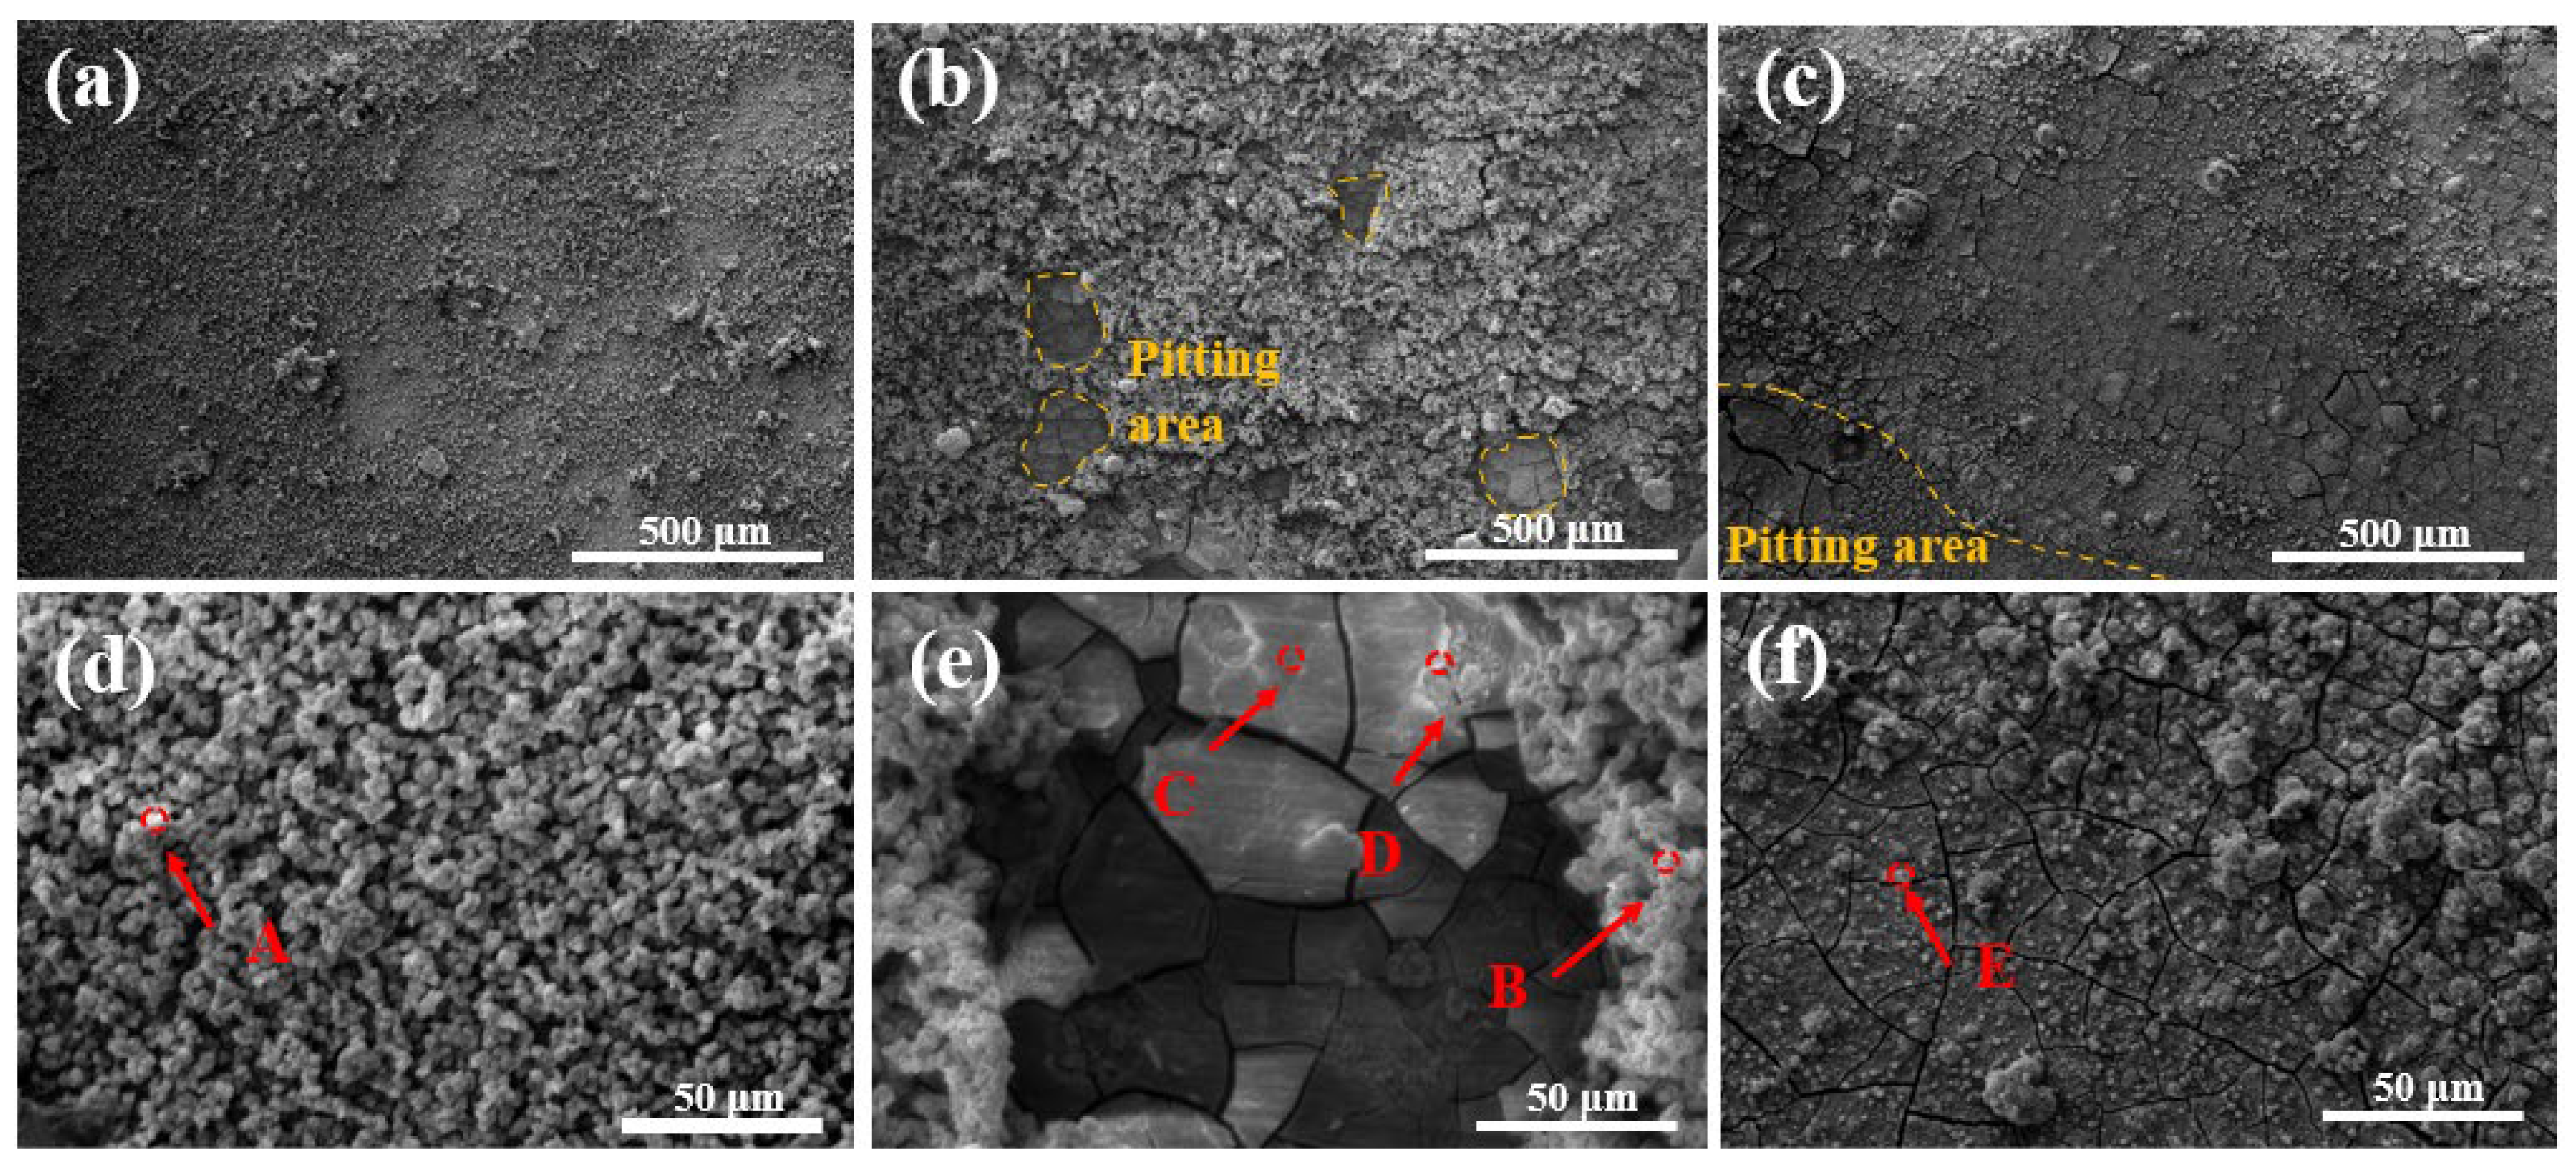
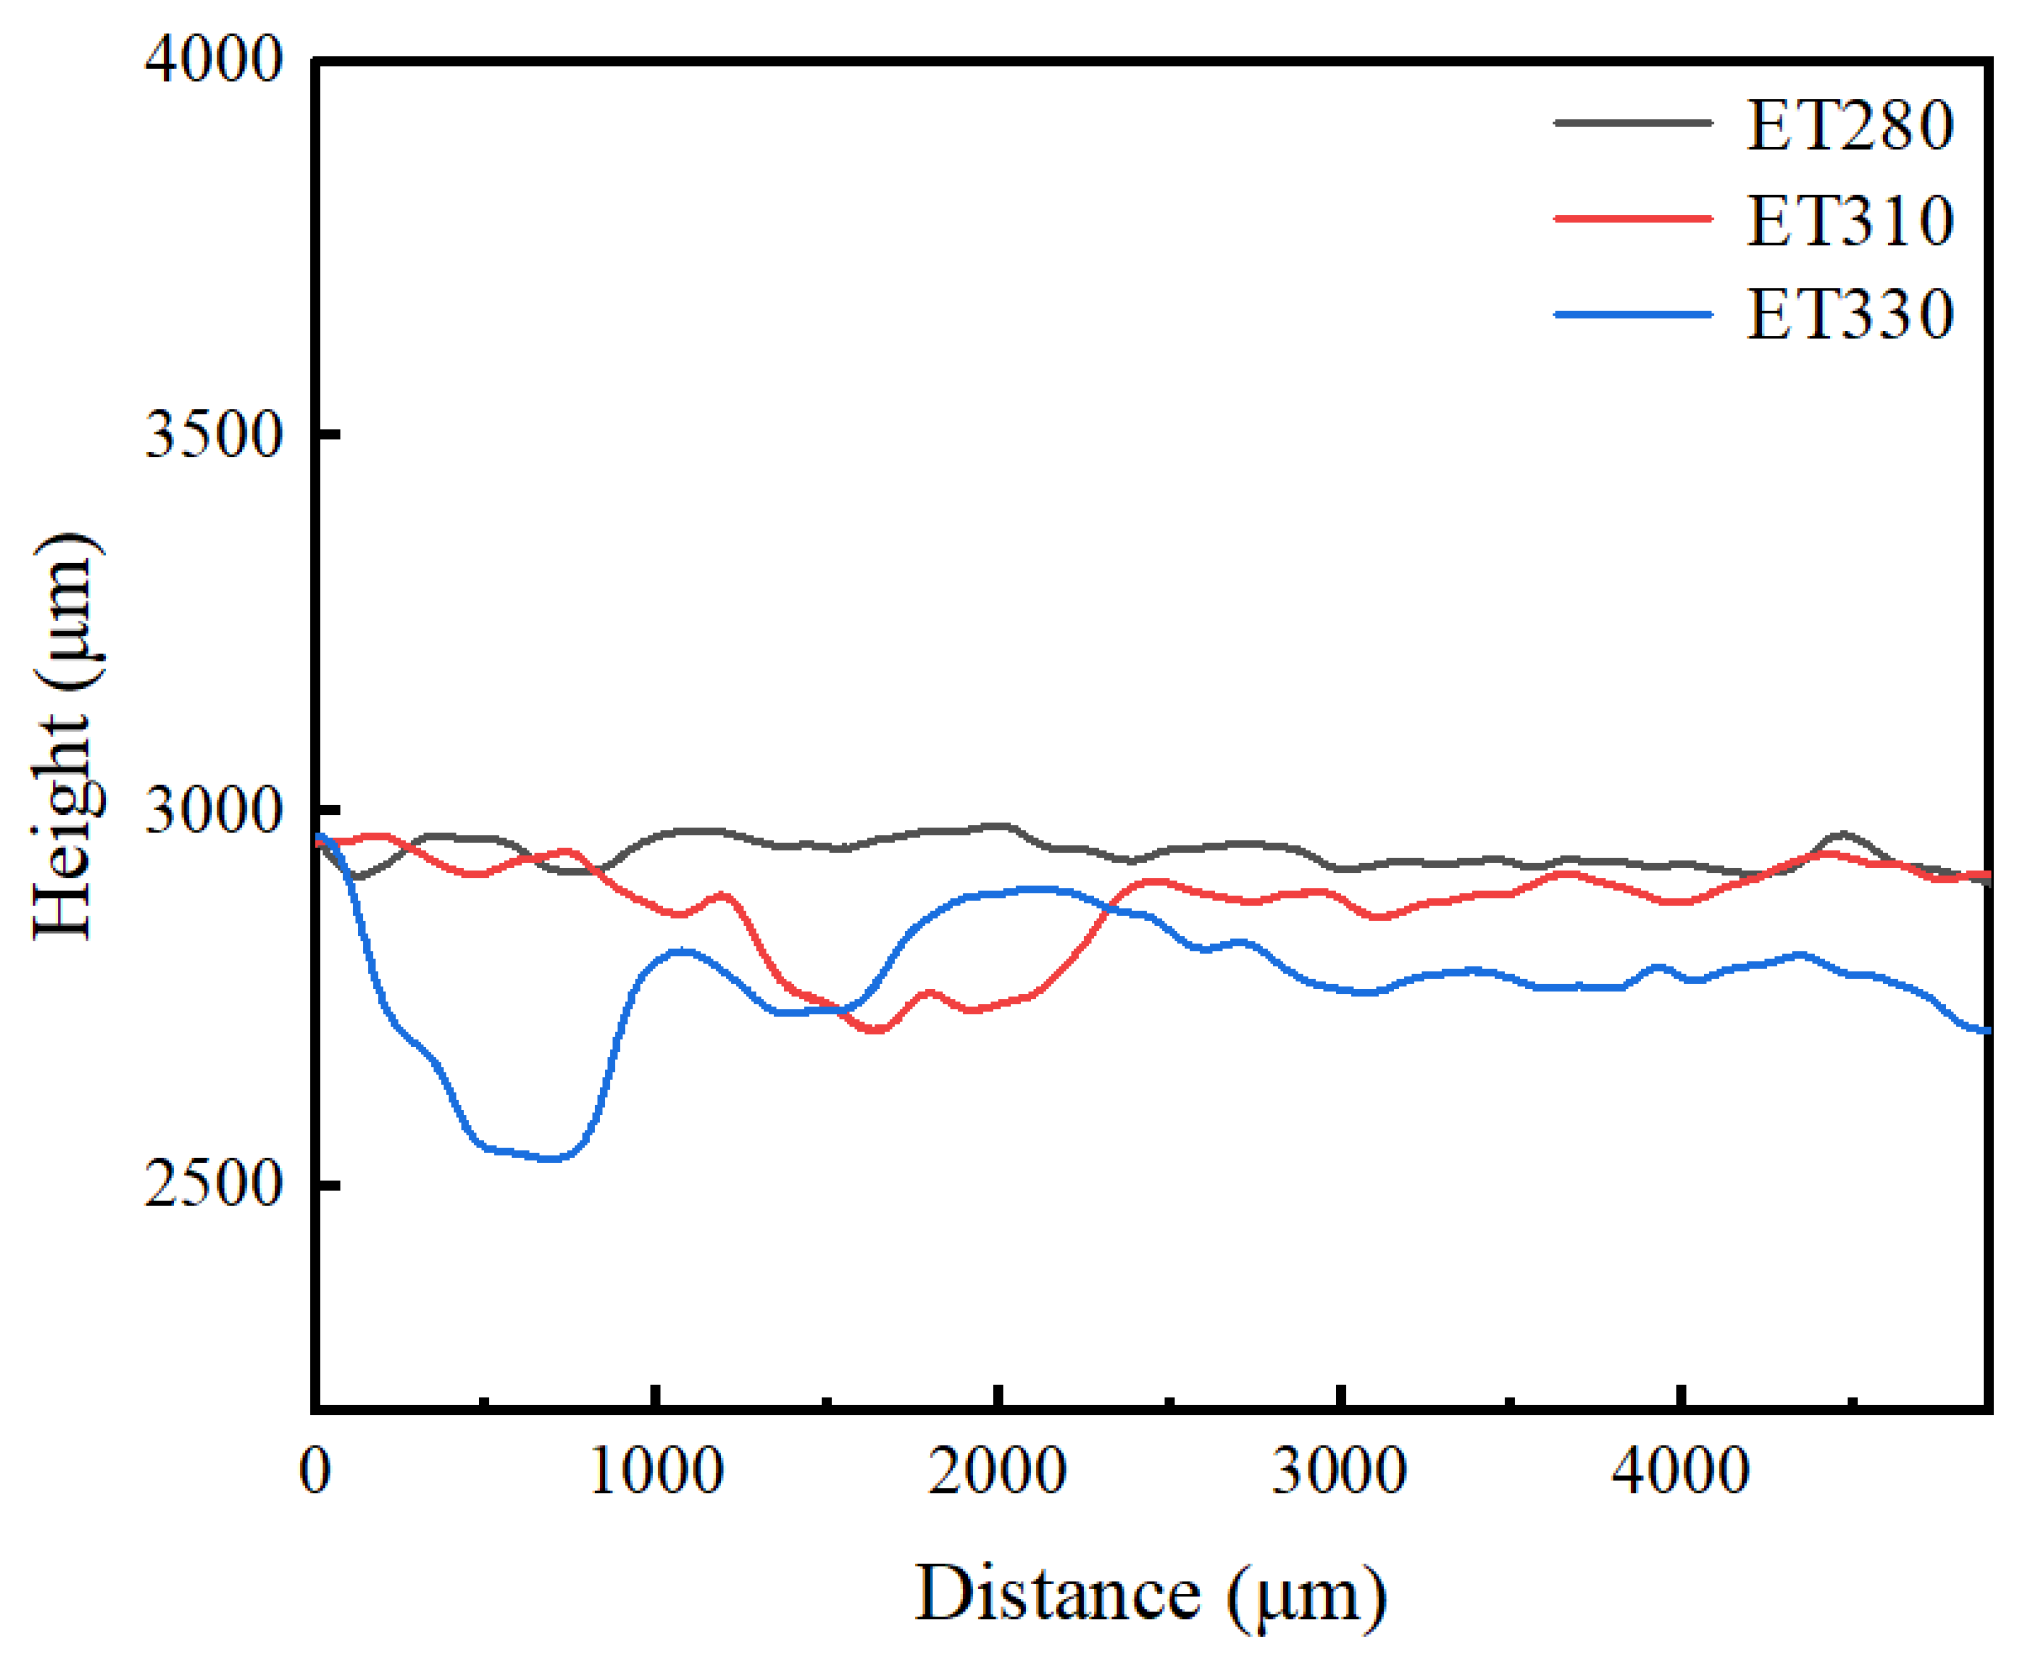
3.3. Corrosion Performance

Figure 7 shows the electrochemical test results of Mg-1Zn-0.4Ca-1MgO composites at different extrusion temperatures in Hank’s solution. Figure 7a,b show the fitting results of the polarization curves and impedance of the Mg-1Zn-0.4Ca-1MgO composites, respectively. The fitting data are displayed in Table 7. The corrosion potential (Ecorr) values of the three composites are close to each other, with the corrosion potential of −1.223 V for ZX3 being slightly lower than that of −1.200 V for ET280 and −1.198 V for ET310. It was reported that a higher corrosion potential indicates better protection of the substrate by the corrosion product layer on the surface of the Mg alloy [43]. Therefore, the reduction of extrusion temperature is favorable to improve the protection of the matrix by the corrosion product layer of Mg-1Zn-0.4Ca-1MgO composites. The annual corrosion rates of the three materials were calculated to be 0.46 mm/y, 0.68 mm/y, and 0.77 mm/y, respectively, according to Equation (2). From the polarization curves in Figure 7a, it can be seen that the cathodic reaction is controlled by hydrogen precipitation, while the anodic reaction is controlled by the substrate dissolution, and the corrosion current densities (Icorr) are extrapolated from the Tafel region of the cathodic branch. Corrosion current density (Icorr) more intuitively reflects the corrosion performance of the material; the cathodic behavior of the three materials is basically the same, but the corrosion current density of ET280 (2.01 μA/cm2) is lower than that of ET310 (2.98 μA/cm2) and ET330 (3.35 μA/cm2). This indicates that in the early stage of corrosion, the corrosion product layer formed in ET280 is dense to protect the erosion of the substrate by the solution and reduce the hydrogen precipitation reaction of the material. From the impedance spectra in Figure 7b, it can be seen that the impedance arc radius of ET280 is much larger than that of ET310 and ET330. In electrochemical testing, the larger the impedance arc radius of a material, the lower the degradation rate of the material. Therefore, ET280 has the best corrosion resistance.
Figure 7c shows the equivalent circuit diagrams, where Rs represents the resistance of the electrolyte, and Rct and CPEct represent the capacitance and resistance, respectively, of the bilayers formed during the charge transfer process. Table 7 lists the parameters of each component in the circuit. The Rct of ET280 is almost twice as much as that of ET330, reaching 6832 Ω. This indicates that ET280 is less likely to lose electrons during electrochemical corrosion, and ET280 has better corrosion resistance. Meanwhile, the CPEct-C of ET280 is also higher than that of ET310 and ET330, which illustrates that the corrosion product layer formed on the surface of ET280 is denser and protects the substrate better as the electrochemical test proceeds.
Figure 8 shows the results of in vitro immersion of Mg-1Zn-0.4Ca-1MgO composites in Hank’s solution at different times. Figure 8a shows the annual corrosion rate calculated based on the weight loss method. At the beginning of immersion, the corrosion rate of the three materials is faster, and the annual corrosion rate of ET280 is 1.03 mm/y, which is lower than that of ET310 and ET330. The corrosion rate of the three materials tends to be stabilized after 7 days, and the annual corrosion rates of ET280, ET310, and ET330 are 0.17 mm/y, 0.37 mm/y, and 0.40 mm/y, respectively, after immersion for 14 days. Figure 8b shows the trend of the pH values of the three materials at different immersion times. The pH values increase rapidly for all three materials at the initial stage of immersion; ET280 has the smallest value. After 6 days of immersion, pH values increase slowly and keep a stable rise rate. Throughout the immersion process, the ET280 material consistently maintained the lowest annual corrosion rate and pH value.

4. Discussion

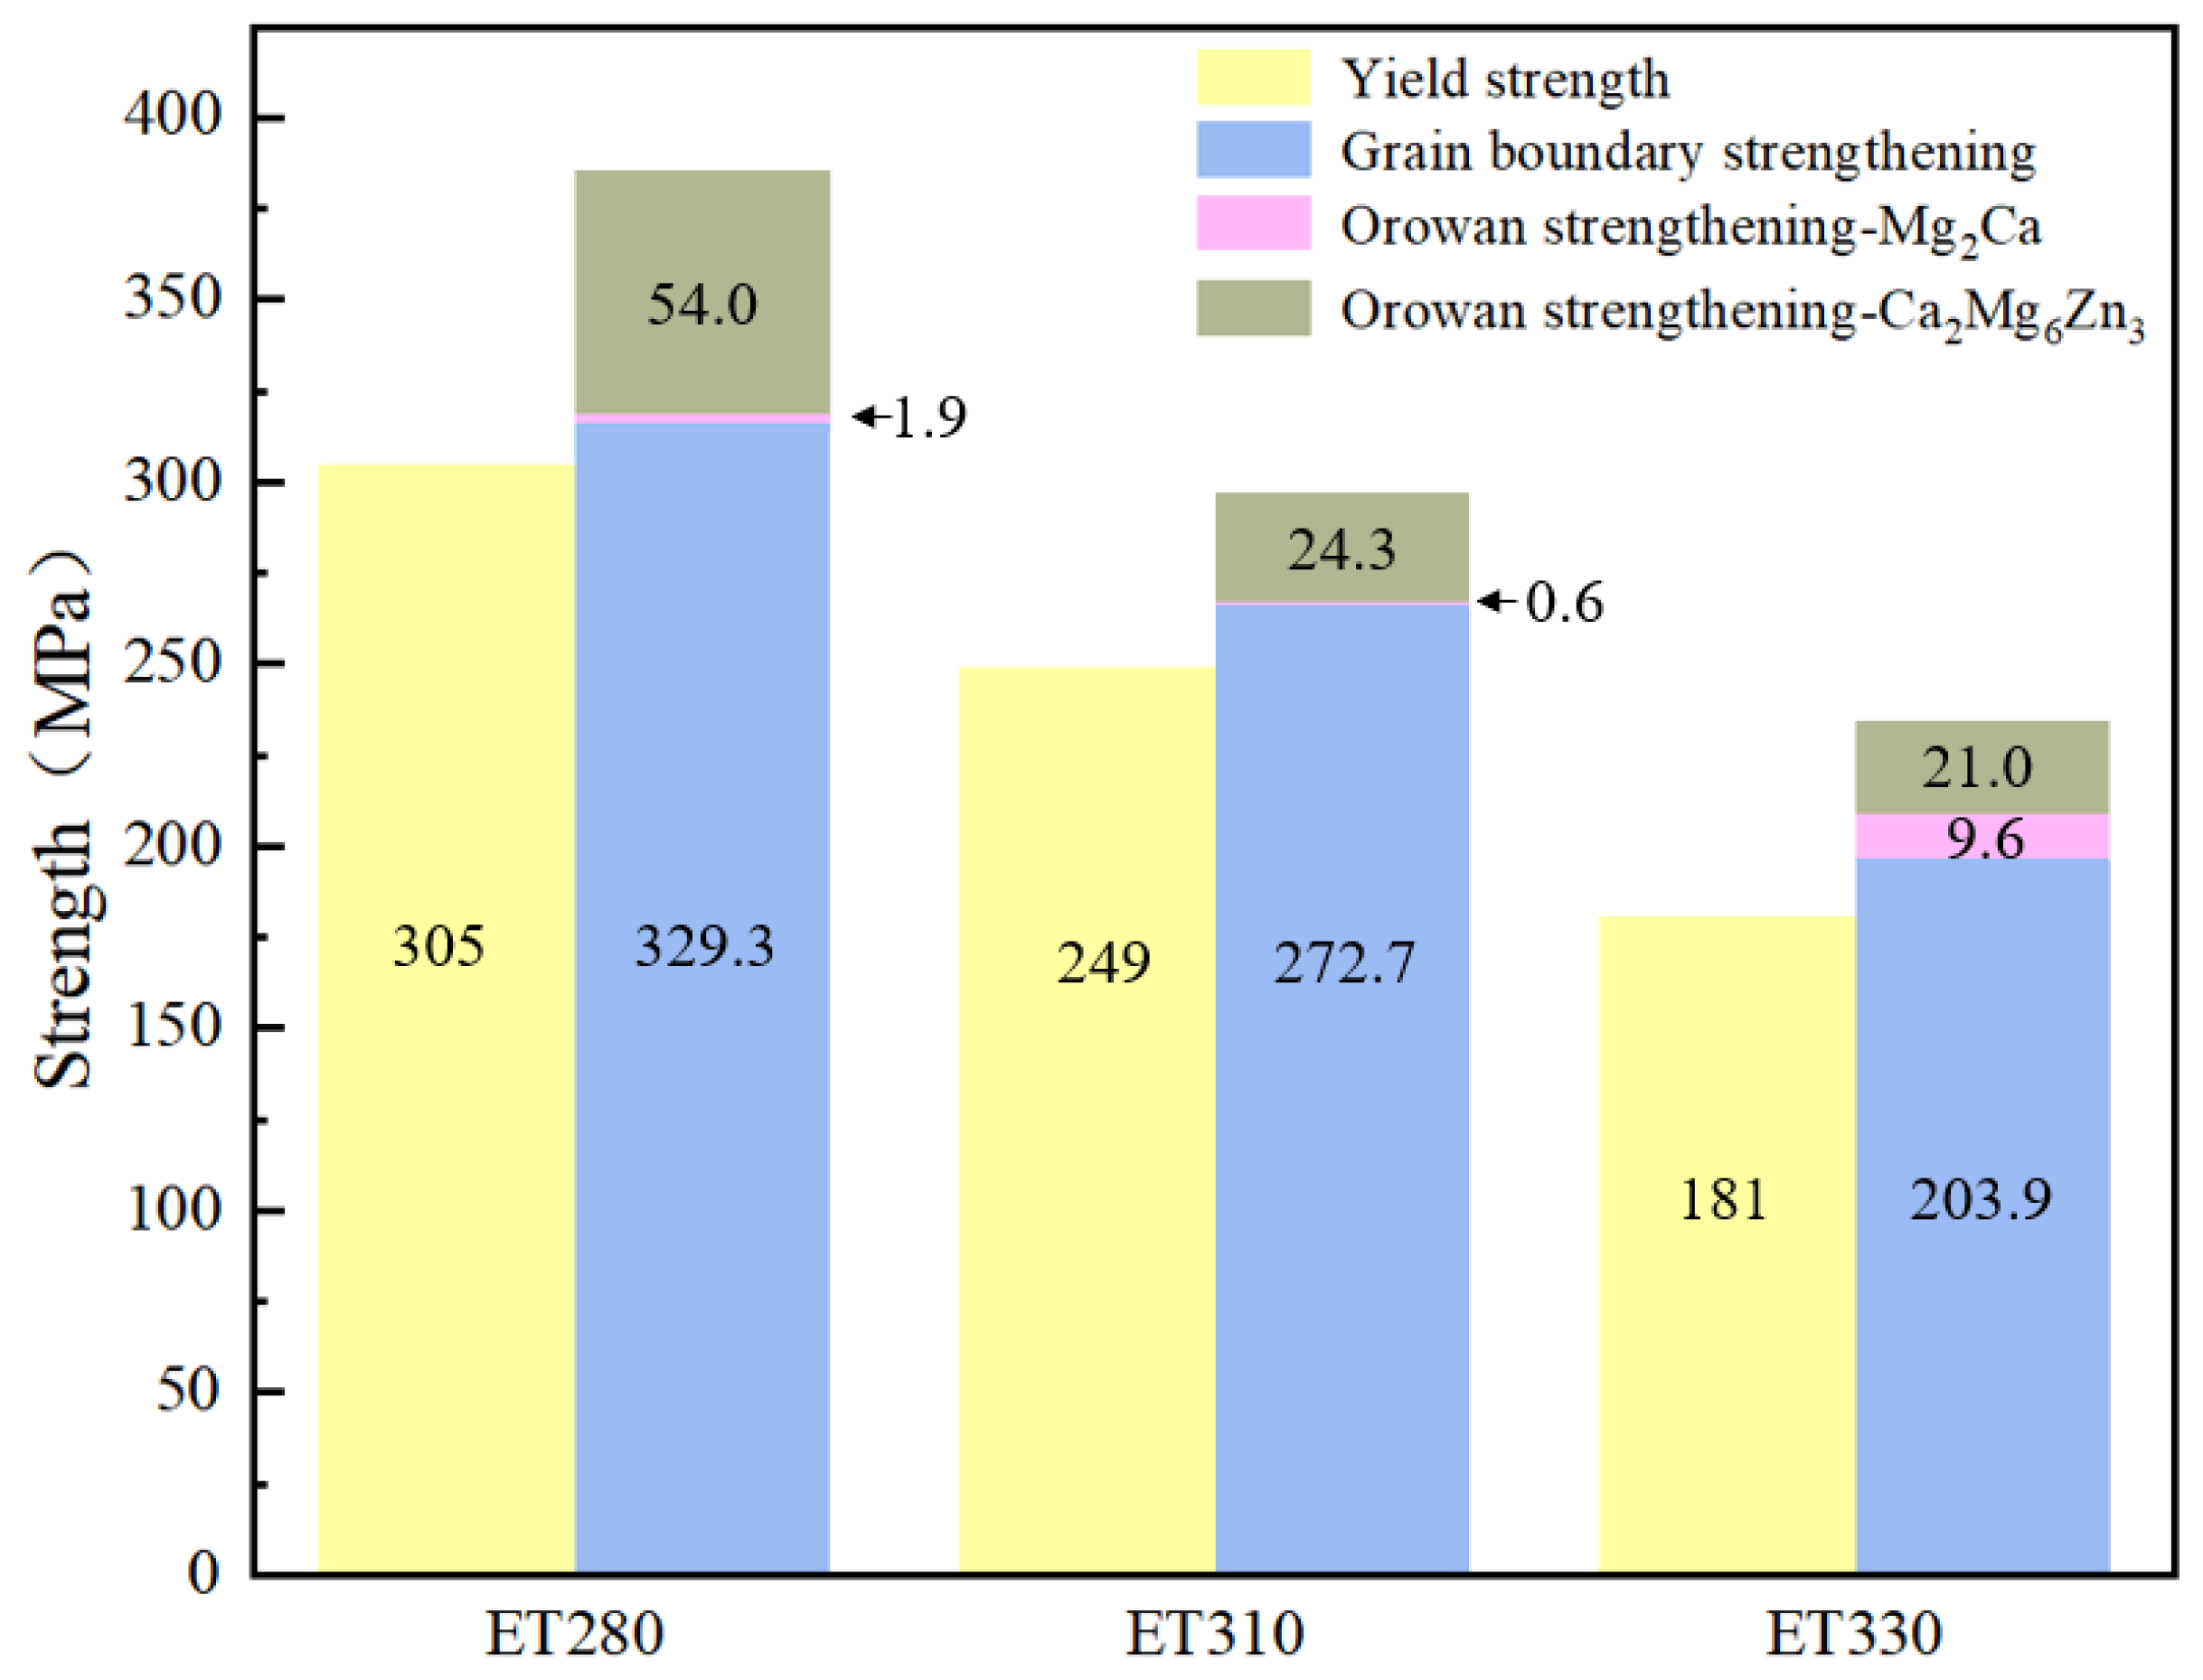
4.1. Mg-1Zn-0.4Ca-1MgO Mechanical Properties of Composites

Owing to the low content of alloying and the existence of second phases in the present three materials, the solid solution strengthening is limited. At the same time, the dislocation density in the extruded alloys is also extremely low [44]. Therefore, the solid solution strengthening and dislocation strengthening in the alloys can be neglected. The mechanical properties of the alloys are mainly determined by grain refinement and Orowan strengthening. Therefore, the strengthening mechanisms of alloys in the extruded state are mainly grain boundary strengthening and second-phase strengthening. Specific data are shown in Table 8.
The grain boundary strengthening can be calculated by the Hall–Page Equation (3) [45]:
σ H P = σ 0 + k · d 1 / 2
In Equation (3), k is a constant with a value of 210 MPa μm1/2, σ 0 denotes the friction of the dislocation sliding on the slip surface, which is 90 MPa for the Mg alloy. d is the average grain size.
The increase in strength due to Orowan strengthening [46] from the incorporation of MgO nanoparticles can be calculated using Equation (4):
σ O R = 0.4 M G b π 1 v     1 d p 4 π f 1     l n d p b
In this context, M represents the Taylor factor, valued at 6.5; b is the Burgers vector for the Mg-based composite b = 0.321 nm; G = 16.5 GPa is the shear modulus of the Mg matrix; v = 0.35 is the Poisson’s ratio for Mg. Additionally, f and dp denote the volume fraction and average dynamic recrystallized grain size of the nanoscale MgO particles, respectively.
As shown in Table 8, the grain boundary strengthening effects of the three alloys were 329.3 MPa, 272.7 MPa, and 203.9 MPa, respectively. It can be concluded that the grain size of ET280 and ET310 decreased significantly with the decrease in the extrusion temperature, while the increase in the grain boundary density increased to the degree of grain boundary strengthening. From the calculated data in Table 8, the Orowan strengthening of the Mg2Ca phase has the strongest effect on ET330 at 9.6 MPa, compared to 1.9 MPa and 0.6 MPa for ET280 and ET310, respectively, which is attributed to the fact that the size of the Mg2Ca phase in ET330 is small (as shown in Table 5), and the dislocations have a larger radius of curvature when they go round, thus resulting in a larger stress elevation. In contrast, the Orowan strengthening effect of the Ca2Mg6Zn3 phase is more pronounced, with an increase of 54.0 MPa, 24.3 MPa, and 21.0 MPa for the three materials, respectively. The Ca2Mg6Zn3 phase, which is more abundant and finely dispersed in ET280, has the best enhancement effect. Theoretical calculations show that the total Orowan strengthening of the second phase is 182.0 MPa, 94.4 MPa, and 30.6 MPa for ET280, ET310, and ET330 alloys, respectively. Therefore, the reduction of grain size and the fine, diffuse distribution of the second phase are the main reasons for the improvement of the mechanical properties of Mg-1Zn-0.4Ca-1MgO composites.
The theoretically calculated yield strength and the actual measured yield strength are shown in Figure 9. It shows that the difference between the actual strength and the calculated strength in ET280 is the largest among the three alloys. It can be seen that from Figure 3, there are parts of un-DRXed grains in ET280, and the area fraction reduced as the extrusion temperature increased. In general, the un-DRXed grains led to a strong basal texture, resulting in a high texture-strengthening effect.
The results of practical tests also verified this result. From the mechanical properties given in Table 6, it can be seen that ET280 exhibits the best UTS and YS as the extrusion temperature decreases, but the EL decreases slightly. The reason for this is that the high volume fraction of Mg2Ca and Ca2Mg6Zn3 in the ET280 alloy impeded the movement of dislocations during deformation, leading to the lowest EL. As the extrusion temperature increased, the volume fraction decreased obviously, especially for the ET330 alloy, and theoretically, its EL will be much higher than that of the ET280 alloy. However, it was increased slightly. This was mainly attributed to the large size of the second phase, where the stress concentration would be generated and become the origin of the crack source. In addition, the coarse grain size is detrimental to the improvement of the ductility of ET330. Therefore, the ET310 and ET330 alloys exhibited similar EL. It is noted that the work-hardening ability of ET310 and ET330 alloys was higher than that of the ET280 alloy due to their high ability to store dislocations, especially in the first half during deformation. The smallest grain size in ET280 led to an increase in the number of grain boundaries, and the barrier effect of grain boundaries on dislocation was enhanced. Therefore, the dislocations were blocked when they met the grain boundary, resulting in the improvement of the strength of the material. However, in this condition, the movement of dislocations was difficult, and the dislocation proliferation and interaction during deformation were reduced, leading to the reduced work hardening ability.

4.2. Corrosion Mechanism of Mg-1Zn-0.4Ca-1MgO Composites

Based on the electrochemical test, the ET280 had a higher corrosion resistance than that of ET310 and ET330. Furthermore, the in vitro immersion test results were also consistent with the above corrosion rate. In order to understand the underlying corrosion mechanism of these three materials, the surface morphology of Mg-1Zn-0.4Ca-1MgO composites after 14 days of immersion in Hank’s solution was observed, as shown in Figure 10.
Figure 10a depicts the corrosion surface of ET280, and there is no obvious pitting, indicating a relatively uniform corrosion pattern. Figure 10d indicates that the surface is covered by a protective layer composed of Ca-P products and spherical Mg(OH)2. EDS analysis of point A, shown in Table 9, reveals that the elemental composition at this point consists of 25.31% Ca, 14.54% P, and 51.64% O, with a Ca:P ratio of 5:3, suggesting the presence of Ca10(PO4)6(OH) [47]. This suggests that the bright white spheres are Mg(OH)2 encapsulating Ca3Mg3(PO4)4, providing effective protection to the substrate through this dense protective layer. Figure 10b shows the corrosion surface morphology of ET310 and contains several small pitting areas, but most of the surface is covered by a dense layer of Mg(OH)2. The high-magnification image in Figure 10e reveals cracking within the protective layer of the pitting. EDS analysis at point B shows a similar elemental composition to point A, primarily consisting of Ca, P, and O. Further EDS analysis of the dark region C and the bright region D within the corrosion pits reveals that the Ca and P content at point C is relatively low, and only about 0.96% and 0.84%, respectively, while point D exhibited much higher concentrations of 26.62% Ca and 9.23% P. This indicates that the dark areas on the surface primarily consist of Mg(OH)2, while the bright areas represent the Ca-P deposit region. Figure 10c presents the corrosion surface morphology of ET330, and there is extensive cracking with prominent fissures forming irregularly sized fragments. Additionally, large pits are evident. Figure 10f further illustrates the morphology of the corrosion products, which are characterized by numerous cracks and a non-uniform distribution of spherical Mg(OH)2. EDS results at point E indicate a similar elemental distribution to point A, primarily comprising a mixture of Ca-P deposits and Mg(OH)2.
Figure 11 displays the cross-sectional SEM images and EDS results of Mg-1Zn-0.4Ca-1MgO composites after 14 days of immersion at different extrusion temperatures. The distribution of elements P, Ca, and O can be used to assess the thickness of the corrosion product layer. The distribution of carbon (C) represents the areas occupied by the resin used for sample fixation. Figure 11a shows the SEM image of the corrosion cross-section for ET280. It can be observed that the corrosion products accumulate tightly on the sample surface, forming a robust bond with the substrate. Notably, there are no distinct delamination phenomena within the corrosion layer. EDS mapping results indicate that the outer layer consists of a uniform and dense Ca-P deposit, while the inner layer is characterized by a substantial Mg(OH)2 deposition. This intact corrosion product layer effectively obstructs contact between the corrosive solution and the Mg substrate, significantly enhancing its corrosion resistance. The sectional corrosion product layer of ET310 in Figure 11b illustrates that there is typical pitting in this area, and the depth and width reach 64 μm and 185 μm, respectively. The element distribution confirms that the corrosion product layer consists of the upper Ca-P layer and the inner Mg(OH)2 layer. Meanwhile, the layer is dense, and the binding degree to the matrix is good. Figure 11c presents the SEM image of the cross-section corrosion product layer and the EDS mapping of ET330. It shows a thick corrosion layer; however, a clear delamination phenomenon is observed within the corrosion layer. EDS mapping results suggest that this delamination is primarily due to the loose bonding between the Ca-P deposit and the Mg(OH)2 layer. Consequently, although the thickness of corrosion products deposited in ET330 is higher than that of ET280 and ET310, the relatively loose drawback leads to poor protection on the matrix.
Figure 12 presents the surface morphology of Mg-1Zn-0.4Ca-1MgO composites without corrosion products after immersion for 7 and 14 days. Figure 12(a1–c1) illustrates the surface morphology after 7 days; Figure 12(c1) shows obvious local pitting and considerable pit depth. In contrast, Figure 12(a1) exhibits no noticeable pitting, and the height map in Figure 12(a2) reveals a relatively smooth surface, indicating nearly uniform corrosion. Figure 12(c2) demonstrates deeper pitting as indicated by the height map. Figure 12(d1–f1) displays the surface morphology after 14 days of immersion. Figure 12(d1) shows no significant deep corrosion pits, and there are only shallow surface corrosion features. The height map in Figure 12(d2) confirms a nearly uniform surface, indicating that ET280 experienced relatively uniform corrosion. Figure 12(f1) reveals that ET330’s surface morphology is similar to that of Figure 12(c1), with limited additional deepening of pits but an increase in the number of smaller pitting features. This indicates that the accumulation of corrosion products has provided better protection to the deeper pits, and the thickening of the corrosion layer effectively mitigated further pit expansion, which enhanced the protection of the substrate.
Figure 13 gives the comparison of surface flatness height maps after removing corrosion products after 14 days of immersion. The corrosion surface of ET280 is exceptionally flat, with virtually no pits, whereas ET330 exhibits a pronounced deep pit. The refinement of grain size and fine second phases contributes to a more uniform corrosion behavior, thereby enhancing overall corrosion resistance.
Figure 14 illustrates the degradation mechanisms of Mg-1Zn-0.4Ca-1MgO composites at different extrusion temperatures. Figure 14a depicts the corrosion process of ET280. The denser grain boundaries contribute to a more uniform corrosion profile, where the fine grain structure provides a solid foundation for the deposition of corrosion products, facilitating the formation of a protective layer. Additionally, the conversion of MgO nanoparticles to Mg(OH)2 enhances protection against crack propagation. The uniformly small second phases formed under low-temperature extrusion reduce the likelihood of pitting, promoting more uniform corrosion. Figure 14c presents the corrosion process for ET330. The poor corrosion resistance of the ET330 alloy was attributed to the high lattice distortion and large grain size. The lattice distortion was caused by the high solution of alloying elements in the matrix. This was because fewer alloying elements would precipitate due to the high extrusion temperature. In this condition, more alloying elements were retained in the matrix, leading to high lattice distortion. For the ET330 alloy with a relatively large grain size, the corrosion eroded quickly along the grain boundaries, while grain interior corrosion was slow, leading to local corrosion. In summary, low-temperature extrusion promotes uniform corrosion through grain refinement and the even distribution of the second phase. The fine grains allow for the rapid formation of a dense corrosion product layer during the initial stages of corrosion, significantly enhancing corrosion resistance.

5. Conclusions

This study compares the microstructure, mechanical properties, and corrosion resistance of Mg-1Zn-0.4Ca-1MgO composite materials processed at different extrusion temperatures so as to explore the mechanisms behind the performance of ultrafine-grained materials. The main conclusions are as follows:
  • Extrusion temperature significantly affects the grain size and second phase of Mg-1Zn-0.4Ca-1MgO composite materials. At lower temperatures, the grain size decreases, and a large number of nanoscale second-phase particles precipitate in the matrix. Specifically, as the extrusion temperature increases from 280 °C to 330 °C, the grain size increases from 0.77 μm to 3.44 μm, and a fully recrystallized structure was obtained at 330 °C.
  • ET280 extruded at 280 °C achieves tensile strength, yield strength, and elongation of 312 MPa, 305 MPa, and 15.2%, respectively. The highest microhardness of 86.9 HV was also obtained among the three materials extruded at different temperatures. Grain refinement and increased fine second-phase content are the main reasons for the improved performance.
  • In electrochemical tests, ET280 exhibits a corrosion potential and current density of −1.2 V and 2.01 μA/cm2, respectively, indicating good corrosion resistance. Meanwhile, the annual corrosion rate after 14 days of immersion is only 0.14 mm/y for ET280, which is lower than that of ET310 and ET330. It is consistent with the electrochemical results. The combination of the rapidly forming layers of corrosion products in the early stages of corrosion and the dense Ca-P and Mg(OH)2 product layers in the later stage contributed to the good corrosion resistance of ET280.

Author Contributions

S.G.: Conceptualization, Data curation, Writing—review and editing, Writing—original draft, Validation, Software, Investigation, Methodology, S.L.: Conceptualization, Methodology, Resources, Supervision, Validation, Visualization, Writing—review and editing. Q.Z.: Conceptualization, Formal analysis, Investigation, Methodology, M.C.: Conceptualization, Funding acquisition, Project administration, Supervision, Visualization, Writing—original draft, Writing—review and editing. All authors have read and agreed to the published version of the manuscript.

Funding

This work was supported by the National Natural Science Foundation of China (No. 52171241 and 52201301), Tianjin Nature Science Foundation (22JCQNJC00750), Science and Technology Correspondent Project of Tianjin (24YDTPJC00180) and Chongqing Postdoctoral Science Special Foundation (2022CQBSHTB3025).

Data Availability Statement

The original contributions presented in this study are included in the article. Further inquiries can be directed to the corresponding authors.

Conflicts of Interest

The authors declare no conflict of interest.

References

  1. Dong, J.; Lin, T.; Shao, H.; Wang, H.; Wang, X.; Song, K.; Li, Q. Advances in degradation behavior of biomedical magnesium alloys: A Review. J. Alloys Compd. 2022, 908, 164600. [Google Scholar]
  2. Zreiqat, H.; Howlett, C.R.; Zannettino, A.; Evans, P.; Schulze-Tanzil, G.; Knabe, C.; Shakibaei, M. Mechanisms of magnesium-stimulated adhesion of osteoblastic cells to commonly used orthopaedic implants. J. Biomed. Mater. Res. 2002, 62, 175–184. [Google Scholar] [PubMed]
  3. Yamasaki, Y.; Yoshida, Y.; Okazaki, M.; Shimazu, A.; Kubo, T.; Akagawa, Y.; Uchida, T. Action of fgmgco3Ap-collagen composite in promoting bone formation. Biomaterials 2003, 24, 4913–4920. [Google Scholar] [CrossRef] [PubMed]
  4. Yamasaki, Y.; Yoshida, Y.; Okazaki, M.; Shimazu, A.; Uchida, T.; Kubo, T.; Akagawa, Y.; Hamada, Y.; Takahashi, J.; Matsuura, N. Synthesis of functionally graded MgCO3 apatite accelerating osteoblast adhesion. J. Biomed. Mater. Res. 2002, 62, 99–105. [Google Scholar]
  5. Chen, J.; Tan, L.; Yu, X.; Etim, I.P.; Ibrahim, M.; Yang, K. Mechanical properties of magnesium alloys for medical application: A Review. J. Mech. Behav. Biomed. Mater. 2018, 87, 68–79. [Google Scholar] [CrossRef]
  6. Shi, Y.; Qi, M.; Chen, Y.; Shi, P. Mao-Dcpd composite coating on Mg alloy for degradable implant applications. Mater. Lett. 2011, 65, 2201–2204. [Google Scholar]
  7. Cao, X.; Xu, C.; Zhang, Z.; Yang, W.; Zhang, J. Effect of I-Phase morphology and microstructure transformation in biomedical Mg-3Zn-1Mn-1Y alloys on vitro degradation behavior in dynamic simulated body fluid. J. Mater. Sci. 2021, 56, 12394–12411. [Google Scholar]
  8. Zhao, D.; Witte, F.; Lu, F.; Wang, J.; Li, J.; Qin, L. Current status on clinical applications of magnesium-based orthopaedic implants: A Review From Clinical Translational Perspective. Biomaterials 2017, 112, 287–302. [Google Scholar]
  9. Saris, N.L.; Mervaala, E.; Karppanen, H.; Khawaja, J.A.; Lewenstam, A. Magnesium: An update on physiological, clinical and analytical aspects. Clin. Chim. Acta 2000, 294, 1–26. [Google Scholar]
  10. Williams, K.; Sobol, R.W. Mutation research/fundamental and molecular mechanisms of mutagenesis: Special issue: DNA repair and genetic instability. Mutat. Res./Fundam. Mol. Mech. Mutagen. 2013, 743–744, 1–3. [Google Scholar]
  11. Niranjan, C.A.; Raghavendra, T.; Rao, M.P.; Siddaraju, C.; Gupta, M.; Jain, V.K.S.; Aishwarya, R. Magnesium alloys as extremely promising alternatives for temporary orthopedic implants—A Review. J. Magnes. Alloys 2023, 11, 2688–2718. [Google Scholar] [CrossRef]
  12. Wang, J.L.; Xu, J.K.; Hopkins, C.; Chow, D.H.K.; Qin, L. Biodegradable magnesium-based implants in orthopedics—A general review and perspectives. Adv. Sci. 2020, 7, 1902443. [Google Scholar] [CrossRef] [PubMed]
  13. Song, Y.; Yuan, K.; Li, X.; Qiao, Y. Microstructure and properties of biomedical Mg-Zn-Ca alloy at different extrusion temperatures. Mater. Today Commun. 2023, 35, 105578. [Google Scholar] [CrossRef]
  14. Kumar, N.; Duhan, R.K.; Kandpal, B.C. Stir casting technology for fabrication of biodegradable magnesium metal matrix composites containing different percentages of hydroxyapatite reinforcement material for biomedical purposes. Mater. Today Proc. 2023, 10, 058. [Google Scholar] [CrossRef]
  15. Li, N.; Zheng, Y. Novel magnesium alloys developed for biomedical application: A Review. J. Mater. Sci. Technol. 2013, 29, 489–502. [Google Scholar] [CrossRef]
  16. Kubásek, J.; Vojtěch, D. Structural characteristics and corrosion behavior of biodegradable Mg–Zn, Mg–Zn–Gd alloys. J. Mater. Sci. Mater. Med. 2013, 24, 1615–1626. [Google Scholar] [CrossRef]
  17. Cai, S.; Lei, T.; Li, N.; Feng, F. Effects of Zn on microstructure, mechanical properties and corrosion behavior of Mg–Zn Alloys. Mater. Sci. Eng. C 2012, 32, 2570–2577. [Google Scholar] [CrossRef]
  18. Yin, P.; Li, N.F.; Lei, T.; Liu, L.; Ouyang, C. Effects of Ca on microstructure, mechanical and corrosion properties and biocompatibility of Mg–Zn–Ca alloys. J. Mater. Sci. Mater. Med. 2013, 24, 1365–1373. [Google Scholar] [CrossRef]
  19. Pulido-González, N.; Torres, B.; García-Rodríguez, S.; Rodrigo, P.; Bonache, V.; Hidalgo-Manrique, P.; Mohedano, M.; Rams, J. Mg–1Zn–1Ca alloy for biomedical applications. Influence of the secondary phases on the mechanical and corrosion behaviour. J. Alloys Compd. 2020, 831, 154735. [Google Scholar] [CrossRef]
  20. Du, Y.; Du, W.; Zhang, D.; Ge, Y.; Jiang, B. Enhancing mechanical properties of an Mg–Zn–Ca alloy via extrusion. Mater. Sci. Technol. 2021, 37, 624–631. [Google Scholar] [CrossRef]
  21. Kang, Q.; Jiang, H.; Zhang, Y.; Xu, Z.; Li, H.; Xia, Z. Effect of various Ca content on microstructure and fracture toughness of extruded Mg-2Zn alloys. J. Alloys Compd. 2018, 742, 1019–1030. [Google Scholar]
  22. Yurchenko, N.Y.; Stepanov, N.D.; Salishchev, G.A.; Serebryany, V.N.; Martynenko, N.S.; Lukyanova, E.A.; Rokhlin, L.L.; Birbilis, N.; Dobatkin, S.V.; Estrin, Y.Z. Effect of multiaxial deformation on structure, mechanical properties, and corrosion resistance of a Mg-Ca alloy. J. Magnes. Alloys 2022, 10, 266–280. [Google Scholar]
  23. Zeng, R.; Qi, W.; Cui, H.; Zhang, F.; Li, S.; Han, E. In vitro corrosion of as-extruded Mg–Ca alloys—The influence of Ca concentration. Corros. Sci. 2015, 96, 23–31. [Google Scholar] [CrossRef]
  24. Bakhsheshi-Rad, H.R.; Abdul-Kadir, M.R.; Idris, M.H.; Farahany, S. Relationship between the corrosion behavior and the thermal characteristics and microstructure of Mg–0.5Ca–xZn alloys. Corros. Sci. 2012, 64, 184–197. [Google Scholar]
  25. Wang, J.; Ferdowsi, M.R.G.; Kada, S.R.; Hutchinson, C.R.; Barnett, M.R. Influence of precipitation on yield elongation in Mg-Zn alloys. Scr. Mater. 2019, 160, 5–8. [Google Scholar]
  26. Radha, R.; Sreekanth, D. Insight of magnesium alloys and composites for orthopedic implant applications—A Review. J. Magnes. Alloys 2017, 5, 286–312. [Google Scholar] [CrossRef]
  27. Yim, C.D.; Kim, Y.M.; You, B.S. Effect of Ca addition on the corrosion resistance of gravity cast AZ31 magnesium alloy. Mater. Trans. 2007, 48, 1023–1028. [Google Scholar]
  28. Ma, Y.; Yang, C.; Liu, Y.; Yuan, F.; Liang, S.; Li, H.; Zhang, J. Microstructure, mechanical, and corrosion properties of extruded low-alloyed Mg-xZn-0.2Ca alloys. Int. J. Miner. Metall. Mater. 2019, 26, 1274–1284. [Google Scholar]
  29. Guan, H.; Xiao, H.; Ouyang, S.; Tang, A.; Chen, X.; Tan, J.; Feng, B.; She, J.; Zheng, K.; Pan, F. A review of the design, processes, and properties of Mg-based composites. Nanotechnol. Rev. 2022, 11, 712–730. [Google Scholar] [CrossRef]
  30. Chen, H.; Yuan, B.; Zhao, R.; Yang, X.; Xiao, Z.; Aurora, A.; Iulia, B.A.; Zhu, X.; Iulian, A.V.; Zhang, X. Evaluation on the corrosion resistance, antibacterial property and osteogenic activity of biodegradable Mg-Ca and Mg-Ca-Zn-Ag alloys. J. Magnes. Alloys 2022, 10, 3380–3396. [Google Scholar]
  31. Zhao, J.; You, C.; Chen, M.; Lyu, S.; Tie, D.; Liu, H. Effect of calcium oxide particle size on microstructure and properties of AZ91 Mg alloy. J. Alloys Compd. 2021, 886, 160970. [Google Scholar]
  32. Gu, X.; Zhou, W.; Zheng, Y.; Dong, L.; Xi, Y.; Chai, D. Microstructure, mechanical property, bio-corrosion and cytotoxicity evaluations of Mg/HA composites. Mater. Sci. Eng. C 2010, 30, 827–832. [Google Scholar]
  33. Lin, G.; Liu, D.; Chen, M.; You, C.; Li, Z.; Wang, Y.; Li, W. Preparation and characterization of biodegradable Mg-Zn-Ca/MgO nanocomposites for biomedical applications. Mater. Charact. 2018, 144, 120–130. [Google Scholar]
  34. Tang, C.; Lyu, S.; Zhao, Z.; Chen, M. Effects of MgO nano particles on the mechanical properties and corrosion behavior of Mg–Zn–Ca alloy. Mater. Chem. Phys. 2023, 297, 127380. [Google Scholar]
  35. Fan, Z.; Gao, F.; Wang, Y.; Wang, S.H.; Patel, J.B. Grain refinement of Mg-alloys by native MgO particles: An Overview. J. Magnes. Alloys 2022, 10, 2919–2945. [Google Scholar] [CrossRef]
  36. Zhao, Q.; Lyu, S.; Zhang, G.; Chen, M. Effect of MgO contents on the microstructure, mechanical properties and corrosion behavior of low-alloyed Mg-Zn-Ca alloy. Metals 2024, 14, 274. [Google Scholar] [CrossRef]
  37. Zhao, S.; Yan, L.; Li, X.; Zhang, Z.; Sun, Y.; Wang, J. Notoginsenoside R1 suppresses wear particle-induced osteolysis and rankl mediated osteoclastogenesis in vivo and in vitro. Int. Immunopharmacol. 2017, 47, 118–125. [Google Scholar]
  38. Wang, H.; Zhang, D.T.; Qiu, C.; Zhang, W.W.; Chen, D.L. Microstructure and tensile properties of a low-alloyed magnesium alloy: Effect of extrusion temperature. J. Mater. Sci. 2023, 58, 13502–13517. [Google Scholar]
  39. Hu, H.; Ying, Y.; Zhang, D. Relationship between extrusion temperature and corrosion resistance of magnesium alloy AZ61. Mater. Test. 2018, 60, 325–332. [Google Scholar] [CrossRef]
  40. GB/T 16865-2013; National Standard of the People’s Republic of China. Standardization Administration of PRC (SAC): Beijing, China, 2017.
  41. ASTM G31-72; Standard Practice for Laboratory Immersion Corrosion Testing of Metals. American Society for Testing and Materials: West Conshohocken, PA, USA, 2004.
  42. Fu, J.; Du, W.; Liu, K.; Du, X.; Zhao, C.; Liang, H.; Mansoor, A.; Li, S.; Wang, Z. Effect of the Ca2Mg6Zn3 phase on the corrosion behavior of biodegradable Mg-4.0Zn-0.2Mn-xCa alloys in Hank’s solution. Materials 2022, 15, 2079. [Google Scholar] [CrossRef]
  43. Li, S.; Sun, B. Preparation of corrosion-resistant surface of magnesium alloy and its performance study. Mater. Res. Express 2023, 10, 96402. [Google Scholar] [CrossRef]
  44. Fu, Z.; Wang, Z.; Li, G.; Yao, Y.; Yu, H.; Liu, Y.; Zheng, T.; Xiong, H. Microstructure, mechanical and corrosion properties of Mg-1.61Al-1.76Ca alloy under different extrusion temperatures. J. Mater. Eng. Perform. 2020, 29, 672–680. [Google Scholar] [CrossRef]
  45. Nie, K.; Guo, Y.; Munroe, P.; Deng, K.; Kang, X. Microstructure and tensile properties of magnesium matrix nanocomposite reinforced by high mass fraction of nano-sized particles including TiC and MgZn2. J. Alloys Compd. 2020, 819, 153348. [Google Scholar] [CrossRef]
  46. Habibi, M.K.; Joshi, S.P.; Gupta, M. Hierarchical magnesium nano-composites for enhanced mechanical response. Acta Mater. 2010, 58, 6104–6114. [Google Scholar] [CrossRef]
  47. Bowen, P.K.; Drelich, J.; Goldman, J. Magnesium in the murine artery: Probing the products of corrosion. Acta Biomater. 2014, 10, 1475–1483. [Google Scholar] [CrossRef]
Figure 1. Theoretical simulated phase diagrams of Mg-1Zn-0.4Ca alloy.
Metals 15 00337 g001
Figure 2. (a) Schematic diagram of alloy preparation, (b) Squeeze diagram.
Metals 15 00337 g002
Figure 3. The OM microstructure of Mg-1Zn-0.4Ca-1MgO composites at various extrusion temperatures: (a,d) ET280, (b,e) ET310, and (c,f) ET330.
Metals 15 00337 g003
Figure 4. XRD diffraction patterns of Mg-1Zn-0.4Ca-1MgO composites at different extrusion temperatures (a) full XRD spectrum and (b,c) enlarged regions A and B in (a).
Metals 15 00337 g004
Figure 5. SEM images of Mg-1Zn-0.4Ca-1MgO composites under various extrusion temperatures, with (a1a3) ET280, (b1b3) ET310, and (c1c3) ET330.
Metals 15 00337 g005
Figure 6. The mechanical properties of extruded Mg-1Zn-0.4Ca-1MgO composites. (a) Tensile stress-strain curves, (b) microhardness.
Metals 15 00337 g006
Figure 7. The electrochemical results for extruded Mg-1Zn-0.4Ca-1MgO composites, including (a) the dynamic potential polarization curves, (b) the impedance plots, and (c) the equivalent circuit.
Metals 15 00337 g007
Figure 8. In vitro immersion tests for extruded Mg-1Zn-0.4Ca-1MgO composites, including (a) the average annual corrosion rates and (b) the pH values during the immersion experiments.
Metals 15 00337 g008
Figure 9. Comparison of YS between the experimental data and theoretical data.
Metals 15 00337 g009
Figure 10. The morphology of corrosion products for extruded Mg-1Zn-0.4Ca-1MgO composites after 14 days of immersion in Hank’s solution. (a,d) ET280, (b,e) ET310, and (c,f) ET330. A–E are EDS results for different locations.
Metals 15 00337 g010
Figure 11. SEM images and EDS elemental distribution of the cross-sections of samples after 14 days of immersion in Hank’s solution. (a) ET280, (b) ET310, and (c) ET330. The yellow dotted line marks the corrosion product layer.
Metals 15 00337 g011
Figure 12. Surface micrographs of extruded Mg-1Zn-0.4Ca-1MgO composites after removing corrosion products following 7 and 14 days of immersion. (a1c1) are macroscopic morphology maps after 7 days of immersion, (a2c2) are corresponding body height maps, (d1f1) are macroscopic morphology maps after 14 days of immersion, and (d2f2) are corresponding body height maps.
Metals 15 00337 g012
Figure 13. Surface topography of extruded Mg-1Zn-0.4Ca-1MgO composites after 14 days of immersion.
Metals 15 00337 g013
Figure 14. The degradation schematic diagram of extruded Mg-1Zn-0.4Ca-1MgO composites. (a) ET280, (b) ET310, and (c) ET330.
Metals 15 00337 g014
Table 1. Extrusion process parameters of the composites.
SamplesExtrusion Temperature (°C)Extrusion Speed (mm/s)Extrusion Ratio
ET280280229:1
ET310310229:1
ET330330229:1
Table 2. Chemical compositions of etching fluid.
Reagent NameC6H₃N₃O₇C2H5OHCH₃COOHH2O
Content2.75 g45 mL15 mL5 mL
Table 3. Content of constituents in 1 L of Hank’s solution (g/L).
ReagentHank’s
NaCl8.00
MgSO4·7H2O0.10
KCl0.40
MgCl2·6H2O0.10
CaCl20.14
Na2HPO4·12H2O0.12
KH2PO40.06
C6H12O61.00
NaHCO30.35
Table 4. Different second-phase proportions correspond to different samples in Figure 5.
SamplesTotal Content of the Second Phase (%)Mg2Ca (%)Ca2Mg6Zn3 (%)
ET2802.16 ± 0.110.46 ± 0.061.70 ± 0.08
ET3101.51 ± 0.080.41 ± 0.041.10 ± 0.03
ET3300.28 ± 0.010.08 ± 0.010.20 ± 0.01
Table 5. The grain size of different samples and their corresponding second phase sizes are in Figure 5.
SamplesAverage Grain Size/μmAverage Mg2Ca Size/μmAverage Ca2Mg6Zn3 Size/nm
ET2800.77 ± 0.011.58 ± 0.1571.07 ± 1.75
ET3101.32 ± 0.013.07 ± 0.21139.45 ± 3.22
ET3303.44 ± 0.020.08 ± 0.0155.39 ± 1.82
Table 6. Mechanical properties of Mg-1Zn-0.4Ca-1MgO composites at different extrusion temperatures.
SamplesYield Strength (YS)Ultimate Tensile Strength (UTS)Elongation (EL)
ET28030531215.1
ET31024927115.2
ET33018124015.4
Table 7. The electrochemical test data for extruded Mg-1Zn-0.4Ca-1MgO composites at different extrusion temperatures.
SamplesEcorr (V)Icorr (μA/cm2)Rs (Ω)CPEct-CRct (Ω)CR (mm/y)
ET280−1.22.0140.484.126 × 10−568320.46
ET310−1.1982.9838.624.17 × 10−544840.68
ET330−1.2233.3553.352.320 × 10−532630.77
Table 8. Theoretical calculation values of yield strength enhancement by three strengthening mechanisms.
Samples Δ σ H P /MPa Δ σ O R M g 2 C a /MPa Δ σ O R C a 2 M g 6 Z n 3 /MPa Δ σ
ET280329.31.954.0385.2
ET310272.70.624.3297.6
ET330203.99.621.0234.5
Table 9. EDS energy spectrum data at different positions are in Figure 10.
PointsSamplesElements (at%)
MgZnCaPO
AET2808.240.2725.3114.5451.64
BET3102.040.2042.6115.3239.83
CET31042.150.730.960.8455.32
DET31012.080.4326.629.2351.64
EET33010.800.3621.0712.0055.77
Disclaimer/Publisher’s Note: The statements, opinions and data contained in all publications are solely those of the individual author(s) and contributor(s) and not of MDPI and/or the editor(s). MDPI and/or the editor(s) disclaim responsibility for any injury to people or property resulting from any ideas, methods, instructions or products referred to in the content.

