
Influence of Y/Zn Ratio on Secondary Phase Strengthening of Mg-Y-Zn Alloy

Abstract
:1. Introduction
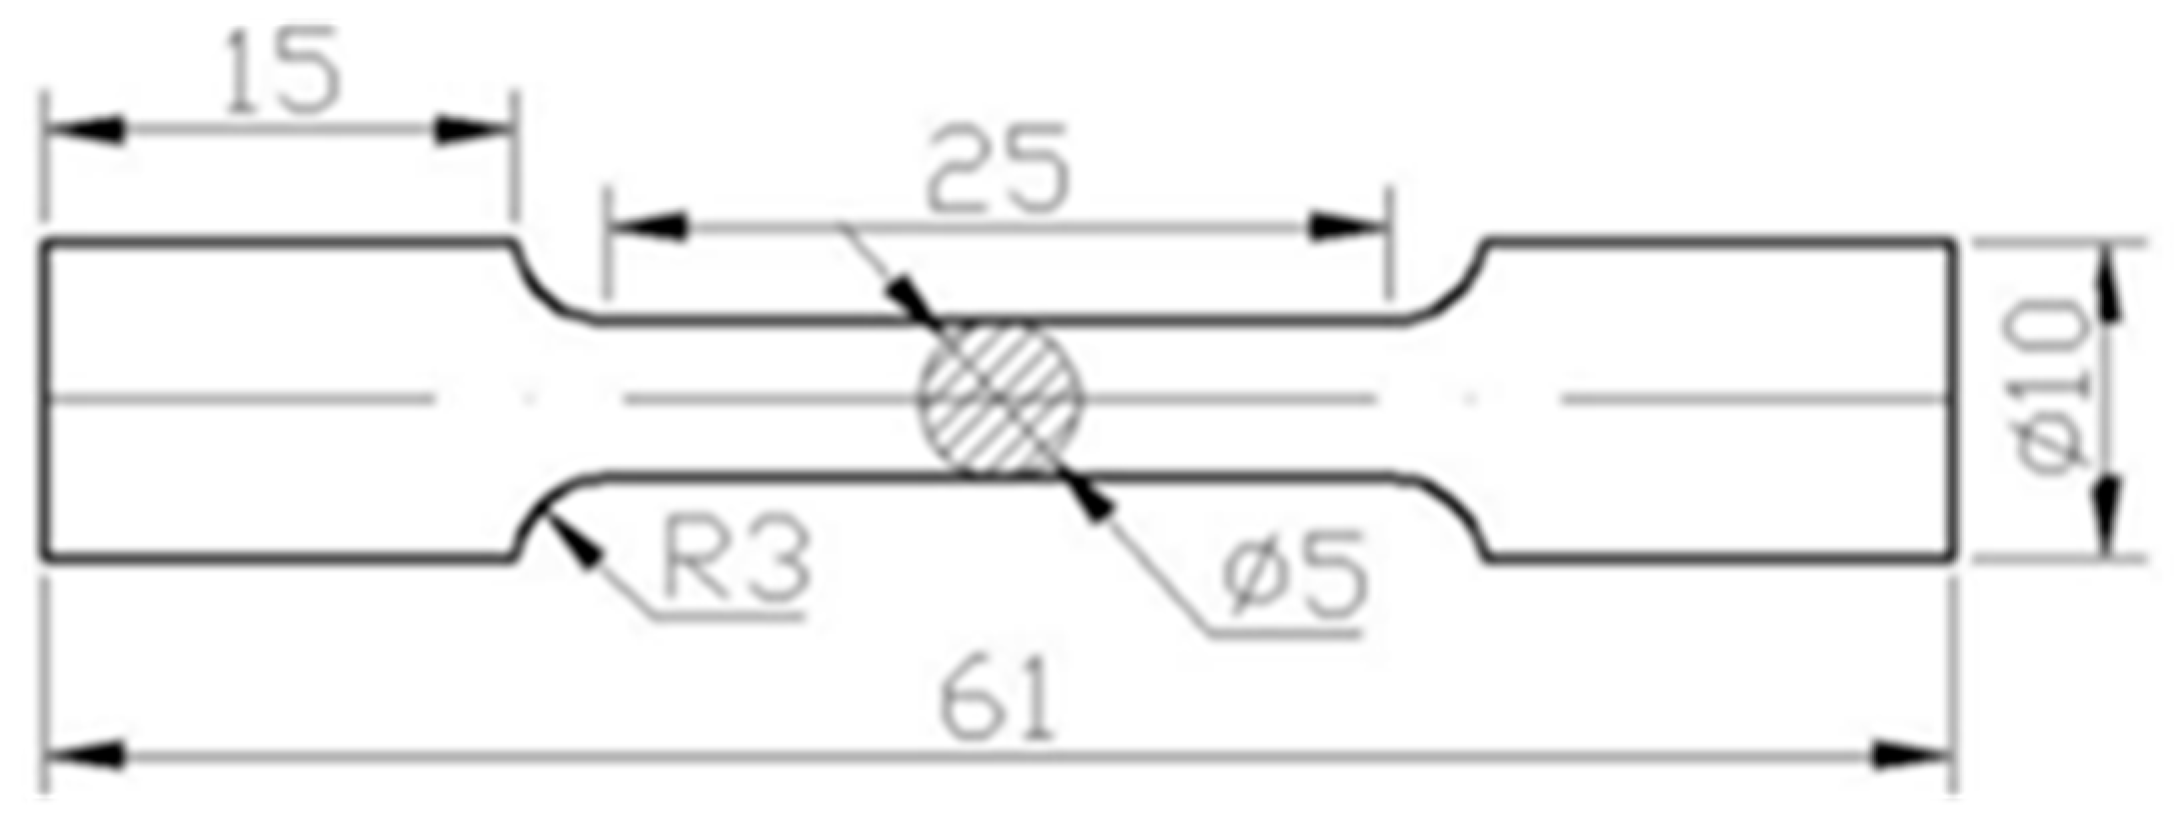
2. Materials and Methods
3. Results
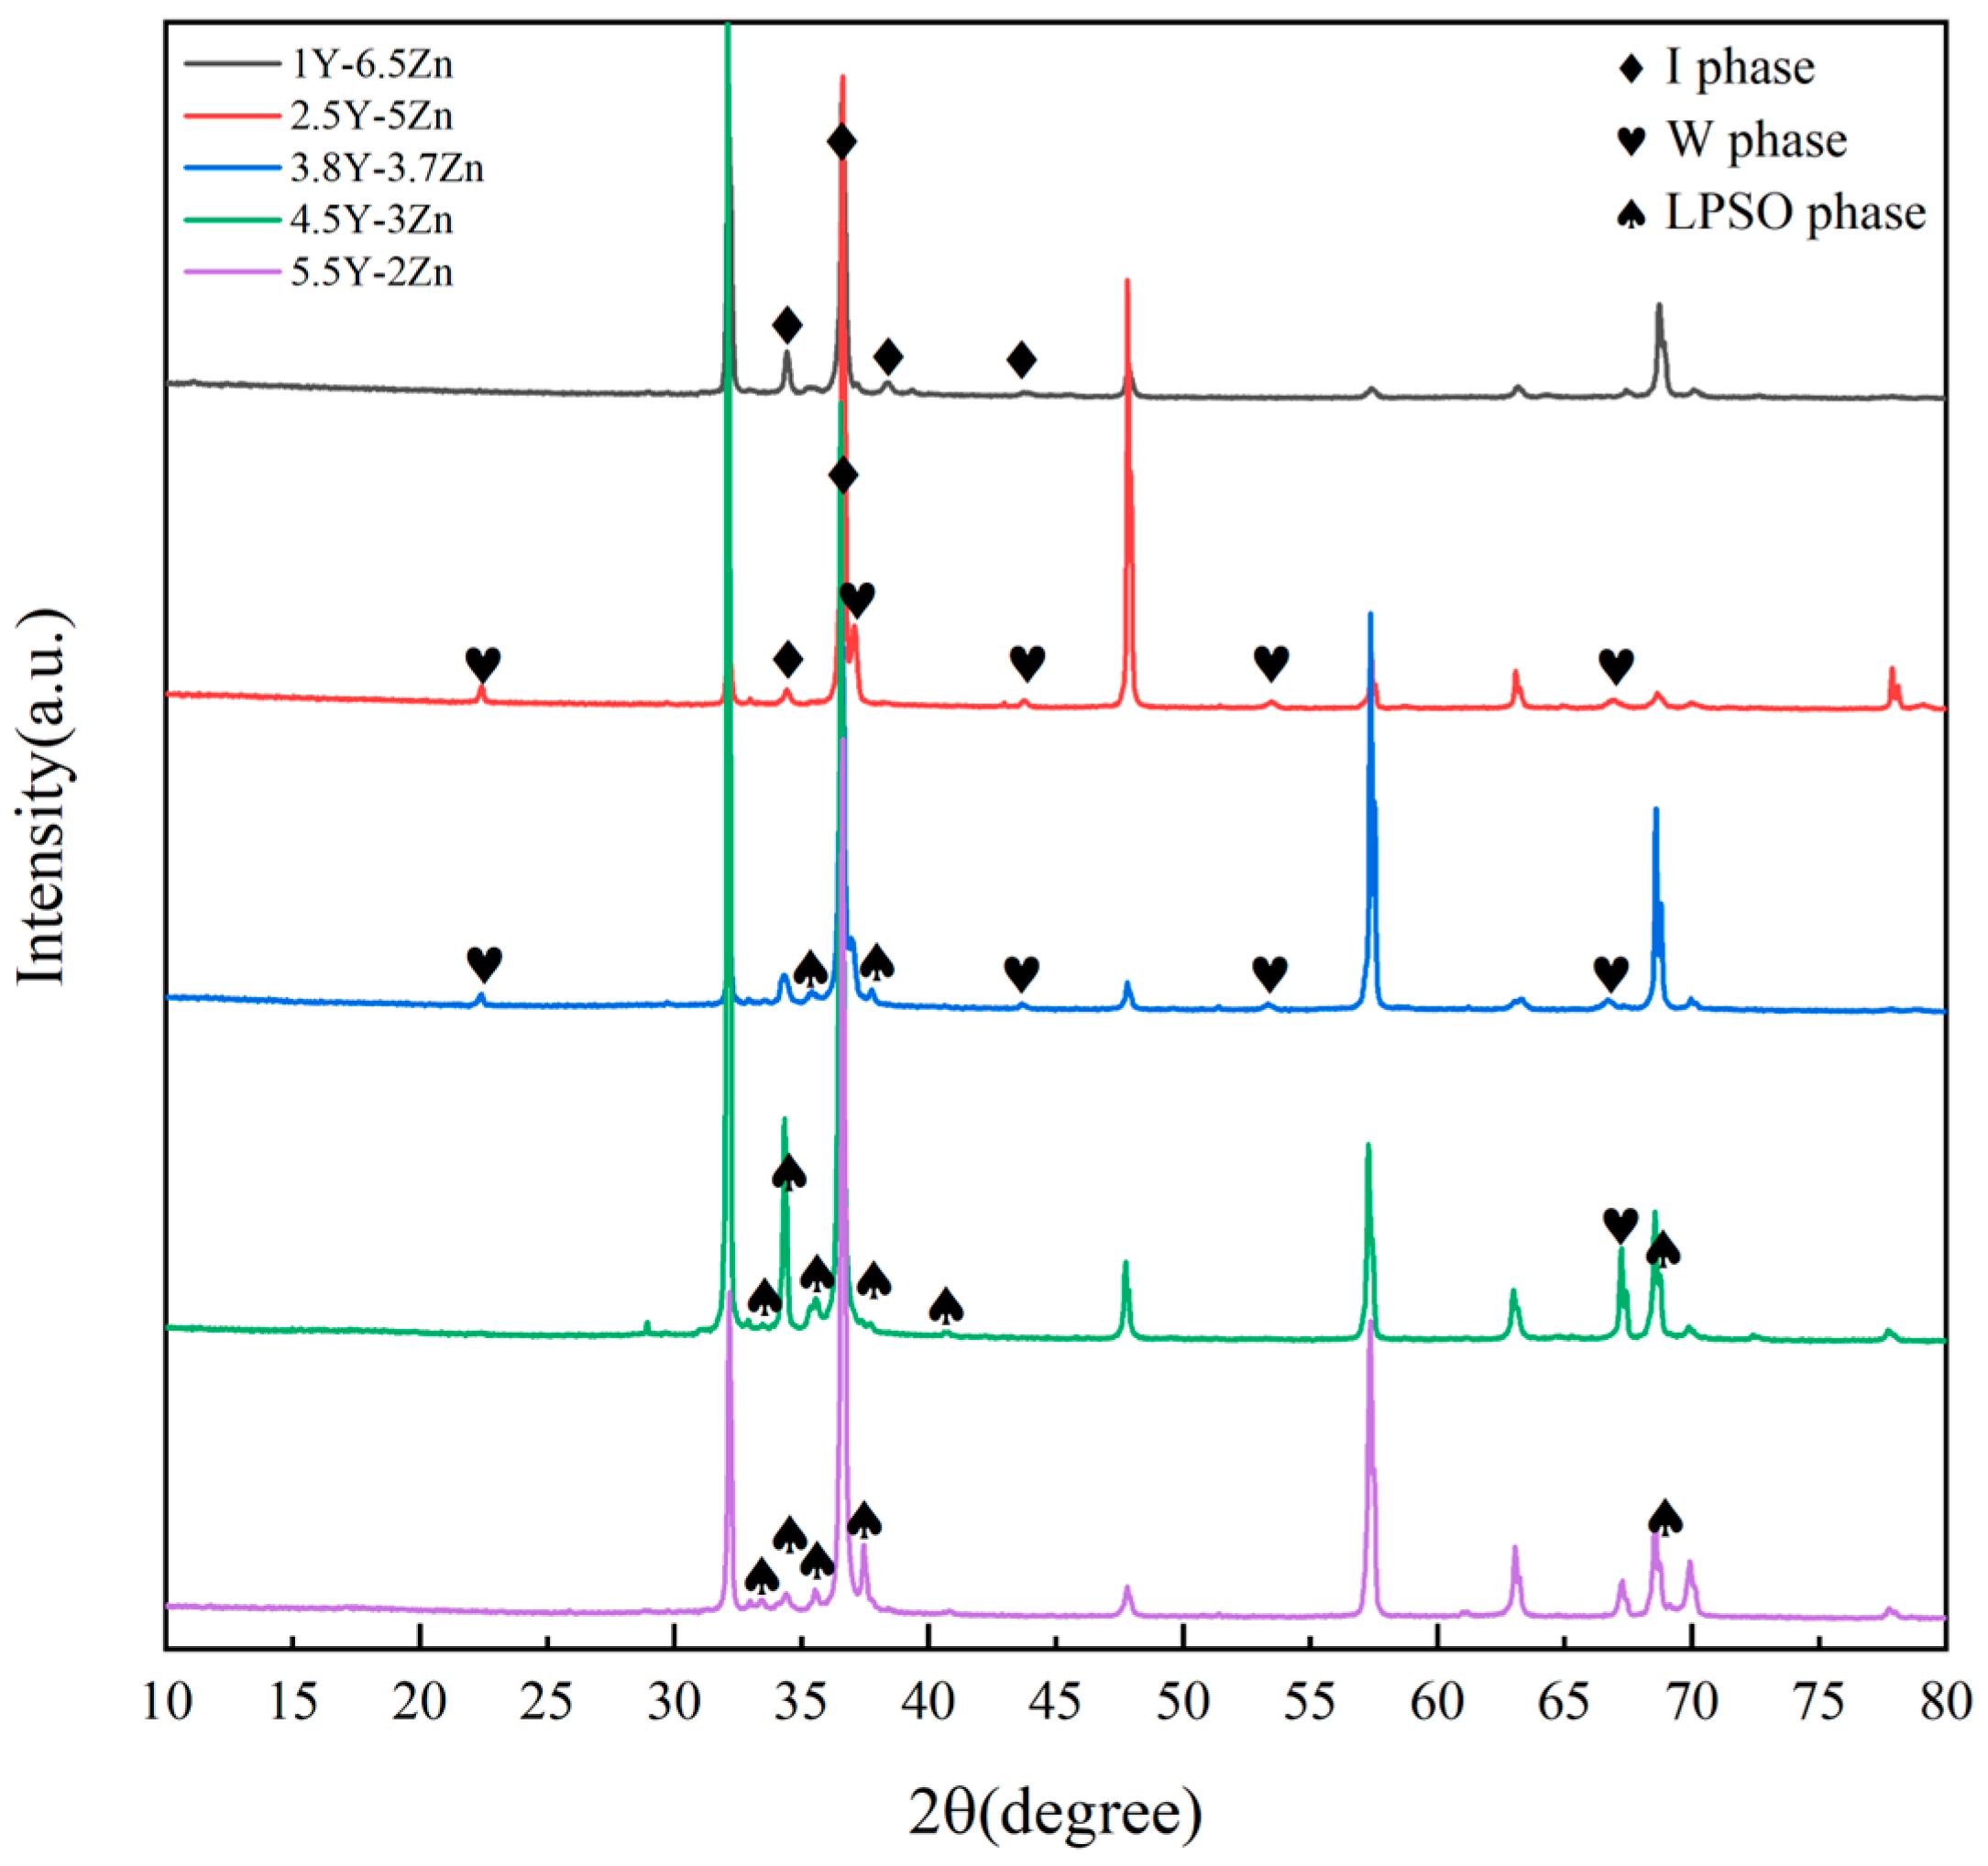
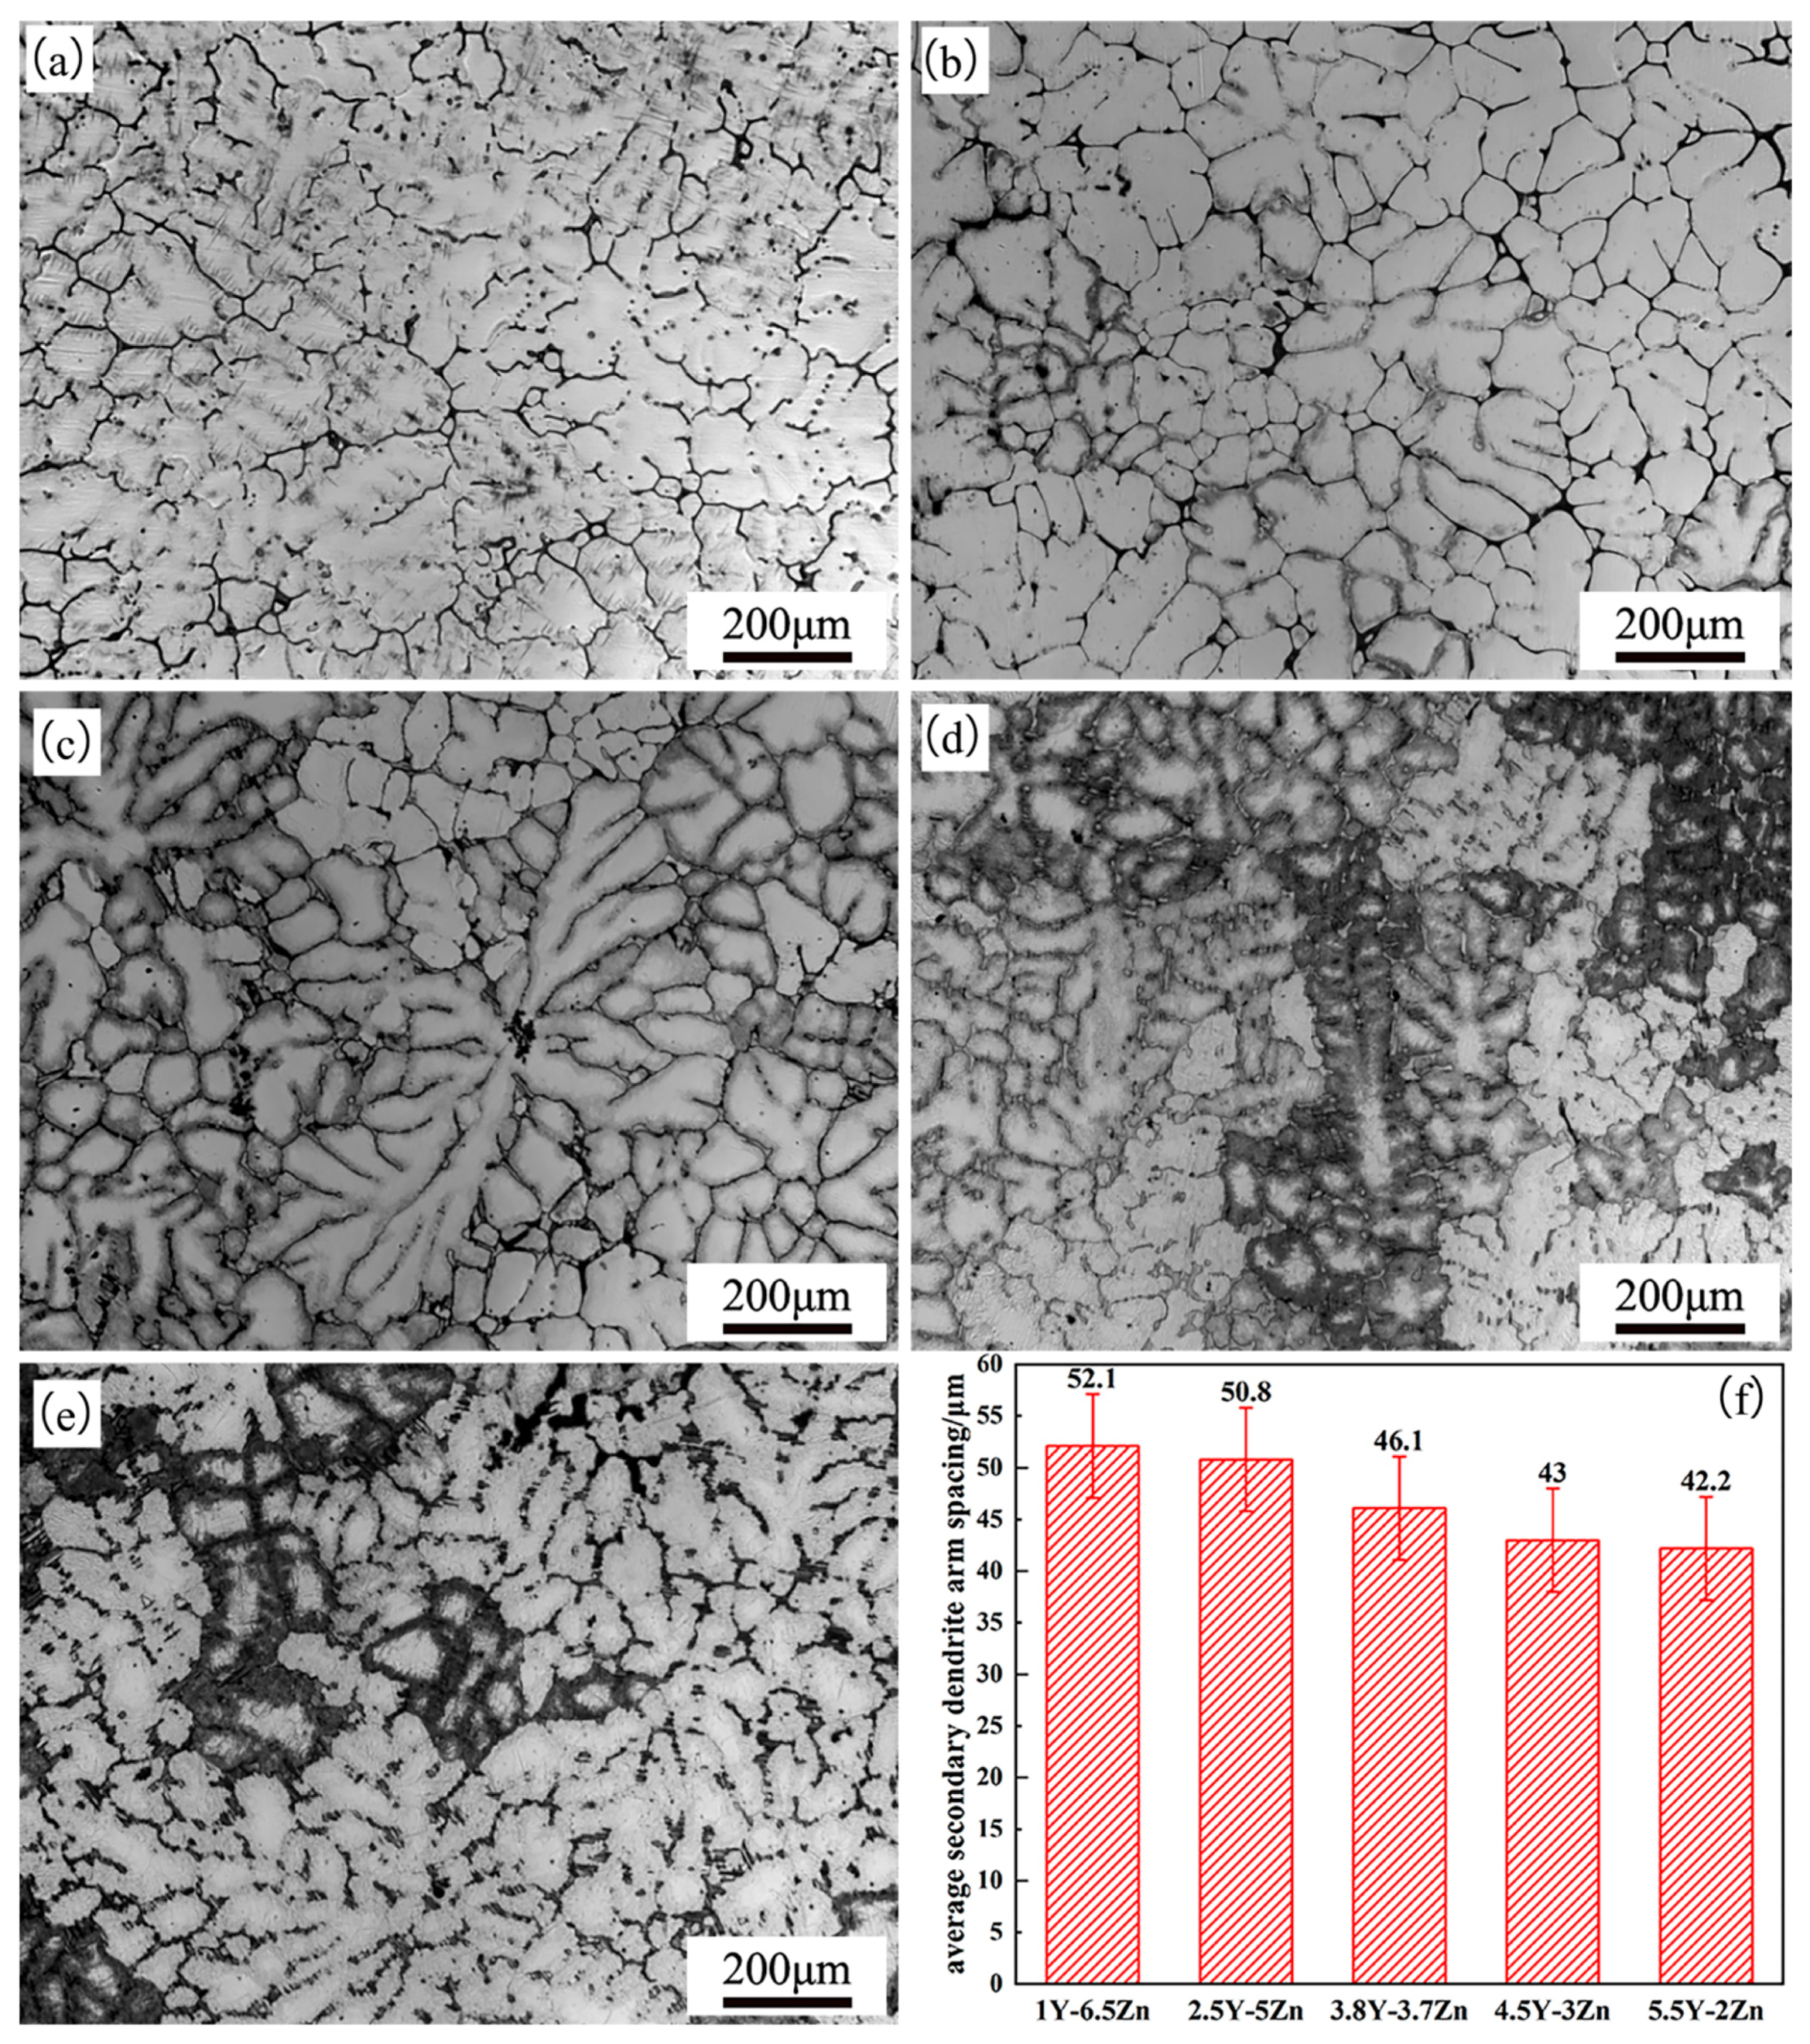
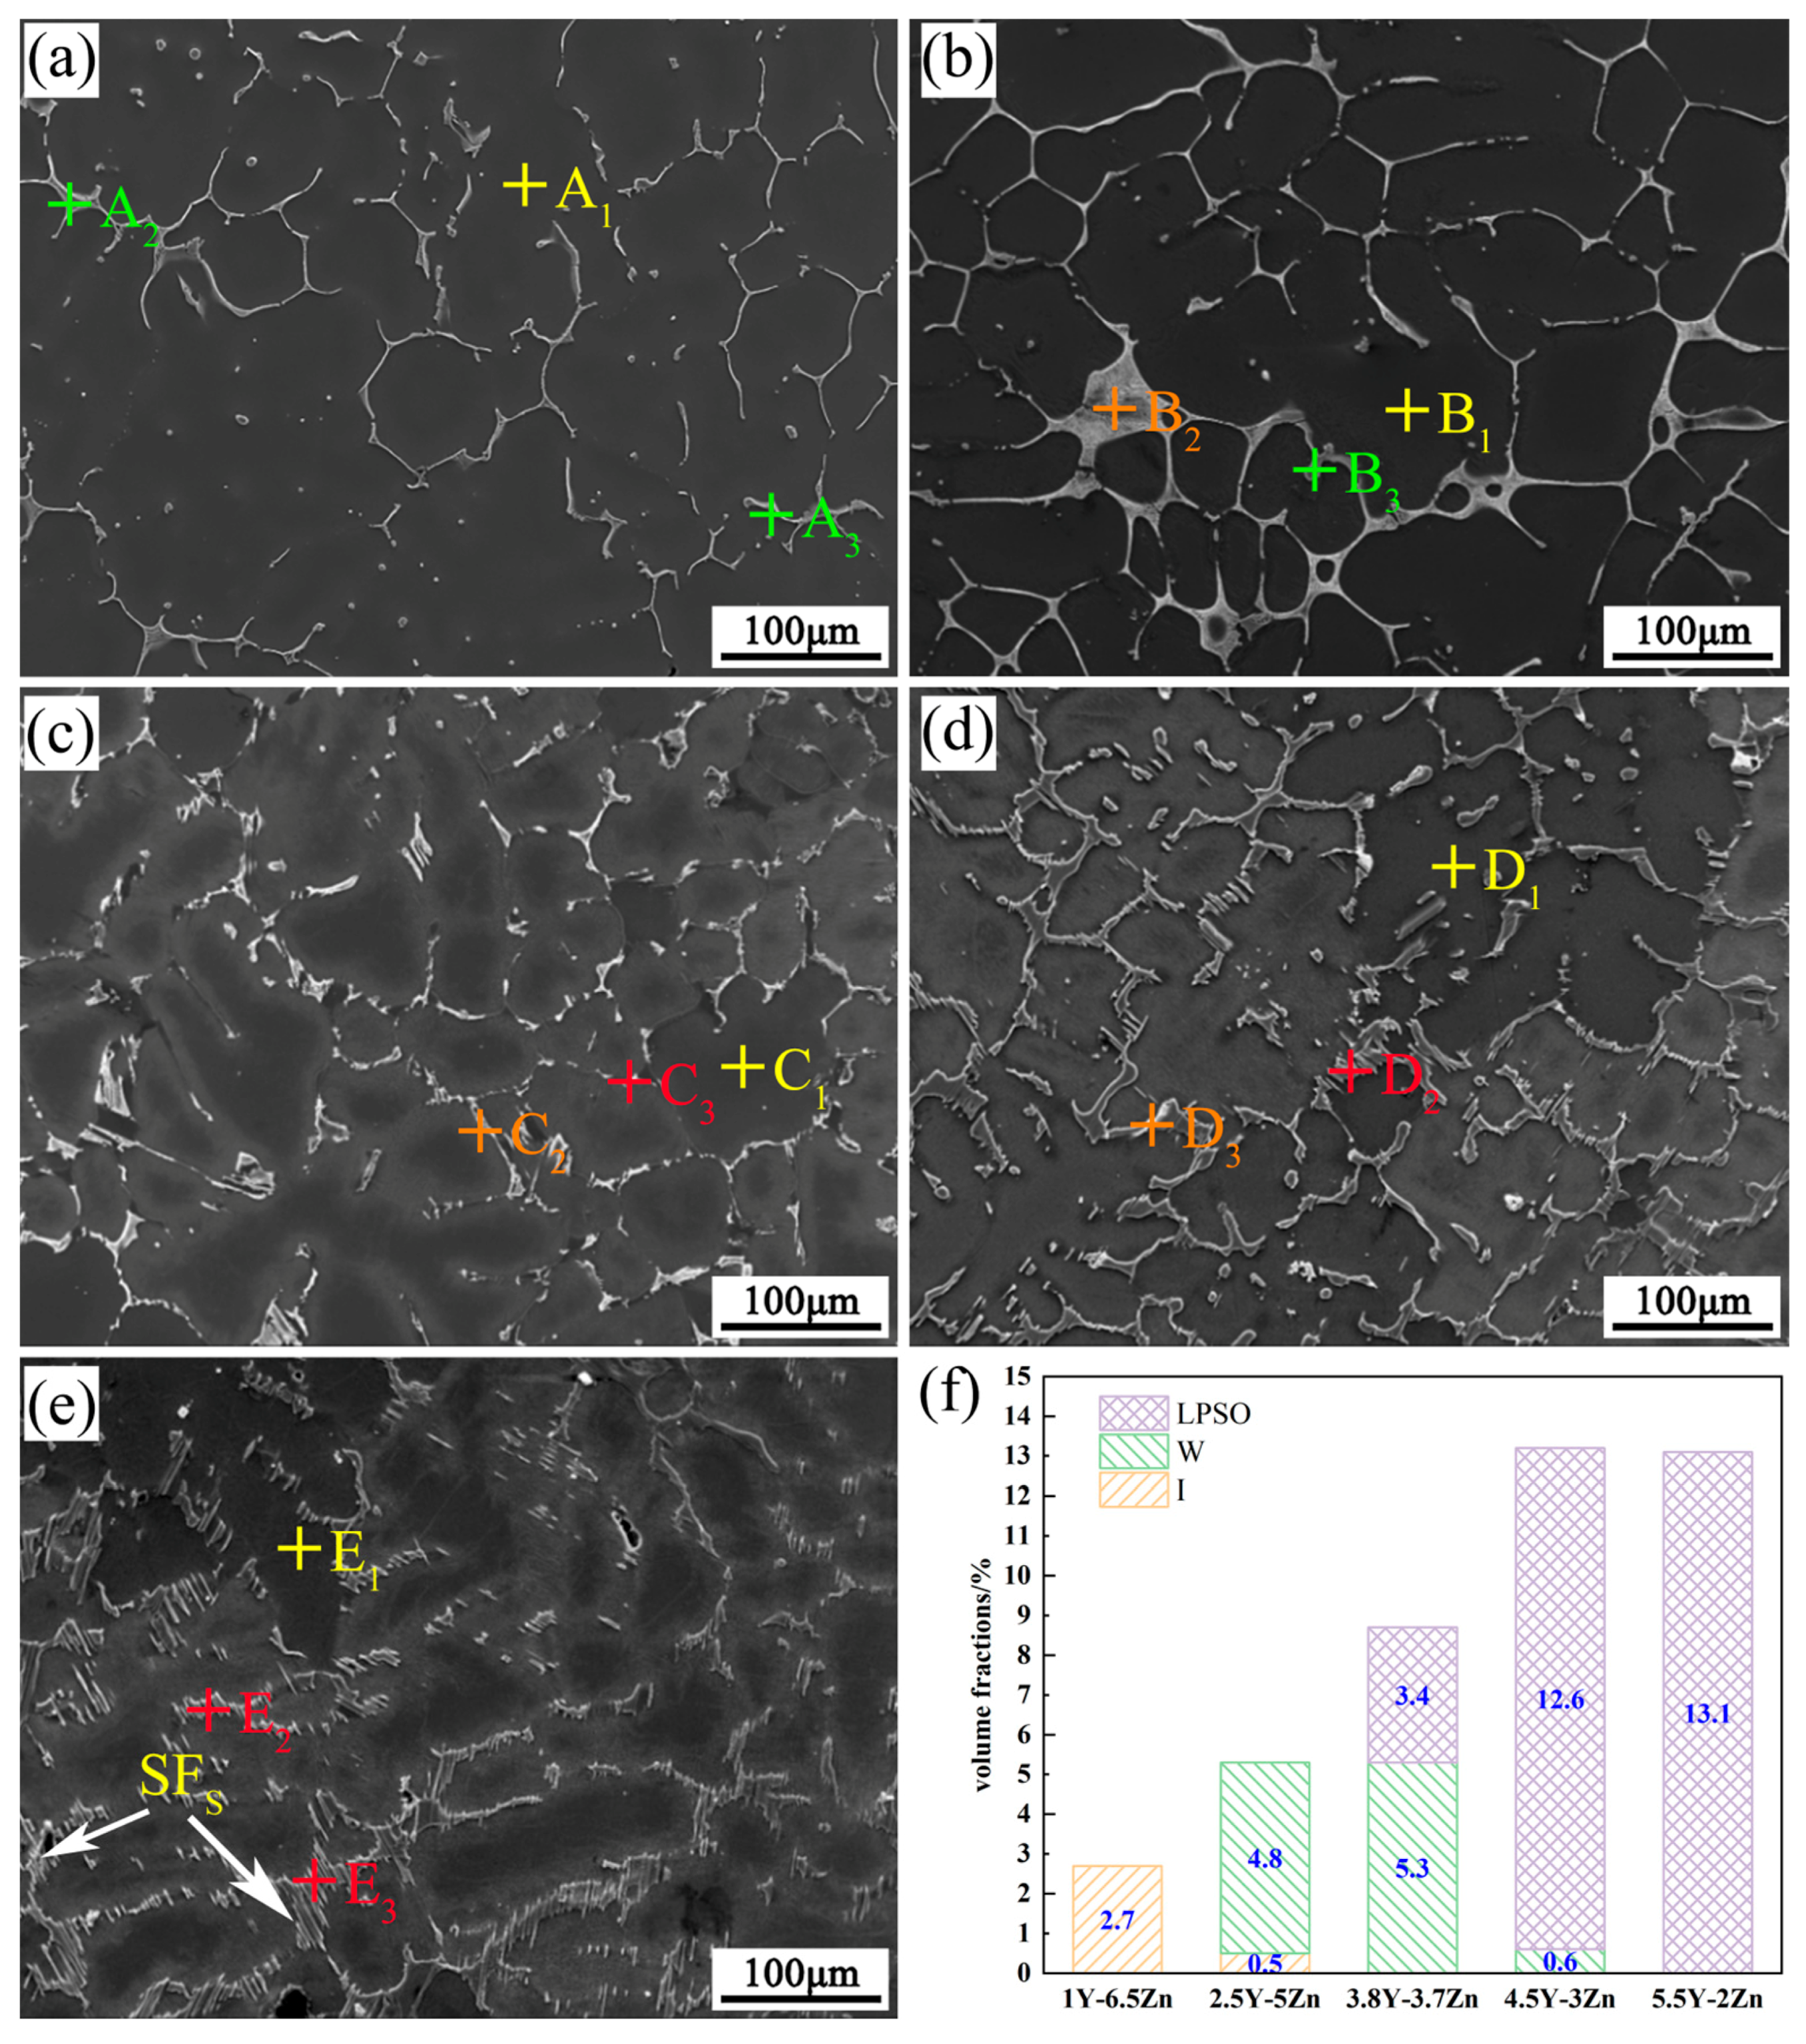
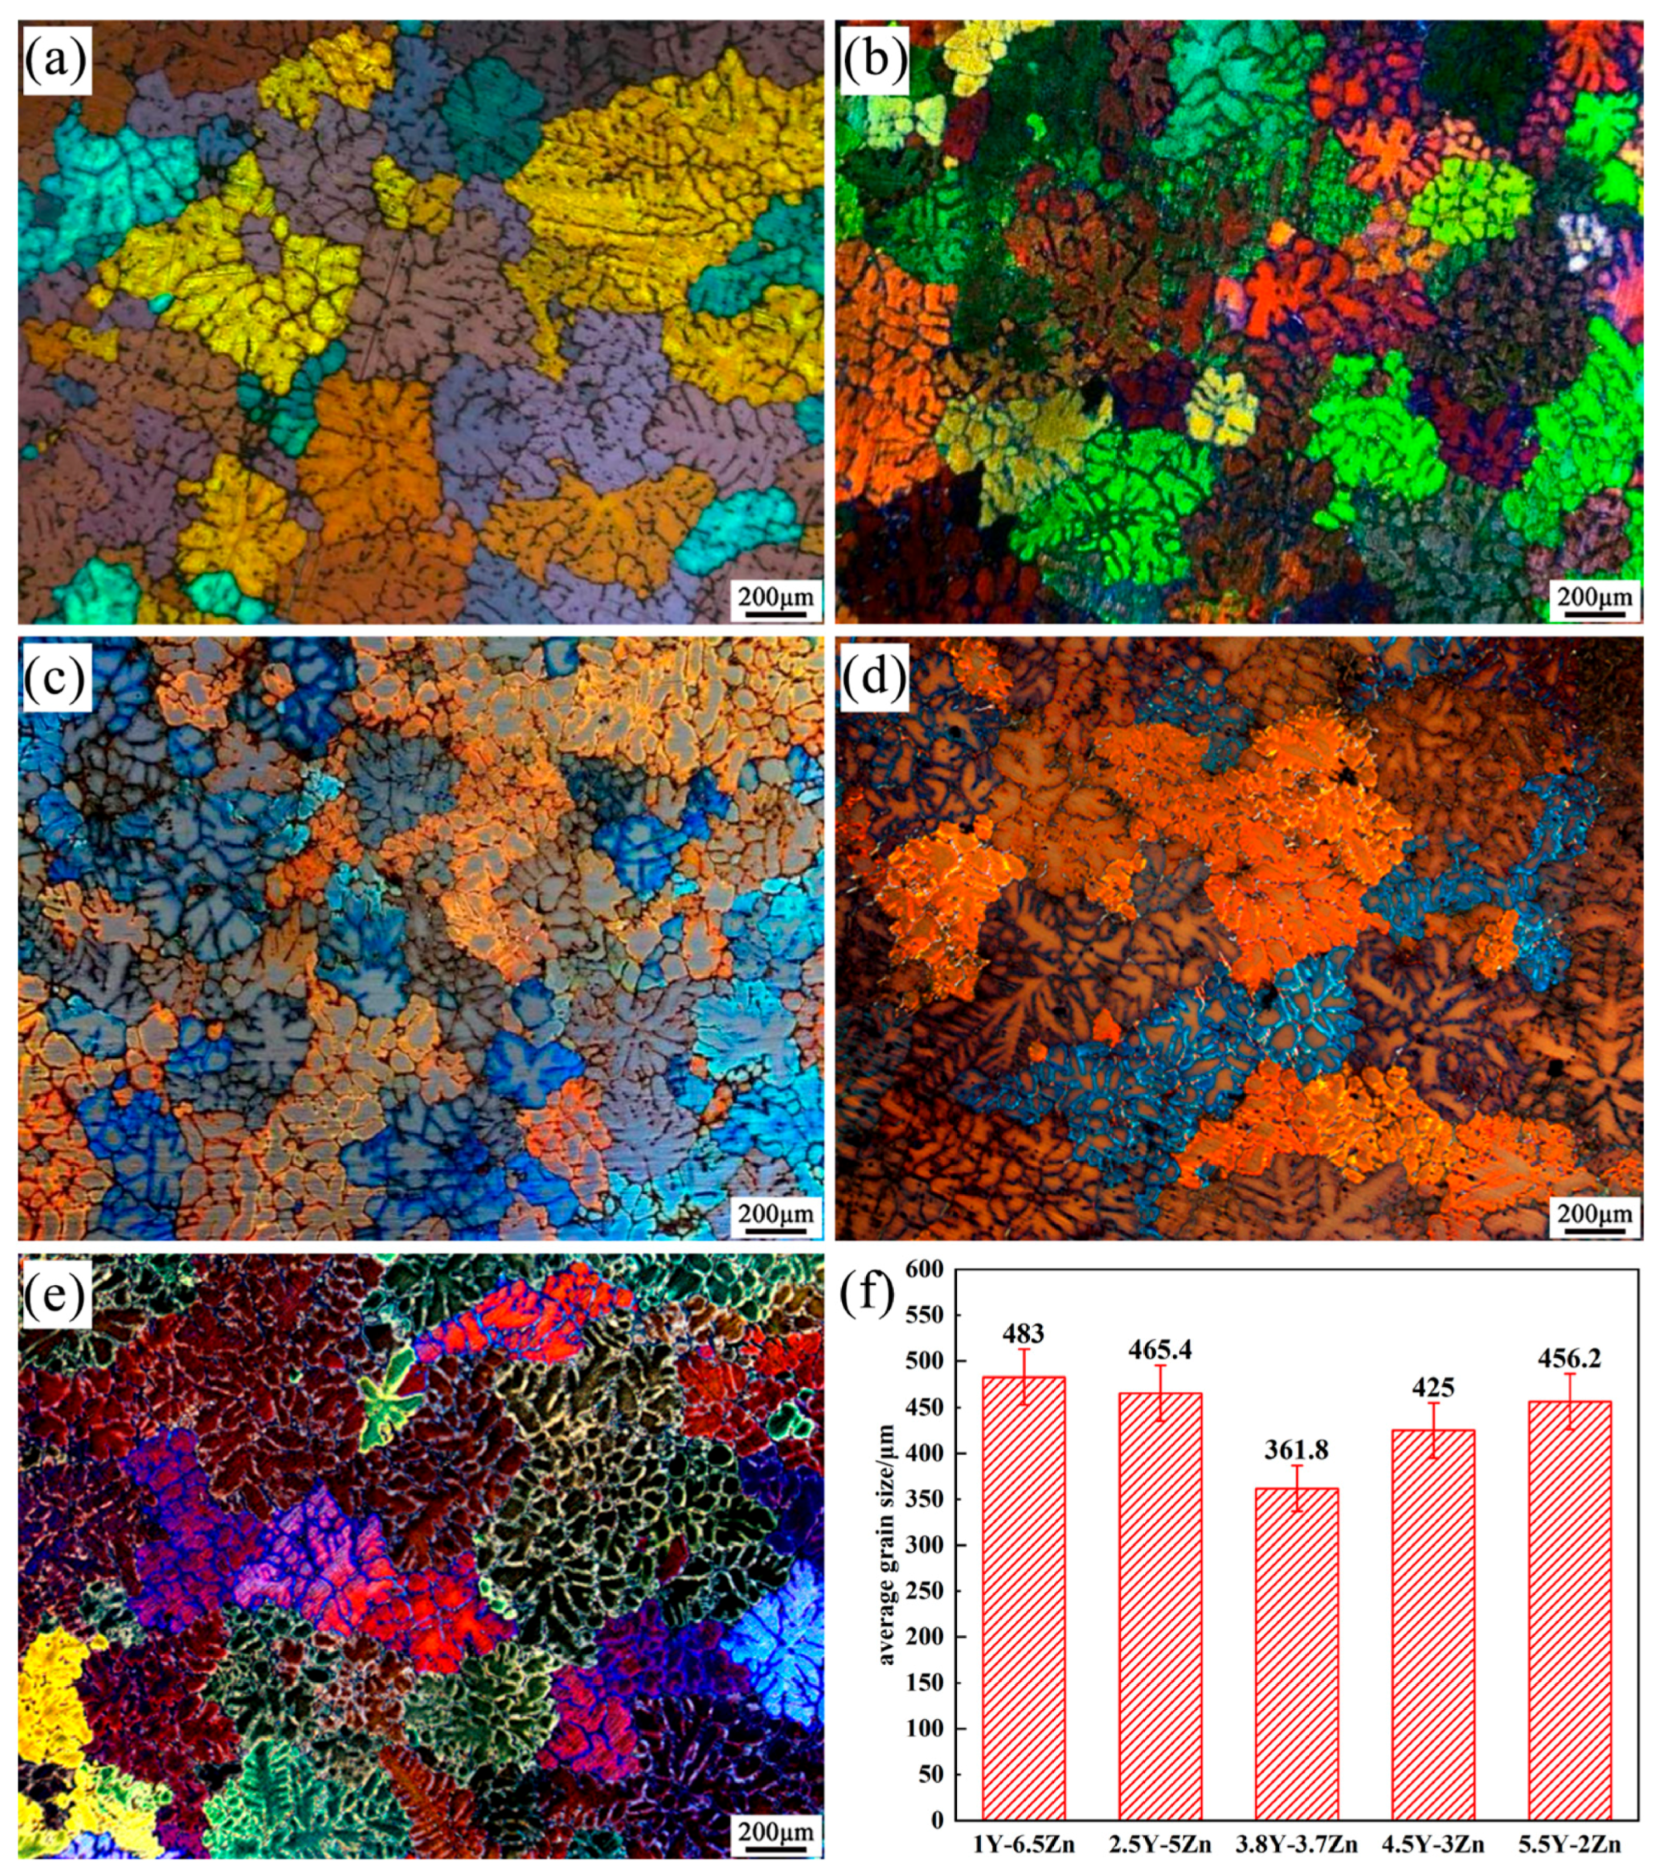
3.1. Microstructure
3.2. Performance
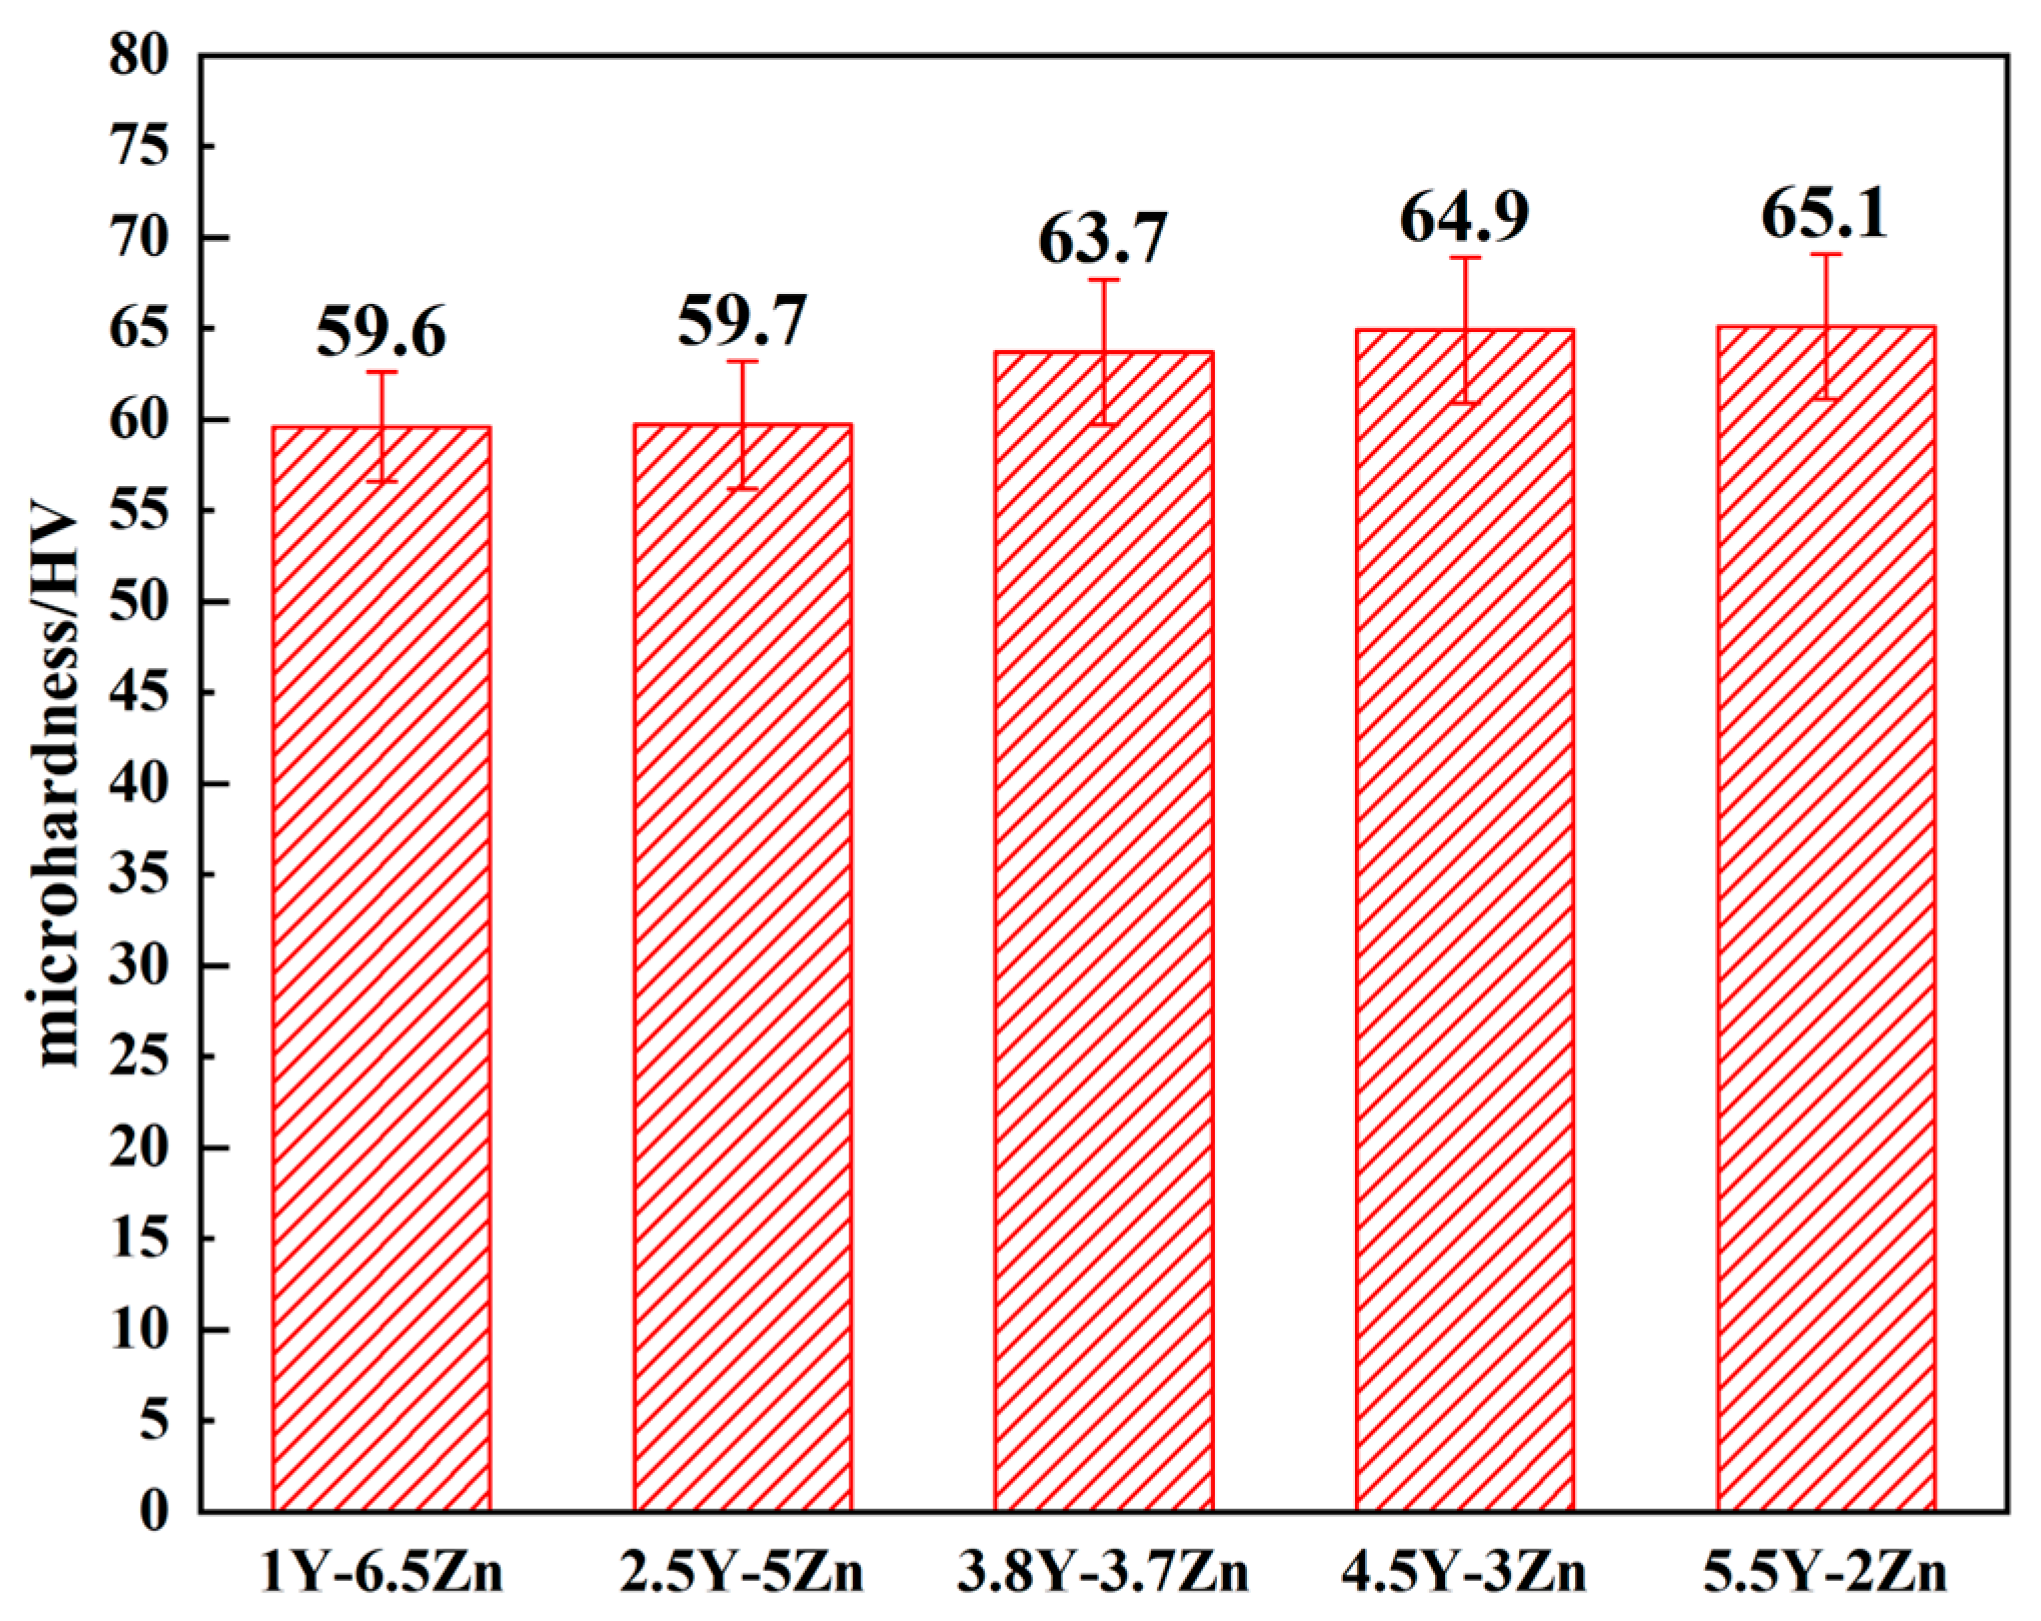
3.2.1. Microhardness
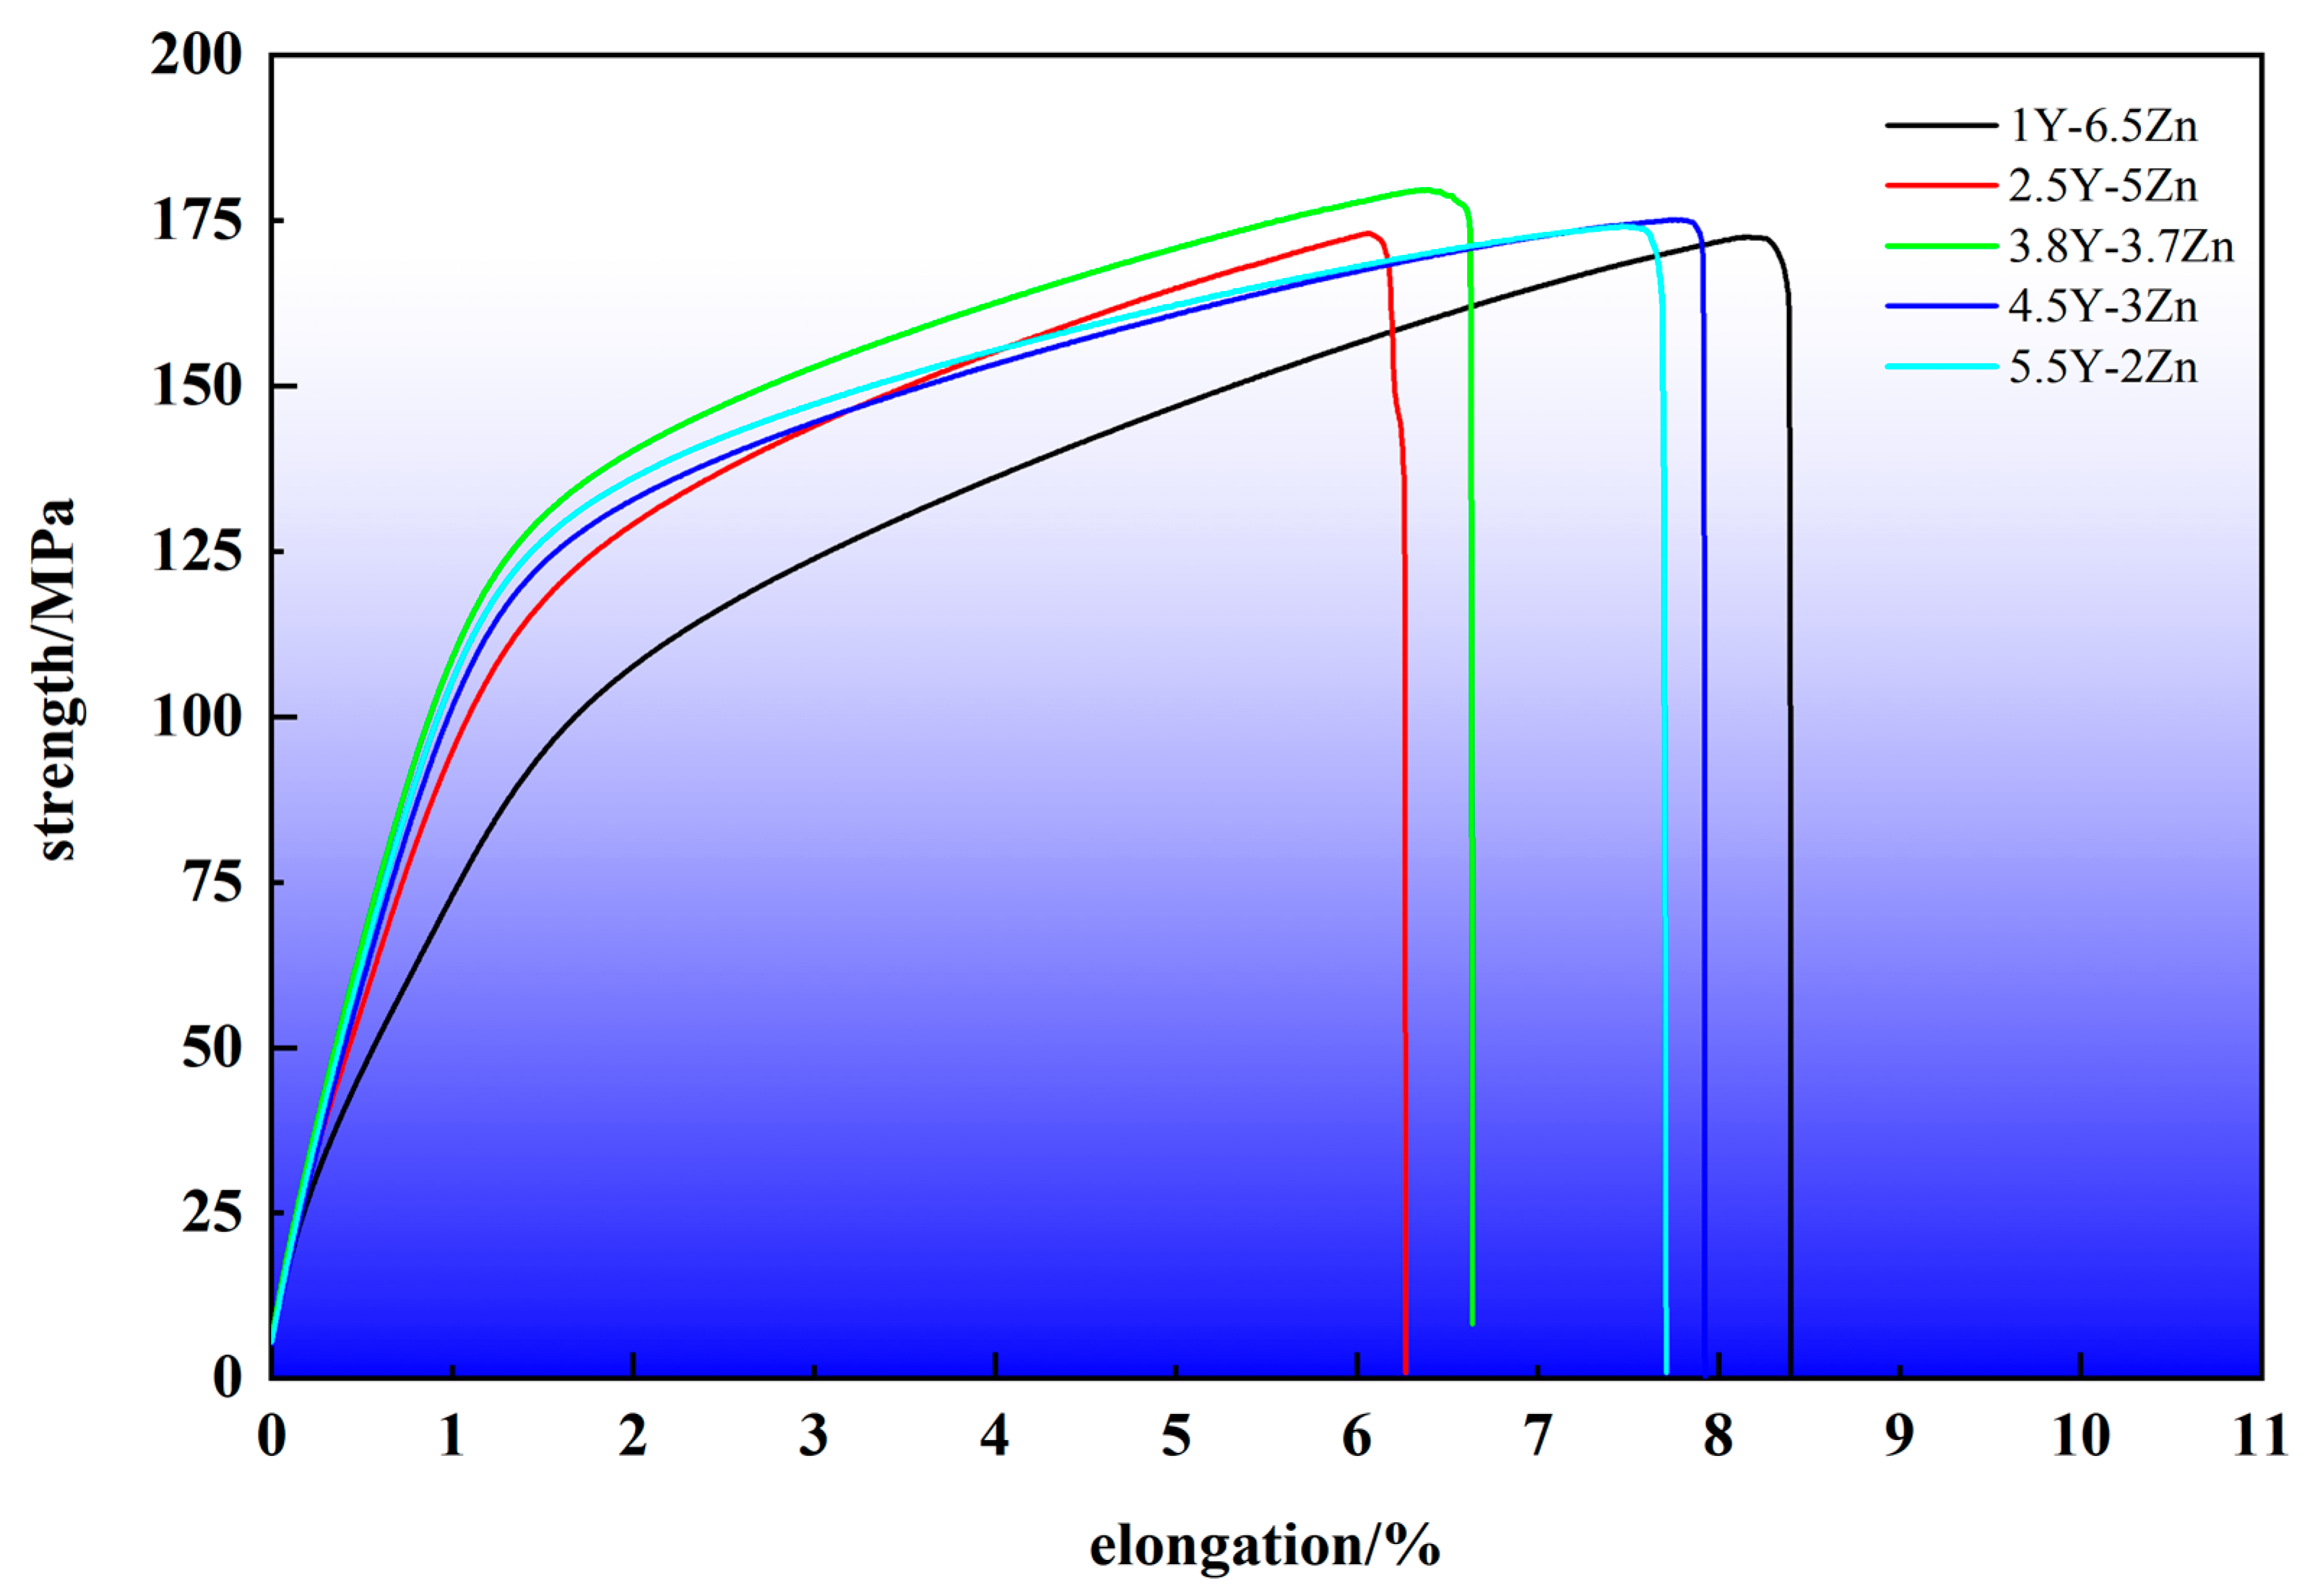
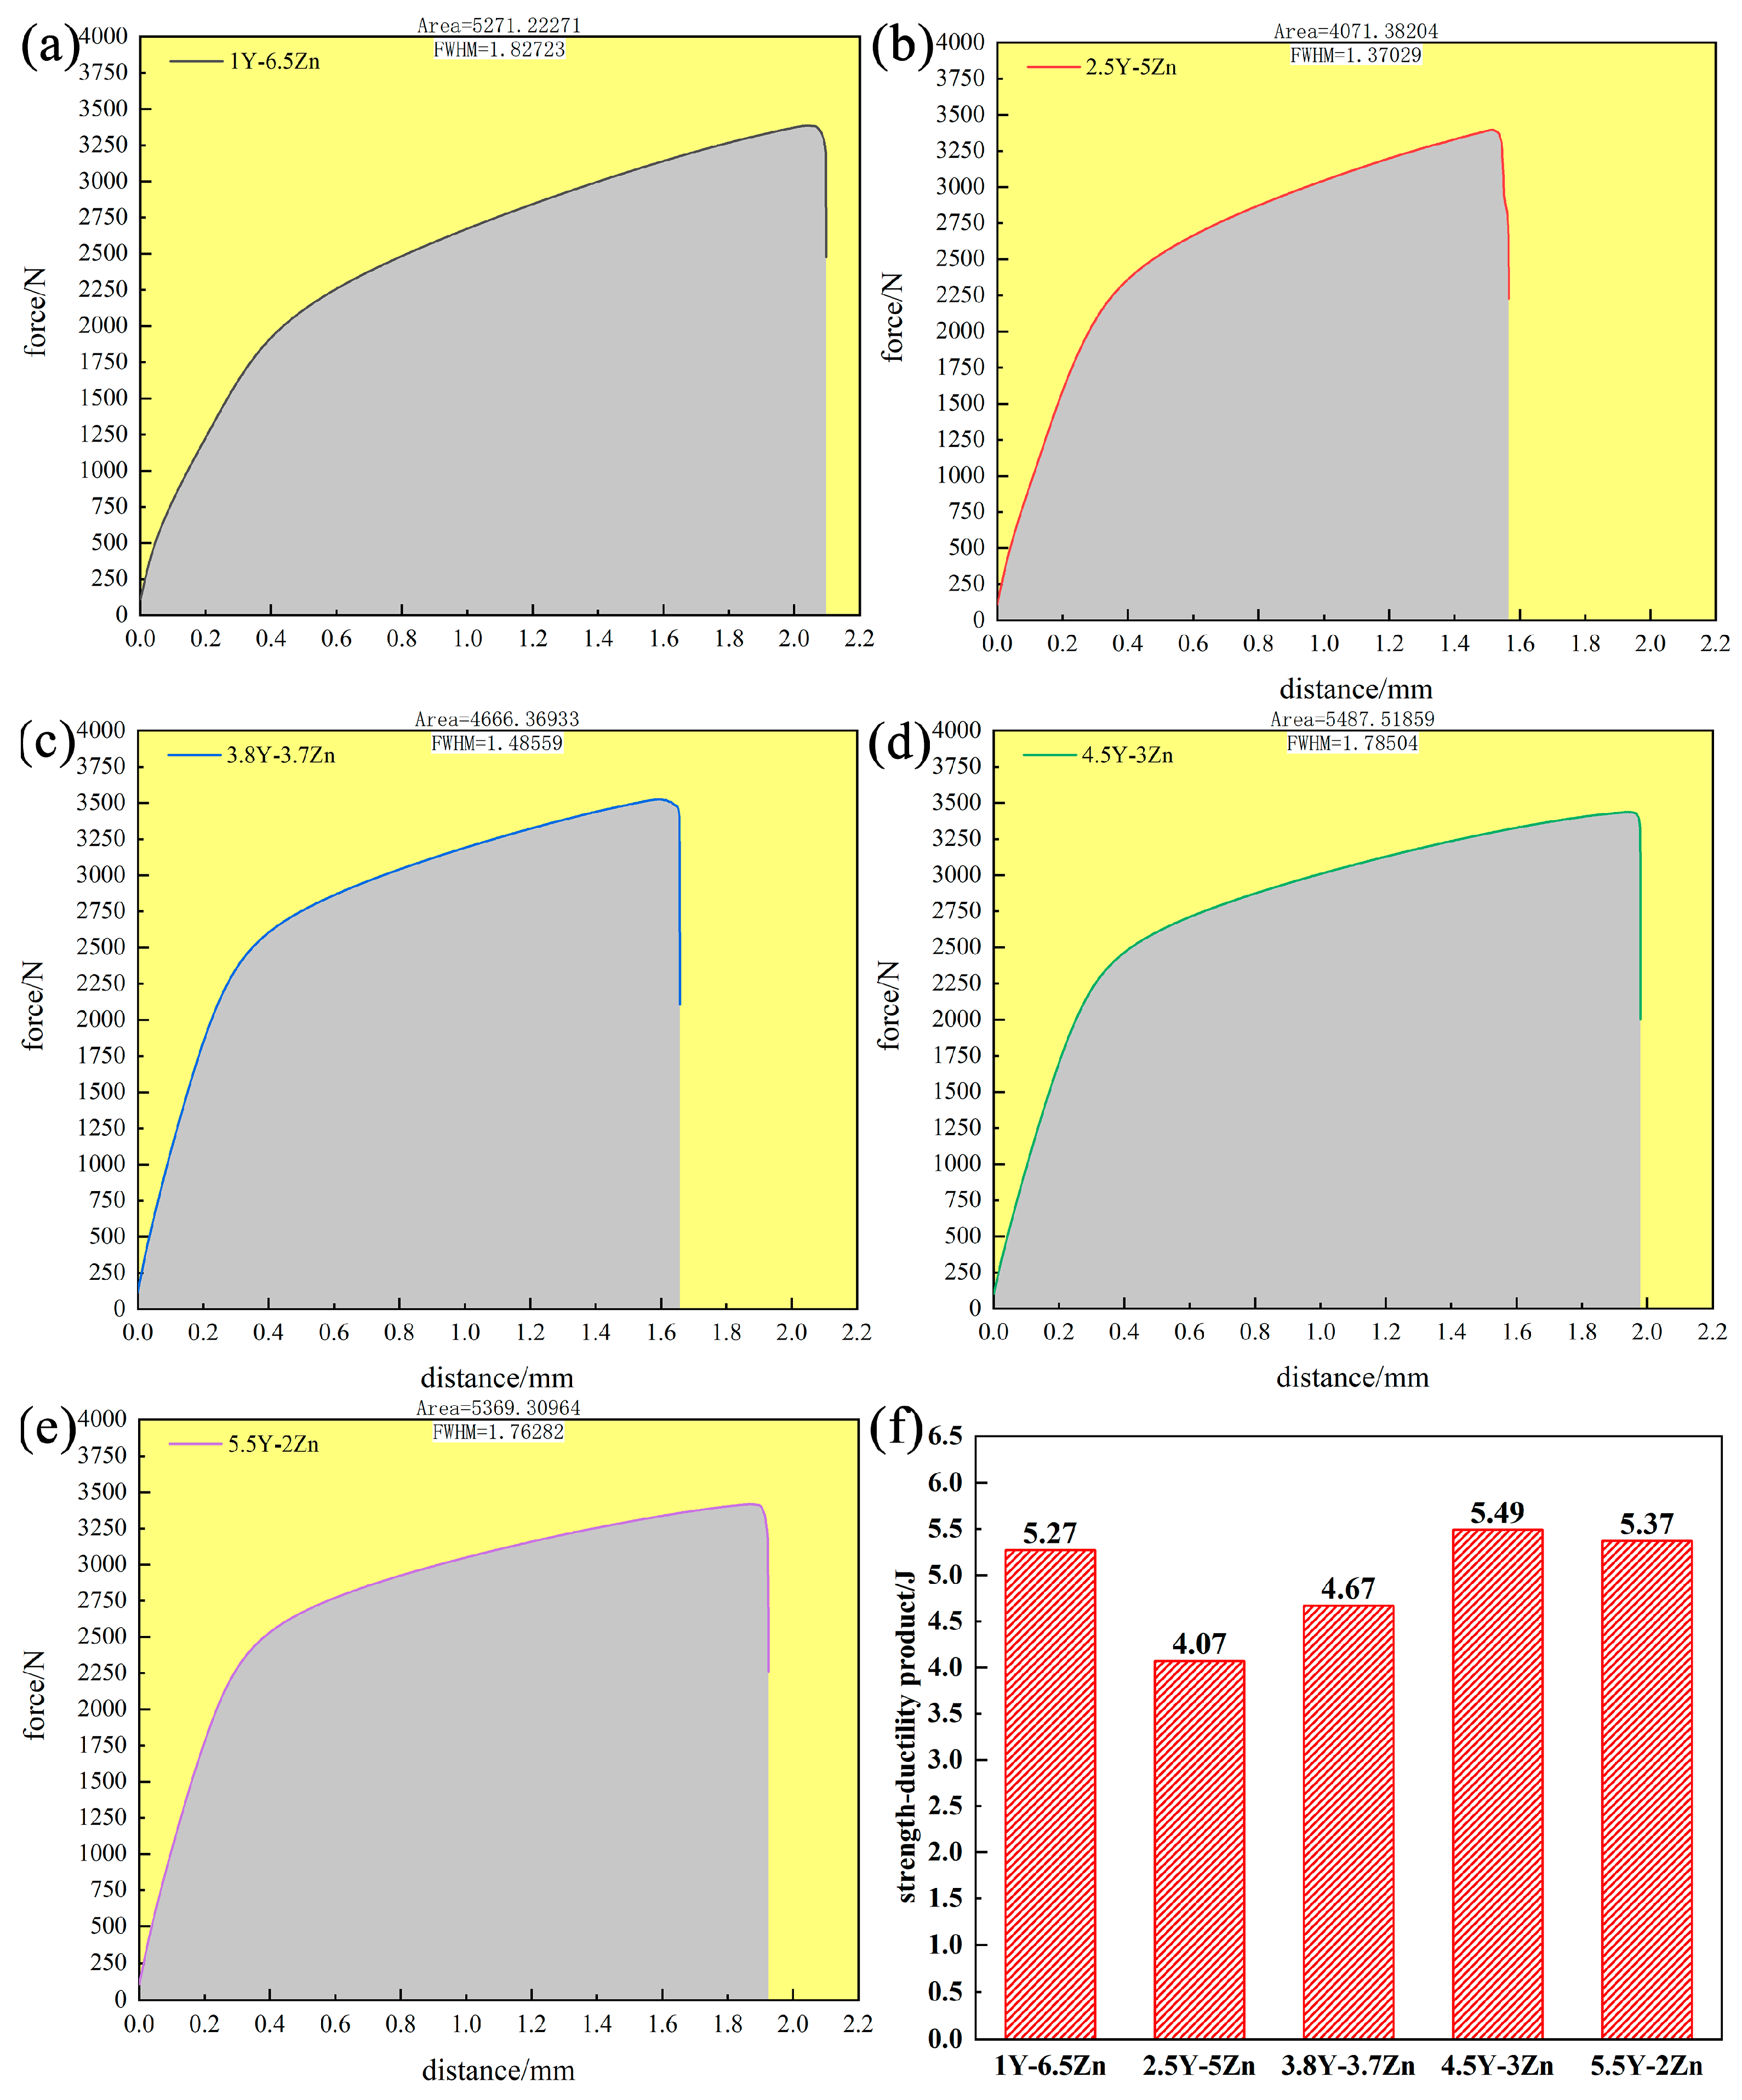
3.2.2. Mechanical Properties
4. Discussion
5. Conclusions
Author Contributions
Funding
Data Availability Statement
Conflicts of Interest
References
- Xu, D.K.; Tang, W.N.; Liu, L.; Xu, Y.B.; Han, E.H. Effect of Y concentration on the microstructure and mechanical properties of as-cast Mg-Zn-Y-Zr alloys. J. Alloys Compd. 2007, 432, 129–134. [Google Scholar]
- Chen, J.; Tan, L.; Yu, X.; Yang, K. Effect of minor content of Gd on the mechanical and degradable properties of as-cast Mg-2Zn-xGd-0.5Zr alloys. Mater. Sci. Technol. Engl. Version 2019, 35, 503–511. [Google Scholar]
- Zhang, T.X.; Zhao, X.T.; Liu, J.H.; Zhang, R.J.; Wang, X.F.; Yuan, Y.; Li, Z.Q.; Han, Z.Q. The microstructure, fracture mechanism and their correlation with the mechanical properties of as-cast Mg-Nd-Zn-Zr alloy under the effect of cooling rate. Mater. Sci. Eng. A 2021, 801, 140382. [Google Scholar]
- Zeng, Z.; Pan, H.; Pan, Z.; Wang, S.; Huang, Y.; Tang, W.; Yang, C.; Ren, Y.; Qin, G. Effect of Sm and Ce content on microstructure and mechanical property of newly developed Mg-Sm-Ce-Mn based alloy. Mater. Charact. 2023, 206, 113420. [Google Scholar]
- Yuan, M.; He, C.; Dong, Z.; Jiang, B.; Song, B.; Guo, N.; Liu, T.; Guo, S.; Pan, F. Effect of Sm addition on the microstructure and mechanical properties of Mg-xSm-0.4Zr alloys. J. Mater. Res. Technol. 2023, 23, 4814–4827. [Google Scholar]
- Abe, E.; Kawamura, Y.; Hayashi, K.; Inoue, A. Long-period ordered structure in a high-strength nanocrystalline Mg-1at%Zn-2at%Y alloy studied by atomic-resolution Z-contrast STEM. Acta Mater. 2002, 50, 3845–3857. [Google Scholar]
- Li, J.; He, Z.; Fu, P.; Wu, Y.; Peng, L.; Ding, W. Heat treatment and mechanical properties of a high-strength cast Mg-Gd-Zn alloy. Mater. Sci. Eng. A 2016, 651, 745–752. [Google Scholar]
- Liu, J.F.; Yang, Z.Q.; Ye, H.Q. Solid-state formation of icosahedral quasicrystals at Zn3Mg3Y2/Mg interfaces in a Mg-Zn-Y alloy. J. Alloys Compd. 2015, 650, 65–69. [Google Scholar]
- Liang, J.R.; Cao, F.R. Research Progress on the Effects of Alloying Elements on the Microstructure and Mechanical Properties of Mg-Y-Zn Alloys Containing LPSO Phase. Spec. Cast. Nonferrous Alloys 2021, 41, 932–937. [Google Scholar]
- Zhang, Z.; Liu, X.; Wang, Z.; Le, Q.; Hu, W.; Bao, L.; Cui, J. Effects of Phase Composition and Content on the Microstructures and Mechanical Properties of High Strength Mg-Y-Zn-Zr Alloys. Mater. Des. 2015, 88, 915–923. [Google Scholar]
- Luo, S.-Q.; Tang, A.-T.; Pan, F.-S.; Song, K.; Wang, W.-Q. Effect of Mole Ratio of Y to Zn on Phase Constituent of Mg-Zn-Zr-Y Alloys. Trans. Nonferrous Met. Soc. China 2011, 21, 795–800. [Google Scholar]
- Bai, Y.; Ye, B.; Guo, J.; Wang, L.; Kong, X.; Ding, W. Mechanical Properties and Yield Asymmetry of Mg-Y-Zn Alloys: Competitive Behavior of Second Phases. Mater. Charact. 2020, 164, 110301. [Google Scholar]
- Chen, X.; Liu, L.; Liu, J.; Pan, F. Microstructure, electromagnetic shielding effectiveness and mechanical properties of Mg-Zn-Y-Zr alloys. Mater. Des. 2015, 65, 360–369. [Google Scholar]
- Mehrabi-Mehdiabadi, M.; Mahmudi, R. Effects of yttrium addition on microstructural stability and elevated-temperature mechanical properties of a cast Mg-Zn alloy. J. Alloys Compd. 2020, 820, 153083. [Google Scholar]
- Wang, J.; Song, P.; Gao, S.; Huang, X.; Shi, Z.; Pan, F. Effects of Zn on the microstructure, mechanical properties, and damping capacity of Mg-Zn-Y-Zr alloys. Mater. Sci. Eng. A 2011, 528, 5914–5920. [Google Scholar]
- Shao, X.H.; Yang, Z.Q.; Ma, X.L. Strengthening and toughening mechanisms in Mg-Zn-Y alloy with a long period stacking ordered structure. Acta Mater. 2010, 58, 4760–4771. [Google Scholar]
- Gröbner, J.; Kozlov, A.; Fang, X.Y.; Zhu, S.; Nie, J.F.; Gibson, M.A.; Schmid-Fetzer, R. Phase equilibria and transformations in ternary Mg-Gd-Zn alloys. Acta Mater. 2012, 60, 5948–5962. [Google Scholar]
- Fang, X.; Wu, S.; Lü, S.; Wang, J.; Yang, X. Microstructure evolution and mechanical properties of quasicrystal-reinforced Mg-Zn-Y alloy subjected to ultrasonic vibration. Mater. Sci. Eng. A Struct. Mater. Prop. Misrostructure Process. 2017, 679, 372–378. [Google Scholar]
- Xu, C.J.; Tian, J.; Chen, L.P.; Zhang, J.X.; Zhang, Z.M. Research progress of long-period stacking ordered (LPSO) structures and formation mechanisms in magnesium alloys. Ordnance Mater. Sci. Eng. 2015, 38, 131–135. [Google Scholar]
- Zhu, Y.M.; Weyland, M.; Morton, A.J.; Oh-Ishi, K.; Hono, K.; Nie, J.F. The building block of long-period structures in Mg-RE-Zn alloys. Scr. Mater. 2009, 60, 980–983. [Google Scholar]
- Zhu, Y.M.; Morton, A.J.; Nie, J.F. The 18R and 14H long-period stacking ordered structures in Mg-Y-Zn alloys. Acta Mater. 2010, 58, 2936–2947. [Google Scholar]
- Lv, B.J. Effects of the Second Phase on the Dynamic Recrystallization Evolution and Hot Workability of Mg-Zn-Zr-Y Magnesium Alloy. Ph.D. Thesis, Chongqing University, Chongqing, China, 2014. [Google Scholar]
- Ghassemali, E.; Riestra, M.; Bogdanoff, T.; Kumar, B.S.; Seifeddine, S. Hall-Petch equation in a hypoeutectic Al-Si cast alloy: Grain size vs. secondary dendrite arm spacing. Int. Conf. Technol. Plast. 2017, 207, 19–24. [Google Scholar]
- Caceres, C.H.; Mann, G.E.; Griffiths, J.R. Grain Size Hardening in Mg and Mg-Zn Solid Solutions. Metall. Mater. Trans. A 2011, 42, 1950–1959. [Google Scholar]
- Fang, X.; Lü, S.; Wang, J.; Yang, X.; Wu, S. Effects of Ce/La misch metal content on microstructure evolution and mechanical properties of Mg-Zn-Y alloy. Mater. Sci. Eng. A Struct. Mater. Prop. Misrostruct. Process. 2017, 699, 1–9. [Google Scholar]
- Yasi, J.A.; Hector, L.G.; Trinkle, D.R., Jr. First-principles data for solid-solution strengthening of magnesium: From geometry and chemistry to properties. Acta Mater. 2010, 58, 5704–5713. [Google Scholar]
- Ma, K.; Wen, H.; Hu, T.; Topping, T.D.; Isheim, D.; Seidman, D.N.; Lavernia, E.J.; Schoenung, J.M. Mechanical behavior and strengthening mechanisms in ultrafine grain precipitation-strengthened aluminum alloy. Acta Mater. 2014, 62, 141–155. [Google Scholar]
- Gao, L.; Chen, R.; Han, E. Effects of rare-earth elements Gd and Y on the solid solution strengthening of Mg alloys. J. Alloys Compd. 2009, 481, 379–384. [Google Scholar]
- Li, Z.; Fu, P.; Peng, L.; Wang, Y.; Jiang, H. Strengthening mechanisms in solution treated Mg-yNd-zZn-xZr alloy. J. Mater. Sci. 2013, 48, 6367–6376. [Google Scholar]
- Fan, M.; Zhang, Z.; Cui, Y.; Liu, L.; Liu, Y.; Liaw, P.K. Achieving strength and ductility synergy via a nanoscale superlattice precipitate in a cast Mg-Y-Zn-Er alloy. Int. J. Plast. 2023, 163, 103558. [Google Scholar]
- Yang, Q.; Bu, F.; Qiu, X.; Li, Y.; Li, W.; Sun, W.; Liu, X.; Meng, J. Strengthening effect of nano-scale precipitates in a die-cast Mg-4Al-5.6Sm-0.3Mn alloy. J. Alloys Compd. 2016, 665, 240–250. [Google Scholar]
- Cai, H.; Zhao, Z.; Wang, Q.; Zhang, N.; Lei, C. Study on solution and aging heat treatment of a super high strength cast Mg-7.8Gd-2.7Y-2.0Ag-0.4Zr alloy. Mater. Sci. Eng. A 2022, 849, 143523. [Google Scholar]


| Alloy Composition | Y | Zn | Y + Zn (wt.%) | Y/Zn (wt.%) |
|---|---|---|---|---|
| Mg-1Y-6.5Zn | 1.10 | 6.09 | 7.19 | 0.15 |
| Mg-2.5Y-5Zn | 2.57 | 4.35 | 6.92 | 0.5 |
| Mg-3.8Y-3.7Zn | 4.12 | 3.23 | 7.35 | 1 |
| Mg-4.5Y-3Zn | 5.06 | 2.70 | 7.76 | 1.5 |
| Mg-5.5Y-2Zn | 5.81 | 1.76 | 7.57 | 2.75 |
| Alloy | Position | Element | Possible Phases | ||
|---|---|---|---|---|---|
| Mg | Zn | Y | |||
| Mg-1Y-6.5Zn | A1 | 99.2 | 0.77 | 0.03 | α-Mg |
| A2 | 54.0 | 37.3 | 8.7 | Mg3YZn6 [11] | |
| A3 | 36.4 | 53.5 | 10.1 | Mg3YZn6 | |
| Mg-2.5Y-5Zn | B1 | 99.2 | 0.6 | 0.2 | α-Mg |
| B2 | 45.6 | 34.4 | 20.0 | Mg3Y2Zn3 [10] | |
| B3 | 41.0 | 49.3 | 9.7 | Mg3YZn6 | |
| Mg-3.8Y-3.7Zn | C1 | 99.5 | 0.2 | 0.3 | α-Mg |
| C2 | 53.1 | 28.9 | 18.0 | Mg3Y2Zn3 | |
| C3 | 86.9 | 5.8 | 7.3 | Mg12YZn [12] | |
| Mg-4.5Y-3Zn | D1 | 99.4 | 0.2 | 0.4 | α-Mg |
| D2 | 85.7 | 6.7 | 7.6 | Mg12YZn | |
| D3 | 65.5 | 21.5 | 13.1 | Mg3Y2Zn3 | |
| Mg-5.5Y-2Zn | E1 | 99.2 | 0.2 | 0.5 | α-Mg |
| E2 | 88.0 | 4.7 | 7.3 | Mg12YZn | |
| E3 | 87.9 | 4.8 | 7.3 | Mg12YZn | |
| Alloy | ) | ) | ) | |||
|---|---|---|---|---|---|---|
| dgs/μm | /MPa | CY/at.% | CZn/at.% | /MPa | /MPa | |
| Mg-1Y-6.5Zn | 483.0 ± 30 | 21.0 | 0.03 | 0.7 | 34.6 | 2.8 |
| Mg-2.5Y-5Zn | 465.4 ± 30 | 21.2 | 0.10 | 0.6 | 35.0 | 14.1 |
| Mg-3.8Y-3.7Zn | 361.8 ± 30 | 22.6 | 0.30 | 0.4 | 38.8 | 42.9 |
| Mg-4.5Y-3Zn | 425.0 ± 30 | 21.7 | 0.40 | 0.3 | 40.6 | 43.3 |
| Mg-5.5Y-2Zn | 456.2 ± 30 | 21.3 | 0.50 | 0.2 | 42.3 | 40.9 |
Disclaimer/Publisher’s Note: The statements, opinions and data contained in all publications are solely those of the individual author(s) and contributor(s) and not of MDPI and/or the editor(s). MDPI and/or the editor(s) disclaim responsibility for any injury to people or property resulting from any ideas, methods, instructions or products referred to in the content. |
© 2025 by the authors. Licensee MDPI, Basel, Switzerland. This article is an open access article distributed under the terms and conditions of the Creative Commons Attribution (CC BY) license (https://creativecommons.org/licenses/by/4.0/).
Share and Cite
Hu, J.; Wu, J.; Liu, X.; Zhao, D.; Liang, L.; Peng, J. Influence of Y/Zn Ratio on Secondary Phase Strengthening of Mg-Y-Zn Alloy. Metals 2025, 15, 359. https://doi.org/10.3390/met15040359
Hu J, Wu J, Liu X, Zhao D, Liang L, Peng J. Influence of Y/Zn Ratio on Secondary Phase Strengthening of Mg-Y-Zn Alloy. Metals. 2025; 15(4):359. https://doi.org/10.3390/met15040359
Chicago/Turabian StyleHu, Jie, Jiageng Wu, Xiangquan Liu, Dong Zhao, Liang Liang, and Jian Peng. 2025. "Influence of Y/Zn Ratio on Secondary Phase Strengthening of Mg-Y-Zn Alloy" Metals 15, no. 4: 359. https://doi.org/10.3390/met15040359
APA StyleHu, J., Wu, J., Liu, X., Zhao, D., Liang, L., & Peng, J. (2025). Influence of Y/Zn Ratio on Secondary Phase Strengthening of Mg-Y-Zn Alloy. Metals, 15(4), 359. https://doi.org/10.3390/met15040359