Article

Corrosion Behavior of Mild Steel in Various Environments Including CO2, H2S, and Their Combinations

National Engineering Laboratory of Advanced Coating Technology for Metal Materials, Central Iron & Steel Research Institute, Beijing 100081, China
*
Author to whom correspondence should be addressed.
Metals 2025, 15(4), 440; https://doi.org/10.3390/met15040440
Submission received: 12 March 2025 / Revised: 8 April 2025 / Accepted: 12 April 2025 / Published: 15 April 2025

Abstract

:
This paper investigates the corrosion behavior of mild steel in simulated oilfield wastewater under CO2, H2S, and their mixture. Using the electrical resistance method, the corrosion rates were monitored, and the influence of corrosion product films on overall performance was analyzed. The results show that the CO2/H2S mixture causes the highest corrosion rate. Metallographic examination and X-ray diffraction (XRD) provided insights into the nature of the corrosion products formed on the steel surface. While hydrogen sulfide (H2S) does not prevent general corrosion, it plays a role in mitigating localized damage. Corrosion leads to deep, narrow pits that weaken the structural integrity without significant surface damage, making it more dangerous than uniform corrosion. In CO2-only environments, electrochemical reactions form protective oxide layers. However, H2S alters this process by forming iron sulfides (FeS), which are less protective but still act as a barrier against further corrosion. In mixed CO2/H2S environments, interactions between the gases complicate the corrosion dynamics, increasing medium aggressiveness and accelerating material degradation. Understanding these mechanisms is critical for the petroleum industry, where equipment is exposed to harsh conditions with varying CO2 and H2S concentrations. Recognizing the dual role of H2S—its inability to inhibit general corrosion but its effectiveness in reducing pitting—can guide material selection and inhibitor development. This knowledge enhances the durability and safety of oil and gas infrastructure by addressing the most damaging forms of corrosion.

1. Introduction

In the realm of oil and gas production, the aqueous phase present in hydrocarbon streams stands out as a significant contributor to the corrosion of pipelines and associated equipment. This issue is notably compounded when hydrogen sulfide (H2S) and carbon dioxide (CO2) are dissolved within the aqueous phase, thereby fostering an environment that is highly conducive to corrosion [1,2,3,4,5]. Over the past decade, the exploitation of both established and newly discovered H2S-containing reservoirs has gained momentum, paralleled by the increasing adoption of Carbon Capture, Utilization, and Storage (CCUS) technologies as a pivotal strategy toward achieving carbon neutrality. However, this transition is not without challenges, as the extraction process from these reservoirs invariably introduces substantial amounts of CO2 and H2S, intensifying the issues of corrosion and erosion [6,7,8,9,10,11].
The simultaneous presence of CO2 and H2S presents a complex scenario in the context of oil and gas field development, where each of these corrosive agents exhibits distinct chemical characteristics. Their interaction within the surface systems further complicates the corrosion dynamics, collectively exerting a detrimental impact on metallic infrastructure [12,13]. Hydrogen sulfide, in particular, displays a multifaceted corrosive behavior that can either accelerate or mitigate corrosion processes depending on various factors such as the environmental pH, temperature, redox potential, the condition of the metal surface, and the nature of the corrosion medium and the resulting corrosion product films [14,15,16,17,18]. The corrosion products formed in the presence of H2S are notably diverse, ranging from mackinawite (FeS1−x) to cubic ferrous sulfide (FeS), pyrrhotite (Fe7S8), troilite (Fe1−xS), pyrite (FeS2), and greigite (Fe3S4) [19,20,21,22]. This variability poses a significant challenge in the accurate identification and quantification of corrosion products, a critical aspect of effective corrosion monitoring [10,23,24].
Several factors, including temperature, gas composition, and fluid velocity, influence CO2 and H2S corrosion mechanisms. Recent studies focus on the competitive growth and protective efficacy of corrosion product films in mixed CO2/H2S environments. Although individual CO2 and H2S corrosion mechanisms are well understood, their combined effects remain complex and under investigation. CO2 primarily causes corrosion via carbonic acid formation, leading to metal degradation, while H2S introduces additional complexity, requiring a deeper understanding of their synergistic impacts on corrosion processes. Currently, more research has been conducted on the competitive growth mechanisms, composition, and protective effects of corrosion product films under combined CO2 and H2S conditions, while studies on the individual mechanisms of CO2 or H2S corrosion are more mature. When only CO2 is present, its corrosion mechanism is as follows [25,26,27,28,29,30]:
CO2 (g) + H2O ⇋ H2CO3 (aq)
2H+ (aq) + 2e → H2 (g) (pH < 4)
2H2CO3 (aq) + 2e → H2 (g) + 2HCO3 (aq) (4 ≤ pH < 6)
2HCO3 (aq) + 2e → H2 (g) + 2CO32− (aq) (pH ≥ 6)
Fe (s) → Fe2+ (aq) + 2e
When only H2S is present, the corrosion mechanism is as follows:
H2S (g) + e →H+ (aq) + HS (aq)
HS (aq) + e →H+ (aq) + S2− (aq)
Fe (s) → Fe2+ (aq) + 2e
Fe (s) + H2S (g) → FeS (g) + H2 (g)
Fe (s) + H2S (g) → FeS1−x (g) + H2 (g)
The corrosion mechanism in mixed CO2-H2S environments remains a key research focus. While it is widely accepted that CO2 promotes corrosion, the effect of H2S in combination with CO2 is still debated, with studies suggesting both synergistic and antagonistic interactions [31]. The mechanism of corrosion is also an important research direction for CO2 and H2S corrosion, and the argument that CO2 promotes the occurrence of corrosion is unanimous, but two opposing viewpoints promote and inhibit the coexistence of H2S and CO2-H2S alone [32,33,34].
ER (electrical resistance) probes and corrosion coupons both enable effective corrosion data analysis. However, ER probes are rarely used in laboratory studies. In this study, ER probes are used for the first time to simulate wastewater containing CO2 and H2S, which provides theoretical support and practical guidance for the application of ER probes in sulfur-containing environments, especially for the matching between the data of ER probes and corrosion coupons [35,36]. We note that in CO2 and H2S studies, the corrosion product films are positively characterized in various ways, and there are few cross-section characterization studies of the corrosion product films. In this study, we have carried out the relevant cross-section studies to find out more characterization of CO2 and H2S corrosion [37].
This study aims to address these gaps by focusing on the corrosion behavior of mild steel under simulated CO2/H2S wastewater conditions. Specifically, it employs ER probes for the first time in such environments, providing a novel approach to corrosion monitoring. Additionally, the research emphasizes cross-sectional characterization of corrosion product films, an area that remains underexplored. By correlating ER probe data with traditional corrosion coupon results, this work seeks to enhance the understanding of CO2/H2S corrosion mechanisms, offering both theoretical insights and practical guidance for mitigating corrosion in sulfur-containing environments.

2. Experimental Procedures

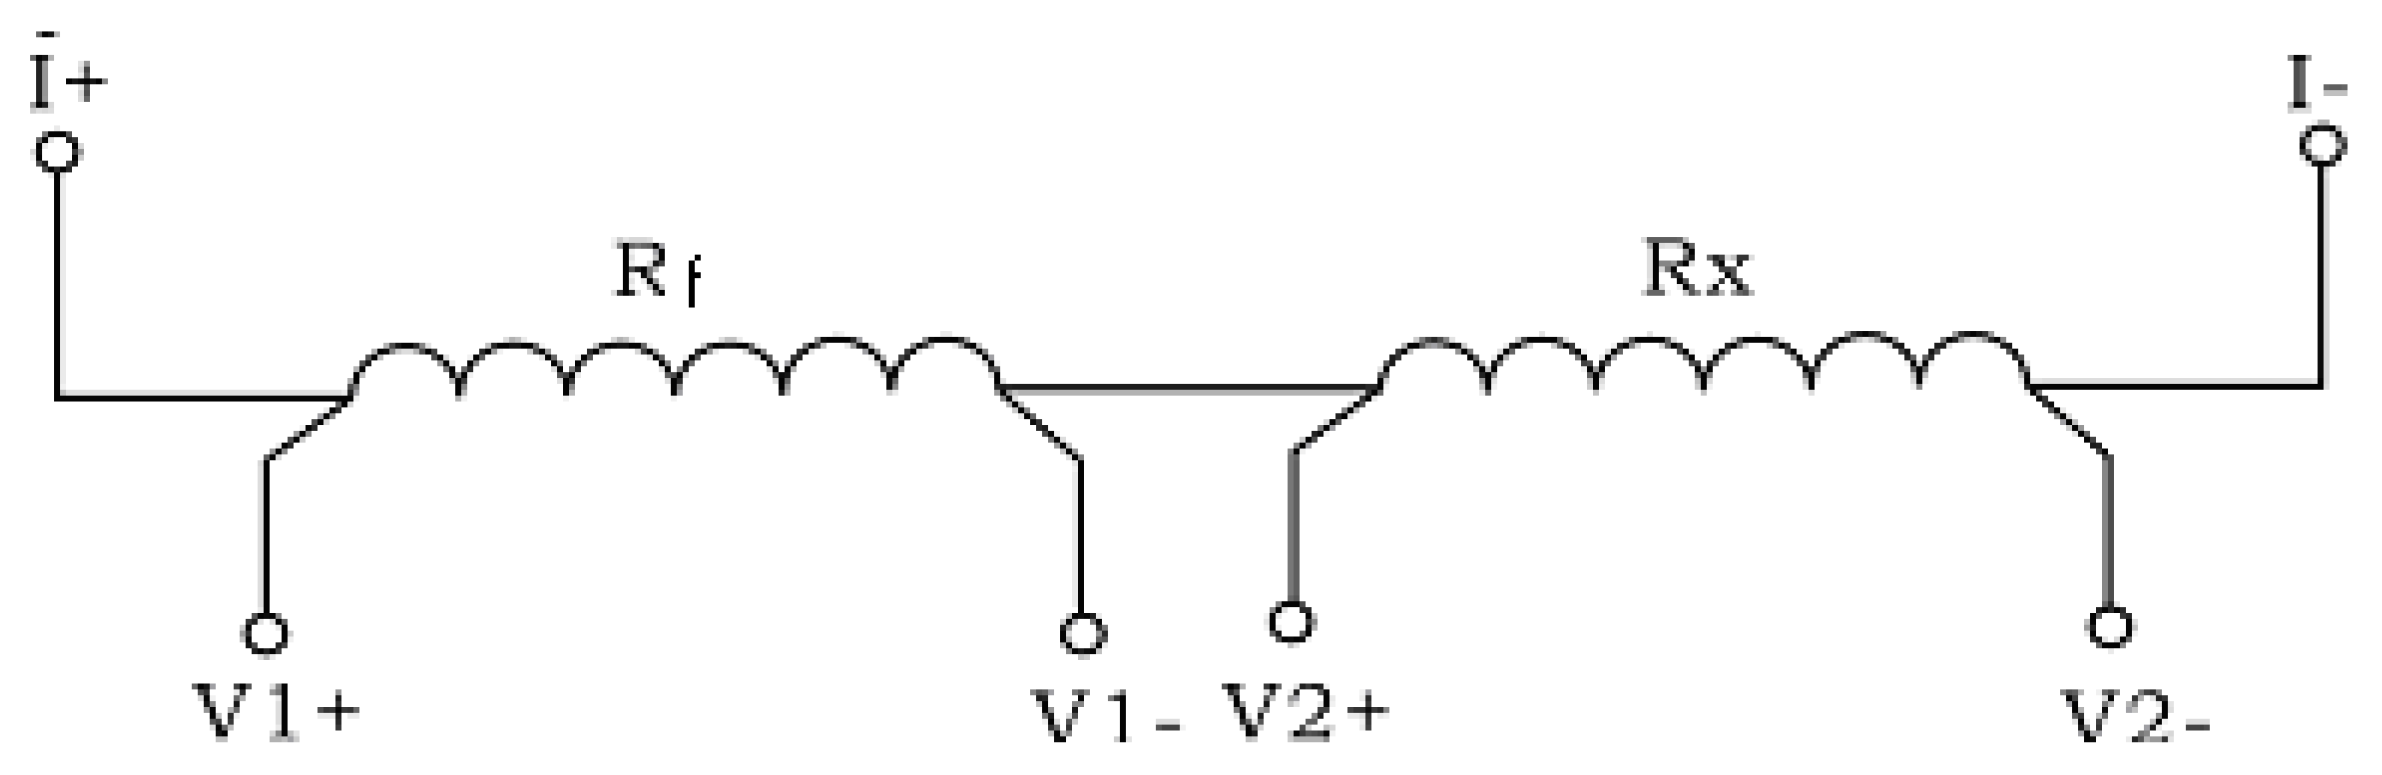
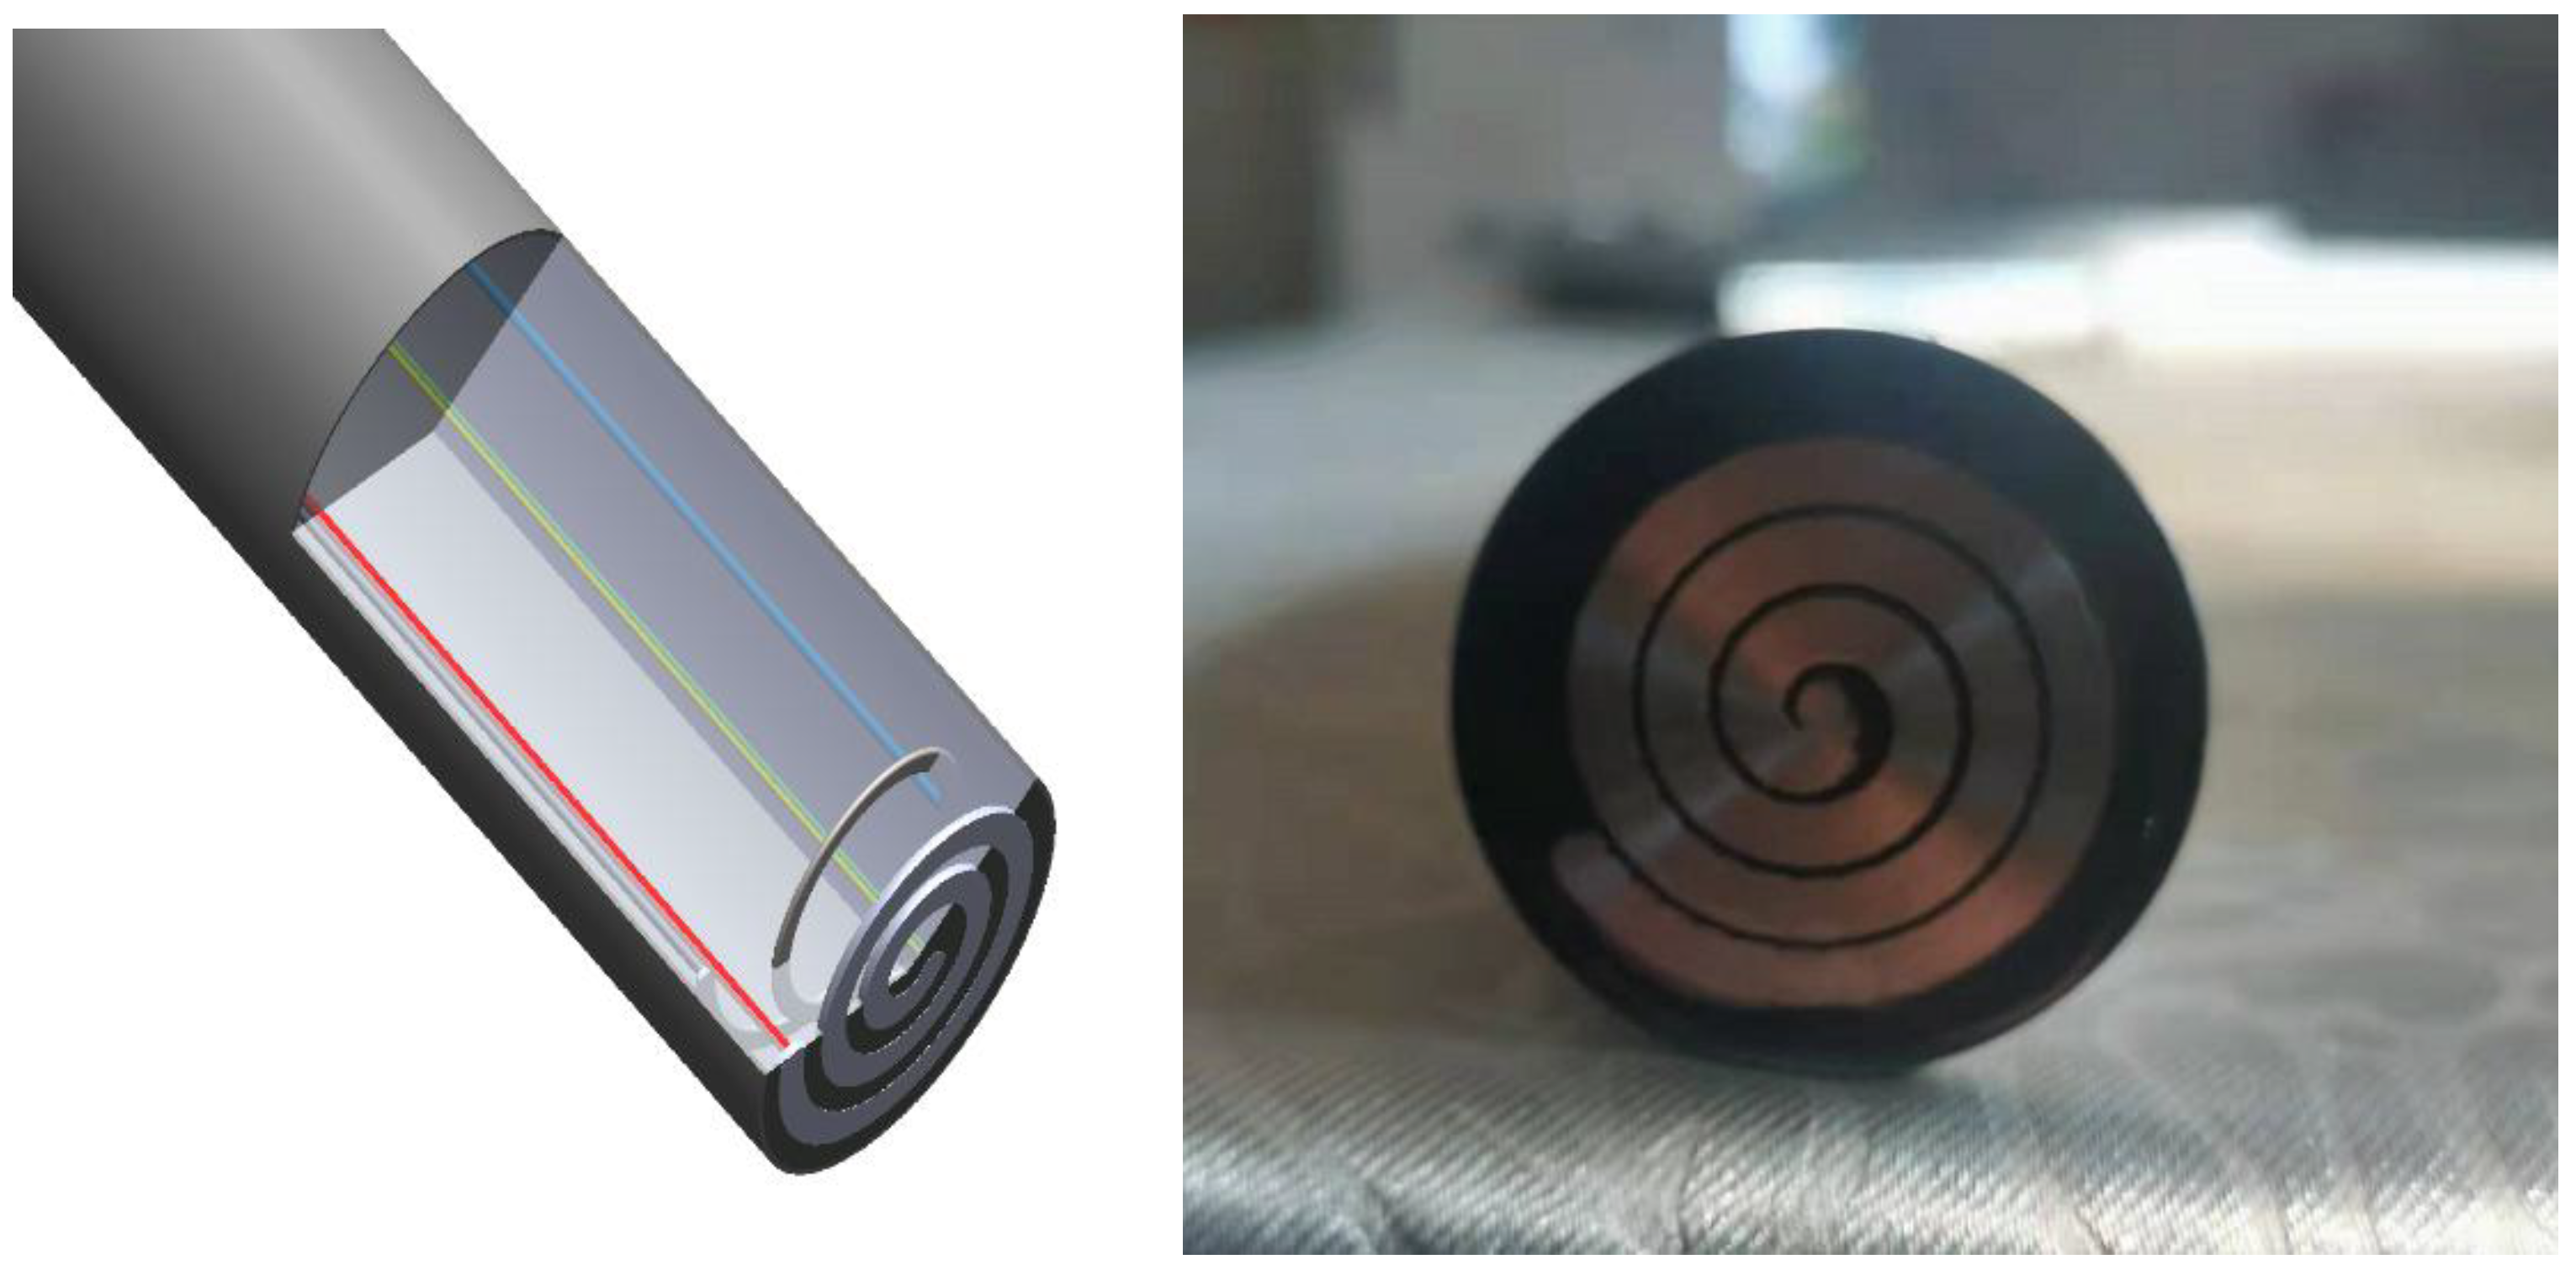
2.1. Test Materials and ER Probes

The tests were conducted using 20# steel in a normalized state, a commonly used material in oil and gas fields, and its chemical composition is shown in Table 1. The 20# steel was machined into a corrosion coupon specimen with a size of 50 mm × 10 mm × 2.5 mm. The chemical composition of 20# steel has been provided in Table 1. At the same time, the material for the ER probe chip was prepared, with the chip having a thickness of 0.5 mm for the large plane ER probe. A total of four were prepared, with one for each group of medium (basic solution, basic solution+CO2, basic solution+H2S, and basic solution+CO2-H2S), and put into use at the same time with the corrosion coupons.
The ER probe calculates the corrosion allowance and corrosion rate by comparing the change in resistance of a surface-sensitive element during the corrosion process with the resistance of a reference element inside the probe [38]. The parameter Rx in Figure 1 and Figure 2 is a sensitive element in contact with the corrosive environment, which will gradually increase as corrosion proceeds, and Rf is a reference measurement element made of the same material but encapsulated inside the probe, which will not corrode and is in the same temperature region as Rx. Then, at the same time, the probe measures the partial voltage of the two resistors (Rf, Rx) at the two ends and calculates their ratio. Based on the ratio over time, at any moment, the remaining thickness, the amount of thinning, the corrosion rate changes, and other information can be calculated. The principle of the circuit is shown in Figure 3, with the current at both ends of the chip. From this, the values of Rf and Rx can be measured simultaneously and the ratio of Rx/Rf calculated to determine the remaining thickness and corrosion rate over time, as shown in Figure 1. The probe design and physical chip are shown in Figure 2.
Based on the standard ASTM G1-03 (2017) “Standard Practice for Preparing, Cleaning, and Evaluating Corrosion Test Specimens” [39], the corroded coupons were immersed in the etching solution at room temperature, subsequently soaked in distilled water and alcohol, and then dried using cold air. The coupons were reweighed to determine the individual mass (m1) after the removal of the corrosion products. The corrosion rate (CR) of the corrosion coupon was calculated according to Equation (11) [40].
C R = 87,600 Δ m ρ t S
where CR is the corrosion rate, mm year−1; Δmm = m1m0) represents the mass loss, g; t is the corrosion time, h; ρ is the physical density of the corroding steel, g·cm−3; and S is the surface of coupons, cm2.
The specific methodologies employed for the corrosion monitoring using ER probes are grounded in the NACE SP0775-2023 standard, “Preparation, Installation, Analysis, and Interpretation of Corrosion Coupons in Oilfield Operations” [41], the ASTM G96-90 (2018) standard, “Standard Guide for Online Monitoring of Corrosion in Plant Equipment (Electrical and Electrochemical Methods)” [42], and the ASTM B826-09 (2020) Standard Test Method for Monitoring Atmospheric Corrosion Tests by Electrical Resistance Probes [43]. The preparation and installation of the ER probes follow the guidelines outlined in the NACE SP0775-2023 standard. This includes selecting the appropriate probe materials that are representative of the system’s components, ensuring proper cleaning and conditioning of the probes, and installing them in locations that are representative of the expected corrosion conditions. The probes are typically installed in areas where the highest risk of corrosion is anticipated, such as near inlets, outlets, and regions with high flow velocities or turbulence. Data collection from the ER probes is conducted according to the ASTM G96-90 (2018) standard. This involves continuous monitoring of the electrical resistance of the probes over time. As corrosion occurs, the cross-sectional area of the probe decreases, leading to an increase in electrical resistance. The change in resistance is directly proportional to the rate of material loss due to corrosion. Regular calibration and maintenance of the measurement equipment are essential to ensure the accuracy and reliability of the data. The calculation of the corrosion rate (CR) for the electrical resistance probe is as shown in Equation (12):
C R = K 1 i c o r r ρ E W
where K1 is a constant; icorr is the corrosion current density, mA/cm2; and EW is the equivalent weight, g.
The probe data acquisition uses the six-channel electronic chip corrosion measurement instrument (Model: ECCM1200, developed by Beijing Guangyuan Keyou Technology Development Co., Ltd., Beijing, China), a device that has the advantages of high precision, high stability, and ease of operation, etc. The instrument has an independent manipulation/data analysis software, which can be realized in both online and offline mode of acquisition. This test adopts the online mode in which the signal acquisition interval is set to 20 min and the probe acquisition status and real-time data can be viewed at any time. Before the test, the probe was polished with 1000 mesh sandpaper and then cleaned with ionized water, degreased with anhydrous ethanol and acetone, blown dry by cold air, and put into a drying box for more than half an hour. Subsequently, a ten-thousandth electronic balance was used to accurately weigh and record the original weight of the corresponding specimen. The configured corrosive medium was placed in the electrolytic cell and heated to 60 °C in a water bath, and then the 14 parallel specimens were suspended and completely submerged in the corrosive medium in the electrolytic cell.

2.2. Experimental Equipment

To study the effect of H2S and CO2 gases on the data collected by the resistive probe, and to understand the mechanism of action of these gases on the corrosion of the probe through experimental observation and analysis while providing a theoretical basis for the practical application, we designed and constructed a set of simulation experimental devices on our own, as shown in Figure 3. The flow rate of CO2 or N2 was precisely controlled by the flow meter on the CO2 or N2 bottle. H2S gas was fed into the system through an H2S generator. The temperature of the solution system was maintained by an electrically heated water bath to simulate the actual working conditions. We utilized real-time monitoring and recording of the resistance probe data changes by setting the data acquisition interval to 25 min for corrosion data acquisition, downloading the data to the SD card at the end of the experiment, analyzing the data in the upper computer analysis software, and comparing the corrosion rates.

2.3. Condition of the Test Medium

The basic solution was provided by the China Petroleum Pipe Engineering Technology Research Institute (Langfang, China), and its composition is shown in Table 2 [44,45].

2.4. Experimental Procedure and Data Acquisition

The corrosive medium involved in this experiment is divided into four groups: basic solution, H2S alone, CO2 alone, and H2S and CO2 at the same time. Table 3 shows the conditions of the medium in this experiment. Simulated oilfield effluent was configured as the basic solution for this set of experiments, with a solution volume of 1500 mL, and the solution pH was titrated to pH = 5 using a standard 1 mol/L hydrochloric acid solution and monitored using a pH meter.
The probe was inserted into the center of the rubber stopper and placed on the beaker, and the probe was connected to the six-channel detector line. The corrosion coupon was tied with enameled copper wire and hung inside the beaker, and the height was adjusted so that the probe and the corrosion coupon were in the same position. A water bath was used to heat the beaker to an experimental temperature of 60 ± 1 °C. Pure N2 gas was continuously introduced into the basic solution for stirring, and the N2 flow rate was 2 cm3/s. The total amount of N2 was controlled by adjusting the flow rate of the gas cylinder. When configuring the CO2-saturated solution, pure CO2 gas was continuously introduced into the basic solution, and the solution was stirred. When configuring the H2S-saturated solution, H2S gas was generated by dropping sulfuric acid into sodium sulfide solution in the reaction flask through the split funnel into the basic solution beaker, and the reaction rate was controlled by controlling the speed of sulfuric acid dropping through the valve of the split funnel to saturate the H2S in the basic solution. For configuring the CO2 and H2S coexistence in the corrosive media, the process is similar to the above, with the modification that the CO2 and H2S gases are passed at the same time.
A high-precision data collector is used to collect the resistance value of the resistance probe in real-time. The collected data need to be transferred to a computer or other storage device for storage and processing through a data transmission module. At the same time, the corrosion rate of the corrosion coupon piece is calculated and compared with the corrosion rate data acquired by the probe. After the corrosion products are removed, the specimen is washed with deionized water, anhydrous ethanol, and acetone; blown dry by cold air; and placed in a drying box. Twenty-four hours later, the specimen is removed and weighed with an electronic balance, the corresponding data are recorded, and finally the corrosion rate of the pendant is calculated by the corrosion rate formula.

3. Results and Discussion

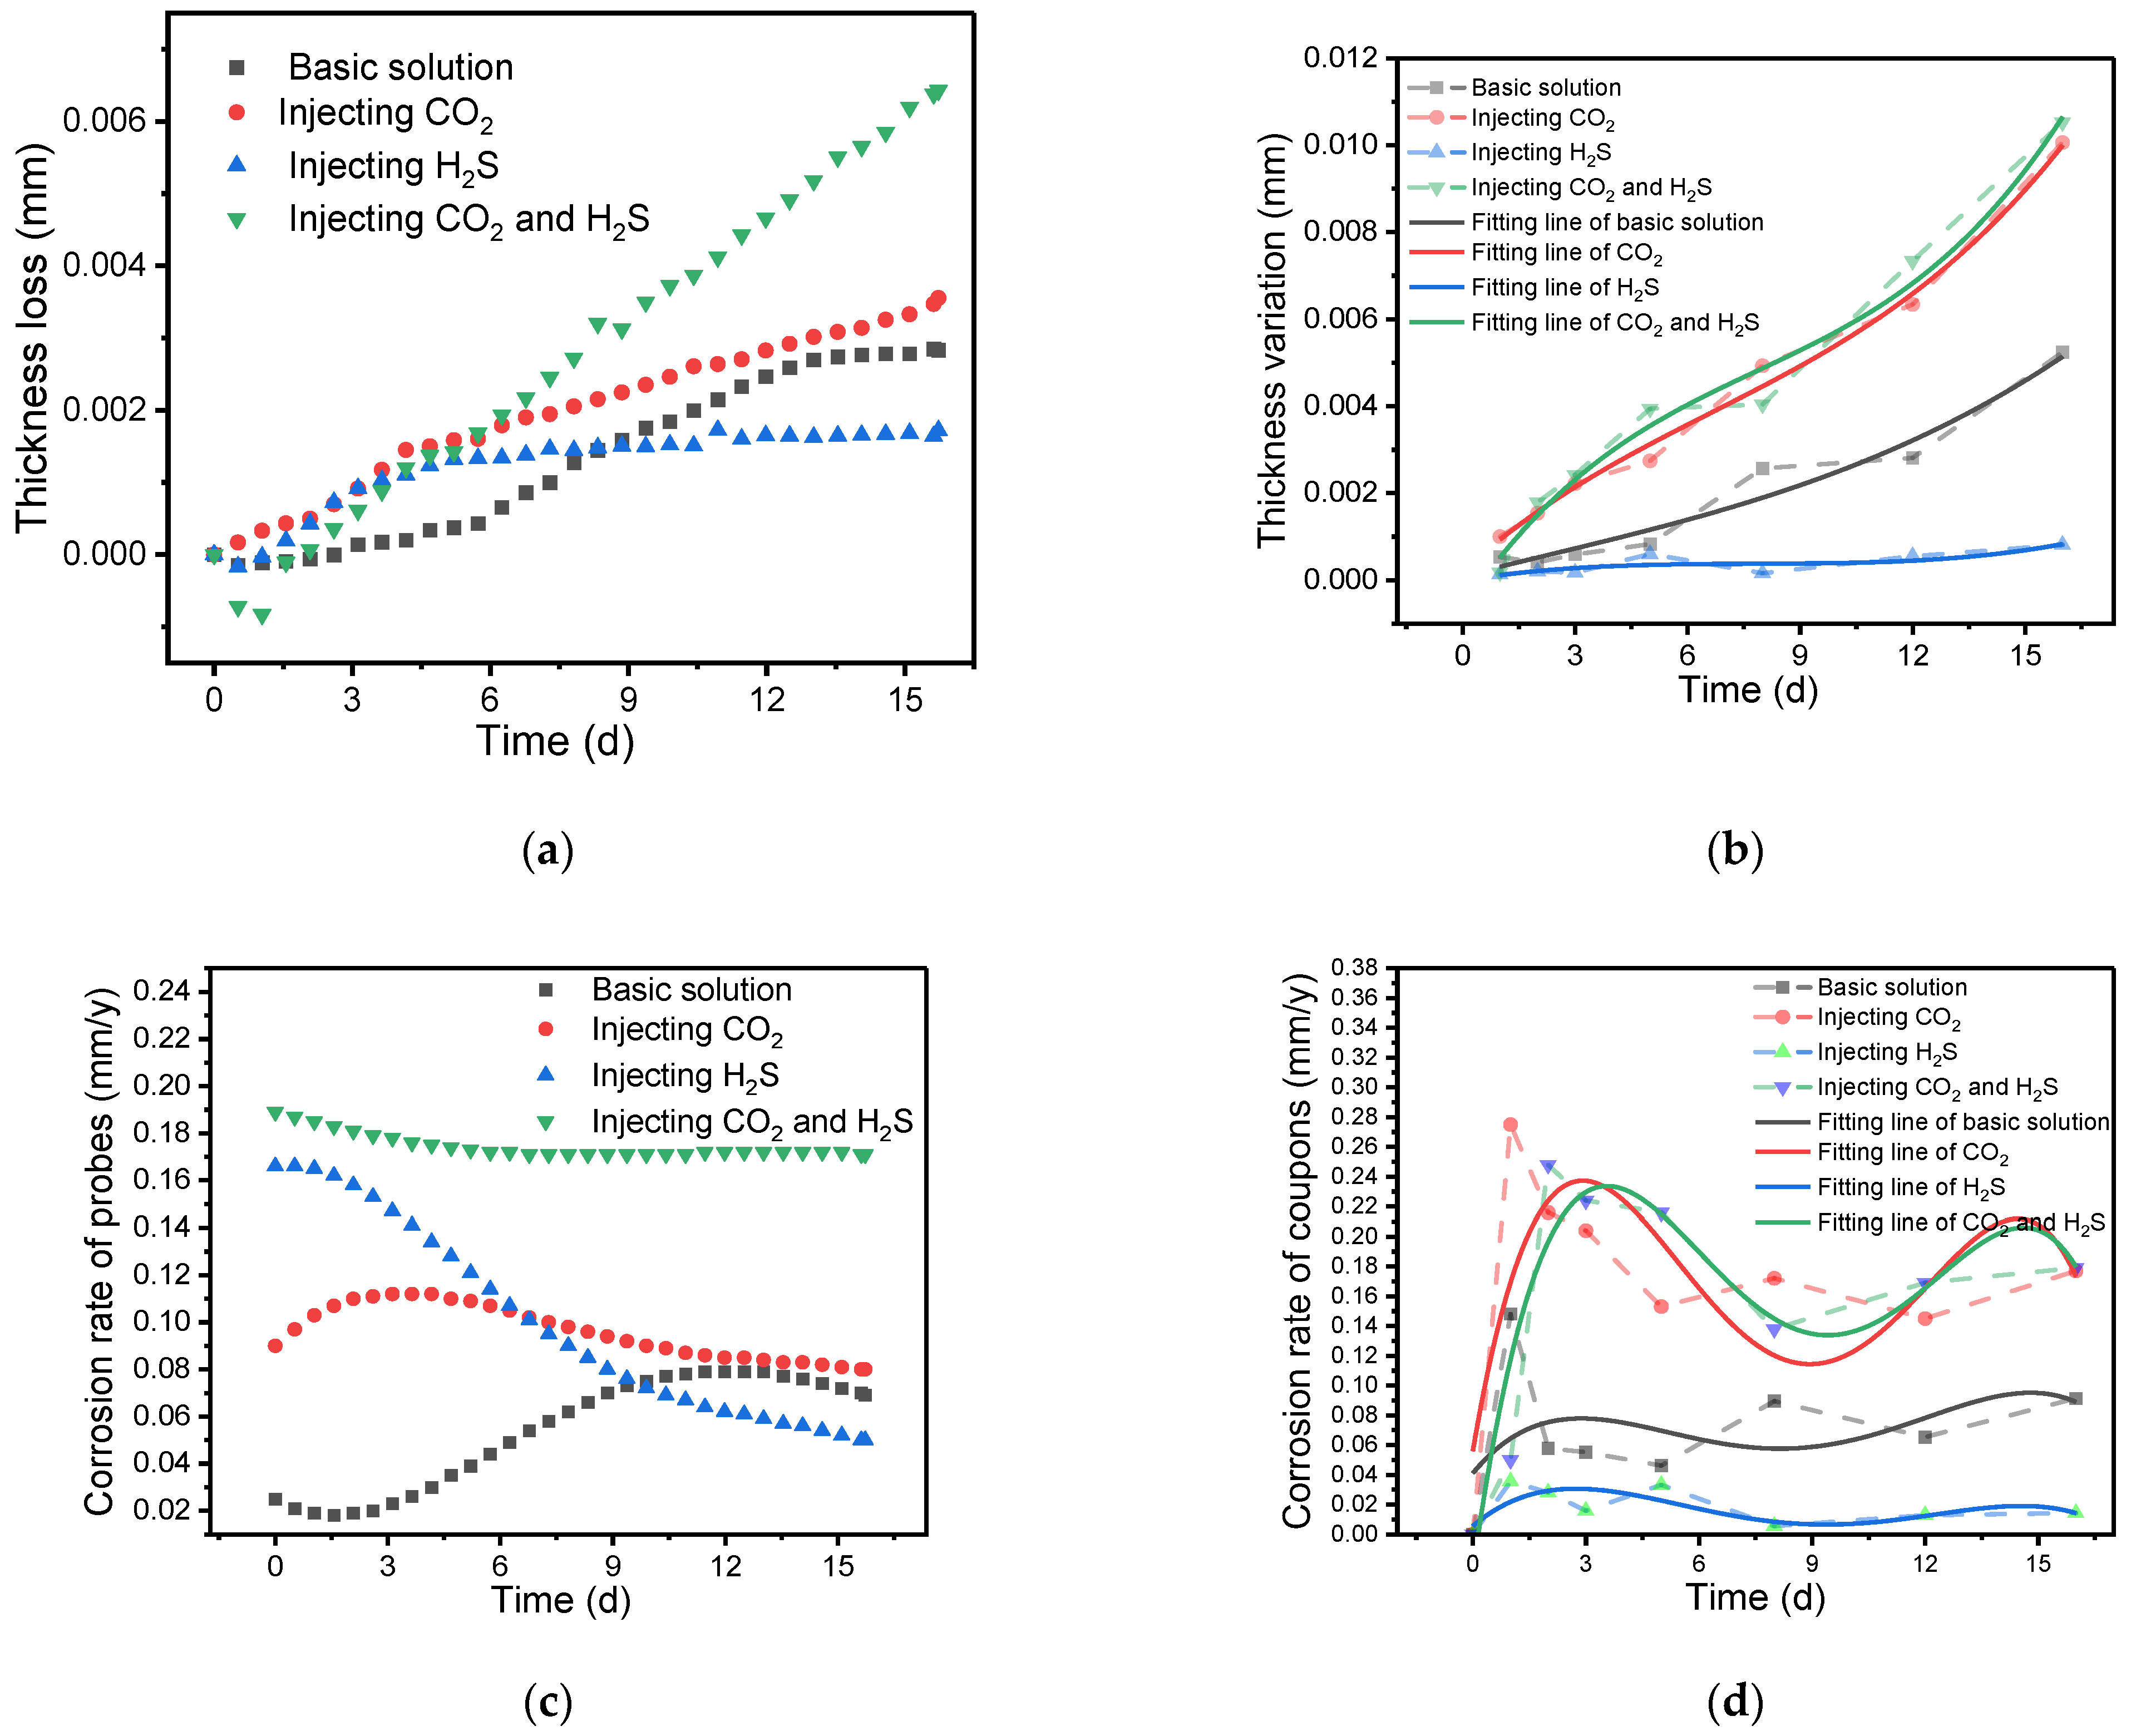
3.1. Analysis of Corrosion Rate

The corrosion monitoring data obtained from the ER probes and the corrosion coupons are presented in Figure 4. These data provide critical insights into the corrosion rates and patterns occurring within the system under study. Although the corrosion rates measured by the two methods show slight differences at the end of the test period, the overall trend remains consistent. The thickness losses of the four sets of ER probes are shown in Figure 4a, while the thickness losses of the corresponding corrosion coupons, along with their fitted data, are presented in Figure 4b. The cumulative corrosion rates of the four sets of ER probes are shown in Figure 4c, and the cumulative corrosion rates of the corrosion coupons, with their fitted data, are shown in Figure 4d. The analysis of data from the corrosion measurements of the ER probes and coupons is illustrated in Table 4. Additionally, the differences and similarities between the ER probes and corrosion coupons in the corrosion monitoring process are shown in Table 5.
As shown in Figure 4a, the initial corrosion rate of 20# steel is higher when only CO2 is energized, with the formation of loose and low-coverage FeCO3 on the surface at first that is then unstably transformed into Fe(OH)3. In contrast, the initial corrosion rate of 20# steel is higher when H2S is energized alone, but the rate decreases significantly with the formation of a dense FeS corrosion product layer, showing the H2S inhibition of corrosion. It should be noted that although H2S can inhibit uniform corrosion, it may still cause hydrogen embrittlement, but this point is not within the scope of this study. When CO2 and H2S coexisted, the corrosion rate was significantly higher than when both were present alone. This is because CO2 increased the film-forming potential of FeS, while H2S accelerated the corrosion process. However, after about 4 days, the growth of the corrosion product film reaches an inflection point and does not continue to grow, resulting in a very low slope of the metal loss curve at a later stage [46,47,48]. At this point, the metal loss curve of the basic solution exceeds that of H2S, ultimately resulting in a significantly lower corrosion rate for H2S than for the basic solution. Throughout the experiment, the metal loss curve of the basic solution has been located above the H2S curve, indicating that H2S has an obvious inhibitory effect on corrosion from the beginning, similar to the role of corrosion inhibitors, which is also consistent with the findings reported in the literature [15]. The finding that H2S exhibits a significant corrosion inhibition effect when the ambient concentration of H2S (hydrogen sulfide) is high is in agreement with the results of existing studies. It was shown that at low H2S concentrations, the generated sulfide is not sufficiently transformed into a stable layer of sulfide iron ore to form an effective protective barrier but may instead promote the corrosion process. Higher concentrations of H2S can induce the formation of a more stable and continuous sulfide protective layer, which can effectively inhibit the corrosion reaction on metal surfaces. The mechanism behind this phenomenon lies in the fact that the sulfides formed under high H2S concentration conditions are better able to cover the metal surface, preventing further chemical reactions such as water molecules and oxygen from coming into contact with the metal and reducing the likelihood of corrosion. In contrast, in low H2S concentration environments, the sulfide formation is incomplete and tends to leave exposed metal surfaces, and these unprotected areas become hot spots for corrosion to occur, accelerating the corrosion process. Therefore, the concentration of H2S has a significant effect on corrosion behavior, and understanding this is critical to designing corrosion protection measures [49].
As shown in Figure 4d, the thickness loss data curves of all three sets of probes energized with CO2, H2S, and CO2-H2S mixtures showed an inflection point when the corrosion was carried out up to 4.5 days, and the slopes of the metal corrosion of CO2 and CO2-H2S remained the same in the initial stage. However, an inflection point in the corrosion process for CO2 occurred on day 5, resulting in a slightly lower metal loss in the middle and late stages than in the early stages. However, for the CO2-H2S condition, there was no significant inflection point throughout the corrosion process, and the metal loss curve continued to run at a stable slope until the end of the experiment. This inflection point may be a sign of the formation of the corrosion product film, after which the corrosion product film begins to rupture. Moreover, this phenomenon can only be detected by real-time monitoring of the resistance probe, and the conventional corrosion loss of the corrosion coupon film cannot reflect this kind of corrosion process.
As shown in Table 6 and Table 7, in the basic solution, the corrosion rate is low and then moderate; in the CO2-saturated solution, the corrosion rate is moderate; in the H2S-saturated solution, the corrosion rate is high and then decreases to moderate; in the presence of both CO2 and H2S, the corrosion rate is high all the time. For the data of the loss-of-weight pendant, regarding the corrosion rate in the basic solution, the corrosion rate is first high and then moderate; in the CO2-saturated solution, the corrosion rate is high; in the H2S-saturated solution, the corrosion rate is first moderate and then decreases to low; when both CO2 and H2S are present at the same time, the corrosion rate is moderate or even high.

3.2. Corrosion Product Analysis and Morphology Observation

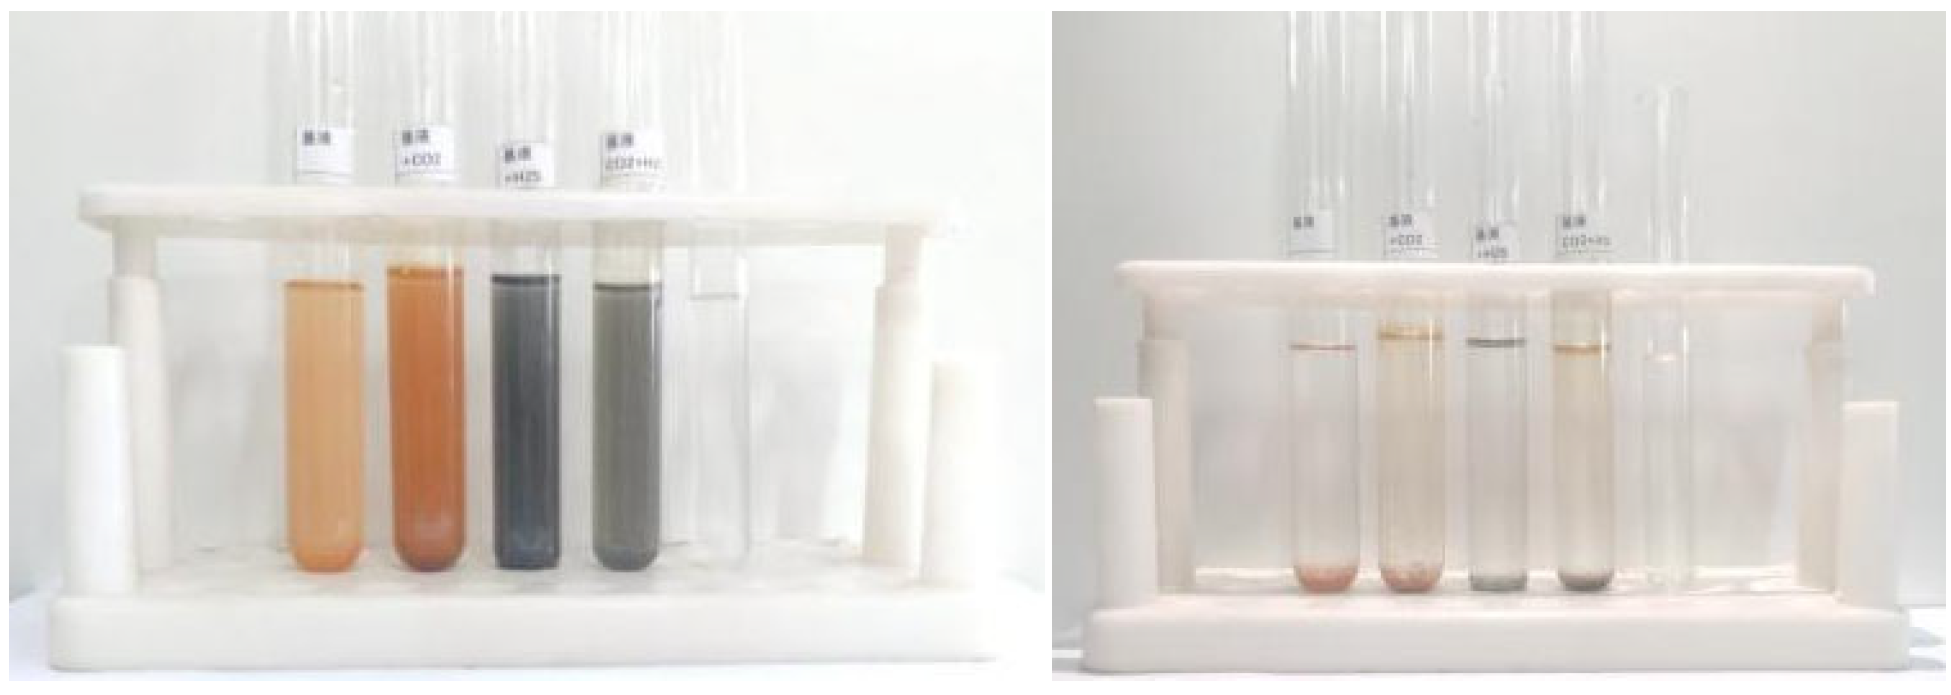
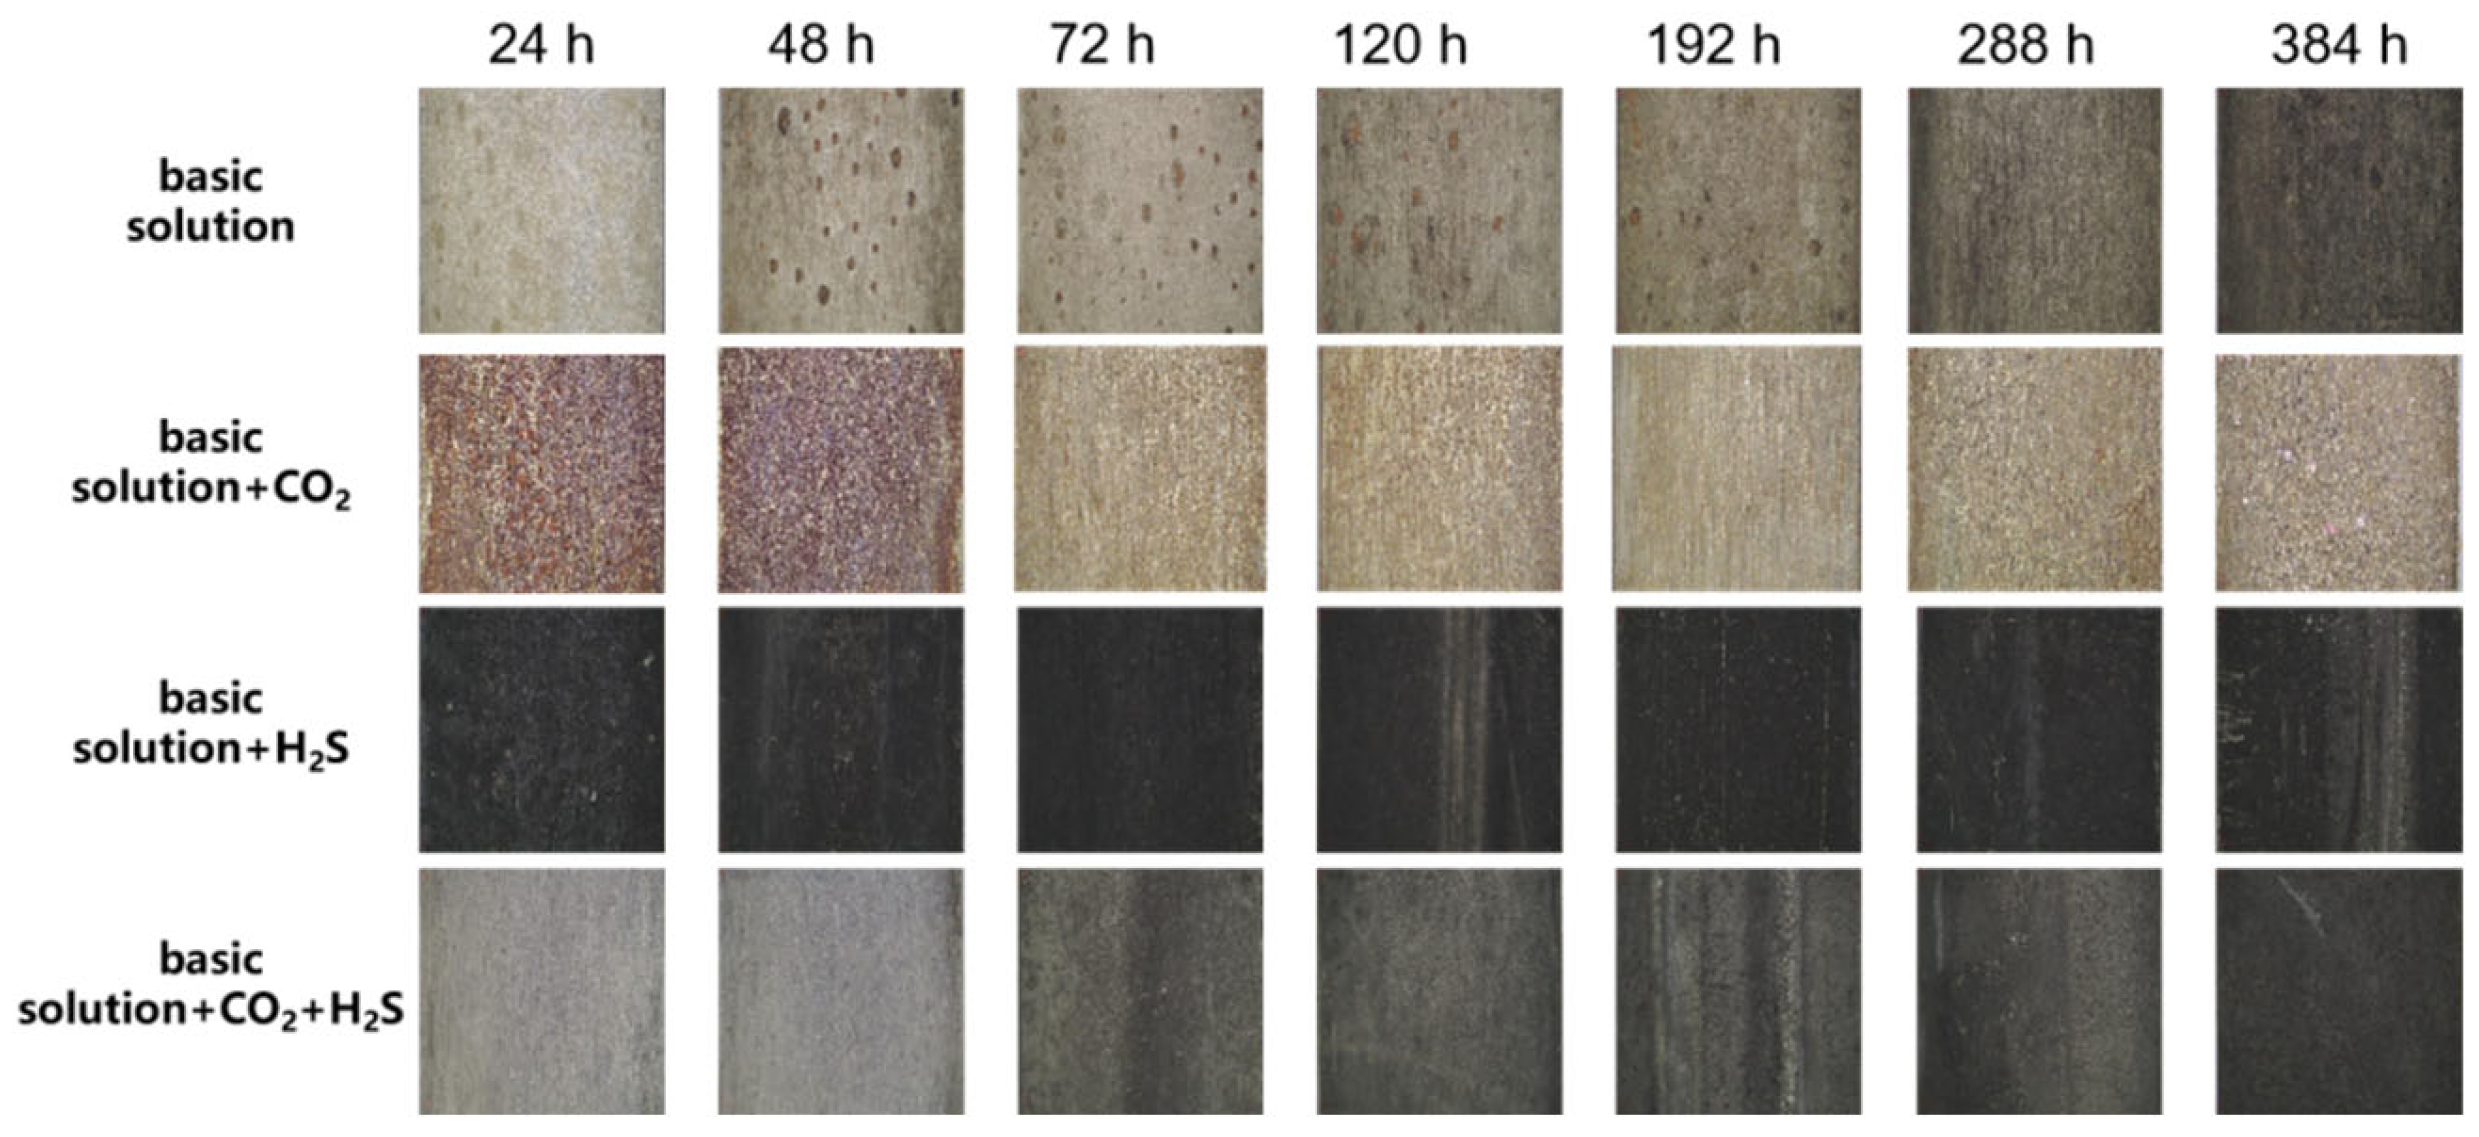
3.2.1. Color Analysis of Corrosion Precipitates

The types of corrosion products as well as the corrosion process and mechanism can be intuitively analyzed based on the change in the color of the corrosion product solution. As can be seen from Figure 5 and Figure 6. The color of the four solutions is different, and the corrosion products have partially entered the corrosion medium solution. The corrosion product solution of the original liquid is light brown, indicating that the 20# steel oxidation reaction occurs to form iron hydroxides or oxides. The corrosion product solution after the passage of CO2 is dark brown, as the presence of CO2 may contribute to the formation of carbonates on the surface of the metal, where the deepening of the color may imply the formation of more solid precipitates, including iron oxides or carbonates; the corrosion product solution after the passage of H2S is dark gray. This is due to the fact that H2S is a strong reducing agent that can react with metal ions to form metal sulfides, and FeS is a common black solid, so the darker gray color may reflect the formation of FeS. The solution of corrosion products with the simultaneous passage of CO2 and H2S is a light gray color, and light gray and light brown corrosion products can be seen after the precipitation; this is due to the fact that with the combined action of CO2 and H2S, the formation of a mixture of sulfides and carbonates is generated, resulting in a lighter color.

3.2.2. XRD Analysis of Corrosion Precipitation Products

As shown in Figure 7, the corrosion products in the basic solution are mainly lepidocrocite (γ-FeOOH), with PDF card number 38-0032, and a small amount of Fe2O3, with PDF card number 39-1346. After the introduction of CO2, the products in the corrosion medium are still dominated by γ-FeOOH, with PDF card number 08-0098, and a small amount of Fe2O3 and trace FeCO3, with PDF card numbers 33-0664 and 29-0696, respectively. There is also a small amount of Fe2O3 and trace amounts of FeCO3, whose PDF card numbers are 33-0664 and 29-0696. After the passage of H2S, the corrosion medium products are FeS2 and Fe (OH) 3-based, with PDF card numbers 42-1340 and 46-1436, respectively, in addition to a small amount of FeSO4-H2O, whose PDF card number is 45-1365. When CO2 and H2S are introduced at the same time, the products in the corrosive medium are mainly Fe(OH)3 and FeS, with PDF card numbers 46-1436 and 23-1123, respectively, in addition to some FeS2 and a small amount of FeSO4-H2O, with PDF card numbers 42-1340 and 45-1365, respectively.
From the above results, it can be seen that in an environment where CO2 and H2S coexist, CO2 may react with the metal first to form FeCO3, but since sulfide is more stable than FeCO3, its final corrosion product is mainly sulfide even if the content of H2S is less. Analyzed in terms of the solubility product constant (Ksp), when CO2 is dissolved in water, it reacts with water molecules to form H2CO3, which is further decomposed into hydrogen ions H+ and HCO3. In an acidic environment, iron begins to undergo anodic oxidation to form Fe2+, and the resulting Fe2+ can react with H2CO3 or HCO3 present in solution to form an unstable FeCO3 precipitate, but FeCO3, which has a higher value of the solubility product constant (Ksp) for iron carbonate, is more soluble in water as compared to other iron compounds that may be formed such as Fe(OH)2 or Fe(OH)3. This means that even if an FeCO3 precipitate is formed, it tends to re-dissolve back into solution, forming a protective layer that is not stable enough (such as FeCO3) to break or fall off, resulting in the bare, fresh metal surface being re-exposed to corrosive environments, thus accelerating the overall corrosion process [50]. Table 8 lists the solubility product constants (Ksp) of the major iron-containing compounds in the system. Its basic calculation formula is shown in Equations (13)–(19). As a result, unstable FeCO3 precipitates are first formed during the corrosion process, then FeCO3 precipitates are converted to Fe(OH)3 precipitates, and subsequently, Fe(OH)3 may be dehydrated into more stable corrosion products, such as γ-FeOOH.
From the chemical potential point of view, the transformation of the stages of the corrosion process is a manifestation of the system’s reduced free energy. The chemical potential measures the effect of a substance on the Gibbs free energy change of a system under specific conditions. When iron comes into contact with CO2-containing water, Fe2+ is first produced, and then Fe2+ reacts with CO32− or HCO3 to form FeCO3 with a lower chemical potential. In the presence of oxygen, Fe2+ is further oxidized to the more stable Fe3+, which combines with OH to form the more stable Fe(OH)3. Each step of the transformation is a way for the system to reduce its total chemical potential through chemical reactions to reach a more stable state. The change in potential drives the substance from a higher to a lower potential until a new equilibrium is reached, a process influenced by the chemical composition and environmental factors such as temperature, pH, and oxygen concentration. The chemical reactions during corrosion are shown below:
Fe2+ + CO32− → FeCO3↓ or Fe2+ + HCO3 → FeCO3↓ + H+
In the presence of oxygen, ferrous ions (Fe2+) are further oxidized to trivalent iron ions (Fe3+). At the same time, iron carbonate may undergo a complex series of reactions, including partial dissolution followed by redeposition to iron hydroxide (Fe(OH)3).
4FeCO3 + O2 + 6H2O → 4Fe(OH)3 + 4CO2
Or directly by the oxidation of ferrous ions:
4Fe2+ + O2 + (6–8)H2O → 4Fe(OH)3 + (2–4)H+
The iron hydroxide (Fe(OH)3) formed can be dehydrated under the right conditions to form more stable rust products such as γ-FeOOH (acicular ferrite) or other forms of iron oxides.
2Fe(OH)3 → γ−Fe2O3 + 3H2O
FeCO3+HS → FeS + HCO3
3Fe2+ + 4H2O → Fe3O4 + 8H+ + 2e
Fe3O4 + 3H2S + 2H+ + 2e → 3FeS + 4H2O

3.3. Structural Analysis of Corrosion Product Films

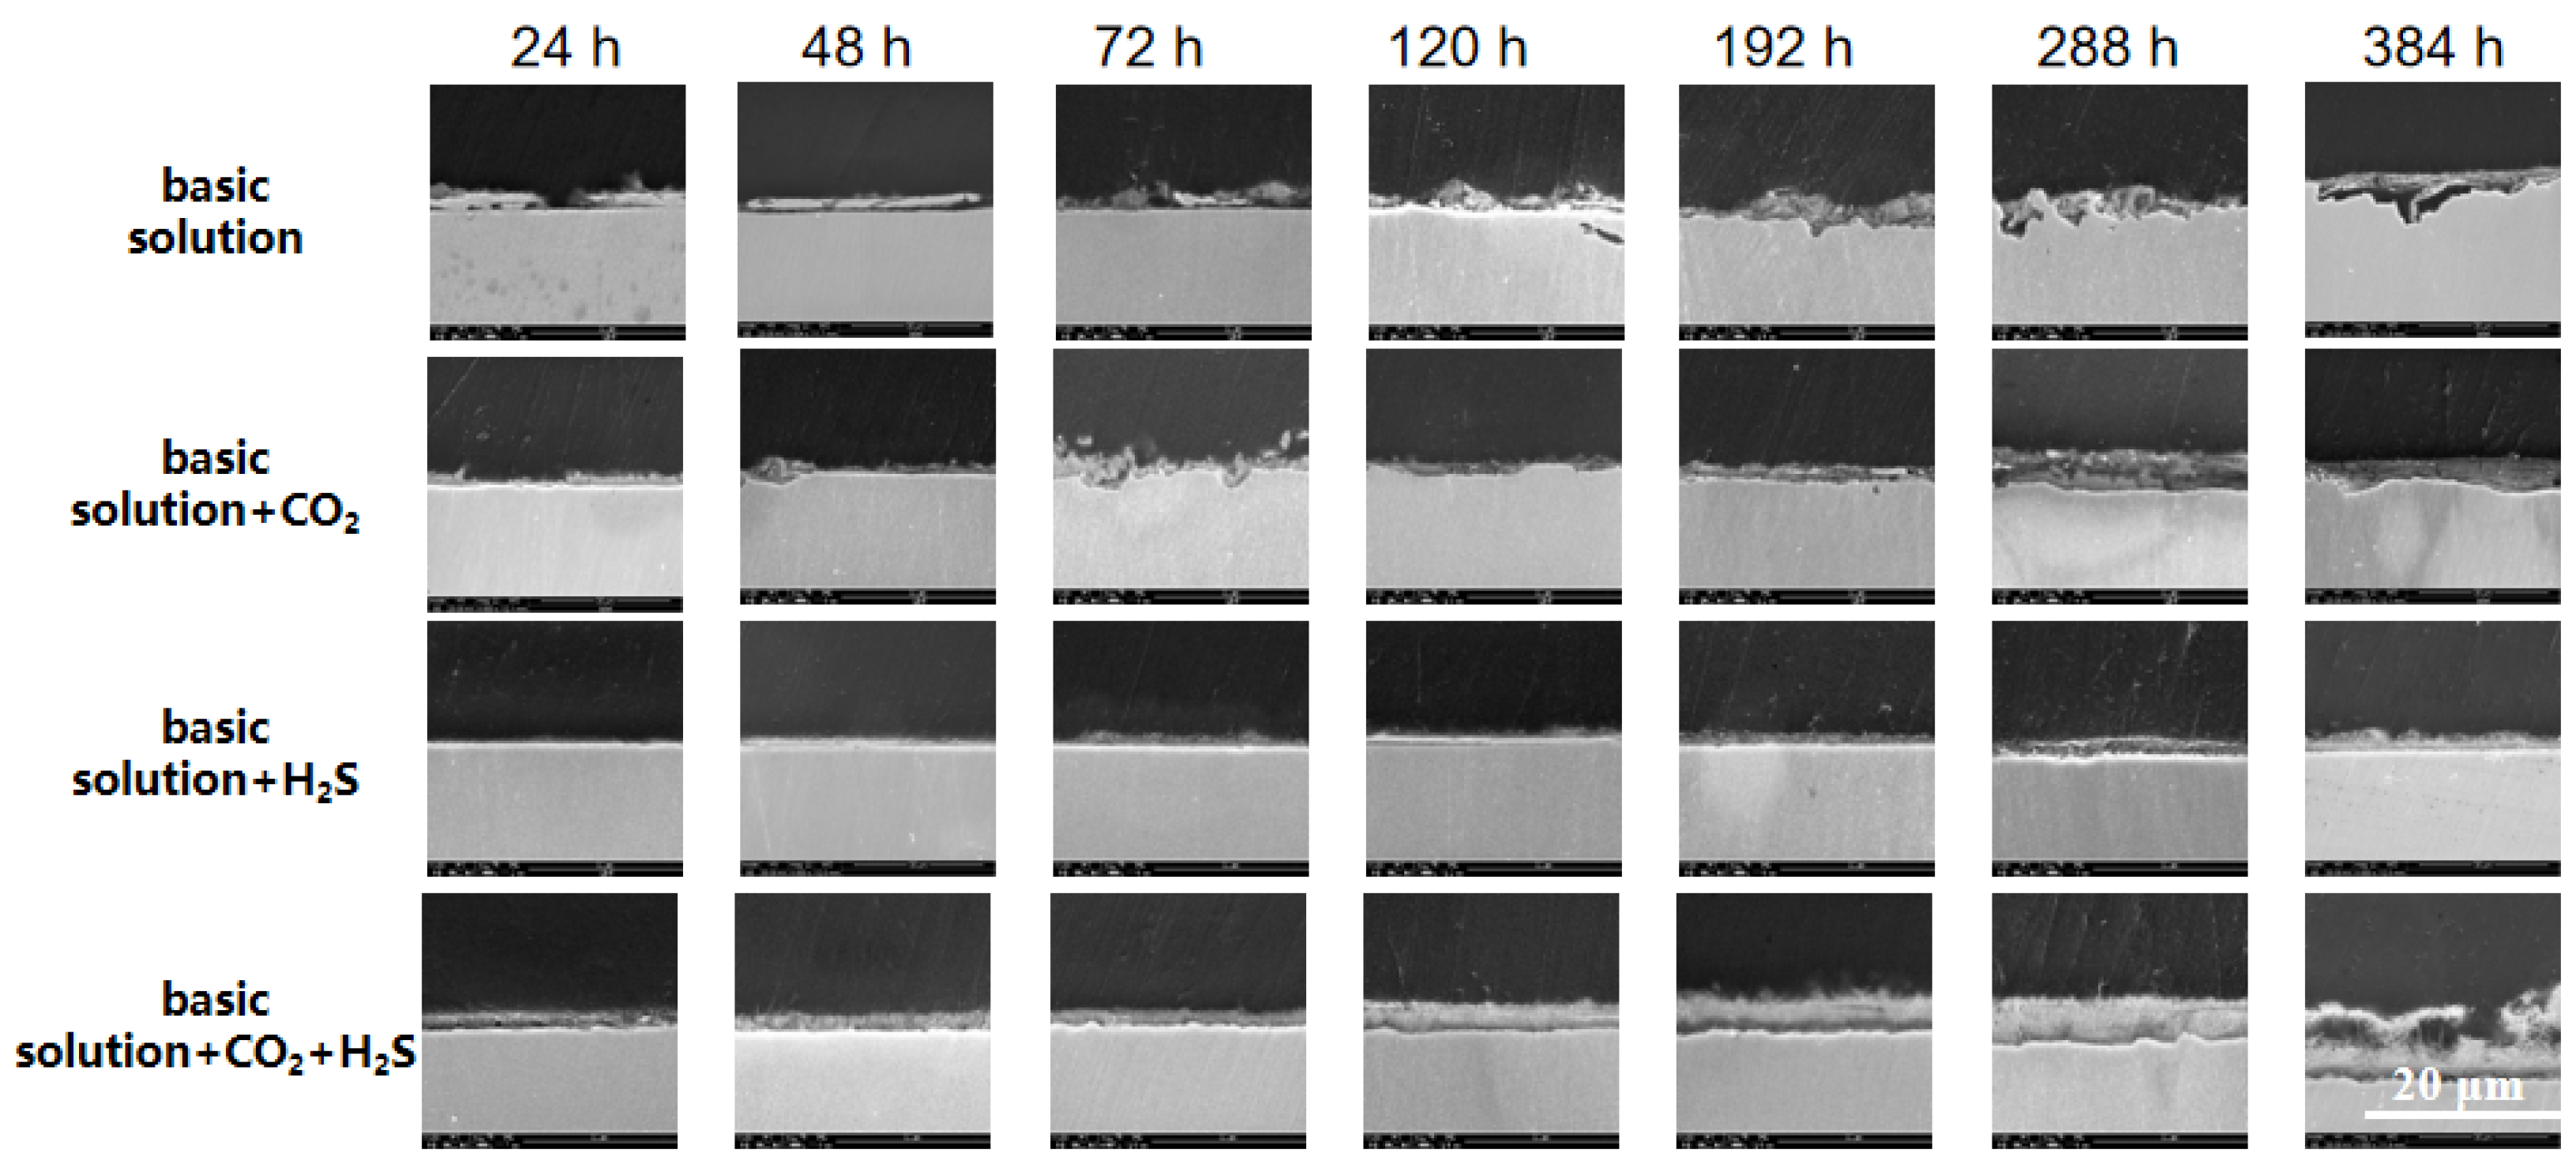
3.3.1. Thickness and Characterization of Corrosion Product Films

The surface of the material is cleaned with appropriate cleaning agents to remove dirt, grease, and impurities from the surface. Polishing, etching, or oxidizing the surface may be necessary to better observe the surface micromorphology. These treatments remove surface roughness and highlight surface features for better observation and analysis. Surface micromorphology before and after etching is observed using tools such as scanning electron microscopy (SEM), with an accelerating voltage of 10 kV, as shown in Figure 8. The surface micromorphology before and after corrosion is compared to analyze the changes and characteristics that occurred during the corrosion process. The development and change trend of the corroded area can be observed, as well as the effect of corrosion on the surface micromorphology.
The corrosion products have been analyzed by XRD with a scanning range of 5~90°. The corrosion product film layer can be divided into two layers inside and outside, in which the inner layer is iron oxide (Fe3O4 or Fe2O3), the outer layer is FeS, and so on, where the outer layer of FeS is more dense, with a certain protective effect [51]. The phenomenon that the corrosion product film is divided into two layers is mainly due to the two stages of chemical reaction. First, in the early stage of corrosion, the metal substrate comes into contact with the corrosive medium, and a preliminary chemical reaction occurs, forming the first layer of corrosion products. This layer is usually tightly adhered to the metal surface and has a good bond with the substrate. Subsequently, chemical reactions continue to occur within the first layer of corrosion product film, leading to the formation of a second layer of corrosion products. This process may be due to the further diffusion of corrosive substances from the environment (e.g., CO2 and H2S) into the first layer of the film, which continues to react with its components to form new compounds. These new compounds may have different chemical and physical properties, leading to the phenomenon of membrane delamination.
The transformation of FeCO3 in the corrosion product membrane is a key factor. FeCO3 can be transformed into other forms of corrosion products under certain conditions, and this transformation process is often accompanied by changes in volume and other physical properties, which leads to the delamination of the membrane. FeCO3 may be transformed into more stable compounds in the outer layer of the membrane while remaining as FeCO3 or other forms of corrosion products in the part close to the matrix. The corrosion products form a two-layer structure on the outer layer of the material.
Therefore, the two-layer structure of the corrosion product membrane is not only a result of the sequence of chemical reactions but also a manifestation of the differences in physical properties between different reaction products. This finding supports our view that the transformation of FeCO3 in the membrane is one of the important reasons for the two-layer structure. Through an in-depth study of this mechanism, we can better understand the corrosion process and provide a theoretical basis for designing more effective anti-corrosion measures.

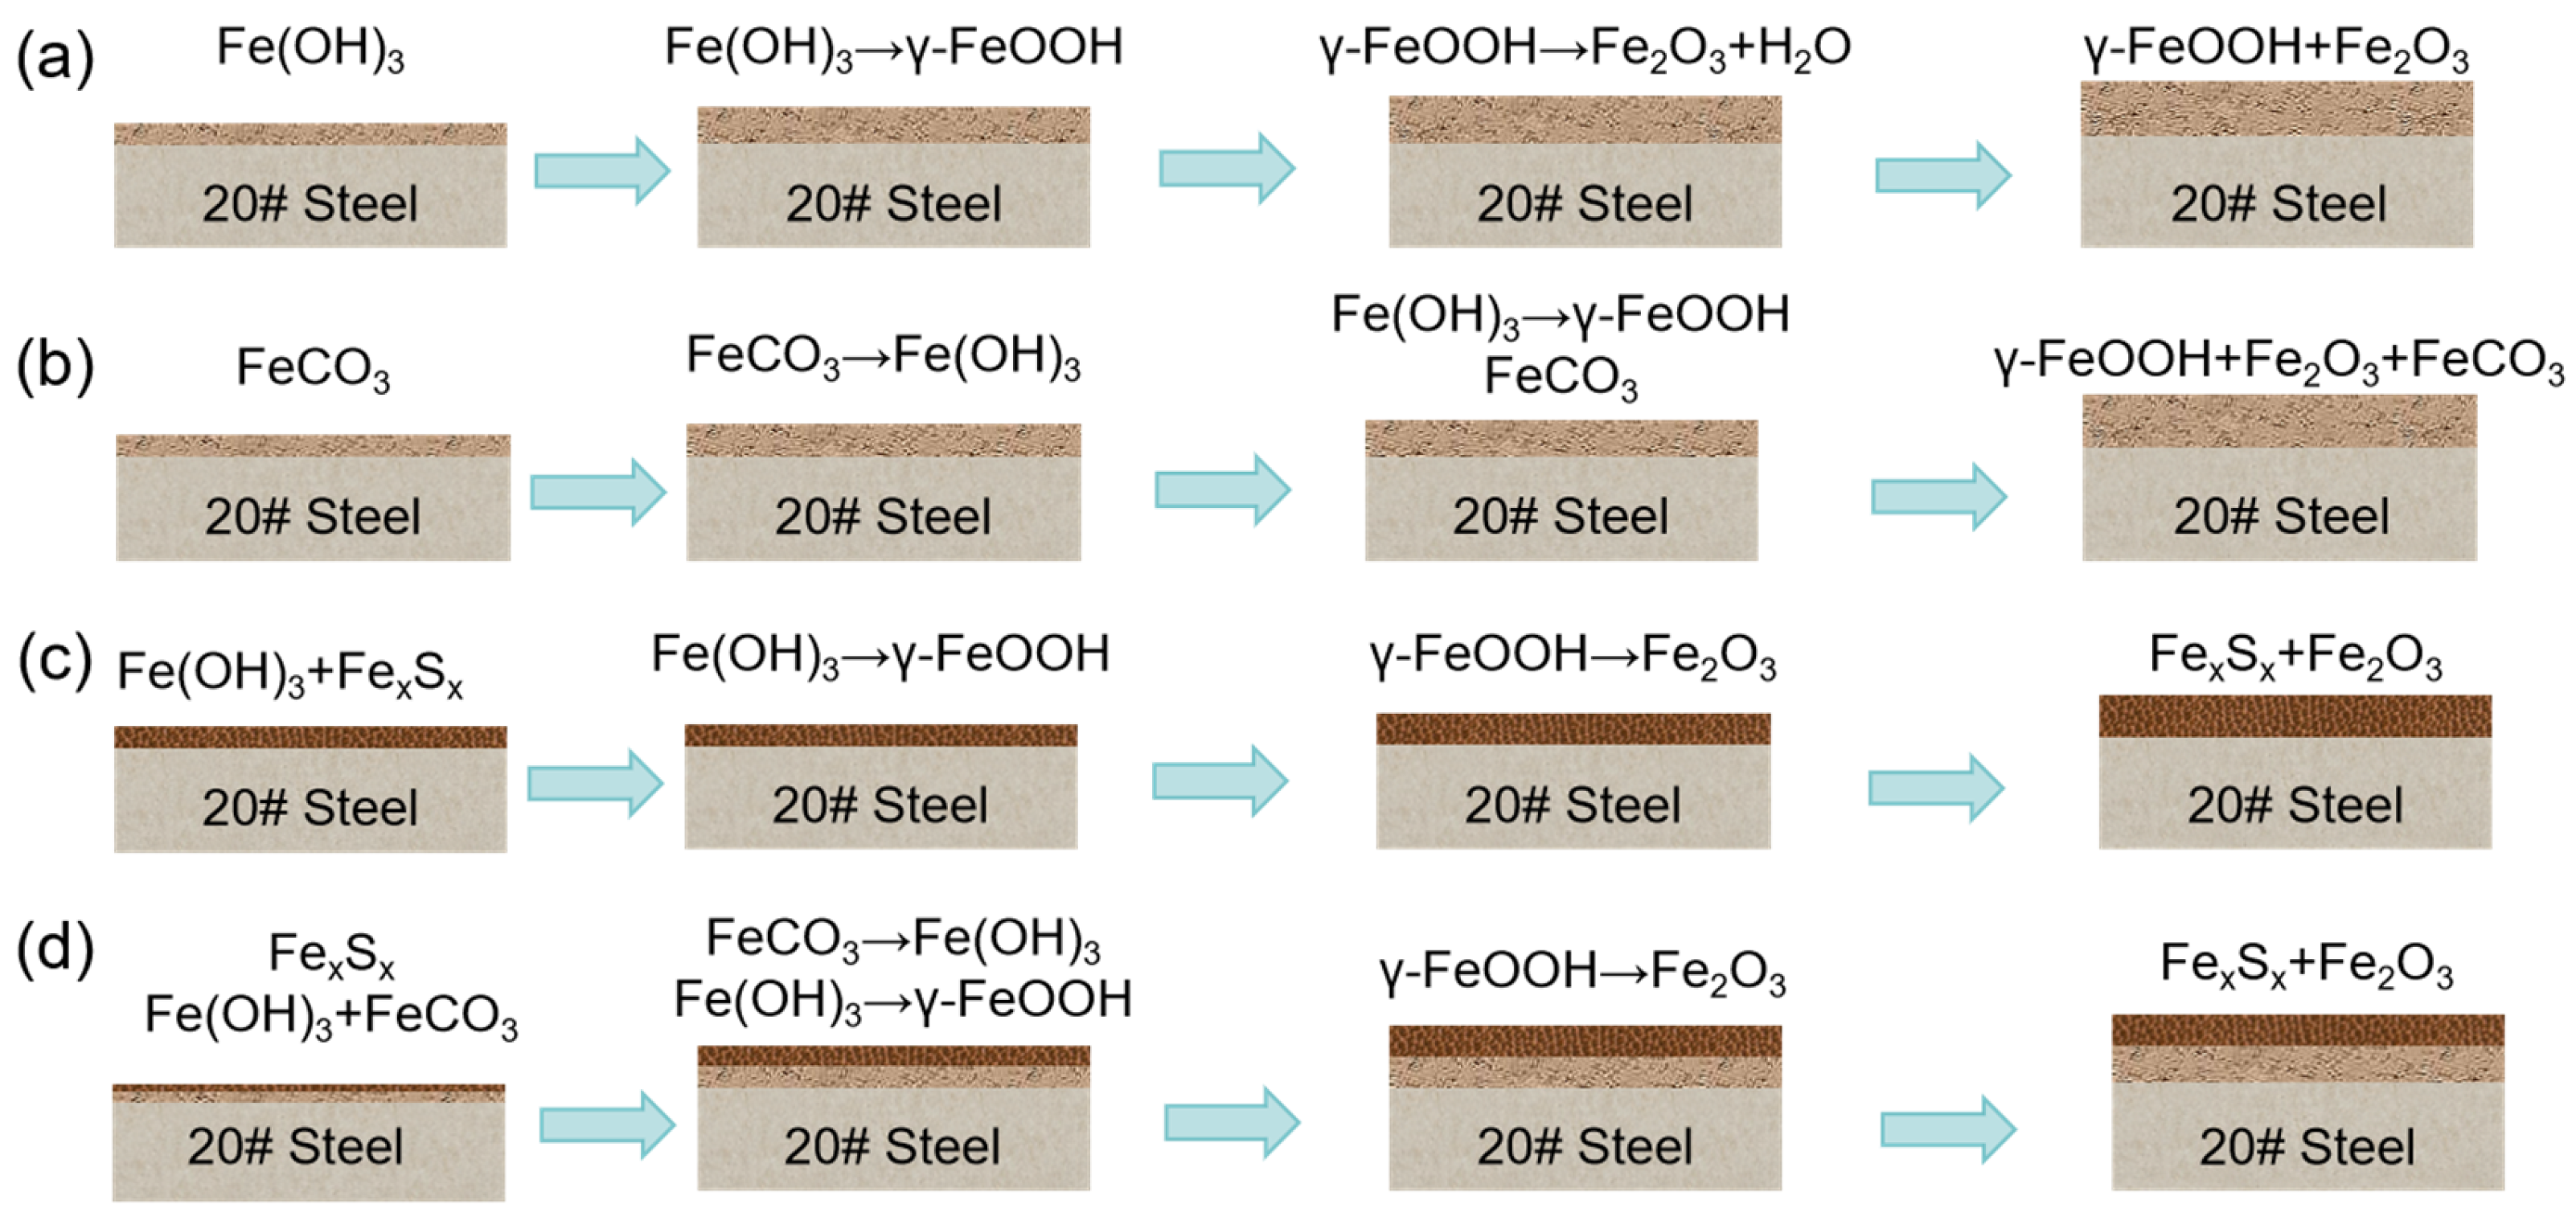
3.3.2. Modeling of Corrosion Product Film Growth and Damage

We believe that previous researchers have neglected the transformation process of iron carbonate (FeCO3) to iron oxide (Fe2O3) and iron hydroxide (Fe(OH)3) in the study of corrosion product membranes. This transformation mechanism is crucial because it not only reveals the dynamics within the corrosion product membrane but also directly affects the structure and composition of the membrane. This transformation process begins with an initial reaction between carbonate (CO32−) and metallic iron (Fe). During the corrosion process, FeCO3 is formed as an intermediate product. However, over time, FeCO3 continues to undergo chemical transformation under the environmental conditions within the membrane, progressively being converted to the more stable iron oxide or iron hydroxide. This transformation is not limited to the surface of the membrane but occurs throughout the interior of the membrane, thus gradually impacting the corrosion coupon’s structure and the composition of the membrane. The reaction processes and evolution of corrosion products in the four corrosive media are shown in Figure 9.

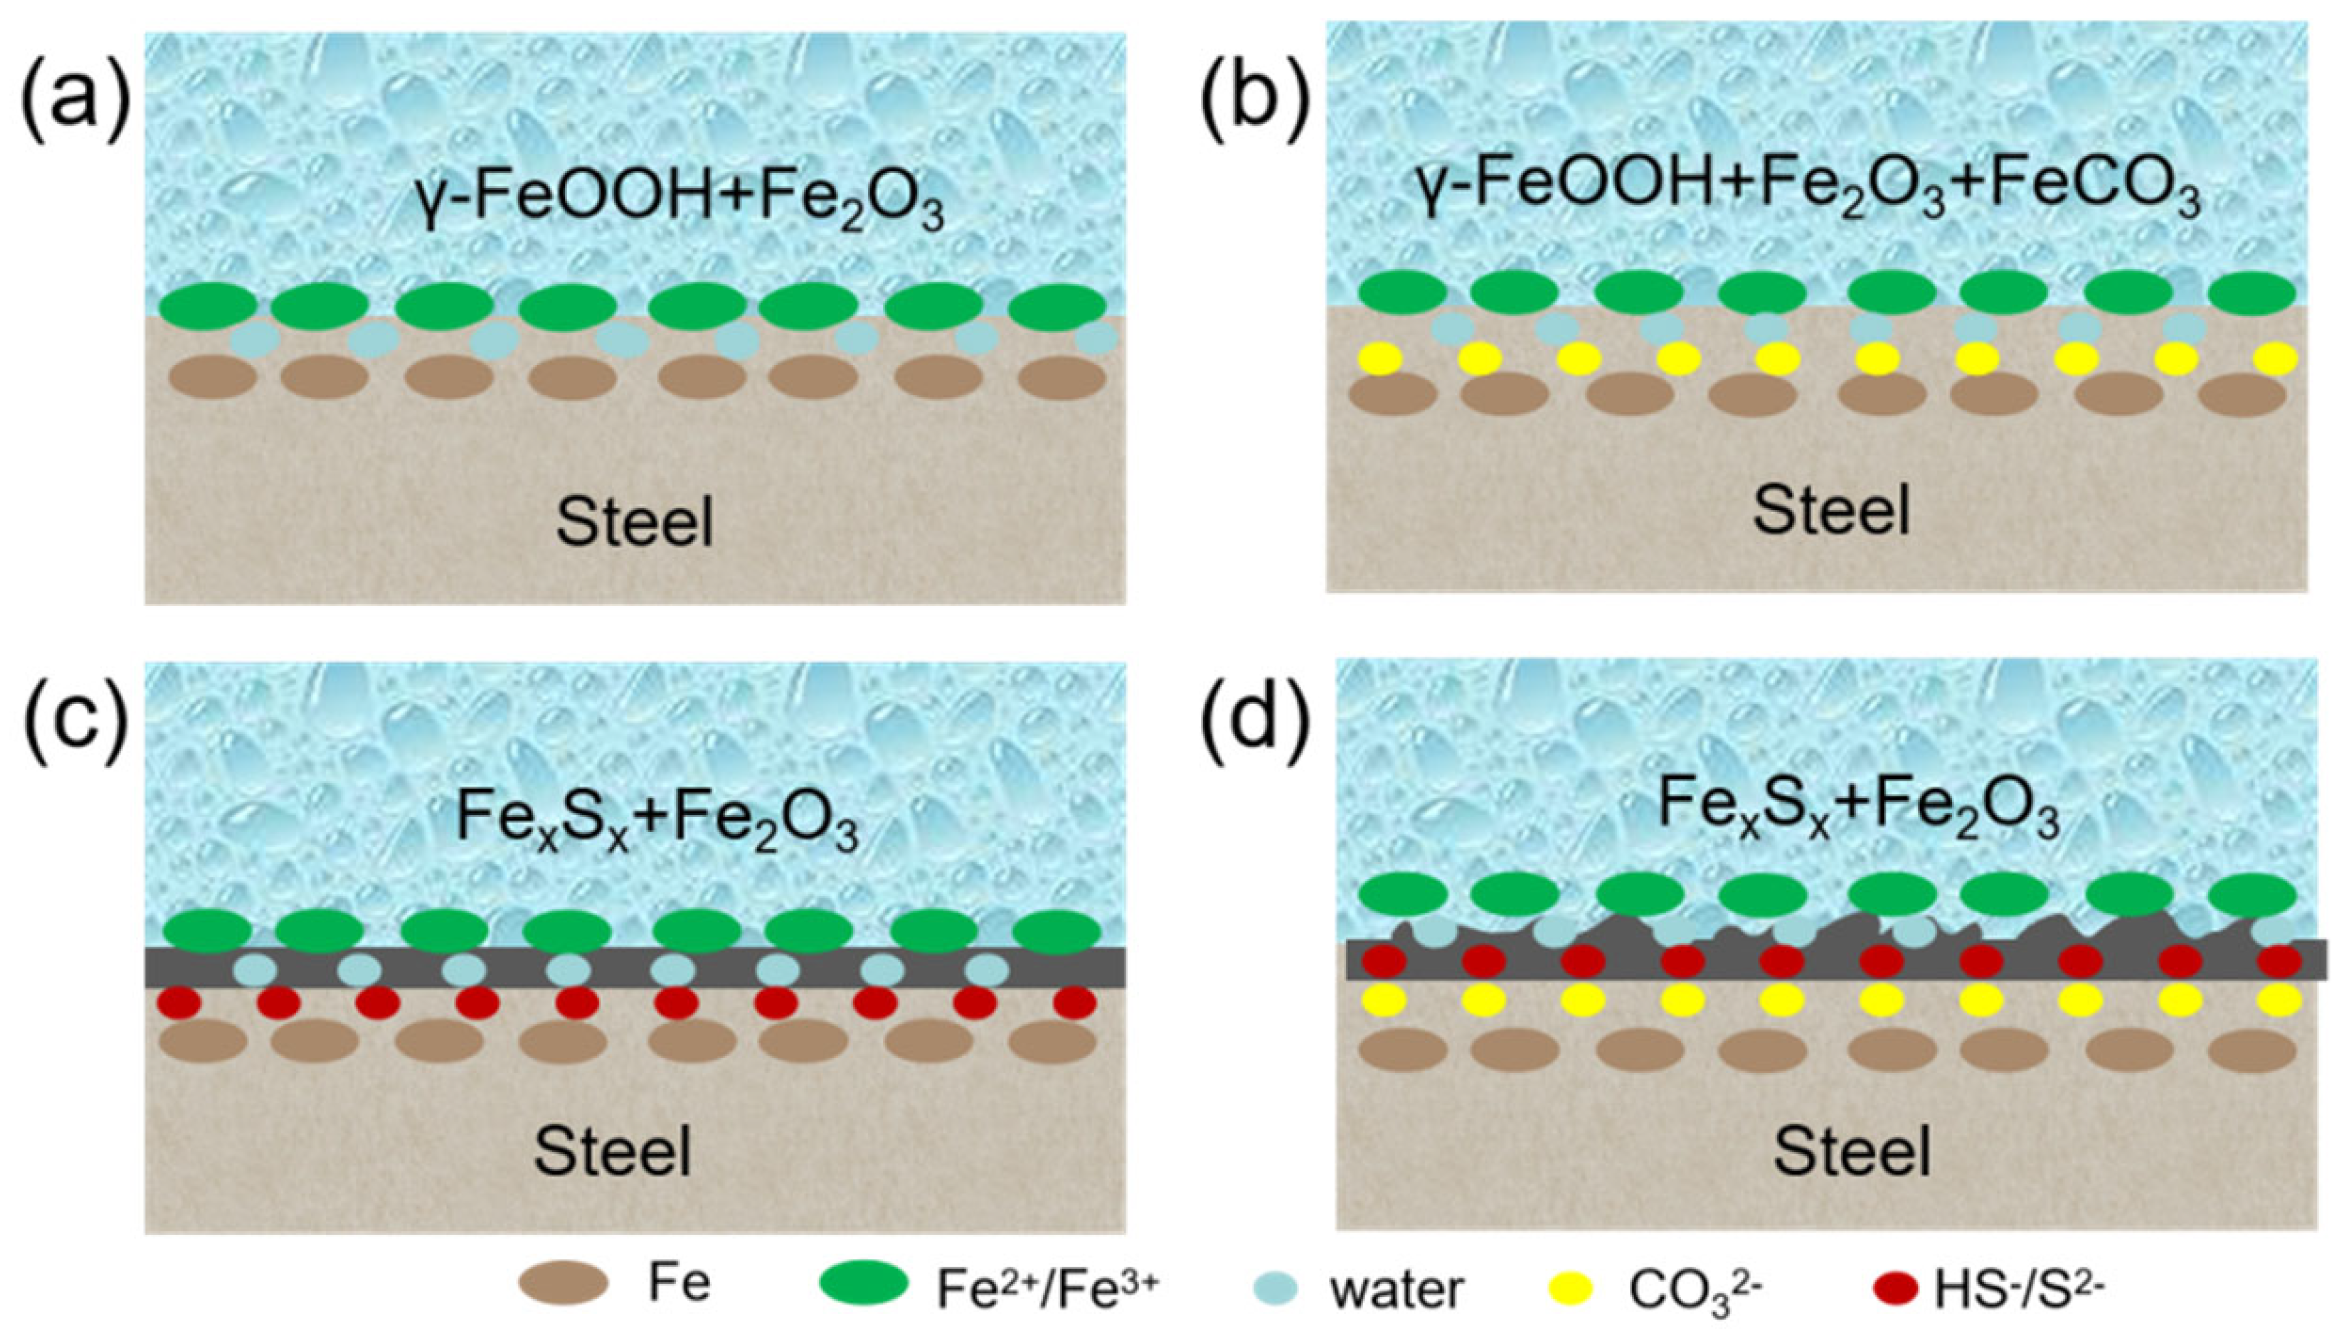
3.4. Modeling of Corrosion in CO2-H2S Environment

Similar studies have shown that during the corrosion of metals, the components of the corrosion product films continue to react chemically over time, rather than just forming at the interface with the metal matrix. These films not only act as physical barriers, preventing or slowing down the direct contact of the corrosive medium with the metal surface, but also participate in the material transport process. The formation and evolution of membranes can influence the corrosion rate and the type of corrosion, e.g., from uniform to localized corrosion. The chemical reactivity, structural density, and stability of the film determine its protective properties, which in turn affects the long-term corrosion resistance of the metal [52].
To verify this idea, we can explore it by analyzing the semi-quantitative characteristics of the energy spectrum (EDX or XPS) of the corrosion product film. The energy spectrum analysis allows us to detect the ratio of the elements in the film and their distribution. If the transformation of FeCO3 to Fe2O3 and Fe(OH)3 is observed, then a change in the ratio of iron (Fe) to oxygen (O) should be visible in the energy spectra, along with a gradual decrease in the content of carbon (C). In addition, by comparing the energy spectral data at different depths, a gradient change in the elemental distribution inside the membrane can be observed, further supporting the idea that FeCO3 is transformed into Fe2O3 and Fe(OH)3 inside the membrane.
By the above method, we can depict the evolution of the corrosion product film more clearly, proving that the conversion of FeCO3 to Fe2O3 and Fe(OH)3 is a dynamic and complex process. This finding not only enriches our understanding of the corrosion mechanism but also provides an important theoretical basis for the development of effective anti-corrosion strategies. Through the semi-quantitative characterization of the energy spectrum analysis, we can demonstrate that the conversion of FeCO3 to Fe2O3 and Fe(OH)3 is a step-by-step process inside the membrane and that this process significantly affects the structure and composition of the membrane. This provides a new perspective for an in-depth understanding of the corrosion mechanism and helps to guide future corrosion protection studies [53]. The line scan results of the elemental content showed that the S content in the corrosion product layer shows a pattern of a gradual decrease from the surface to the inside. This phenomenon may be closely related to the environmental conditions and corrosion mechanism of the material during the corrosion process. Specifically, sulfide may be formed by the reaction between the external sulfur source and the metal surface, and in the initial stage, due to the high reactivity, sulfide rapidly accumulates on the surface of the material, forming a higher concentration of the sulfide layer. With the depth of the corrosion process, on the one hand, the sulfide layer formed on the surface may have a certain protective effect on the internal material, slowing down the direct contact between the external sulfur source and the metal substrate and resulting in a reduction in the rate of sulfide generation; on the other hand, with time, the active sites that can be reacted with the sulfur source are gradually reduced, which will also cause the sulfur content of the growth of the level to tend to level off until the decline. The reaction processes at the interface in the four corrosive media are shown in Figure 10.
When CO2 exists alone, it mainly causes the galvanic corrosion of metal materials; when H2S exists alone, it not only causes the galvanic corrosion of metal materials but also causes stress corrosion cracking. During the corrosion process, gases such as carbon dioxide (CO2) and hydrogen (H2) may be generated, and the production of these gases significantly affects the stability of the corrosion product film [54,55]. In addition to the gas build-up, temperature changes, mechanical stresses, and fluctuations in the chemical composition of the environment can affect the stability of corrosion product membranes. For example, an increase in temperature may lead to the thermal expansion of the membrane material, thus triggering stress concentration and cracking, while mechanical vibration or impact may directly destroy the continuity of the membrane. Therefore, the shedding of corrosion product membranes is not only the result of the action of a single factor but the combined effect of a variety of physical and chemical processes.
The exfoliation mechanism of the corrosion product film is a complex process that is affected by a variety of factors, and this paper concludes, through a systematic study, that the shedding of the corrosion product film is mainly due to the aggregation of gases generated during the corrosion process. When corrosion occurs on a metal surface, a protective film consisting of corrosion products is usually formed. This film ideally slows down further corrosion processes. However, in real-world environments, corrosion reactions are often accompanied by the generation of gases such as hydrogen or carbon dioxide. These gases accumulate within or underneath the corrosion product film, creating a localized pressure [56,57].
2H+(aq) + 2e → H2 (g)
2H2CO3 (aq) + 2e →2HCO3 (aq) + H2 (g)
2HCO3 (aq) + 2e →2CO32− (aq) + H2 (g)
2H2S (aq) + 2e → 2HS (aq) + H2 (g)
2HS (aq) + 2e → 2S2− (aq) + H2 (g)
As the gas continues to be generated and builds up, the pressure gradually increases and eventually exceeds the mechanical strength of the corrosion product membrane. This excessive internal pressure can cause the structural integrity of the membrane to be compromised, causing cracking. Once cracks begin to appear in the membrane, corrosive media (e.g., water, acidic solutions, etc.) are able to diffuse into the metal surface more easily, accelerating the corrosion process. In addition, the cracks provide a pathway for more gases to escape, further exacerbating the damage to the membrane. The process of corrosion and membrane peeling has been shown in Figure 11.

4. Conclusions

  • This study pioneeringly employs the electrical resistance method, utilizing a large plane probe, to investigate corrosion in simulated oilfield sewage containing CO2 and H2S under laboratory conditions. The obtained corrosion process curve distinctly exhibits the stages of film formation to maturation, revealing characteristics unattainable through synchronous specimen testing. Contrary to previous beliefs regarding the unsuitability of the resistance method due to the electronic conductivity of FexSx, our experiments demonstrate its efficacy for corrosion monitoring in H2S-containing environments.
  • Throughout the maturation of the corrosion product film, material conversion within the film, including transformations from iron oxide to iron sulfide, significantly influences corrosion behavior.
  • In the presence of both CO2 and H2S, neither inhibits uniform corrosion nor decelerates it; instead, it facilitates the corrosion process.

Author Contributions

Y.Y.: Conceptualization, methodology, formal analysis, investigation, data curation, writing—original draft preparation, project administration, funding acquisition. Z.Y.: Software, validation, visualization. S.L.: Validation, data curation. Z.Z.: Validation, writing—review and editing. Q.Z.: Resources, supervision, validation & investigation. All authors have read and agreed to the published version of the manuscript.

Funding

This research received no external funding.

Data Availability Statement

The original contributions presented in this study are included in the article. Further inquiries can be directed to the corresponding author.

Conflicts of Interest

All authors were employed by the Central Iron & Steel Research Institute. The all authors declare that the research was conducted in the absence of any commercial or financial relationships that could be construed as a potential conflict of interest.

References

  1. Gong, Q.; Wu, H.; Yang, F.; Tang, Z. Corrosion of pipeline steel weld metals containing alloying elements in CO2/H2S environment. Gas Sci. Eng. 2023, 109, 104846. [Google Scholar] [CrossRef]
  2. NACE TM0177-2005; Laboratory Testing of Metals for Resistance to Specific Forms of Environmental Cracking in H2S Environments. NACE International: Houston, TX, USA, 2005.
  3. Mansfeld, F. The influence of carbon dioxide on corrosion. Corrosion 1988, 44, 33–46. [Google Scholar]
  4. Ben, M.E.A.; Seghier, B.; Keshtegar, K.F.; Tee, T.; Zayed, R.; Abbassi, N.T.T. Prediction of maximum pitting corrosion depth in oil and gas pipelines. Eng. Fail. Anal. 2020, 112, 104505. [Google Scholar]
  5. Seghier, M.B.; Hoche, D.; Zheludkevich, M. Prediction of the internal corrosion rate for oil and gas pipeline: Implementation of ensemble learning techniques. J. Nat. Gas Sci. Eng. 2022, 99, 104425. [Google Scholar] [CrossRef]
  6. Nocito, F.; Dibenedetto, A. Atmospheric CO2 mitigation technologies: Carbon capture utilization and storage. Curr. Opin. Green Sustain. Chem. 2020, 21, 34–43. [Google Scholar] [CrossRef]
  7. Zhao, Z. Corrosion mechanism and prevention of buried gas gathering pipeline in micro H2S/CO2 environment. Oil-Gas Field Surf. Eng. 2021, 40, 73–76. [Google Scholar]
  8. Zheng, Y.; Jing, N.; Bruce, B. Electrochemical model of mild steel corrosion in a mixed H2S/CO2 aqueous environment in the absence of protective corrosion product layers. Corrosion 2014, 71, 316–325. [Google Scholar] [CrossRef]
  9. El-Kady, A.; Amin, M.T.; Khan, F.; El-Halwagi, M. Analysis of CO2 pipeline regulations from a safety perspective for offshore carbon capture, utilization, and storage (CCUS). J. Clean. Prod. 2024, 439, 140734. [Google Scholar] [CrossRef]
  10. Zhou, Y.; Xie, F.; Wang, D.; Wang, Y.; Wu, M. Carbon capture, utilization and storage (CCUS) pipeline steel corrosion failure analysis: A review. Eng. Fail. Anal. 2024, 155, 107745. [Google Scholar] [CrossRef]
  11. Chen, L.; Liu, Z.; Huang, F.; Dong, J.; Wang, C.; Yuan, J.; Fu, Q. Experimental study of corrosion resistance of 431M2 stainless steel coatings in a CO2-saturated NaCl solution deposited by extreme high-speed laser cladding. Mater. Today Commun. 2024, 38, 108202. [Google Scholar]
  12. Sun, W.; Nesic, S. A mechanistic model of uniform hydrogen sulfide/carbon dioxide corrosion of mild steel. Corrosion 2009, 65, 291–307. [Google Scholar] [CrossRef]
  13. Wang, C.; Yan, M.; Zhao, X.; Li, P.; Wang, H. Research progress of H2S/CO2 corrosion in oil and gas development. J. Xi’an Shiyou Univ. 2005, 20, 66–71. [Google Scholar]
  14. Li, D.P.; Zhang, L.; Yang, J.W.; Lu, M.X.; Ding, J.H.; Liu, M.L. Effect of H2S concentration on the corrosion behavior of pipeline steel under the coexistence of H2S and CO2. Int. J. Miner. Metall. Mater. 2014, 21, 388–394. [Google Scholar] [CrossRef]
  15. Choi, Y.S.; Nešić, S.; Ling, S. Effect of H2S on the CO2 corrosion of carbon steel in acidic solutions. Electrochim. Acta 2011, 56, 1752. [Google Scholar] [CrossRef]
  16. Li, W.F.; Zhou, Y.J.; Xue, Y. Corrosion behavior of 110S tube steel in environments of high H2S and CO2 content. J. Iron Steel Res. Int. 2012, 19, 59. [Google Scholar] [CrossRef]
  17. Ma, H.Y.; Cheng, X.L.; Li, G.Q.; Chen, S.H.; Quan, Z.L.; Zhao, S.Y.; Niu, L. The influence of hydrogen sulfide on corrosion of iron under different conditions. Corros. Sci. 2000, 42, 1669. [Google Scholar] [CrossRef]
  18. Tang, J.W.; Shao, Y.W.; Zhang, T.; Meng, G.Z.; Wang, F.H. Corrosion behaviour of carbon steel in different concentrations of HCl solutions containing H2S at 90 °C. Corros. Sci. 2011, 53, 1715. [Google Scholar] [CrossRef]
  19. Nešić, S. Key issues related to modelling of internal corrosion of oil and gas pipelines: A review. Corros. Sci. 2007, 49, 4308. [Google Scholar] [CrossRef]
  20. Yin, Z.F.; Zhao, W.Z.; Bai, Z.Q.; Feng, Y.R.; Zhou, W.J. Corrosion behavior of SM 80SS tube steel in stimulant solution containing H2S and CO2. Electrochim. Acta 2008, 53, 3690. [Google Scholar] [CrossRef]
  21. Davoodi, A.; Pakshir, M.; Babaiee, M.; Ebrahimi, G.R. A comparative H2S corrosion study of 304L and 316L stainless steels in acidic media. Corros. Sci. 2011, 53, 399. [Google Scholar] [CrossRef]
  22. Tang, J.W.; Shao, Y.W.; Guo, J.B.; Zhang, T.; Meng, G.Z.; Wang, F.H. The effect of H2S concentration on the corrosion behavior of carbon steel at 90 °C. Corros. Sci. 2010, 52, 2050. [Google Scholar] [CrossRef]
  23. Zhongwen, J.I.; Shoumin, C.H.E.N.; Lipeng, G.O.U.; Qili, M.A. Multi-media environment corrosion mechanism and protection technology of gathering and transportation pipeline in oilfield. Appl. Chem. Ind. 2024, 53, 1612–1615. [Google Scholar]
  24. Khalaf, A.H.; Xiao, Y.; Xu, N.; Wu, B.H.; Li, H.; Lin, B.; Nie, Z.; Tang, J.L. Emerging AI technologies for corrosion monitoring in oil and gas industry: A comprehensive review. Eng. Fail. Anal. 2024, 155, 107735. [Google Scholar] [CrossRef]
  25. Alamri, A.H. Localized corrosion and mitigation approach of steel materials used in oil and gas pipelines—An overview. Eng. Fail. Anal. 2020, 116, 104735. [Google Scholar] [CrossRef]
  26. Lin, N.; Huang, H.; Li, S.L. Study on erosion numerical simulation of elbows of pipelines in natural gas gathering stations. Sci. Technol. Eng. 2020, 20, 8543–8549. [Google Scholar]
  27. Obot, I.B.; Solomon, M.M.; Umoren, S.A.; Suleiman, R.; Elanany, M.; Alanazi, N.M.; Sorour, A.A. Progress in the development of sour corrosion inhibitors: Past, present, and future perspectives. J. Ind. Eng. Chem. 2019, 79, 1–18. [Google Scholar] [CrossRef]
  28. Yan, T.; Xu, L.-C.; Zeng, Z.-X.; Pan, W.-G. Mechanism and anti-corrosion measures of carbon dioxide corrosion in CCUS: A review. iScience 2024, 27, 108594. [Google Scholar] [CrossRef]
  29. Wei, L.; Pang, X.; Gao, K. Effect of small amount of H2S on the corrosion behavior of carbon steel in the dynamic supercritical CO2 environments. Corros. Sci. 2016, 103, 132–144. [Google Scholar] [CrossRef]
  30. Liu, Z.; Gao, X.; Du, L.; Li, J.; Li, P.; Bai, X.; Misra, R.D.K. Corrosion behavior of low-alloy pipeline steel exposed to H2S/CO2-saturated saline solution. J. Mater. Eng. Perform. 2017, 26, 1010–1017. [Google Scholar] [CrossRef]
  31. Srinivasan, S.; Tebbal, S. Critical factors in predicting CO2/H2S corrosion in multiphase systems. In CORROSION 98; NACE International: San Diego, CA, USA, 1998. [Google Scholar]
  32. NACE International. H2S-CO2 environment. In CORROSION; Paper No. 1559; NACE International: Houston, TX, USA, 2012. [Google Scholar]
  33. Pessu, F.; Barker, R.; Neville, A. The influence of pH on localized corrosion behavior of X65 carbon steel in CO2-saturated brines. Corrosion 2015, 71, 1452–1466. [Google Scholar] [CrossRef]
  34. Pessu, F.; Barker, R.; Neville, A. Pitting and uniform corrosion of X65 carbon steel in sour corrosion environments: The influence of CO2, H2S and temperature. Corrosion 2017, 73, 12454. [Google Scholar] [CrossRef] [PubMed]
  35. Asmara, Y.; Kurniawan, T.; Ijost, I. Corrosion prediction for corrosion rate of carbon steel in oil and gas environment: A review. Indones. J. Sci. Technol. 2018, 3, 64–74. [Google Scholar] [CrossRef]
  36. Reddy, M.S.B.; Ponnamma, D.; Sadasivuni, K.K.; Aich, S.; Kailasa, S.; Parangusan, H.; Ibrahim, M.; Eldeib, S.; Shehata, O.; Ismail, M.; et al. Sensors in advancing the capabilities of corrosion detection: A review. Sens. Actuators A Phys. 2021, 332 Pt 1, 113086. [Google Scholar] [CrossRef]
  37. Banan, A.; Asadi, S. Novel cationic and non-ionic biopolyurethanes for effective inhibition of mild steel corrosion in H2S-CO2 environment. Ind. Crops Prod. 2024, 221, 119320. [Google Scholar] [CrossRef]
  38. Keshk, A.A.; Elsayed, N.H.; Almutairi, F.M.; Al-Anazi, M.; Said, S.; Althurwi, H.M.; Albalawi, R.K.; El-Aassar, M.R. Effect of green and sustainable extracted fucoidan polysaccharide as a corrosion inhibitor in 3.5% NaCl. Biomass Convers. Biorefinery 2024, 14, 28219–28232. [Google Scholar] [CrossRef]
  39. ASTM Standard G1-03; Standard Practice for Preparing, Cleaning, and Evaluating Corrosion Test Specimens. ASTM International: West Conshohocken, PA, USA, 2017.
  40. Qian, Y.H.; Ma, C.H.; Niu, D.; Xu, J.J.; Li, M.S. Influence of Alloyed Chromium on the Atmospheric Corrosion Resistance of Weathering Steels. Corros. Sci. 2013, 74, 424–429. [Google Scholar] [CrossRef]
  41. NACE SP0775-2023; Preparation, Installation, Analysis, and Interpretation of Corrosion Coupons in Oilfield Operations. NACE International: Houston, TX, USA, 2023.
  42. ASTM Standard G96-90; Standard Guide for Online Monitoring of Corrosion in Plant Equipment (Electrical and Electrochemical Methods). ASTM International: West Conshohocken, PA, USA, 2018.
  43. ASTM B826-09(2020); Standard Test Method for Monitoring Atmospheric Corrosion Tests by Electrical Resistance Probes. ASTM: West Conshohocken, PA, USA, 2020.
  44. Kim, S.; McCormick, B.; Carlson, K.; Lee, S.; Kim, G.; Lee, K.; Yun, Y.-M.; Kang, W. Characterization of flowback and produced water from shale oil and gas wells fractured with different levels of recycled water. Water Pract. Technol. 2024, 19, 4022–4035. [Google Scholar] [CrossRef]
  45. Kamal, M.S.; Hussein, I.; Mahmoud, M.; Sultan, A.S.; Saad, M.A.S. Oilfield scale formation and chemical removal: A review. J. Pet. Sci. Eng. 2018, 171, 127–139. [Google Scholar] [CrossRef]
  46. Wu, Q.L.; Zhang, Z.H.; Dong, X.M.; Yang, J.Q. Corrosion Behavior of Low-Alloy Steel Containing 1% Chromium in CO2 Environments. Corros. Sci. 2013, 75, 400–408. [Google Scholar] [CrossRef]
  47. López, D.A.; Pérez, T.; Simison, S.N. The Influence of Microstructure and Chemical Composition of Carbon and Low Alloy Steels in CO2 Corrosion. A State-of-the-Art Appraisal. Mater. Des. 2003, 24, 561–575. [Google Scholar] [CrossRef]
  48. Liu, Z.; Gao, X.; Du, L.; Li, J.; Li, P.; Yu, C.; Misra, R.D.K.; Wang, Y. Comparison of corrosion behaviour of low-alloy pipeline steel exposed to H2S/CO2-saturated brine and vapour-saturated H2S/CO2 environments. Electrochim. Acta 2017, 232, 528–541. [Google Scholar] [CrossRef]
  49. Lee, K.-L.; Nesic, S. The Effect of Trace Amount of H2S on CO2 Corrosion Investigated by Using the EIS Technique. In CORROSION 2005; NACE International: Houston, TX, USA, 2005. [Google Scholar]
  50. Sun, W.; Nešić, S.; Woollam, R.C. The effect of temperature and ionic strength on iron carbonate (FeCO3) solubility limit. Corros. Sci. 2009, 51, 1273–1276. [Google Scholar] [CrossRef]
  51. Gao, S.; Jin, P.; Brown, B.; Young, D.; Nesic, S.; Singer, M. Corrosion behavior of mild steel in sour environments at elevated temperatures. In CORROSION; NACE International: Houston, TX, USA, 2017. [Google Scholar]
  52. Ning, J.; Zheng, Y.; Brown, B.; Young, D.; Nesic, S. The role of iron sulfide polymorphism in localized H2S corrosion of mild steel. Corros. Sci. 2017, 73, 155–168. [Google Scholar] [CrossRef] [PubMed]
  53. Chen, Z.; Xu, M.; Hu, T.; Xue, G.; Chen, F.; Zhao, H.; Zhou, H.; Lei, Y.; Zhu, K. Effects of H2S content on the corrosion behavior of gas storage reservoir injection and production pipeline steel in CO2-H2S environment. Mater Today Commun 2024, 41, 110364. [Google Scholar] [CrossRef]
  54. Zhang, G.A.; Zeng, Y.; Guo, X.P.; Jiang, F.; Shi, D.Y.; Chen, Z.Y. Electrochemical corrosion behavior of carbon steel under dynamic high pressure H2S/CO2 environment. Corros. Sci. 2012, 65, 37–47. [Google Scholar] [CrossRef]
  55. Xiang, Y.; Xu, M.; Choi, Y.-S. State-of-the-art overview of pipeline steel corrosion in impure dense CO2 for CCS transportation: Mechanisms and models. Corros. Eng. Sci. Technol. 2017, 52, 485–509. [Google Scholar] [CrossRef]
  56. Zheng, S.; Li, C.; Chen, C.; Yang, M.; Qi, Y. Stress-oriented hydrogen-induced cracking of L360QS steel. Mater. Perform. 2012, 51, 71–75. [Google Scholar] [CrossRef]
  57. Li, W.F.; Zhou, Y.J.; Xue, Y. Corrosion behavior of tubing steel in an environment with high H2S and CO2 content. J. Wuhan Univ. Technol. Mater. Sci. Ed. 2013, 28, 1038–1043. [Google Scholar] [CrossRef]
Figure 1. Schematic diagram of the wiring.
Metals 15 00440 g001
Figure 2. Structure of the probe and the chip.
Metals 15 00440 g002
Figure 3. Schematic diagram of the simulation device.
Metals 15 00440 g003
Figure 4. Comparison of corrosion measurement data between corrosion probe and coupons. (a) Thickness loss for four sets of probes. (b) Fitting of the amount of thickness loss for the four sets of corrosion coupons. (c) Cumulative corrosion rates for four sets of probes. (d) Cumulative corrosion rate fitting for the four sets of corrosion coupons.
Metals 15 00440 g004
Figure 5. Solution color after corrosion and precipitation of four groups.
Metals 15 00440 g005
Figure 6. Macroscopic morphology characterization of the four groups of samples (200×).
Metals 15 00440 g006
Figure 7. Physical phase analysis of corrosion products. (a) basic solution; (b) injected CO2; (c) injected H2S; (d) injected both CO2 and H2S.
Metals 15 00440 g007
Figure 8. Microscopic morphology after corrosion in solution.
Metals 15 00440 g008
Figure 9. Reaction process and evolution of corrosion products of four groups of samples. (a) evolution of corrosion products in basic solution (b) evolution of corrosion products in the solution injected CO2 (c) evolution of corrosion products in the solution injected H2S (d) evolution of corrosion products in the solution injected CO2 and H2S.
Metals 15 00440 g009
Figure 10. Reaction processes at the interface of four groups of samples. (a) Reaction processes in the basic solution (b) in the solution injected CO2 (c) in the solution injected H2S (d) in the solution injected CO2 and H2S.
Metals 15 00440 g010
Figure 11. Corrosion modeling in CO2-H2S environments.
Metals 15 00440 g011
Table 1. Chemical composition of 20# steel.
ElementSiMnPSAlCrNiCuCFe
Content (wt.%)0.20.410.0130.0090.0290.010.010.010.18balance
Table 2. Composition of simulated oilfield wastewater basic solution.
Chemical CompositionMgSO4CaSO4Na2CO3NaHCO3NaSO4NaClH2O
Mass fraction (wt.%)0.1800.6420.5575.3108.73216.480balance
Table 3. Condition of the four groups of test media.
Injected GasesPhysical StateExperimental PeriodRemarks
Group ABasic solutionN2 (for oxygen repellent)60 °C, atmospheric pressureCorrosion coupons were taken and analyzed 24 h, 48 h, 72 h, 120 h, 192 h, 288 h, and 384 h after the start of the experiment.Dynamic stirring conditions were not performed in this experiment, and the medium dynamics were generated naturally by the energized gas.
Group BH2S
Group CCO2
Group DH2S+CO2
Table 4. Analysis of data from corrosion measurements of ER probes and coupons.
Basic SolutionBasic Solution+CO2Basic Solution+H2SBasic Solution+CO2+H2S
Cumulative corrosion rate1. Within 288 h, the corrosion rate gradually increases1. Within 72 h, the corrosion rate gradually increases1. The initial corrosion rate is higher; it is significantly higher than the situation where only CO2 is introduced1. It has the highest initial corrosion rate
2. The corrosion rate reaches its peak at approximately 288 h and then shows a decreasing trend2. The corrosion rate reaches its peak around 72 h and then shows a slow decreasing trend2. After the formation of the corrosion product film, the corrosion rate gradually decreases2. The corrosion rate gradually stabilizes after 72 h and is significantly higher than in the other three situations
Thickness loss1. Within 144 h, there is minimal change in thickness1. Within 96 h, there is minimal change in thickness1. Within 96 h, the thickness change is similar to the situation where only CO2 is introduced1. Within 96 h, the thickness change is similar to the situation where only CO2 or H2S is introduced
2. As corrosion progresses, the thickness loss gradually increases2. As corrosion progresses, the thickness loss slowly increases2. As corrosion progresses, the thickness loss remains almost stable and unchanged2. As corrosion progresses, the thickness loss gradually increases and is significantly higher than the thickness loss in the original solution
Table 5. Differences and similarities between ER probes and corrosion coupons in the corrosion monitoring process.
Data AcquisitionSimilarityThe changes in the corrosion rate and thickness trends shown in the initial formation of the corrosion product film to the stabilization stage are consistent.
DifferenceThe ER probe can collect a large amount of data continuously, and the obtained data can show strong regularity without fitting. The corrosion coupon can only collect a small amount of data at intervals, and the data obtained are more dispersed and require complex post-processing such as fitting.
Data AnalysisSimilarityThe pattern of the endpoints obtained by the two methods is the same.
DifferenceAt low corrosion rates (in the case of the basic solution and with only H2S passed through), the pattern reflected by the ER probe and the corrosion coupon do not agree with each other.
Usage EnvironmentSimilarityBoth methods can be performed in the field and are suitable for different types of corrosive environments.
DifferenceThe data obtained from the ER probe and the corrosion coupon under the condition of CO2 alone are not identical.
Table 6. Corrosion rates and determination of corrosion classification.
SolutionEnd-of-Period Corrosion Rate
ER ProbeCorrosion Coupon
Corrosion RateClassificationCorrosion RateClassification
Basic solution0.0069Moderate0.0913Moderate
+CO20.08Moderate0.177High
+H2S0.05Moderate0.0142Low
+H2S-CO20.171High0.179High
Table 7. Thickness losses and determination of corrosion classification.
SolutionEnd-of-Period Corrosion Rate
ER ProbeCorrosion Coupon
Thickness LossClassificationThickness LossClassification
Basic solution0.04166Moderate5.24 × 10−4Moderate
+CO20.03973Moderate0.00101High
+H2S0.06615Moderate8.1 × 10−5Low
+H2S-CO20.05753High0.00105High
Table 8. Solubility product constants of main components.
Chemical CompoundSolubility Product Constant (Ksp)
Fe(OH)28.0 × 10⁻¹⁶
Fe(OH)34.0 × 10−38
FeCO33.2 × 10−11
FeS6.3 × 10−18
FeS24.0 × 10−22
Fe2O310−30~10−40
Fe3O410−40~10−50
Disclaimer/Publisher’s Note: The statements, opinions and data contained in all publications are solely those of the individual author(s) and contributor(s) and not of MDPI and/or the editor(s). MDPI and/or the editor(s) disclaim responsibility for any injury to people or property resulting from any ideas, methods, instructions or products referred to in the content.

