Article

The Annealing Effect on Microstructure and Texture Evolution of Spun Al-Mg Alloy Tubes with Cross Inner Ribs

1
College of Mechanical Engineering, Taiyuan University of Technology, Taiyuan 030024, China
2
Shanxi Key Laboratory of Intelligent Underwater Equipment, Taiyuan University of Technology, Taiyuan 030024, China
*
Author to whom correspondence should be addressed.
Metals 2025, 15(4), 441; https://doi.org/10.3390/met15040441
Submission received: 10 March 2025 / Revised: 13 April 2025 / Accepted: 14 April 2025 / Published: 15 April 2025
(This article belongs to the Special Issue Plasticity and Metal Forming)

Abstract

:
Tubes with a cross inner rib exhibit significant internal residual stresses after spinning, which seriously affects their properties. The recrystallization and texture evolution of the tube at different annealing temperatures were investigated. The results showed that severe plastic deformation occurred during the spinning process, with an average grain size of 10.94 μm and a residual compressive stress of −75 MPa. The annealing treatment increased the yield strength and elongation but decreased the ultimate tensile strength. At 290 °C, the residual stress decreased to −50.1 MPa, the grain size was refined to 5.9 μm, the β-fiber structure was retained, and excellent mechanical properties were obtained, with a yield strength of 106.22 MPa, an elongation of 42.43%, and an ultimate tensile strength of 378.55 MPa. At 350 °C, the grain size increased to 7.2 μm, the β-fiber structure disappeared, the mechanical properties decreased, and the residual stress was further reduced to −24.01 MPa. The fracture mode after annealing was a ductile fracture.

1. Introduction

Aluminum alloys are extensively utilized in the aerospace and transportation industries due to their lightweight properties, moderate strength, excellent corrosion resistance, and ease of machining and forming [1,2,3]. Aluminum alloys with inner ribs, such as cryogenic propellant tanks for launch vehicles, are widely used in the aerospace industry due to their lightweight and high reliability [4,5]. In recent years, thin-walled tubular components with cross inner ribs have garnered increasing attention from researchers as a typical reinforcement method [6,7]. Traditional manufacturing techniques often struggle to meet the demands for lightweight and high-performance designs [8]. In contrast, flow molding technology presents several advantages, including low processing costs, simple manufacturing equipment, and reduced molding loads, making it an effective approach for producing complex parts that are close to the net shape [9,10].
Most of the studies on the microstructure of conventional flow-formed tubes have focused on the effect of the thinning rate on the evolution of the microstructure and mechanical properties [11,12,13]. The grain refinement level [11] and grain morphologies [12] as well as orientation are greatly affected by the thickness reduction [13]. Meanwhile, the plastic hardening effect increases with increasing thickness reduction. The tubes with an inner rib are usually spun with one large thinning rate [14]. After spinning, a significant amount of residual stress exists inside the tubes [15], especially with a large reduction rate. Residual stress is generated due to the mismatch of plastic deformation between different regions. Residual stress can reduce the fatigue strength of the material, increase the risk of crack initiation and propagation, and thereby shorten the service life of the parts [16].
Yuan Ting et al. [17] found that in hot-extruded Mg/Al laminates, the presence of an equiaxial β phase on the Al side and the transformation of the S and Brass texture into the Cube-weave structure in annealing. Peng Junjie et al. [18] found that the difference in the orientation of aluminum alloys after deep-cooling rolling was due to the shear stresses exerted on the slip system, and that the recrystallization preferentially nucleates at grain boundaries and along the RD direction after annealing. Du Peng et al. [19] found that fine phases during the annealing process may lead to the formation of M{113}<110> texture, which have a strong pinning effect on large-angle grain boundaries, and that the rolling method and the amount of under pressure have a significant effect on the texture. Wang X.X. et al. [20] found that strong plastic deformation induces a large number of continuous dynamic recrystallization grains (CDR grains), and during the annealing process, the average grain size is more sensitive to the annealing temperature.
This study investigates the effects of three different annealing temperatures on the microstructural evolution and mechanical properties of spun tubes with cross inner ribs. The research aims to elucidate the influence of annealing temperature on the microstructure and how it affects the material properties, while also analyzing the fracture behavior. Exploring the optimal annealing temperature provides a theoretical basis for selecting the annealing temperature for spun tubes.

2. Experimental Materials and Methods

The 5A06 aluminum alloy was machined into tube with an inner diameter of 90 mm and a wall thickness of 4 mm, as detailed in the chemical composition presented in Table 1. To ensure stable contact conditions between the rollers and the billet during the initial spinning stage and to prevent the diameter of the open end of the tube from expanding after spinning, the blank was chamfered at an angle of 20° in accordance with the forming angle of the rollers, as illustrated in Figure 1a.
In the spinning process, an appropriate axial distance can make the roller force more uniform, with a typical axial offset ranging from 2 to 8 mm [21]. The selection of the radius of the spinning roller filet is between 3 and 12 mm [10]. For the spinning process with cross inner ribs, the feed ratio was maintained at 0.25–1 mm/r, while the reduction rate was controlled within 30–60% to ensure proper material flow and rib formation [22]. According to the thermal machining diagram of the 5A06 aluminum alloy, it can be seen that the suitable heating temperature is between 350 and 500 °C [23]. The parameters of the spinning process are shown in Table 2.
The microstructure of the 5A06 blank consists of equiaxed aluminum grains measuring 40–50 μm. Prior to the experiment, the blank was preheated to 380 °C, as depicted in the drawing of the spinning machine and the mandrel in Figure 1b. The blank rotates with the mandrel while the three rotating wheels move in the axial direction. In the spin molding experiments, the rollers were lubricated with a mixture of lubricant and molybdenum disulfide, resulting in the production of the thin-walled tube with a cross inner rib, as shown in Figure 1c.
Figure 2a shows three rounds of a strong staggered spinning process. The sampling locations are shown in Figure 2b. The transversal inner rib (TIR) region of the tube was annealed for 2 h at 290 °C, 320 °C, and 350 °C, respectively. After grinding and polishing, the samples were tested and analyzed for phase and elemental distribution using a scanning electron microscope (SEM), JEOL Ltd., Tokyo, Japan. The residual stress of the specimens was measured using an X-ray diffraction residual stress analyzer (IXRD), Rigaku, Tokyo, Japan. The samples were electrolyzed using a 1:9 mixture of HClO4 and C2H6O and then tested by electron back scatter diffraction (EBSD), Oxford Instruments, Abingdon, UK. The microstructure observation surface is shown in Figure 2c. The geometry of the tensile specimen is shown in Figure 2d. The macroscopic dimensions of the tensile specimen are shown in Figure 2e.

3. Results and Discussion

This study determined residual stresses using X-ray diffraction (XRD). When residual stresses are present in a material, the interplanar spacing (d-spacing) of the crystal lattice changes, resulting in a shift in the diffraction peaks when Bragg diffraction occurs. The relationship between the diffraction angle (2θ) and the corresponding d-spacing can be calculated according to Equation (1):
2 d sin θ = n λ
where d is the crystal plane spacing, and n is the wavelength of X-rays. When the sample is irradiated at different angles of incidence, the slope of the diffraction angle to sin2θ is obtained as M. The residual stress (σ) in the corresponding direction can be calculated according to Equation (2) [24]:
σ = K M
where K is the stress constant, M is the angle between the sample surface normal, and the diffracted crystal surface normal.
The distribution of residual stress at the rib positions of the tube under different annealing temperatures is illustrated in Figure 3. The material exhibits a high residual stress of −75 MPa, primarily attributed to dislocation accumulation and lattice distortion induced by plastic deformation during the spinning process. After annealing at 290 °C, the residual stress decreases to approximately −50.01 MPa, indicating that thermal activation promotes dislocation slip and rearrangement, thereby enabling partial stress relief through dynamic recovery mechanisms. When the annealing temperature is increased to 320 °C, the residual stress further reduces to −30.89 MPa. At the highest annealing temperature of 350 °C, the residual stress reaches its minimum value of −24.01 MPa.
Annealing treatment significantly influences the microstructure and mechanical properties of materials by altering the morphology, distribution, and interfacial characteristics of the second phase. The second phase in the 5A06 aluminum alloy has been extensively studied by numerous researchers, with the primary second phases identified as Mg2Si, Al6(Fe, Mn), and β(Al3Mg2) [25,26]. The β phase is characterized by its hardness and brittleness, which detrimentally affects the mechanical properties of the material [27]. The weak adhesion effect at the interface between the α grain matrix and the hard and brittle β is the preferred location for microcrack nucleation and further ductile fracture [28]. In 7xxx and 5xxx aluminum alloys, the precipitated phase undergoes spheroidisation after annealing [29,30]. The 5A06 aluminum alloy with large plastic deformation has β-phase precipitation in annealing at 170 °C [31].
Figure 4 presents scanning electron microscope (SEM) images captured at different annealing temperatures. After spinning, the microstructure exhibits fragmented Al6(Fe, Mn) phases, smaller Mg2Si particles, and voids formed during the forming process. The formation of voids is primarily attributed to the uncoordinated motion between the particles and the matrix during the rotational deformation of the 5A06 aluminum alloy. As the second-phase particles break apart and move, the metal fails to flow and replenish, resulting in voids around the particles. Figure 4b shows the sample after slight corrosion at an annealing temperature of 290 °C. It can be observed that flaky second-phase particles precipitate around the grain boundaries as well as at the triangular grain boundaries. When the annealing temperature is 320 °C and 350 °C, no fragmented second phase is observed in the material, and more fine precipitates are formed. However, the voids generated during the spinning process do not disappear, as shown in Figure 4c,d.
Figure 5 shows the energy spectrum of the second phase of 5A06 aluminum alloy. Figure 5a shows the crushed second phase without annealing treatment. It can be clearly observed that the second phase is rich in Fe, Mn, and Al elements, and a small amount of Mg elements. The second phase is Al6(Fe, Mn). After the annealing treatment at 350 °C, the energy spectrum of the second phase is shown in Figure 5b. The Mg element in the second phase disappears. The fine second phase after the annealing treatment is observed, which indicates that the Mg element precipitates out to form the second phase after the annealing treatment.
Zener pinning forces occur when a second phase is present in the alloy, thus inhibiting recrystallization. The Zener formula can be calculated according Equation (3):
P z = 3 f v γ 2 r
where fv is the second phase volume fraction, r is the average radius of the second-phase particles, and γ is the second phase interfacial energy. The smaller the size of the second phase and the larger the volume fraction, the stronger the pinning force. Fine particles can hinder the onset of recrystallization in alloys with a band structure [32].
When the degree of deformation is large, the driving force of recrystallization is much larger than the pinning force of second phase recrystallization. And the coarse second phase (>1 μm) can act as a recrystallization nucleus to induce Particle stimulation nucleation (PSN) and promote recrystallization [33]. CubeND is a typical PSN recrystallization texture [34]. The Al6(Fe, Mn) phase stimulates nucleation during the recrystallization process.
Figure 6 presents the IPF (inverse pole figure) maps at different annealing temperatures. Figure 6a shows the specimen after spinning, where the grain orientation is predominantly {111}, with an average grain size of 10.94 μm. Figure 6b displays the specimen annealed at 290 °C, exhibiting an equiaxed grain structure with larger grain sizes but no distinct orientation. The average grain size is 5.9 μm, and the proportion of grains within the 20 μm to 40 μm range increases significantly. Figure 6c illustrates the specimen annealed at 350 °C. Compared to the 290 °C annealed microstructure, the grains remain equiaxed, with an average grain size increasing to 7.2 μm, and the fraction of grains in the 20–40 μm range further rises. At the measured locations, the grains are noticeably elongated and displaced along the RD (rolling direction). Due to the misalignment between the force generated by the inner rib filling and the AD (axial direction), the grains experience some degree of deviation. At an annealing temperature of 290 °C, the grain size slightly decreases, while at 350 °C, the grains continue to grow, becoming more equiaxed and uniformly distributed.
Figure 7 demonstrates the recrystallization, substructure, and deformed grains of the TIR region. Figure 7a shows the specimen after spinning with a large number of deformed microstructures in the organization, indicating that the dislocation density and their interactions increased significantly during the forming process, and the dislocations were located at the grain boundaries. Stacking fault energy (SFE) plays an important role in the plastic deformation mode of face-centered cubic materials [35]. As a typical SFE metal, aluminum exhibits dislocations that can be rearranged through cross-slip after movement and are prone to dynamic recovery (DRV) during plastic deformation [18,27]. This process results in the accumulation of dislocations within the substrate and a gradual transformation into sub-grain boundaries.
Figure 7b shows the sample after annealing at 290 °C, with 86% recrystallization in the tissue, but 12.8% of sub-structures are still present. Figure 7c shows the specimen after annealing at 350 °C, the recrystallization percentage is 90.8% and the substructure percentage is further reduced to 6.5%. This is due to the fact that during the annealing process, the dislocation density continues to decrease and the atoms begin to rearrange themselves at the sub-grain boundaries, resulting in the formation of new nuclei (recrystallized grains). The nucleation rate can be calculated according to Equation (4) [36]:
N = C exp ( Q N R T )
where C is a constant, QN is the activation energy for nucleation, R is the universal gas constant, and T is the annealing temperature in Kelvin. It can be concluded that the nucleation rate depends on the annealing temperature, the higher the temperature nucleation rate, the stronger the recrystallization kinetics. Therefore, the specimens after annealing at 350 °C recrystallized more than those after annealing at 290 °C.
During the annealing process, the coalescence and growth of sub-grains and the transformation of sub-grains into recrystallized nuclei can be controlled by the mobility of LAGBs, which enables the growth of recrystallized grains. The mobility of HAGBs enables the growth of recrystallized grain. The mobility of LAGB and HAGB can be calculated according to Equation (5) [37].
M = M 0 exp ( Q r e x R T )
where M0 is a pre-exponential factor, Qrex is the apparent activation energy for recrystallization, R is the universal gas constant, and T is the Kelvin temperature. The mobility of LAGBs and HAGBs increases with increasing annealing temperature. An increase in annealing temperature from 290 °C to 350 °C increases the mobility of high angle versus low angle. This also leads to rapid recrystallization kinetics and grain growth of the samples after annealing at 350 °C.
The increase in dislocation density during the deformation process aggravates the fractional aberrations around the dislocations, and the induced fractional aberrations cause changes in the orientation difference in the crystals in the vicinity of the dislocations. When dislocations accumulate to a certain extent, dislocation walls, microbands, and sub-granular boundaries appear in the microstructure, and these substructures are observed in Kernel Average Misorientation (KAM) in the form of localized orientation differences.
The KAM data are mainly used to calculate the geometrically necessary dislocation density within the plastically deformed metallic material. The local orientation difference at each scanning point is the core of 24 nearest neighboring points around the data point, which is used to assign a scalar value to each point indicating its local orientation difference. The color scale indicates the degree of the local orientation difference, which directly represents the internal strain at each point [38]. The KAM map obtained by EBSD can be used to calculate the geometrically necessary dislocation density. In general, the mean geometric dislocation density is calculated as follows:
Δ θ = 1 n j = 1 n θ j , s u r θ i
where θi is the local orientation difference in data point i; θj,sur is the local orientation difference around data point i.
The mathematical relationship between geometric must dislocations and local orientation differences can be calculated by means of the strain gradient theory Equation (7) [39].
ρ = 2 θ / μ b
where θ is the average local misorientation within the selected region, μ is the measurement step size (1.2 μm), and b is the magnitude of the Burgers vector (b = 0.286 nm) [40].
The KAM map is presented in Figure 8. The specimens after spinning are shown in Figure 8a, where the organization contains a large number of dislocations. The specimen after 290 °C annealing treatment is shown in Figure 8b, and still contains a small number of dislocations according to the majority of the grain boundaries for the high-angle grain boundaries. The specimen after 350 °C annealing treatment is shown in Figure 8c, where the dislocations are further reduced and the distribution of the grains is more uniform. The measured average KAM values for the three samples are 1.1°, 0.34°, and 0.32°, respectively. The sample annealed at 350 °C exhibits the lowest KAM value, suggesting a more complete recrystallization process.
The number of recrystallized grains increases, and the dislocation density decreases dramatically. The dislocation densities of the specimens after spinning and annealing at 350 °C were 6.47 × 10¹⁶ m−2 and 1.87 × 10¹⁶ m−2, respectively. The presence of a high geometrically necessary dislocation density (GND) in the post-spin group indicates that dislocations are stacking and entangling on the slip surface, resulting in the formation of many deformation zones and that the dislocation density decreases as the grains recrystallize during the annealing process.
After spinning, the texture is altered during the annealing process, which has a significant effect on the mechanical properties of the material. The ODF is superimposed by the u component, denoting all orientations g(g,gi,η) that have ≈η minor dislocations with a particular orientation gi. The ODF is expressed as a weighted sum of radially symmetric functions ui, centered at a set of orientations gi = (1, …, N), and a uniform distribution of orientations in Euler space (fiso(g) = 1∀g ∈ FZ) [41].
f ( g ) = i = 1 N w i u ( g , g i , η ) + ( 1 i = 1 N w i ) f i s o ( g )
where wi is the weight associated with each component. The texture analysis was conducted using Aztec crystal software 2.1 version. The texture after annealing is characterized by the orientation distribution function (ODF). The texture composition is characterized by the Euler angles. As shown in Figure 8, the typical texture components of FCC metals and their corresponding Euler angles and Miller indices are detailed in Table 3. In general, the Cube{001}<100> and R-CubeND{001}<110> compositions belong to the recrystallized organization found in FCC structural alloys [19]. β-fiber compositions are typically extruded weaves containing the characteristic texture Brass {110}<112>, S{123}<634>, and Copper {110}<112>. Upon annealing, the β-fiber texture and {112}<111> rolled textures are gradually transformed into recrystallized textures, including Cube textures and R-CubeND textures [42].
Figure 9 shows the orientation distribution at different annealing temperatures. The texture after spinning is shown in Figure 9a and contains mainly {221}<1-22> and {111}<3-41> texture. The texture after annealing at 290 °C is shown in Figure 9b and becomes more uniformly distributed, containing Cube{001}<100>, S{123}<634>, Brass{110}<112>, and R-CubeND{001}<110>. Some β-fiber texture begins to appear, especially in Brass {110}<112>. The texture after annealing at 350 °C is shown in Figure 9c, which consists mainly of R-CubeND{001}<110> and Cube{001}<110>. The texture distribution after annealing at 350 °C is more uniform and random, and the temperature increase effectively promotes grain recrystallization. The temperature increase effectively promotes grain recrystallization. During the annealing process, the stresses within the material are released and the grains are recombined, resulting in a variety of new textures. This observation suggests that the annealing process not only promotes grain recrystallization but also attenuates the texture-strengthening effect induced by plastic deformation. It is widely believed that random textures are related to the particle-stimulated nucleation (PSN) mechanism [43].
In order to obtain a complete picture of the microstructural evolution during the annealing process, Figure 10 shows the changes in the microstructure of the 5A06 aluminum alloy after annealing. Figure 10a shows the initial blank structure, consisting of equiaxed large grains. Figure 10b depicts the microstructure after spinning, in which a large number of dislocations and {111} texture orientations occur, resulting in flattened grains. The microstructure also shows a sub-grain structure and a small amount of recrystallized tissue. Figure 10c shows the organization at 290 °C, where most of the grains have recrystallized but still contain a small amount of sub-structure, with a small amount of β-fiber retained in the grain orientation. Figure 10d shows the microstructure of the sample annealed at 350 °C, where recrystallization is almost complete and Cube, R-Cubes, and some random textures appear.
The stress–strain curve is shown in Figure 11a, with the corresponding yield strength (YS), ultimate tensile strength (UTS), and elongation (EL) results presented in Figure 11b. After annealing, the yield strength and elongation of the material increased compared to the as-spun state, while the ultimate tensile strength decreased. At an annealing temperature of 290 °C, the material achieved the highest elongation of 42.43%, along with a relatively high ultimate tensile strength, which is attributed to the combined effects of partial β-fiber texture and a low density of dislocations. The superior mechanical properties at 290 °C suggest that alloys with smaller average grain sizes or heterogeneous grain structures can exhibit excellent mechanical performance [44,45]. The decrease in elongation at 350 °C is due to the precipitation of second-phase particles at triple grain boundaries. The increase in YS after annealing is caused by the precipitation of numerous fine second-phase particles, which form dislocation loops as dislocations bypass them, hindering dislocation motion on slip planes and thereby enhancing yield strength.
Figure 12 illustrates the fracture morphology of 5A06 aluminum alloy tubes at different annealing temperatures. As shown in Figure 12a, the fracture surface of the as-spun specimen exhibits a river-like pattern. The spinning process generates a high density of dislocations and tangles, leading to significant work hardening and stress concentration within the deformed structure. The tensile fracture surface reveals large dimples and a small number of small dimples, indicating a trans granular fracture with a ductile fracture mechanism. Figure 12b displays the fracture morphology after annealing at 290 °C, showing non-uniform dimples with an average size of approximately 8 μm. In Figure 12c, the fracture morphology after annealing at 320 °C demonstrates larger dimples, with diameters around 11 μm, along with some very small dimples. Figure 12d presents the fracture morphology after annealing at 350 °C, where extremely large dimples of 20 μm containing smaller dimples are observed. After annealing, the dislocation density decreases, and cleavage planes disappear, resulting in a typical ductile fracture mechanism. This is characterized by weak interfacial adhesion between the α-grain matrix and hard brittle β-grains [46,47], which facilitates microcrack nucleation and further ductile fracture. The increase in dimple size with rising annealing temperature also reflects the growth of second-phase particles.
Before annealing treatment, cracks may initiate from the fractured second phase or the void defects generated during the spinning process. After annealing treatment, cracks originate from both the second phase and the void defects.

4. Conclusions

This paper investigates the microstructure of different parts of the 5A06 aluminum alloy tube with a cross inner rib, explores the microstructure and mechanical properties change rule under annealing temperatures of 290 °C, 320 °C, and 350 °C, and analyses the organizational properties of the samples before annealing and after annealing. The main conclusions are as follows:
(1)
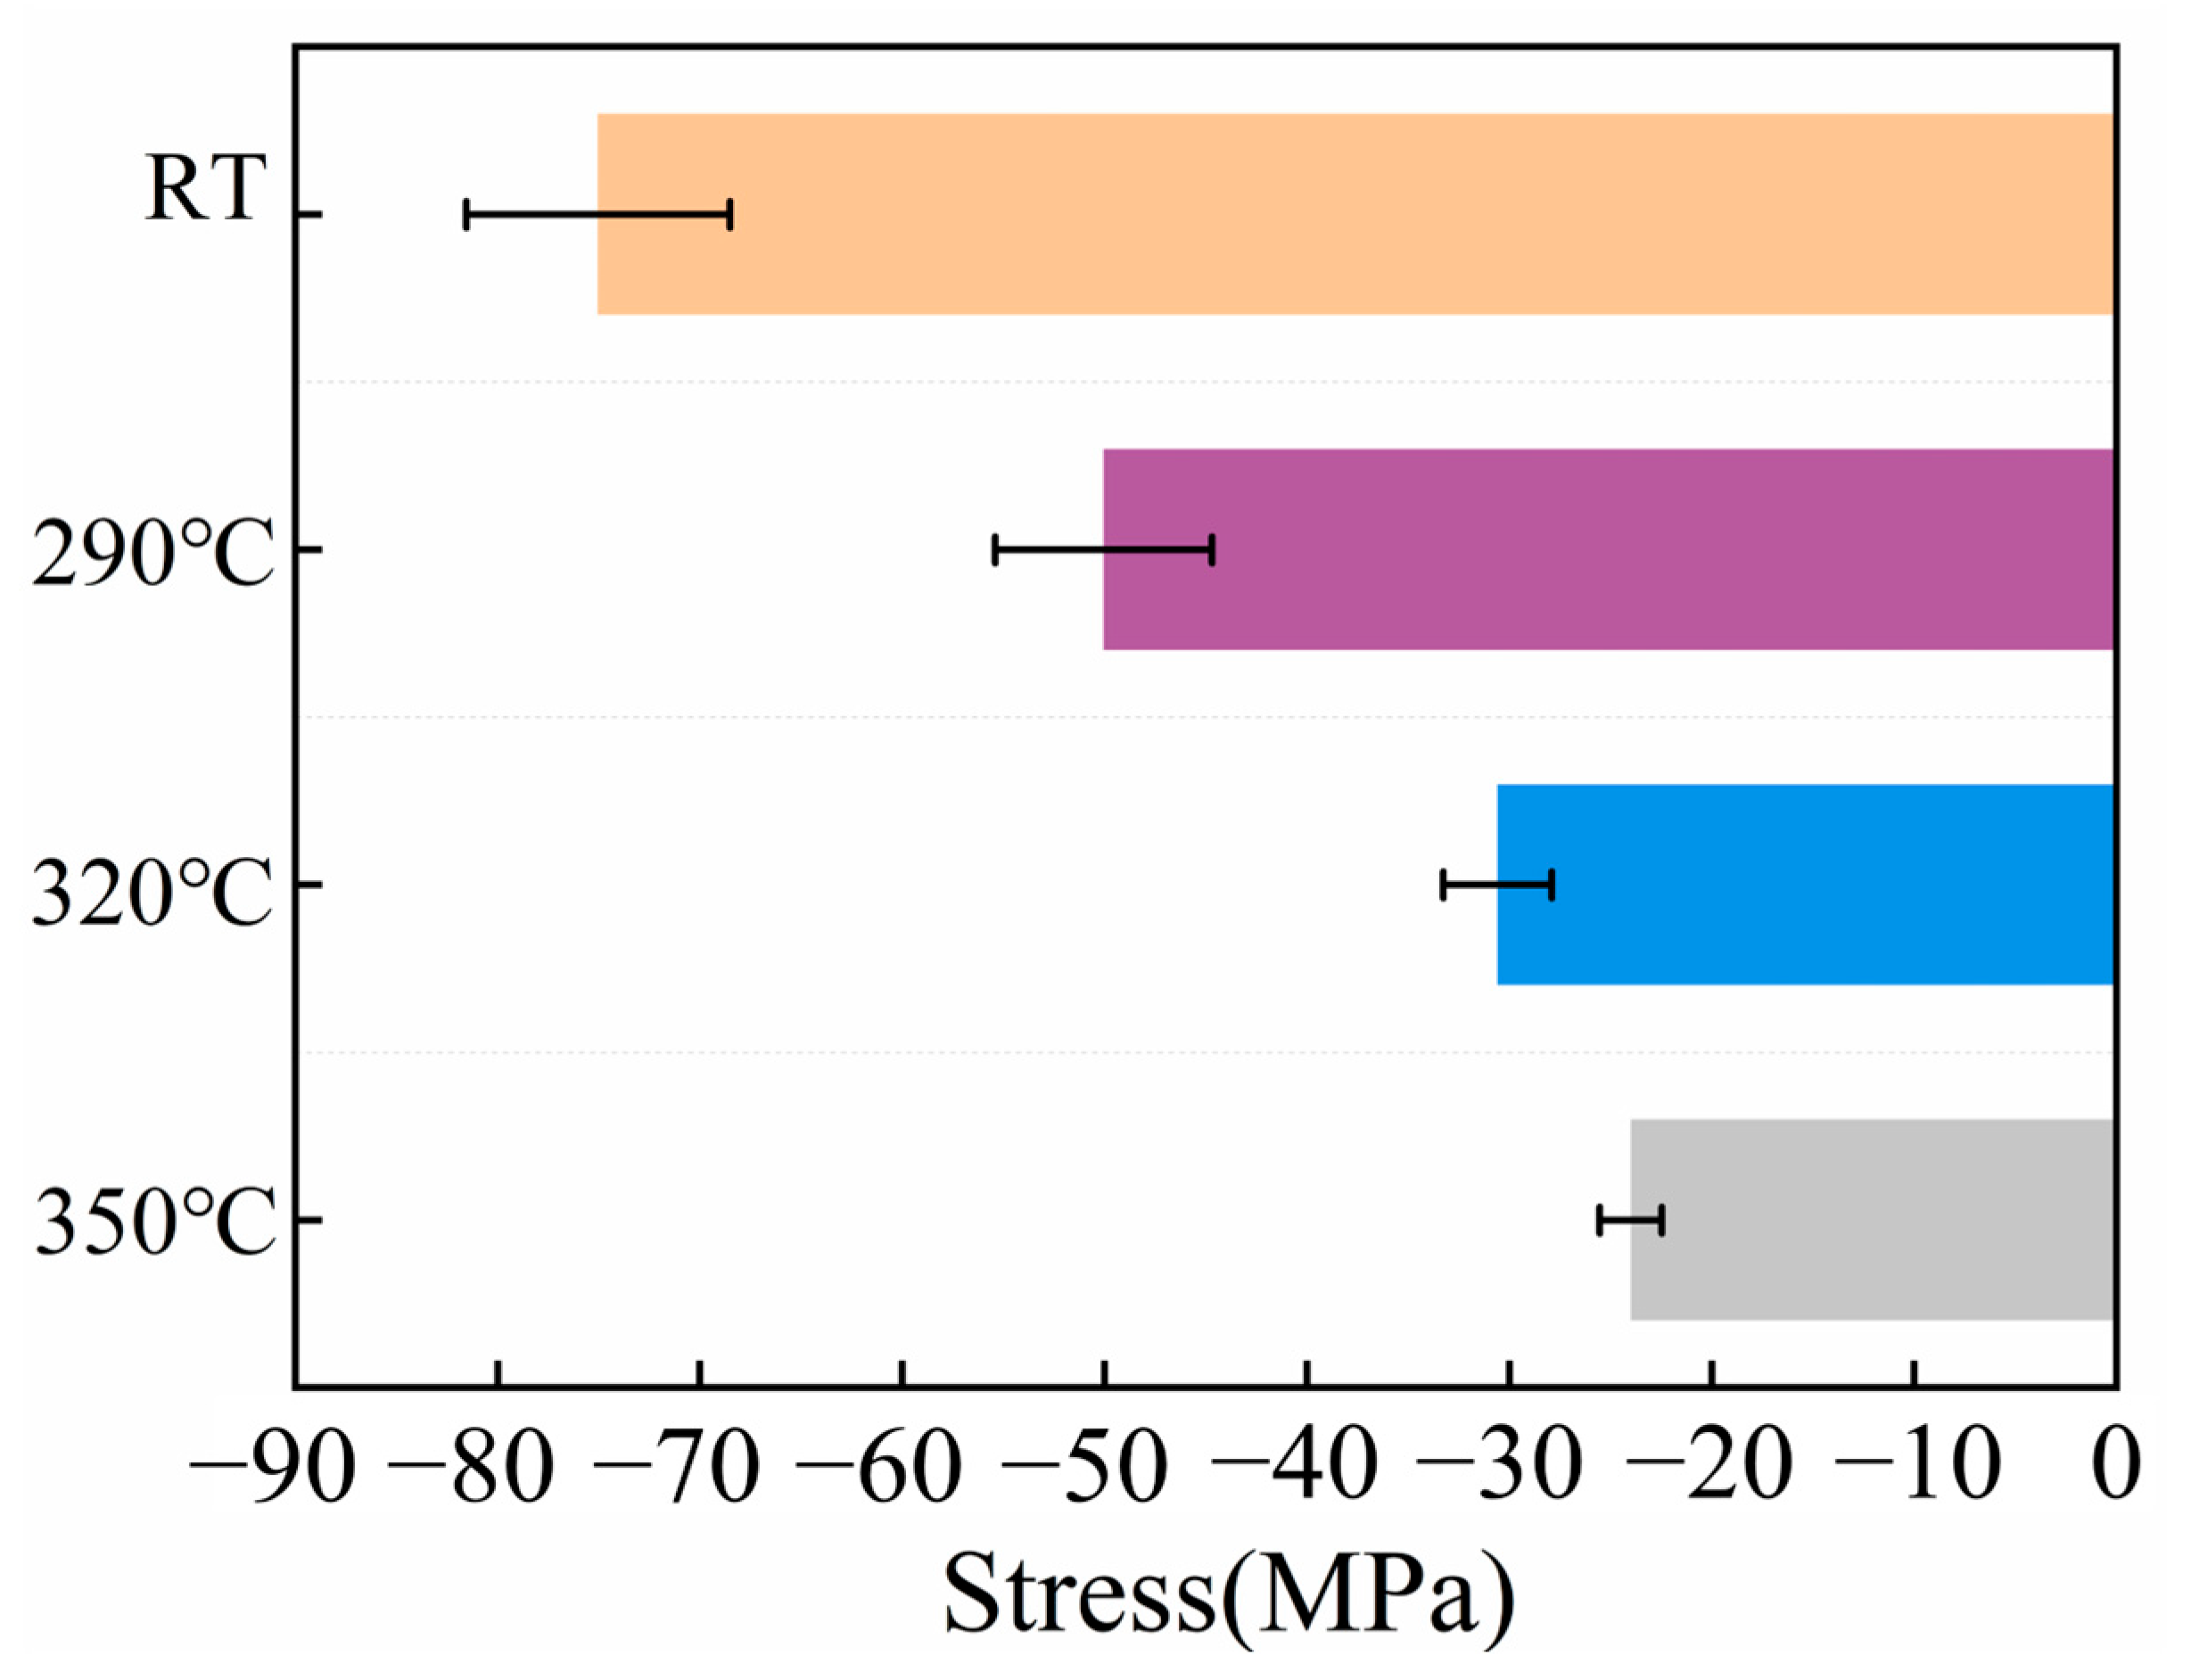
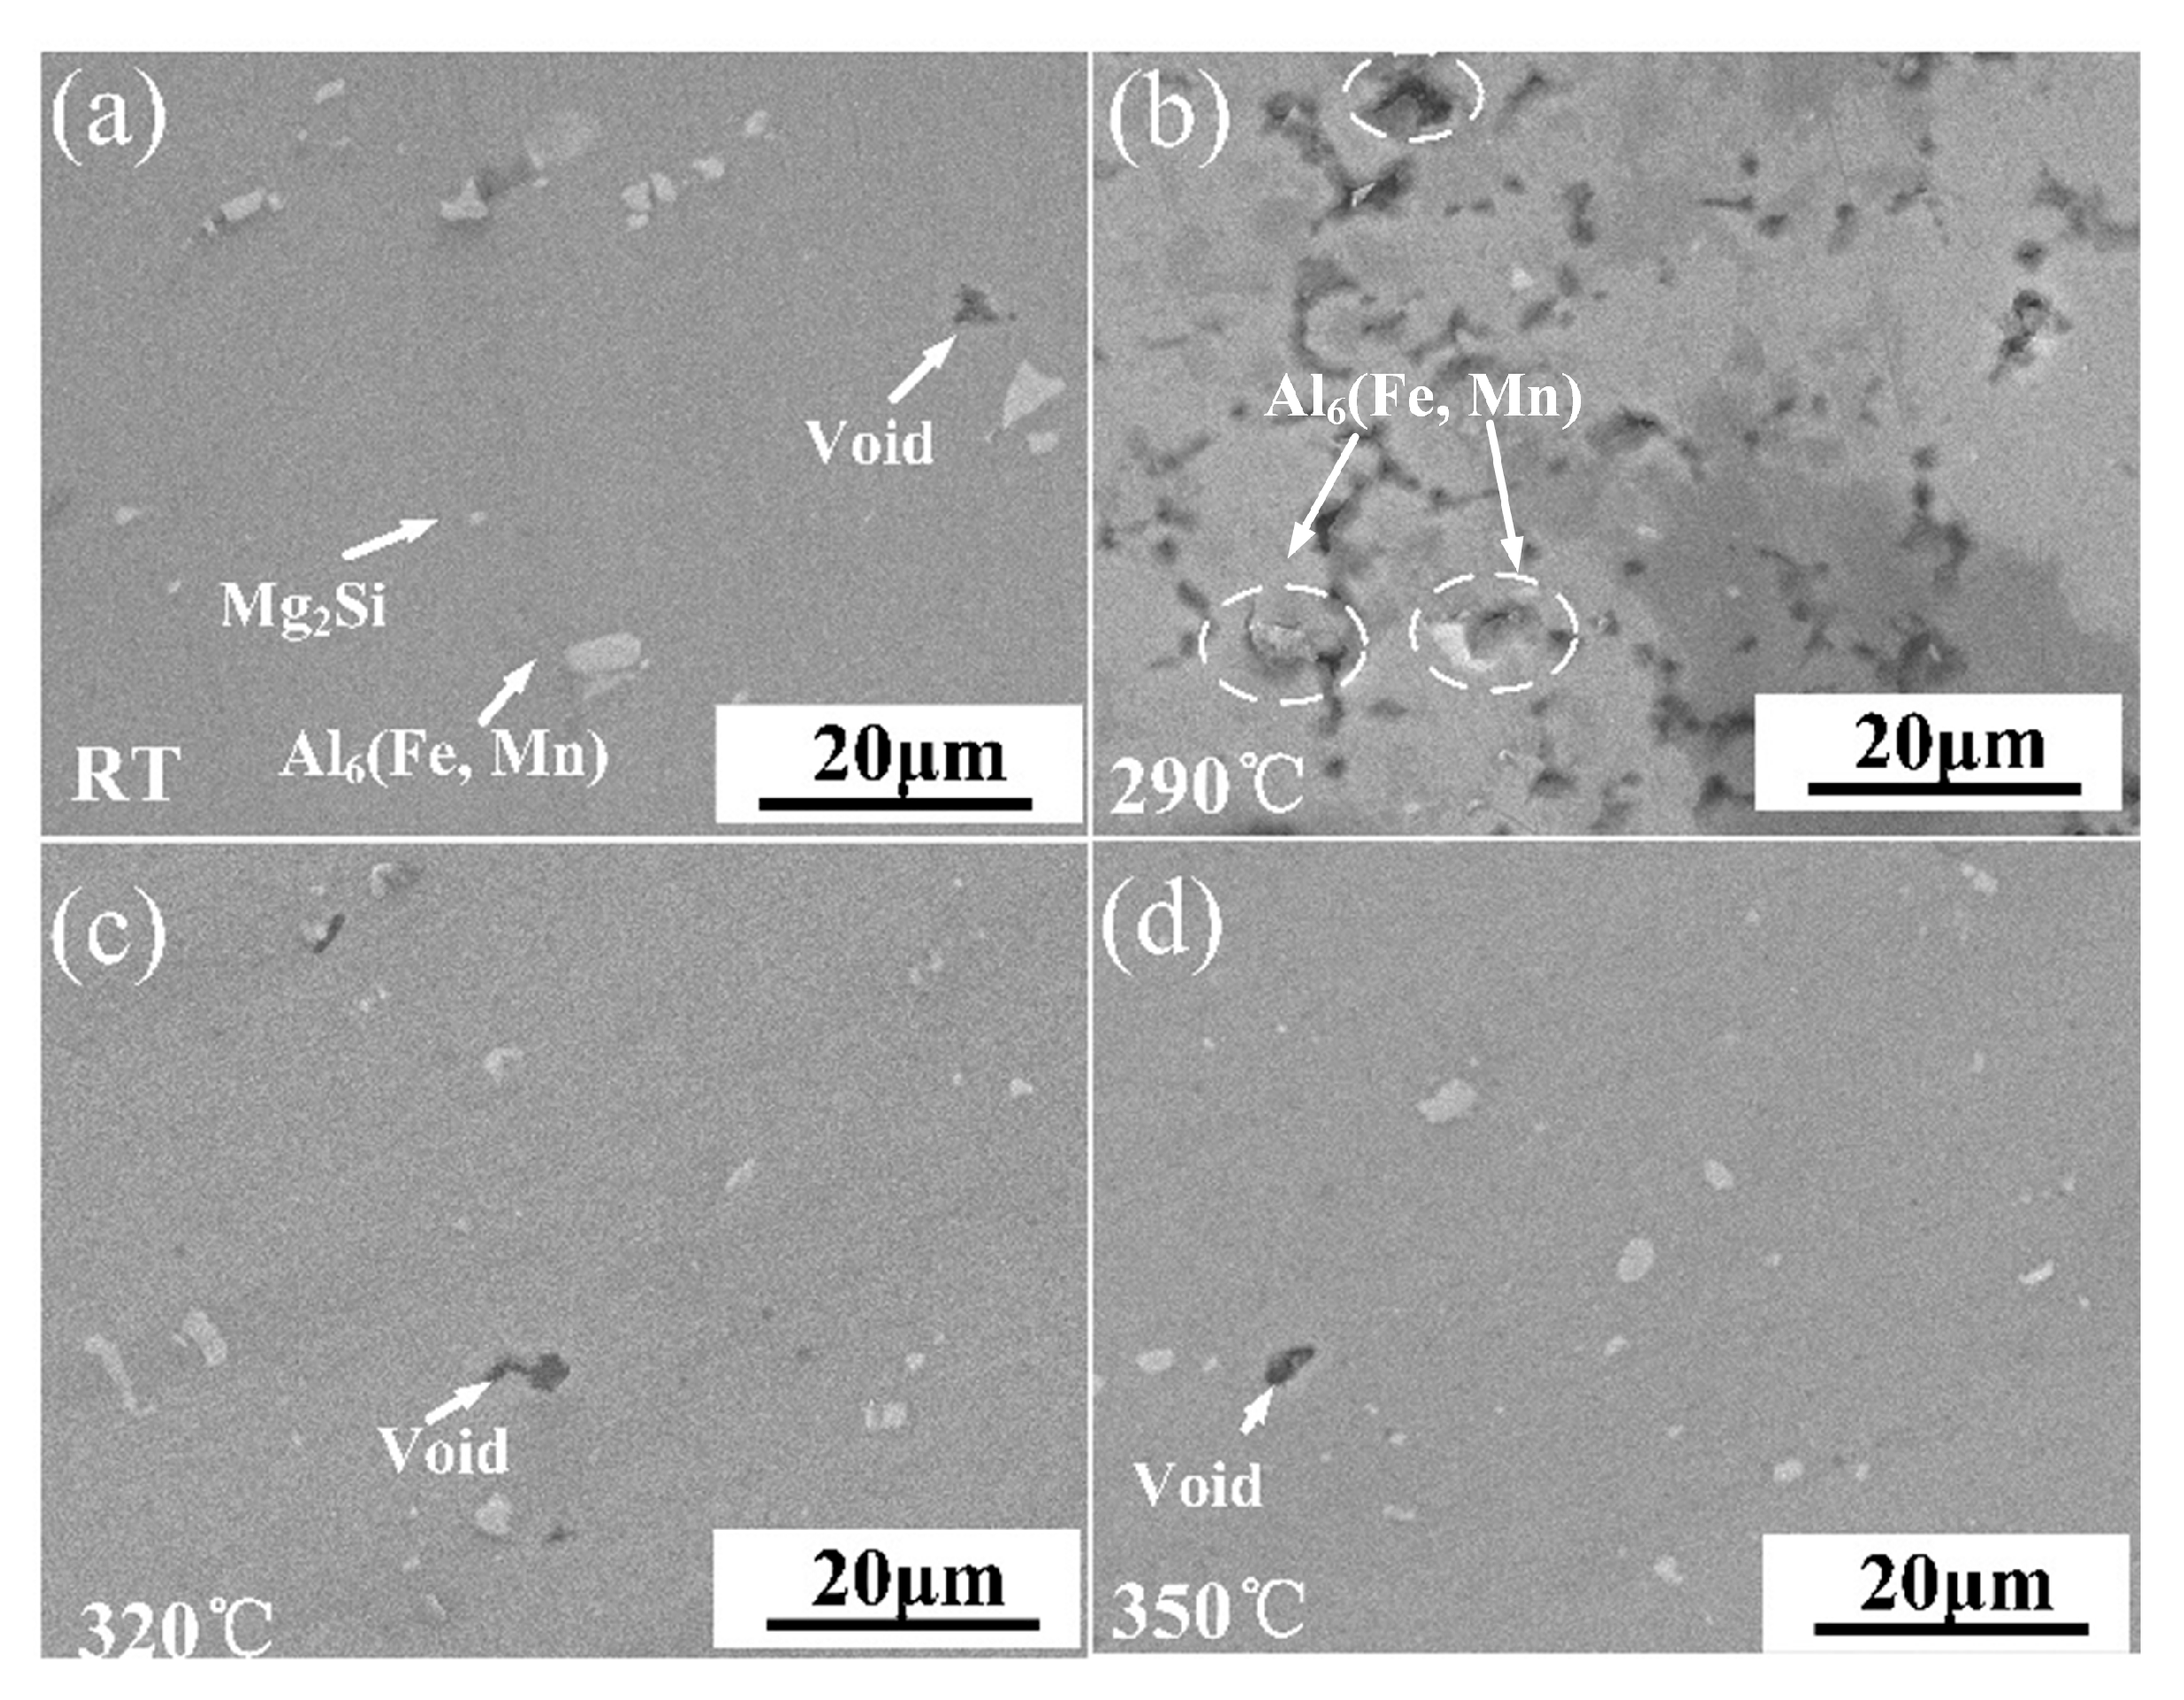
After annealing, the residual stress in the TIR decreased from 70.5 MPa to 24.01 MPa. After annealing, the fragmented second-phase particles disappeared. Precipitation appeared at the triple grain boundaries and was accompanied by the formation of fine precipitates.
(2)
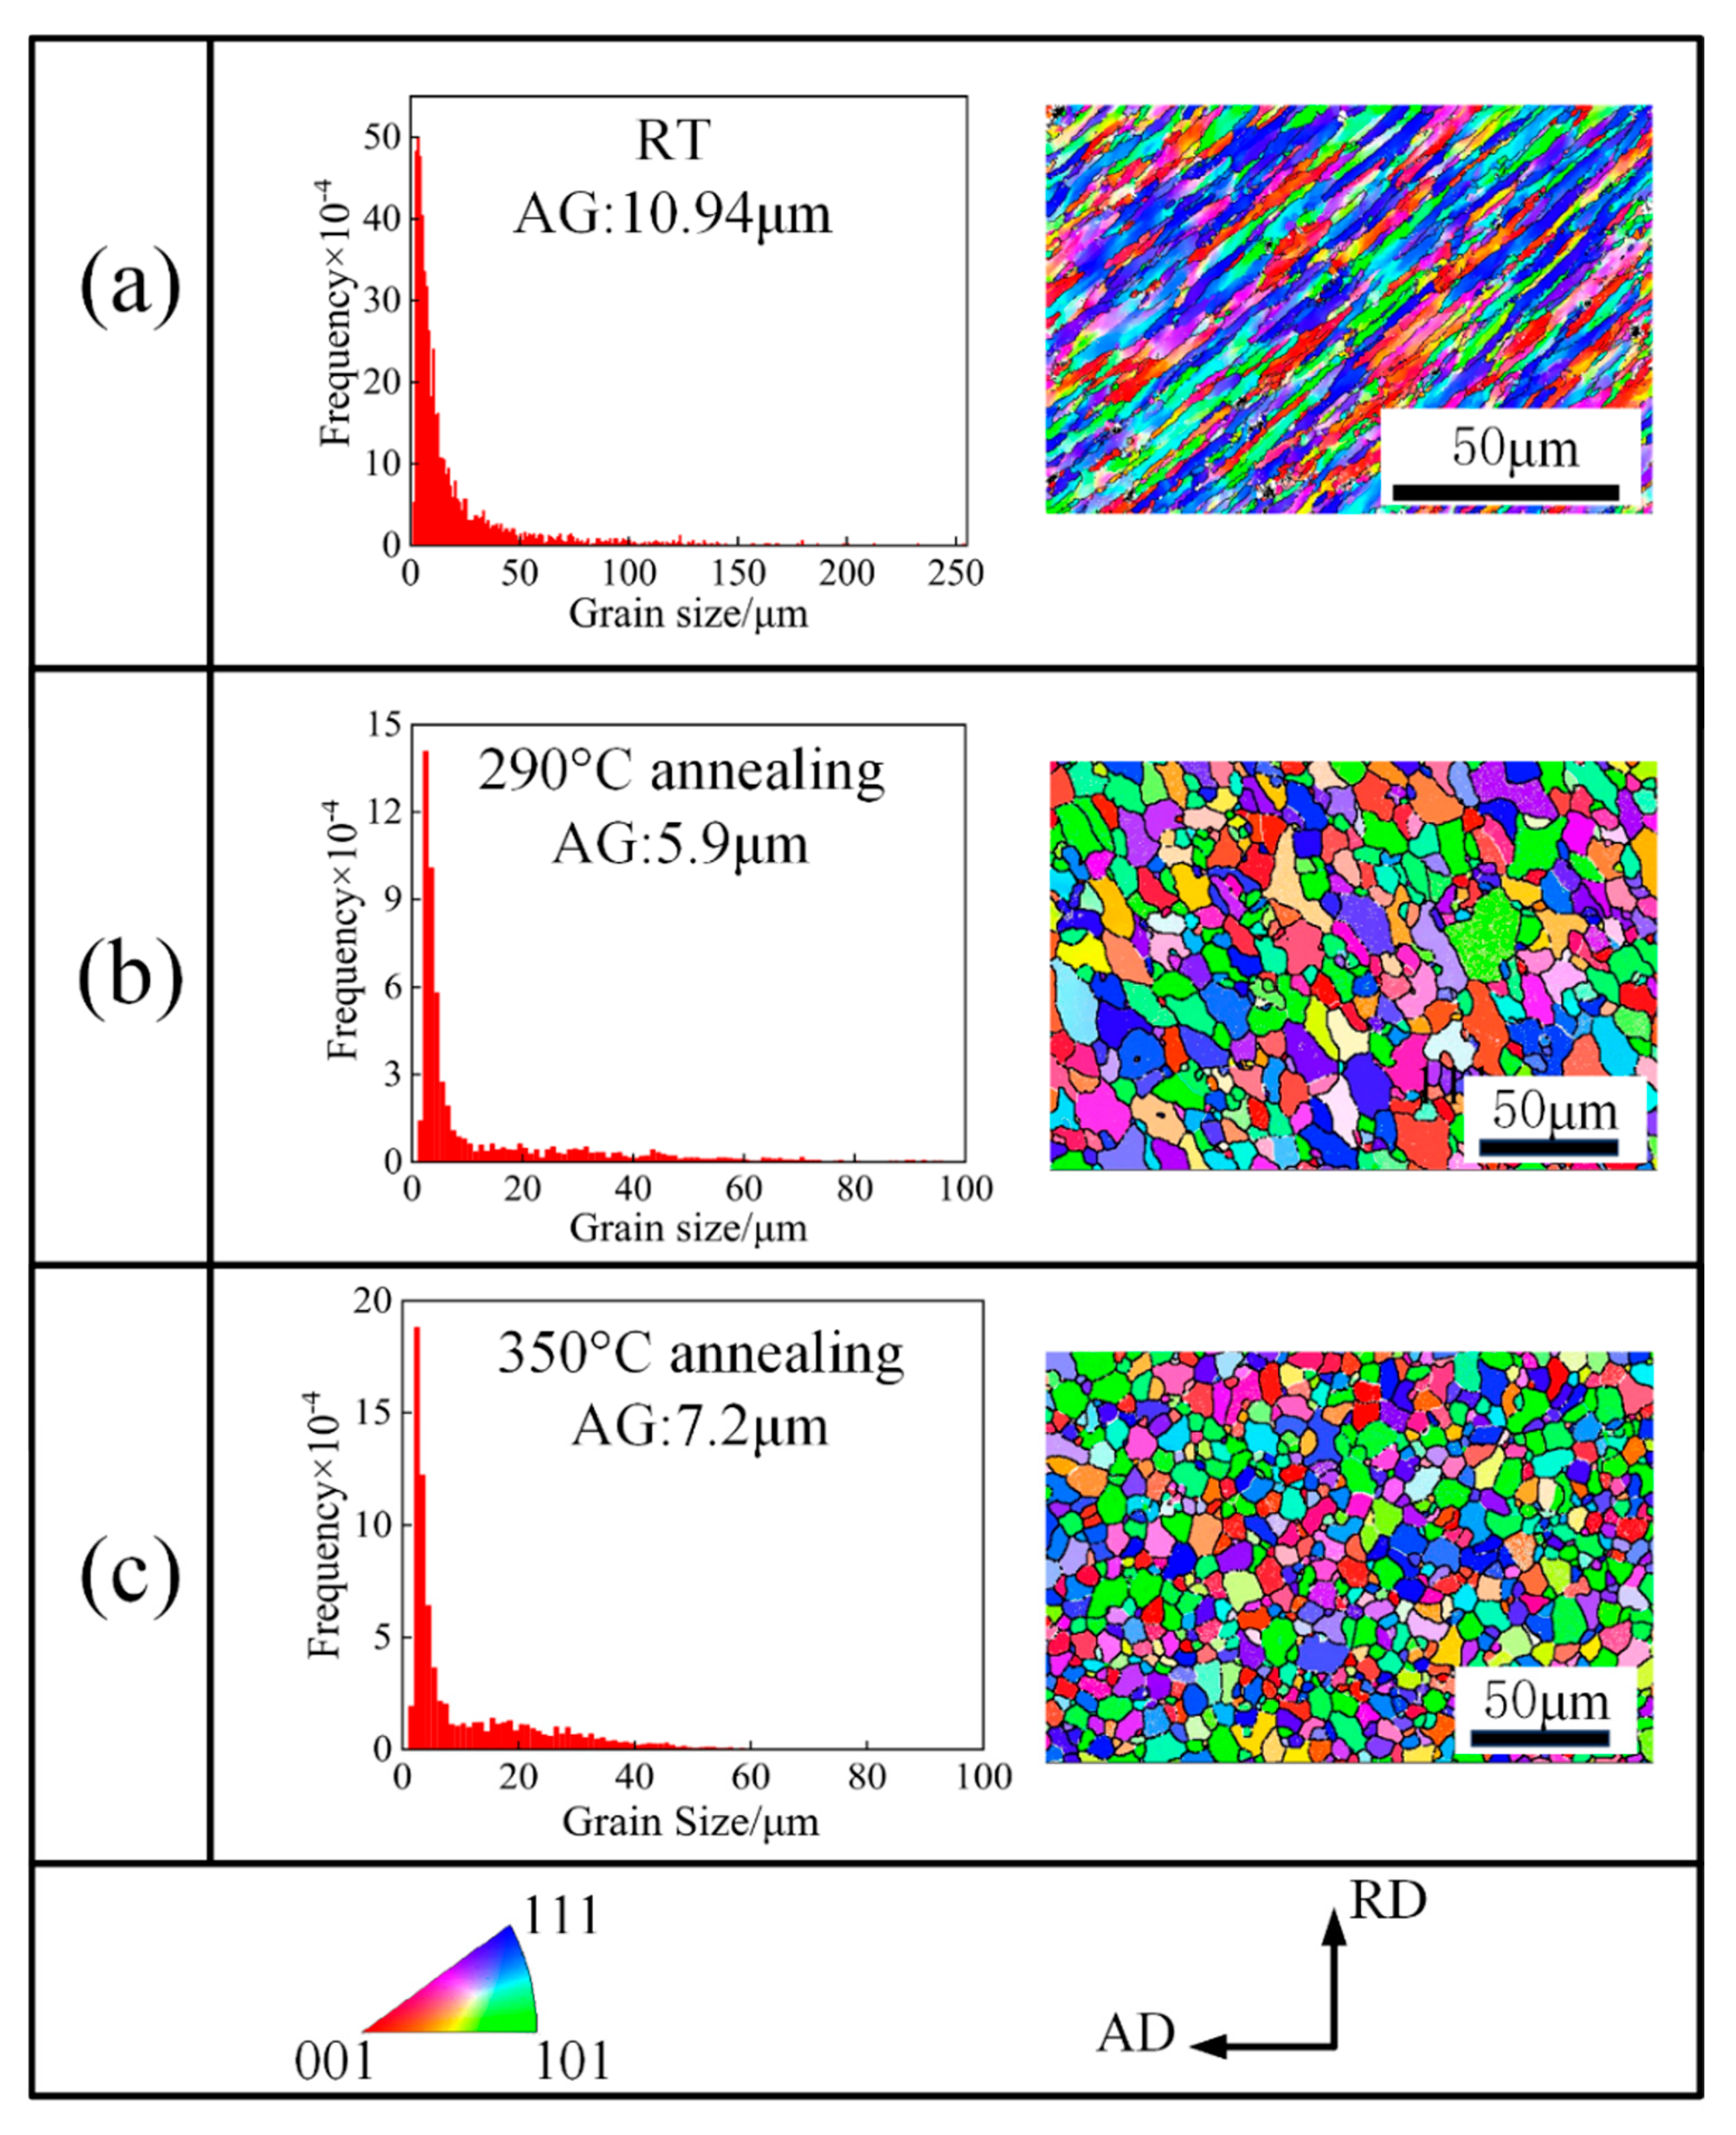
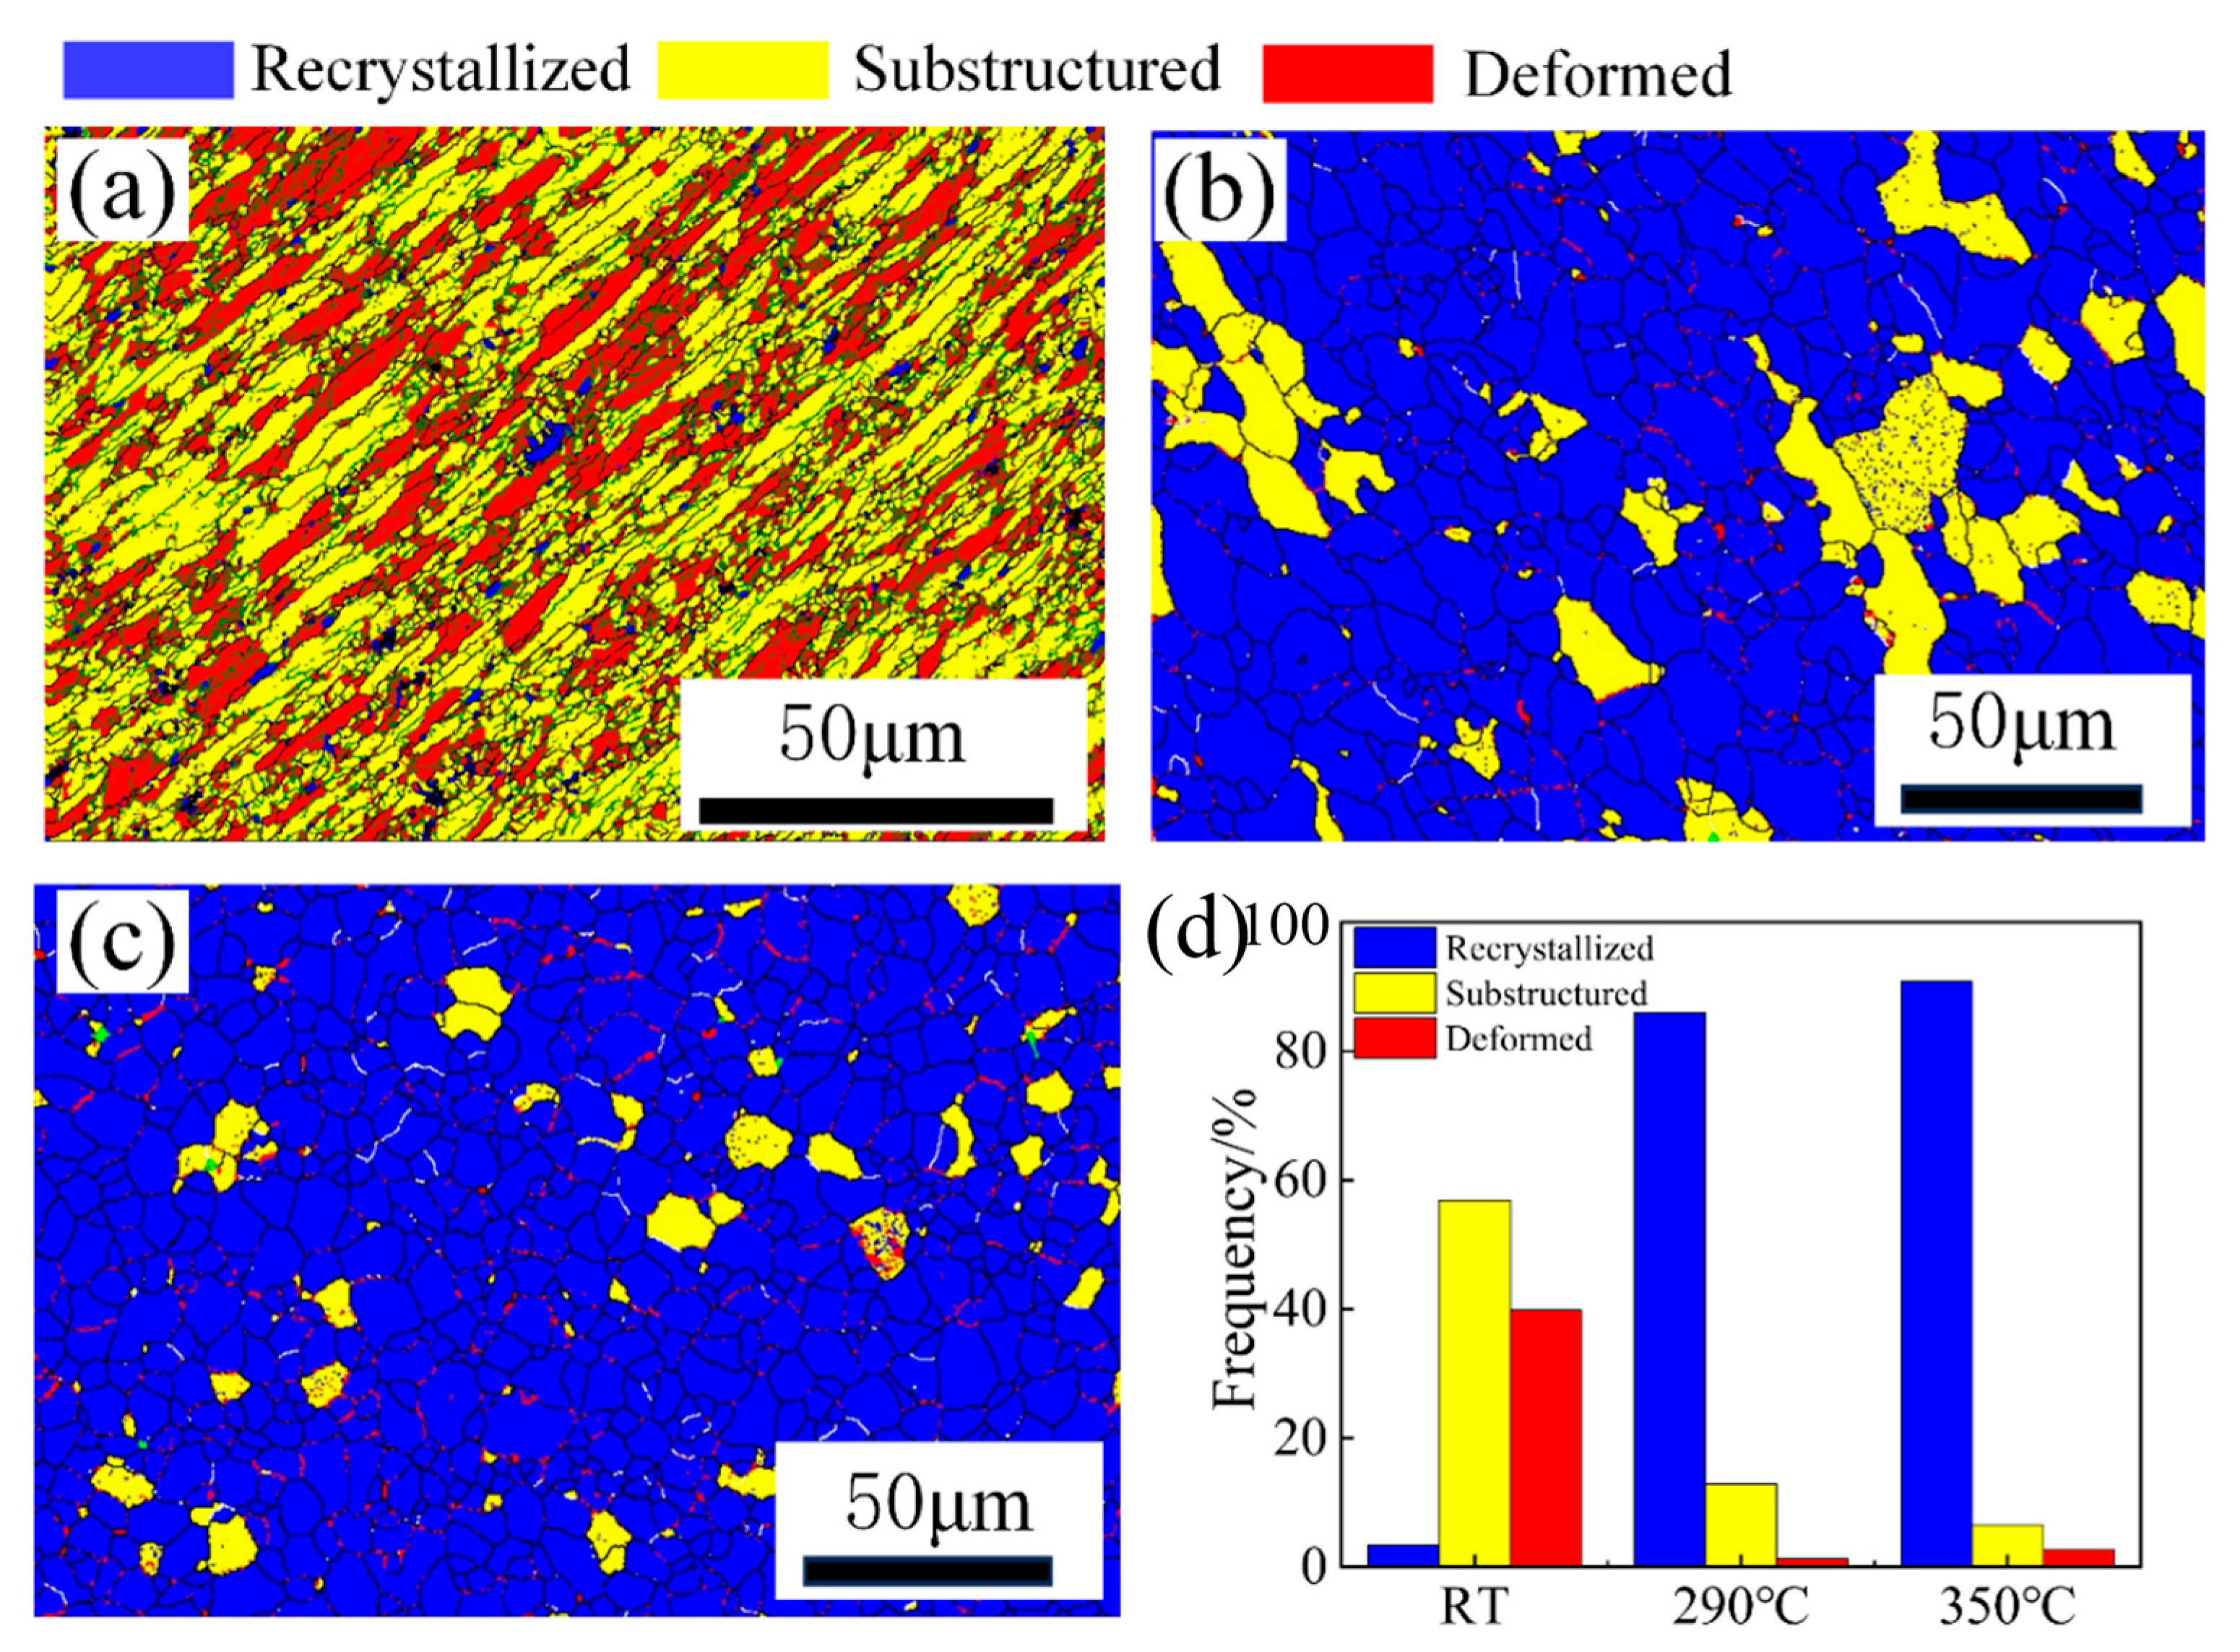
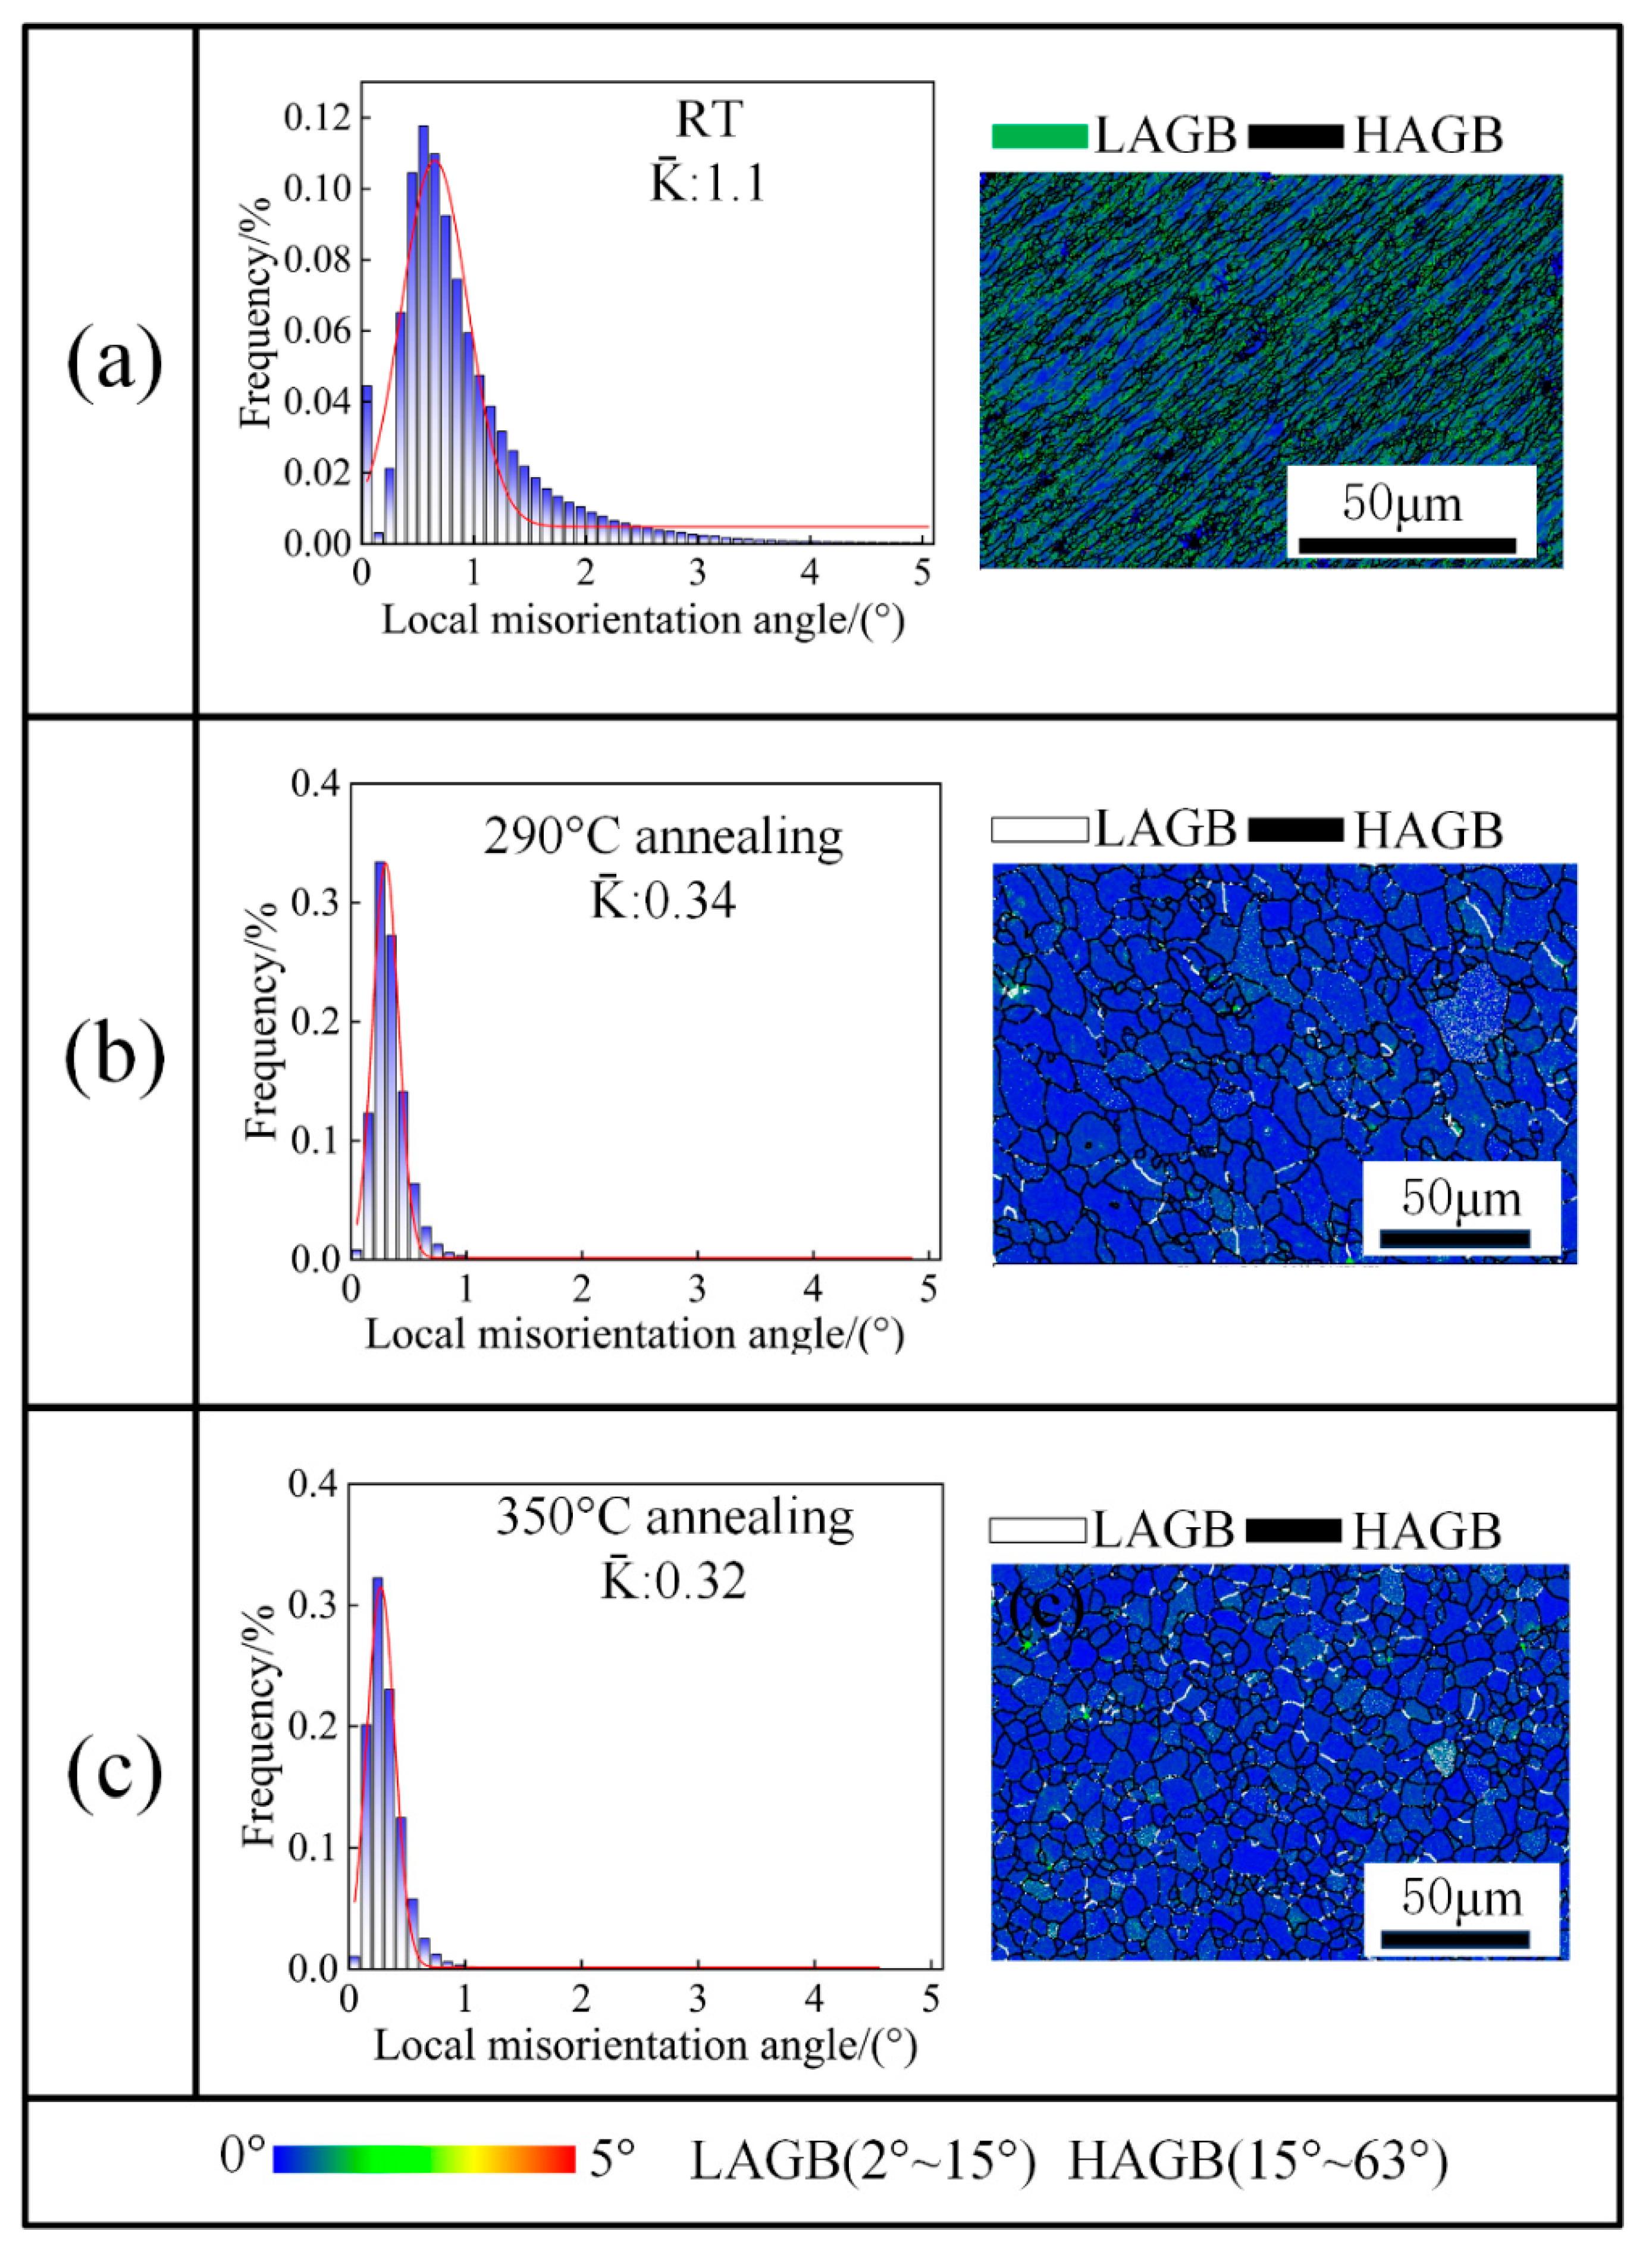
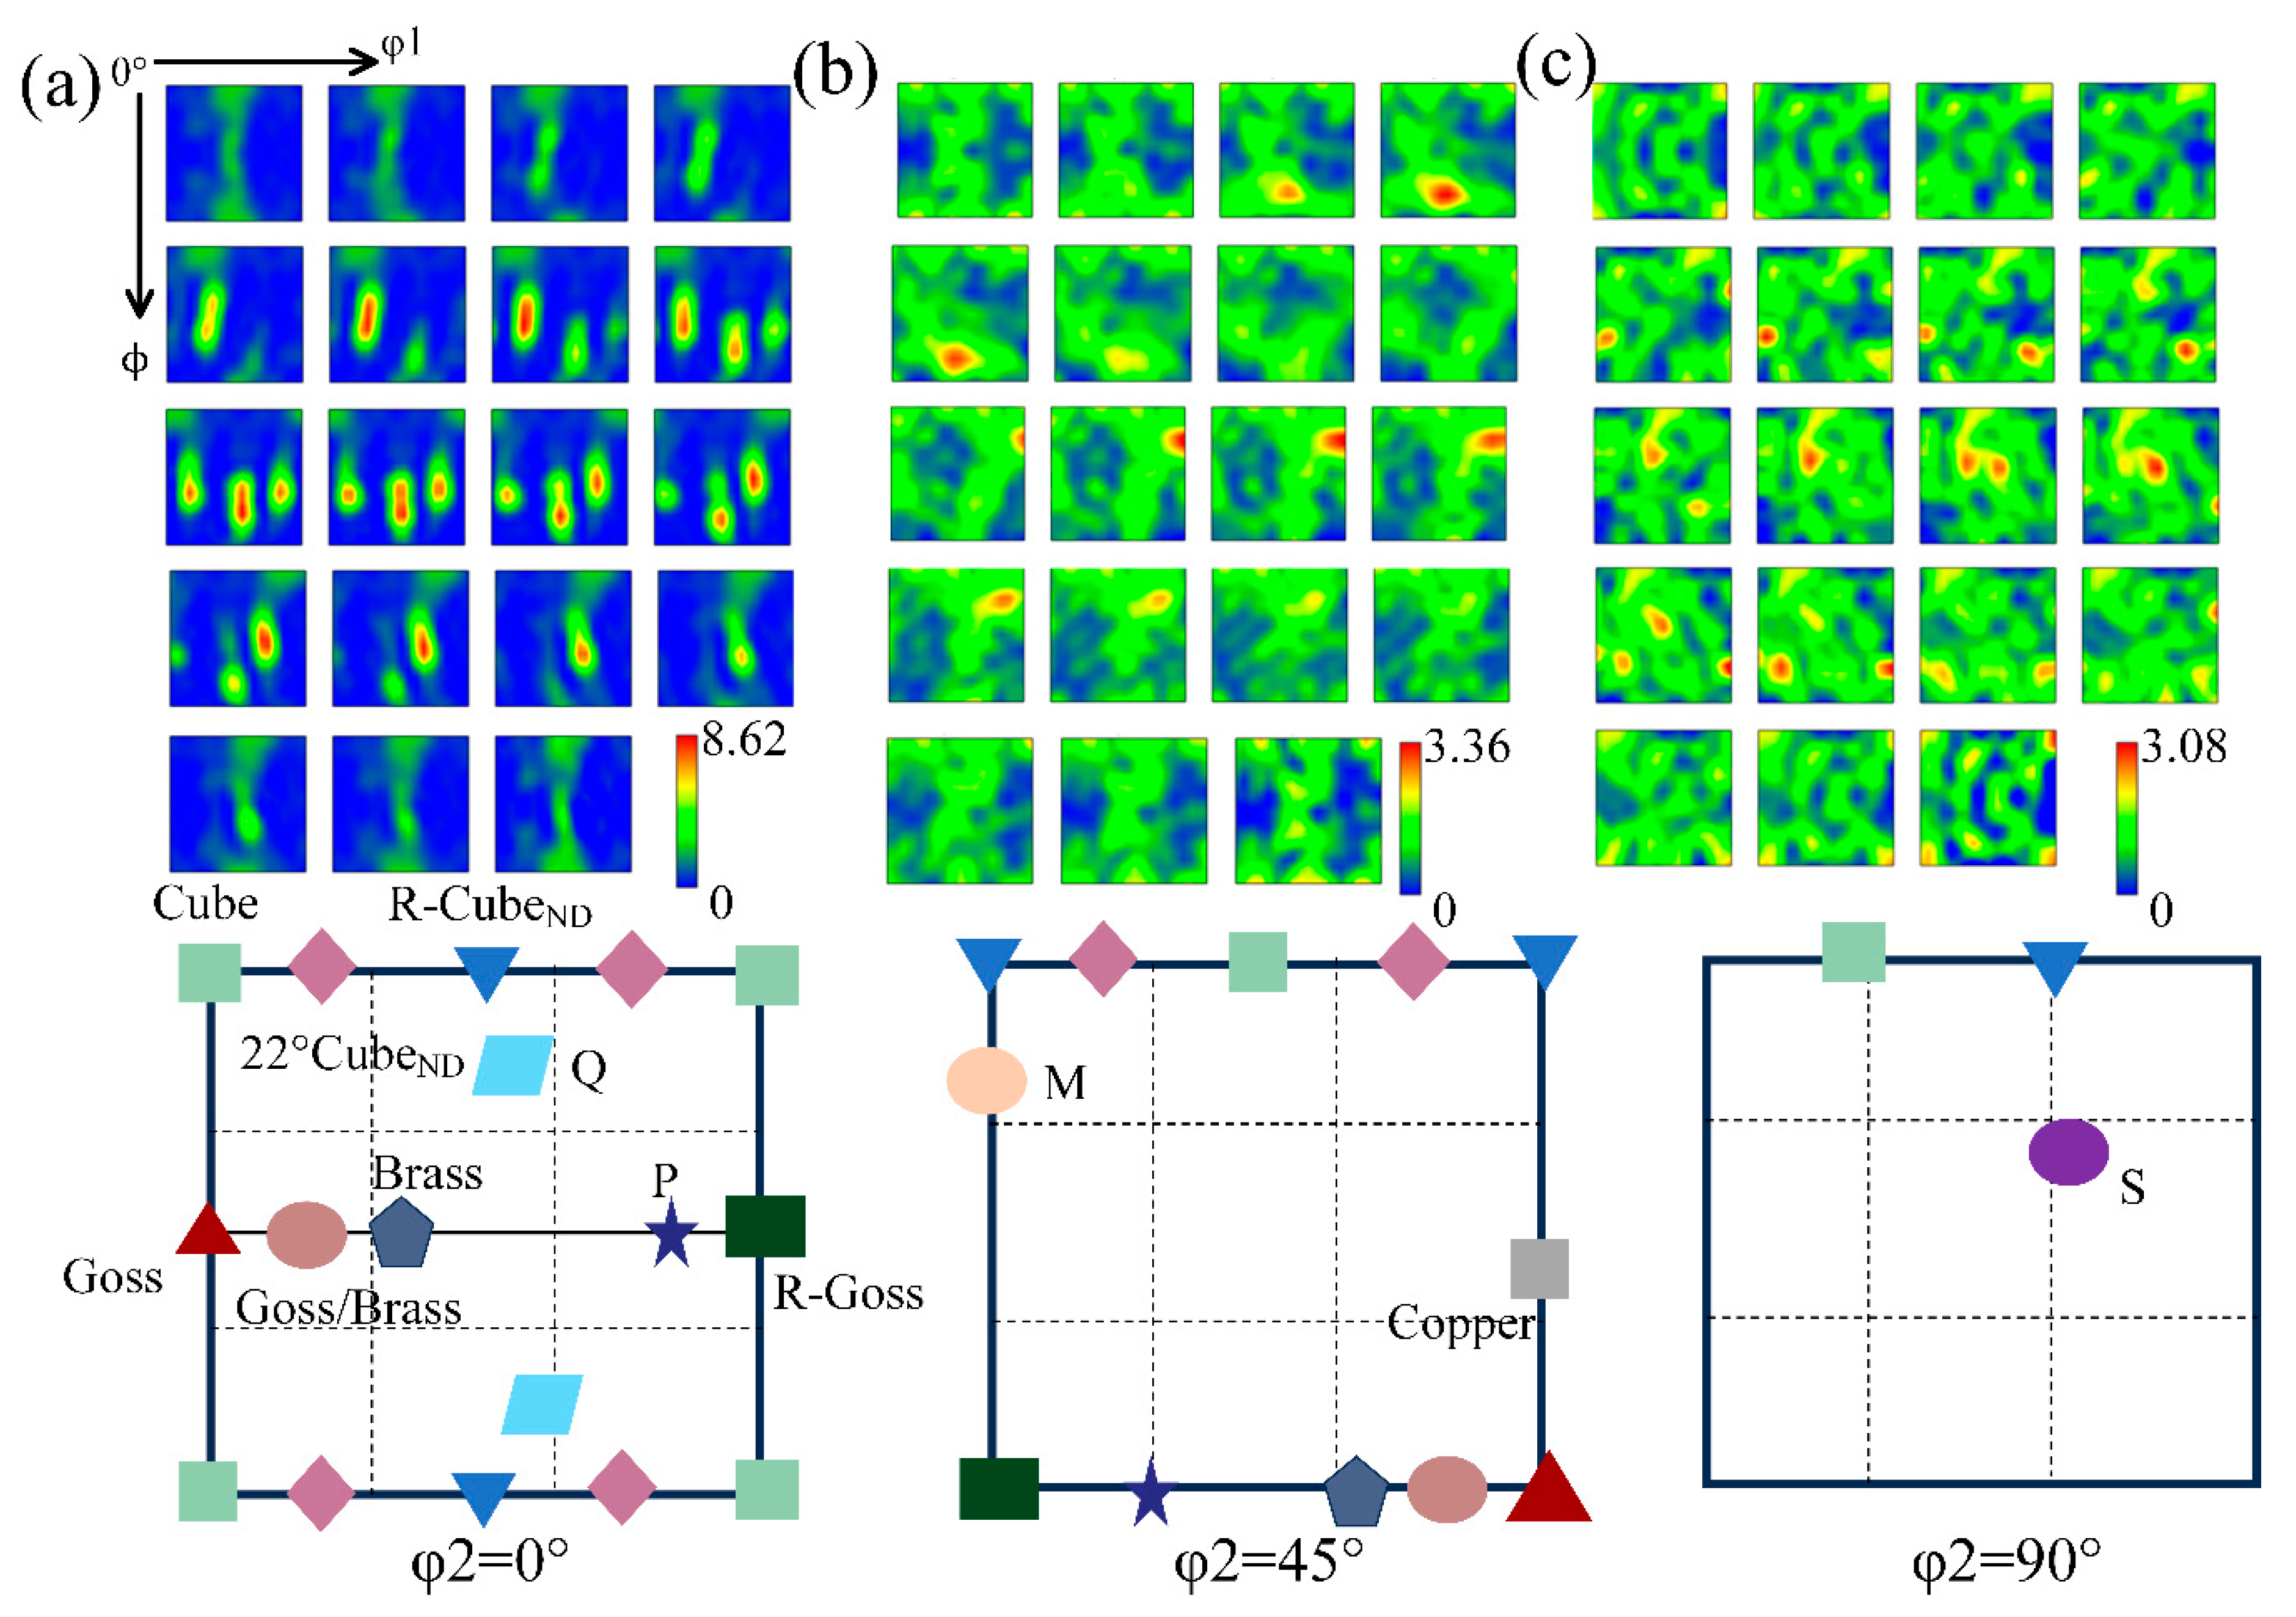
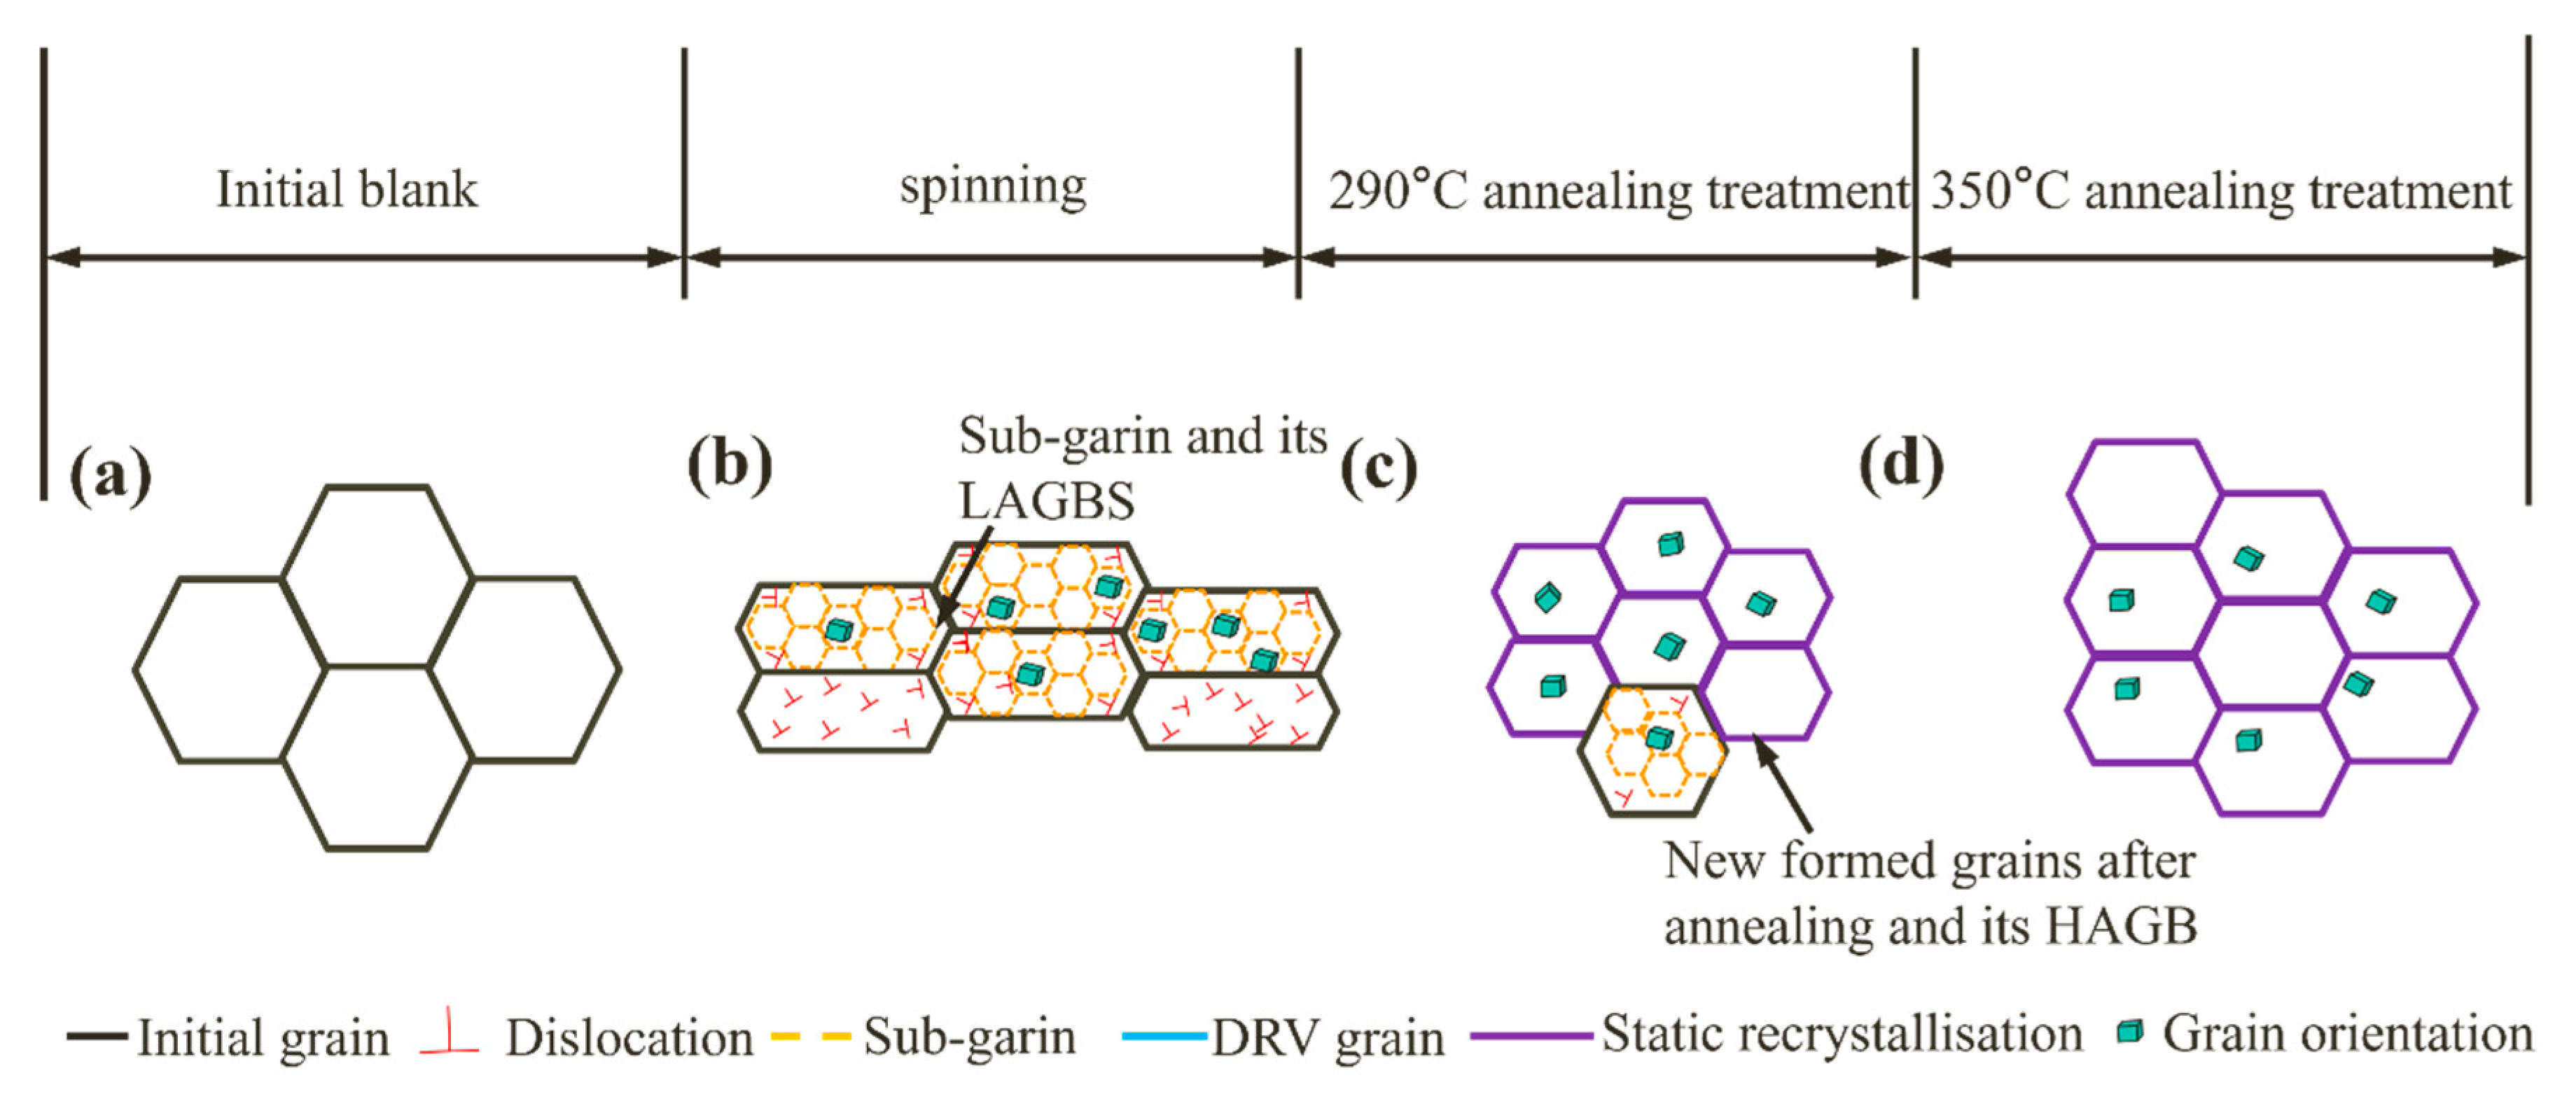
After annealing, 5A06 aluminum alloy is transformed from stronger {221}<1-22> and {111}<3-41> textures to recrystallized texture (Cube{001}<100> and R-CubeND{001}<110>). The annealing process promotes grain recrystallization, weakening the texture strengthening effect induced by plastic deformation and decreasing dislocation density. The percentage of recrystallized grains at 350 °C was 90.8%.
(3)
The EL is the first to increase and then decrease with the increase in the annealing temperature. The mechanical properties of the specimen at 290 °C annealing temperature are the best, with a yield strength and ultimate tensile strength of 106.22 MPa and 378.55 MPa, respectively, and the EL is 42.43%.
In this paper, the mechanical properties of aluminum alloys after spinning were improved by heat treatment, but the annealing time was not investigated and there are various methods to eliminate residual stresses. In the future, the various methods need to be compared to obtain the best treatment.

Author Contributions

Conceptualization, H.C., F.C. and Z.W.; Methodology, H.C.; Software, K.Y., F.C. and Z.W.; Validation, F.C. and Z.W.; Formal analysis, H.C.; Data curation, K.Y.; Writing—original draft, K.Y.; Writing—review & editing, H.C.; Visualization, K.Y.; Supervision, H.C.; Project administration, H.C. All authors have read and agreed to the published version of the manuscript.

Funding

This work was supported by the Key Research and Development project of Shanxi province of China (No. 202102150401003) and Basic research project of Shanxi province (No. 202303021211045), special funds from the central finance to support the development of local universities (No. YDZJSX2022A018).

Data Availability Statement

The original contributions presented in this study are included in the article. Further inquiries can be directed to the corresponding author.

Conflicts of Interest

The authors declare that they have no known competing financial interests or personal relationships that could have appeared to influence the work reported in this paper.

References

  1. Yang, Y.-Y.; Chen, H.-S.; Zhou, J.; Nie, H.-H.; Xu, X.; Xi, S.-X.; Chang, Y.-L. Study on interface behavior and mechanical properties of Al/Cu laminated tubes fabricated by strong staggered spinning at room temperature. J. Mater. Res. Technol. 2023, 25, 7307–7324. [Google Scholar] [CrossRef]
  2. Zhang, R.; Li, J.; Li, Q.; Qi, Y.; Zeng, Z.; Qiu, Y.; Chen, X.; Kairy, S.K.; Thomas, S.; Birbilis, N. Analysing the degree of sensitisation in 5xxx series aluminium alloys using artificial neural networks: A tool for alloy design. Corros. Sci. 2019, 150, 268–278. [Google Scholar] [CrossRef]
  3. Zheng, Z.; Ma, P.; Chen, L.; Liu, C. Microstructural Modification by Large Pre-Deformation and Post-Aging to Improve Properties in Al-Mg-Li Alloy. Metals 2025, 15, 290. [Google Scholar] [CrossRef]
  4. Gao, P.; Gong, Y.; Ren, Z.; Zhan, M. A new spinning-extrusion forming technology for the inner-ribbed component. Int. J. Mech. Sci. 2024, 279, 109494. [Google Scholar] [CrossRef]
  5. Chen, X.; Yu, Z.; Chen, W.; Wang, F.; Zhao, Y.; Lin, Z. Study on generating rolling method for manufacturing cylindrical parts with external cross ribs. J. Manuf. Process. 2024, 111, 1–20. [Google Scholar] [CrossRef]
  6. Wong, C.C.; Dean, T.A.; Lin, J. A review of spinning, shear forming and flow forming processes. Int. J. Mach. Tools Manuf. 2003, 43, 1419–1435. [Google Scholar] [CrossRef]
  7. Xia, Q.; Xiao, G.; Long, H.; Cheng, X.; Sheng, X. A review of process advancement of novel metal spinning. Int. J. Mach. Tools Manuf. 2014, 85, 100–121. [Google Scholar] [CrossRef]
  8. Zeng, X.; Fan, X.; Li, H.; Li, S. Flow forming process of thin-walled tubular parts with cross inner ribs. Procedia Manuf. 2018, 15, 1239–1246. [Google Scholar] [CrossRef]
  9. Wong, C.C.; Dean, T.A.; Lin, J. Incremental forming of solid cylindrical components using flow forming principles. J. Mater. Process. Technol. 2004, 153–154, 60–66. [Google Scholar] [CrossRef]
  10. Xia, Q.; Xiao, G.; Long, H.; Cheng, X.; Yang, B. A study of manufacturing tubes with nano/ultrafine grain structure by stagger spinning. Mater. Des. 2014, 59, 516–523. [Google Scholar] [CrossRef]
  11. Zhang, Y.; Wang, F.; Dong, J.; Jin, L.; Liu, C.; Ding, W. Grain refinement and orientation of AZ31B magnesium alloy in hot flow forming under different thickness reductions. J. Mater. Sci. Technol. 2018, 34, 1091–1102. [Google Scholar] [CrossRef]
  12. RadoviĆ, L.; NikaČEviĆ, M.; JordoviĆ, B. Deformation behaviour and microstructure evolution of AlMg6Mn alloy during shear spinning. Trans. Nonferrous Met. Soc. China 2012, 22, 991–1000. [Google Scholar] [CrossRef]
  13. Wang, X.X.; Zhan, M.; Gao, P.F.; Zhang, H.R. Micromechanical behaviour of TA15 alloy cylindrical parts processed by multi-pass flow forming. Mater. Sci. Eng. A 2018, 737, 328–335. [Google Scholar] [CrossRef]
  14. Zeng, X.; Fan, X.G.; Li, H.W.; Zhan, M.; Li, S.H.; Wu, K.Q.; Ren, T.W. Heterogeneous microstructure and mechanical property of thin-walled tubular part with cross inner ribs produced by flow forming. Mater. Sci. Eng. A 2020, 790, 139702. [Google Scholar] [CrossRef]
  15. Dahms, F.; Homberg, W. Manufacture of Defined Residual Stress Distributions in the Friction-Spinning Process: Investigations and Run-to-Run Predictive Control. Metals 2022, 12, 158. [Google Scholar] [CrossRef]
  16. Zhang, C.; Wang, Y.; Wang, M.; Li, W.; Zhang, C.; Luo, J. Relationship Between Fracture Fractal and Mechanical Properties of 5083 Aluminum Alloy Sheet Prepared by Alternate Ring-Groove Pressing and Torsion. Metals 2024, 14, 1382. [Google Scholar] [CrossRef]
  17. Yuan, T.; Wang, Y.; Du, W.; Zeng, C.; Sun, Z.; Peng, W.; Liu, Y.; Hu, H.; Zeng, Z. Influence of annealing on the interfacial structure, recrystallization behaviour, and texture evolution of hot extruded Mg/Al laminated composites. Mater. Today Commun. 2024, 40, 110132. [Google Scholar] [CrossRef]
  18. Peng, J.; Zhang, J.; Li, Z.; Chen, X.; Cui, L. Grain structure evolution, textures, and mechanical properties of cryogenic-rolled AA6061 under high-temperature short-term annealing. Mater. Today Commun. 2024, 40, 109682. [Google Scholar] [CrossRef]
  19. Du, P.; Li, C.; Gao, P.; Liu, L.; Chen, B.; Li, M.; Wang, Z. Effect of rolling method on the recrystallization behavior and recrystallization texture of Al-Mn alloy. Mater. Today Commun. 2024, 38, 108001. [Google Scholar] [CrossRef]
  20. Wang, X.X.; Liu, T.; Zhang, R.X.; Jin, H.J.; Zhao, X.N.; Wu, W.H.; Cheng, J. Texture evolution related to static recrystallization during annealing of TA15 alloy tube formed by flow forming. J. Mater. Res. Technol. 2023, 24, 5769–5781. [Google Scholar] [CrossRef]
  21. Xu, W.; Zhao, X.; Ma, H.; Shan, D.; Lin, H. Influence of roller distribution modes on spinning force during tube spinning. Int. J. Mech. Sci. 2016, 113, 10–25. [Google Scholar] [CrossRef]
  22. Zeng, X.; Fan, X.G.; Li, H.W.; Zhan, M.; Zhang, H.R.; Wu, K.Q.; Ren, T.W.; Li, S.H. Die filling mechanism in flow forming of thin-walled tubular parts with cross inner ribs. J. Manuf. Process. 2020, 58, 832–844. [Google Scholar] [CrossRef]
  23. Wang, J.; Xiao, G.; Zhang, J. A new constitutive model and hot processing map of 5A06 aluminum alloy based on high-temperature rheological behavior and higher-order gradients. Mater. Today Commun. 2023, 36, 106502. [Google Scholar] [CrossRef]
  24. Rossini, N.S.; Dassisti, M.; Benyounis, K.Y.; Olabi, A.G. Methods of measuring residual stresses in components. Mater. Des. 2012, 35, 572–588. [Google Scholar] [CrossRef]
  25. Zhang, W.; Jin, T.; Lou, W.; Li, W.; Dai, W. Mechanical Properties and Corrosion Behavior of 5A06 Alloy in Seawater. IEEE Access 2018, 6, 24952–24961. [Google Scholar] [CrossRef]
  26. Zhang, H.; Guo, C.; Li, S.; Li, B.; Nagaumi, H. Influence of cold pre-deformation on the microstructure, mechanical properties and corrosion resistance of Zn-bearing 5xxx aluminum alloy. J. Mater. Res. Technol. 2022, 16, 1202–1212. [Google Scholar] [CrossRef]
  27. Yan, S.; Yang, H.; Li, H.; Yao, X. Microstructure Evolution and Flow Localization Characteristics of 5A06 Alloy in High Strain Rate Forming Process. Procedia Eng. 2014, 81, 1198–1203. [Google Scholar] [CrossRef]
  28. Yan, S.L.; Yang, H.; Li, H.W.; Ren, G.Y. Experimental study of macro–micro dynamic behaviors of 5A0X aluminum alloys in high velocity deformation. Mater. Sci. Eng. A 2014, 598, 197–206. [Google Scholar] [CrossRef]
  29. Zuo, J.; Hou, L.; Shi, J.; Cui, H.; Zhuang, L.; Zhang, J. The mechanism of grain refinement and plasticity enhancement by an improved thermomechanical treatment of 7055 Al alloy. Mater. Sci. Eng. A 2017, 702, 42–52. [Google Scholar] [CrossRef]
  30. Ding, Y.; Gao, K.; Huang, H.; Wen, S.; Wu, X.; Nie, Z.; Guo, S.; Shao, R.; Huang, C.; Zhou, D. Nucleation and evolution of β phase and corresponding intergranular corrosion transition at 100–230 °C in 5083 alloy containing Er and Zr. Mater. Des. 2019, 174, 107778. [Google Scholar] [CrossRef]
  31. Ma, B.X.; Wang, G.J.; Guo, E.J. Effect of annealing temperature on microstructure and tensile properties of Al–Mg alloy 5A06 sheet. Mater. Sci. Technol. 2013, 29, 1044–1047. [Google Scholar] [CrossRef]
  32. Wang, X.; Guo, M.; Zhang, Y.; Xing, H.; Li, Y.; Luo, J.; Zhang, J.; Zhuang, L. The dependence of microstructure, texture evolution and mechanical properties of Al–Mg–Si–Cu alloy sheet on final cold rolling deformation. J. Alloys Compd. 2016, 657, 906–916. [Google Scholar] [CrossRef]
  33. Robson, J.D.; Henry, D.T.; Davis, B. Particle effects on recrystallization in magnesium–manganese alloys: Particle pinning. Mater. Sci. Eng. A 2011, 528, 4239–4247. [Google Scholar] [CrossRef]
  34. Engler, O.; Kong, X.W.; Yang, P. Influence of particle stimulated nucleation on the recrystallization textures in cold deformed Al-alloys Part I—Experimental observations. Scr. Mater. 1997, 37, 1665–1674. [Google Scholar] [CrossRef]
  35. Srinivas, B.; Dhal, A.; Panigrahi, S.K. A mathematical prediction model to establish the role of stacking fault energy on the cryo-deformation behavior of FCC materials at different strain levels. Int. J. Plast. 2017, 97, 159–177. [Google Scholar] [CrossRef]
  36. Li, M.H.; Ma, M.; Liu, W.C.; Yang, F.Q. Recrystallization behavior of cold-rolled Zr 702. J. Nucl. Mater. 2013, 433, 6–9. [Google Scholar] [CrossRef]
  37. Homer, E.R.; Holm, E.A.; Foiles, S.M.; Olmsted, D.L. Trends in Grain Boundary Mobility: Survey of Motion Mechanisms. JOM 2013, 66, 114–120. [Google Scholar] [CrossRef]
  38. Wright, S.I.; Nowell, M.M.; Field, D.P. A review of strain analysis using electron backscatter diffraction. Microsc. Microanal. 2011, 17, 316–329. [Google Scholar] [CrossRef]
  39. Lu, X.; Dunne, F.P.E.; Xu, Y. A crystal plasticity investigation of slip system interaction, GND density and stored energy in non-proportional fatigue in Nickel-based superalloy. Int. J. Fatigue 2020, 139, 105782. [Google Scholar] [CrossRef]
  40. Wu, C.; Ma, K.; Zhang, D.; Wu, J.; Xiong, S.; Luo, G.; Zhang, J.; Chen, F.; Shen, Q.; Zhang, L.; et al. Precipitation phenomena in Al-Zn-Mg alloy matrix composites reinforced with B4C particles. Sci. Rep. 2017, 7, 9589. [Google Scholar] [CrossRef]
  41. Hielscher, R. Kernel density estimation on the rotation group and its application to crystallographic texture analysis. J. Multivar. Anal. 2013, 119, 119–143. [Google Scholar] [CrossRef]
  42. Zhou, Y.L.; Yang, Y.; Tan, Y.B.; Xiang, S.; Ma, M.; Zhao, F.; Yang, M. Recrystallization behavior and texture evolution during annealing of cryogenic-rolled 3003 aluminum alloy. J. Alloys Compd. 2024, 997, 174818. [Google Scholar] [CrossRef]
  43. Chen, Y.D.; Dan, C.Y.; Chen, C.; Chen, C.X.; Jin, L.; Wang, H.W.; Chen, Z. Quasi in situ investigation on the influence of particle stimulate nucleation on recrystallization textures in TiB2 particles reinforced Al-3wt%Mg composites. J. Mater. Sci. 2023, 58, 9337–9348. [Google Scholar] [CrossRef]
  44. Fu, Y.-B.; Lu, Y.-P.; Wang, Z.-J.; Cao, Z.-Q.; Xu, A.-J. Microstructural refinement and performance improvement of Cu–36 wt% Zn alloy by Al2O3 nanoparticles coupling electromagnetic stirring. Rare Met. 2016, 41, 3560–3565. [Google Scholar] [CrossRef]
  45. Du, Y.J.; Xu, S.M.; Wang, F.; Li, J.L.; Wen, G.D.; Xiong, J.T.; Guo, W. Simultaneously enhancing strength–ductility synergy in refractory high entropy alloys by a heterogeneous structure design. J. Alloys Compd. 2024, 993, 174550. [Google Scholar] [CrossRef]
  46. Liu, D.H.; Yu, H.P.; Li, C.F. Comparative study of the microstructure of 5052 aluminum alloy sheets under quasi-static and high-velocity tension. Mater. Sci. Eng. A 2012, 551, 280–287. [Google Scholar] [CrossRef]
  47. Li, C.; Liu, D.; Yu, H.; Ji, Z. Research on formability of 5052 aluminum alloy sheet in a quasi-static–dynamic tensile process. Int. J. Mach. Tools Manuf. 2009, 49, 117–124. [Google Scholar] [CrossRef]
Figure 1. Spinning simulation and assembly diagram: (a) initial blank and geometric schematic; (b) schematic diagram of a rotary press and flap-splitting mandrels; (c) tube with a cross inner rib after spinning.
Metals 15 00441 g001
Figure 2. Sampling location: (a) staggered spinning schematic; (b) sampling position; (c) transversal inner rib observation surface; (d) tensile specimen geometry; (e) macroscopic morphology of tensile specimen.
Metals 15 00441 g002
Figure 3. Residual stress at different annealing temperatures.
Metals 15 00441 g003
Figure 4. SEM images at different annealing temperatures: (a) RT, (b) 290 °C, (c) 320 °C, and (d) 350 °C.
Metals 15 00441 g004
Figure 5. EDS spectrum: (a) RT and (b) 350 °C.
Metals 15 00441 g005
Figure 6. IPF maps of TIR region at different annealing temperatures: (a) RT, (b) 290 °C, and (c) 350 °C.
Metals 15 00441 g006
Figure 7. RF maps of TIR region at different annealing temperatures: (a) RT, (b) 290 °C, (c) 350 °C, and (d) frequency of recrystallized, deformed, and substructure microstructures.
Metals 15 00441 g007
Figure 8. KAM maps of TIR region at different annealing temperatures: (a) RT, (b) 290 °C, and (c) 350 °C.
Metals 15 00441 g008
Figure 9. Orientation distribution functions (ODF) of different annealing temperatures: (a) RT, (b) 290 °C, and (c) 350 °C.
Metals 15 00441 g009
Figure 10. Schematic diagram of grain refinement and growth during annealing after spinning: (a) initial grains; (b) after spinning forming; (c) grain recrystallization at 290 °C; (d) grain recrystallization at 350 °C.
Metals 15 00441 g010
Figure 11. Mechanical properties at different annealing temperatures: (a) stress–strain curve; (b) YS, UTS, and EL.
Metals 15 00441 g011
Figure 12. Fracture morphology at different annealing temperatures: (a) RT, (b) 290 °C, (c) 320 °C, and (d) 350 °C.
Metals 15 00441 g012
Table 1. Chemical composition of 5A06 alloy.
MaterialChemical Composition (wt%)
5A06 alloy SiFeCuMnMgTiAl
0.020.140.010.616.30.04Bal.
Table 2. Spinning process parameters.
Forming ParametersValues
Roller disk misalignment (mm)4
Diameter of the roller (mm)200
Radius of roller rounding (mm)5
Mandrel rotation speed/(r/mm)300
Feed speed/(mm/min)100
Reduction rate (%)50
Exit angle of the roller (°)25
Table 3. Angles and Miller indices of typical texture components in aluminum alloys.
ComponentEuler Angles (φ1, φ, φ2)Miller Indices
Brass(35, 45, 0){110}<112>
Goss(0, 45, 0){110}<001>
Brass/Goss(74, 90, 45){110}<115>
R-Goss(90, 45, 0){110}<110>
Cube(0, 0, 0){001}<100>
22.5 °CubeND(22.5, 0, 0){001}<210>
R-CubeND(45, 0, 0){001}<110>
Q(58, 18, 0){013}<231>
P(65, 45, 0){011}<566>
M(0, 25, 45){113}<110>
Copper(90, 35, 45){112}<111>
S(59, 37, 63){123}<634>
Disclaimer/Publisher’s Note: The statements, opinions and data contained in all publications are solely those of the individual author(s) and contributor(s) and not of MDPI and/or the editor(s). MDPI and/or the editor(s) disclaim responsibility for any injury to people or property resulting from any ideas, methods, instructions or products referred to in the content.

