Article

A Temperature Field Simulation of the Pressure Quenching Process of 18Cr2Ni2MoVNbA Gears

1
School of Mechanical Engineering and Mechanics, Xiangtan University, Xiangtan 411105, China
2
JiangLu Machinery Electronics Group Co., Ltd., Xiangtan 411105, China
*
Authors to whom correspondence should be addressed.
Metals 2025, 15(4), 443; https://doi.org/10.3390/met15040443
Submission received: 16 January 2025 / Revised: 17 March 2025 / Accepted: 1 April 2025 / Published: 16 April 2025

Abstract

:
In this paper, gears made of 18Cr2Ni2MoVNbA steel were taken as the research object, and their cooling curves under different flow rate conditions were determined. By calculating the corresponding heat transfer coefficients, a finite element simulation method was used to study the temperature field distribution law of different flow rate combinations on the gears in the cooling process of pressure quenching. The results show that among the four representative flow combinations, the working condition 1 (A + (A − b − c) + (A − b − c)) has the smallest temperature difference between the inner and outer gears, and can better reduce the temperature difference between the inner and outer parts. Furthermore, in the pressure quenching process of gears, the appropriate extension of the quenching time can keep the quenched gear with a lower average temperature, while promoting the martensitic transformation on the surface of the workpiece. Comparing the simulation results with the experimental data, the reliability of the pressure-quenching temperature field model is verified, which can provide theoretical guidance for the optimization of the pressure quenching process.

1. Introduction

The 18Cr2Ni2MoVNbA steel that has undergone a quenching and low-temperature tempering [1] treatment maintains a good workpiece toughness and hardness while enhancing the surface hardness [2,3,4,5,6]. As a result, the material has a good impact resistance, load-bearing strength and mechanical properties [7]. However, the steel generally produces a large deformation after heat treatment, which leads to a large amount of subsequent machining workload, reduced gear performance, and may even directly lead to scrapping [8]. In order to alleviate the problem of excessive workpiece distortion during the quenching process of heat treatment, the pressure quenching method is commonly employed for thin-walled gears, bevel gears, and other components. This method can effectively control the material deformation during the heat treatment process.
Currently, the pressure hardening machine commonly used in factories is the Gleason NO.537 pressure quenching machine with some matching parts. In the process of developing new materials for gears or new product configurations, the traditional method of relying on empirical methods for repeated machining adjustments is still used. However, this method is not only time consuming and labor intensive, but also fails to meet the demanding requirements of high-precision machining and production. With the further development of computer numerical simulation technology [9,10,11,12,13], it is possible to realize the simulate and analysis of the temperature, phase transition, and stress changes in the heat treatment process, which not only reduces energy consumption, but also optimizes the organizational structure and machining process of gears and other products [14,15,16,17]. Therefore, this paper simulates the temperature field of 18Cr2Ni2MoVNbA steel gears during the pressure quenching process under different oil flow combinations to derive the optimal oil flow combinations, so as to optimize the pressure quenching process of the gears, and ultimately to achieve the purpose of improving the production efficiency and reducing the production cost.

2. Materials and Methods

2.1. Simulation Program

The cooling process of gear workpieces during pressure quenching is influenced by multiple factors such as the pulse frequency, pulse pressure, and cooling medium. In the case of quenching medium determination, the temperature difference between the interior and exterior of the workpiece as well as the distribution of thermal stresses will also be affected by the difference in oil flow rates, which will not be able to control the deformation of the pressure quenching of gears and other products. Therefore, for the pressure quenching of gears and other parts, it is of a great importance to study the effect of different oil flow rates on the pressure-quenching temperature field under the same pulse frequency and pulse pressure.
In actual production, even if the type of quenching oil and pressure are determined, there are different oil flow rates in the quenching stage of the Gleason NO.537 quenching press (Gleason Corporation, Rochester, NY, USA). In addition, the pressure quenching stage is divided into three stages, which results in hundreds of possible flow rate combinations overall. It would be a relatively large amount of work to test, calculate, and experiment with the flow combinations one by one, so three stages of the same flow rate are used to calculate the heat transfer coefficients for the various single flow rates,, and then the heat transfer coefficients for the three different flow rates are used to replace the various combinations of flow rates for the pressure quenching.
Based on the factory’s existing actual experience, four representative flow rate combinations are selected for research on the influence of the temperature field distribution in the gear parts, and the specific processes, as shown in Table 1. A, C, A-B-C, B-C, and A-B represent the oil flow level, respectively; the magnitude of the flow rate of the oil is the following: A < A-B < C < B-C < A-B-C. The initial stage of working condition 1 adopts slow-flow oil (A), and then fast-flow oil (A-B-C) is used in the second and third stages. The purpose of using slow-flow oil is due to the fact that in the initial stage (at the beginning of the pressure quenching), within the temperature range of 25 °C to 800 °C, gears are more affected by pressure at around 800 °C than at room temperature (25 °C), thus causing deformation. The use of fast-flow oil in the second and third stages is intended to achieve the required hardness and microstructure by accelerating the transformation of martensite. Since the initial stage of gear deformation has been essentially completed, the second and third stages can be executed at a high oil flow rate, thereby increasing productivity. To establish a contrast with working condition 1, the initial stage of working condition 2 is designed to use fast-flowing oil (A-B-C) and the second and third phases to use slow-flowing oil (A). Similarly, the design of working condition 3 is based on the actual production experience of the factory: specifically a fast-flow oil (A-B-C) condition for the initial stage, slow-flow oil (A) for the second stage, and fast-flow oil (A-B-C) for the third stage. The purpose of using fast-flow oil in the first stage is to make the pressure-quenched parts cool quickly to ensure the quenching hardness. The second stage of the use of slow-flow oil is to reduce the temperature to close to the martensitic transition point of the material. At this time, the microstructural stress is reduced, and it is easier to correct the distortion of the parts. In the third stage, the microstructural transformation is basically complete, and the external dimensions are basically stereotyped, so the use of the fast oil flow condition is conducive to the further release of thermal stress, so as to achieve the effect of controlling the distortion. Working condition 4 is a combination of processes used in the actual production of the factory.

2.2. Mathematical Modeling

2.2.1. Governing Equations

In calculating the temperature field using finite element simulations, the governing equation for heat conduction in solids is the Fourier heat conduction equation. By establishing the initial and boundary conditions, the outcomes of thermal conduction inside the workpiece can be calculated. The governing equations for the temperature field are typically classified into two cases:
(a) When the workpiece is in a steady-state condition, the heat flow is positively correlated with the temperature difference and surface area in the direction of the perpendicular heat flow. Then, the temperature field control equation is as follows:
q x = λ T x
The Eq is the heat flow rate per unit surface area in the x direction and is the thermal conductivity (W/(m·°C)).
(b) When the workpiece is in a non-stationary state, the workpiece changes with temperature, considering that it has an internal heat source, the temperature control equation is as follows:
λ 2 T x 2 + 2 T y 2 + 2 T z 2 + q = ρ C p T t
The Eq is the latent heat of the phase transition (W/m2), the density (kg/m3), and is the constant-pressure specific heat capacity (J/(kg·°C)).

2.2.2. Initial Conditions

The initial conditions, which act as the initial values for the temperature field calculations, need to be taken into account in two different cases:
(a) When the temperature field of the initial condition is uniform, such as the forging that is heated from the greenhouse loading furnace, or heated to a given temperature and held for a long period of time, so that the interior of the workpiece is heated uniformly. Hence, the initial condition of the temperature at this point is the following:
T | t = 0 = T 0 ,
(b) When the temperature field of the initial condition is non uniform, but the value of the temperature at each point of the workpiece is known, the initial condition of the temperature is the following:
T | t = 0 = T 0 ( z , r ) ,
The Eq is the known temperature, and is the known temperature function.

2.2.3. Boundary Conditions

Boundary conditions as a part of the surface of the heat exchange between a surface and its surroundings can generally be categorized into three situations:
(a) When the temperature or temperature function on the boundary of the workpiece is known, which is the first type of boundary condition, the equation is expressed as follows:
T | s = T w   or ,   T | s = T w ( z , r , t )
In the Eq, s is the boundary range of the workpiece and is the surface temperature of the workpiece (°C) and is the temperature function of the surface of the workpiece with respect to time and position.
(b) When the heat density () on the surface of the workpiece is known, that is, the second type of boundary condition, then the equation is expressed as follows:
λ T n s | s = q w   or , λ T n | s = q w ( z , r , t )
In the Eq, n is normal outside the boundary, is the heat flow density on the surface of the workpiece, and is the heat flow density function on the surface of the workpiece as a function of time and position.
(c) When the convective heat transfer coefficient between the workpiece and the contact fluid medium and the temperature of the fluid medium () are known, it is the third type of boundary condition, which is expressed by the following:
λ T n | s = H ( T w T c ) ,
In the Eq, H is the total heat transfer coefficient (W/(m °C)), and is the medium temperature (°C). Among them, the surface heat transfer coefficient directly affects the distribution of the temperature field of the gear in the pressure quenching and cooling process, which is related to the workpiece material, shape, size, and medium, and medium flow rate.

2.3. Determination of Material Parameters

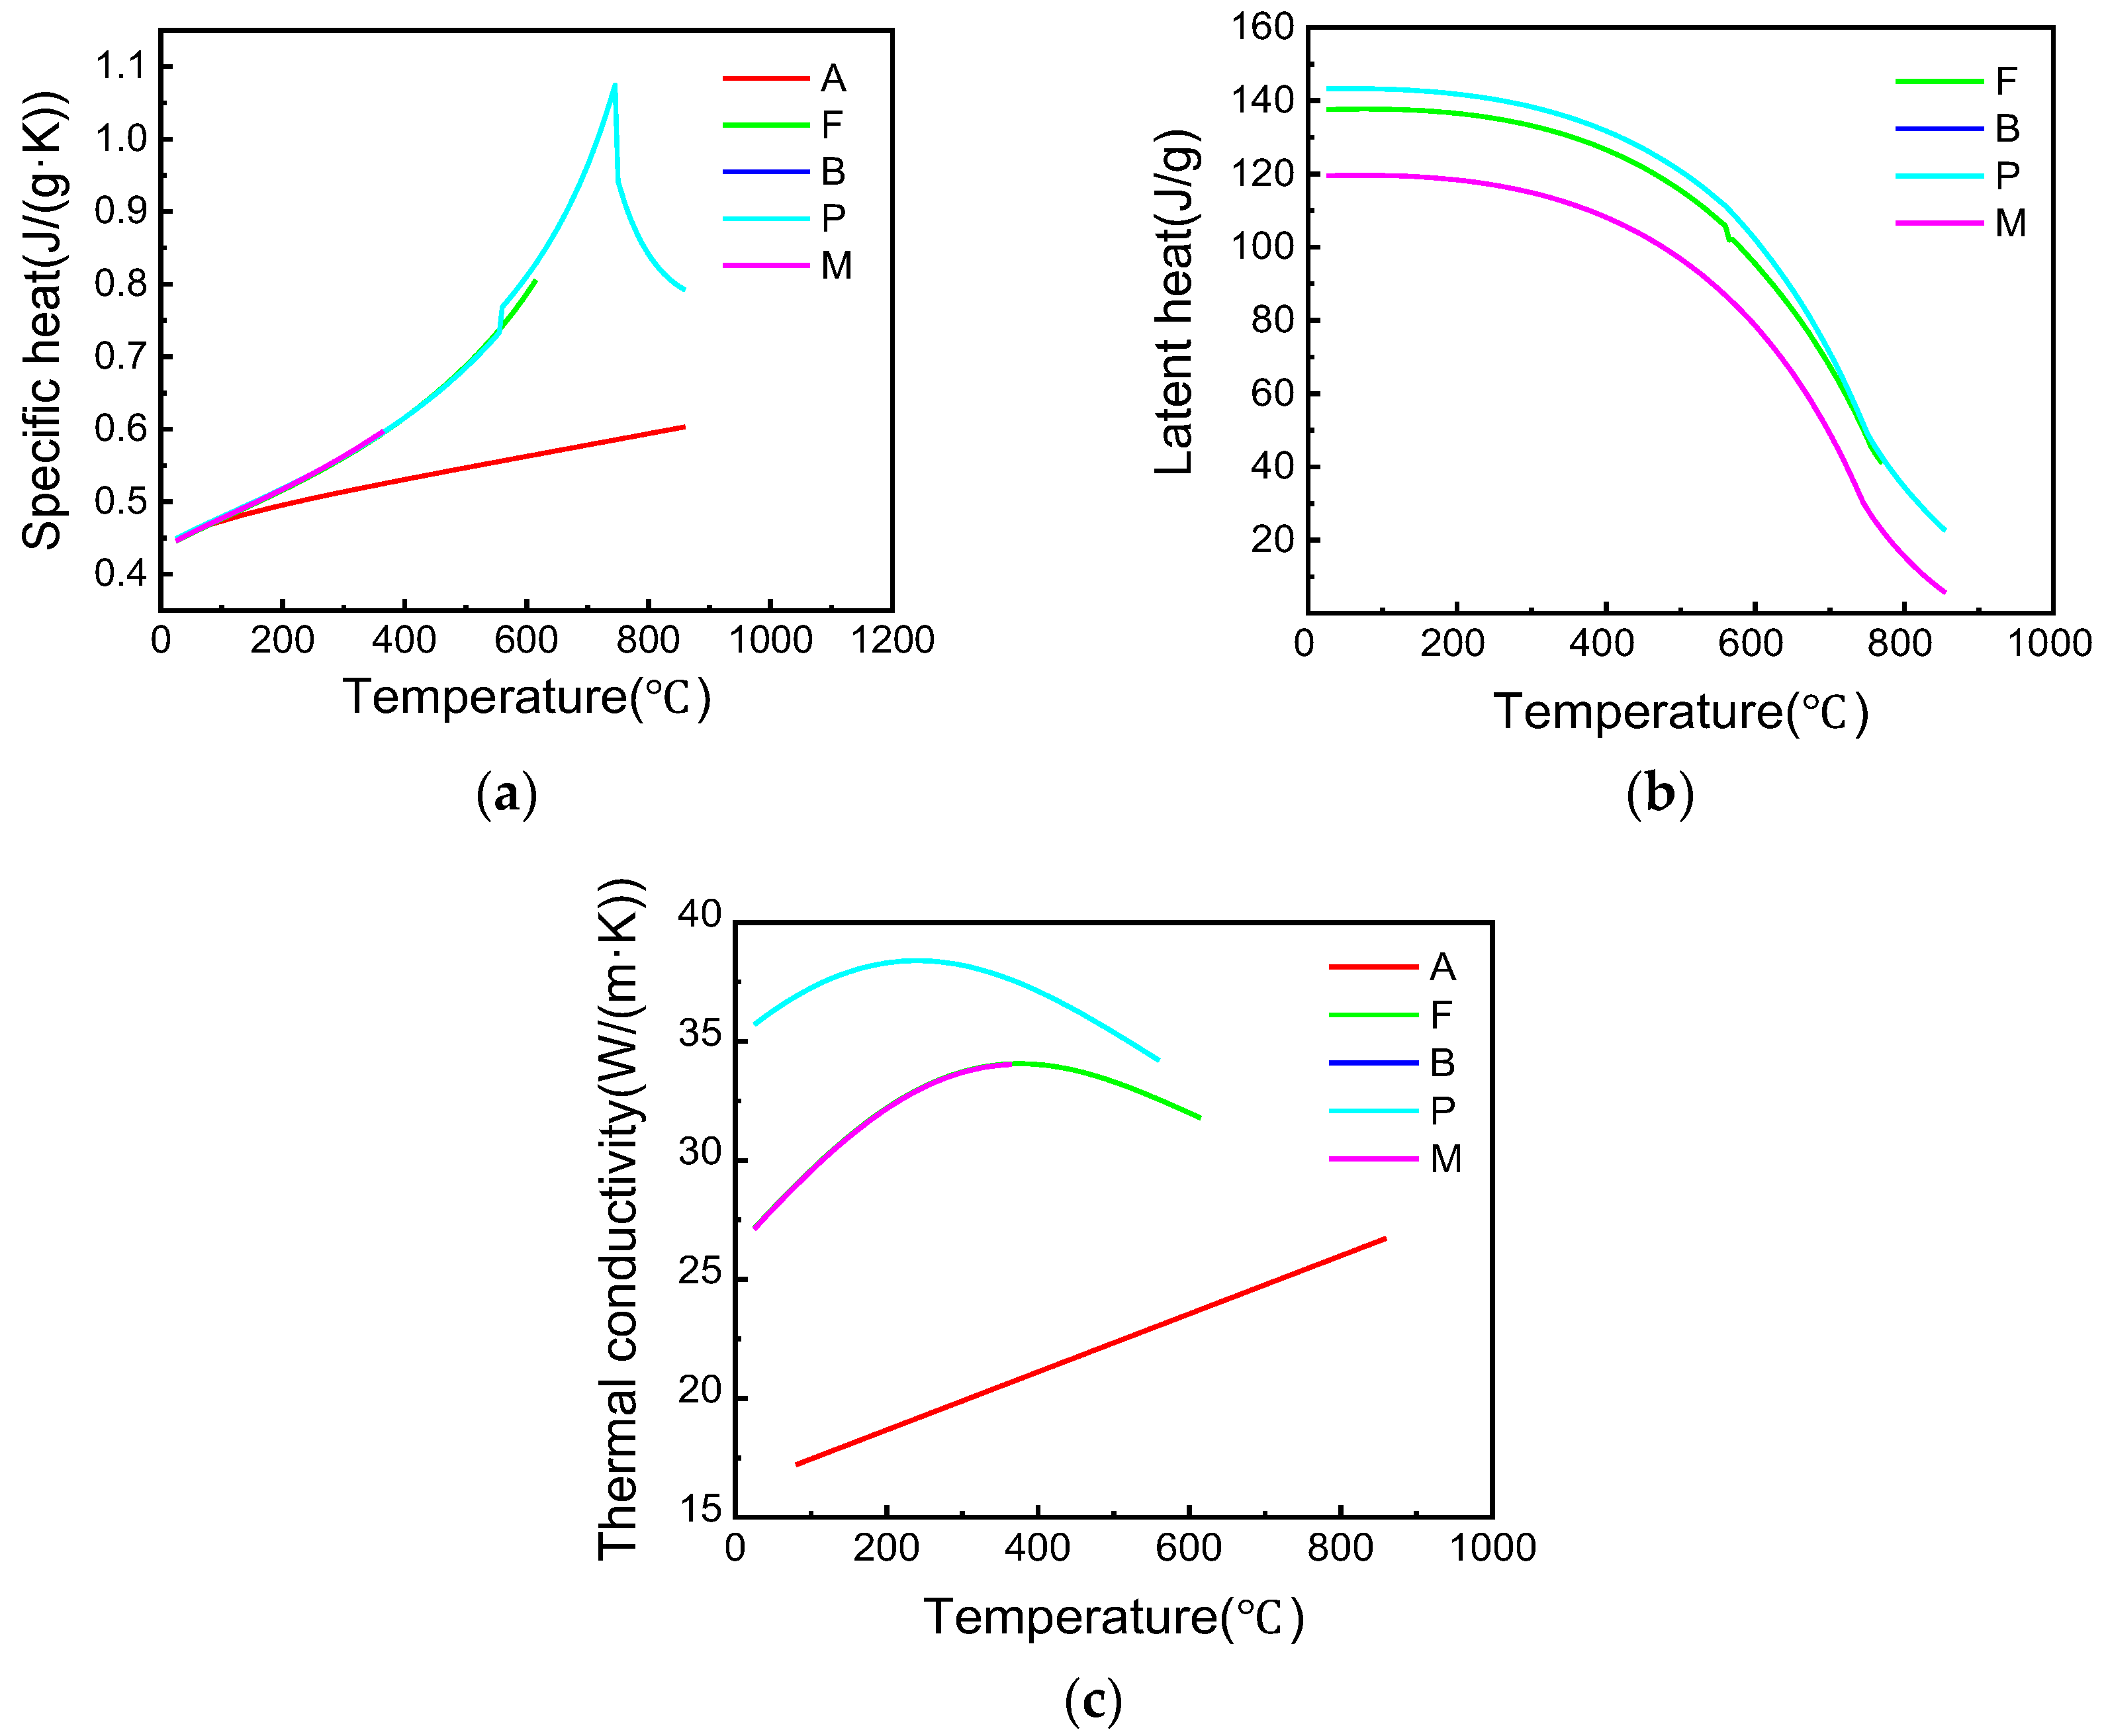
2.3.1. Determination of the Rmophysical Parameters

A certain amount of samples were extracted from the powder samples and analyzed for chemical composition using the spark8000 direct reading spectrometer (NAKAR Testing Technology Co., Ltd., Beijing, China). The chemical composition of one piece of 18Cr2Ni2MoVNbA steel was obtained, as shown in Table 2. Before the finite element modeling calculation, the measured chemical composition parameters were substituted into the thermodynamic software JMatPro7.0 to calculate and determine the physical properties of the material, such as the specific heat, thermal conductivity, and latent heat of the phase change. As shown in Figure 1, A represents austenite, F represents ferrite, B represents bainite, and M represents martensite. Meanwhile, tests were conducted on the gleeble-3500 thermal simulator, and finally the Ms of 18Cr2Ni2MoVNbA steel was determined to be 395 °C and the Mf to be 235 °C.

2.3.2. Determination of the Heat Transfer Coefficient for Different Oil Flow Rates

During the pressure quenching and cooling process, the gears are in a complex hermetically sealed oil-pressurized environment that is both pressurized and cooled by the oil. The operating principle of the Gleason NO.537 quenching press is shown in Figure 2a. Due to the gears being tightly fitted to the mandrel and outer compression ring during the gear pressure quenching process, it is not feasible to insert a thermocouple for temperature measurement. Additionally, the shape of the mandrel has little impact on the cooling rate. Therefore, in this study, the cooling curves are measured using a loose piece mandrel and a circular profile test block, as shown in Figure 2b. Subsequently, the heat transfer coefficients at different flow rates are determined using reverse heat transfer. Finally, the actual temperature profiles measured at the surface and heart position of the pressure quenched gears were compared with the simulated values. This comparison was used to verify the accuracy of the temperature simulation calculations.
In order to measure the oil flow under different flow rates, the workpiece was placed in the heating furnace and heated to 800 °C for 30 min. After that, the workpiece was quickly placed into the pressure bed (by manually using fixtures, the entire process was less than 20 s). Rapid quenching was carried out at different oil flow rates levels of A, A-b, C, B-C, and A-B-C, respectively. The temperature data during the cooling process were collected and recorded using a temperature collector, and the cooling curve of the near surface of the ring was measured as shown in Figure 3a. Finally, by inverse heat transfer calculations based on the collected processing temperature data, the interfacial heat transfer coefficient of the workpiece during pressure quenching with varying oil flow rates could be determined [18], as depicted in Figure 3b. It is shown that the heat transfer coefficients corresponding to the five different oil flow rates all show a trend of increasing and then decreasing with the increase of temperature, and the larger the oil flow rate, the larger the maximum value of the heat transfer coefficient.

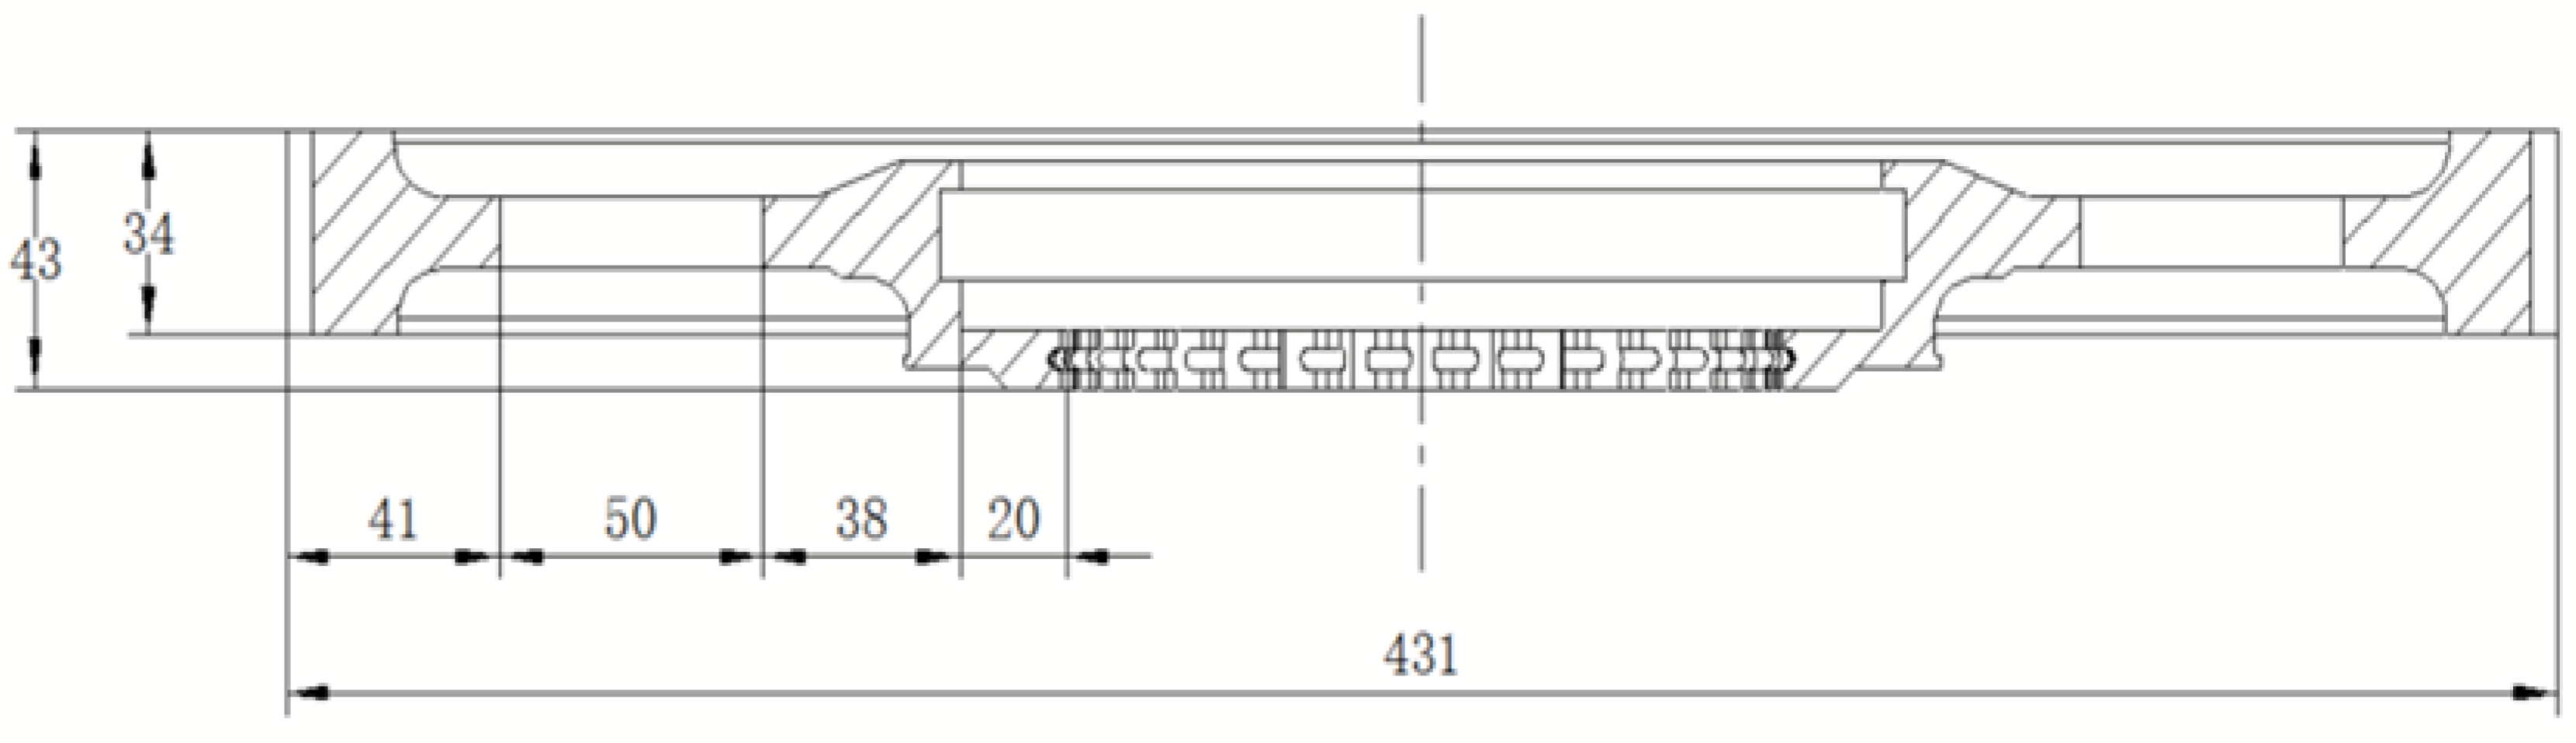
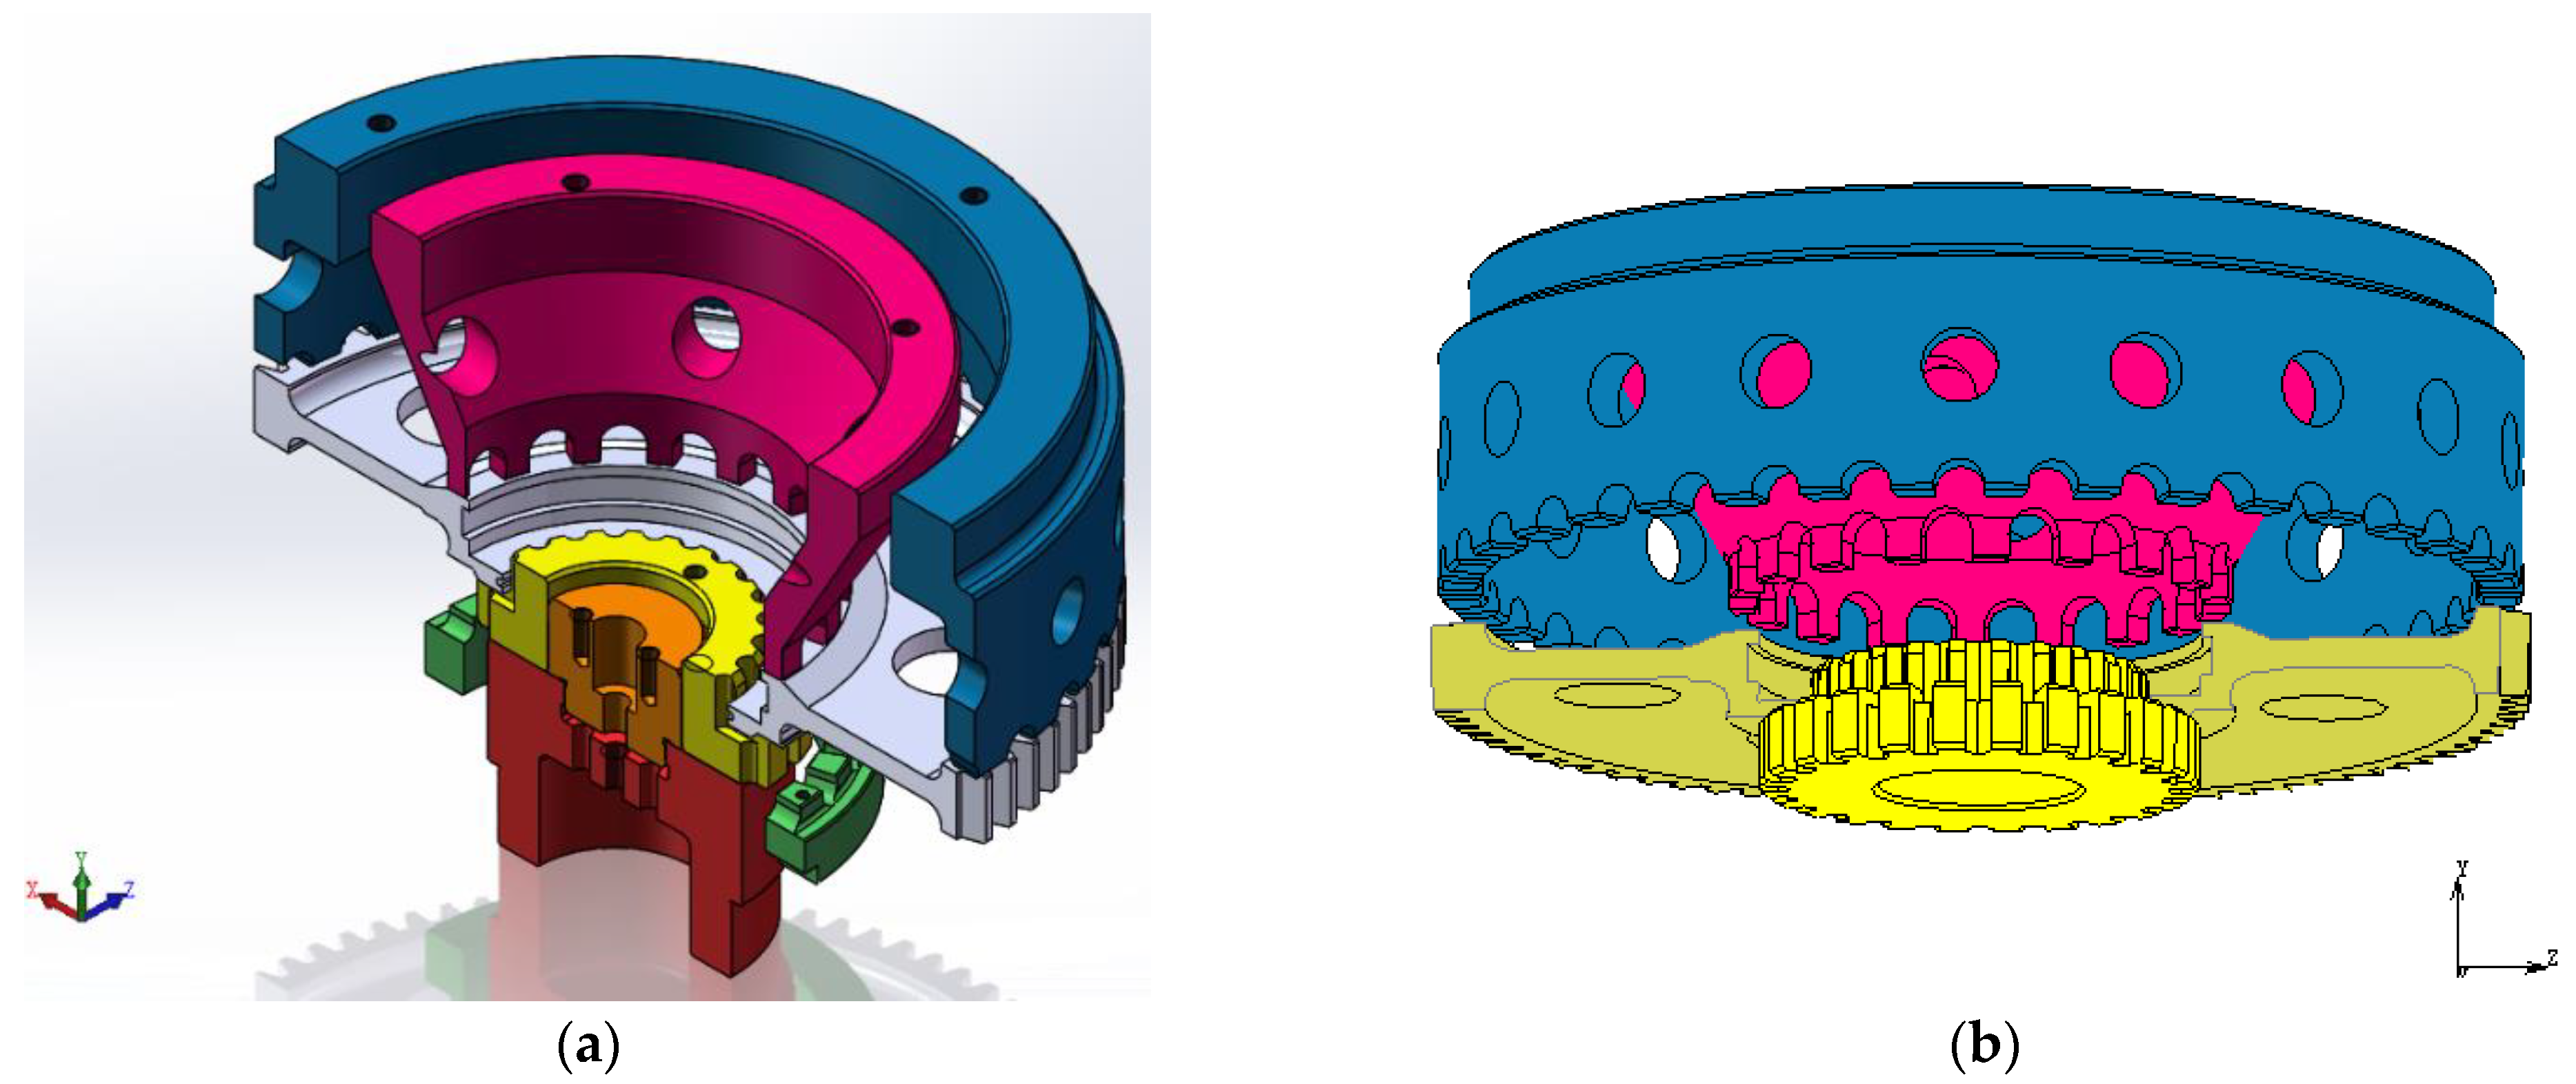
2.4. Finite Element Modeling
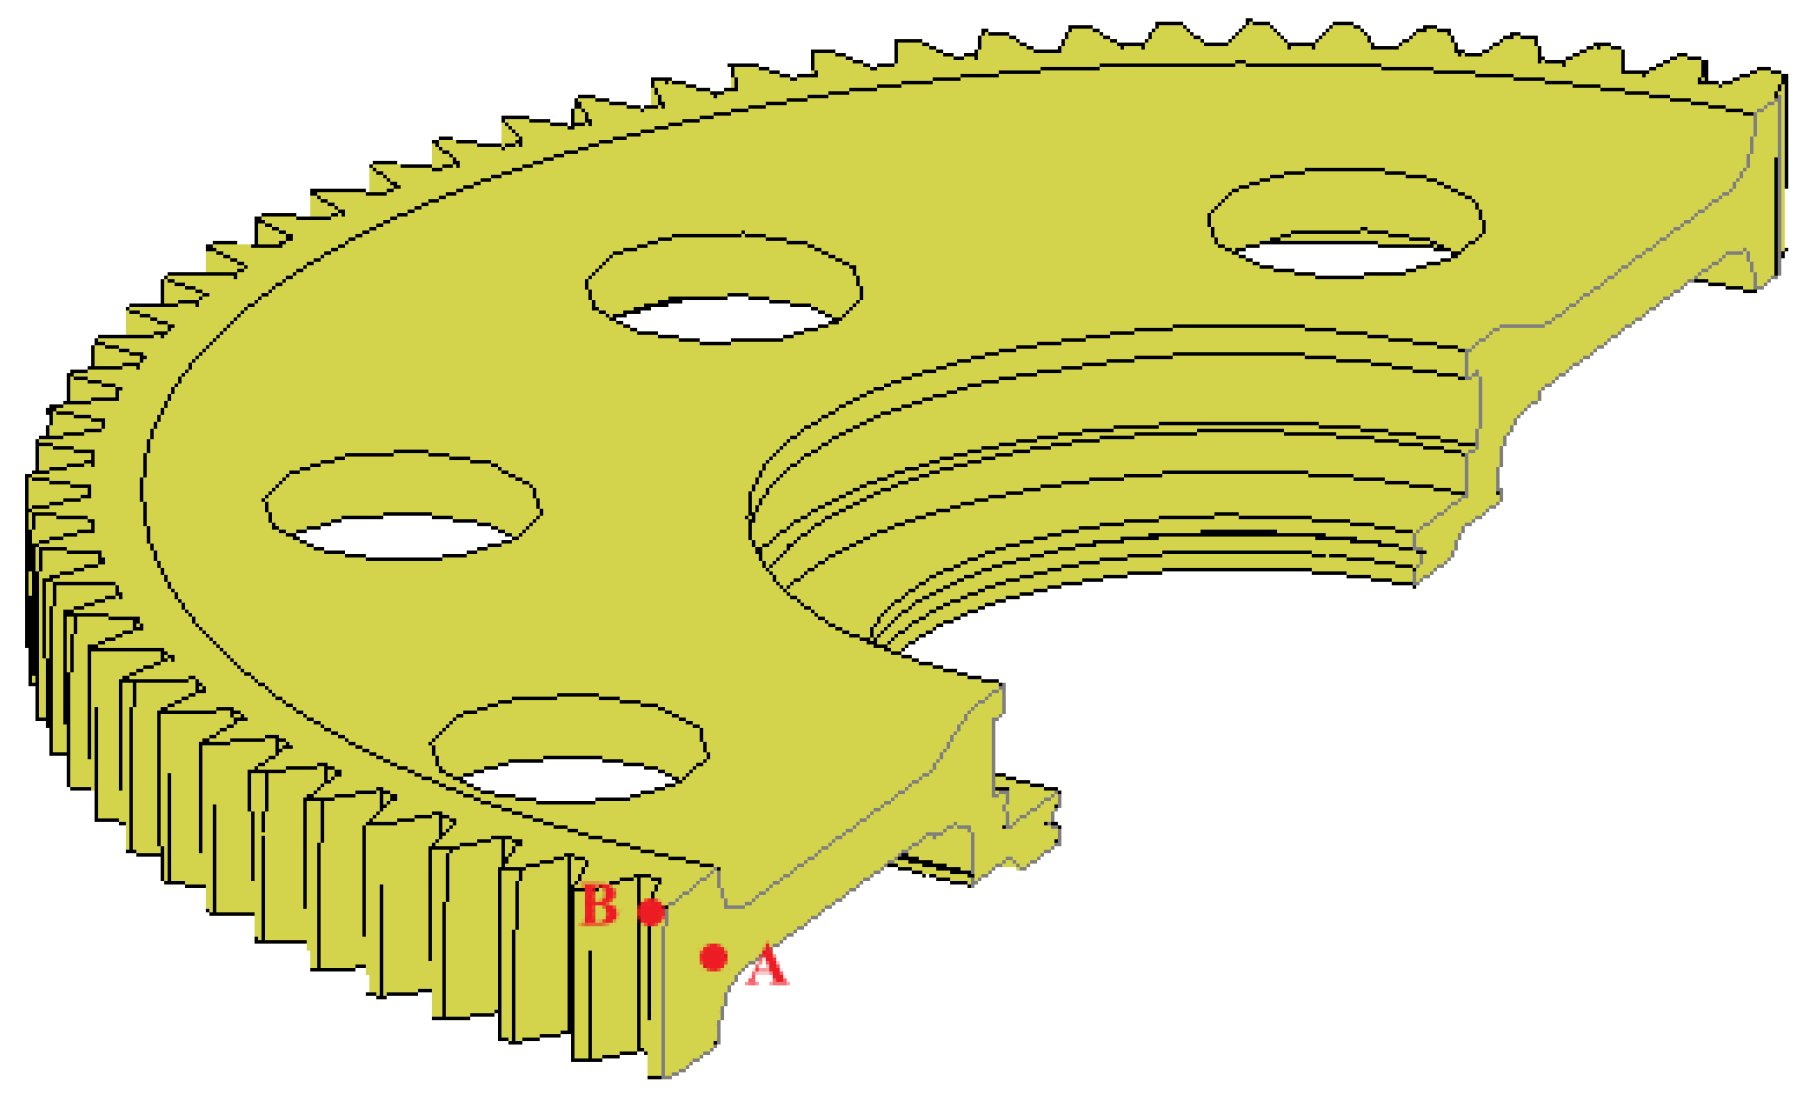
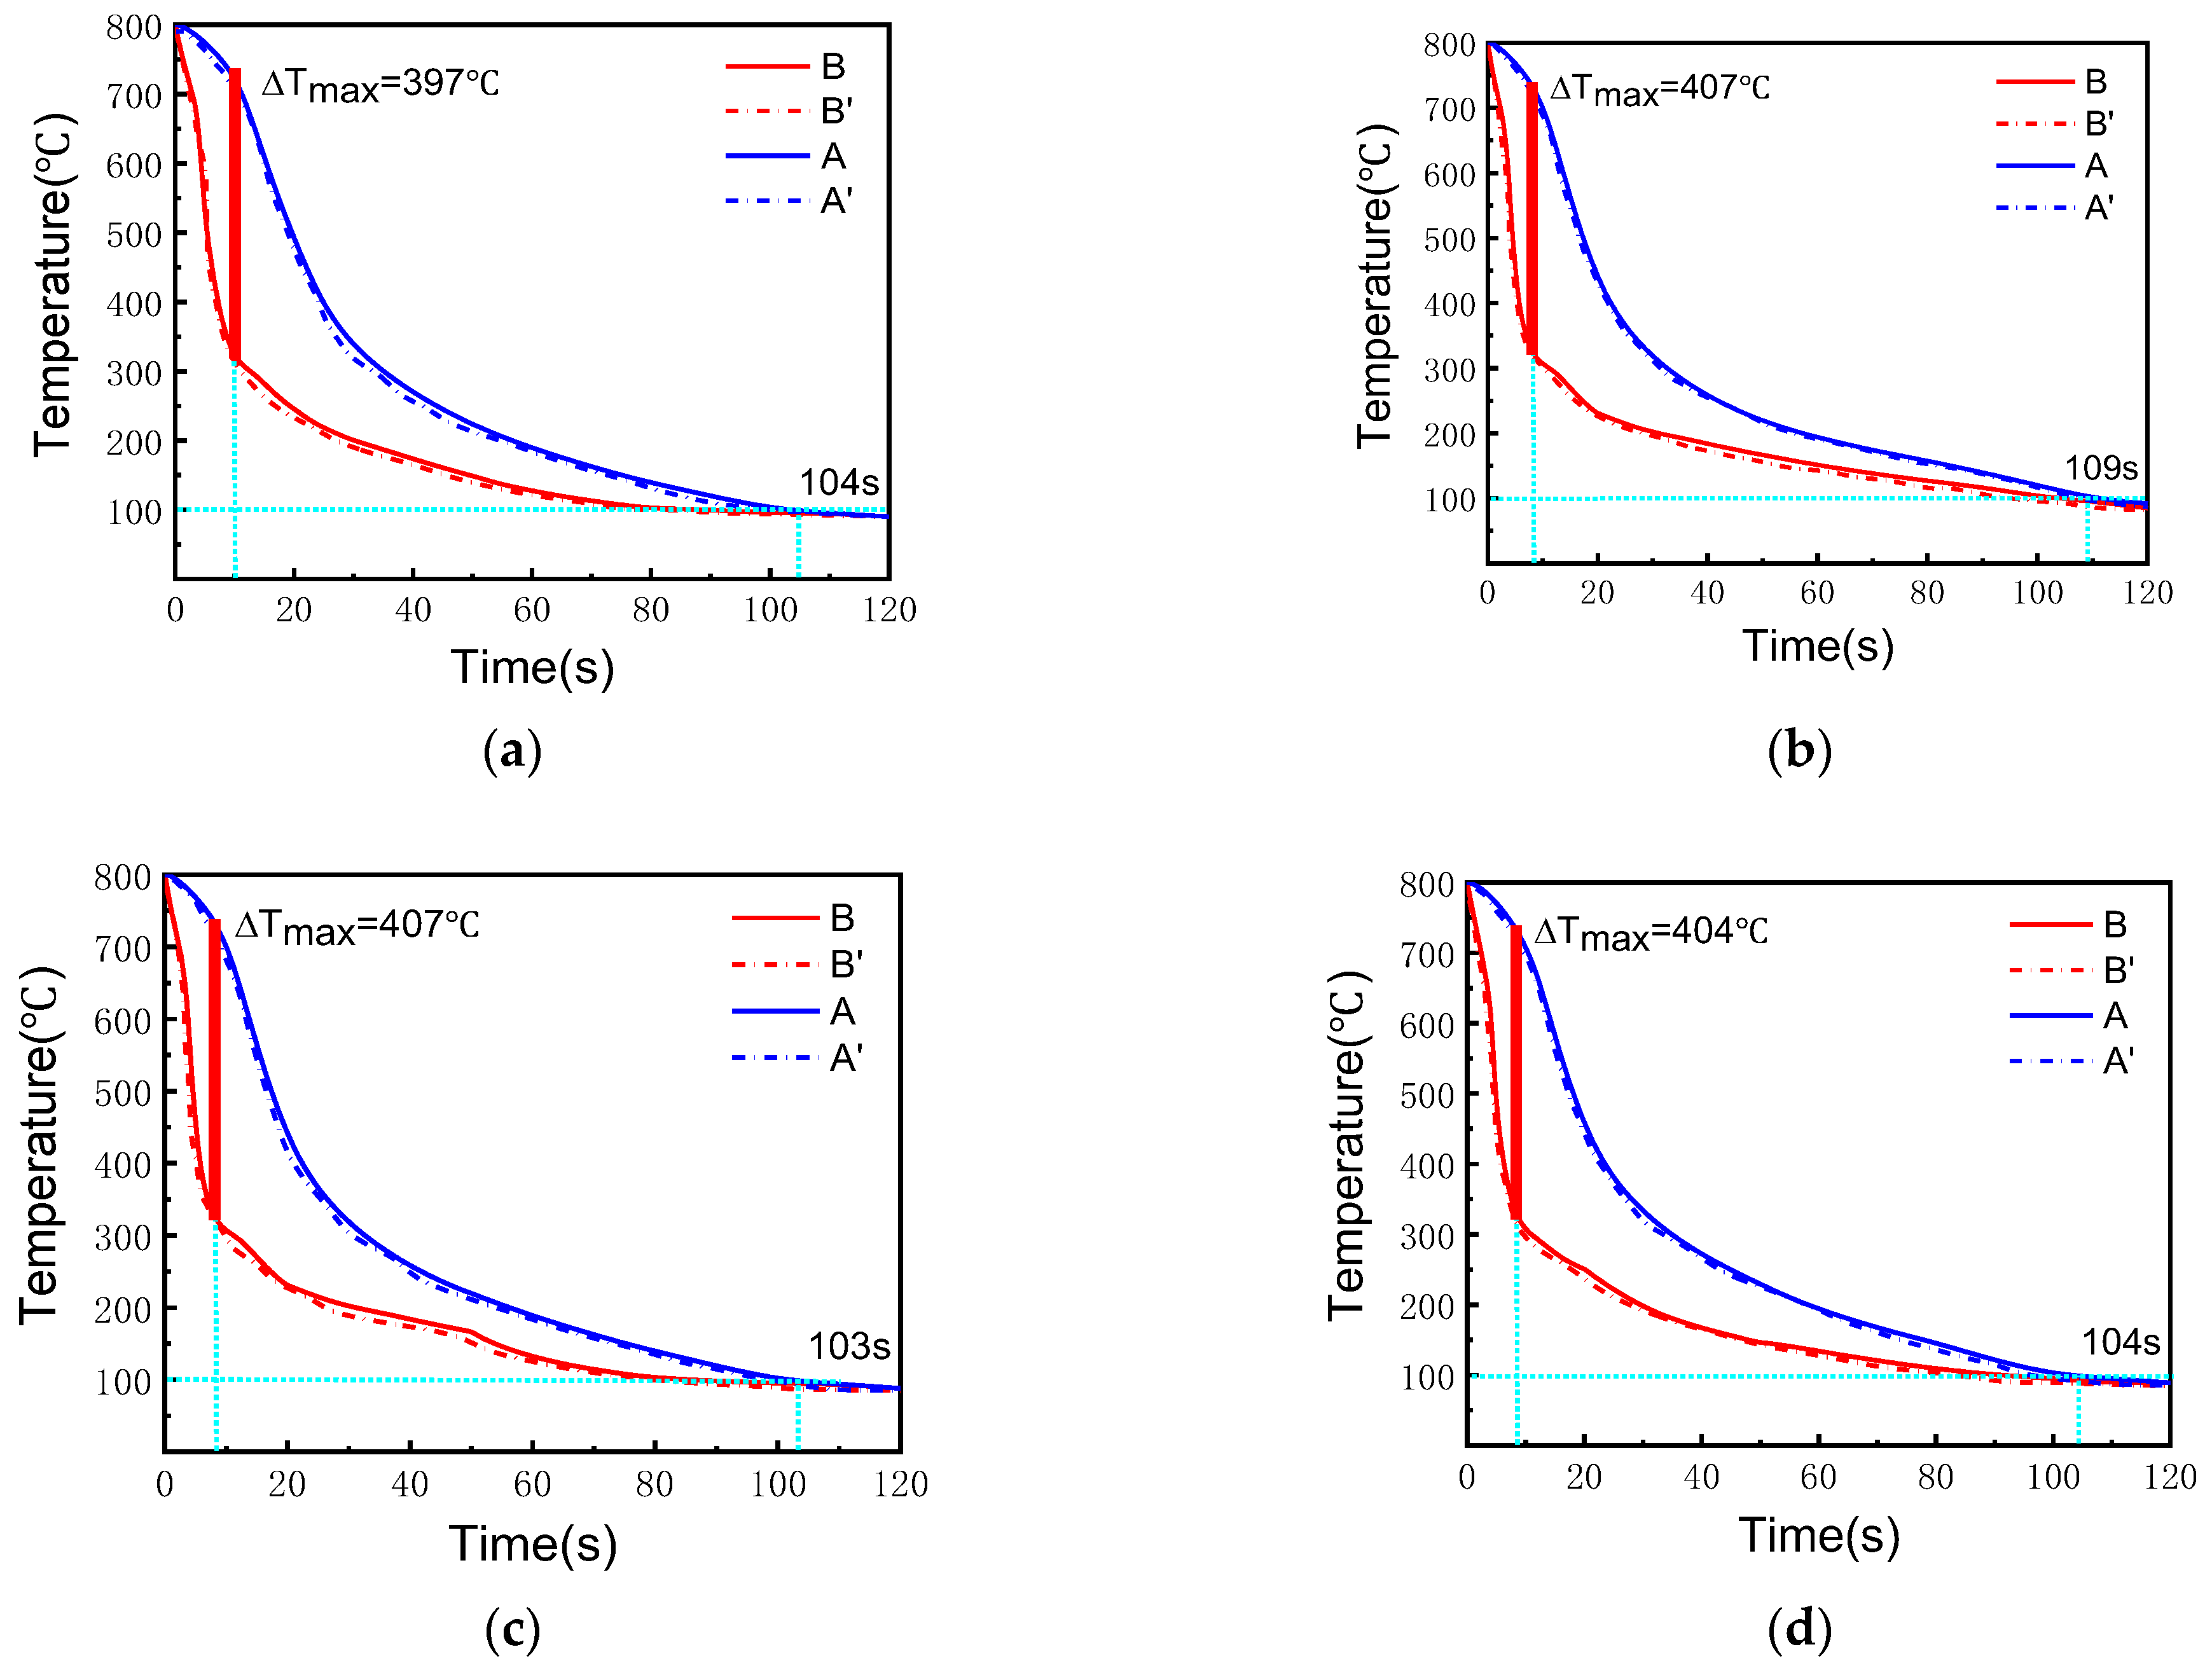
The object of the finite element simulation calculation is the 18Cr2Ni2MoVNbA gear, with dimensions shown in Figure 4. In simulating and calculating the cooling stage of pressure quenching, the gear is considered as a deformed body, while the outer pressure ring, inner pressure ring, and mandrel are considered as rigid bodies.
Due to the complexity of the pressure quenching molds, in order to simplify the model, the components of the simulated quenching molds were simplified. The mold model is shown in Figure 5a, and the simplified model is shown in Figure 5b. As shown in Figure 5a, the gray part represents the 18Cr2Ni2MoVNbA gear product, and the other parts are the pressure quenching models of the corresponding gears. Figure 5b is the simplified model without the redundant pressure quenching molds. For ease of observation, the gear is shown as a schematic diagram with half removed. During the calculation, due to the asymmetry of the gear structure and for the convenience of an intuitive understanding of the overall gear in the subsequent process, a tetrahedral mesh was adopted to divide the overall gear, and finally it consisted of 113,839 nodes and 527,768 grids.
The simulation process involves conducting various oil flow rate combinations for the quenching and cooling of 18Cr2Ni2MoVNbA gears with a carbon content of 0.20% in an oil environment (HQG oil) at an initial temperature of 800 °C and an ambient temperature of 50 °C. Meanwhile, during the quenching and cooling process, the inner pressure ring (pink model) applies a pulse pressure of 0.8 MPa to the inner edge of the gear, the outer pressure ring (blue model) applies a pulse pressure of 1 MPa to the outer edge of the gear, and the mandrel (yellow model) is regarded as a fixed model. The pulse frequency is divided into three stages over time: the first stage uses a pressure application of 1 s and a pressure release of 1 s, and the second and third stages use a pressure application of 2 s, and a pressure release of 1 s.

3. Results

Figure 6 shows the temperature cloud diagram of the gear under the four conditions when quenched for 5 s. Based on the data displayed in the figures, it is evident that the internal temperature of the gear exceeds the surface temperature under all four pressure quenching conditions. Furthermore, at the time of quenching for 5 s, the temperature of the gear remains relatively high within the thicker interface, while the temperature at the top of the gear remains relatively low. This difference indicates that the cooling rate of the inner gear is slower than that of the outer surface, while the top of the gear cools faster due to the top of tooth effect. As shown in Figure 6a, after 5 s cooling for the gear under the working condition 1, the highest temperature of 782.7 °C is achieved at the center of the cross-section of the outer tooth, and the lowest temperature of 447.6 °C is observed at the top of the inner tooth on both sides. At this point, the temperature difference is 335.1 °C. As shown in Figure 6b,c, the oil flow rates in working condition 2 and working condition 3 are the same in the initial stage. As a result, the temperature clouds of working condition 2 and working condition 3 remain the same during the 5 s cooling period, with the maximum and minimum temperatures of 778.9 °C and 374.8 °C, respectively, with a temperature difference of 404.1 °C. The initial stage of working condition 4 (shown in Figure 6d) uses the B Coil flow rate with a temperature difference of 380.1 °C. The temperature maps show that the red color of working condition 4 is greater than that of working condition 1 and lower than that of working condition 2 and 3. The application of working condition 1 during the quenching process minimizes the initial temperature, which is beneficial for the pulse-pressure sizing of the gears at elevated temperatures.
In order to better analyze the temperature fluctuation of the gears, the internal and external surfaces of the gear are chosen as two different reference points for a real-time temperature measurement and tracking analysis. The specific reference points are observed in Figure 7. Figure 8 displays the test results, A represents the simulated value of the internal temperature of the gear, B represents the simulated value of the external surface temperature of the gear, and A’ and B’ represent the measured values of the internal and external surface temperatures of the gear, respectively. In the temperature–time change curves, the internal and external surface temperatures of the gears under the four conditions show a decreasing trend with the increase of time, and the difference between the internal and external temperatures shows a tendency of increasing and then decreasing slowly, and the difference between the internal and external temperatures reaches the minimum at about 110 s. By comparing the cooling curves obtained from tests and simulation calculations at positions A and B, it can be seen that the simulated results of the temperature field of pressure quenching at different oil flow rates are in good agreement with the test results. This indicates that the pressure quenching model used in this paper is reliable. In Figure 8a, the temperature difference between position A and B in working condition 1 reaches the value of 397 °C at 9.8 s of cooling. On the other hand, in both working condition 2 and working condition 3 (shown in Figure 8b,c), the temperature difference between position A and B reaches a maximum value of 407 °C at 8.1 s cooling. The temperature difference between position A and B is 404 °C after cooling for 8.7 s in working condition 4, as depicted in Figure 8d. Observably, the temperature difference between position A and B is minimum when pressure quenching is carried out in working condition 1. Additionally, the gear is in a state of elevated temperature during this period, which is favorable for pulse-pressure shaping. Due to the excellent quenching ability of 18Cr2Ni2MoVNbA steel, for this product, after quenching and cooling, the majority of the microstructure transforms into martensite, which can effectively enhance the mechanical properties of the product. As shown in Figure 8, in the four working conditions, position B reaches Ms (395 °C) at approximately 6 s and begins the martensite transformation, while position A reaches the Ms point at approximately 22 s and begins the martensite transformation. Moreover, in the four working conditions, position A reaches Mf (395 °C) at approximately 48 s when the martensite transformation is completed, thereby increasing the hardness of the 18Cr2Ni2MoVNbA gear when quenching is completed.
Based on the simulation results, it can be predicted that under the four working conditions, namely 104 s for condition 1, 109 s for condition 2, 103 s for condition 3, and 104 s for condition 4, the time required to cool the gears to 100 °C will be as follows. Since the factory usually adopts a pressure quenching end time of 80 s, at this point, the surface of the gears has completed the martensitic transformation and has obtained sufficient hardness, but the maximum temperature can reach around 150 °C. To ensure the safety of production workers as the premise, the temperature should be controlled within the range of 100 °C after the gears have completed the pressure quenching. Moreover, after the gears have cooled down to the 100 °C value, the temperature drop rate is relatively slow, and there is no need for further pressure quenching. To accelerate production efficiency and ensure safety, it is necessary to extend the pressure quenching time from the original 80 s to 110 s.

4. Discussion

In this paper, the heat transfer coefficients in pressure quenching under five different oil flow rates are calculated, which not only solves the problem of calculating the heat transfer coefficients of a single flow rate and working conditions, but also solves the problem of heat transfer coefficients in different flow rate combination stages. It reduces a lot of the calculation and experimental workload, and provides supporting data for the calculation of parts of the corresponding materials later. Furthermore, in the simulation calculations of the four representative flow combinations, it was found that condition 1 could effectively reduce the temperature difference between the inside and outside of the gears. This indicates that in the early stage of quenching, using low-flow-rate oil for quenching is beneficial for reducing the thermal stress deformation of the corresponding parts caused by large temperature differences during pressure quenching, and is conducive to the subsequent study on the deformation of pressure quenching. Finally, it is predicted that the time required for the end temperature of pressure quenching at 100 is about 100 s. A new process scheme is put forward, which can not only ensure the low discharge temperature of the gear, but also promote the completion of the surface martensitic transformation and ensure the safety of the guarantor. By simulating the process that the corresponding material is 18Cr2Ni2MoVNbA steel gear, the heavy workload caused by the traditional method of repeated machining adjustment can be avoided, the gear performance will be reduced, and even the problem of damage and scrap may be directly caused. At the same time, it can realize the simulation analysis of the results of the heat treatment process, so as to optimize the processing technology of gears and other similar products, and finally achieve the purpose of improving production efficiency and reducing production costs.

5. Conclusions

(1) The heat transfer coefficients of HQG oil for 18Cr2Ni2MoVNbA steel under five different oil flow rates were determined, providing a reference for subsequent researchers.
(2) Simulation studies were conducted on the pressure quenching process under four different oil flow rate conditions. The results indicated that among the four working conditions, the temperature difference between the inner and outer parts of the gear was the smallest when using the oil flow rate combination of working condition 1 (A + (A − b − C) + (A − b − C)).
(3) The end time of pressure quenching for gears can be predicted. Based on the simulation result that it takes approximately 100 s for the temperature of 18Cr2Ni2MoVNbA gears to cool down to 100 °C, similar guidance can be provided for the corresponding products of the same Gleason quenching press to predict the end time of pressure quenching for different products.
(4) The pressure-quenching temperature field model was established in this paper, and the simulation calculation results were basically consistent with the experimental results. It showed that the model was reliable and could provide theoretical guidance for the future process control and optimization of other parts using the Gleason quenching press.

Author Contributions

Conceptualization, J.L. and Z.Z.; methodology, Y.W.; software, X.T.; validation, Y.W. and Z.Z.; formal analysis, J.L.; investigation, Y.W.; resources, J.L.; data curation, S.L.; writing—original draft preparation, Y.W.; writing—review and editing, J.L. and Z.Z.; visualization, X.T.; supervision, S.L.; project administration, Z.Z.; funding acquisition, J.L. All authors have read and agreed to the published version of the manuscript.

Funding

This research was funded by the National Natural Science Foundation of China (52075465, 52375519), Hunan Provincial Science and Technology Innovation Program (2020RC4038), Hunan Provincial Natural Science Foundation of China (2021J50110), Key Products of Hunan Province’s Manufacturing Industry “Unveiled and Leading” Project (2023GXGG018), The Science and Technology Innovation Program of Hunan Province (2023RC3251).

Data Availability Statement

The original contributions presented in this study are included in the article. Further inquiries can be directed to the corresponding authors.

Acknowledgments

The authors would like to thank the engineers of Jiang Lu Machinery Electronics Group Co., Ltd. for their experimental assistance and valuable discussions.

Conflicts of Interest

Author Yu Wang is employed by the company JiangLu Machinery Electronics Group Co., Ltd. The remaining authors declare that the research was conducted in the absence of any commercial or financial relationships that could be construed as a potential conflict of interest.

References

  1. Yen, H.W.; Chiang, M.H.; Lin, Y.C.; Chen, D.; Huang, C.-Y.; Lin, H.-C. High-temperature tempered martensite embrittlement in quenched-and-tempered offshore steels. Metals 2017, 7, 253. [Google Scholar] [CrossRef]
  2. Liu, G.; Huang, C.; Zhao, B.; Wang, W.; Sun, S. Effect of Machined Surface Integrity on Fatigue Performance of Metal Workpiece: A Review. Chin. J. Mech. Eng. 2021, 34, 118. [Google Scholar] [CrossRef]
  3. Kiyak, M. Investigation of effects of cutting parameters on surface quality and hardness in the wire-EDM process. Int. J. Adv. Manuf. Technol. 2022, 119, 647–655. [Google Scholar] [CrossRef]
  4. Miao, S.; Ju, D.Y.; Chen, Y.; Liu, Y.-Q. Optimization based on orthogonal experiment design and numerical simulation for carburizing quenching process of helical gear. Mater. Perform. Charact. 2018, 8, 66–79. [Google Scholar] [CrossRef]
  5. Li, W.; Liu, B. Experimental investigation on the effect of shot peening on contact fatigue strength for carburized and quenched gears. Int. J. Fatigue 2018, 106, 103–113. [Google Scholar] [CrossRef]
  6. Zhi, L.; Jie, Y.; Li, S.-K.; Nie, W.-J.; Li, L.-X.; Wang, G. Study on inhomogeneous cooling behavior of extruded profile with unequal and large thicknesses during quenching using thermo-mechanical coupling model. Trans. Nonferrous Met. Soc. China 2020, 30, 1211–1226. [Google Scholar]
  7. Onishchenko, V. Investigation of tooth wears from scuffing of heavy duty machine spur gears. Mech. Mach. Theory 2015, 83, 38–55. [Google Scholar] [CrossRef]
  8. Shi, L.; Cui, X.; Li, J.; Jin, G.; Liu, J.; Tian, H. Improving the wear resistance of heavy-duty gear steels by cyclic carburizing. Tribol. Int. 2022, 171, 107576. [Google Scholar] [CrossRef]
  9. Iżowski, B.; Wojtyczka, A.; Motyka, M. Numerical Simulation of Low-Pressure Carburizing and Gas Quenching for Pyrowear 53 Steel. Metals 2023, 13, 371. [Google Scholar] [CrossRef]
  10. Li, X.; Ju, D.; Cao, J.; Wang, S.; Chen, Y.; He, F.; Li, H. Effect of Transformation Plasticity on Gear Distortion and Residual Stresses in Carburizing Quenching Simulation. Coatings 2021, 11, 1224. [Google Scholar] [CrossRef]
  11. Shao, W.; Yi, M.; Tang, J.; Sun, S. Prediction Minimization of the Heat Treatment Induced Distortion in 8620HSteel Gear: Simulation Experimental Verification. Chin. J. Mech. Eng 2022, 35, 126. [Google Scholar] [CrossRef]
  12. Pinheiro, P.M.; Junio, J.U.; Gonçalves, L.A.P.; da Costa, J.Â.P.; Ochoa, A.A.V.; Alves, K.G.B.; Leite, G.d.N.P.; Michima, P.S.A. Modeling and Simulation of the Induction Hardening Process: Evaluation of Gear Deformations and Parameter Optimization. Processes 2024, 12, 1428. [Google Scholar] [CrossRef]
  13. Liu, H.; Zhao, J.; Tang, J.; Shao, W.; Sun, B. Simulation and Experimental Verification of Die Quenching Deformation of Aviation Carburized Face Gear. Materials 2023, 16, 690. [Google Scholar] [CrossRef] [PubMed]
  14. Khan, D.; Gautham, B.P. Integrated modeling of carburizing-quenching-tempering of steel gears for an ICME framework. Integr. Mater. Manuf. Innov. 2018, 7, 28–41. [Google Scholar] [CrossRef]
  15. Li, J.; Feng, Y.; Zhang, H.; Min, N.; Wu, X. Thermomechanical Analysis of Deep Cryogenic Treatment of Navy C-Ring Specimen. J. Mater. Eng. Perform. 2014, 23, 4237–4250. [Google Scholar] [CrossRef]
  16. Zhang, Y.; Wang, G.; Shi, W.; Yang, L.; Li, Z. Modeling and Analysis of Deformation for Spiral Bevel Gear in Die Quenching Based on the Harden ability Variation. J. Mater. Eng. Perform. 2017, 26, 3034–3047. [Google Scholar] [CrossRef]
  17. Sun, Y.; Li, X.; Liu, C.; Deng, X.; Zhang, W.; Wang, J.; Zhang, Z.; Wen, T.; Song, T.; Ju, D. Development of an intelligent design and simulation aid system for heat treatment processes based on LLM. Mater. Des. 2024, 29, 113506. [Google Scholar] [CrossRef]
  18. Brokate, M.; Sprekels, J. Hysteresis and Phase Transitions; Springer Science & Business Media: Berlin/Heidelberg, Germany, 1996. [Google Scholar]
Figure 1. The rmophysical parameters of 18Cr2Ni2MoVNbA steel: (a) specific heat capacity; (b) latent heat; and (c) thermal conductivity.
Metals 15 00443 g001
Figure 2. A schematic diagram of pressure quenching: (a) a schematic diagram of the quenching press; (b) a schematic diagram of gear pressure quenching (unit: mm).
Metals 15 00443 g002
Figure 3. Cooling curves of different flow levels and the corresponding heat transfer coefficients: (a) cooling curve; (b) heat transfer coefficient.
Metals 15 00443 g003
Figure 4. A schematic diagram of the gear structure (unit: mm).
Metals 15 00443 g004
Figure 5. A 3D diagram of gear press quenching die. (a) 3D schematic diagram; (b) a finite element simulation schematic diagram.
Metals 15 00443 g005
Figure 6. The temperature cloud chart corresponding to the pressure quenching of 5 s corresponding to different working conditions: (a) working condition 1; (b) working condition 2; (c) working condition 3; and (d) working condition 4.
Metals 15 00443 g006
Figure 7. Two characteristic position reference points of the gear.
Metals 15 00443 g007
Figure 8. Cooling curves of characteristic parts in different working conditions: (a) working condition 1; (b) working condition 2; (c) working condition 3; and (d) working condition 4.
Metals 15 00443 g008
Table 1. The parameters of four different working conditions (L/min).
The First Stage (20 s)The Second Stage (30 s)The Third Stage (70 s)
condition 1A (189 L/min)A-B-C (1136 L/min)A-B-C (1136 L/min)
condition 2A-B-C (1136 L/min)A (189 L/min)A (189 L/min)
condition 3A-B-C (1136 L/min)A (189 L/min)A-B-C (1136 L/min)
condition 4B-C (1041 L/min)C (965 L/min)A-B (795 L/min)
Table 2. The chemical composition of gears (mass fraction, %).
CSiMnCrNiMo
18Cr2Ni2MoVNbA0.20.180.581.691.590.28
Disclaimer/Publisher’s Note: The statements, opinions and data contained in all publications are solely those of the individual author(s) and contributor(s) and not of MDPI and/or the editor(s). MDPI and/or the editor(s) disclaim responsibility for any injury to people or property resulting from any ideas, methods, instructions or products referred to in the content.

