
A Novel Model for Transformation-Induced Plasticity and Its Performance in Predicting Residual Stress in Quenched AISI 4140 Steel Cylinders


Abstract
:1. Introduction
2. Materials and Methods
2.1. Experimental Methods
2.2. Numerical Models
2.2.1. Temperature Distribution
2.2.2. Phase Transformation Kinetics
2.2.3. Analysis of Stress/Strain
2.2.4. Calculation of Hardness
2.2.5. Simulation Details
3. Results
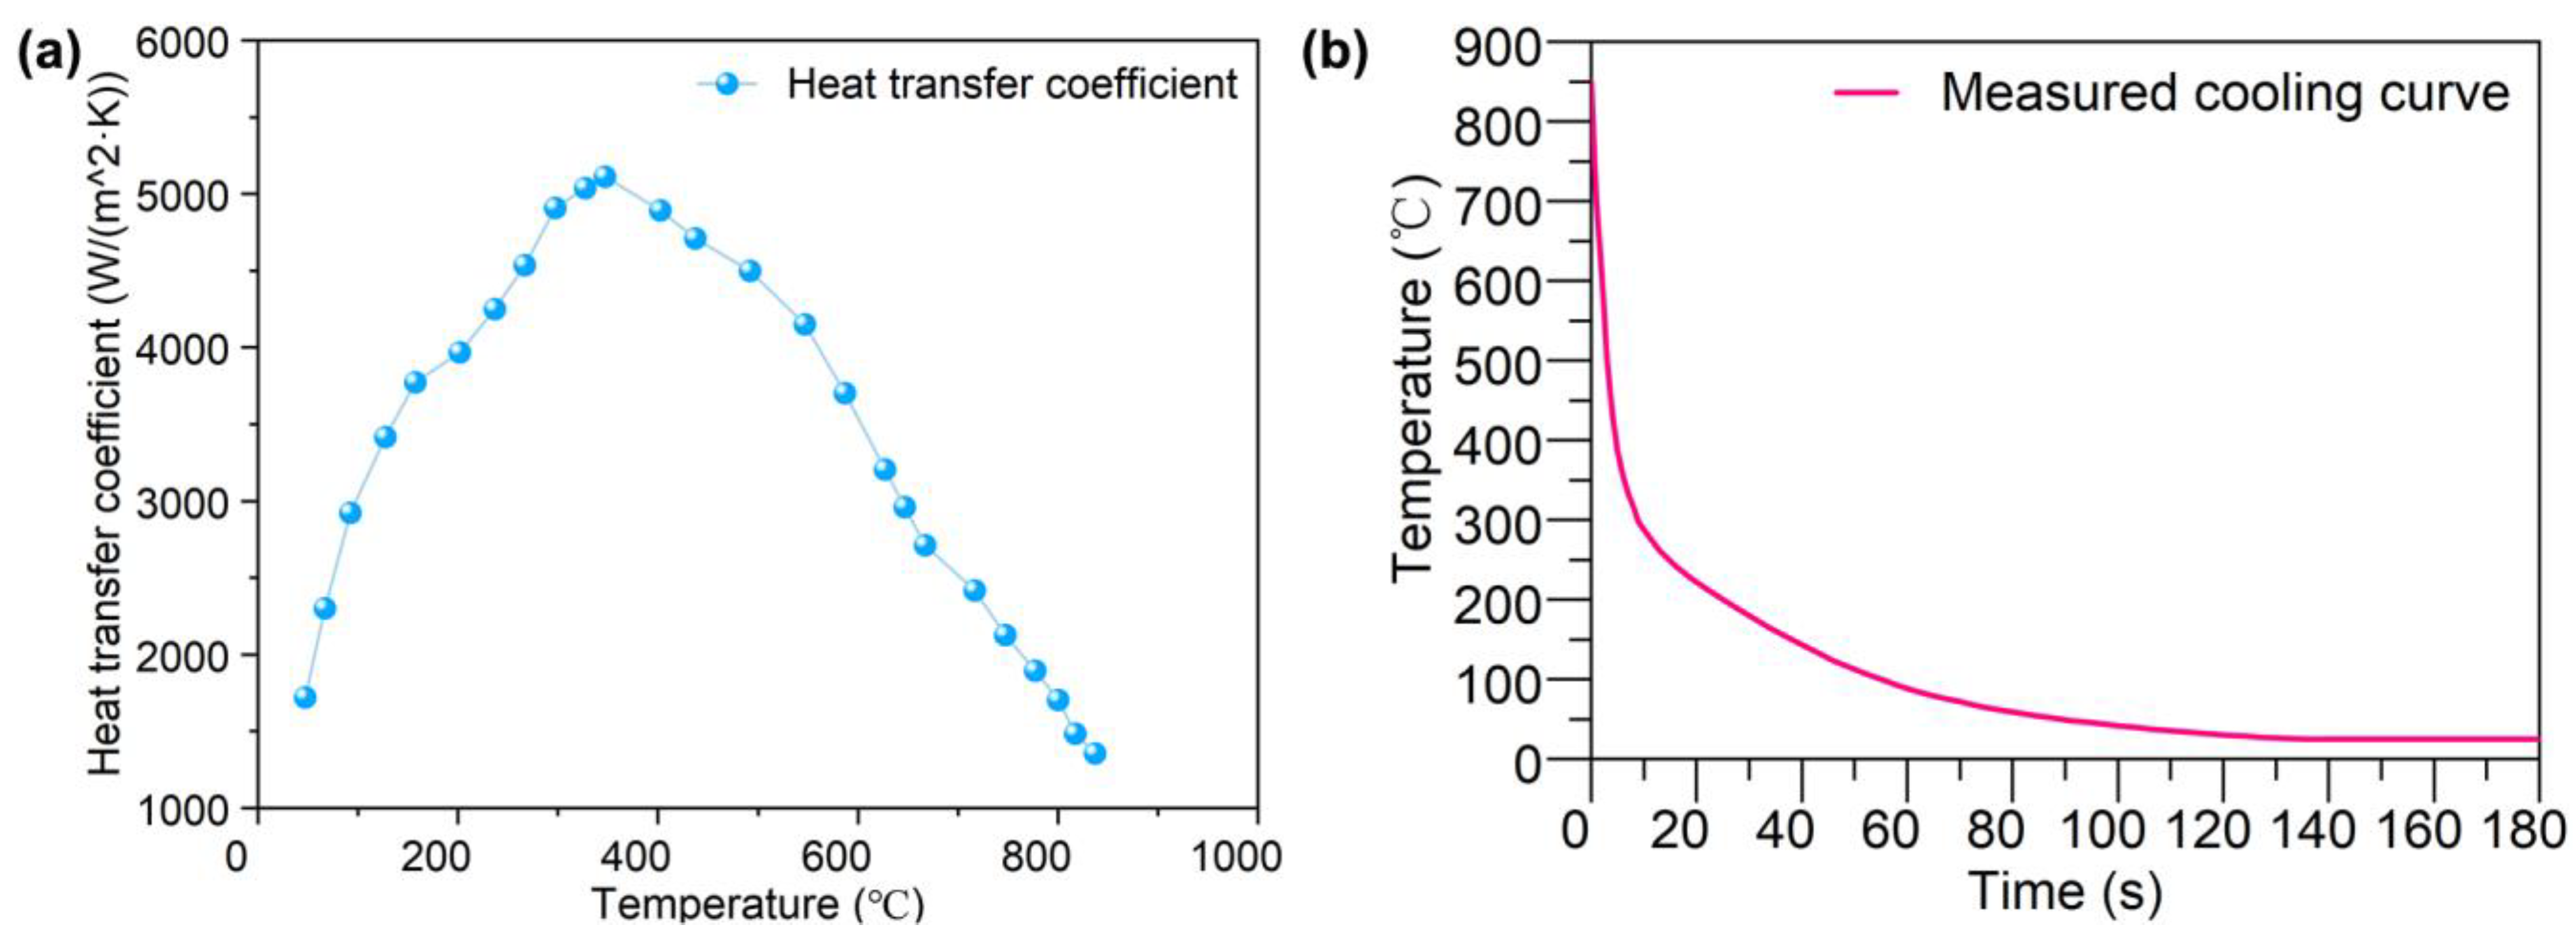
3.1. Cooling Curves
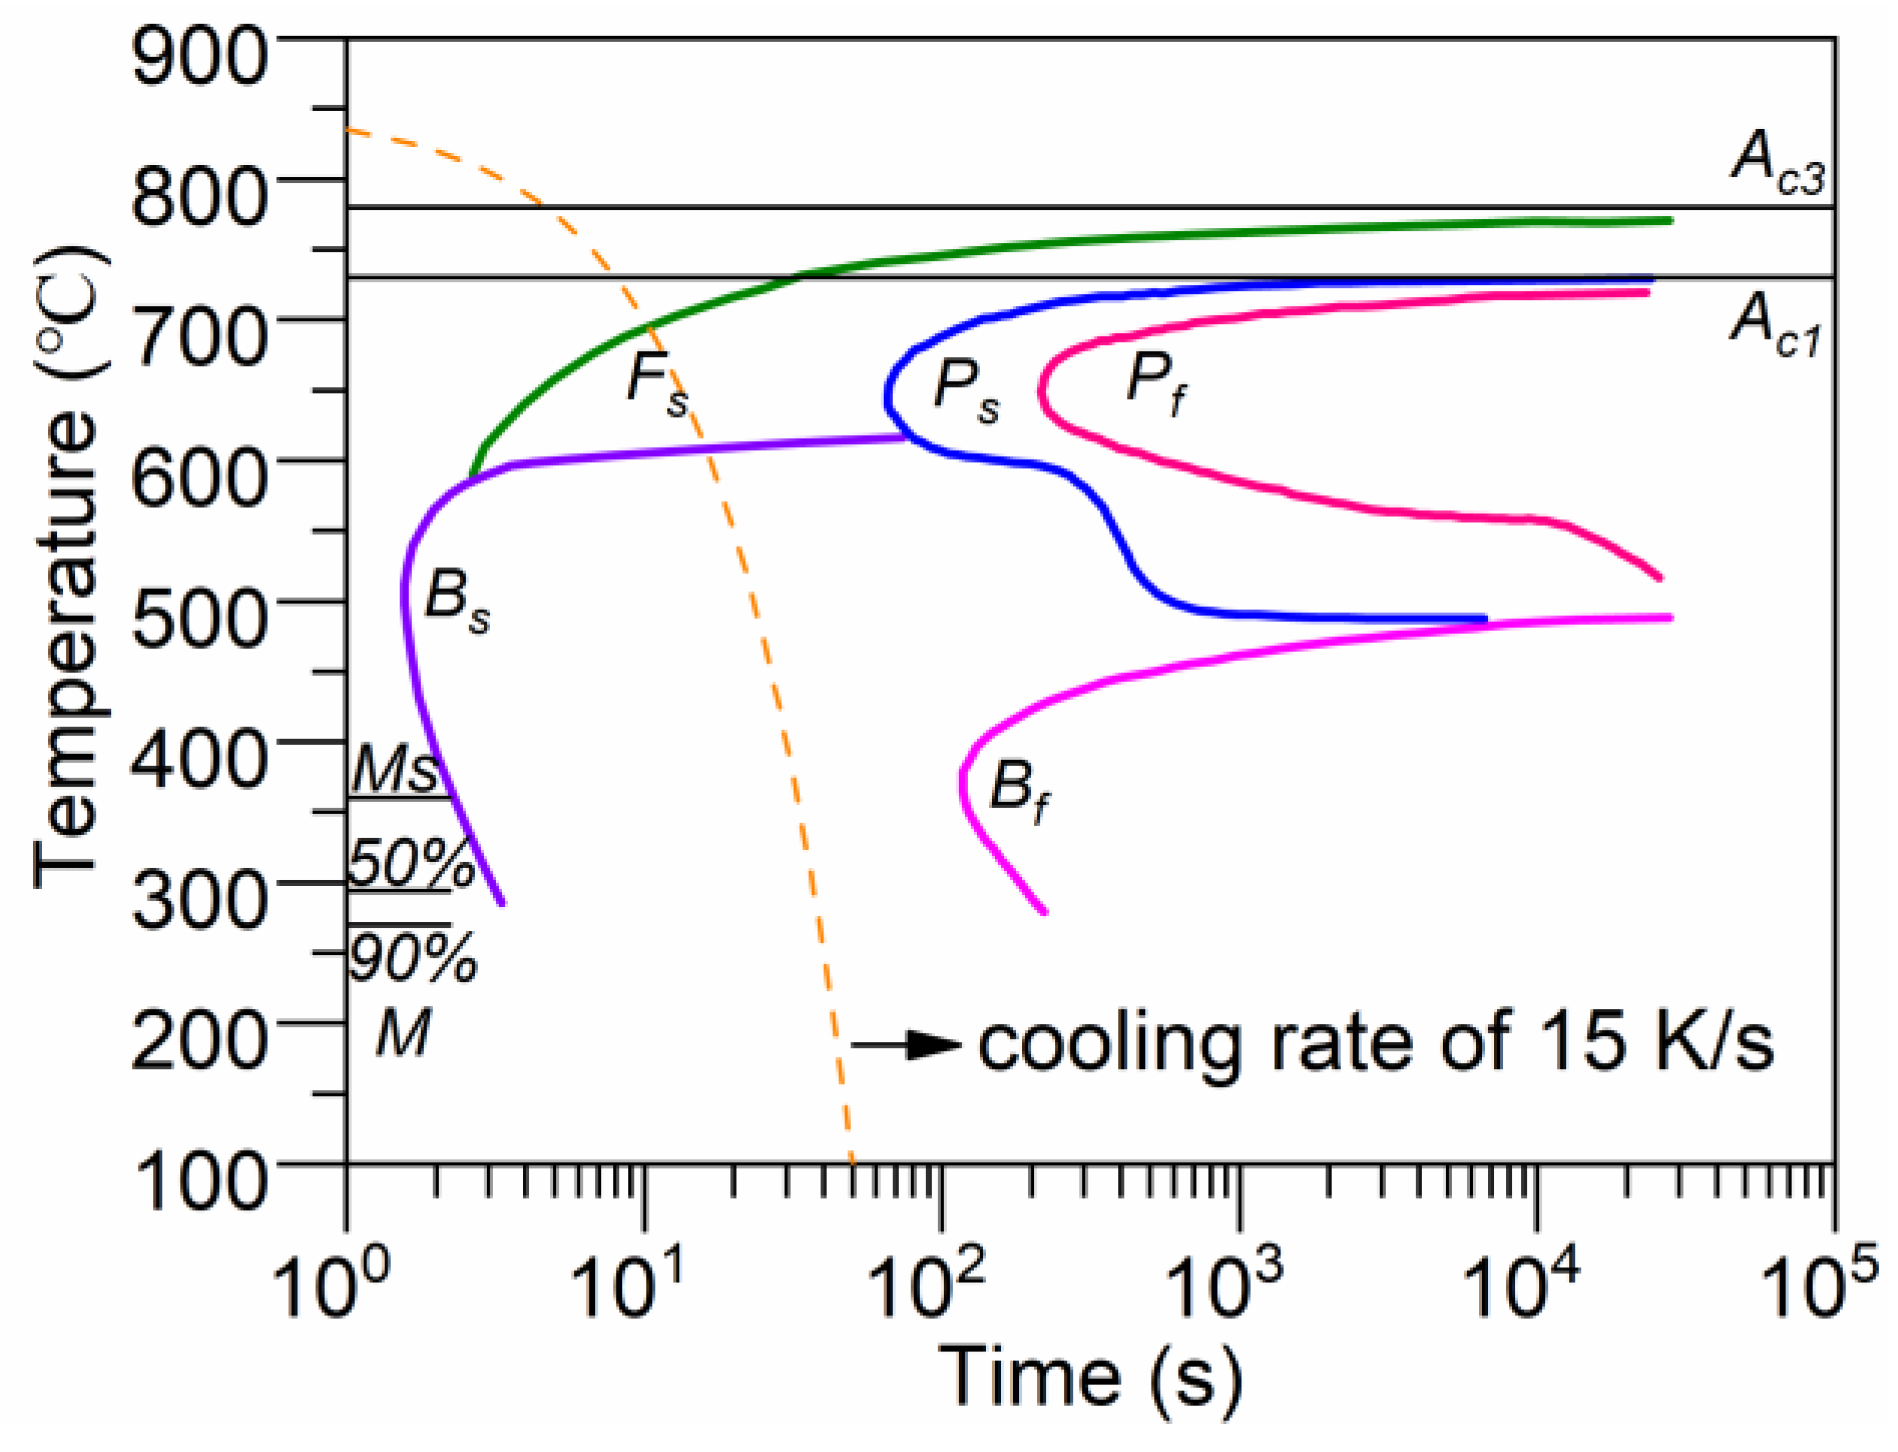
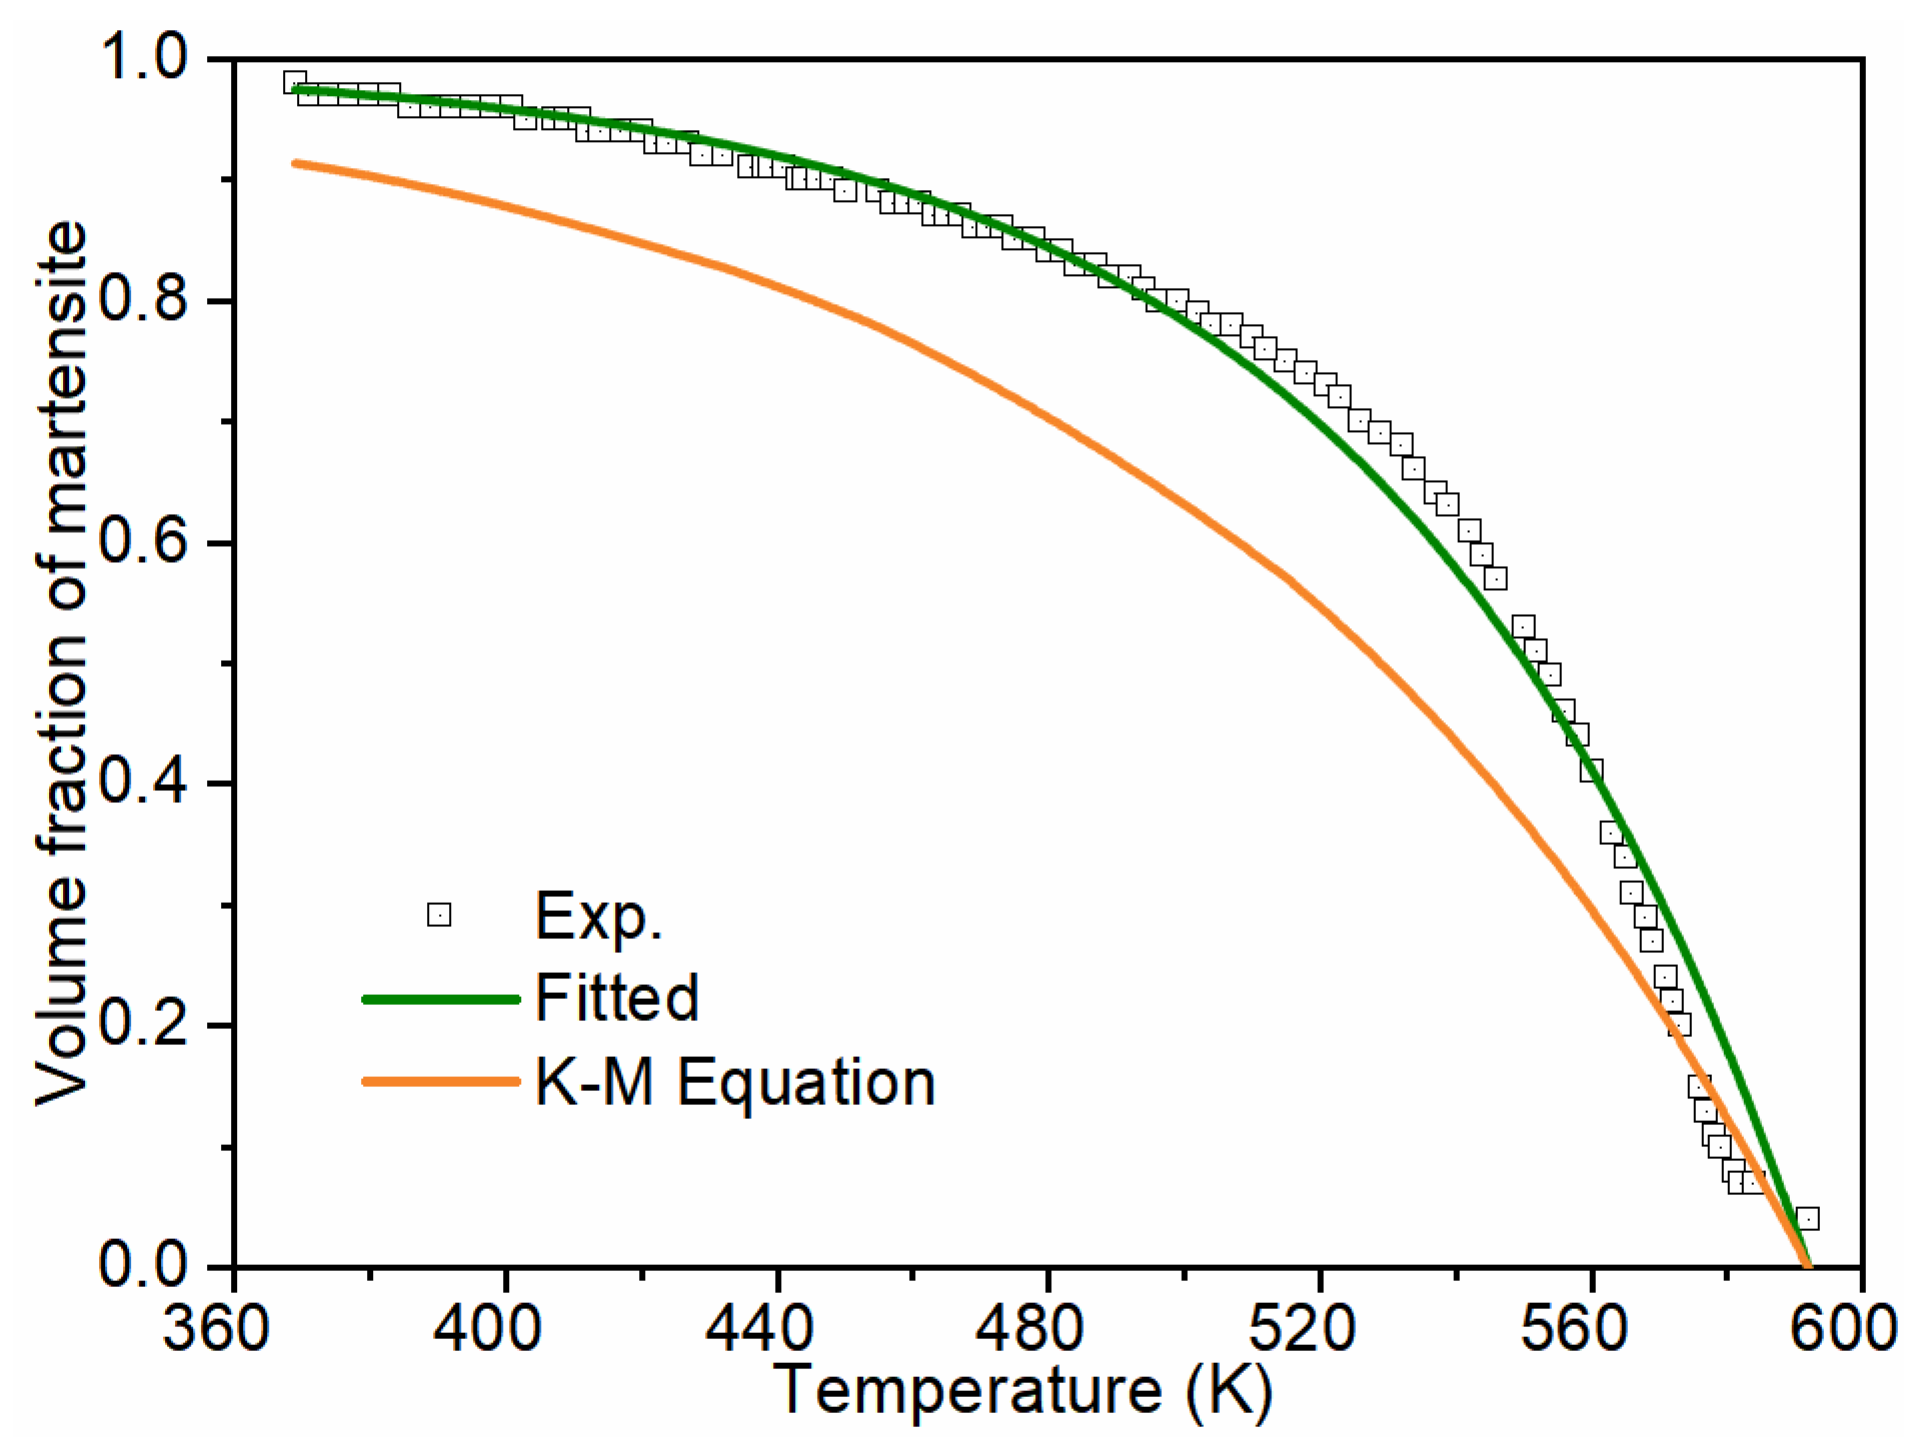
3.2. Microstructure Distribution
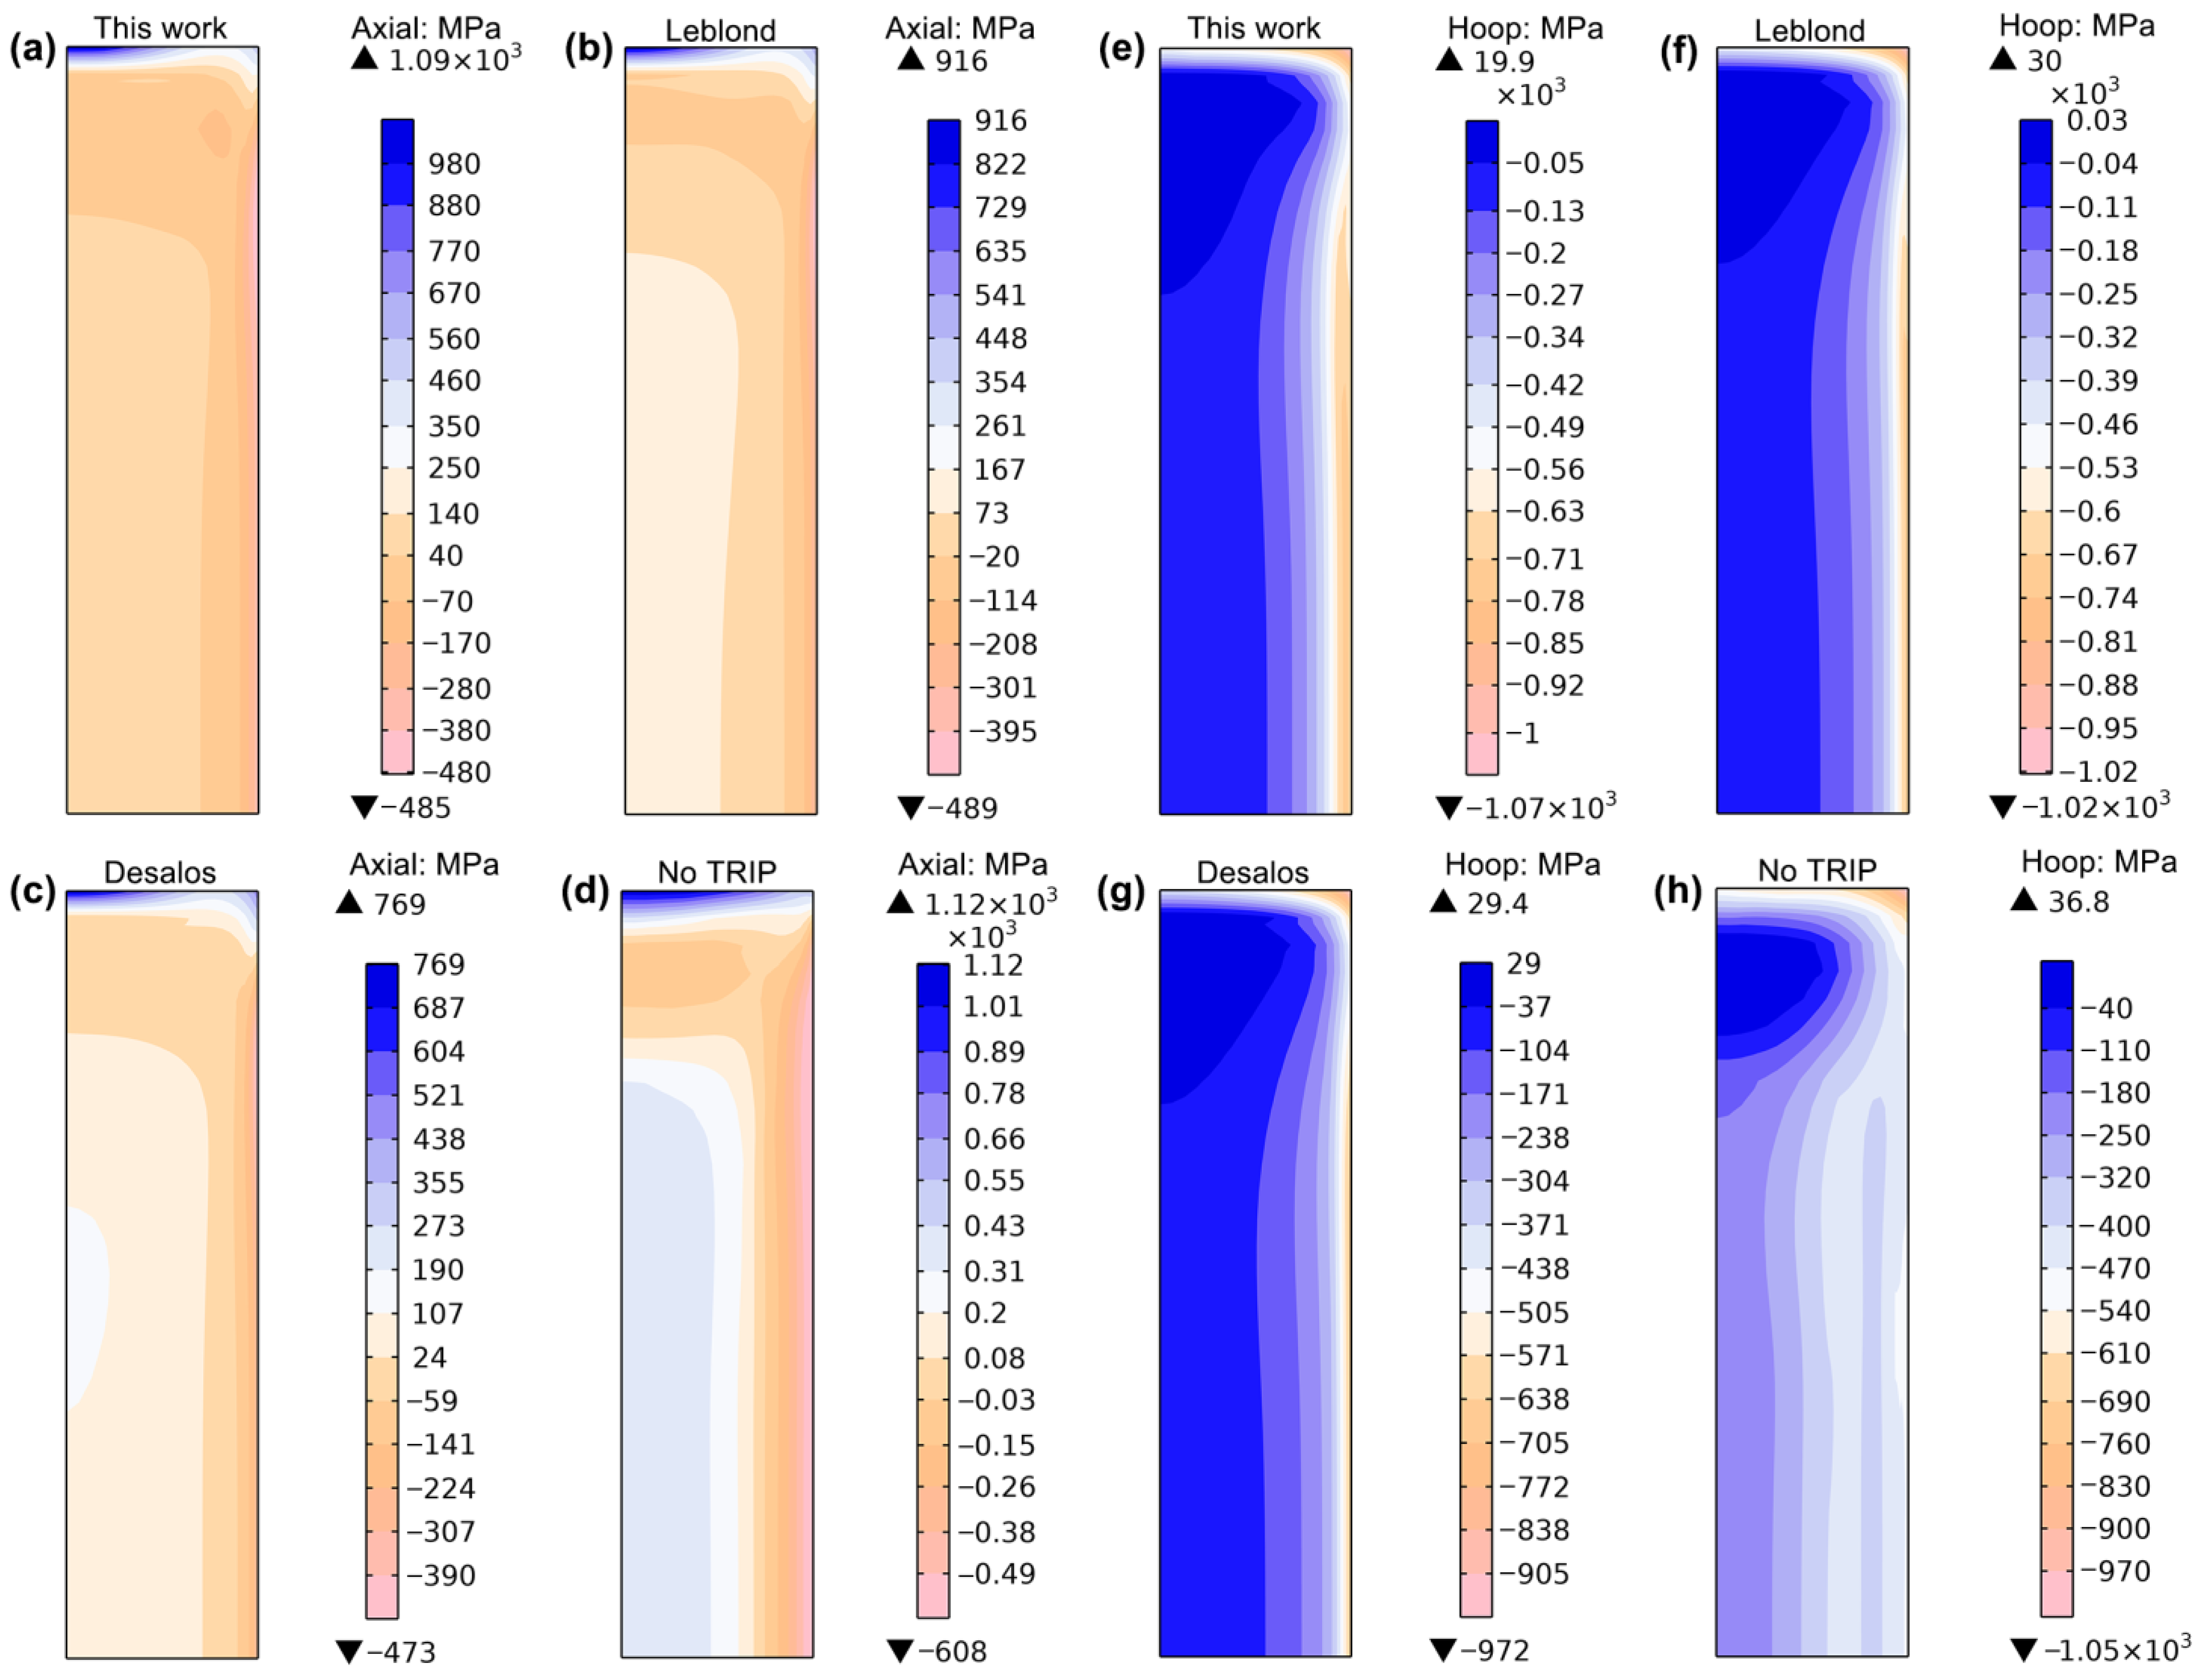
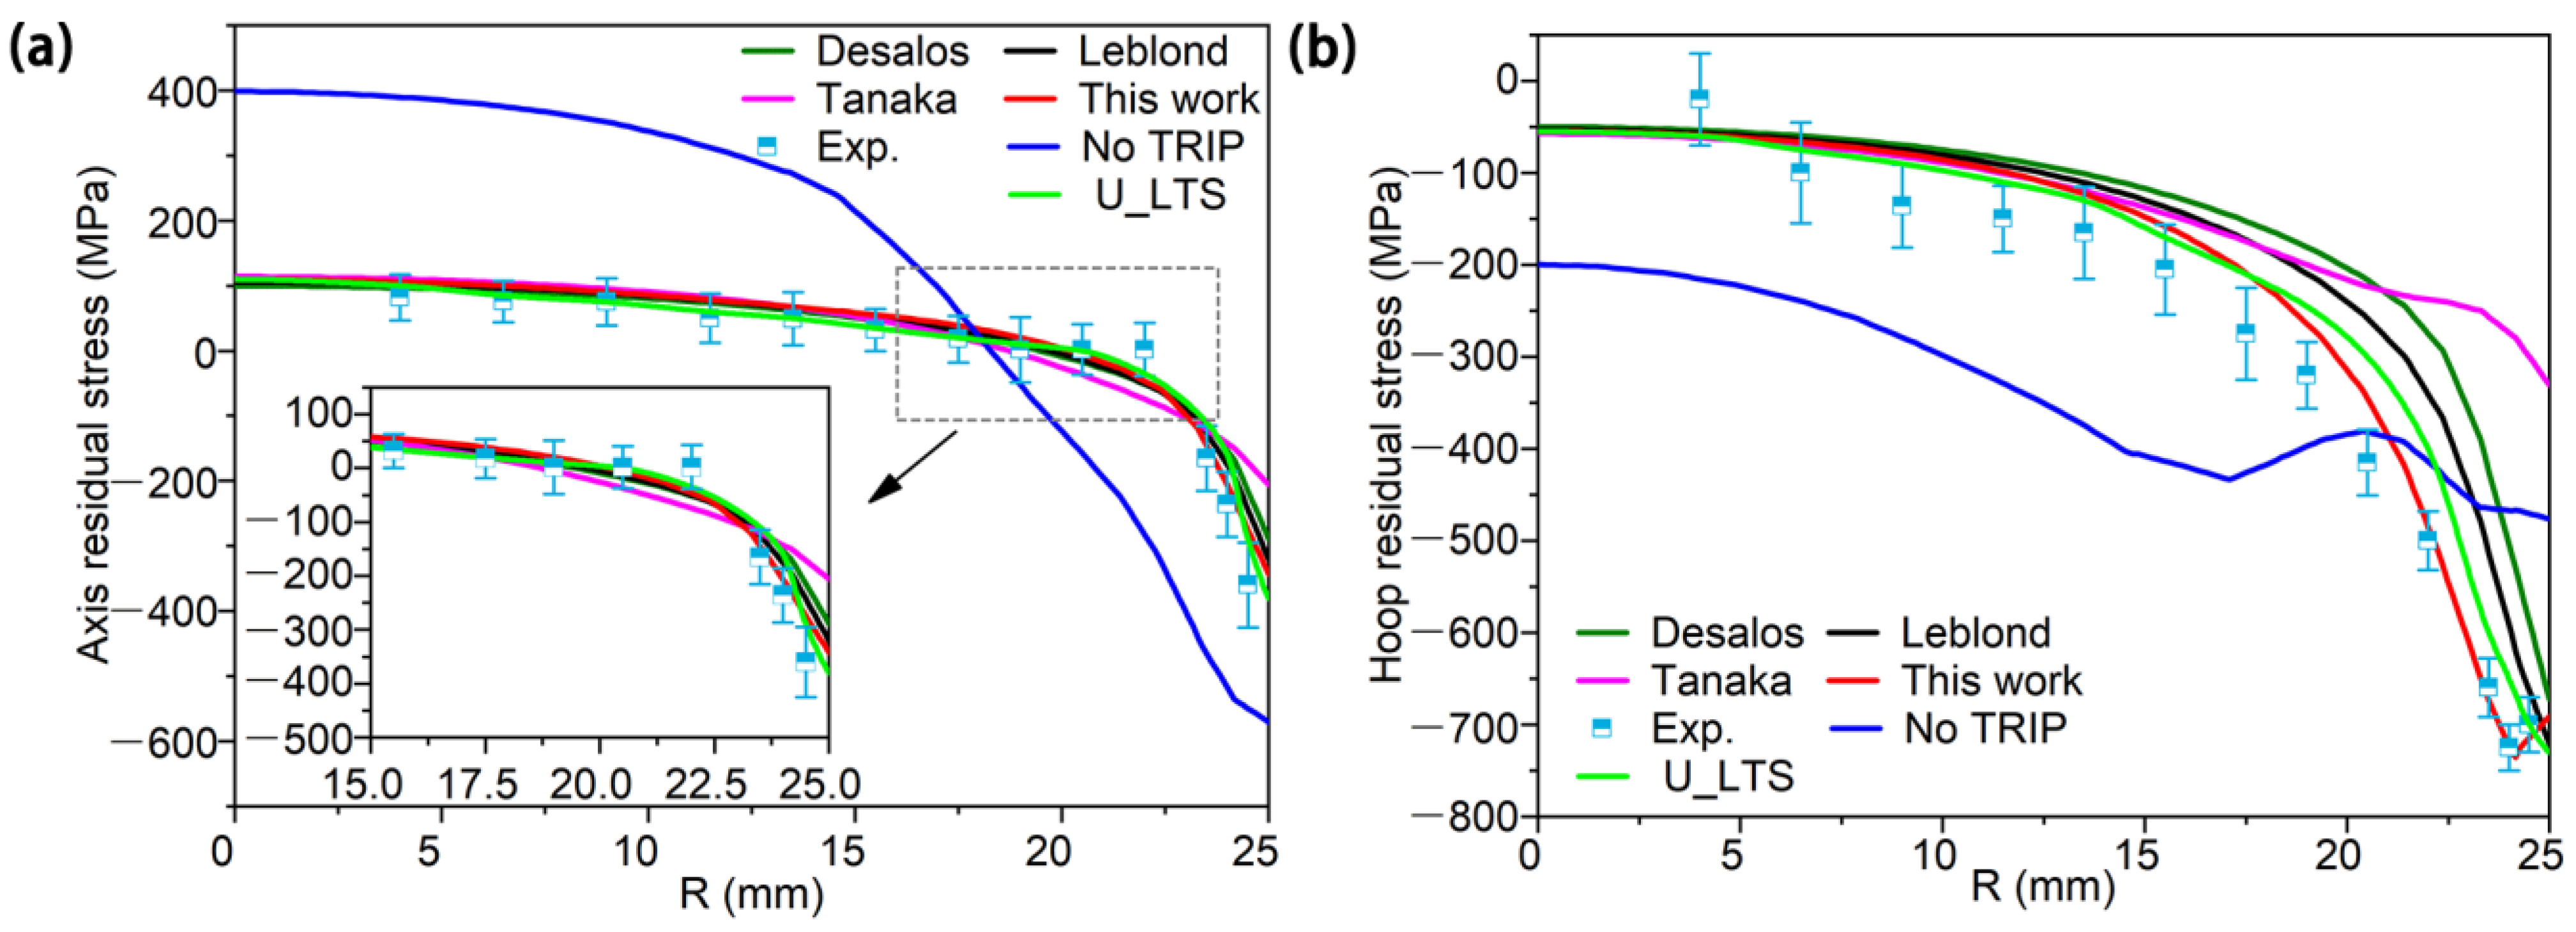
3.3. Residual Stress Distribution
4. Discussion
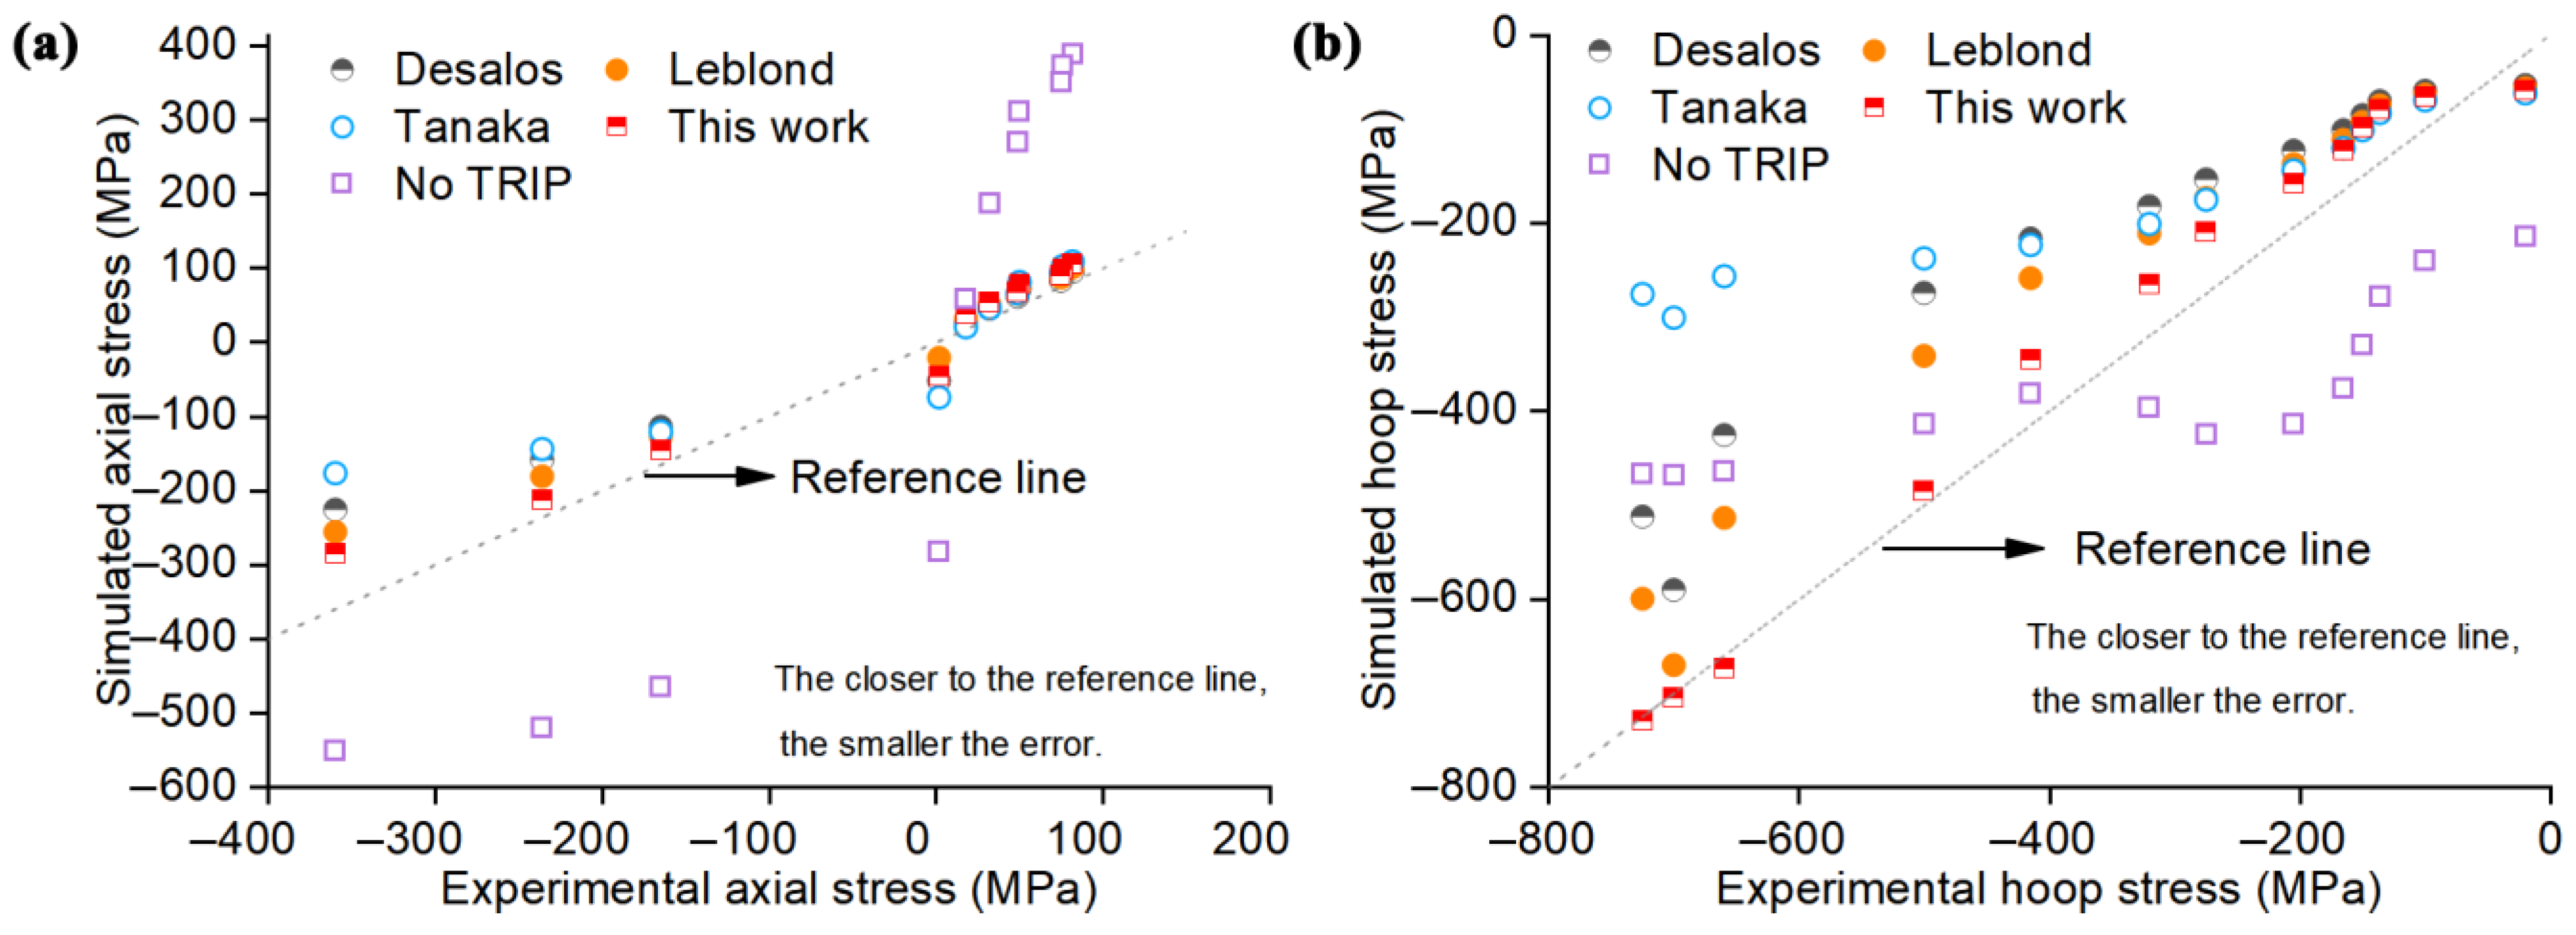
4.1. Performance of the New Model in Predicting Residual Stress
4.2. Evaluation of the New TRIP Model in Predicting Residual Stress
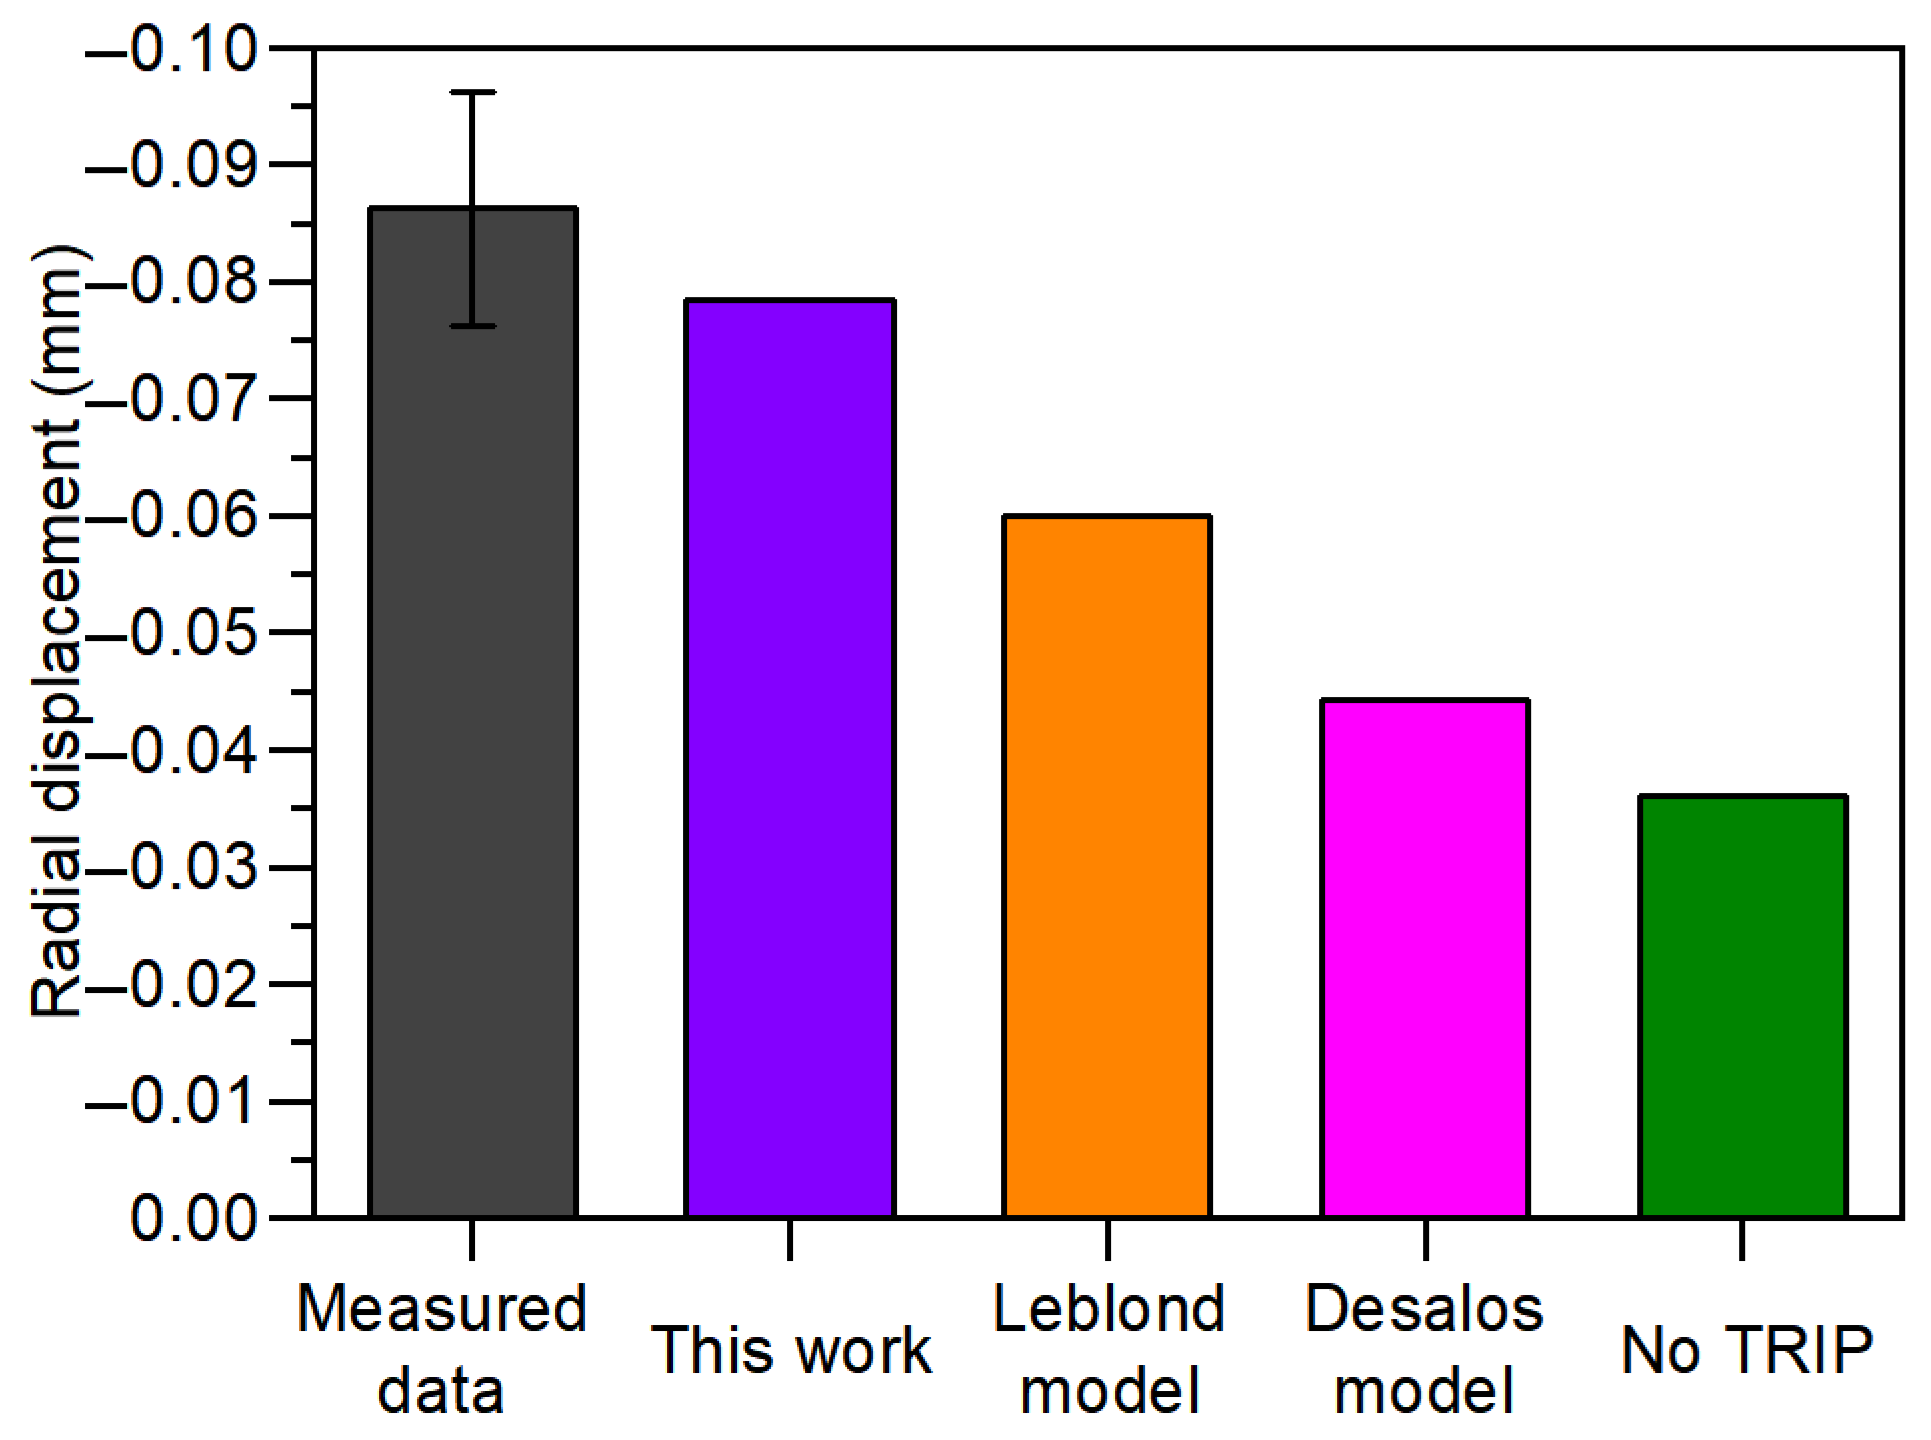
4.3. Performance of the New Model in Predicting Distortion After Quenching
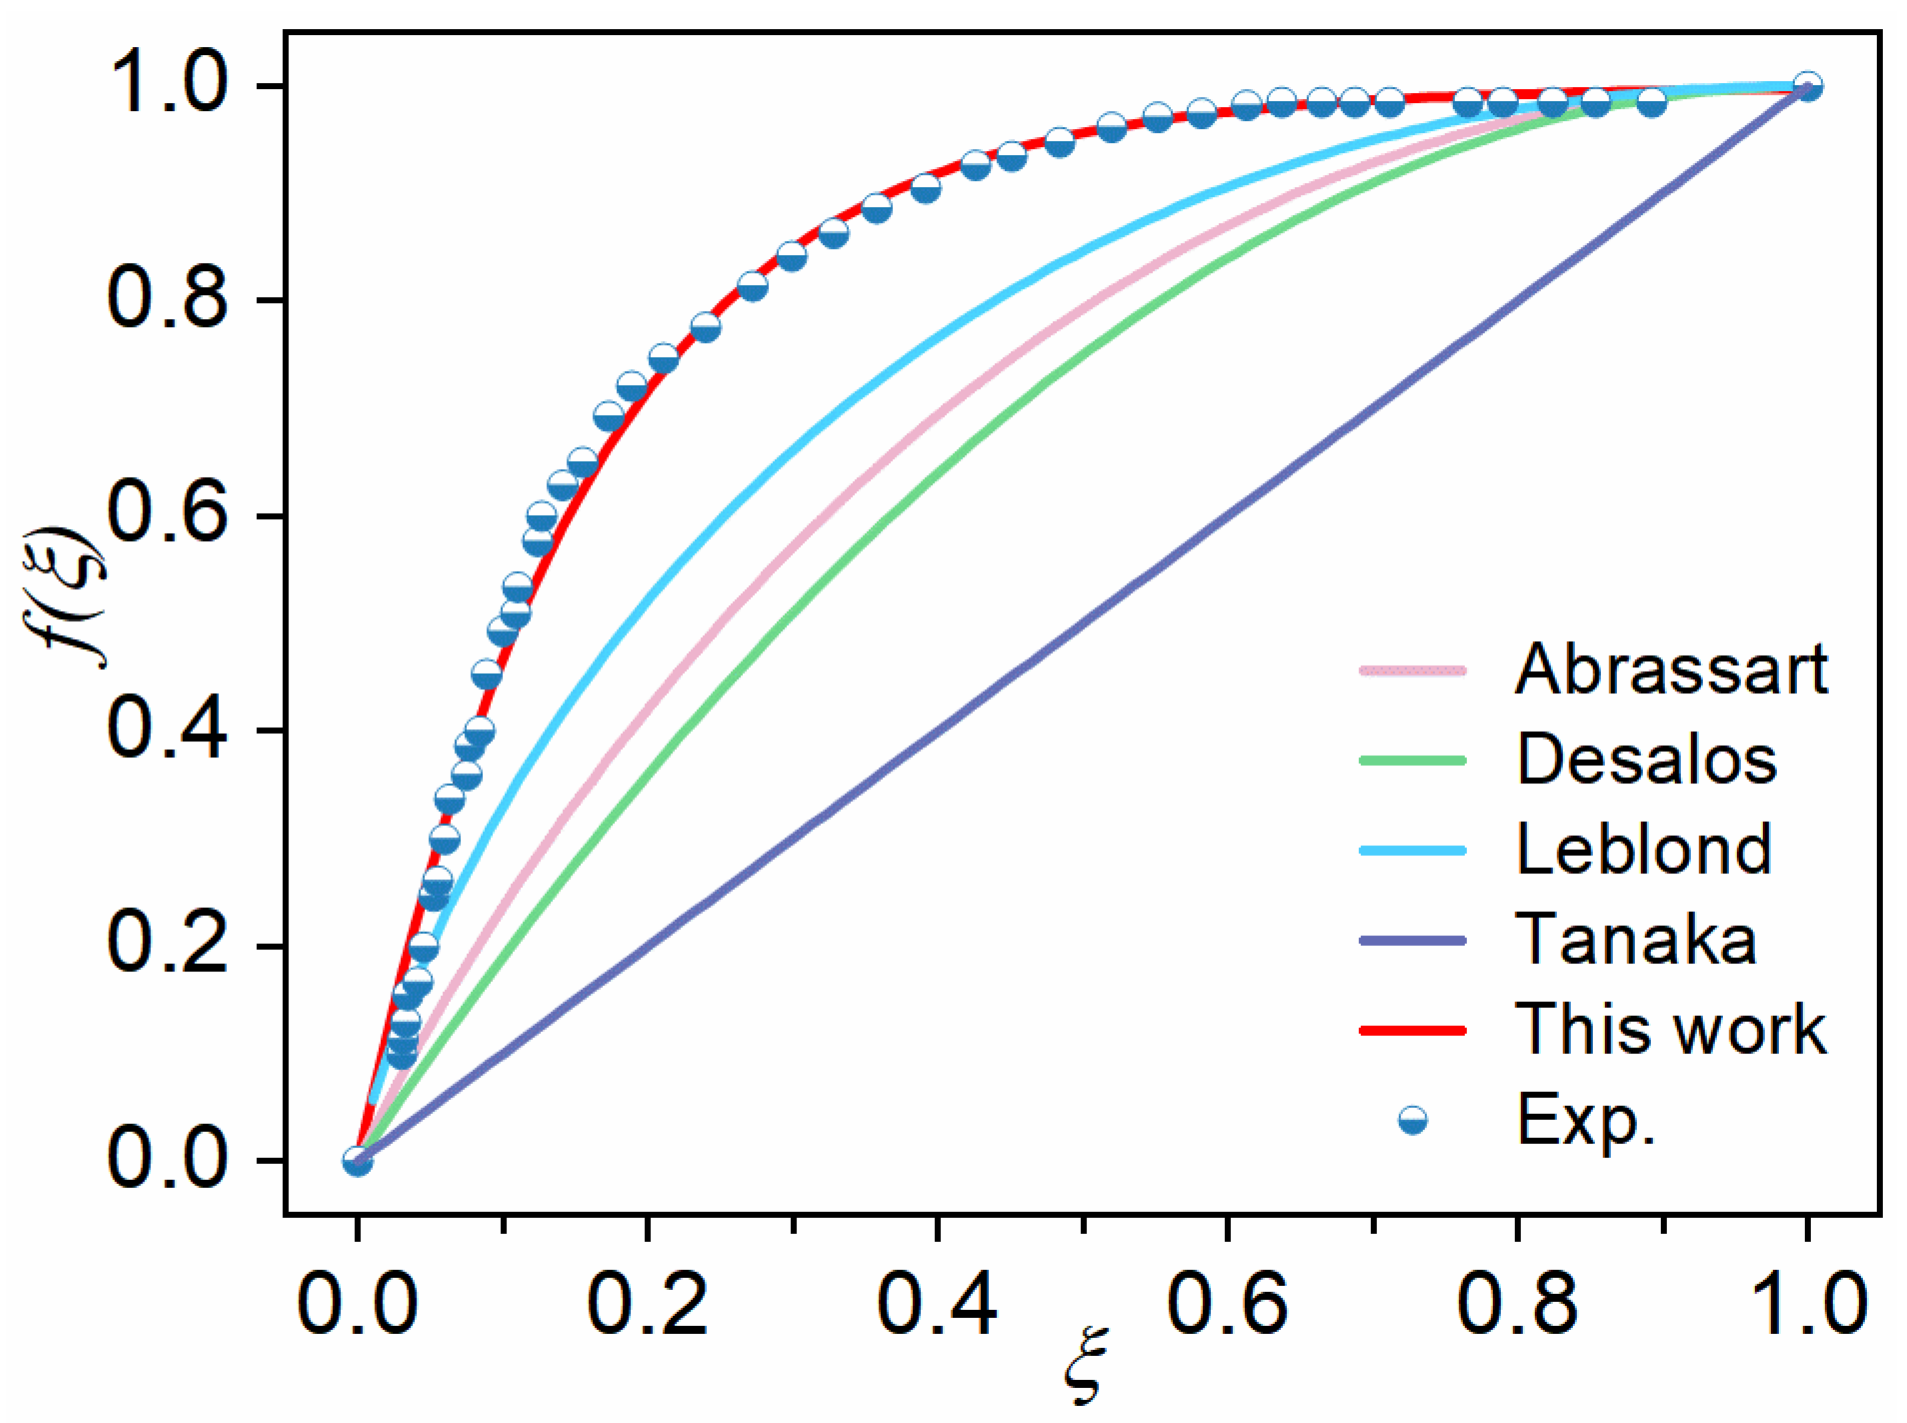
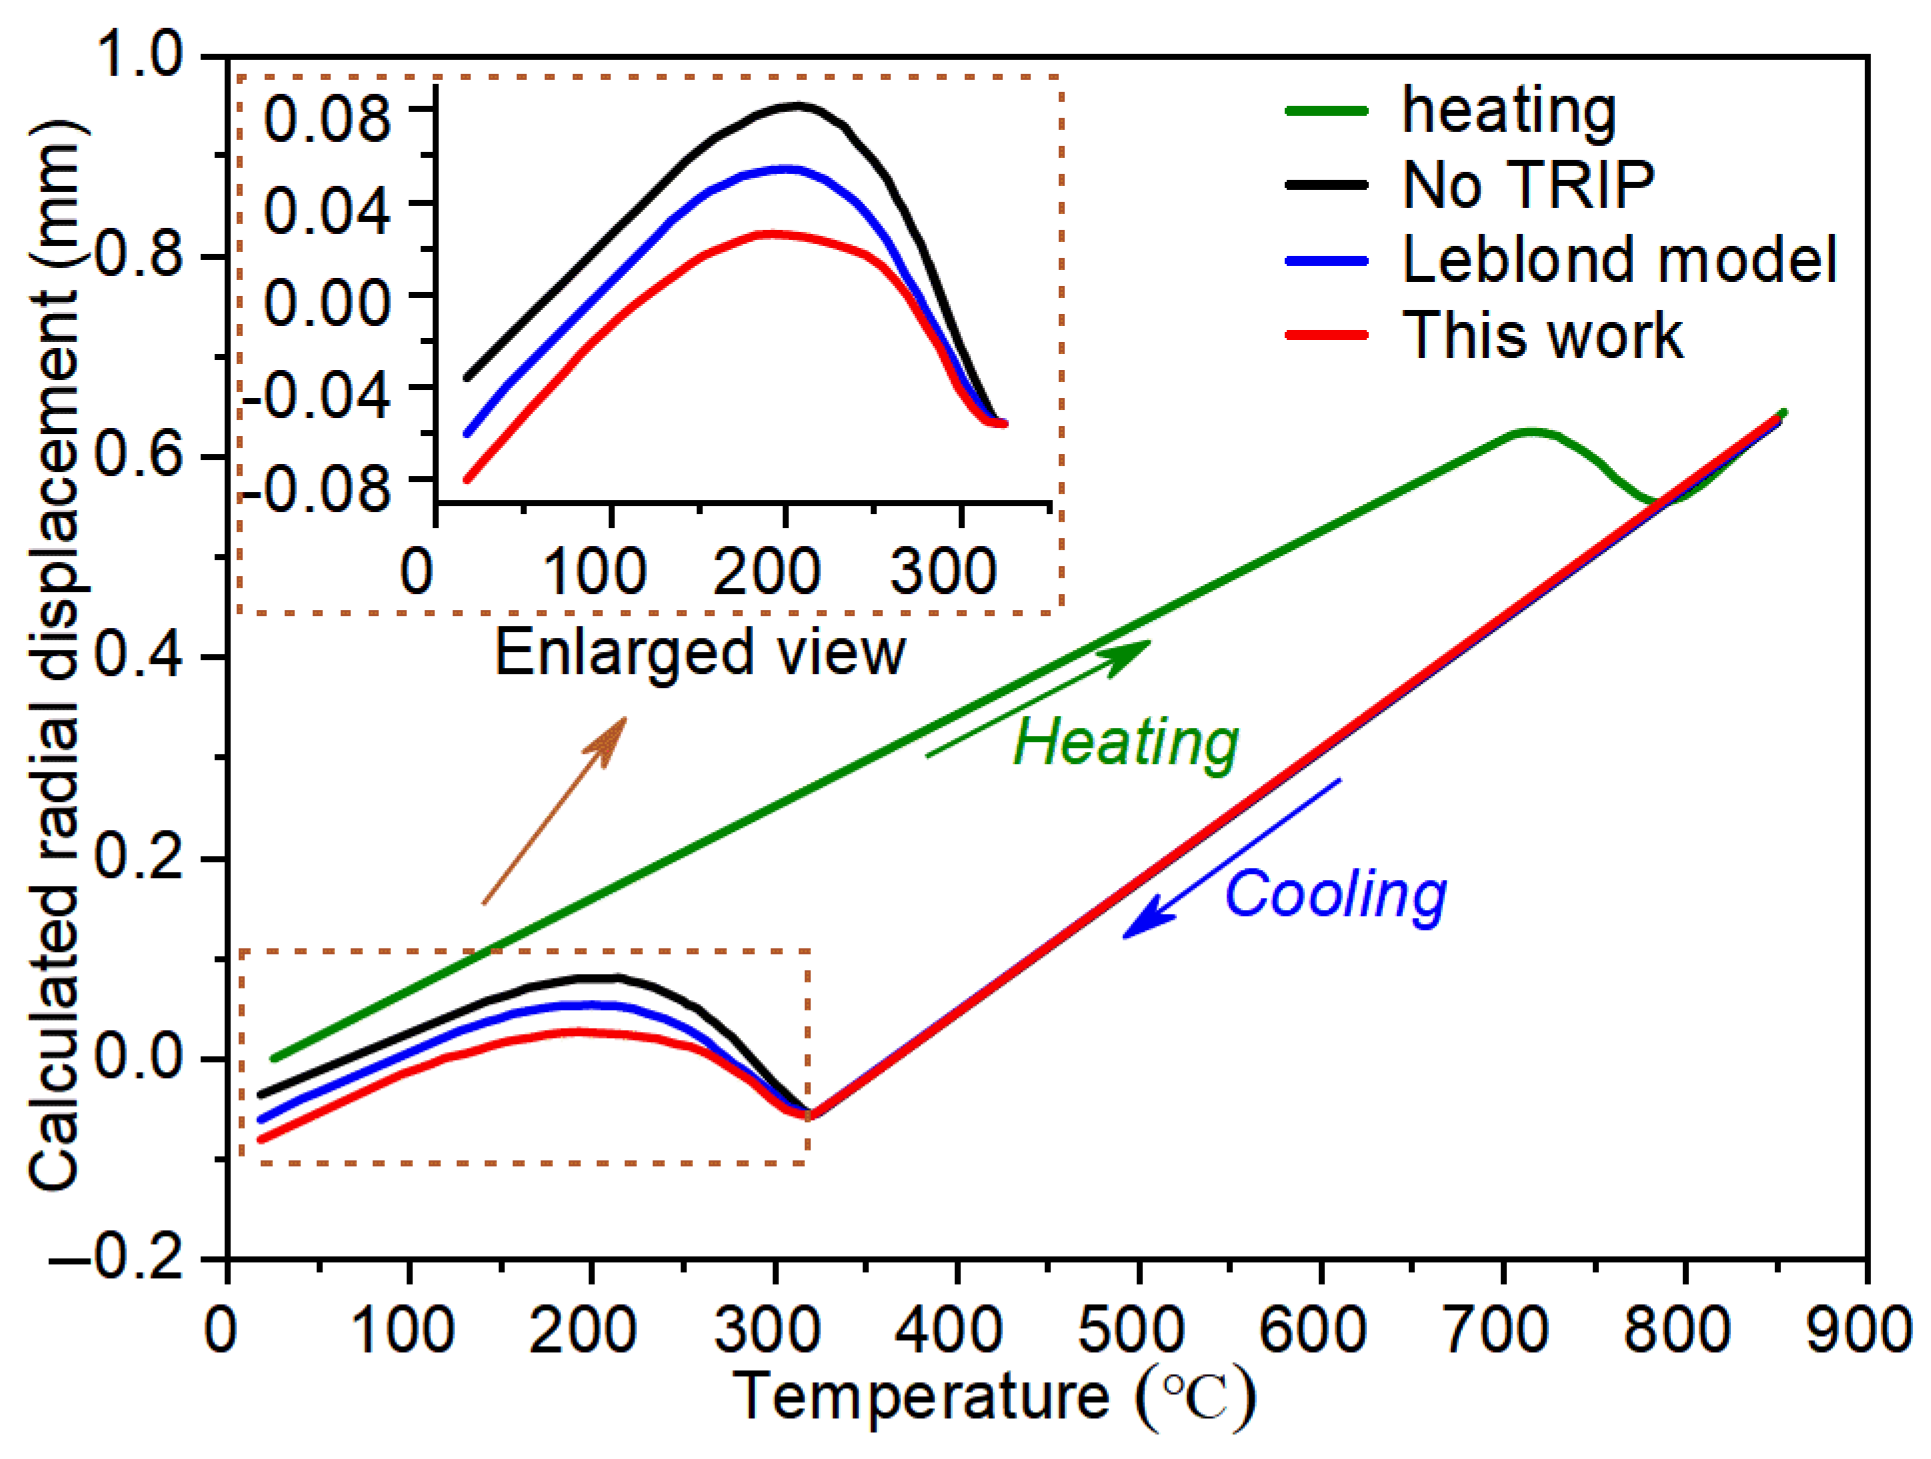
4.4. Dilatation Data Calculated Using Different TRIP Models
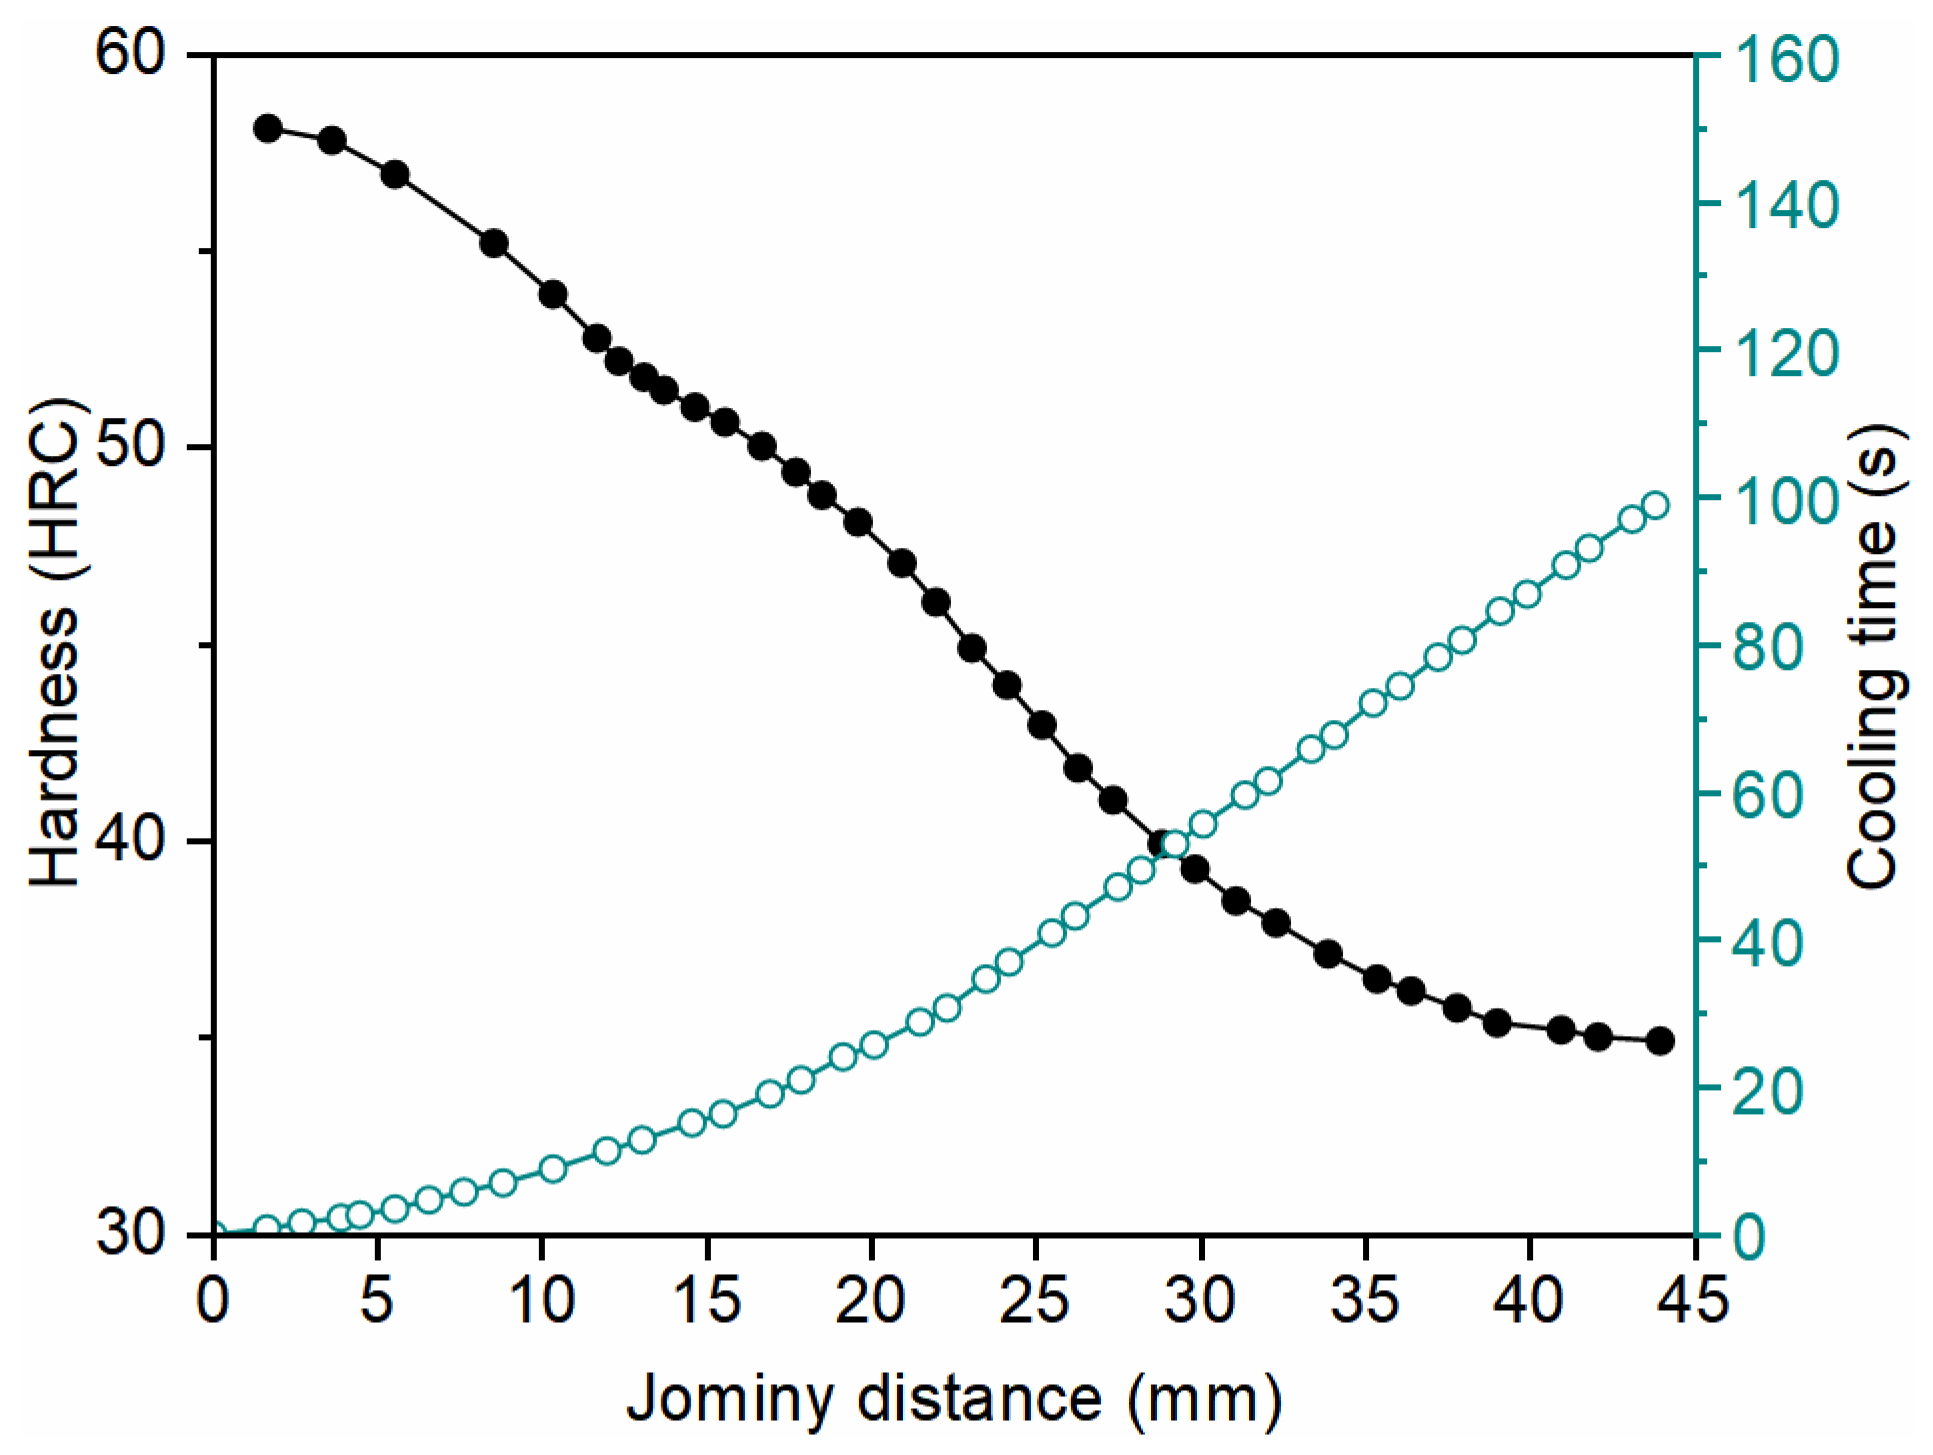
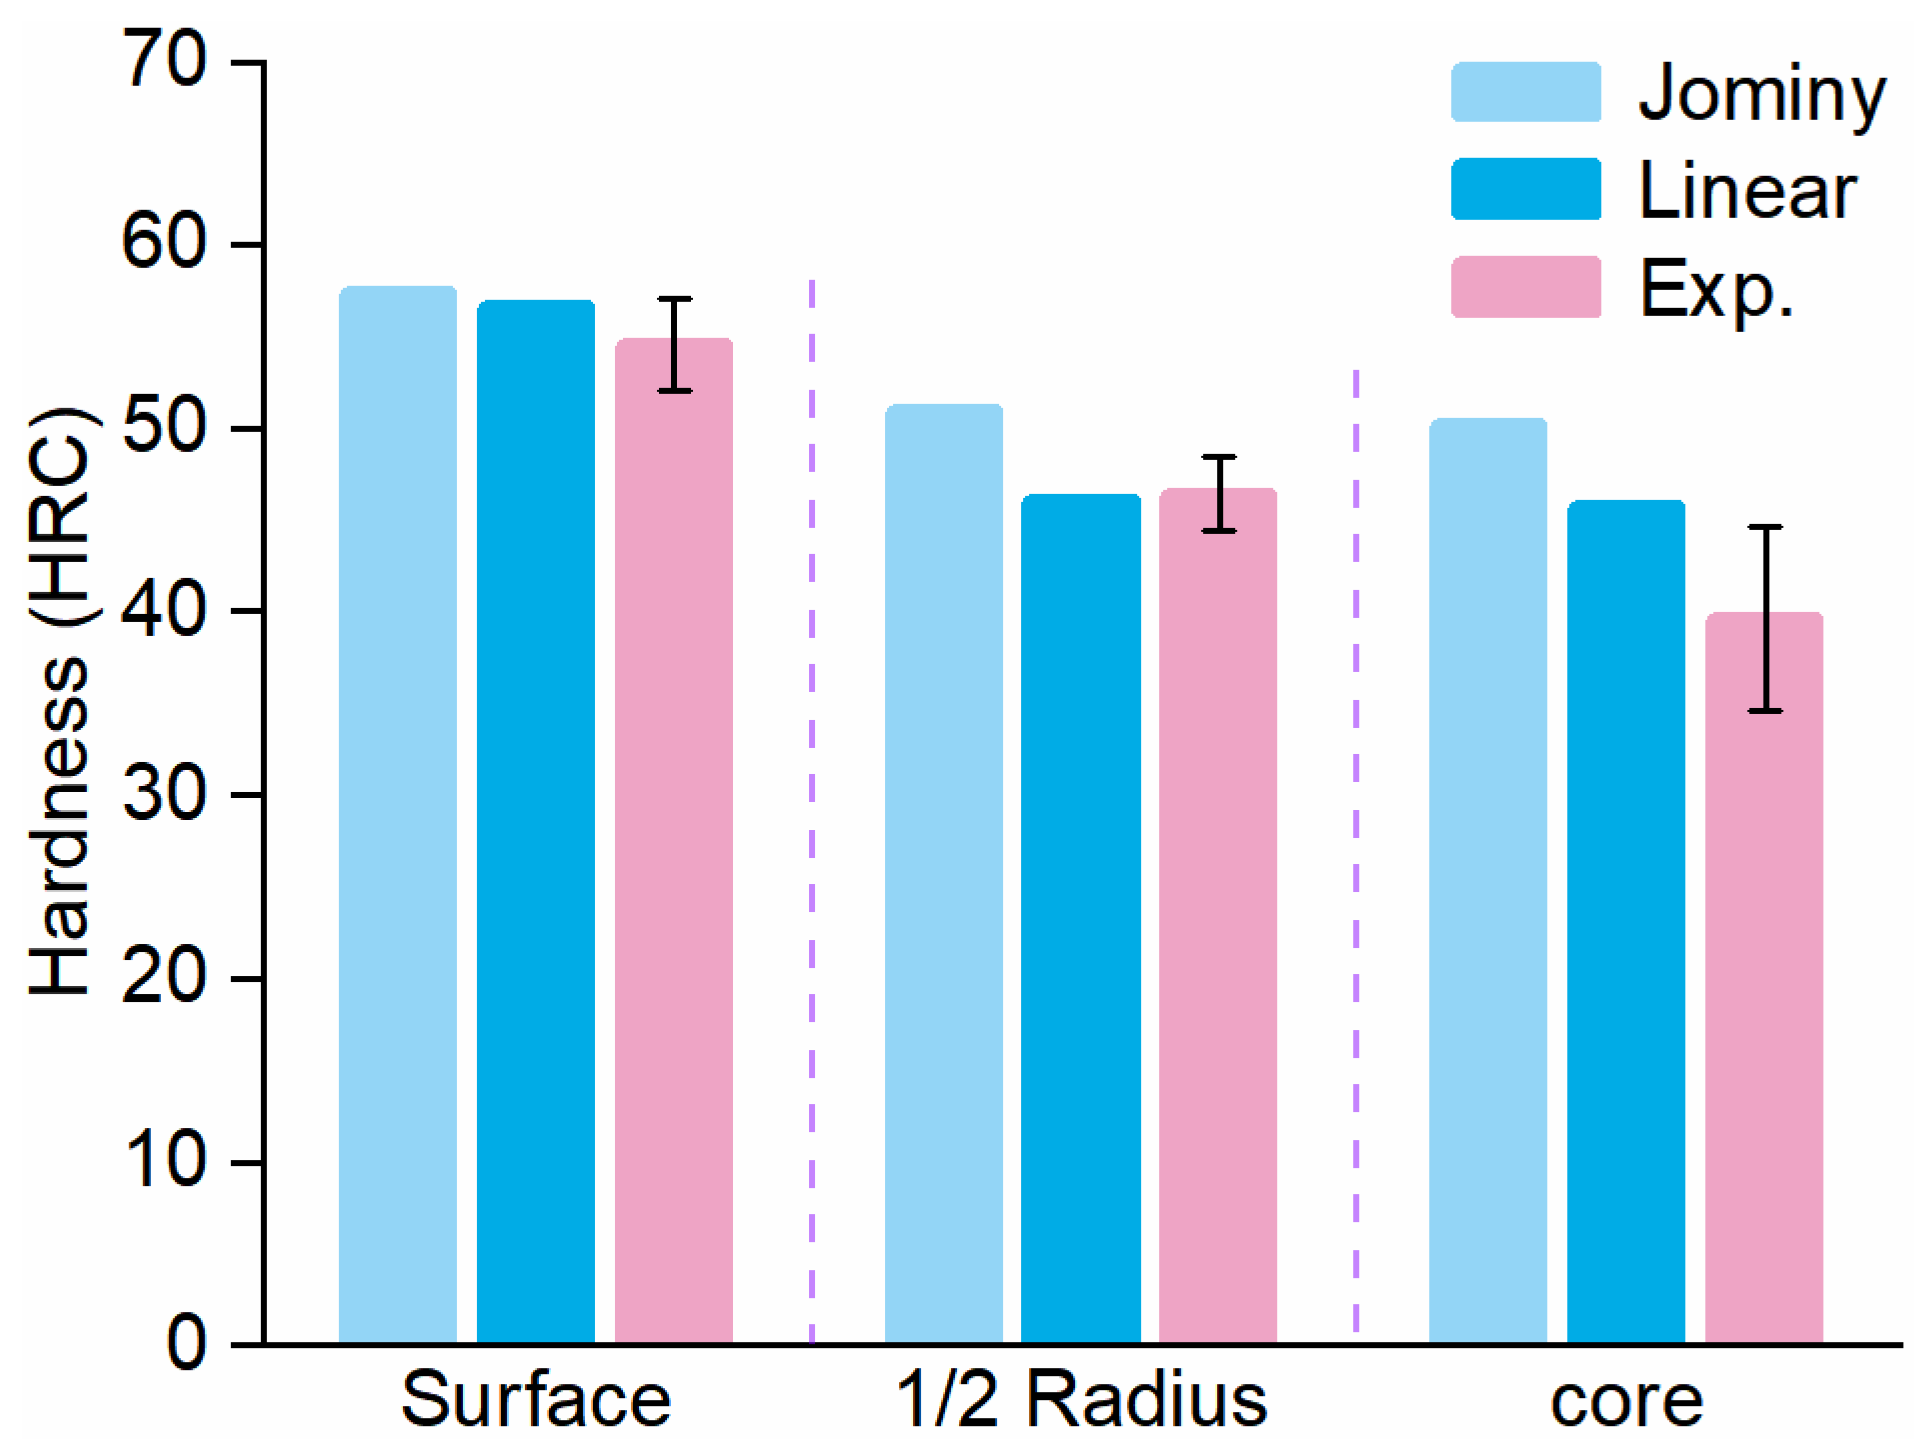
4.5. Hardness Prediction
5. Conclusions
- Although the TRIP model has a minimal influence on the locations of the maximum axial tensile and compressive residual stresses, it has a significant impact on the magnitudes of these stresses.
- The finite element simulation with the TRIP model proposed in this work more accurately predicts the residual stress distribution after quenching. The CE values of the TRIP model proposed in this work for axial and hoop residual stress are 2.551 and 0.321.
- The transformation-induced plasticity (TRIP) must be incorporated in the finite element model when predicting the residual stress after quenching.
- The improvement of the U_LTS model lies in its incorporation of the influence of back stress on the direction of plastic flow, allowing for a more accurate representation of transformation-induced plasticity kinetics than the Leblond model.
- The linear mixture law demonstrates satisfactory performance in hardness calculations, while the accuracy of the Jominy hardenability curve method in hardness prediction is inherently dependent on the precision of experimental data.
Author Contributions
Funding
Data Availability Statement
Conflicts of Interest
References
- Kang, J.; Pottore, N.S.; Zhu, H.; Tasan, C.C. An in Situ Investigation of Neighborhood Effects in a Ferrite-Containing Quenching and Partitioning Steel: Mechanical Stability, Strain Partitioning, and Damage. Acta Mater. 2023, 254, 118985. [Google Scholar] [CrossRef]
- Hou, Y.; Lee, M.-G.; Lin, J.; Min, J. Experimental Characterization and Modeling of Complex Anisotropic Hardening in Quenching and Partitioning (Q&P) Steel Subject to Biaxial Non-Proportional Loadings. Int. J. Plast. 2022, 156, 103347. [Google Scholar] [CrossRef]
- Ribamar, G.G.; Escobar, J.D.; Kwiatkowski Da Silva, A.; Schell, N.; Ávila, J.A.; Nishikawa, A.S.; Oliveira, J.P.; Goldenstein, H. Austenite Carbon Enrichment and Decomposition during Quenching and Tempering of High Silicon High Carbon Bearing Steel. Acta Mater. 2023, 247, 118742. [Google Scholar] [CrossRef]
- Tkachev, E.; Borisov, S.; Belyakov, A.; Kniaziuk, T.; Vagina, O.; Gaidar, S.; Kaibyshev, R. Effect of Quenching and Tempering on Structure and Mechanical Properties of a Low-Alloy 0.25C Steel. Mater. Sci. Eng. A 2023, 868, 144757. [Google Scholar] [CrossRef]
- Li, Y.; Jiang, Z.; Wang, P.; Li, D.; Li, Y. Effect of a Modified Quenching on Impact Toughness of 52100 Bearing Steels. J. Mater. Sci. Technol. 2023, 160, 96–108. [Google Scholar] [CrossRef]
- Jung, M.; Kang, M.; Lee, Y.-K. Finite-Element Simulation of Quenching Incorporating Improved Transformation Kinetics in a Plain Medium-Carbon Steel. Acta Mater. 2012, 60, 525–536. [Google Scholar] [CrossRef]
- Lee, S.-J.; Lee, Y.-K. Finite Element Simulation of Quench Distortion in a Low-Alloy Steel Incorporating Transformation Kinetics. Acta Mater. 2008, 56, 1482–1490. [Google Scholar] [CrossRef]
- Kang, S.-H.; Im, Y.-T. Three-Dimensional Thermo-Elastic–Plastic Finite Element Modeling of Quenching Process of Plain-Carbon Steel in Couple with Phase Transformation. Int. J. Mech. Sci. 2007, 49, 423–439. [Google Scholar] [CrossRef]
- Şimşir, C.; Gür, C.H. 3D FEM Simulation of Steel Quenching and Investigation of the Effect of Asymmetric Geometry on Residual Stress Distribution. J. Mater. Process. Tech. 2008, 207, 211–221. [Google Scholar] [CrossRef]
- Sugianto, A.; Narazaki, M.; Kogawara, M.; Shirayori, A.; Kim, S.-Y.; Kubota, S. Numerical Simulation and Experimental Verification of Carburizing-Quenching Process of SCr420H Steel Helical Gear. J. Mater. Process. Tech. 2009, 209, 3597–3609. [Google Scholar] [CrossRef]
- Savaria, V.; Monajati, H.; Bridier, F.; Bocher, P. Measurement and Correction of Residual Stress Gradients in Aeronautical Gears after Various Induction Surface Hardening Treatments. J. Mater. Process. Tech. 2015, 220, 113–123. [Google Scholar] [CrossRef]
- Farivar, H.; Prahl, U.; Hans, M.; Bleck, W. Microstructural Adjustment of Carburized Steel Components towards Reducing the Quenching-Induced Distortion. J. Mater. Process. Tech. 2019, 264, 313–327. [Google Scholar] [CrossRef]
- Wołowiec-Korecka, E. Modeling Methods for Gas Quenching, Low-Pressure Carburizing and Low-Pressure Nitriding. Eng. Struct. 2018, 177, 489–505. [Google Scholar] [CrossRef]
- Ferro, P.; Bonollo, F. Modelling of the Carburizing and Quenching Process Applied to Caterpillar Track Bushings. Model. Simul. Mater. Sci. Eng. 2014, 22, 025019. [Google Scholar] [CrossRef]
- Zhang, Y.; Wang, G.; Shi, W.; Yang, L.; Li, Z. Optimization of Process Parameters for the Axial Distortion and Distortion Range During Die Quenching of a Spiral Bevel Gear. J. Mater. Eng. Perform. 2018, 27, 3803–3811. [Google Scholar] [CrossRef]
- Chen, X.; Zhang, S.; Rolfe, B.; Li, D. The FEM Simulation and Experiment of Quenching Distortion of a U-Shape Sample and the Sensitivity Analysis of Material Properties. Mater. Res. Express 2019, 6, 116539. [Google Scholar] [CrossRef]
- Sugianto, A.; Narazaki, M.; Kogawara, M.; Kim, S.Y.; Kubota, S. Distortion Analysis of Axial Contraction of Carburized-Quenched Helical Gear. J. Mater. Eng. Perform. 2010, 19, 194–206. [Google Scholar] [CrossRef]
- Li, Z.; Ferguson, B.L.; Nemkov, V.; Goldstein, R.; Jackowski, J.; Fett, G. Effect of Quenching Rate on Distortion and Residual Stresses During Induction Hardening of a Full-Float Truck Axle Shaft. J. Mater. Eng. Perform. 2014, 23, 4170–4180. [Google Scholar] [CrossRef]
- Lee, S.J.; Matlock, D.K.; Van Tyne, C.J. Comparison of Two Finite Element Simulation Codes Used to Model the Carburizing of Steel. Comp. Mater. Sci. 2013, 68, 47–54. [Google Scholar] [CrossRef]
- Hoang, A.T.; Nguyen, X.P.; Khalaf, O.I.; Tran, T.X.; Chau, M.Q.; Dong, T.M.H.; Nguyen, D.N. Thermodynamic Simulation on the Change in Phase for Carburizing Process. Comput. Mater. Contin. 2021, 68, 1129–1145. [Google Scholar] [CrossRef]
- Kim, D.-W.; Cho, H.-H.; Lee, W.-B.; Cho, K.T.; Cho, Y.-G.; Kim, S.-J.; Han, H.N. A Finite Element Simulation for Carburizing Heat Treatment of Automotive Gear Ring Incorporating Transformation Plasticity. Mater. Design 2016, 99, 243–253. [Google Scholar] [CrossRef]
- Zhong, H.; Wang, Z.; Gan, J.; Wang, X.; Yang, Y.; He, J.; Wei, T.; Qin, X. Numerical Simulation of Martensitic Transformation Plasticity of 42CrMo Steel Based on Spot Continual Induction Hardening Model. Surf. Coat. Technol. 2020, 385, 125428. [Google Scholar] [CrossRef]
- Li, J.; Xu, Y.; Liu, Y. Influence of Initial Yield Strength Weighting on Residual Stresses in Quenched Cylinders Using Finite Element Analysis. Materials 2024, 17, 5833. [Google Scholar] [CrossRef]
- Sugianto, A.; Narazaki, M.; Kogawara, M.; Shirayori, A. A Comparative Study on Determination Method of Heat Transfer Coefficient Using Inverse Heat Transfer and Iterative Modification. J. Mater. Process. Technol. 2009, 209, 4627–4632. [Google Scholar] [CrossRef]
- Lee, S.J.; Van Tyne, C.J. A Kinetics Model for Martensite Transformation in Plain Carbon and Low-Alloyed Steels. Metall. Mater. Trans. A 2012, 43, 422–427. [Google Scholar] [CrossRef]
- Liu, Y.; Qin, S.; Hao, Q.; Chen, N.; Zuo, X.; Rong, Y. Finite Element Simulation and Experimental Verification of Internal Stress of Quenched AISI 4140 Cylinders. Met. Mat. Trans. A 2017, 48, 1402–1413. [Google Scholar] [CrossRef]
- Pietzsch, R.; Brzoza, M.; Kaymak, Y.; Specht, E.; Bertram, A. Minimizing the Distortion of Steel Profiles by Controlled Cooling. Steel Res. Int. 2005, 76, 399–407. [Google Scholar] [CrossRef]
- Zhang, Y.; Wang, G.; Shi, W.; Yang, L.; Li, Z. Modeling and Analysis of Deformation for Spiral Bevel Gear in Die Quenching Based on the Hardenability Variation. J. Mater. Eng. Perform. 2017, 26, 3034–3047. [Google Scholar] [CrossRef]
- Liu, Y.; Qin, S.; Zhang, J.; Wang, Y.; Rong, Y.; Zuo, X.; Chen, N. Influence of Transformation Plasticity on the Distribution of Internal Stress in Three Water-Quenched Cylinders. Met. Mat. Trans. A 2017, 48, 4943–4956. [Google Scholar] [CrossRef]
- Denis, S.; Simon, A.; Beck, G. Estimation of the effect of stress/phase transformation interaction when calculating internal stress during martensitic quenching of steel. Trans. Iron Steel Inst. Jpn. 1982, 22, 504–513. [Google Scholar] [CrossRef]
- Rammerstorfer, F.G.; Fischer, D.F.; Mitter, W.; Bathe, K.J.; Snyder, M.D. On Thermo-Elastic-Plastic Analysis of Heat-Treatment Processes Including Creep and Phase Changes. Comput. Struct. 1981, 13, 771–779. [Google Scholar] [CrossRef]
- Taleb, L. Experimental Analysis of Transformation Plasticity. Int. J. Plast. 2001, 17, 1–20. [Google Scholar] [CrossRef]
- EN15305; Non-Destructive Testing—Test Method for Residual Stress Analysis by X-Ray Diffraction. CEN: Brussel, Belgium, 2008.
- Kang, D.T.; Zhang, H. Research on the distribution of residual stress along the cross-section of the workpiece in quenched and tempered large shafts. Trans. Met. Heat Treat 1983, 4, 61–77. [Google Scholar]
- Mottet, G. Mathematical Models of Anisothermal Phase Transformations in Steels, and Predicted Plastic Behaviour. Mater. Sci. Technol. 1985, 1, 815–822. [Google Scholar]
- Kakhki, M.E.; Kermanpur, A.; Golozar, M.A. Numerical Simulation of Continuous Cooling of a Low Alloy Steel to Predict Microstructure and Hardness. Model. Simul. Mater. Sci. Eng. 2009, 17, 045007. [Google Scholar] [CrossRef]
- Vander Voort, G.F. Atlas of Time-Temperature Diagrams for Irons and Steels; ASM International: Materials Park, OH, USA, 1991; p. 140. [Google Scholar]
- Kirkaldy, J.S.; Venugopalan, D. Phase Transformation in Ferrous Alloys; Marder, A.R., Goldstein, J.I., Eds.; TMS-AIME: Warrendale, PA, USA, 1984; pp. 126–147. [Google Scholar]
- Lee, Y.K. Effects of Nitrogen on γ→ε Martensitic Transformation and Damping Capacity of Fe-16% Mn-X% N Alloys. J. Mater. Sci. Lett. 2002, 21, 1149–1151. [Google Scholar] [CrossRef]
- Fanfoni, M.; Tomellini, M. The Johnson-Mehl-Avrami-Kohnogorov Model: A Brief Review. Nouv. Cim. D 1998, 20, 1171–1182. [Google Scholar] [CrossRef]
- Leblond, J.B.; Devaux, J.; Devaux, J.C. Mathematical Modelling of Transformation Plasticity in Steels I: Case of Ideal-Plastic Phases. Int. J. Plast. 1989, 5, 551–572. [Google Scholar] [CrossRef]
- Koistinen, D.P.; Marburger, R.E. A general equation prescribing extend of austenite-martensite transformation in pure Fe-C alloys and plain carbon steels. Acta Metall. 1959, 7, 59–60. [Google Scholar] [CrossRef]
- Li, J.; Xu, Y.; Liu, Y.; He, H. Investigation of Non-Uniformity of Temperature Distribution and Phase Transformation in Spiral Bevel Gears during Carburizing and Quenching. J. Mater. Sci. 2024, 59, 609–630. [Google Scholar] [CrossRef]
- Denis, S.; Sjöström, S.; Simon, A. Coupled Temperature, Stress, Phase Transformation Calculation. Met. Trans. A 1987, 18, 1203–1212. [Google Scholar] [CrossRef]
- Houlsby, G.; Puzrin, A. Principles of Hyperplasticity; Springer: London, UK, 2007; pp. 13–33. [Google Scholar]
- Leblond, J.B.; Mottet, G.; Devaux, J.C. A Theoretical and Numerical Approach to the Plastic Behaviour of Steels during Phase Transformations—I. Derivation of General Relations. J. Mech. Phys. Solids 1986, 34, 395–409. [Google Scholar] [CrossRef]
- Ju, D.; Zhang, W.M.; Zhang, Y. Modeling and Experimental Verification of Martensitic Transformation Plastic Behavior in Carbon Steel for Quenching Process. Mater. Sci. Eng. A 2006, 438–440, 246–250. [Google Scholar] [CrossRef]
- Tong, D.; Gu, J.; Totten, G.E. Numerical Investigation of Asynchronous Dual-Frequency Induction Hardening of Spur Gear. Int. J. Mech. Sci. 2018, 142–143, 1–9. [Google Scholar] [CrossRef]
- Fasano, A.; Hömberg, D.; Panizzi, L. A Mathematical Model for Case Hardening of Steel. Math. Models Methods Appl. Sci. 2009, 19, 2101–2126. [Google Scholar] [CrossRef]
- Kang, S.-H.; Im, Y.-T. Finite Element Investigation of Multi-Phase Transformation within Carburized Carbon Steel. J. Mater. Process. Tech. 2007, 183, 241–248. [Google Scholar] [CrossRef]
- Fischer, F.D.; Reisner, G.; Werner, E.; Tanaka, K.; Cailletaud, G.; Antretter, T. A New View on Transformation Induced Plasticity (TRIP). Int. J. Plasticity 2000, 16, 723–748. [Google Scholar] [CrossRef]
- Fischer, F.D.; Sun, Q.P.; Tanaka, K. Transformation-induced plasticity (TRIP). Appl. Mech. Rev. 1996, 49, 317–364. [Google Scholar] [CrossRef]
- Taleb, L.; Duchaussoy, A.; Jimenez, J. Transformation Induced Plasticity in Ferritic Steels: New Experiments and Updated Modeling. Int. J. Plast. 2023, 171, 103775. [Google Scholar] [CrossRef]
- Maynier, P.; Jungmann, B.; Dollet, J. Creusot-Loire System for the Prediction of the Mechanical Properties of Low Alloy Steel Products. In Hardenability Concepts with Applications to Steel; Doane, D.V., Kirkaldy, J.S., Eds.; Metallurgical Society of AIME: San Ramon, CA, USA, 1978; pp. 518–545. [Google Scholar]
- Ivanov, D.; Markegard, L. Stress relaxation by transformation plasticity under the martensitic transformation in steels. HTM J. Heat Treat. Mater. 2016, 71, 99–104. [Google Scholar] [CrossRef]


| Temperature (°C) | ρ (kg/m3) | Cp (J/(kg·K)) | k (W/(m·K)) | ||||||
|---|---|---|---|---|---|---|---|---|---|
| A * | B * | M * | A | B | M | A | B | M | |
| 100 | 7900 | 7850 | 7800 | 594 | 488 | 594 | 27 | 43 | 27 |
| 200 | 594 | 523 | 594 | 27 | 40 | 27 | |||
| 300 | 594 | 566 | 594 | 27 | 38 | 27 | |||
| 400 | 594 | 617 | 594 | 27 | 36 | 27 | |||
| 500 | 594 | 684 | 594 | 27 | 34 | 27 | |||
| 600 | 594 | 781 | 594 | 27 | 33 | 27 | |||
| 700 | 594 | 594 | 27 | 32 | 27 | ||||
| 800 | 594 | 594 | 27 | 32 | 27 | ||||
| 900 | 605 | 605 | 28 | 32 | 27 | ||||
| Temperature (°C) | E (GPa) | Initial Yield Strength (MPa) | h (GPa) | Poisson’s Ratio | ||||
|---|---|---|---|---|---|---|---|---|
| A * | B 1 * | M 1 * | A | B | M | A, B, M | A, B, M | |
| 0 | 200 | 210 | 200 | 190 | 440 | 1600 | 8.47 | 0.3 |
| 300 | 175 | 193 | 185 | 110 | 330 | 1480 | 10.8 | |
| 600 | 150 | 765 | 168 | 30 | 140 | 1260 | 0.06 | |
| 900 | 124 | 120 | - | 20 | 30 | - | - | |
| Phase | Austenite | Bainite | Martensite |
|---|---|---|---|
| TEC * (10−5 K−1) | 2.25 | 1.3 | 1.15 |
| Model | Expression |
|---|---|
| Abrassart | |
| Desalos | |
| Leblond | |
| Tanaka |
Disclaimer/Publisher’s Note: The statements, opinions and data contained in all publications are solely those of the individual author(s) and contributor(s) and not of MDPI and/or the editor(s). MDPI and/or the editor(s) disclaim responsibility for any injury to people or property resulting from any ideas, methods, instructions or products referred to in the content. |
© 2025 by the authors. Licensee MDPI, Basel, Switzerland. This article is an open access article distributed under the terms and conditions of the Creative Commons Attribution (CC BY) license (https://creativecommons.org/licenses/by/4.0/).
Share and Cite
Li, J.; Xu, Y.; Wang, H.; Liu, Y.; Xu, Y. A Novel Model for Transformation-Induced Plasticity and Its Performance in Predicting Residual Stress in Quenched AISI 4140 Steel Cylinders. Metals 2025, 15, 450. https://doi.org/10.3390/met15040450
Li J, Xu Y, Wang H, Liu Y, Xu Y. A Novel Model for Transformation-Induced Plasticity and Its Performance in Predicting Residual Stress in Quenched AISI 4140 Steel Cylinders. Metals. 2025; 15(4):450. https://doi.org/10.3390/met15040450
Chicago/Turabian StyleLi, Junpeng, Yingqiang Xu, Haiwei Wang, Youwei Liu, and Yanlong Xu. 2025. "A Novel Model for Transformation-Induced Plasticity and Its Performance in Predicting Residual Stress in Quenched AISI 4140 Steel Cylinders" Metals 15, no. 4: 450. https://doi.org/10.3390/met15040450
APA StyleLi, J., Xu, Y., Wang, H., Liu, Y., & Xu, Y. (2025). A Novel Model for Transformation-Induced Plasticity and Its Performance in Predicting Residual Stress in Quenched AISI 4140 Steel Cylinders. Metals, 15(4), 450. https://doi.org/10.3390/met15040450