Abstract
The objective of this study is to develop failure-limit material models for Aluminum 6061-T6, A36 Carbon Steel, 304 Stainless Steel, and Nitronic 60 metals, based on parameters of plastic equivalent strain (failure strain) and stress triaxiality. The research is conducted in two parts. This paper presents Part One of the study. In Part One, custom-designed test specimens undergo controlled uniaxial tension and compression testing at ambient temperature. These tests are performed at quasi-static speeds using Universal Testing Machines (UTMs) in accordance with ASTM E8 and ASTM E9 standards. Experimental data, specifically engineering stress–strain and force–displacement curves, are recorded from the onset of loading until specimen fracture, or in the case of compression tests, until the capacity of the testing machine is reached. In Part Two, the emphasis shifts to the calibration of Finite Element Analysis (FEA) models of the custom-designed test specimens. Plastic equivalent strain and the corresponding stress triaxiality values at failure are extracted from each test specimen for the given metal. These values are then systematically plotted onto a single graph to construct the failure-limit curve, which delineates the boundary conditions for material failure. This approach will facilitate the development of a comprehensive material property definition that correlates plastic equivalent strain with stress triaxiality at failure for Aluminum 6061-T6, A36 Carbon Steel, 304 Stainless Steel, and Nitronic 60 metals.
1. Introduction
Movement, transport, and storage of hazardous materials are common in the United States and require thorough design safety measures before initiation. Structures containing such materials encounter a range of complex stress conditions when subjected to these types of activities. While design safety is often perceived as the total elimination of risks, it is more accurately characterized by the reduction and management of potential hazards. Risks such as accidental drops due to negligent handling, crushing from improper cargo stacking, and environmental factors such as extreme temperatures, represent just a few examples that, if not appropriately assessed, could result in inaccuracies and premature structural failures.
In the nuclear industry, addressing these risks is particularly critical due to the hazardous nature of the materials involved. Metals such as Aluminum 6061-T6, A36 Carbon Steel, 304 Stainless Steel, and Nitronic 60 are commonly used due to their favorable properties, which include high strength, corrosion resistance, and radiation tolerance. These metals are employed in the development of reactor fuels, reactor pressure vessels, piping, and reactor vessel internals. Furthermore, these materials are used in the manufacturing of shipping containers, handling tools, and other components essential for safe and efficient nuclear reactor operation. Ensuring the integrity of these materials through proper design and risk management is vital to prevent structural failures and maintain safety.
Numerous studies have evaluated the structural integrity of transport containers, components, and structures. For instance, Blanton [1] analyzed containers subjected to accidental drops with various impact orientations, determining which scenarios resulted in the greatest damage. Snow et al. [2] initially examined the United States Department of Energy spent fuel container for qualification when subjected to postulated drop events using 304L and 316L metals, then later (Snow et al. [3,4,5,6,7,8]) introduced a strain-based acceptance criterion for inclusion in Section 3 of the ASME Pressure and Boiler Vessel Code.
Additional significant studies contributing to the safe handling and transport of structures, systems, and components (SSCs) include those by Wu et al. [9], Jaksic and Nilsson [10], Aquaro et al. [11], Kim et al. [12], Lin et al. [13], and Oka et al. [14], among others.
These studies examined structures under dynamic loading using conventional engineering methods. While these methods are robust, there remains the potential for premature failure of key components, posing risks of undesirable outcomes and consequences. This concern has been validated by researchers such as Bao and Wierzbicki [15,16,17], who made significant contributions to understanding failure mechanisms. In their studies, Bao and Wierzbicki integrated models such as Gurson’s [18], which describes the nucleation, growth, and coalescence of voids in ductile materials leading to fracture. They also integrated Johnson-Cook [19], which accounts for the effects of strain, strain rate, and temperature on material behavior and is commonly used in high-strain-rate applications such as impact and crash simulations. Additionally, they referenced the Rice–Tracey Model [20], which is focused on the growth of a single void and predicts ductile fracture in metals under triaxial stress. Bao and Wierzbicki concluded that failure mechanisms are diverse and dependent on the type of material system. For instance, the splitting of micro-cracks in brittle heterogeneous materials like concrete, crazing in polymers, and the void nucleation followed by subsequent growth and coalescence in ductile materials are highly sensitive to the state of stress near the fracture zone. Bao and Wierzbicki’s work on stress triaxiality and plastic failure strain has been pivotal in preventing premature material failure. Their research focused on developing criteria to predict the conditions under which materials fail under tension, compression, and complex loadings. They built on the foundational efforts of McClintock [21,22,23], Hancock et al. [24], Thomson and Hancock [25], and Alves and Jones [26]. An aspect of Bao and Wierzbicki’s work proposed establishing a limiting curve based on stress triaxiality and plastic failure strain, below which damage and fracture do not occur. Their research introduced several custom-designed specimens targeting three regions of triaxiality, referred to as negative, low-, and high-stress triaxialities.
Stress triaxiality is defined as the ratio of hydrostatic stress to the equivalent von Mises stress in a material. This value measures the stress state in a material under different loading conditions. Negative triaxiality is associated with compressive hydrostatic stress, where material failure is characterized by shear localization and ductile fracture. Increases in material ductility are observed in this region. Low-stress triaxiality is linked to shear-dominated loading conditions, where shear stress dominates over normal stress. Torsional and other shear-dominating stress states fall within this region. High-stress triaxiality corresponds to tensile hydrostatic stress, often associated with reduced ductility, which is typical in catastrophic failures. These high-stress triaxiality conditions are critical in the design of pressure vessels where catastrophic failures can result in large explosions due to the rapid release of stored energy (pressurized gas or liquid), posing severe risks to safety. Other researchers have also explored material failure linking stress triaxiality and plastic failure strain parameters, including Mirone [27], Yu and Jeong [28], Choung et al. [29], Rodríguez-Millán et al. [30], Kanazawa et al. [31], Brunig et al. [32], Borvik et al. [33], Anderson et al. [34], Huang et al. [35], Li et al. [36], Seidt et al. [37], and Zhang et al. [38].
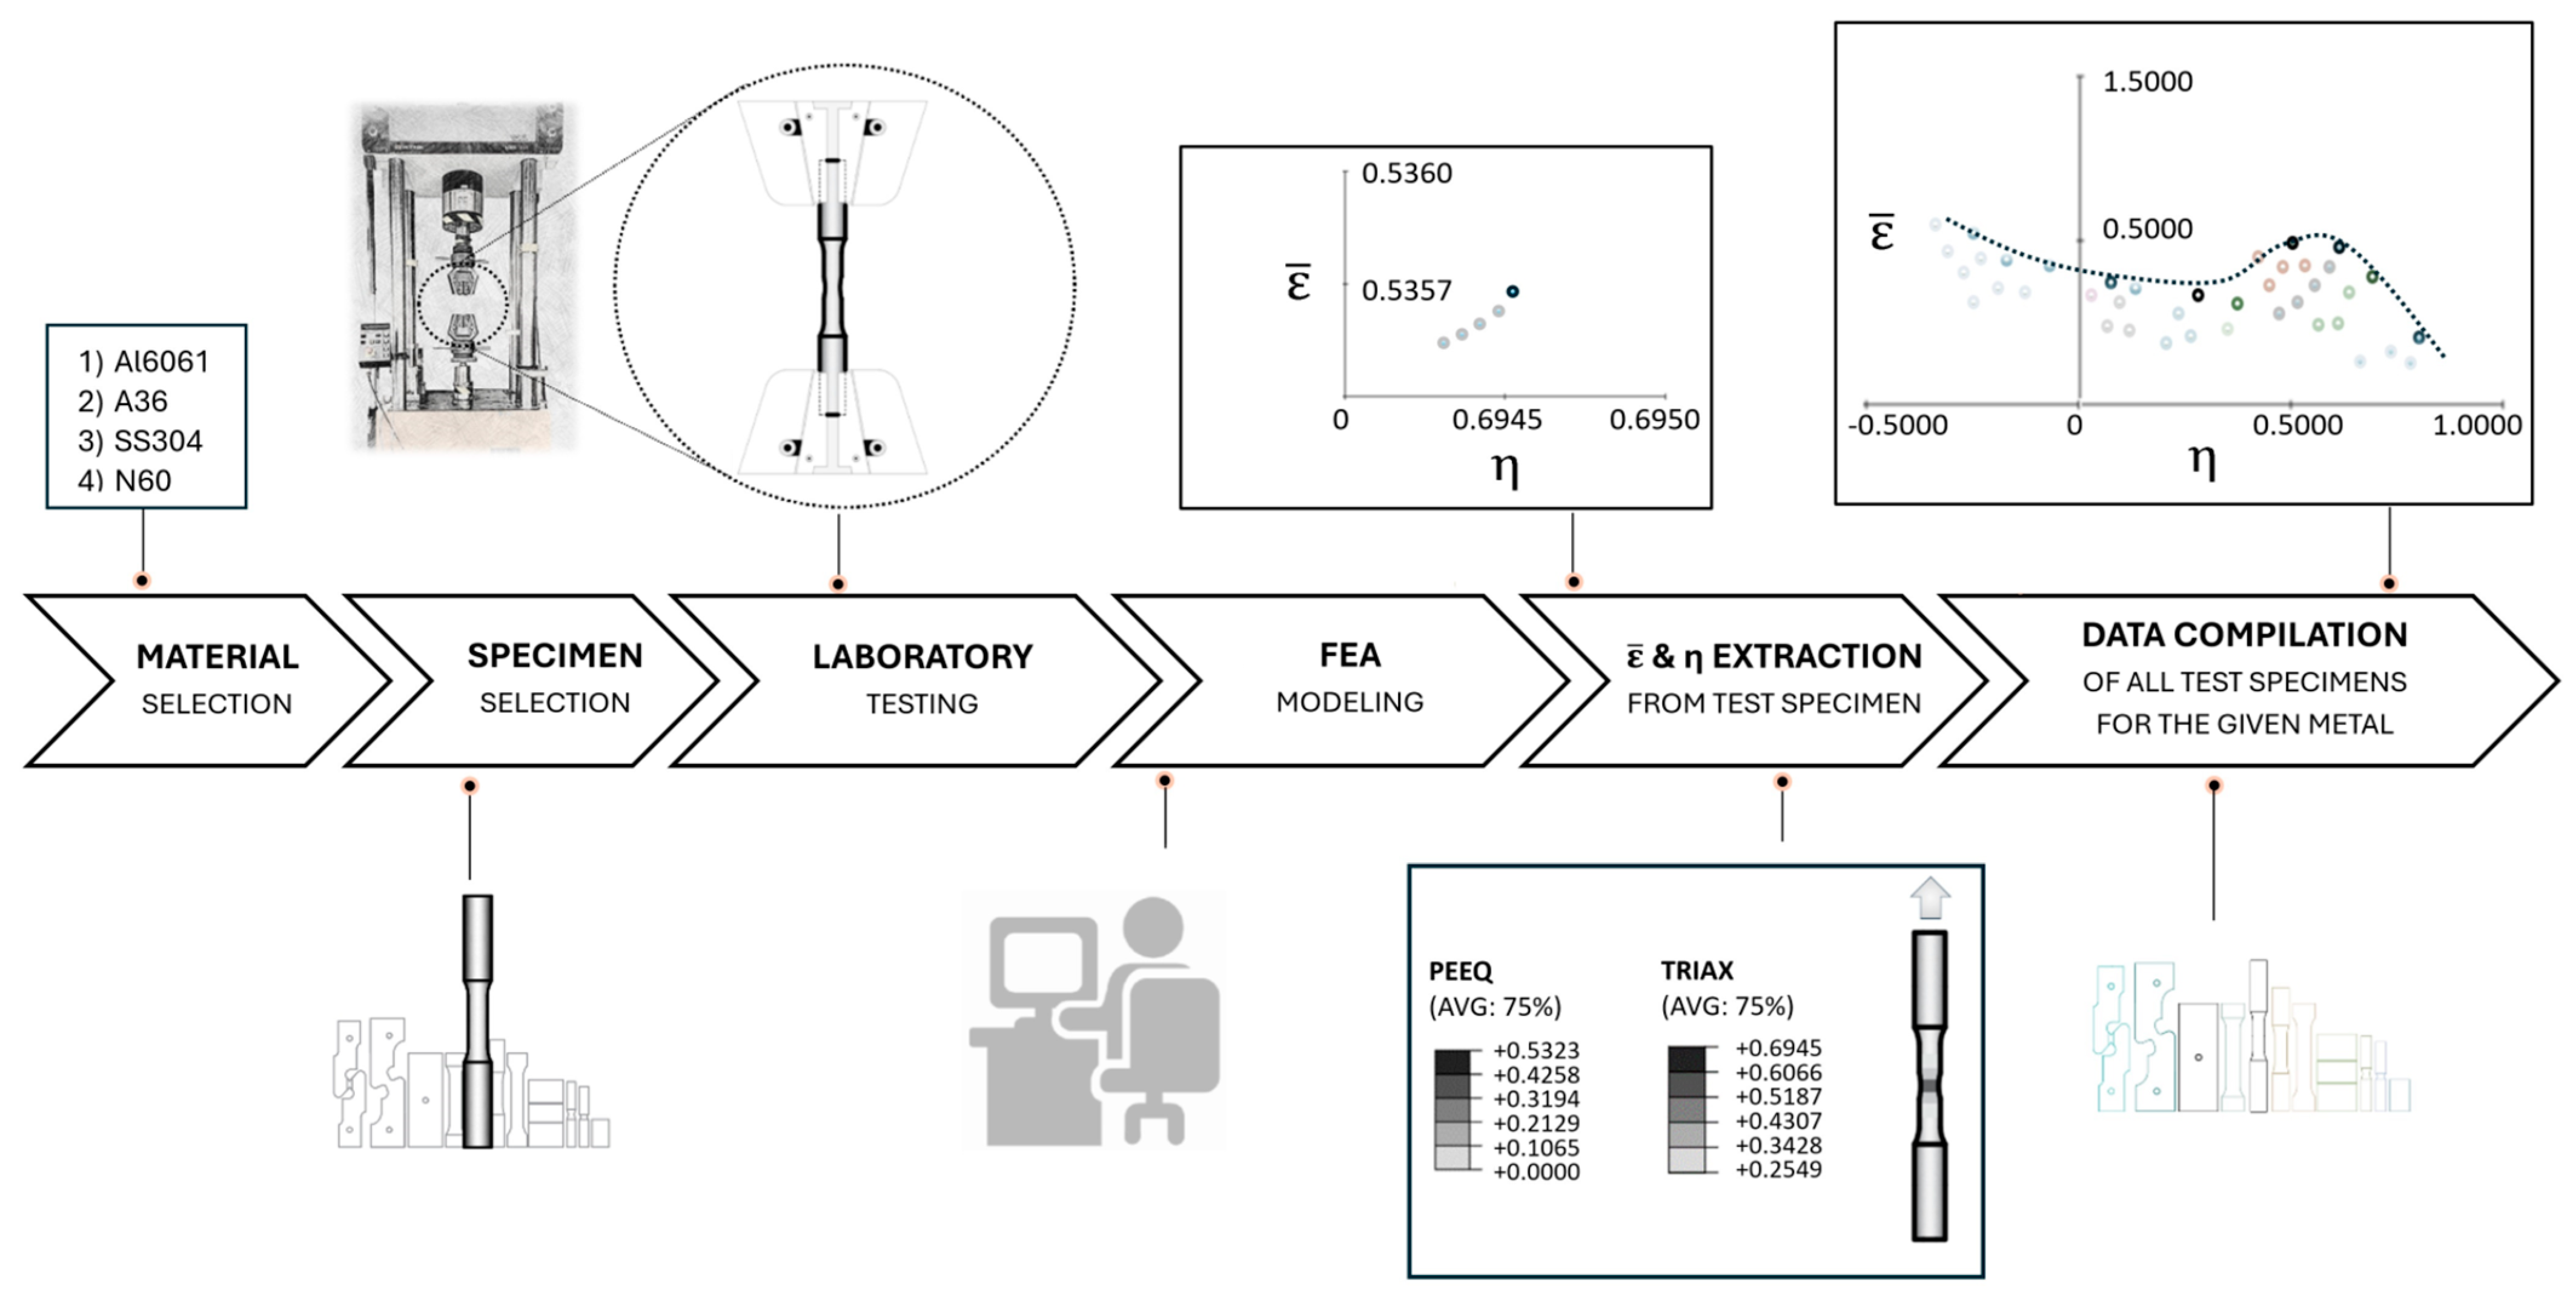
While there have been studies on carbon steels (Kiran, R., & Khandelwal, K. [39]; Cho et al. [40]) and 304 steels (Othmen et al. [41]; Seo et al. [42]; Xing et al. [43]), there has been a gap in the literature regarding N60 steels. Most studies linking failure strain () to triaxiality (η) focused more on aluminum alloys. Additionally, no studies have been found that establish failure-limit curves for each of the metals and stress triaxiality regimes targeted in this study, including Aluminum 6061-T6. Consequently, existing data on the material properties of metals such as A36, 304 Stainless Steel, and Nitronic 60 remain limited. While standard mechanical properties for these materials are widely available through organizations like the American Society for Testing and Materials (ASTM), the American Society of Mechanical Engineers (ASME), and the International Organization for Standardization (ISO), failure-limit curves that account for stress triaxiality and equivalent plastic strain are neither common nor universally standardized. This study is motivated by the absence of failure-limit curves for Aluminum 6061-T6, A36 Carbon Steel, 304 Stainless Steel, and Nitronic 60 metals. The goal of this study is to systematically establish failure-limit curves for the aforementioned metals at ambient temperatures. A combination of experimental, numerical, and analytical methods will be employed as these metals are subjected to failure loads across a range of stress triaxiality regimes. The stress triaxiality regimes will be defined/controlled using test specimens akin to those described by Bao and Wierzbicki [15,16,17], which include compression, shear, combined shear tension, and tension stress states. A graphical abstract of the study is displayed in Figure 1.
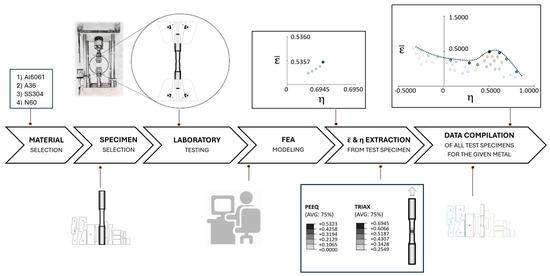
Figure 1.
Graphical abstract.
In Part One, the focus is on material selection, specimen design, and laboratory testing. Specifically, this involves selecting appropriate materials, fabricating test specimens, and conducting controlled laboratory tests to obtain relevant data.
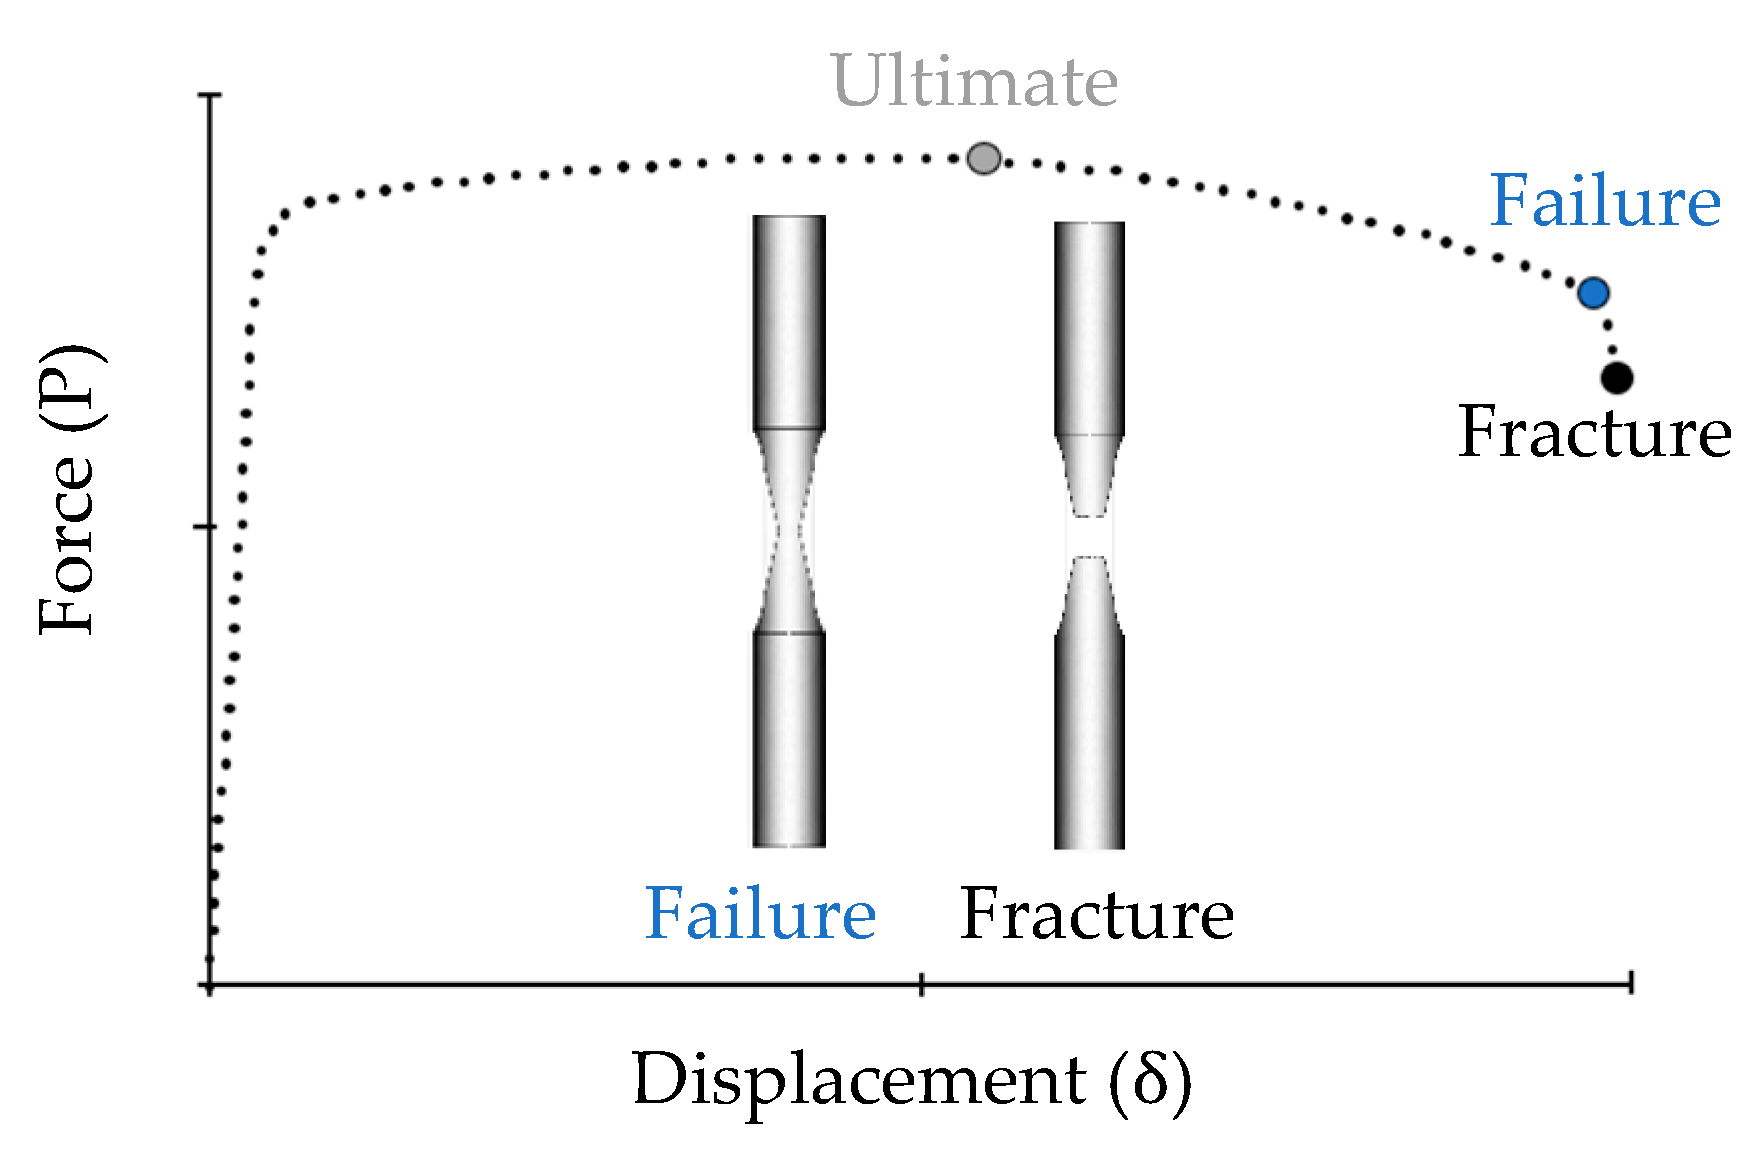
In Part Two, the emphasis shifts to the calibration of Finite Element Analysis (FEA) models of the specimens using ABAQUS software [44]. Plastic failure strain and the corresponding stress triaxiality values are extracted from each test specimen for the given metal. These values are then systematically plotted onto a single graph to construct the failure-limit curve, which delineates the boundary conditions for material failure. This approach will facilitate the development of a comprehensive material property definition that correlates failure strain (plastic equivalent strain) with stress triaxiality for Aluminum 6061-T6, A36 Carbon Steel, 304 Stainless Steel, and Nitronic 60 metals. The failure criterion in the context of metal deformation is often described as the strain at which the material undergoes fracture or catastrophic failure. In the context of this study, “failure” refers to the point where the final load curve slope change occurs that leads to fracture. If an entire cross section suddenly fractured, failure and fracture could occur at the same point. This did not occur in the tests. Rather, a progressive loss of load-carrying capacity led to fracture. In an FEA model, failure can be described as the point where the first element reaches its ultimate plastic equivalent strain (for its triaxiality value) and can no longer carry shear strains (i.e., it reaches failure strain for its triaxiality). After the first element fails, neighboring elements must carry its load, and a progressive loss of load-carrying capacity leads to fracture (similar to the actual test). The failure point is important because it allows for the definition of the limiting plastic equivalent strain at a given triaxiality.
Figure 2 is a typical force–displacement curve obtained from a smooth round bar test specimen of Aluminum 6061-T6, illustrating the distinction between failure and fracture as used in this study. Utilizing the material’s failure point in lieu of the fracture point is conservative, as it will facilitate a curve with a safety margin against fracture.

Figure 2.
Stress–strain curve for the Al6061 round bar test specimen.
2. Experiment Design, Methods, and Materials
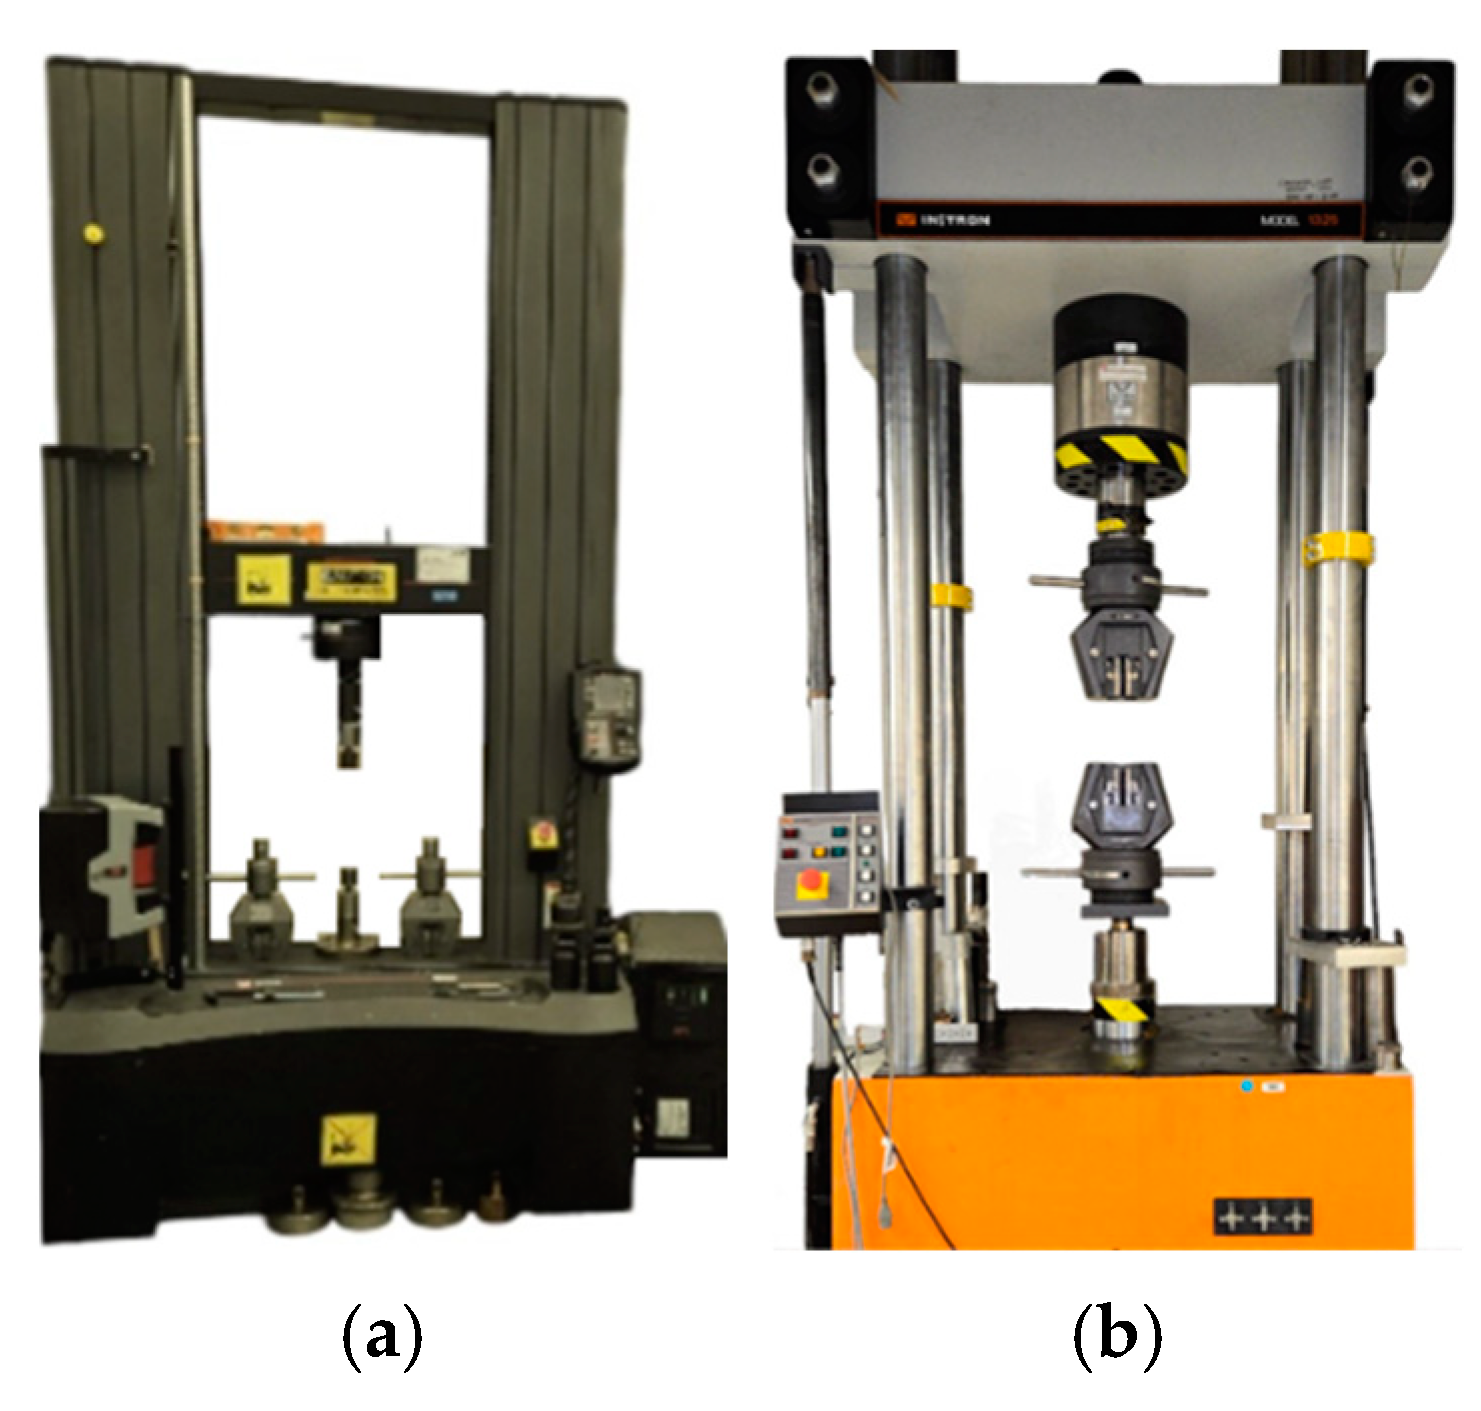
Achieving the desired stress states listed in the introduction necessitates the use of Universal Test Machines (UTMs), see Figure 3. For this study, tests are conducted under conditions that simulate quasi-static speeds and normal ambient environments. An Instron 5982 UTM with a 22,500 lbf (100 kN) load capacity was used to conduct the tension testing. It was equipped with a data acquisition unit and an AVE-2 non-contact video extensometer, which utilizes digital image correlation (DIC) techniques for in-plane strain measurement. Specifications for the AVE-2 unit are provided in Table 1.
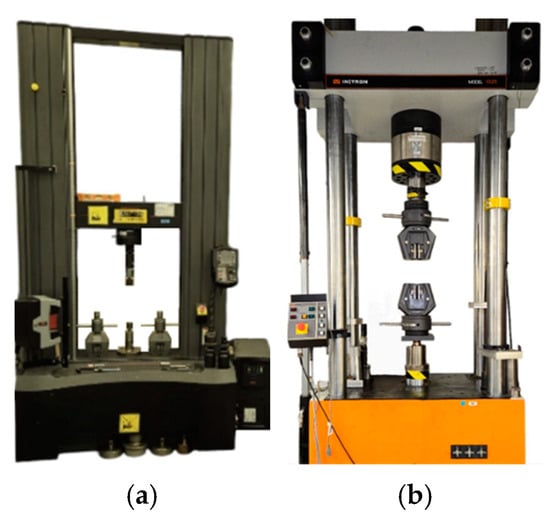
Figure 3.
Laboratory testing equipment: (a) tension testing and (b) compression testing.

Table 1.
AVE-2 video extensometer specifications.
A Nikon D700 camera, with a measurement accuracy (measurement accuracy is based on the camera’s relative position to the test specimen) of ~383 pixels/in (9728 pixels/mm), was utilized to capture out-of-plane movements and shape distortions every five seconds during tests. Tests were conducted at a speed of ~0.0013 in/s (2 mm/min), adjustable to ~0.0079 in/s (12 mm/min) for elongations over 5%, per ASTM E8 (control method C). Quality control was ensured using Bluehill Universal software (version 3.72.4715), with results exported in CSV (comma-separated values) format.
Due to significant load variations between compression and tension tests, a different system was used for the uniaxial compression of the cylindrical specimens. These tests were conducted using an Instron 1325 Universal Testing Machine, a hydraulically driven system with a load capacity of up to 225,000 lbf (1000 kN). Unlike the Instron 5982 UTM used for tensile tests, this unit lacked an AVE unit and data collection capability. The Instron 1325 UTM force–displacement data were manually recorded, with displacement measurements taken from the crosshead position. A Canon EOS 90D camera, with a measurement accuracy (measurement accuracy is based on the camera’s relative position to the test specimen) of ~1122 pixels/in (28,500 pixels/mm), was utilized to capture out-of-plane movements and shape distortions every five to ten seconds during tests. Tests were conducted at a speed of 0.02 in/min (0.508 mm/min) per ASTM E9 for metals at room temperature. The uniaxial tension test [45] and the uniaxial compression test [46] are among the most common methods for determining a material’s stress–strain response. The use of these specific standards allows researchers and engineers to compare material properties reliably and ensure accuracy and consistency on an international scale.
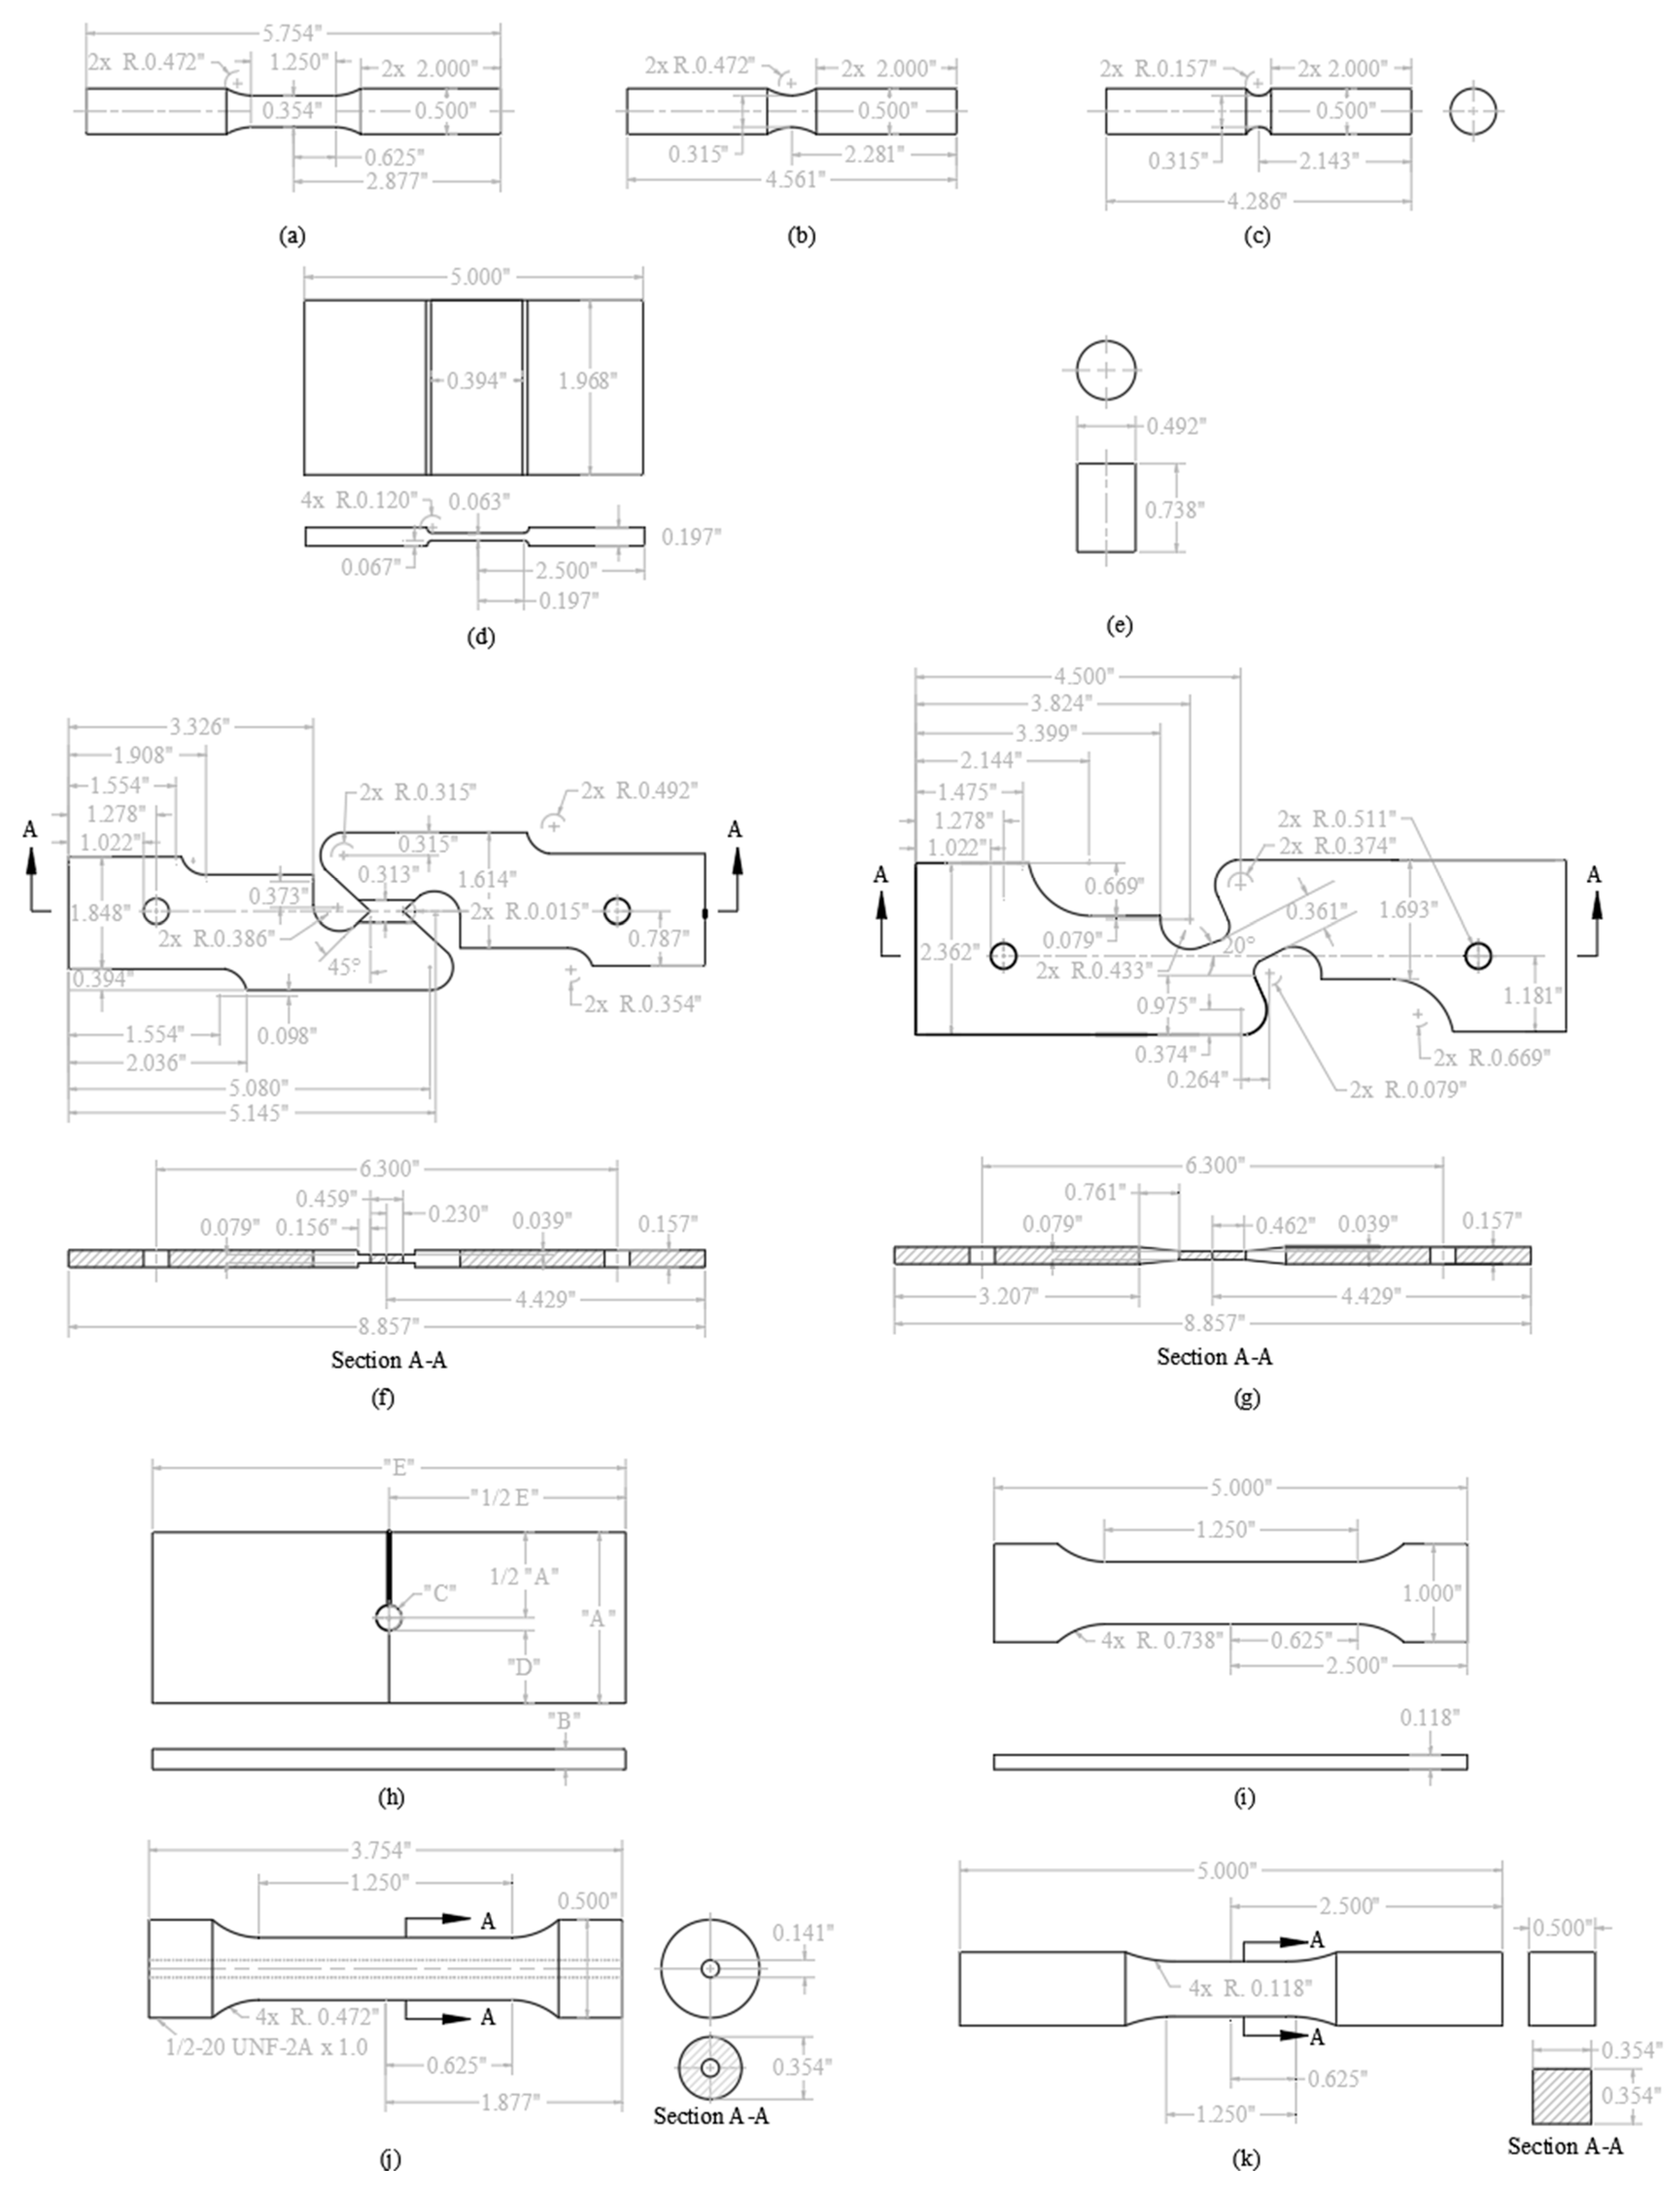
The test specimens used in this research were derived from the studies conducted by Bao and Wierzbicki [15,16,17], Driemeier [47], Li [36], Zhu [48], Fu [49], Roy [50], Yan [51], Ganjiani [52], Nam and Choung [53], and Baruscotti [54]. These researchers selected specific specimen geometries to measure the impact of stress triaxiality on fracture initiation. Their research contributed to the development of ductile fracture initiation models that consider both plastic equivalent strain and stress triaxiality. The specimens were specifically engineered to address a range of complex stress conditions resulting from the types of handling activities mentioned earlier in this paper. These stress conditions include, but are not limited to, compression, shear, combined shear/tension, and tension stress states. The geometric dimensions of these test specimens are illustrated in Figure 4.
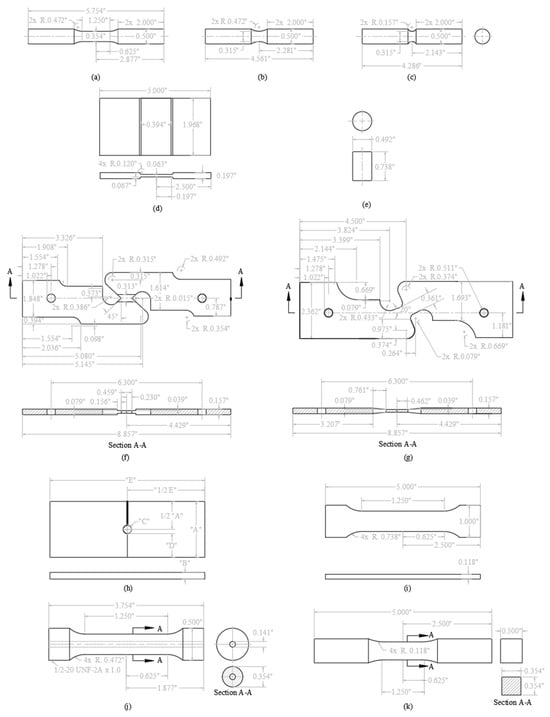
Figure 4.
Test specimens: (a) smooth round bar, (b) large-notched round bar, (c) small-notched round bar, (d) flat groove plate, (e) cylinder, (f) simple shear plate, (g) combined shear/tension plate, (h) perforated plate, (i) dog bone, (j) thick-wall pipe, and (k) square bar (1 in = 25.4 mm).
Table 2 provides a description of the test specimens, including the stress states expected of each, corresponding drawing designations, and a sample of studies that have used similar test specimens. Drawing numbers were assigned to each specimen for the purposes of fabrication and procurement. The drawing numbers were also used to differentiate the specimen datasets. A total of eleven distinct tests were conducted for each of the four metals: Aluminum 6061-T6, A36 Carbon Steel, 304 Stainless Steel, and Nitronic 60.
Table 2.
Test specimens.
Three samples were produced for each test specimen. Each sample was assigned and marked with an identification number (e.g., A-1 for the Aluminum 6061-T6 specimen, sample 1). Prior to testing, the specimens were lightly sprayed with black and white paint to create black-and-white speckle patterns. Using white paint markers, two reference points located at a distance apart (where is the initial gauge length of the specimen) were established to define the gauge length. These patterns and reference points are used to measure surface deformation and strain (see Figure 5).
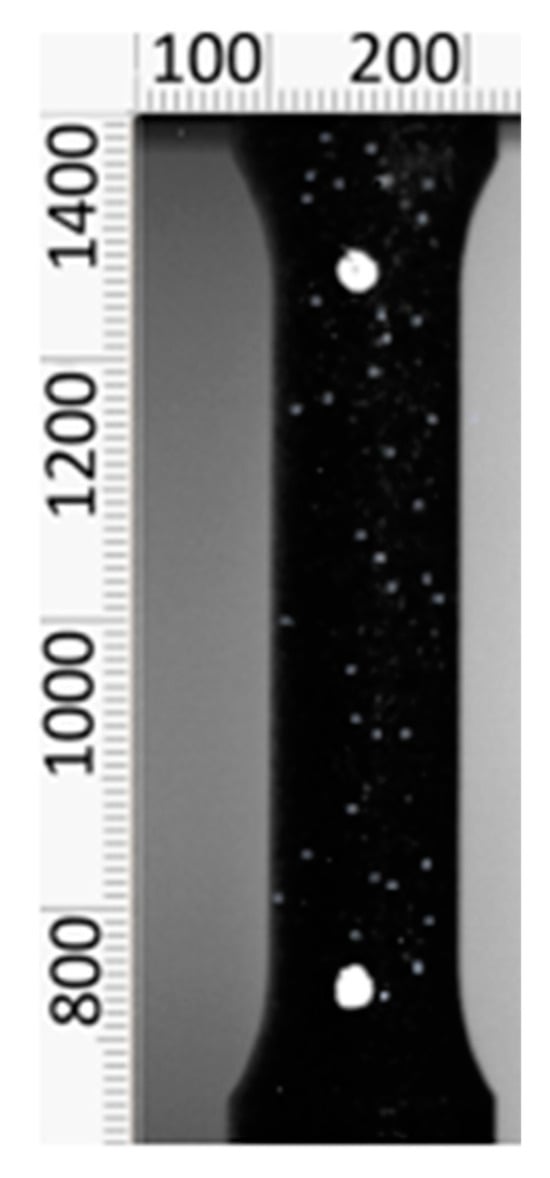
Figure 5.
Image of test specimen viewed in Microsoft Paint.
3. Experimental Data
Engineering stress (σ) versus engineering strain (ε) is automatically generated as output during the tensile test experiment via the Bluehill software version 3.72.4715 provided by the instrument manufacturer. Force–displacement data is obtained by the equations for force (F = σ
), where
is the initial cross-sectional area, and for displacement (δ = ε).
Please note that while the stress–strain and force–displacement data are important for FEA calibration and comparison and that the fracture surface (or deformed state as it relates to the cylinder specimens) can be used to infer their failure mechanisms, the failure point on the load curve is of primary interest. Consequently, stress–strain, force–displacement, and fracture surface data are provided for informational purposes.
Figure 6, Figure 7, Figure 8, Figure 9, Figure 10, Figure 11, Figure 12, Figure 13, Figure 14, Figure 15, Figure 16, Figure 17, Figure 18, Figure 19, Figure 20, Figure 21, Figure 22, Figure 23, Figure 24, Figure 25, Figure 26, Figure 27, Figure 28, Figure 29, Figure 30, Figure 31, Figure 32, Figure 33, Figure 34, Figure 35, Figure 36, Figure 37, Figure 38, Figure 39, Figure 40, Figure 41, Figure 42, Figure 43, Figure 44, Figure 45, Figure 46, Figure 47, Figure 48, Figure 49, Figure 50, Figure 51, Figure 52, Figure 53, Figure 54, Figure 55, Figure 56, Figure 57, Figure 58, Figure 59 and Figure 60 illustrate the fractured specimens of the uniaxial tensile and compression tested specimens, and Table 3, Table 4, Table 5, Table 6, Table 7, Table 8, Table 9, Table 10, Table 11, Table 12 and Table 13 present their respective material properties. It is important to note that A denotes Aluminum 6061-T6, C indicates A36 Carbon Steel, S represents 304 Stainless Steel, and N signifies Nitronic 60.
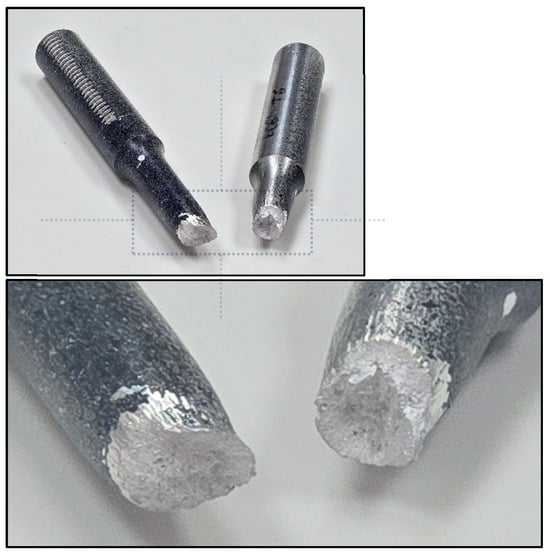
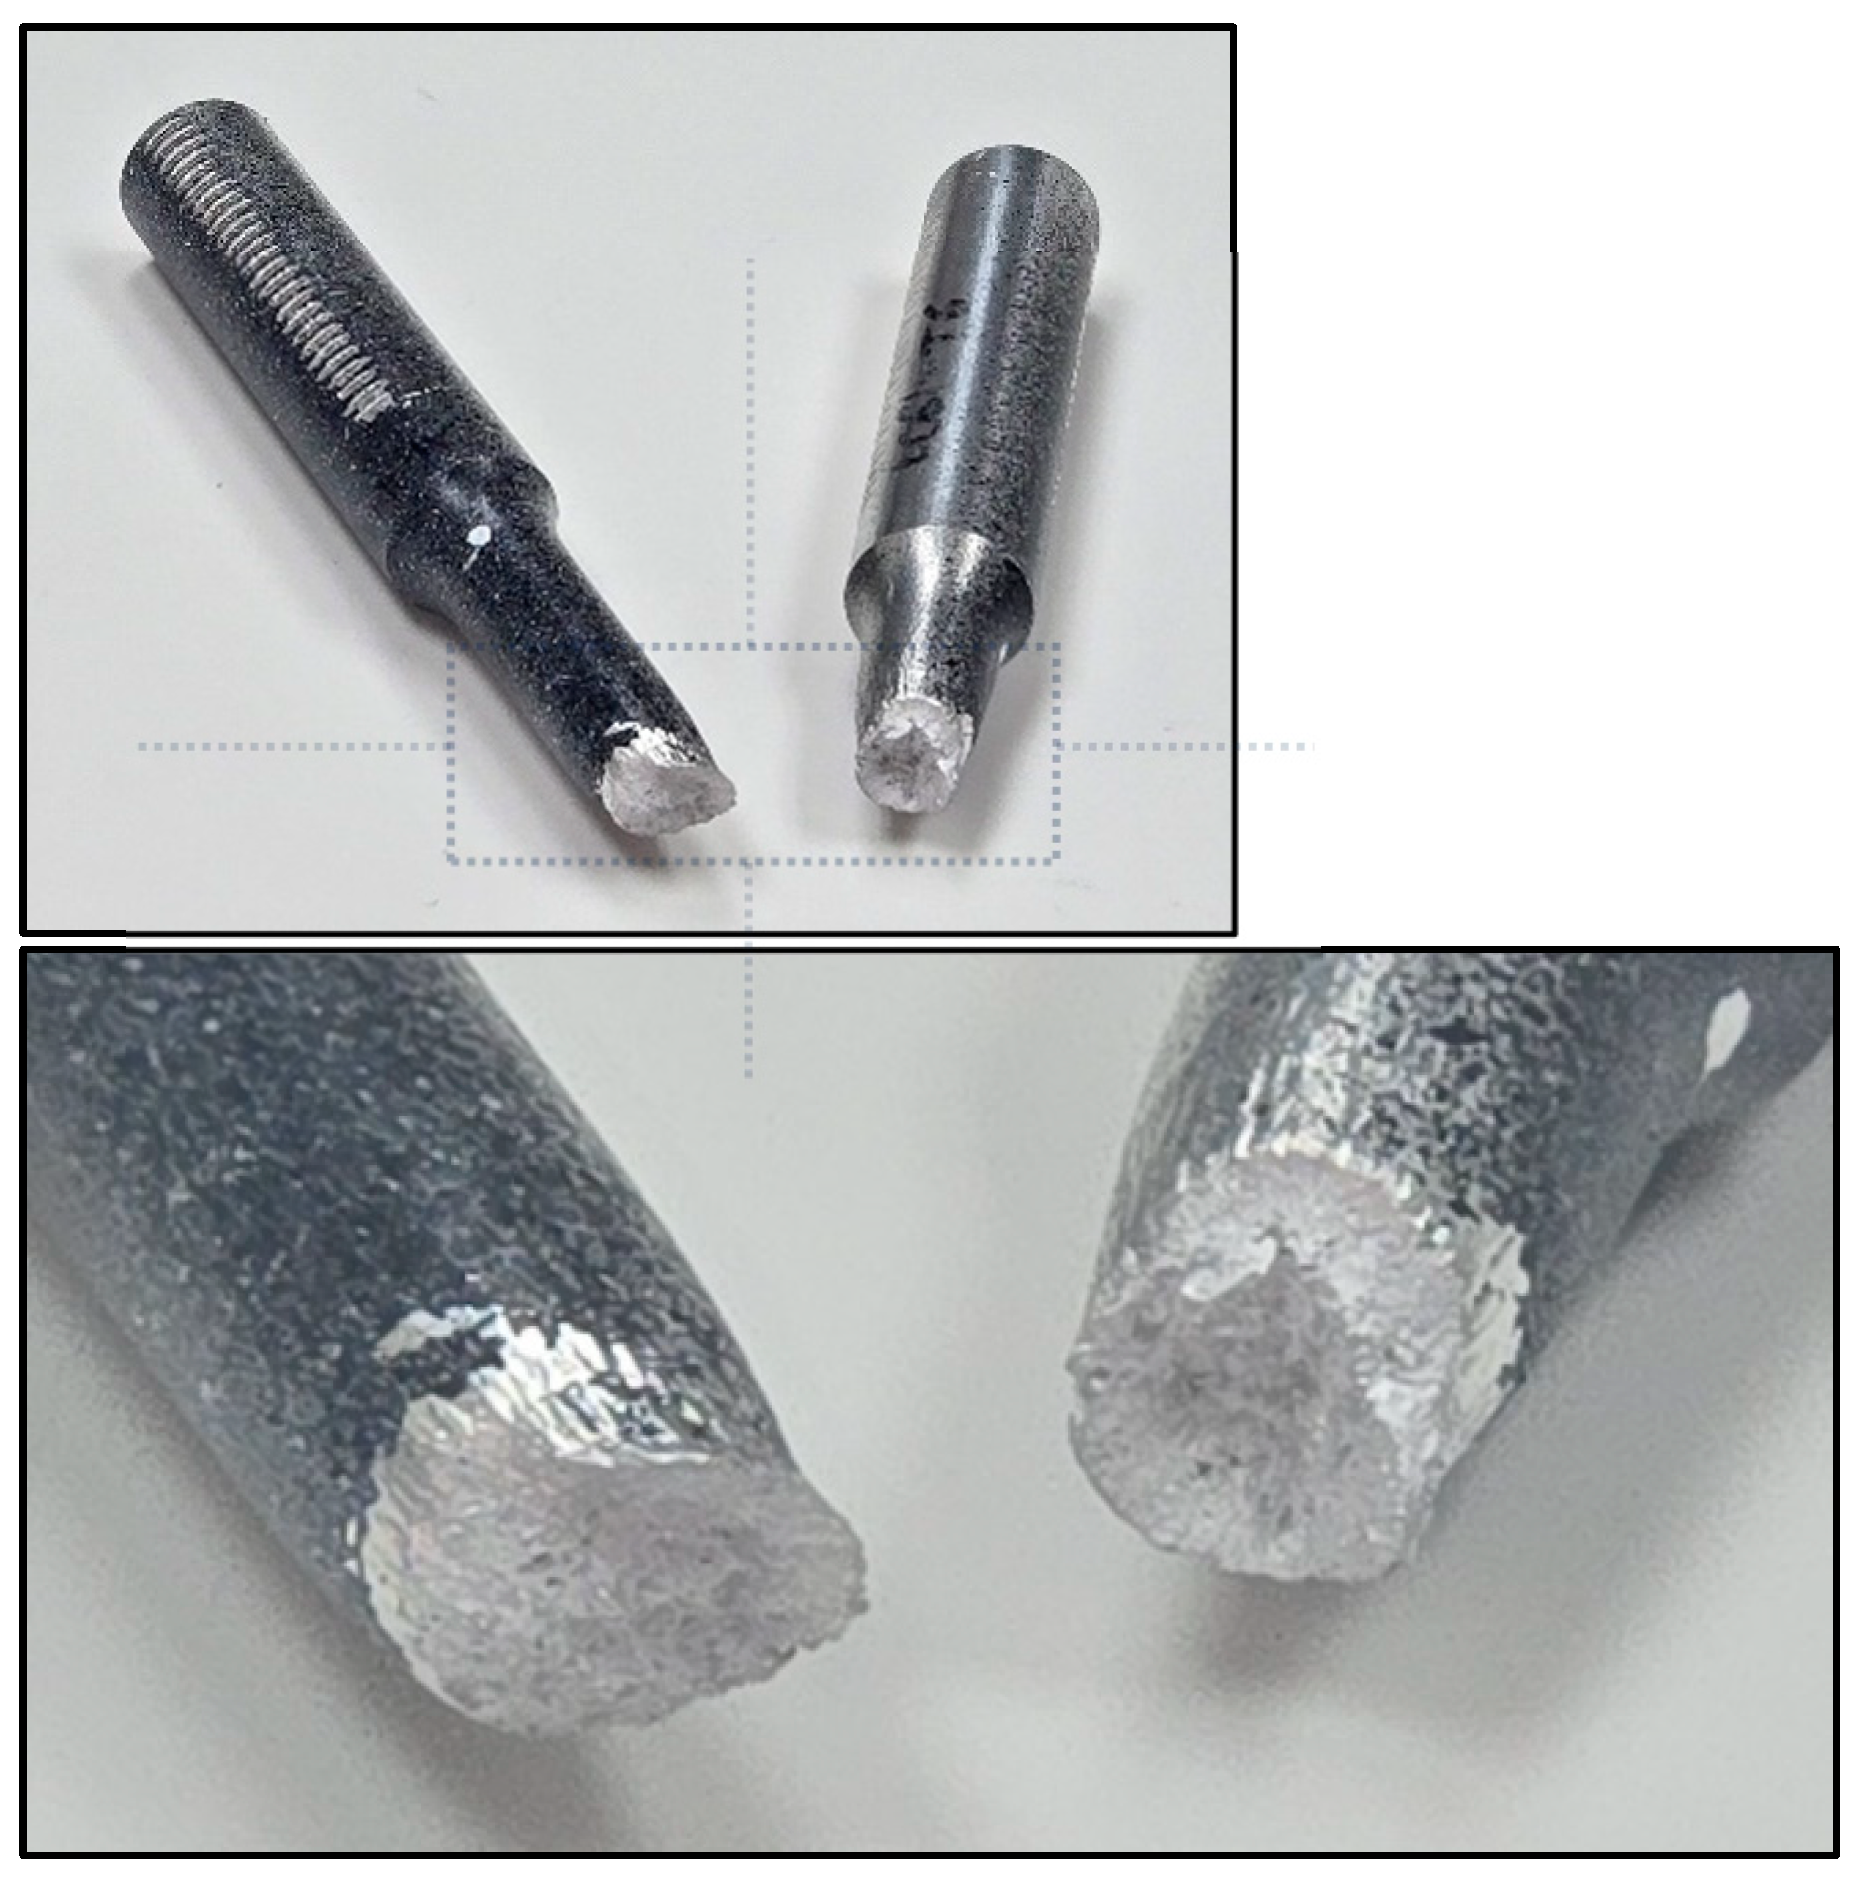
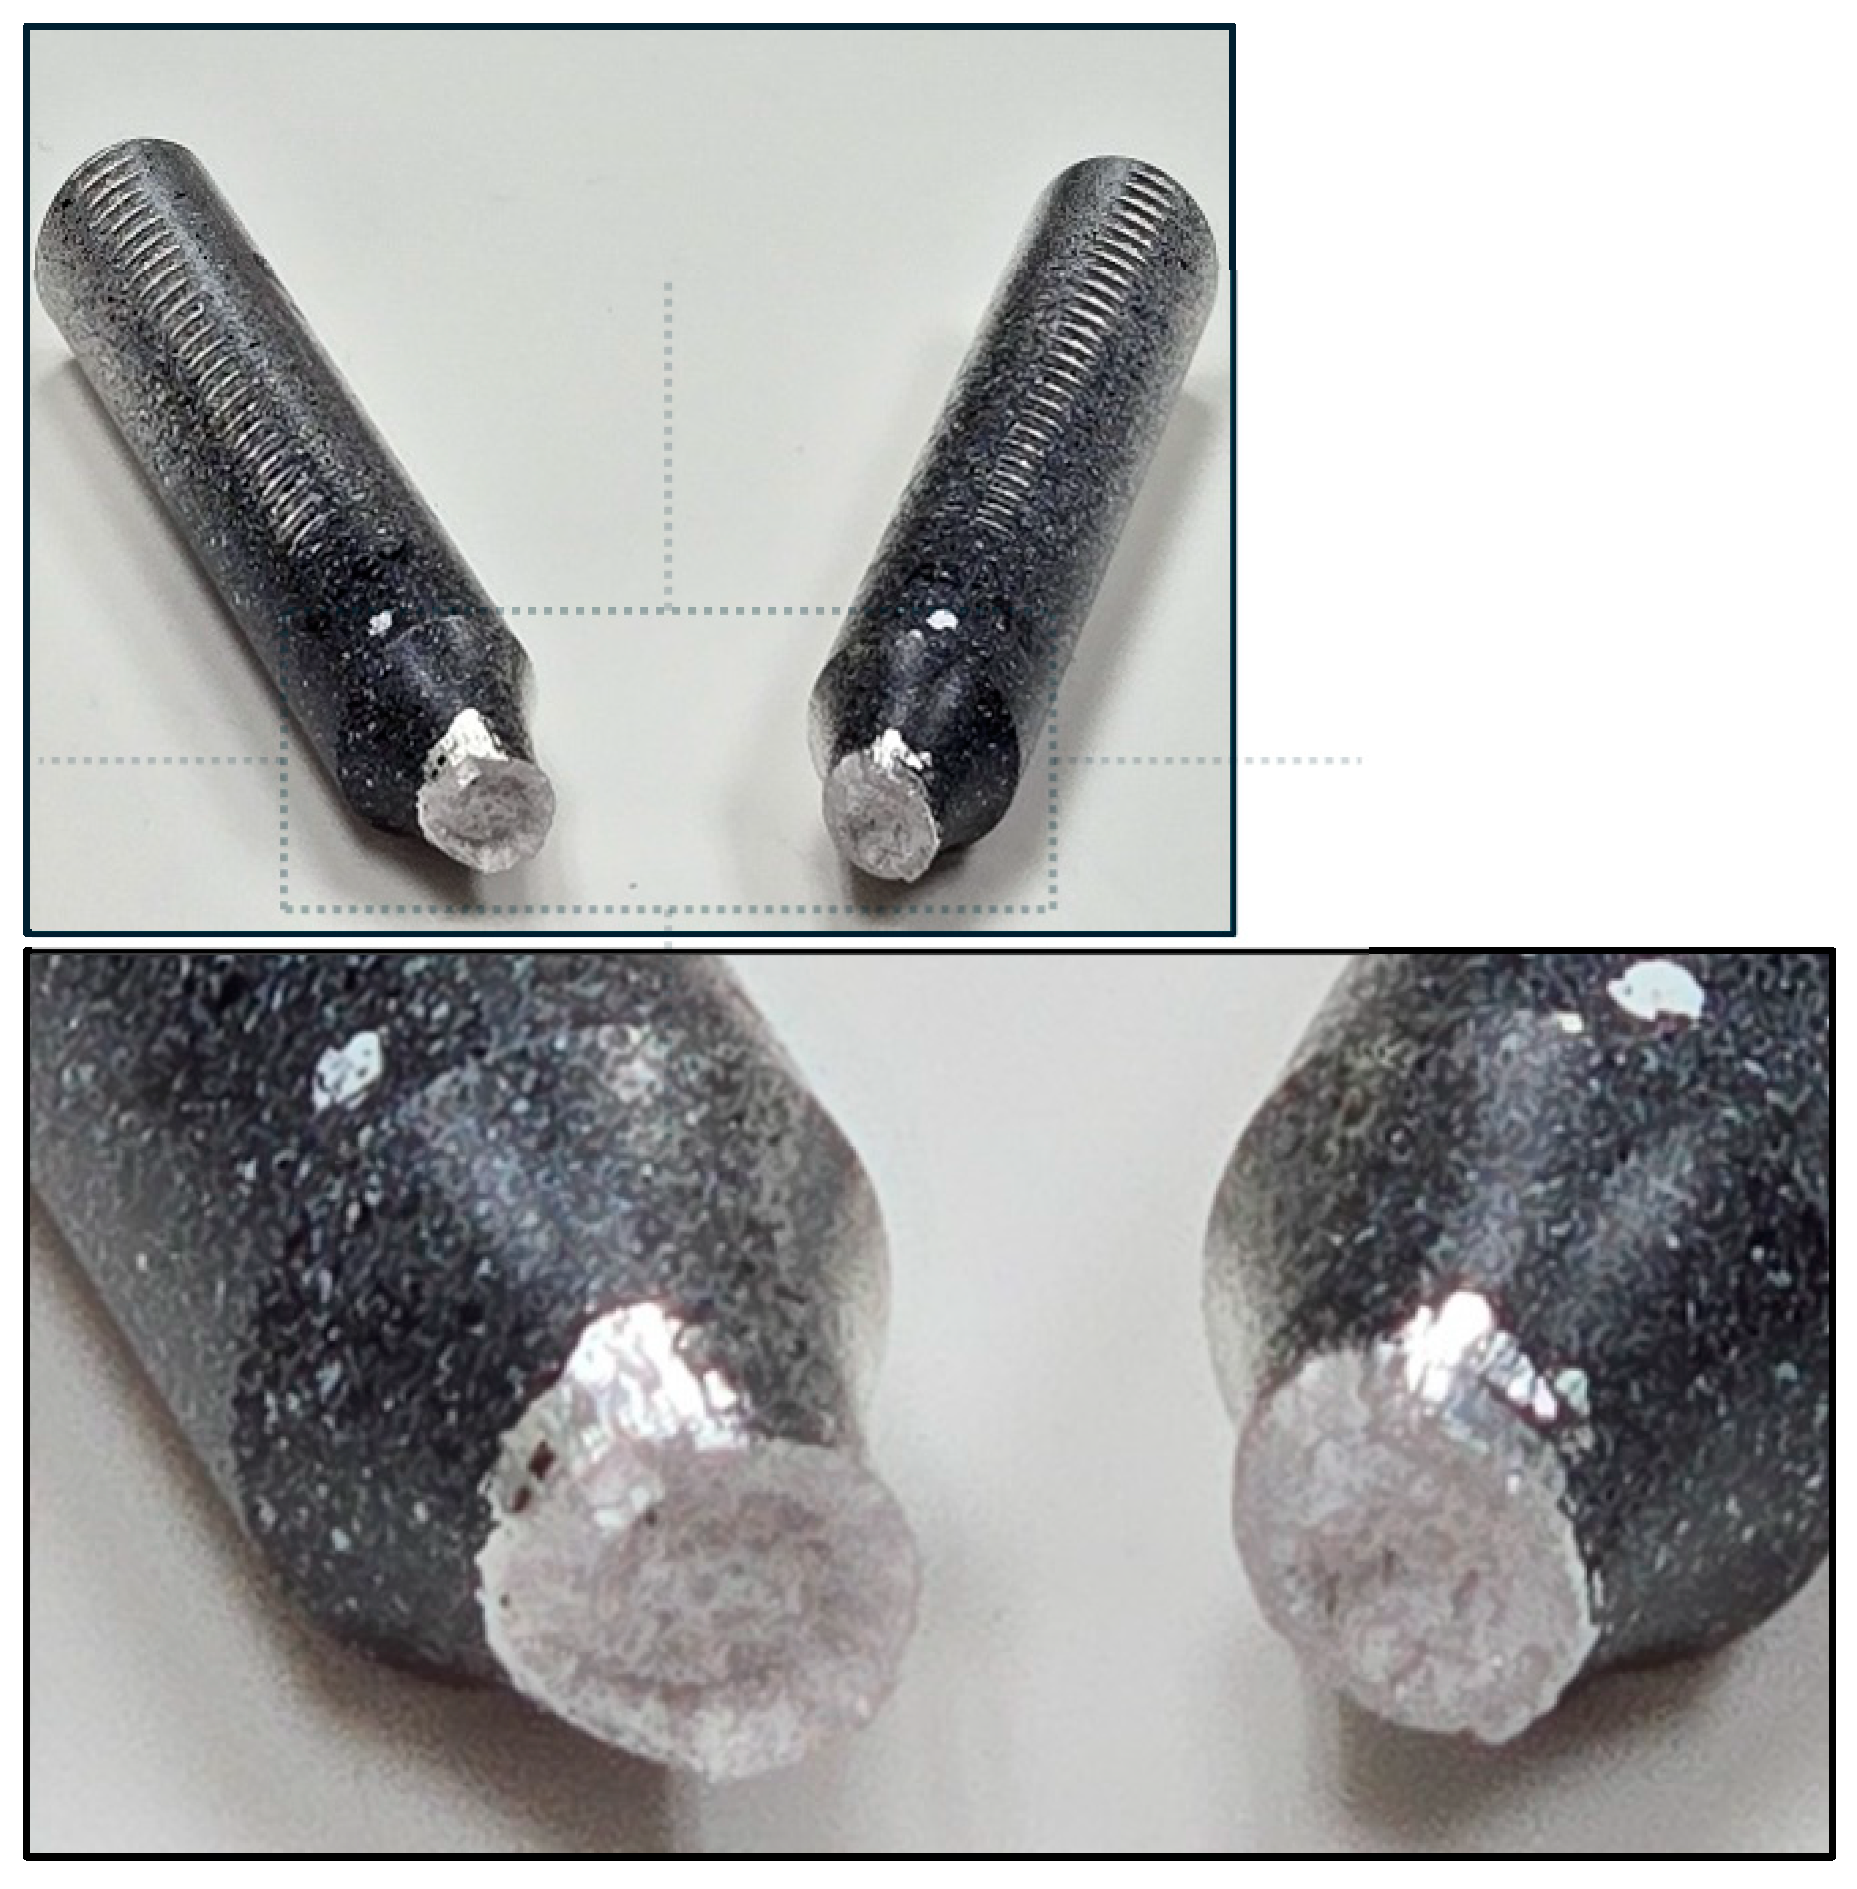
Figure 6.
Ductile fracture of specimen-821449, Al6061.
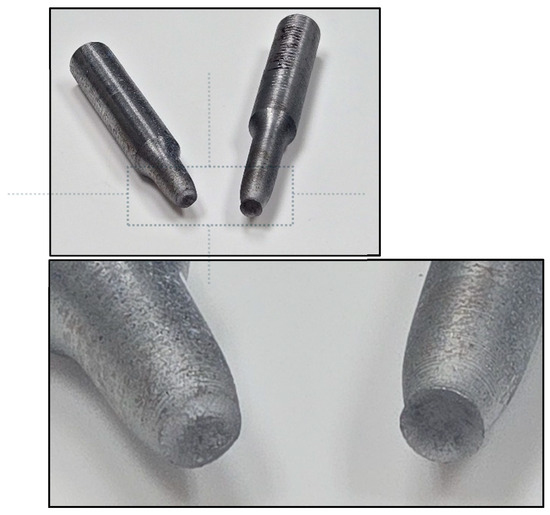
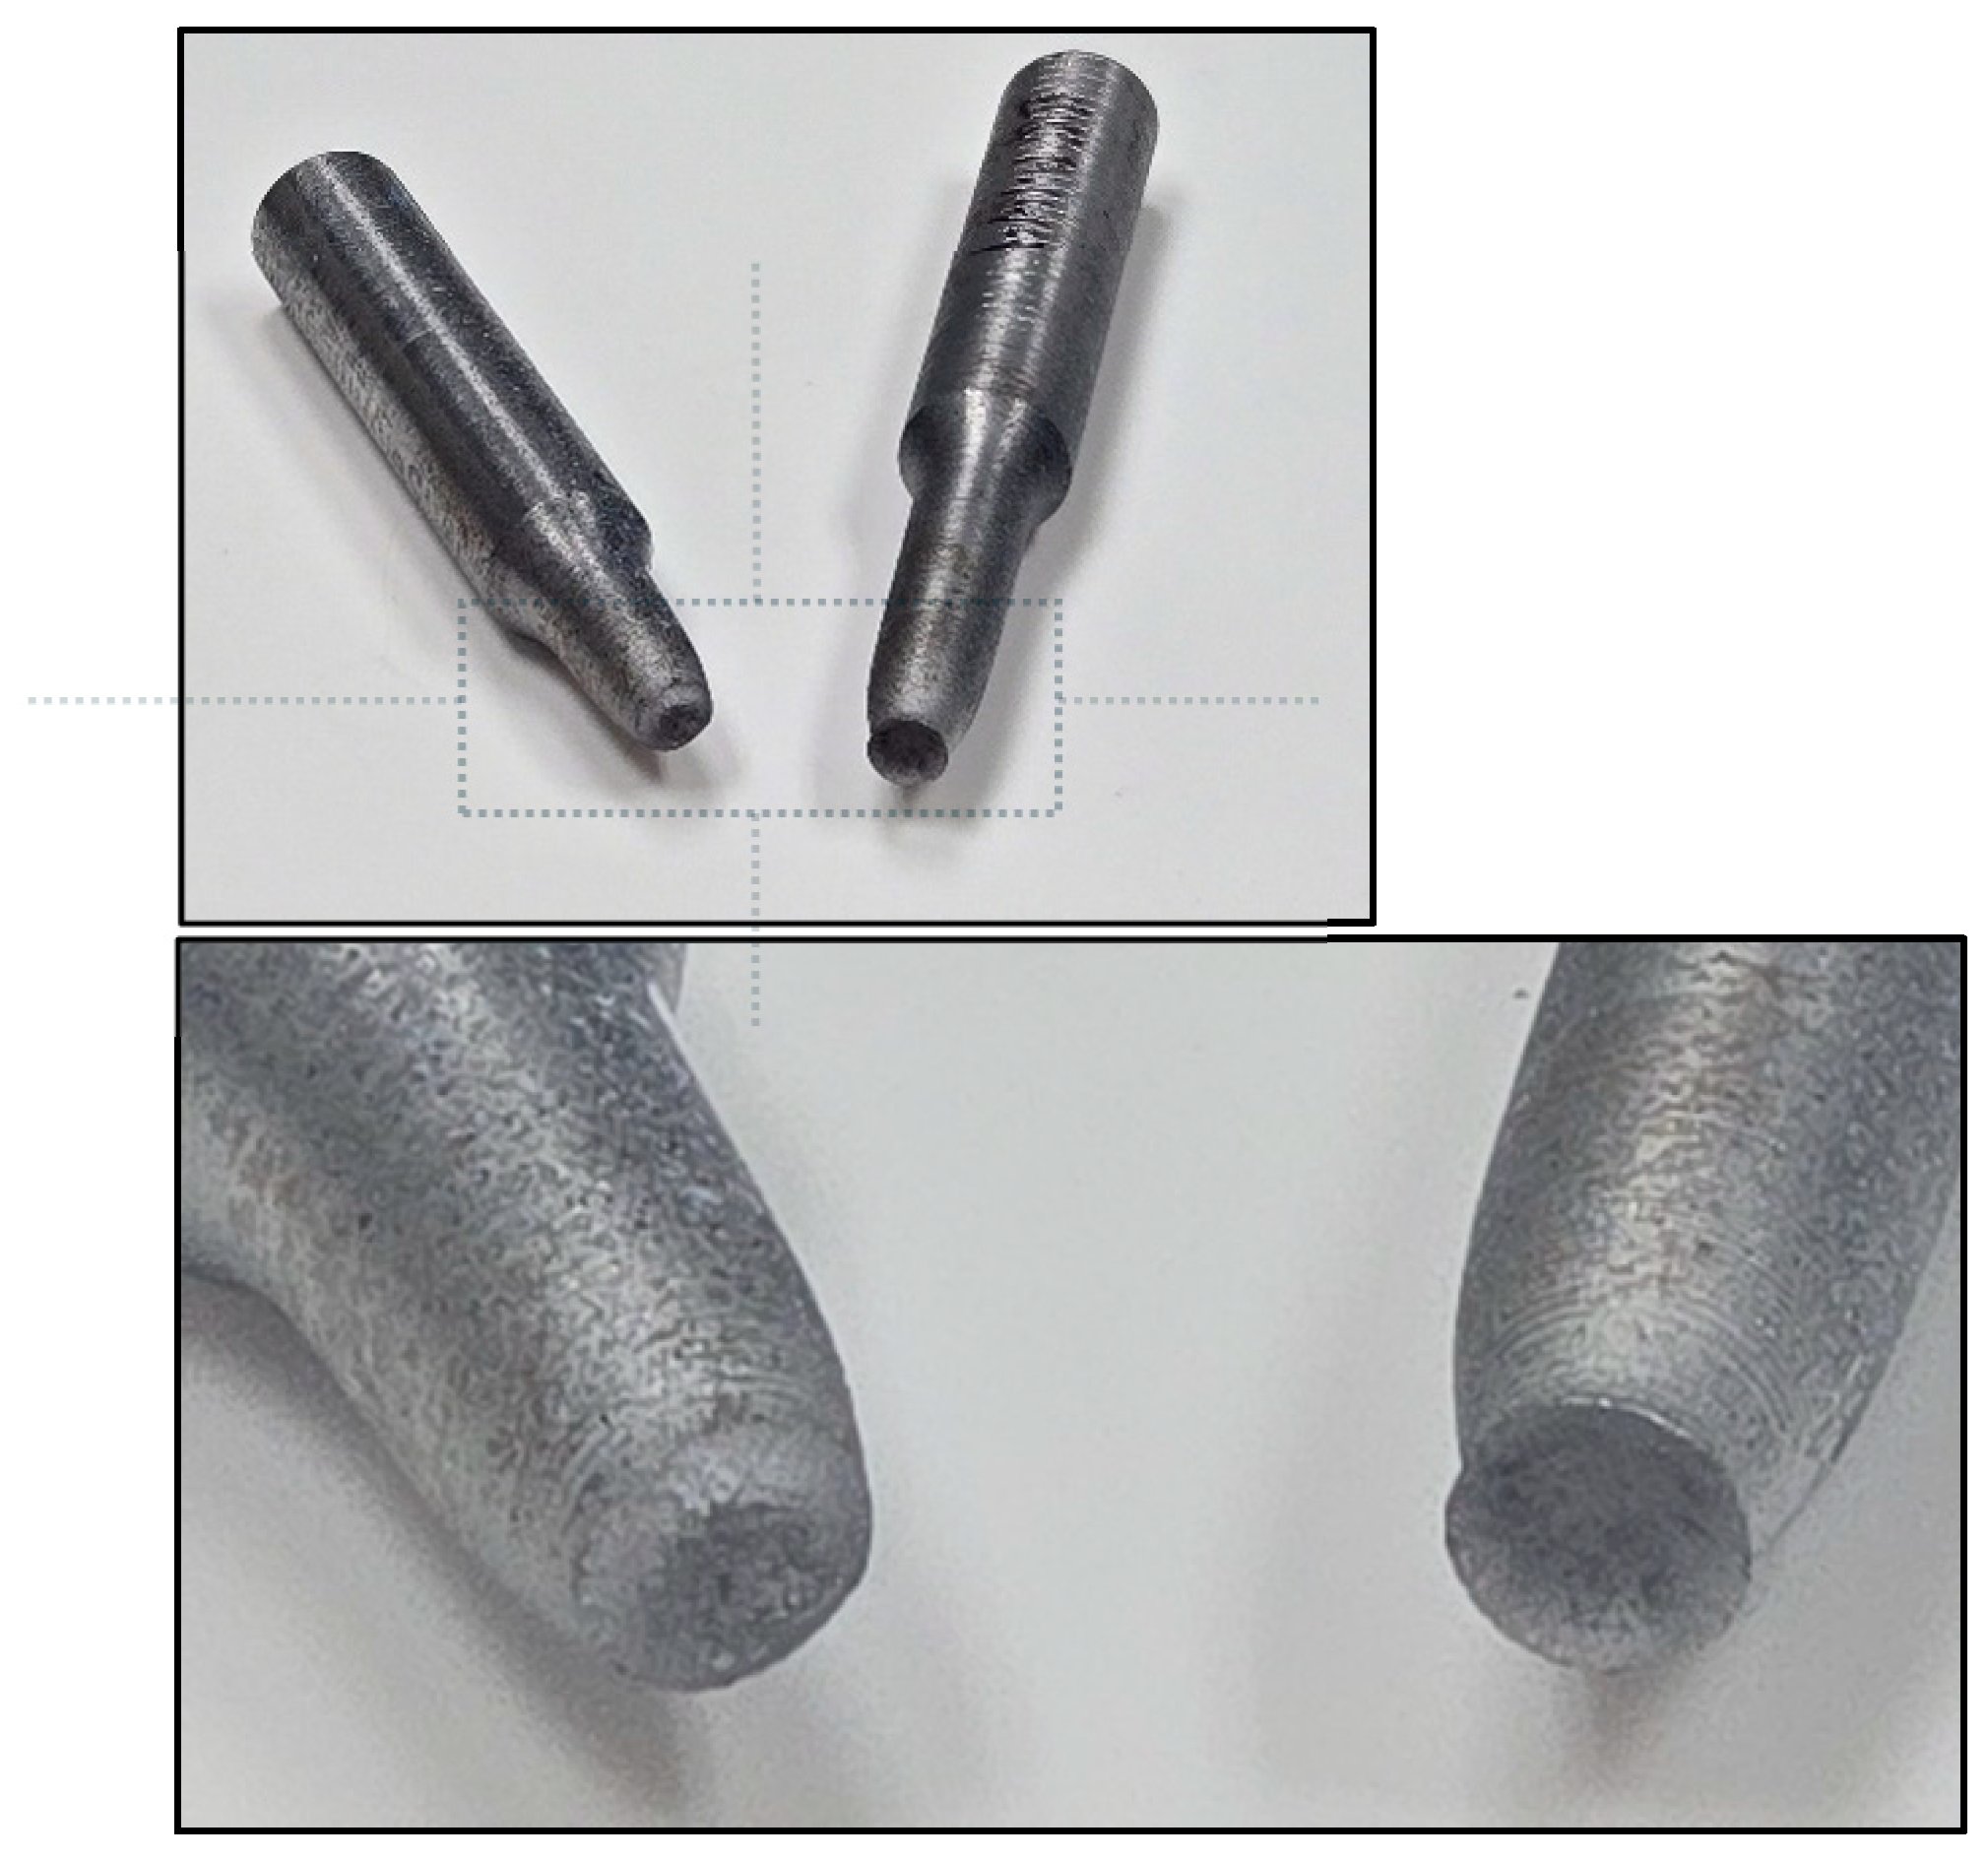
Figure 7.
Ductile fracture of specimen-821449, A36.
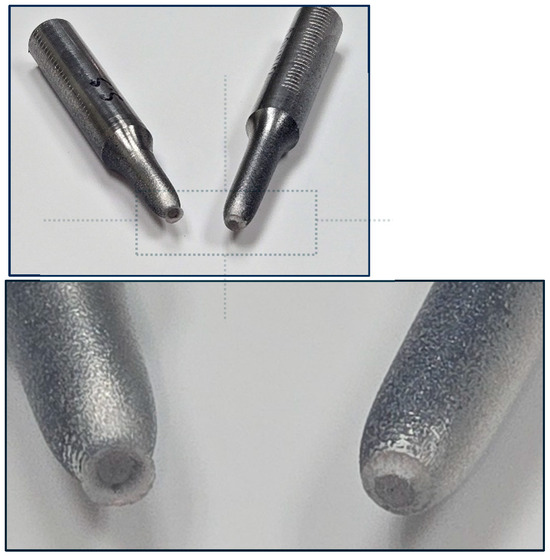
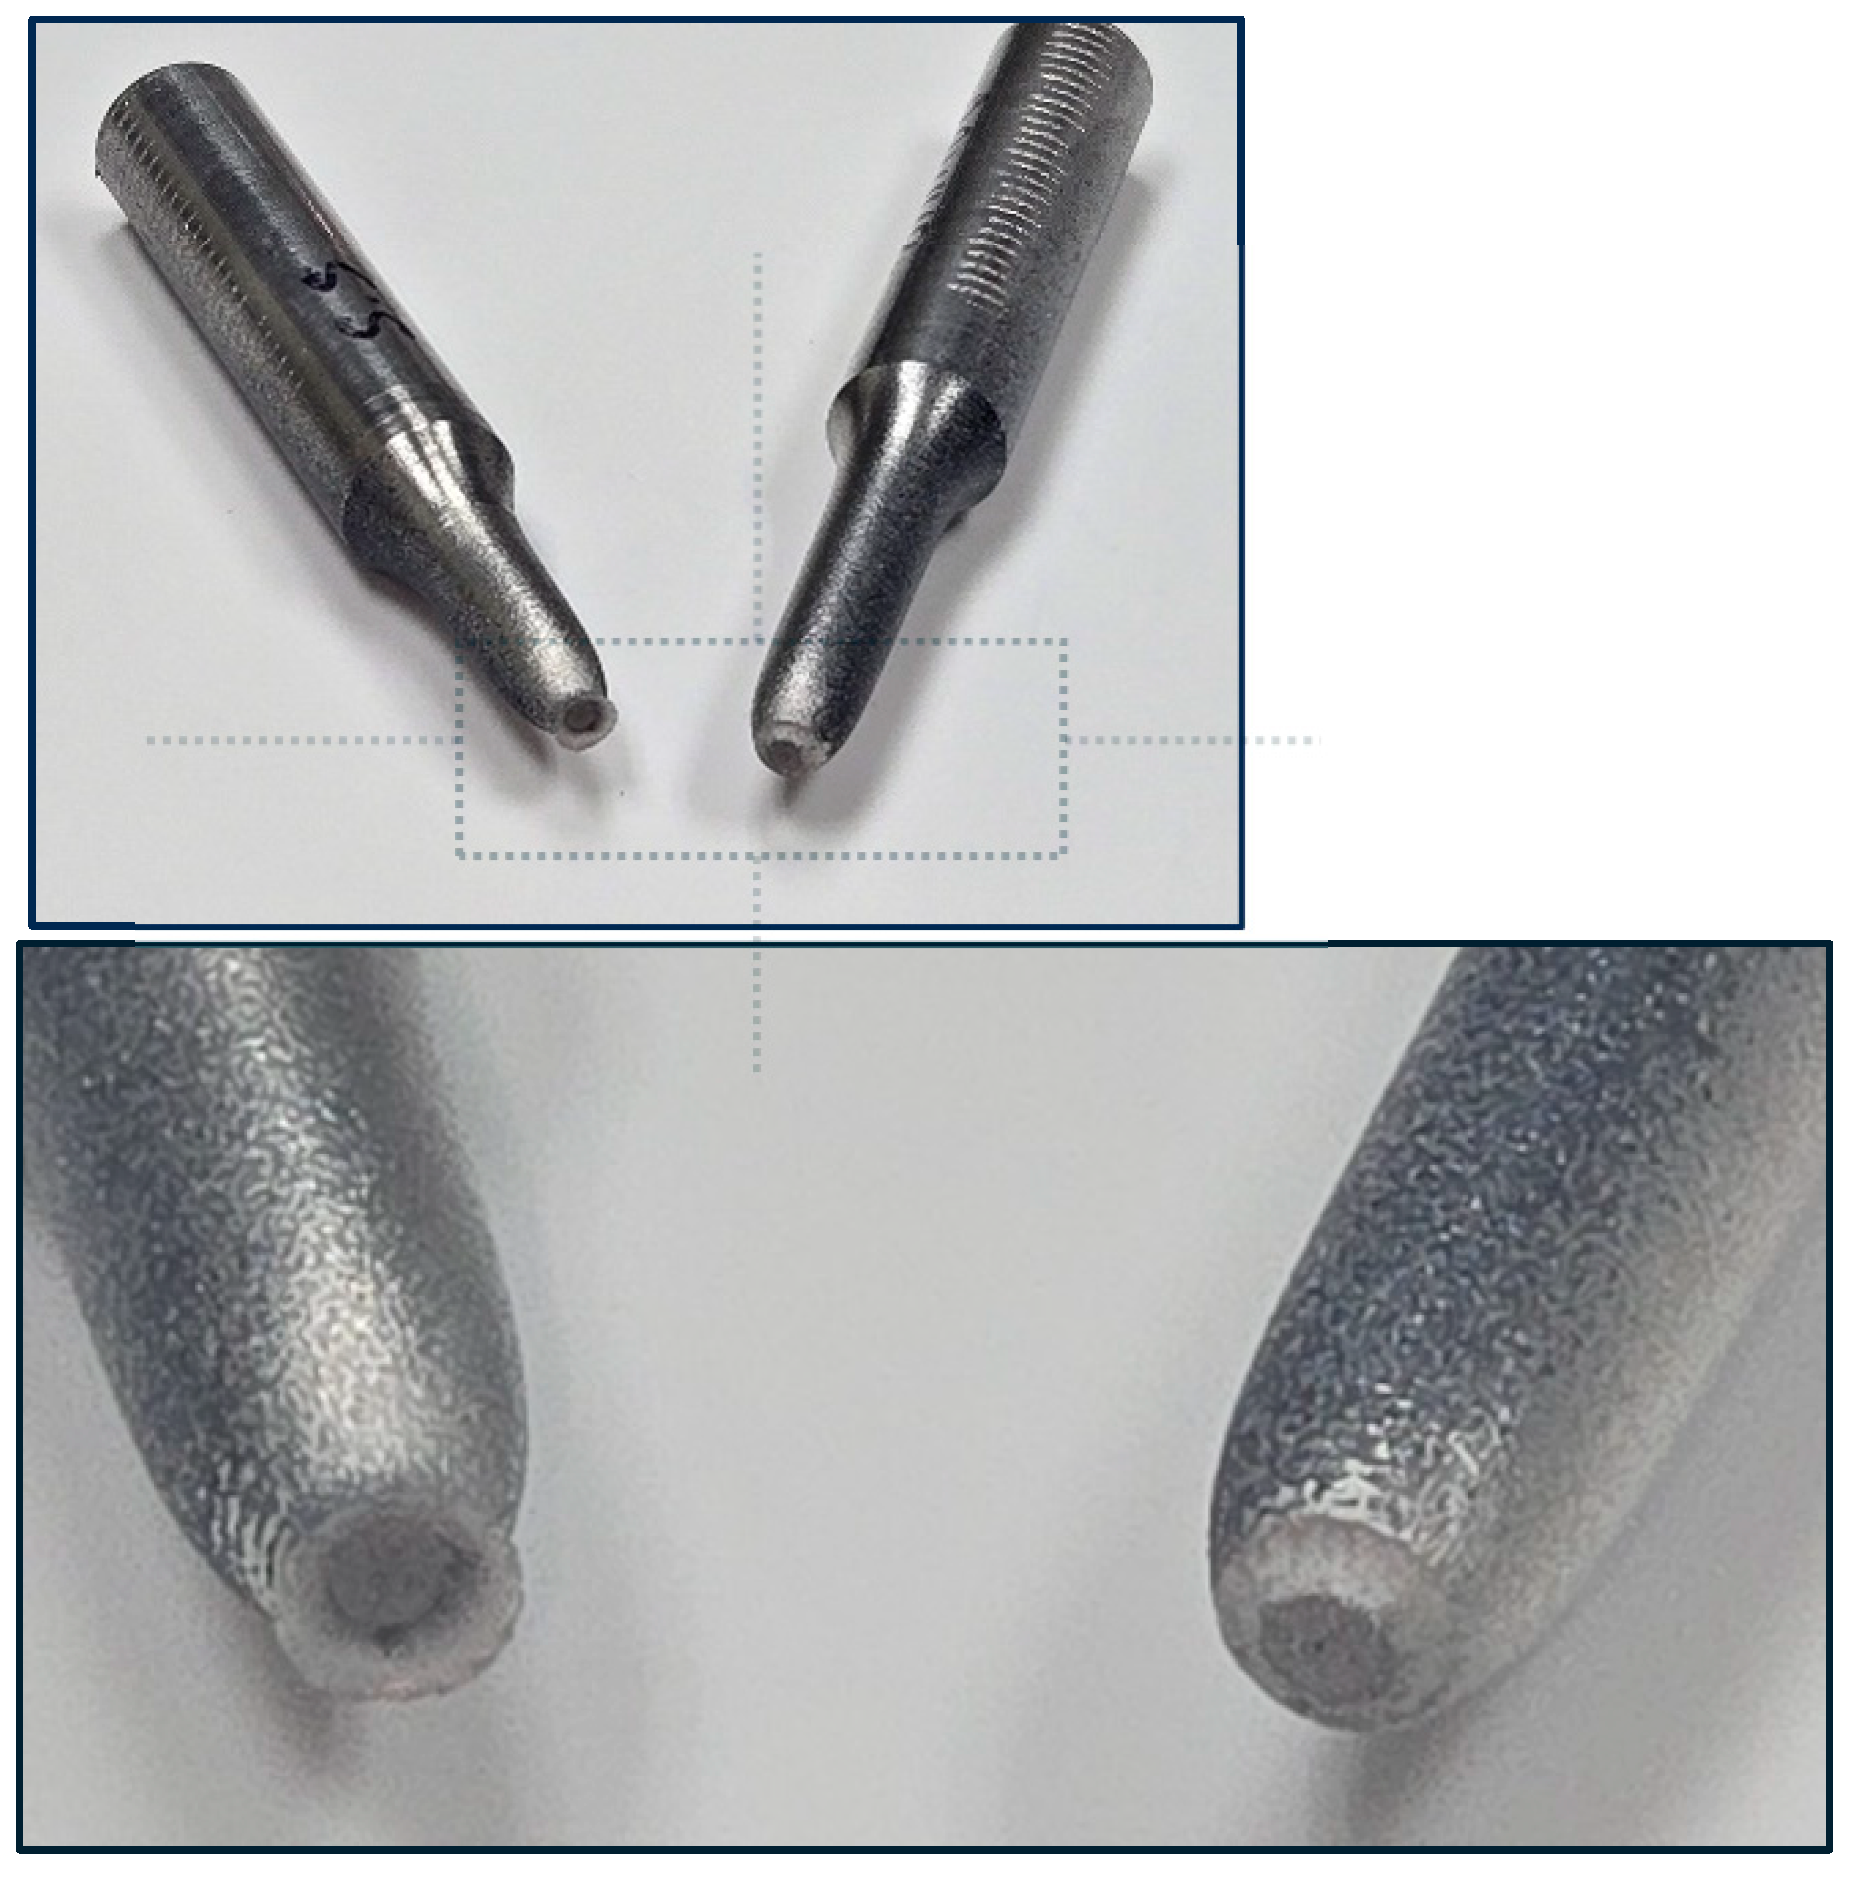
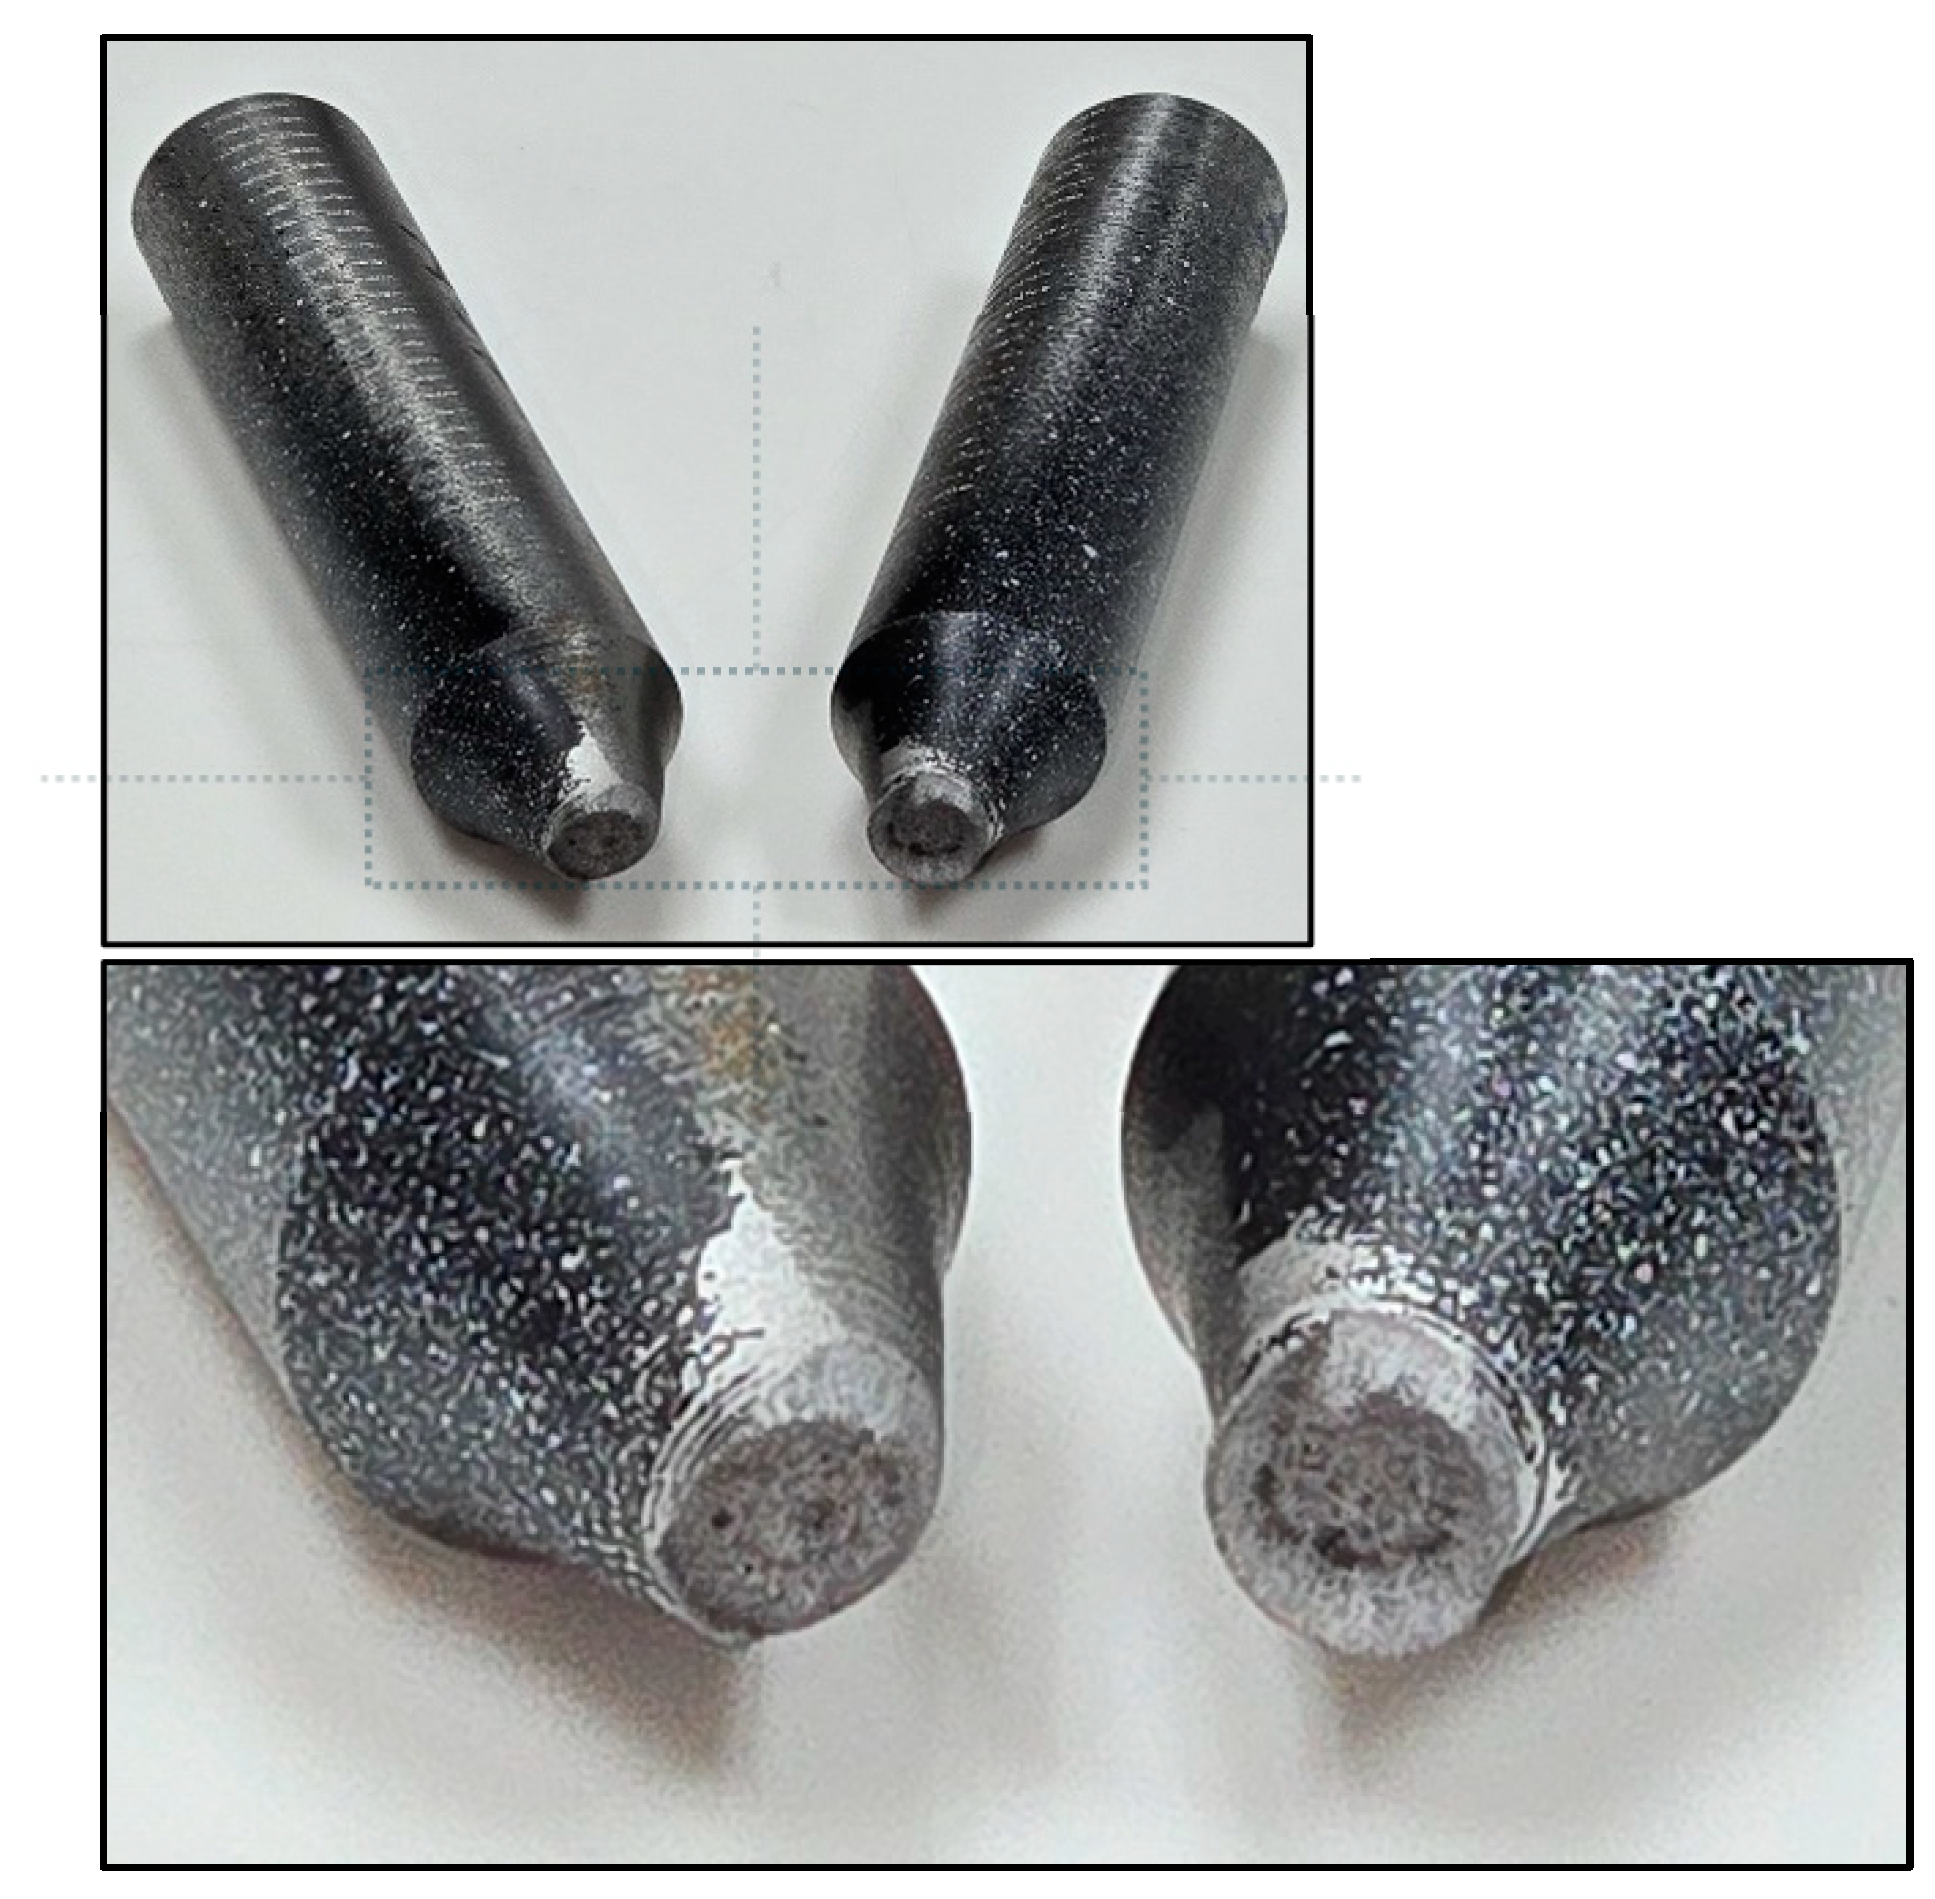
Figure 8.
Ductile fracture of specimen-821449, SS304.
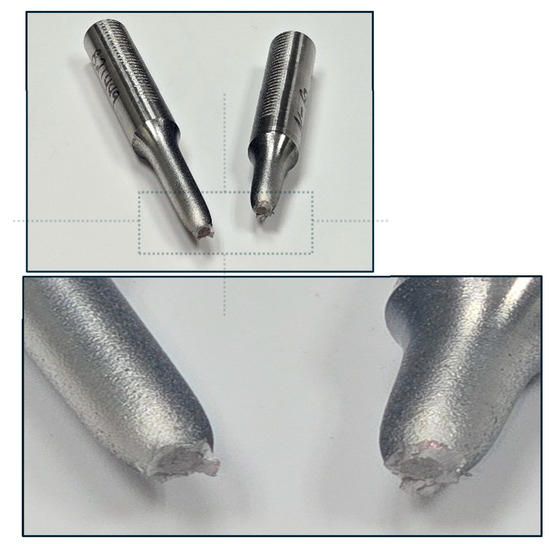
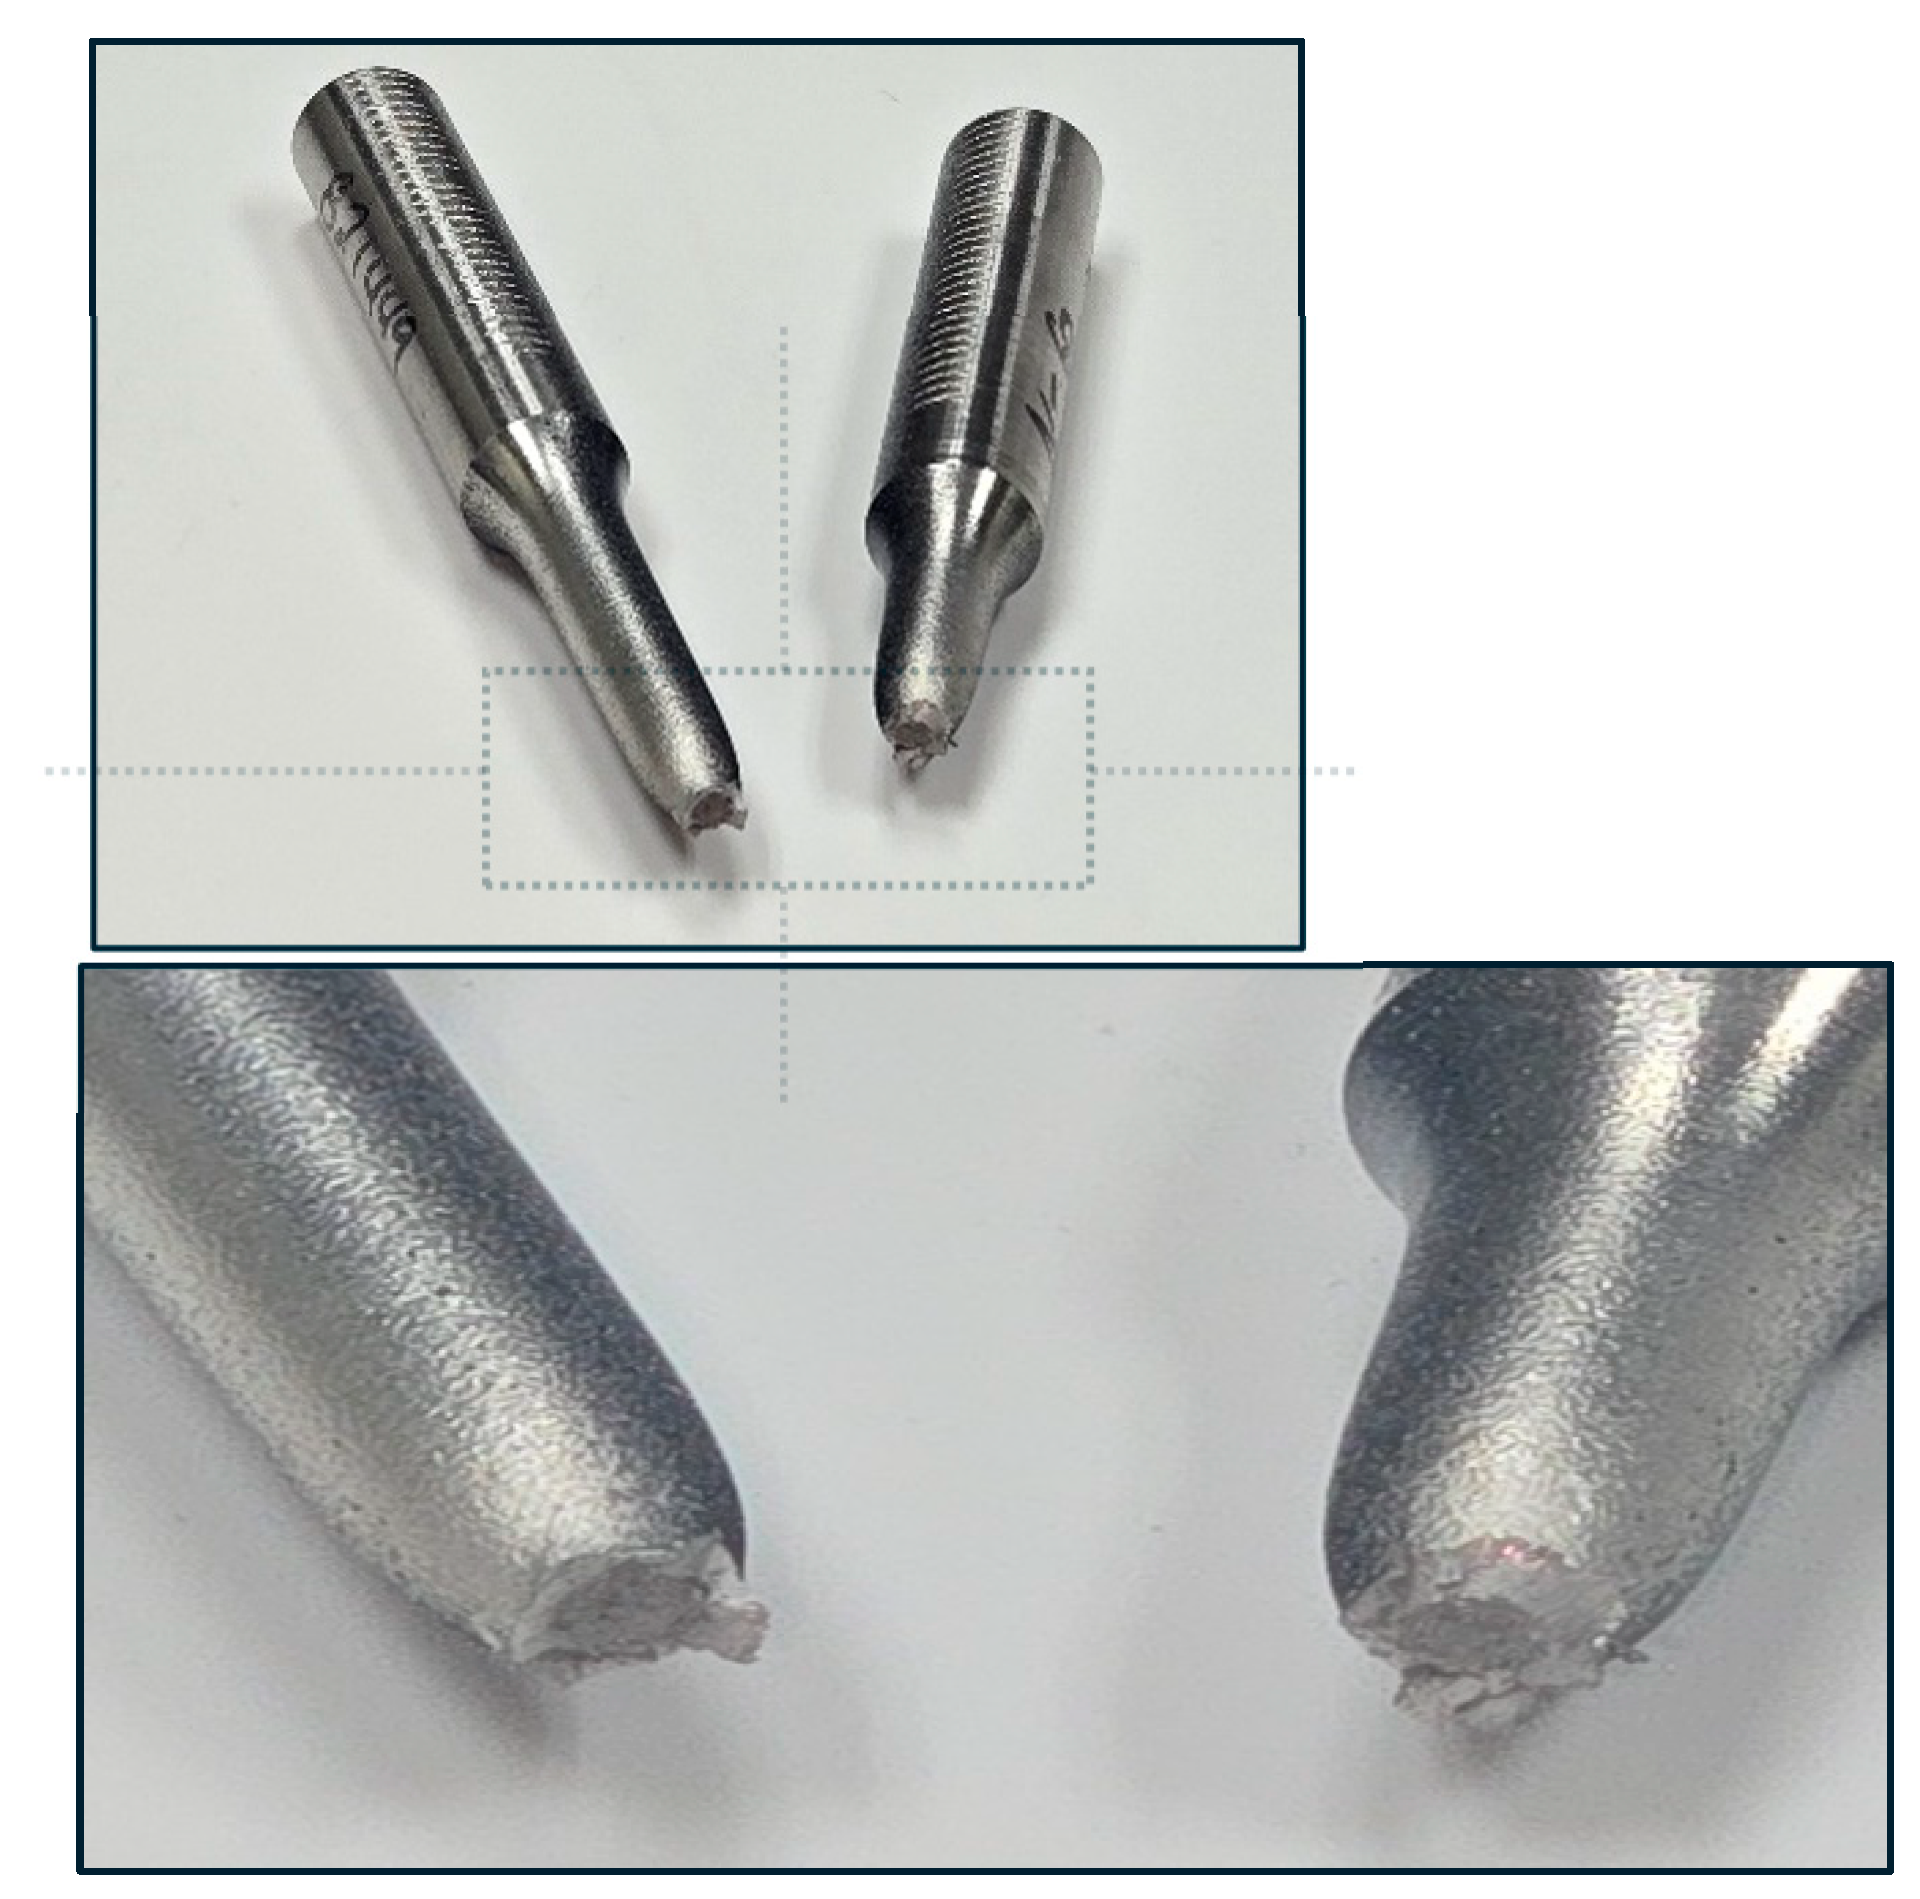
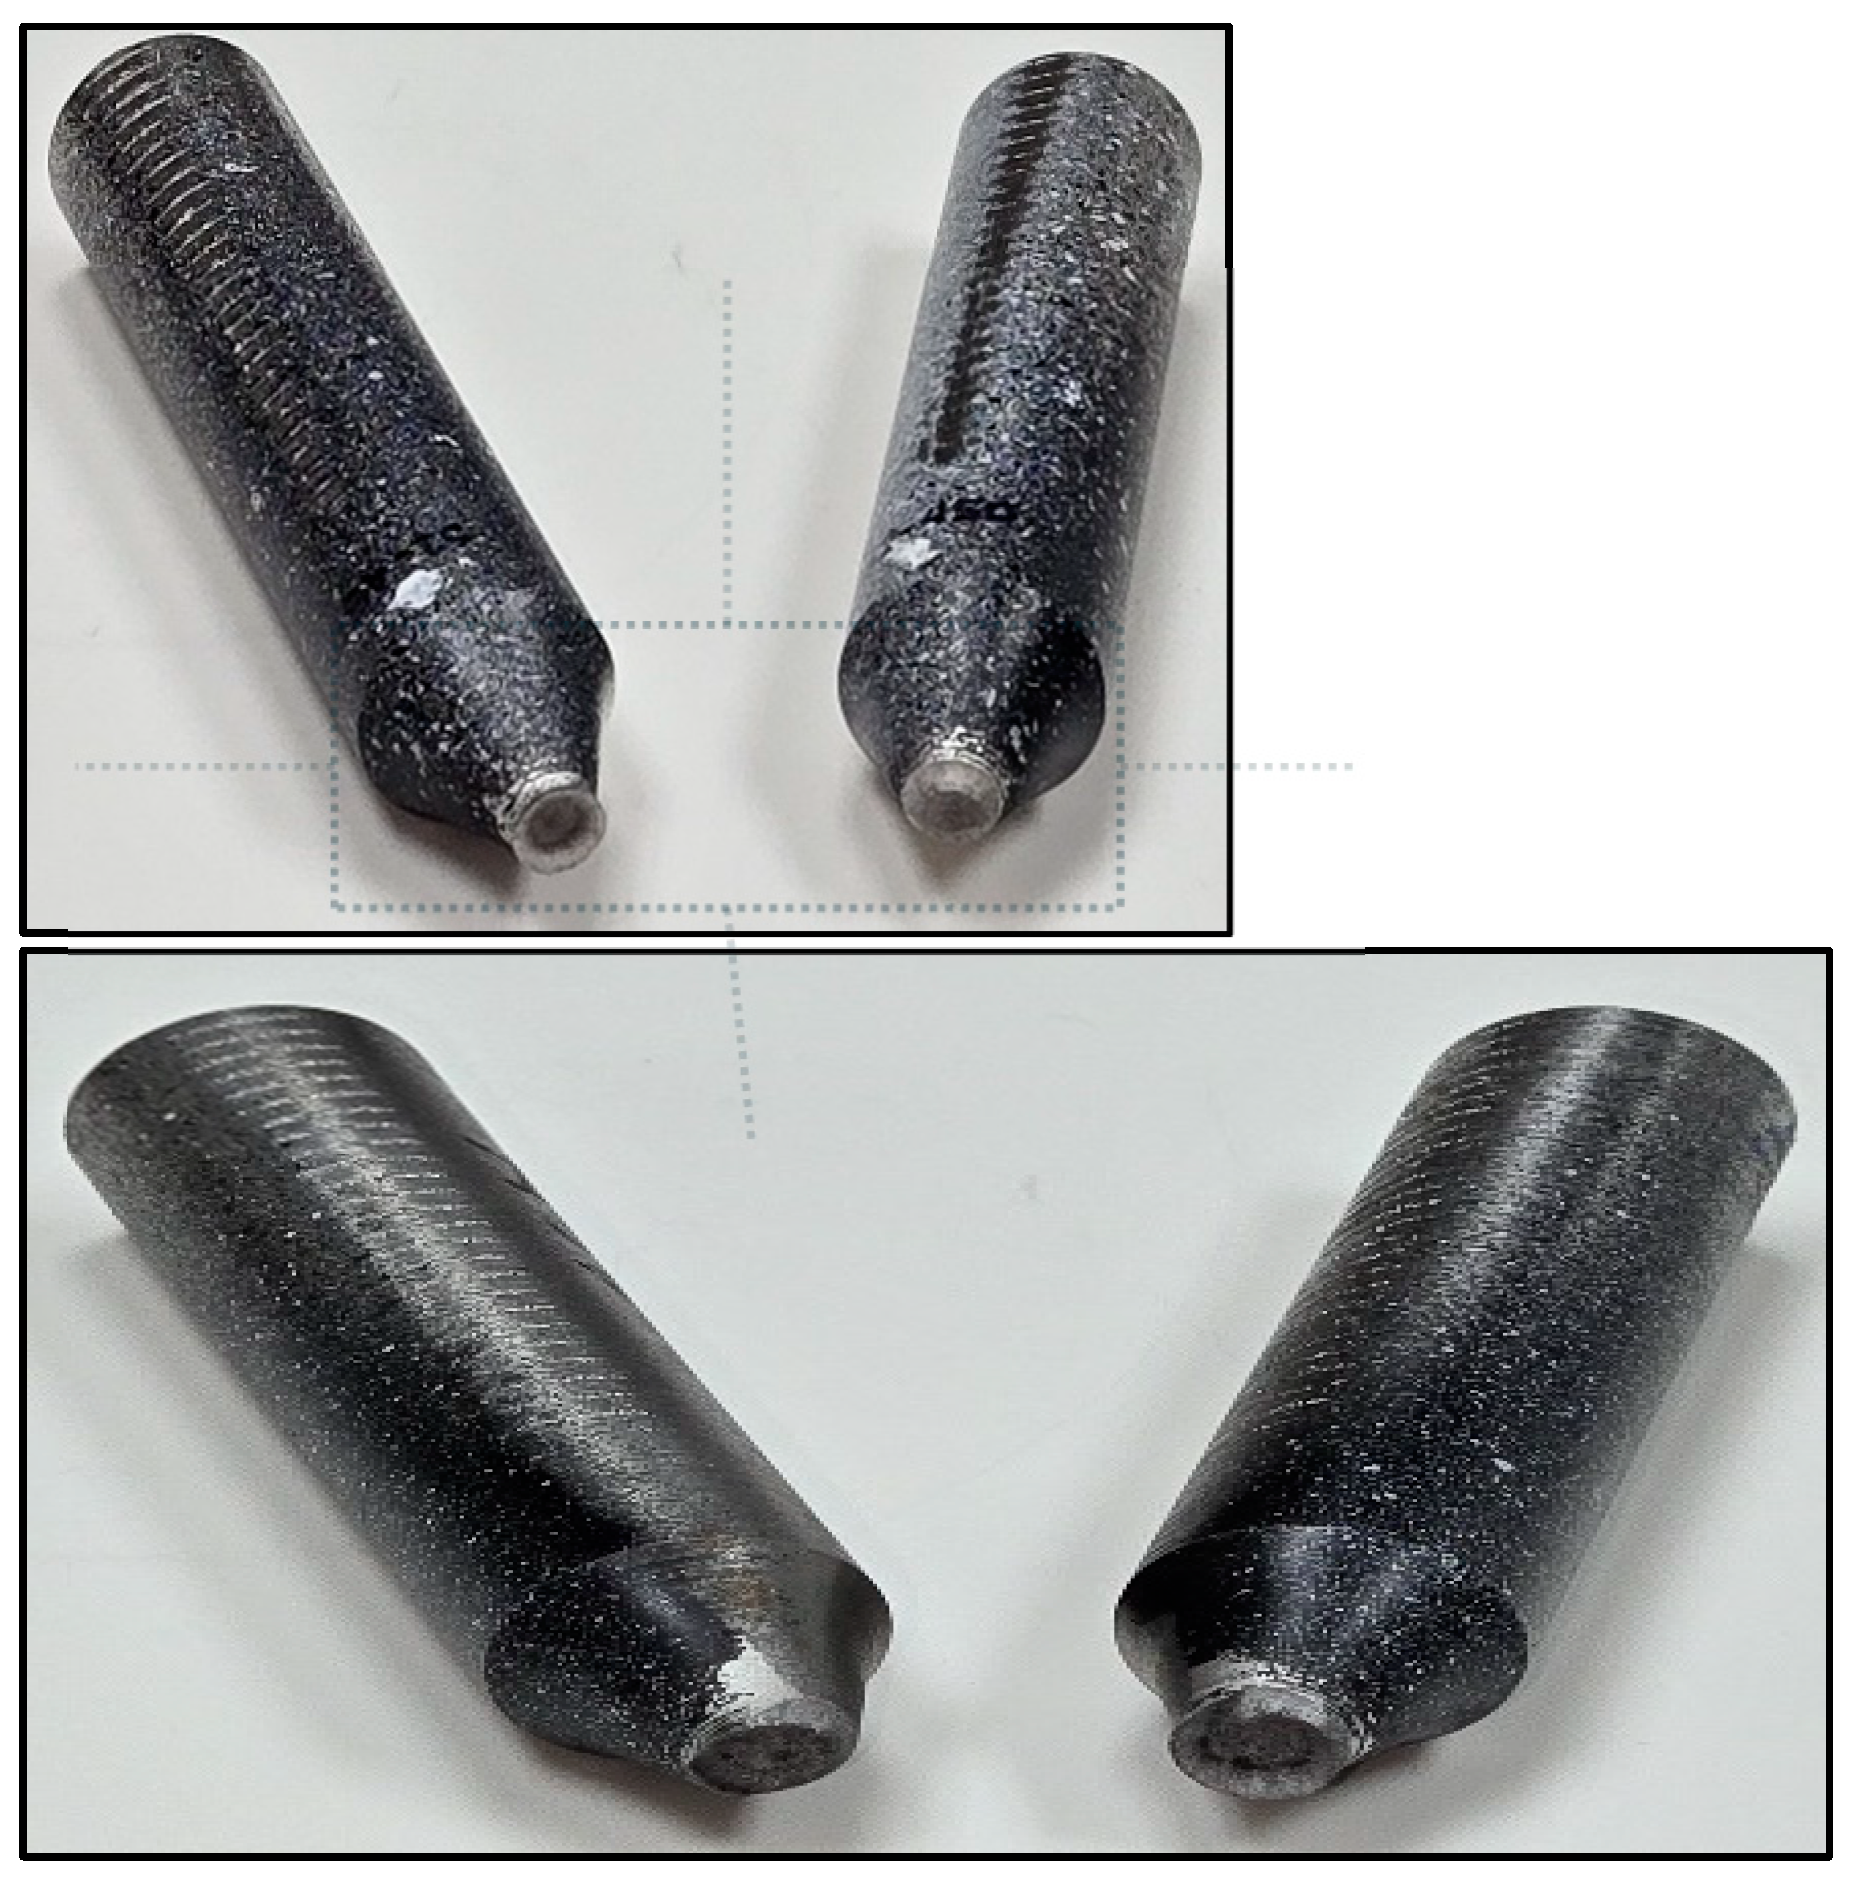
Figure 9.
Ductile fracture of specimen-821449, N60.
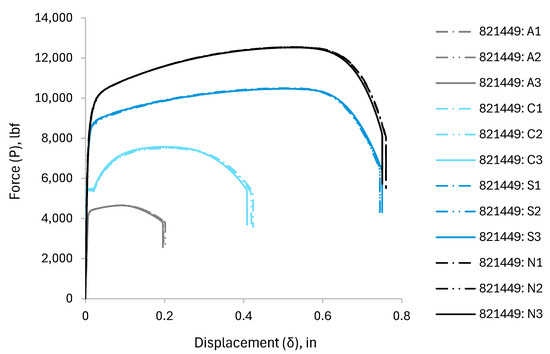
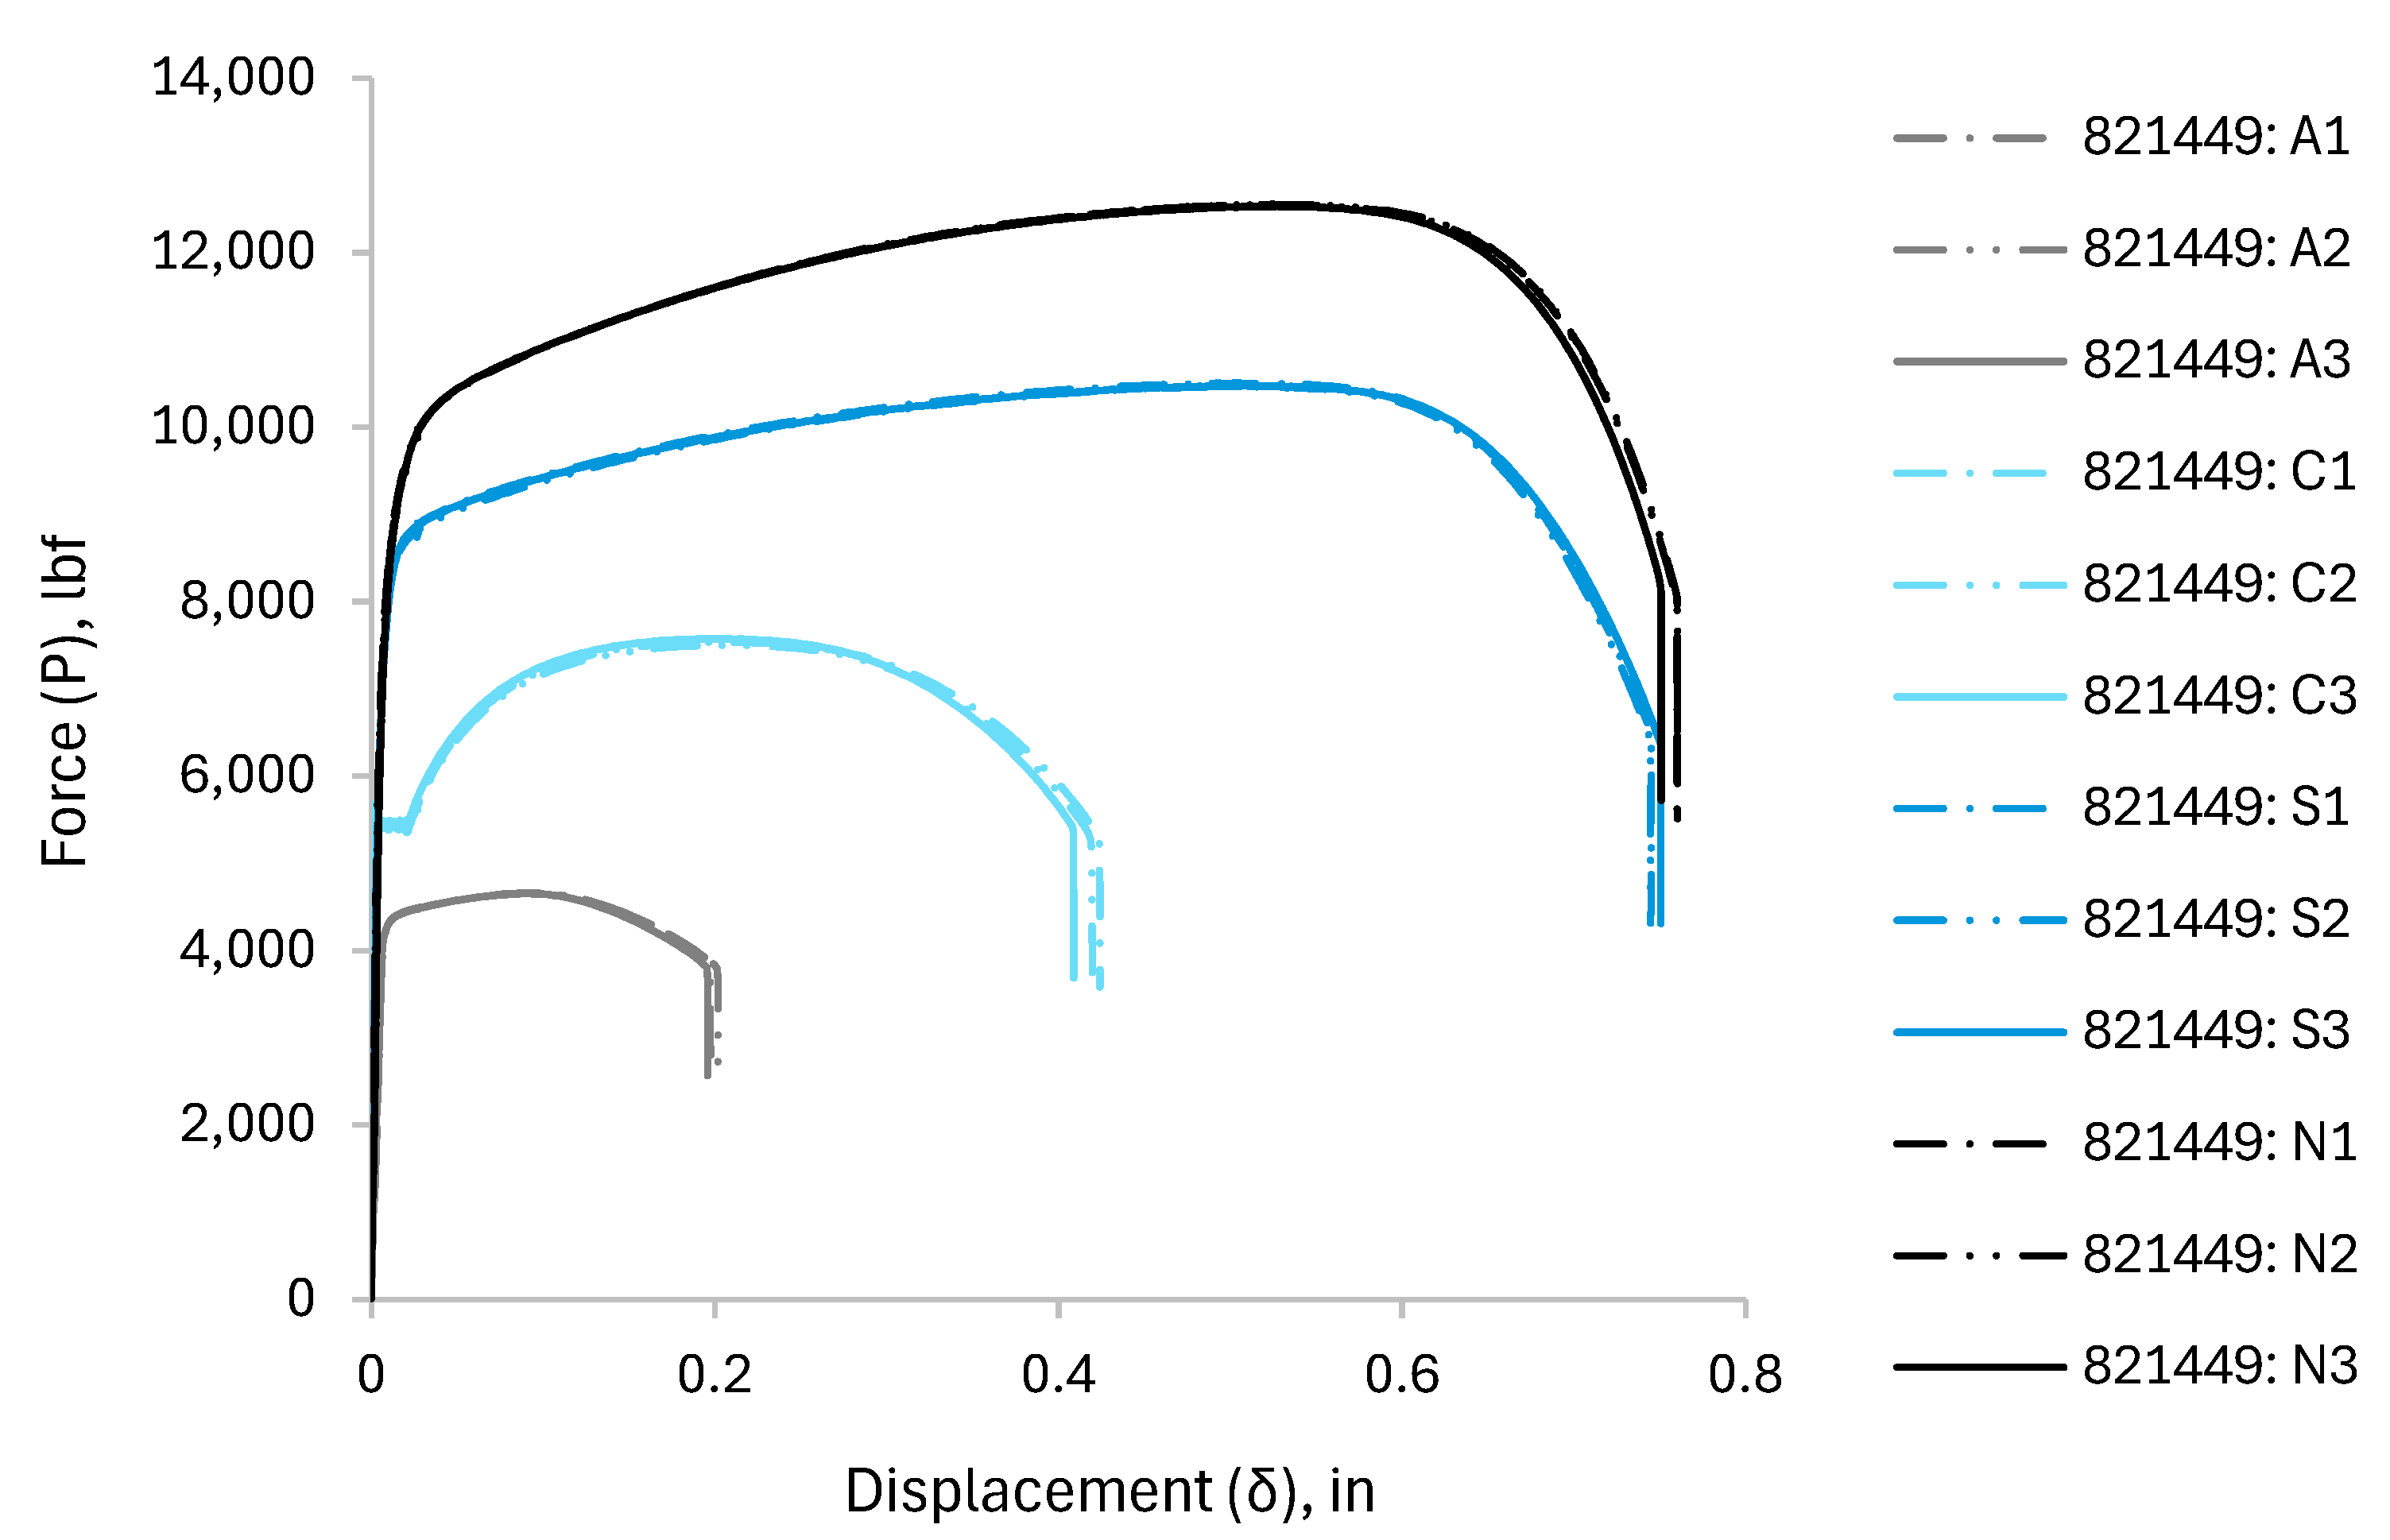
Figure 10.
curve for smooth round bars (specimen-821449).
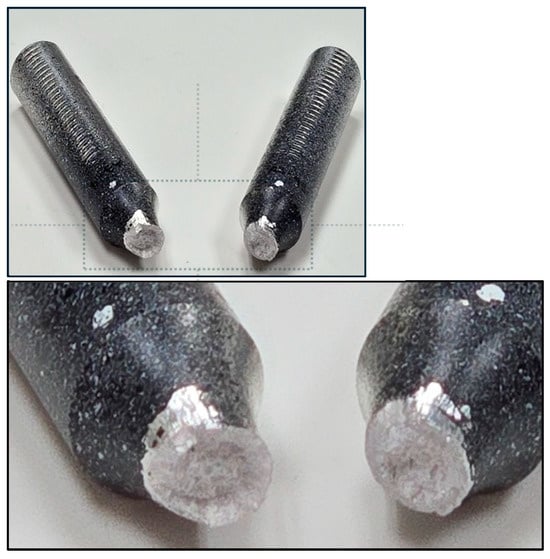
Figure 11.
Ductile fracture of specimen-821450, Al6061.
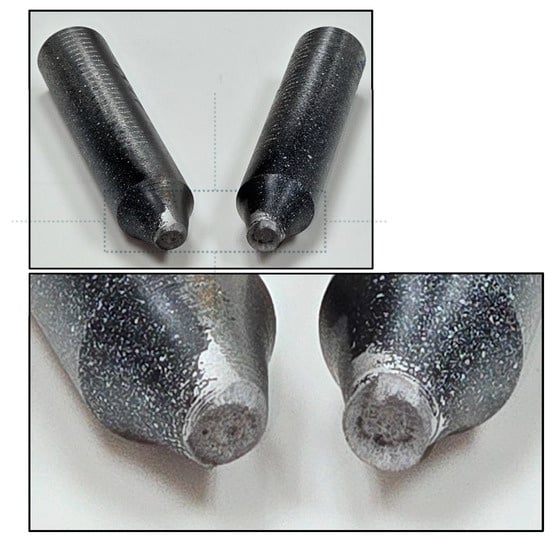
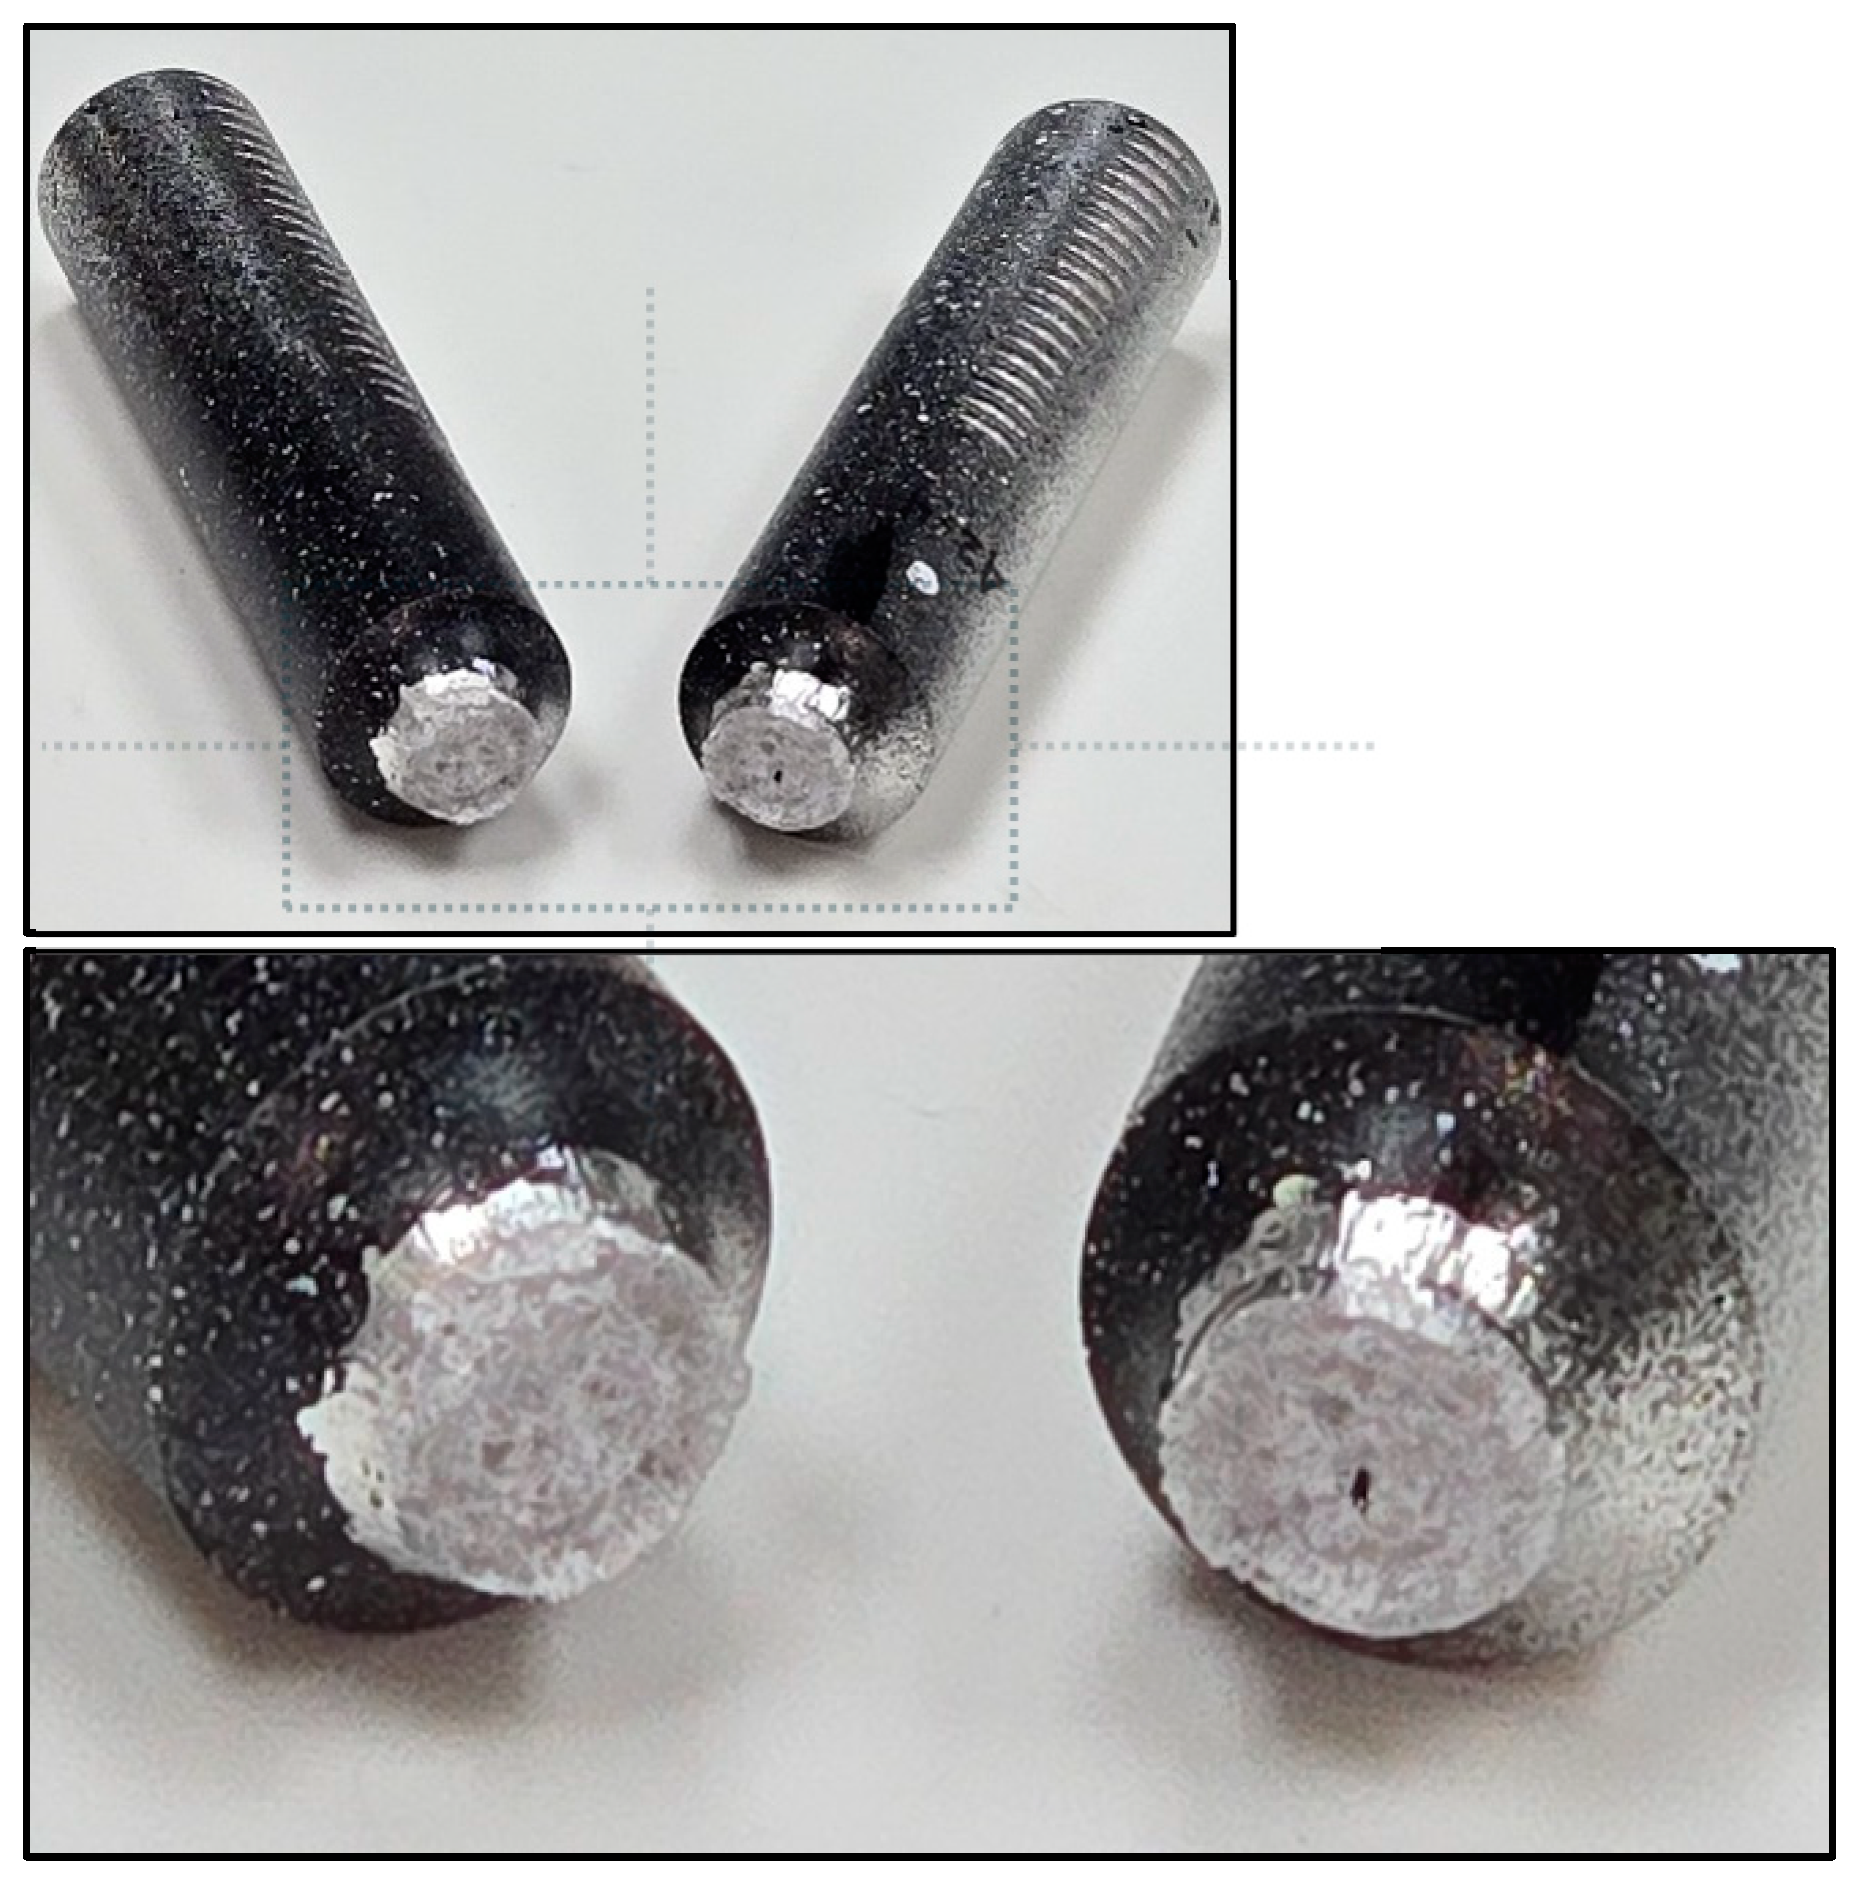
Figure 12.
Ductile fracture of specimen-821450, A36.
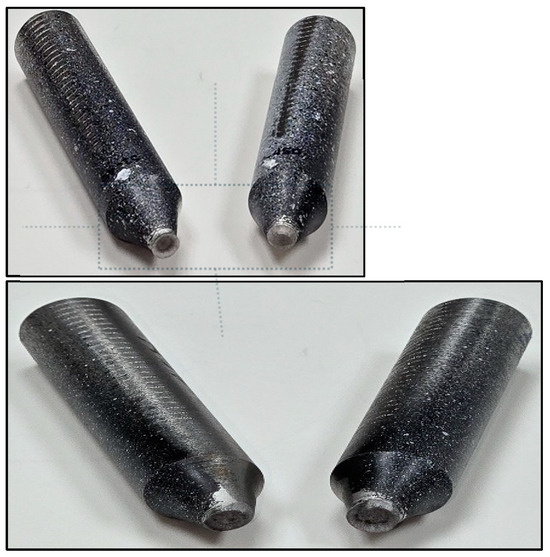
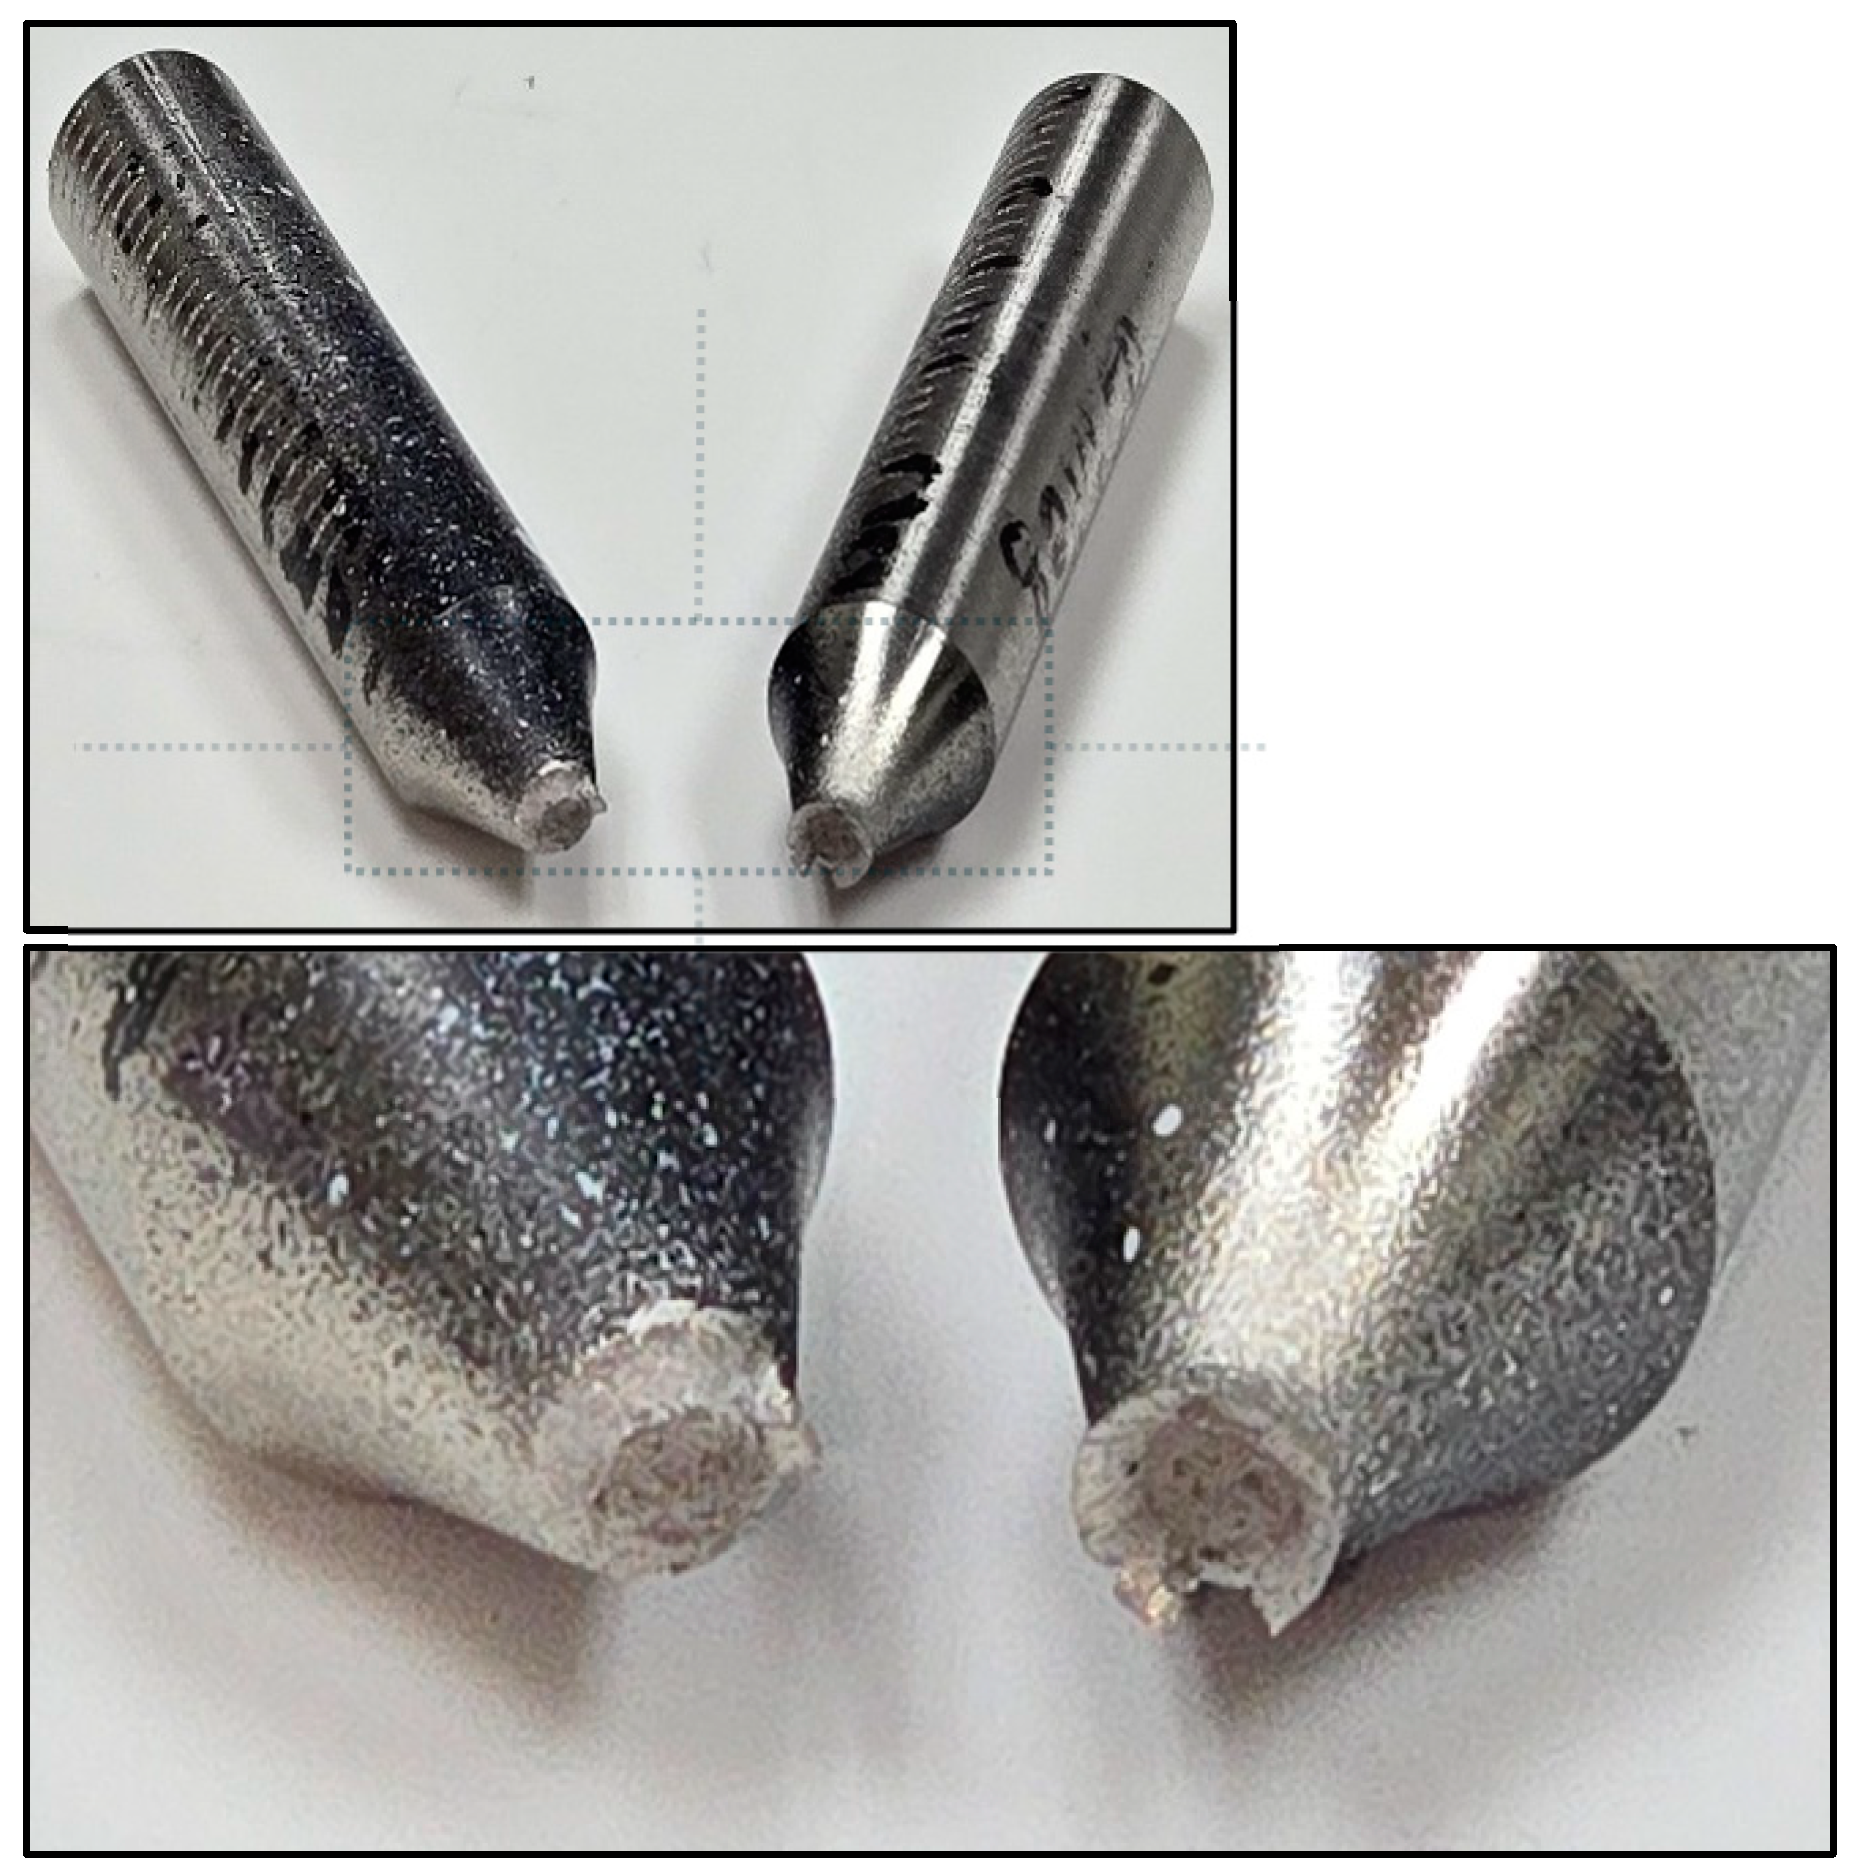
Figure 13.
Ductile fracture of specimen-821450, SS304.

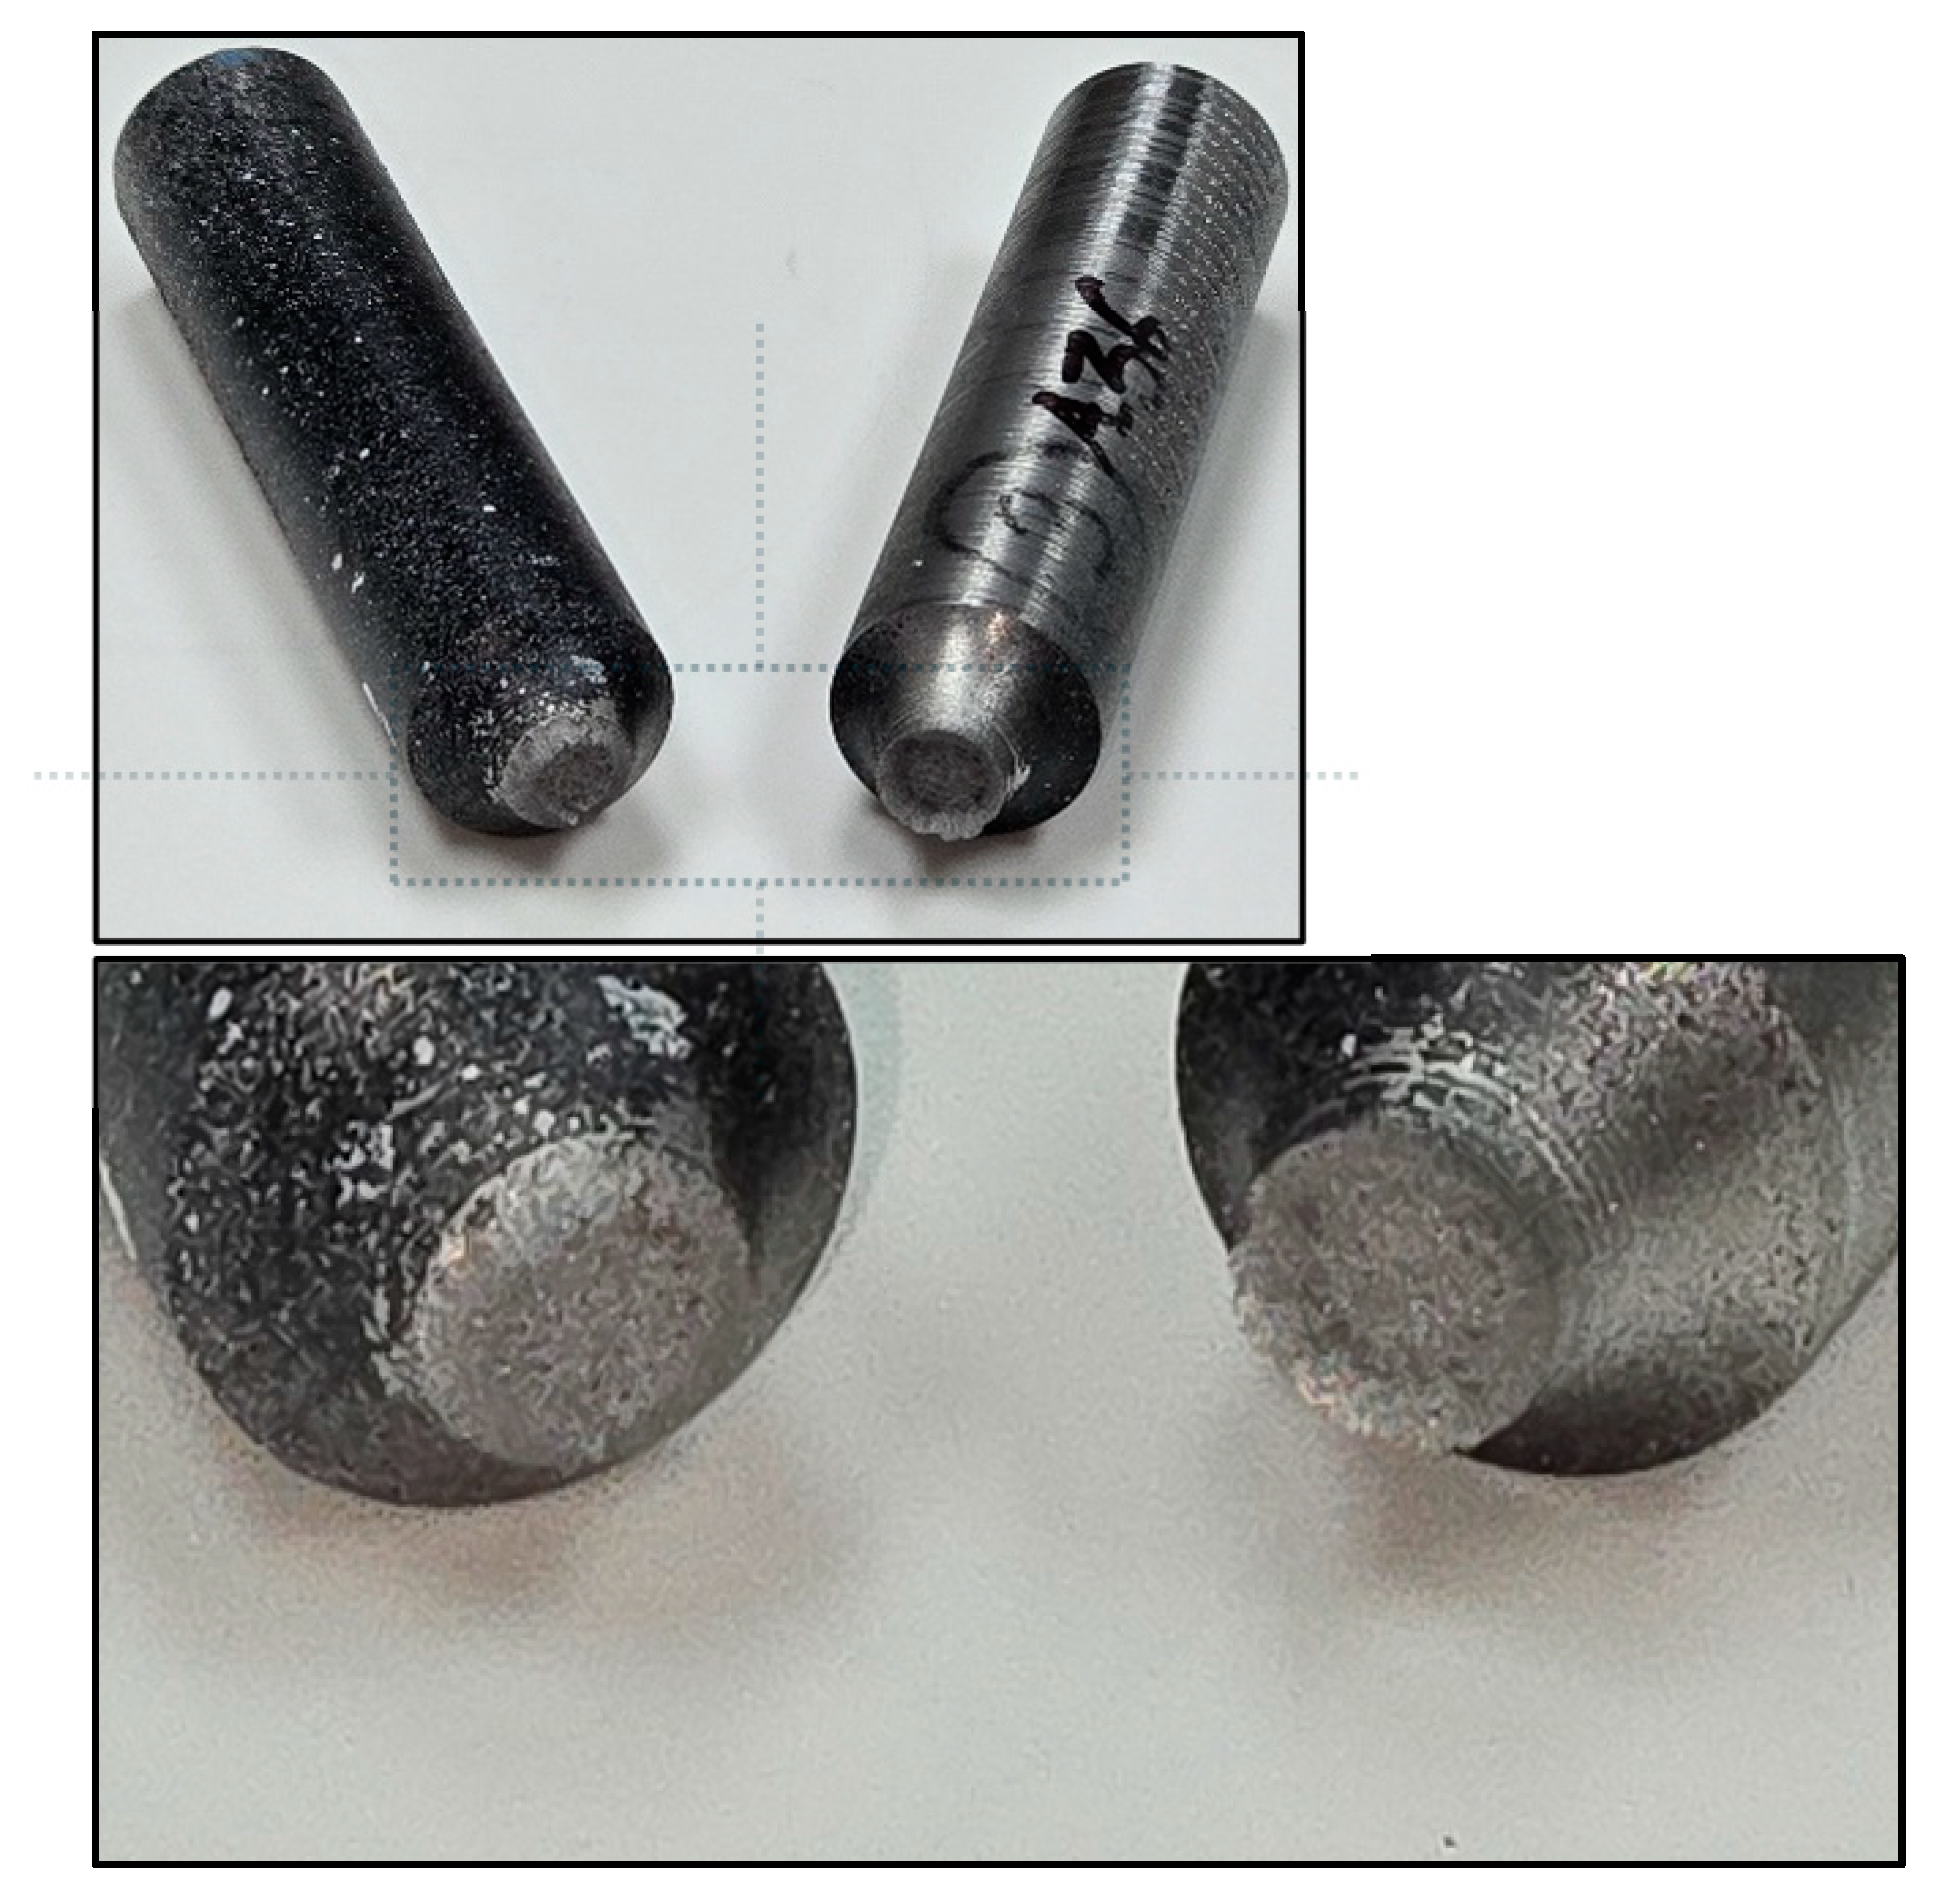
Figure 14.
Ductile fracture of specimen-821450, N60.
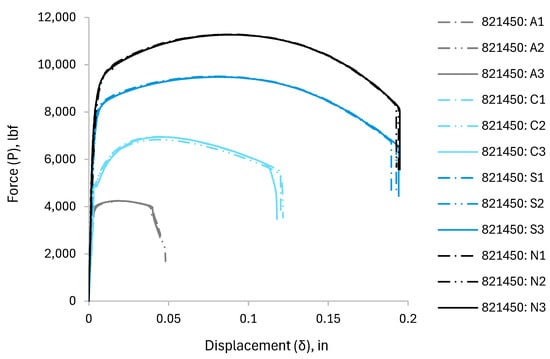
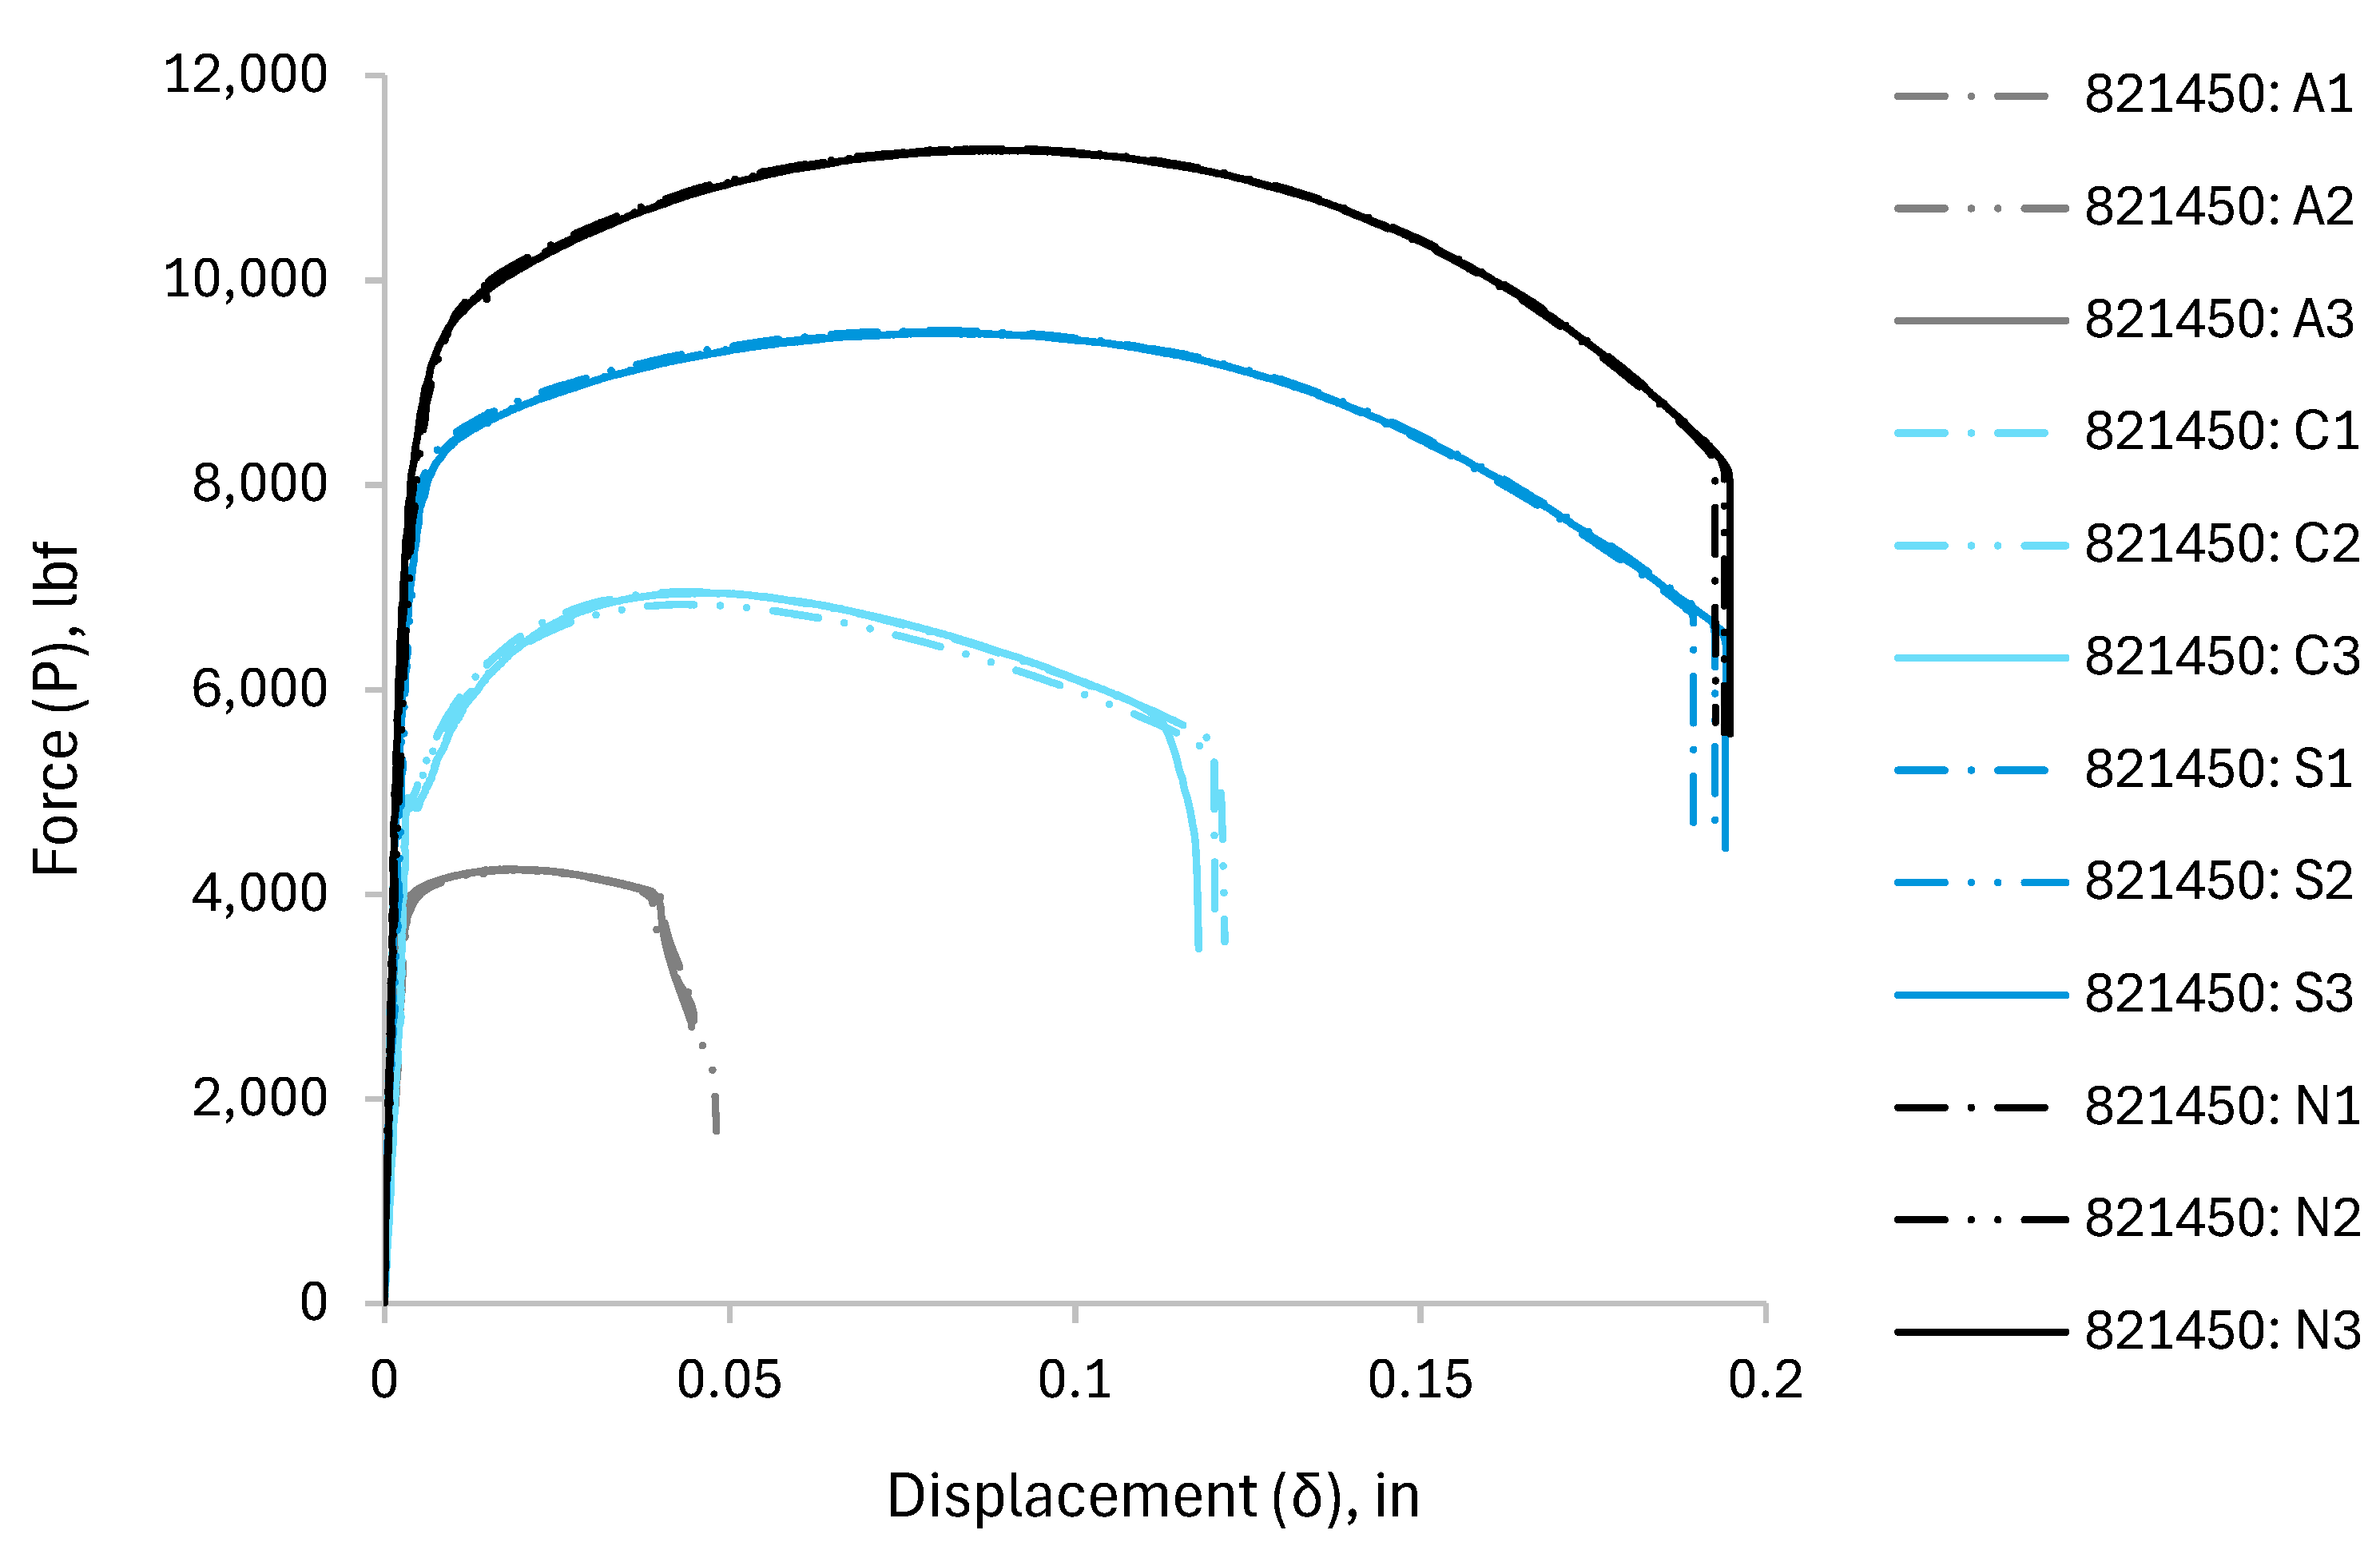
Figure 15.
curve for large-notched round bars (specimen-821450).
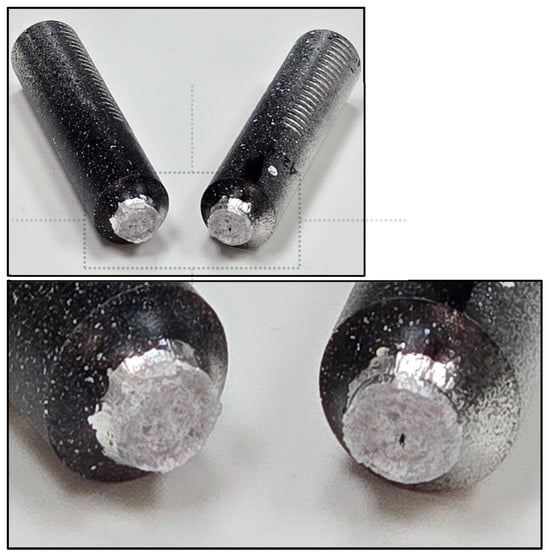
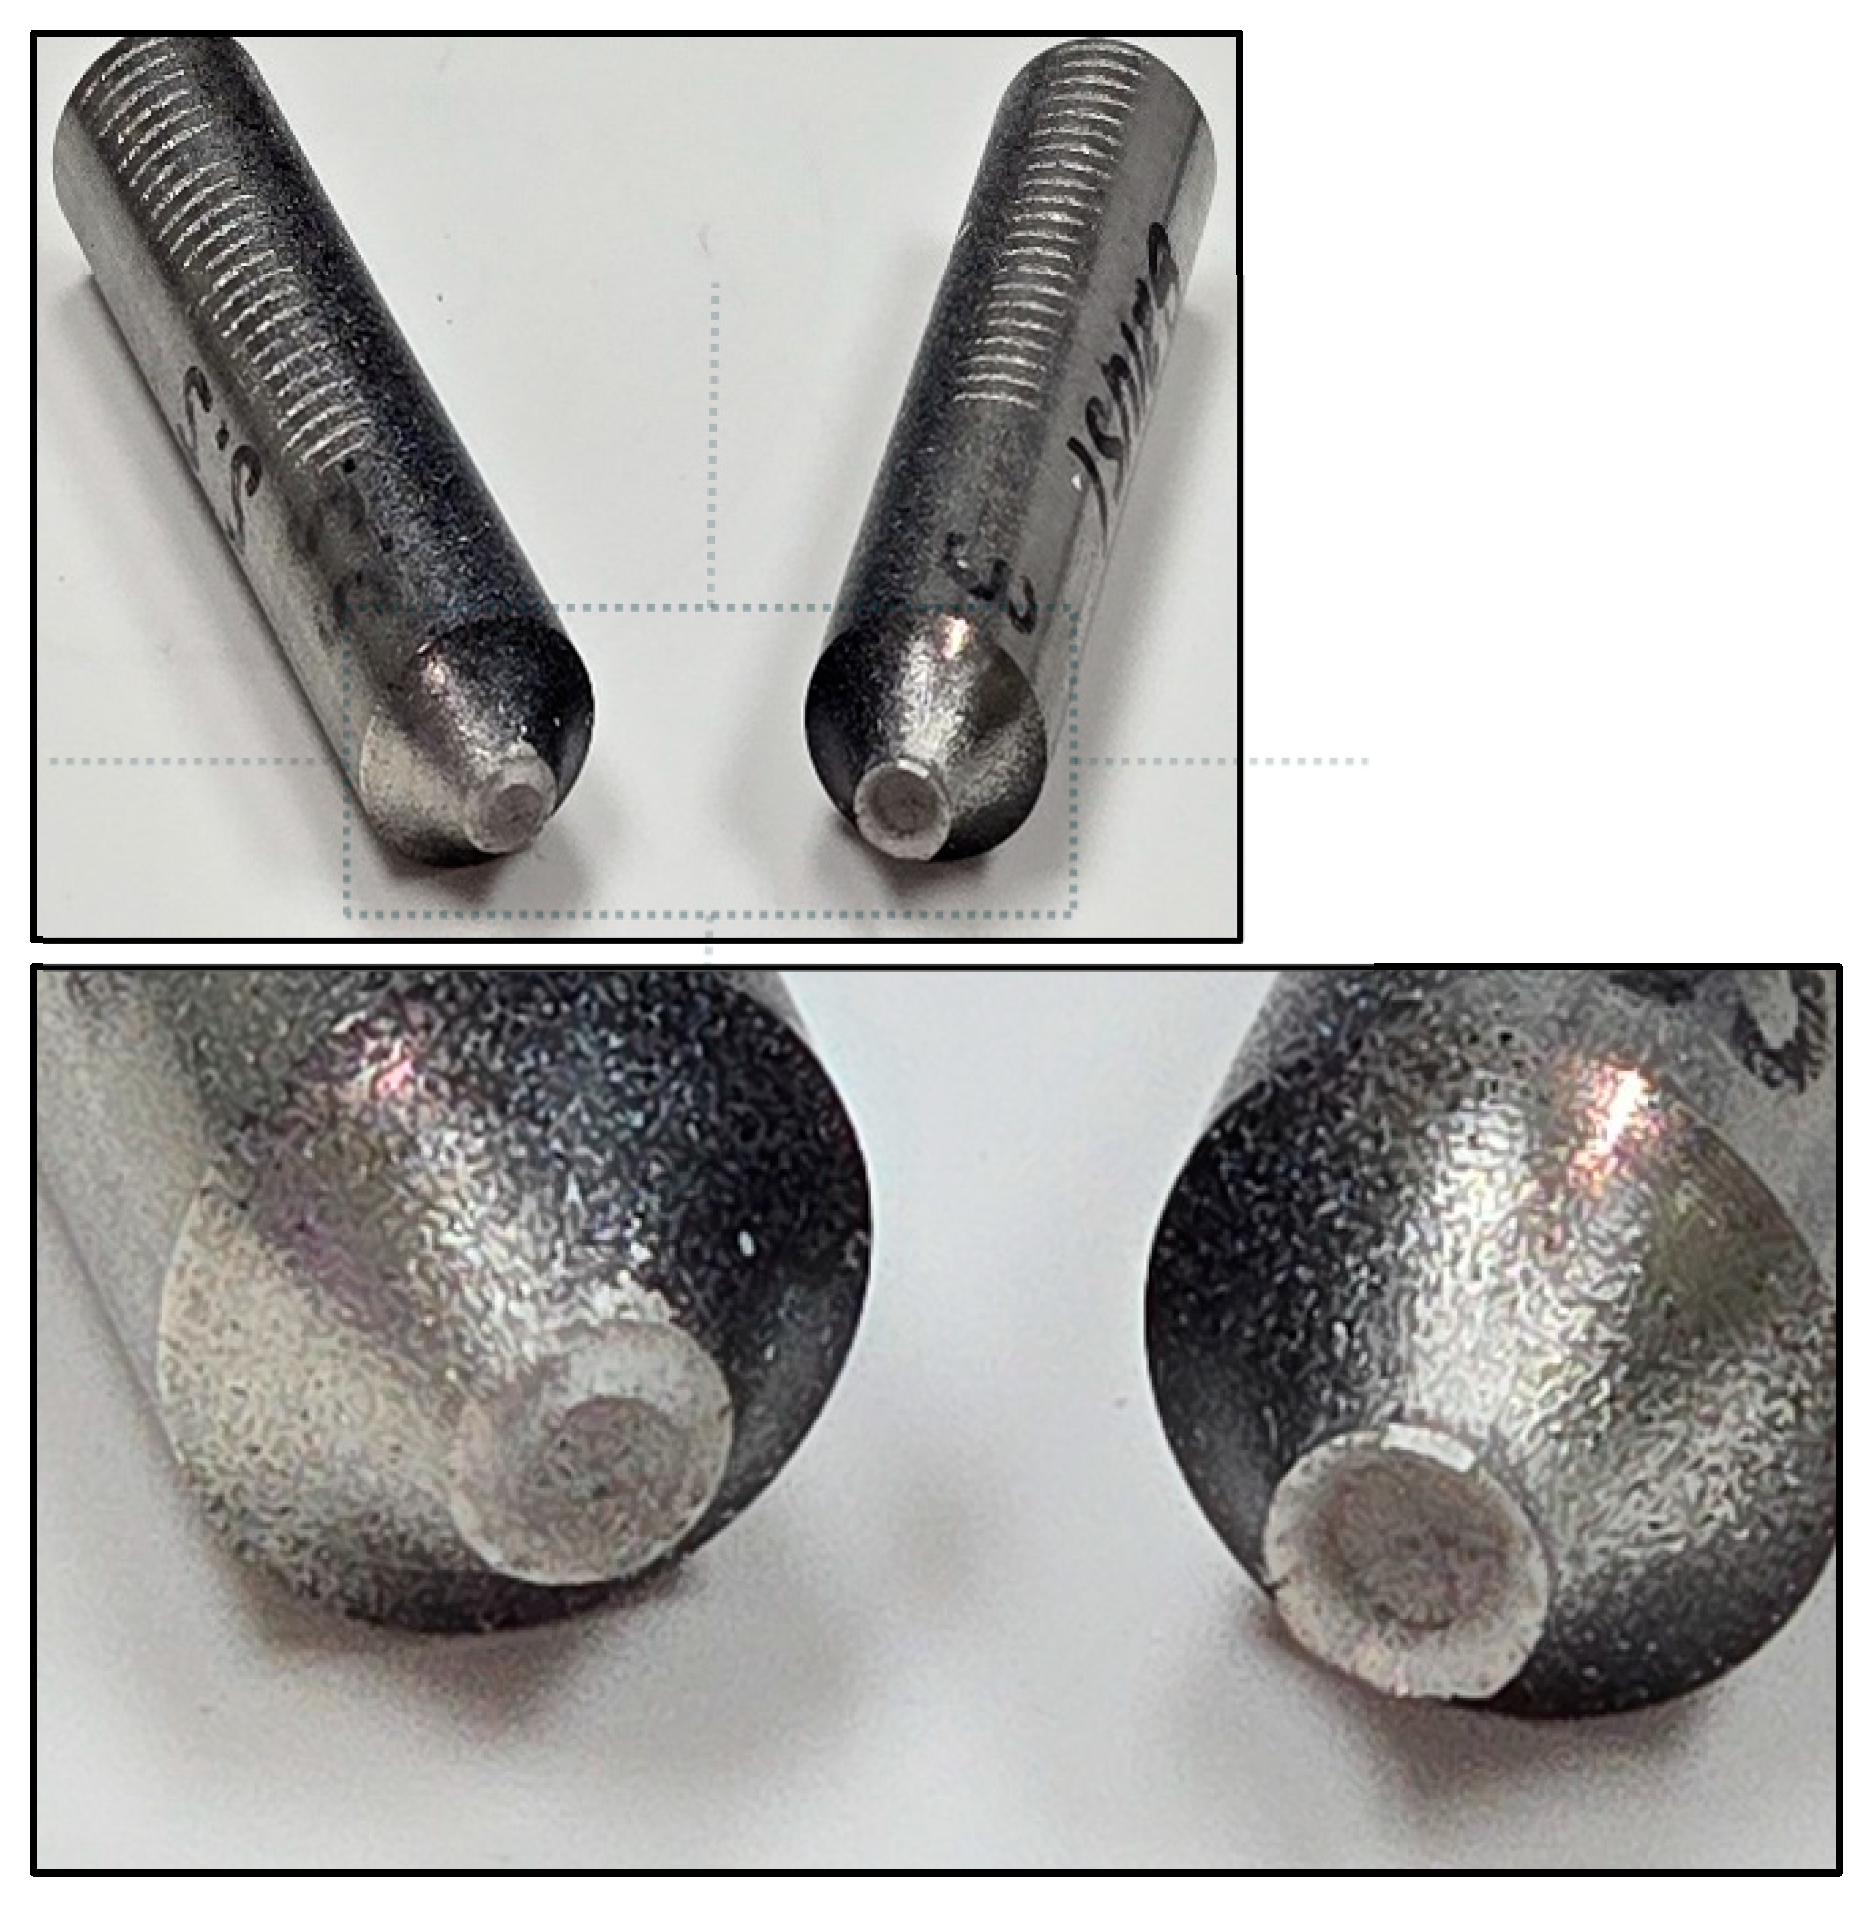
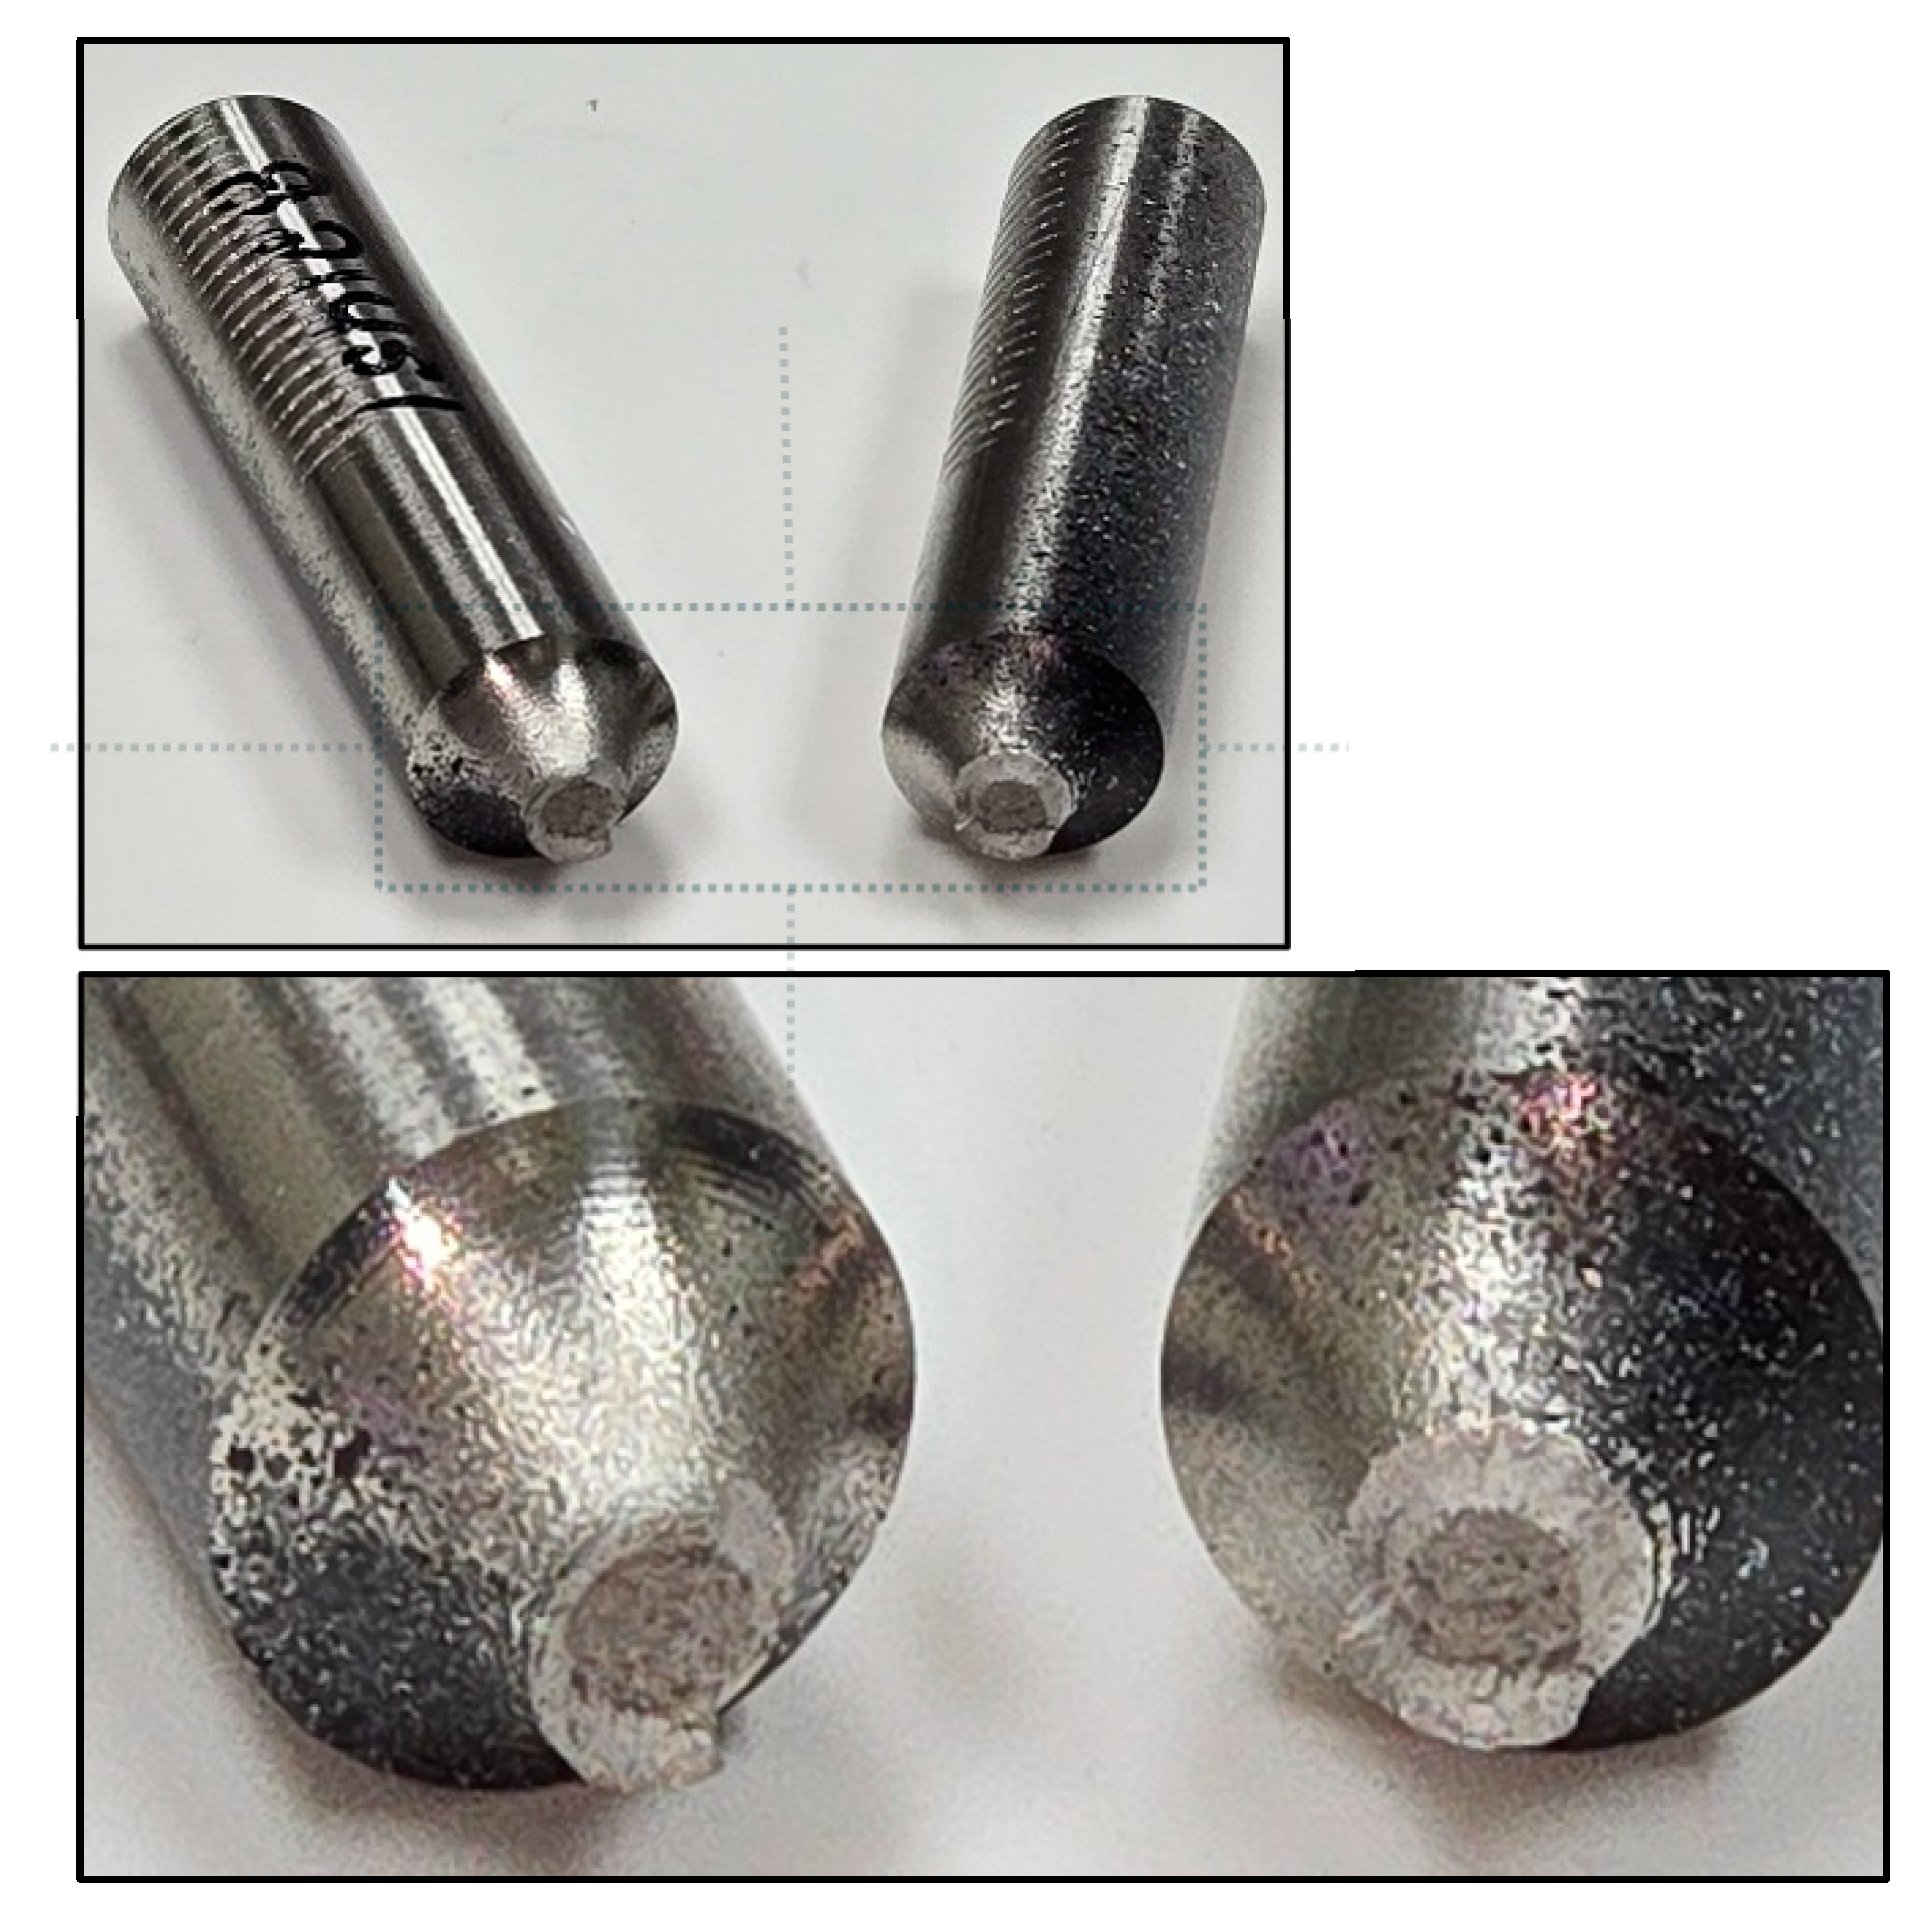
Figure 16.
Ductile fracture of specimen-821451, Al6061.
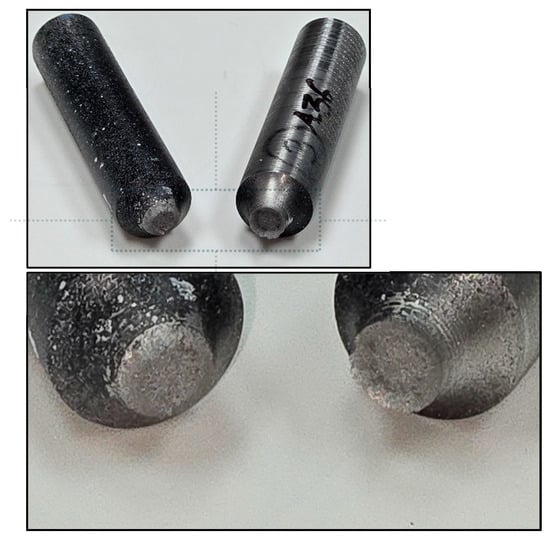
Figure 17.
Ductile fracture of specimen-821451, A36.

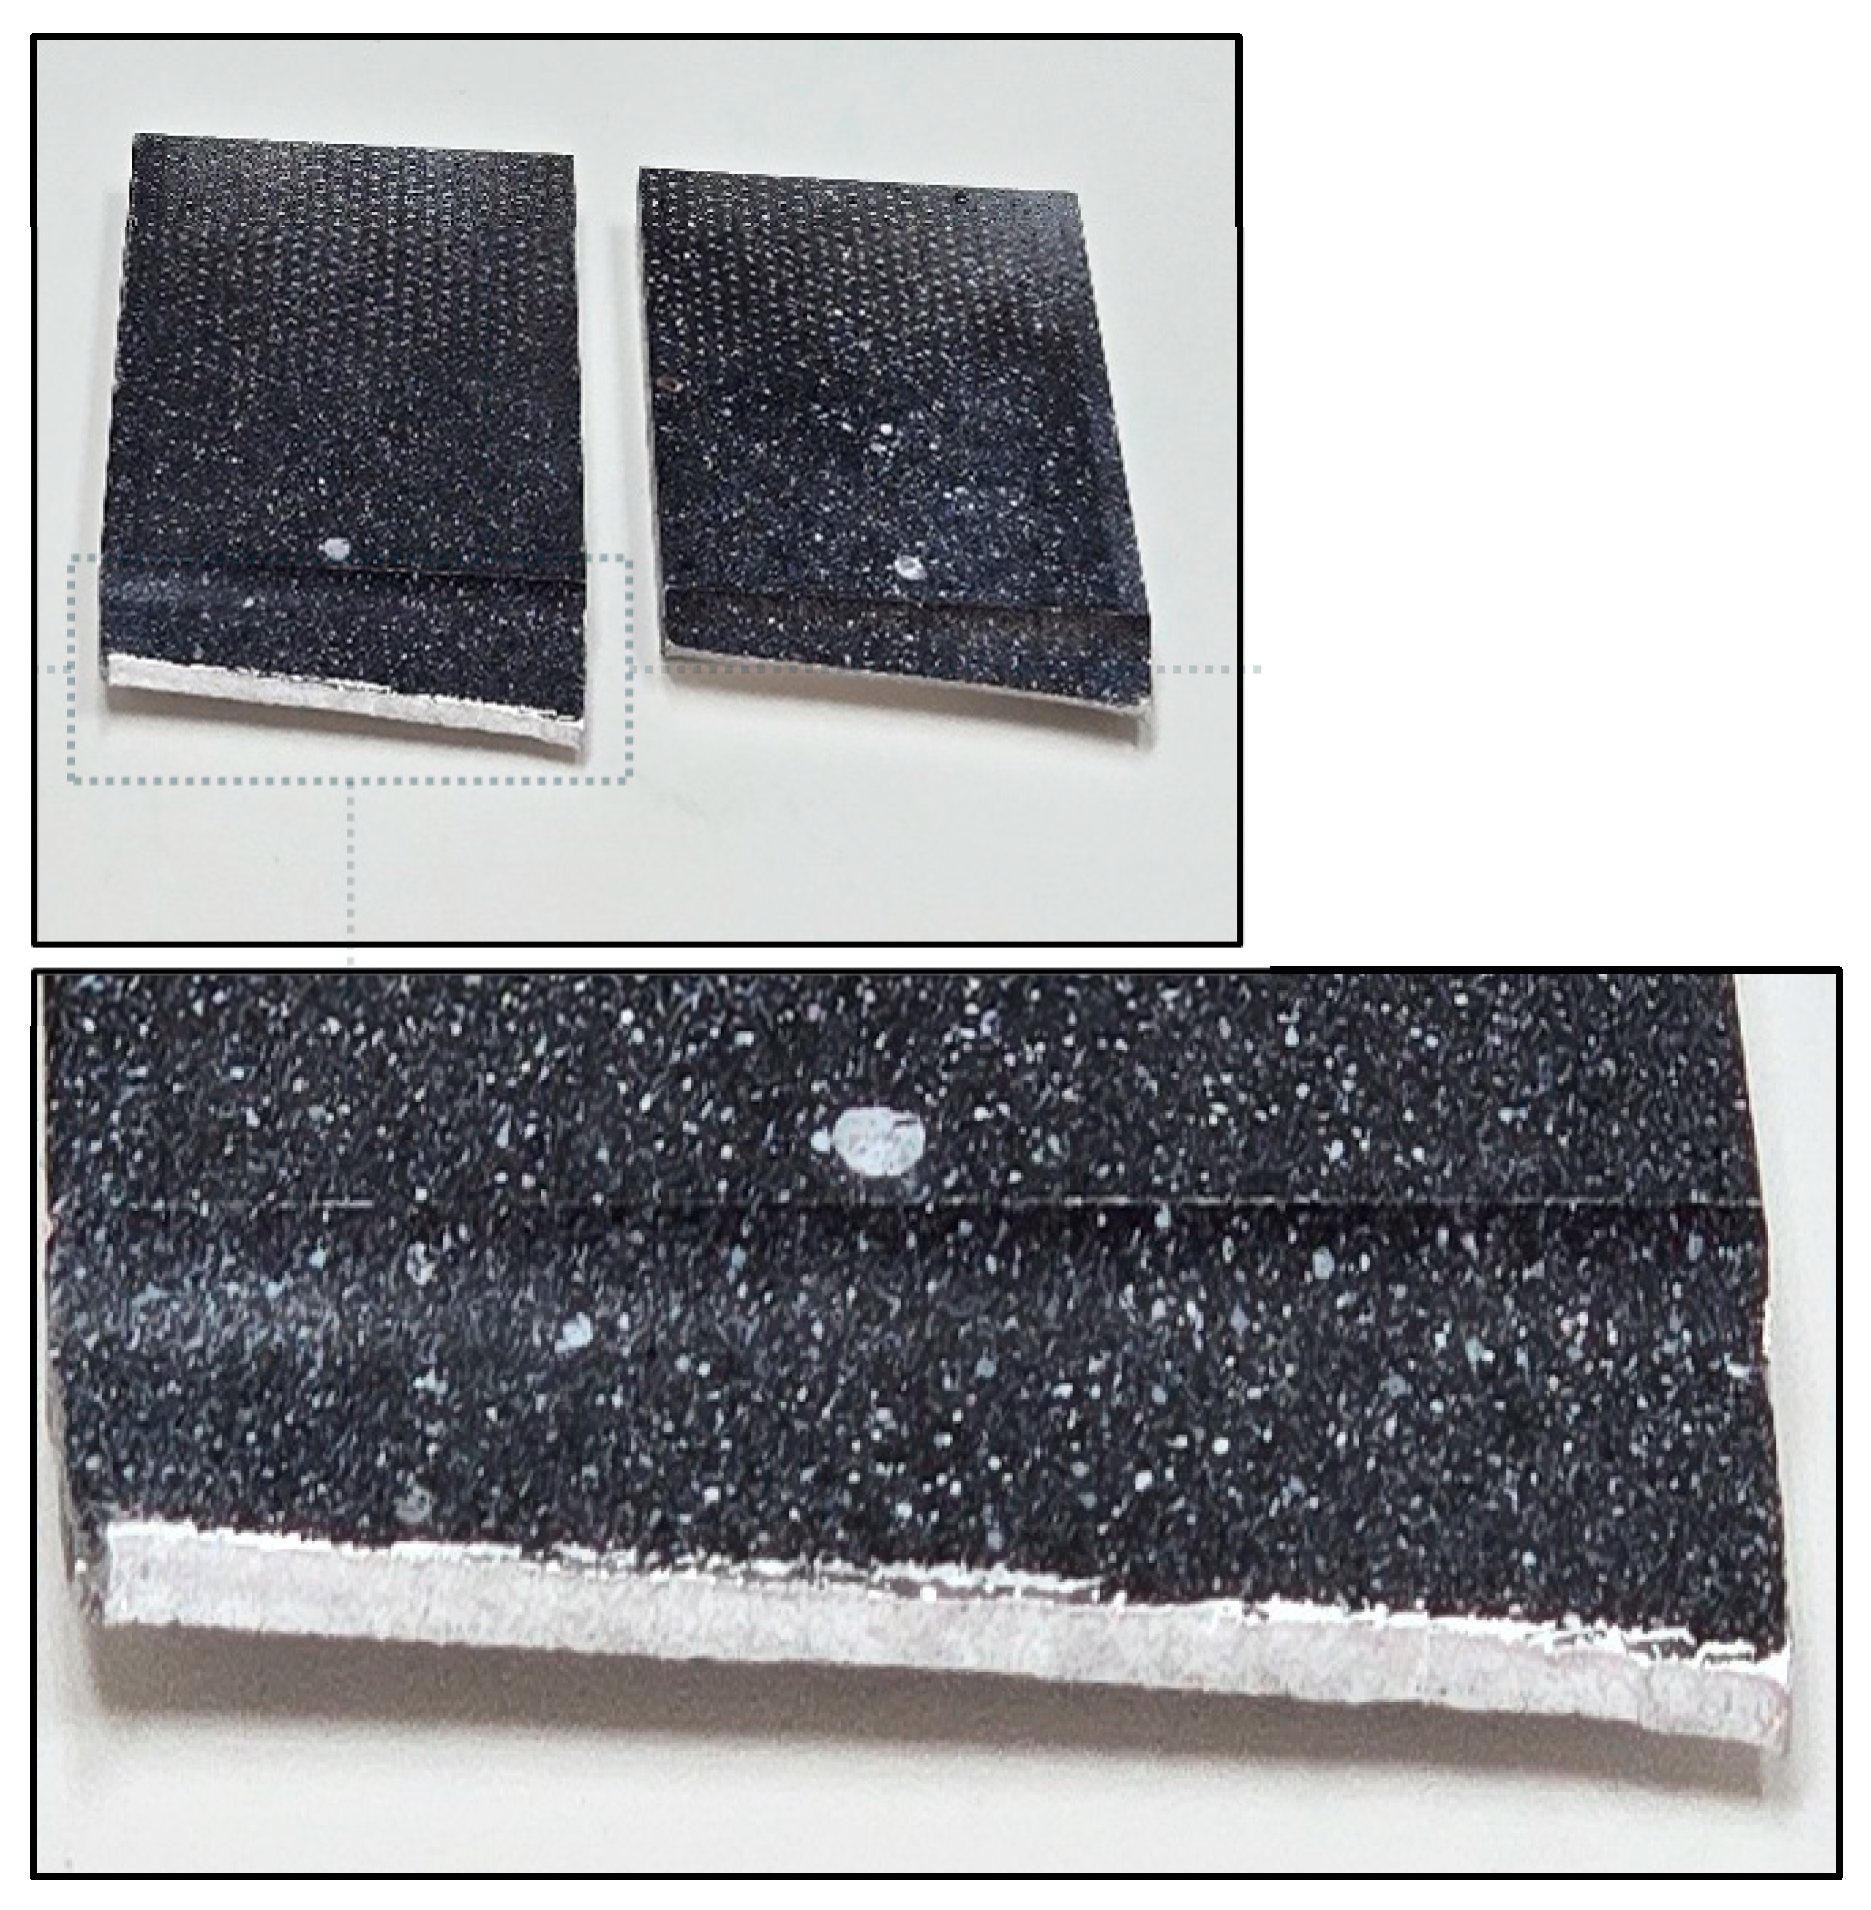
Figure 18.
Ductile fracture of specimen-821451, SS304.
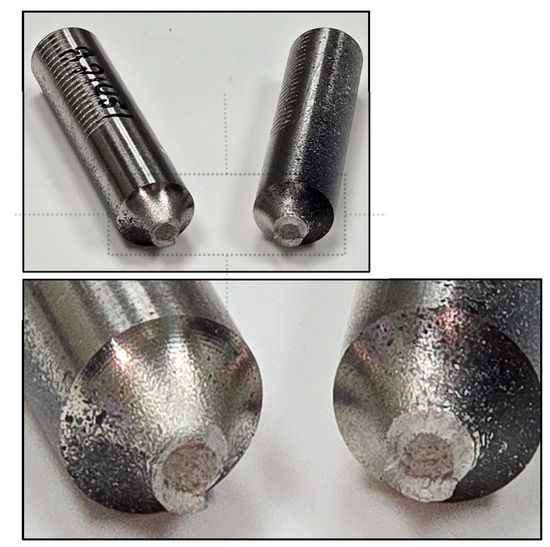
Figure 19.
Ductile fracture of specimen-821451, N60.
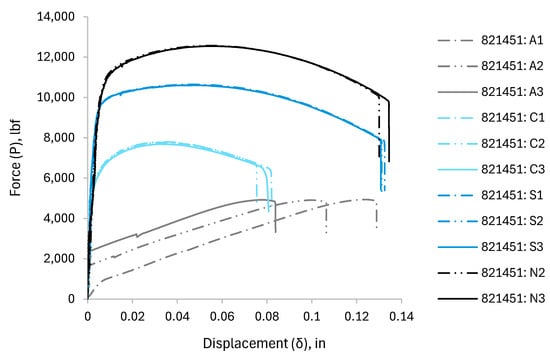
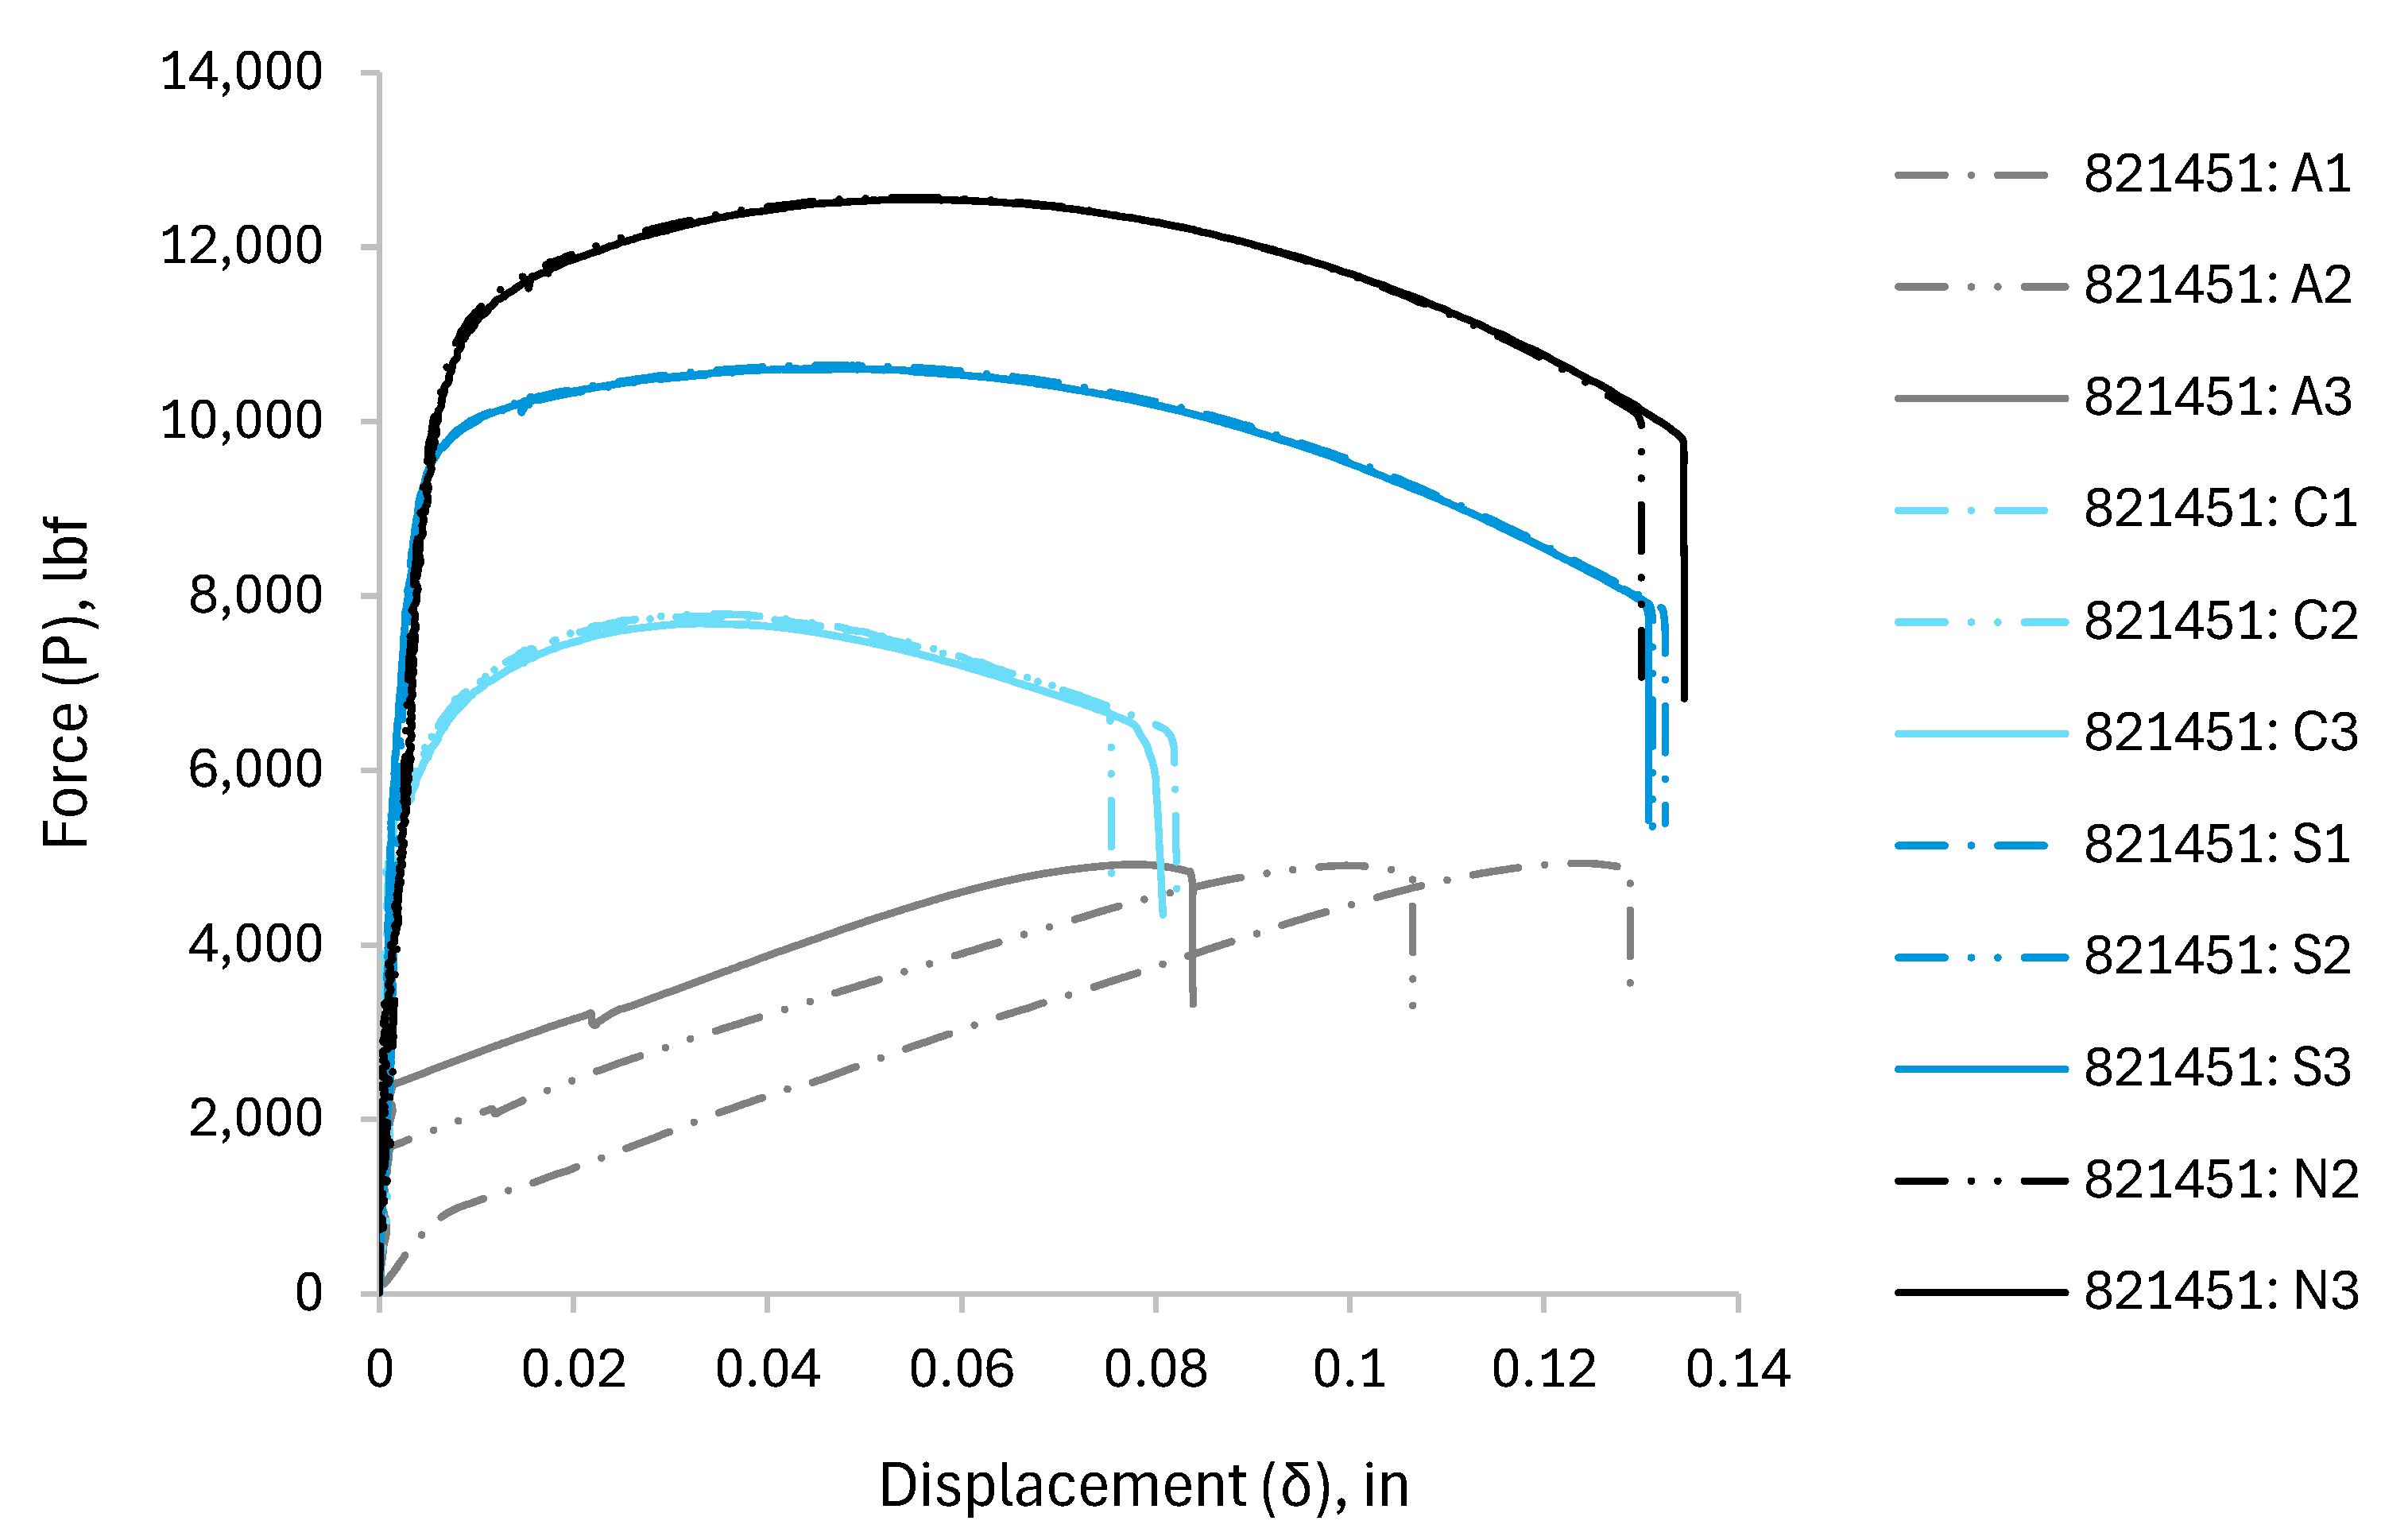
Figure 20.
curve for small-notched round bars (specimen-821451).
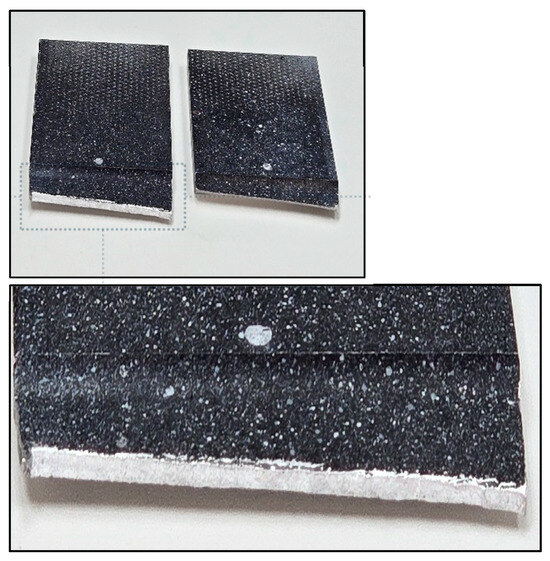
Figure 21.
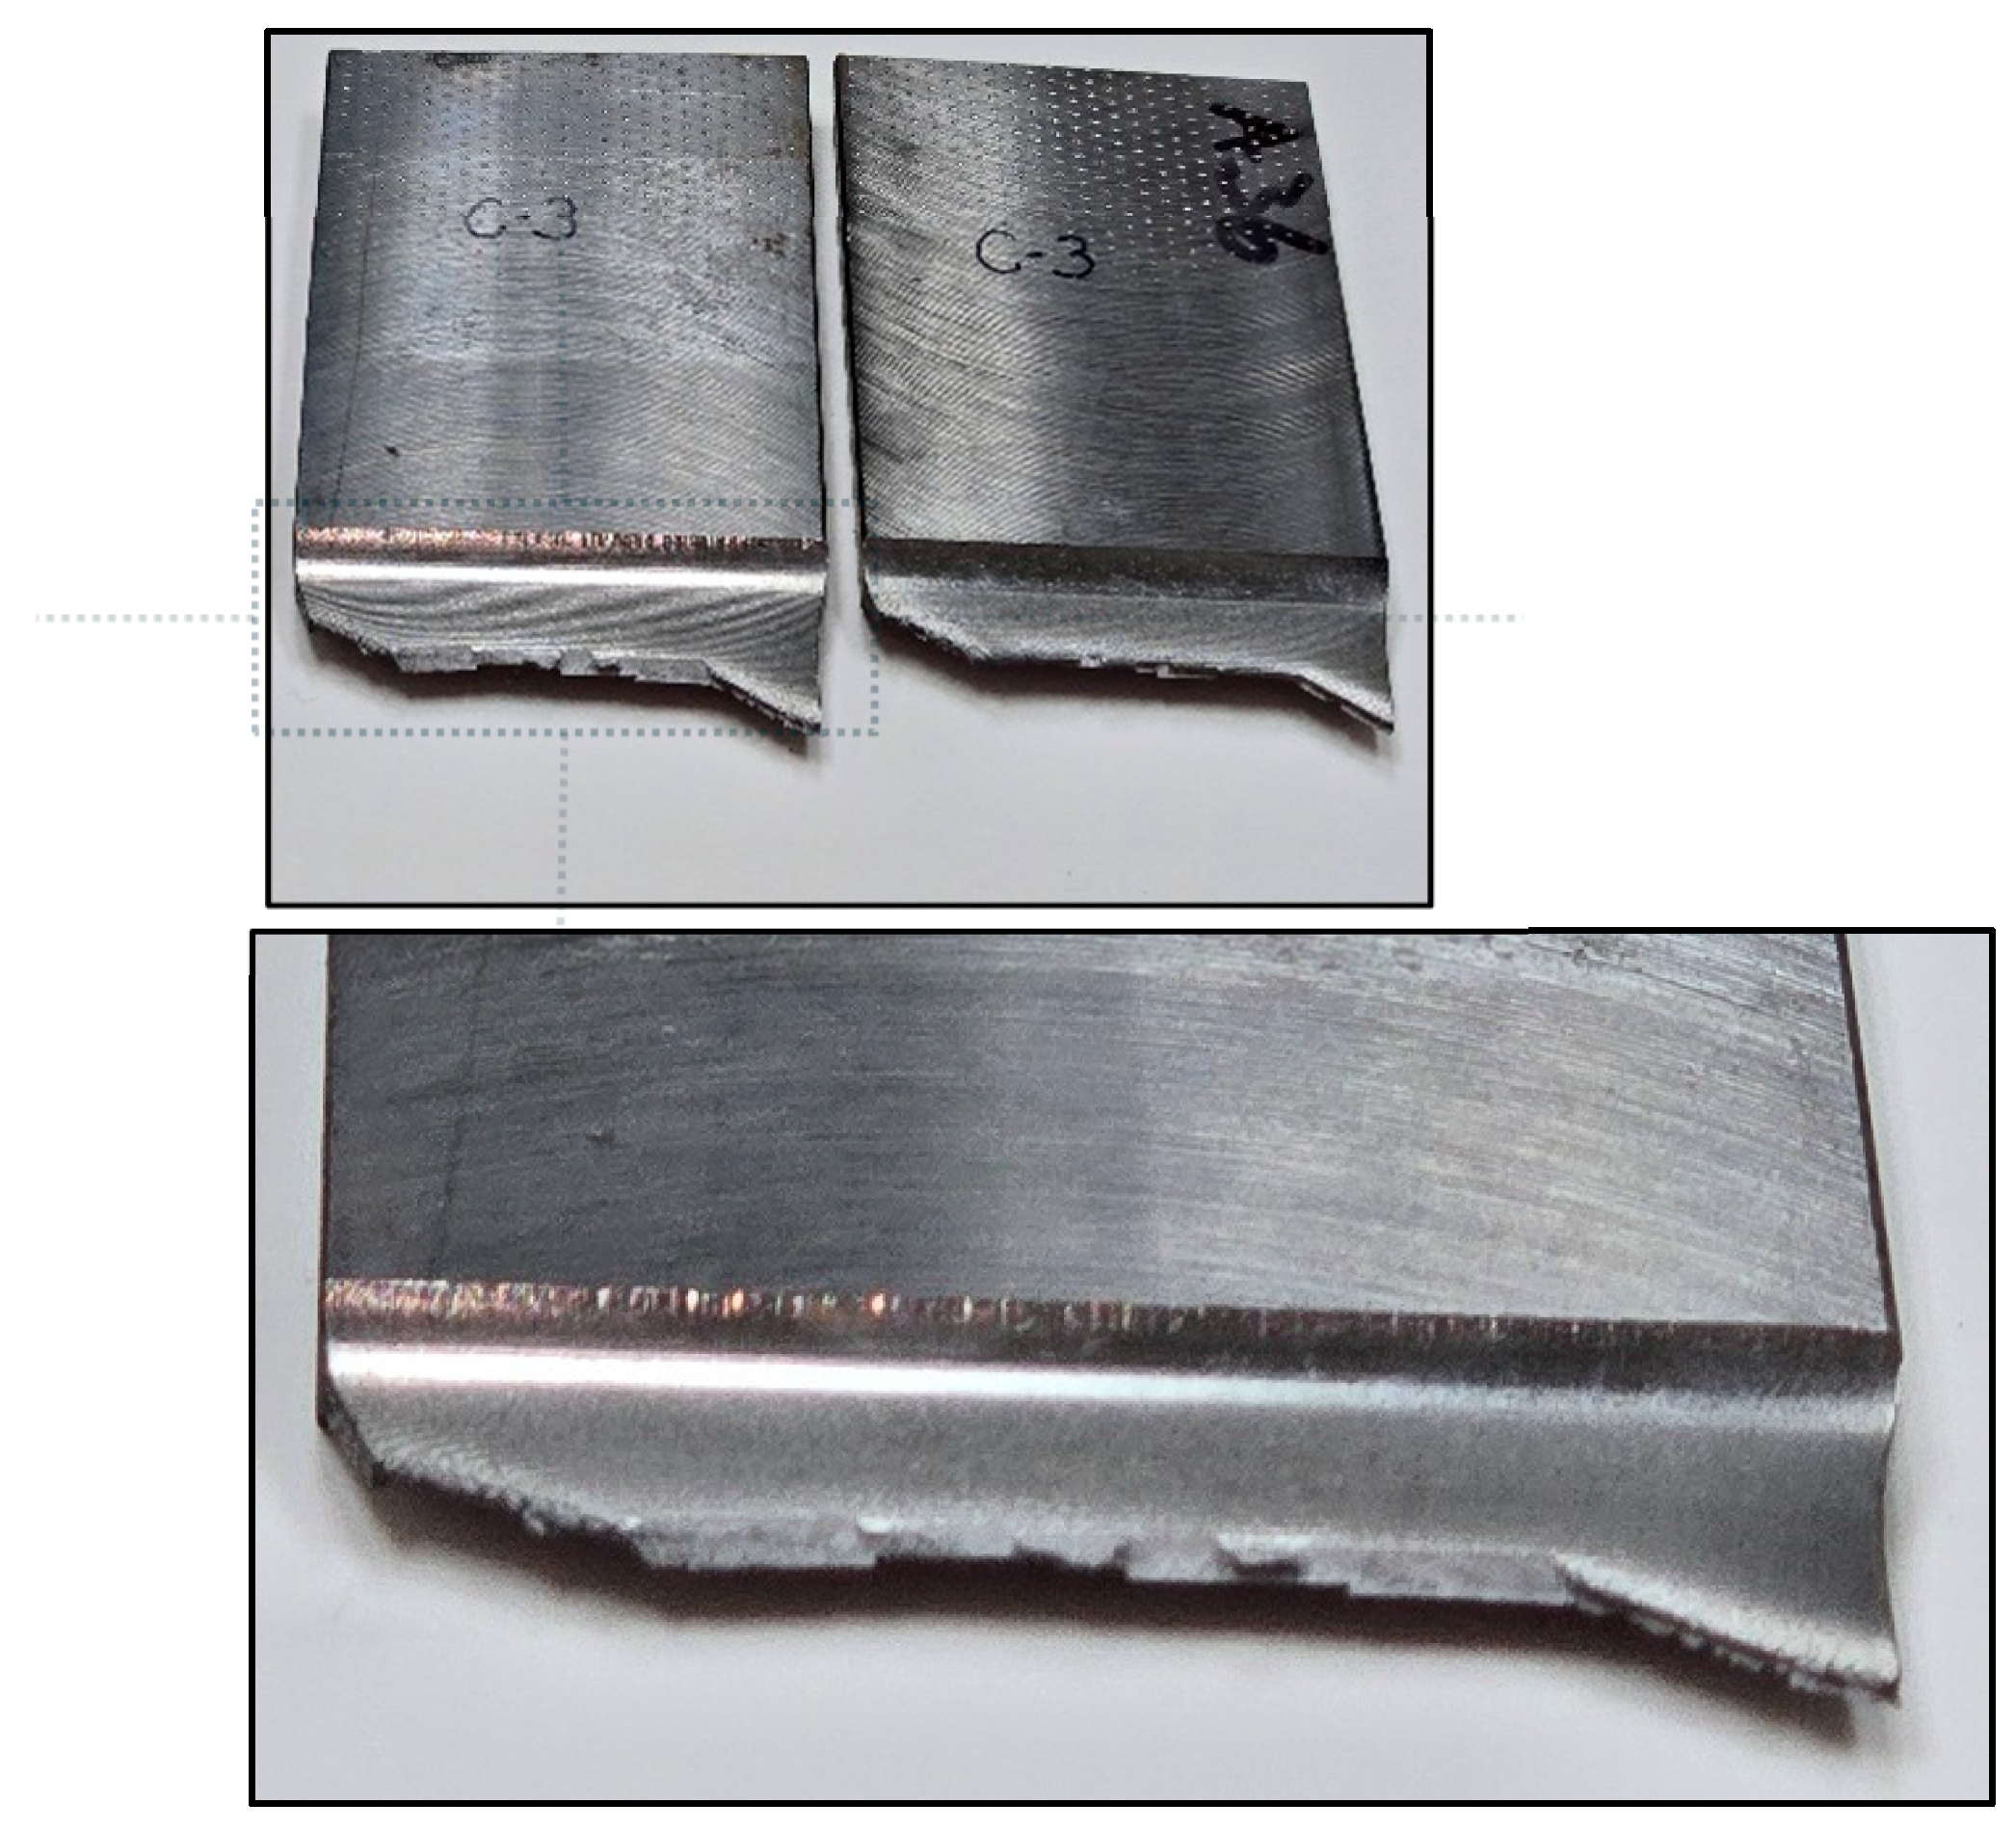
Ductile fracture of specimen-821452, Al6061.
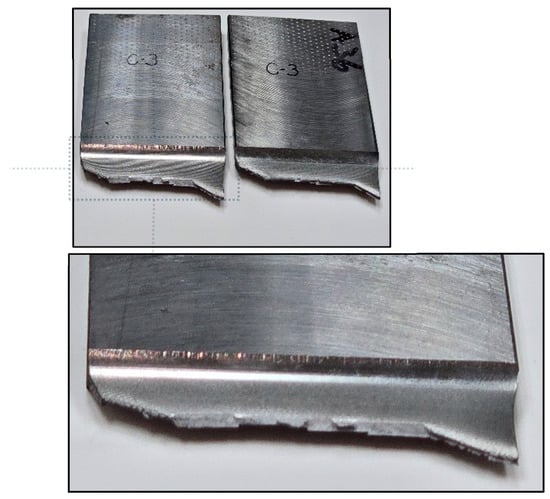
Figure 22.
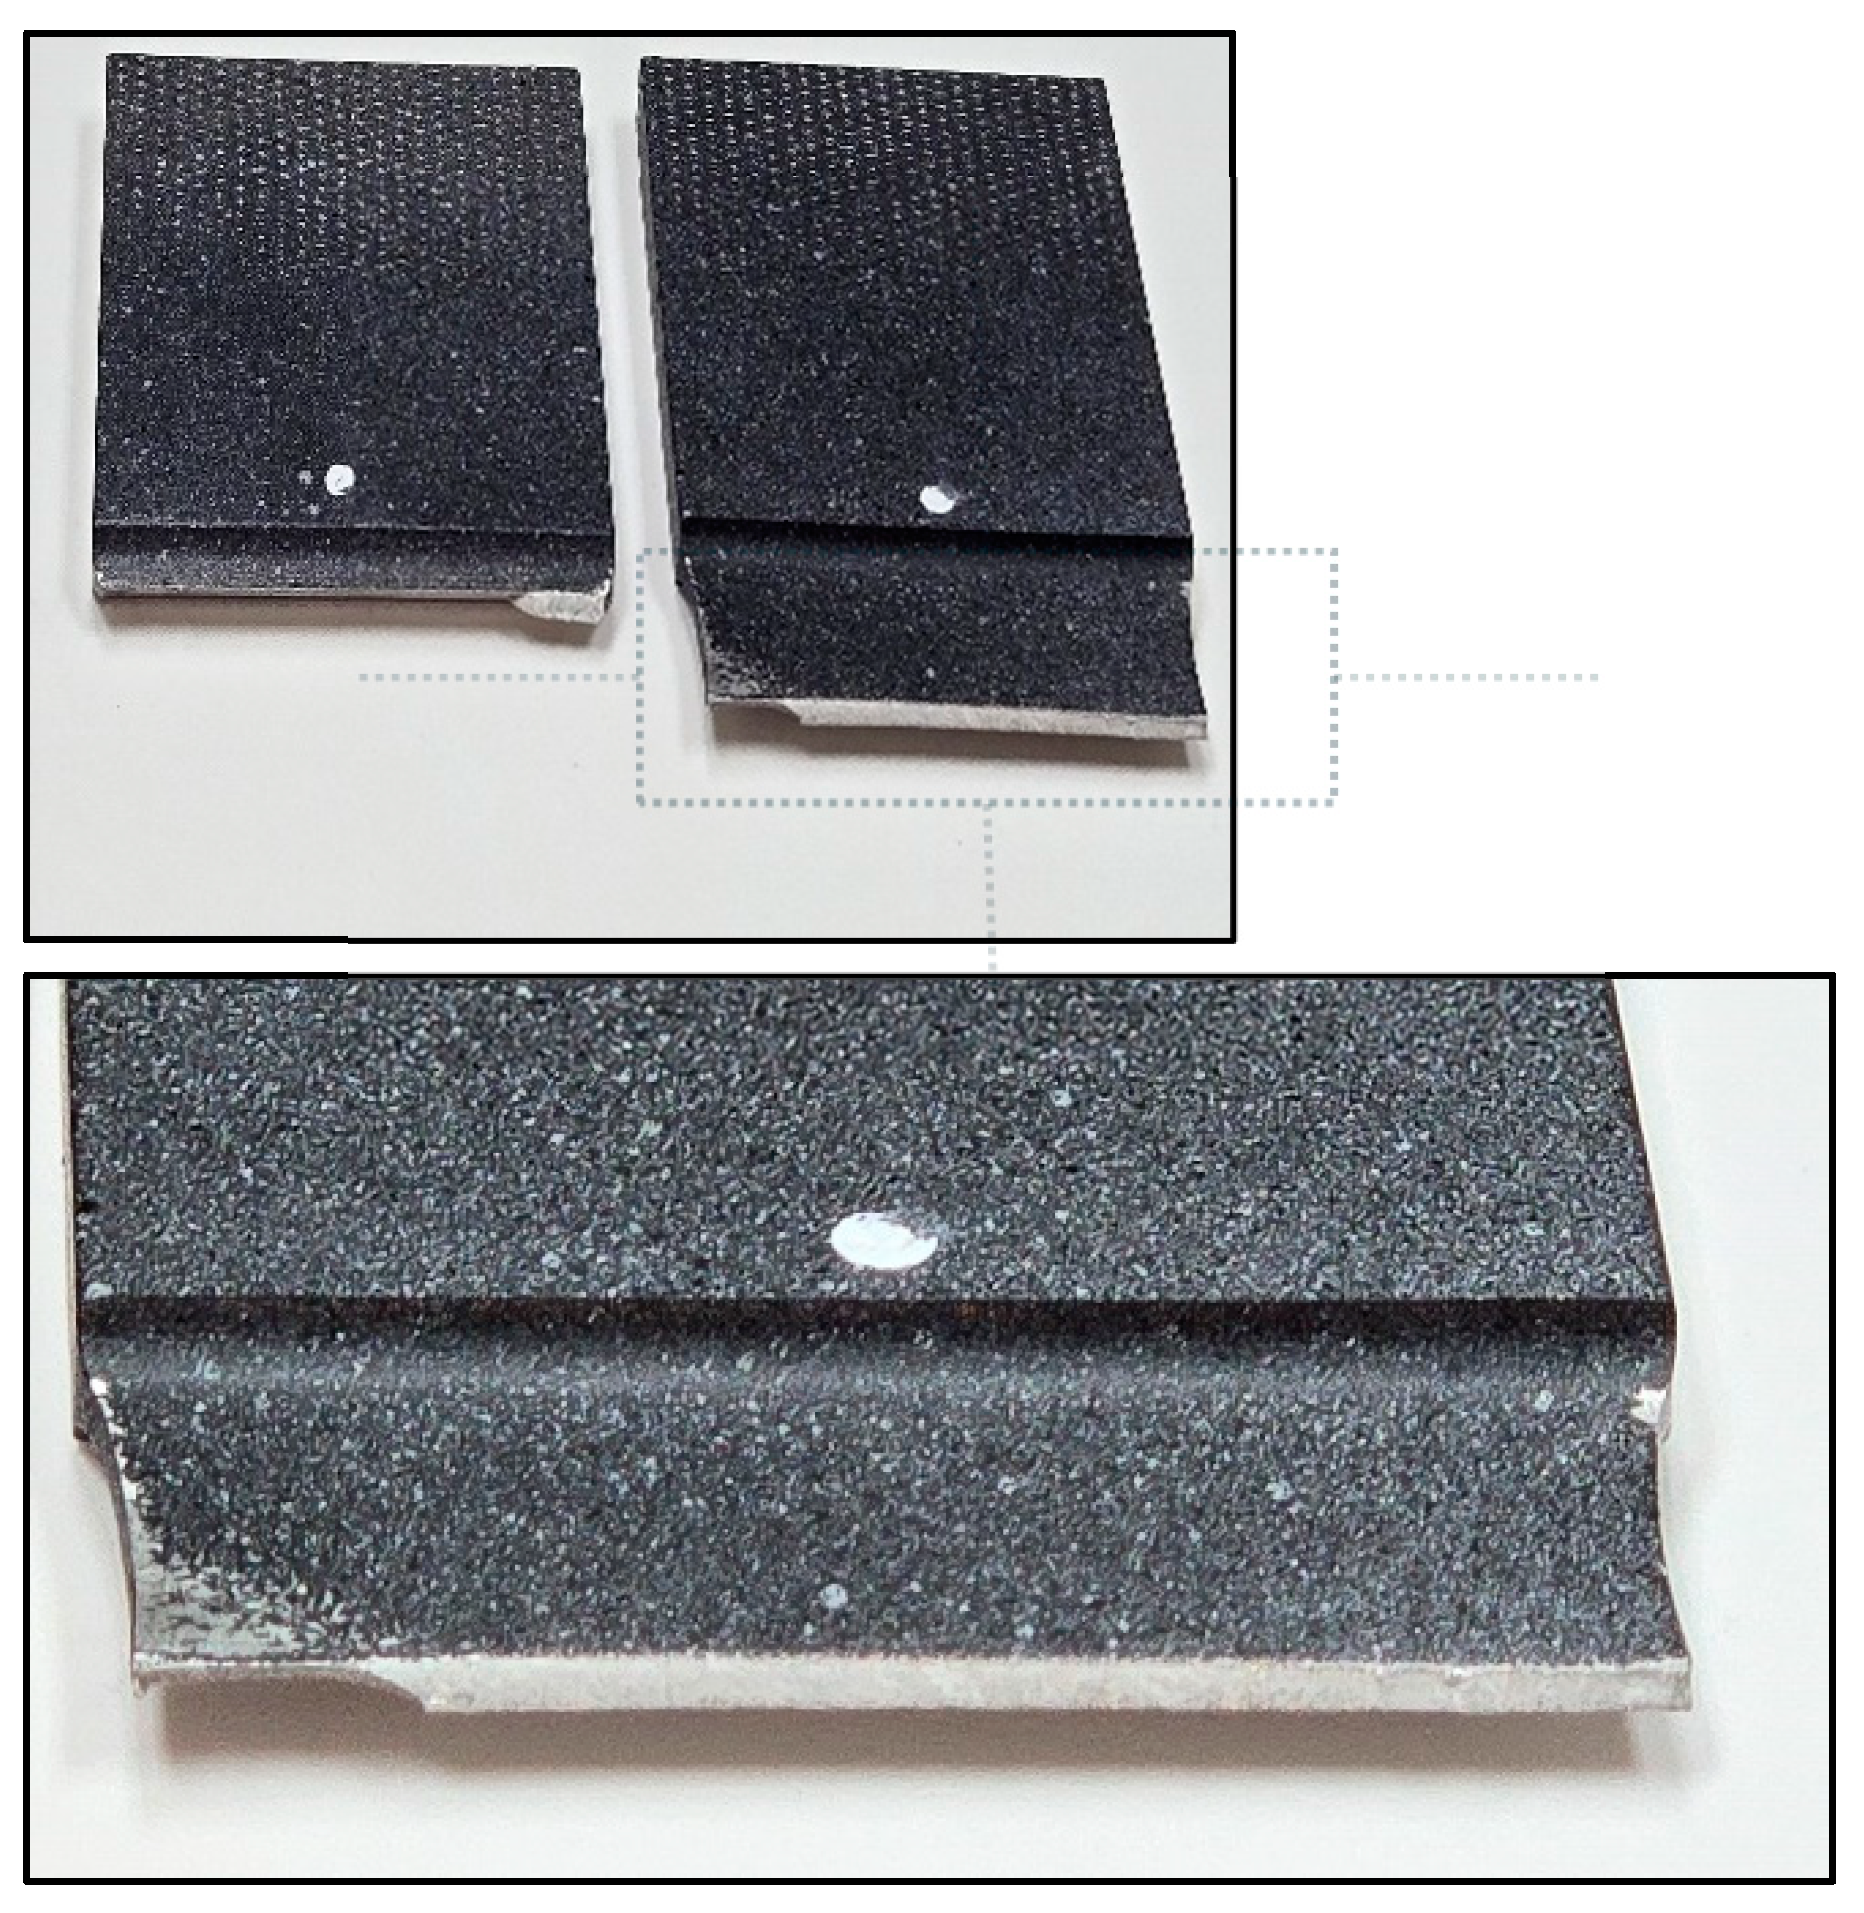
Ductile fracture of specimen-821452, A36.
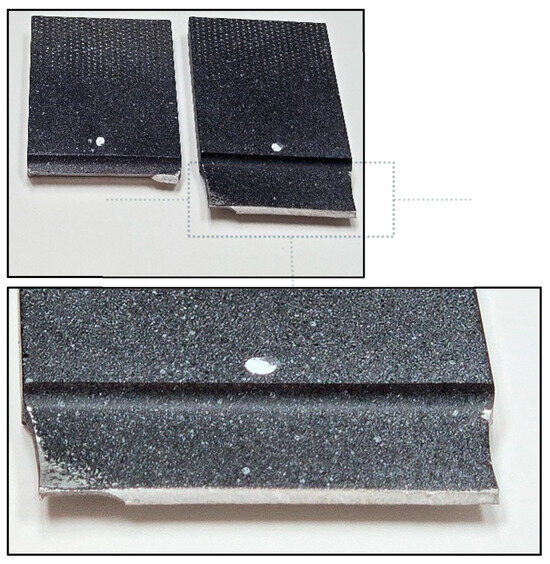
Figure 23.
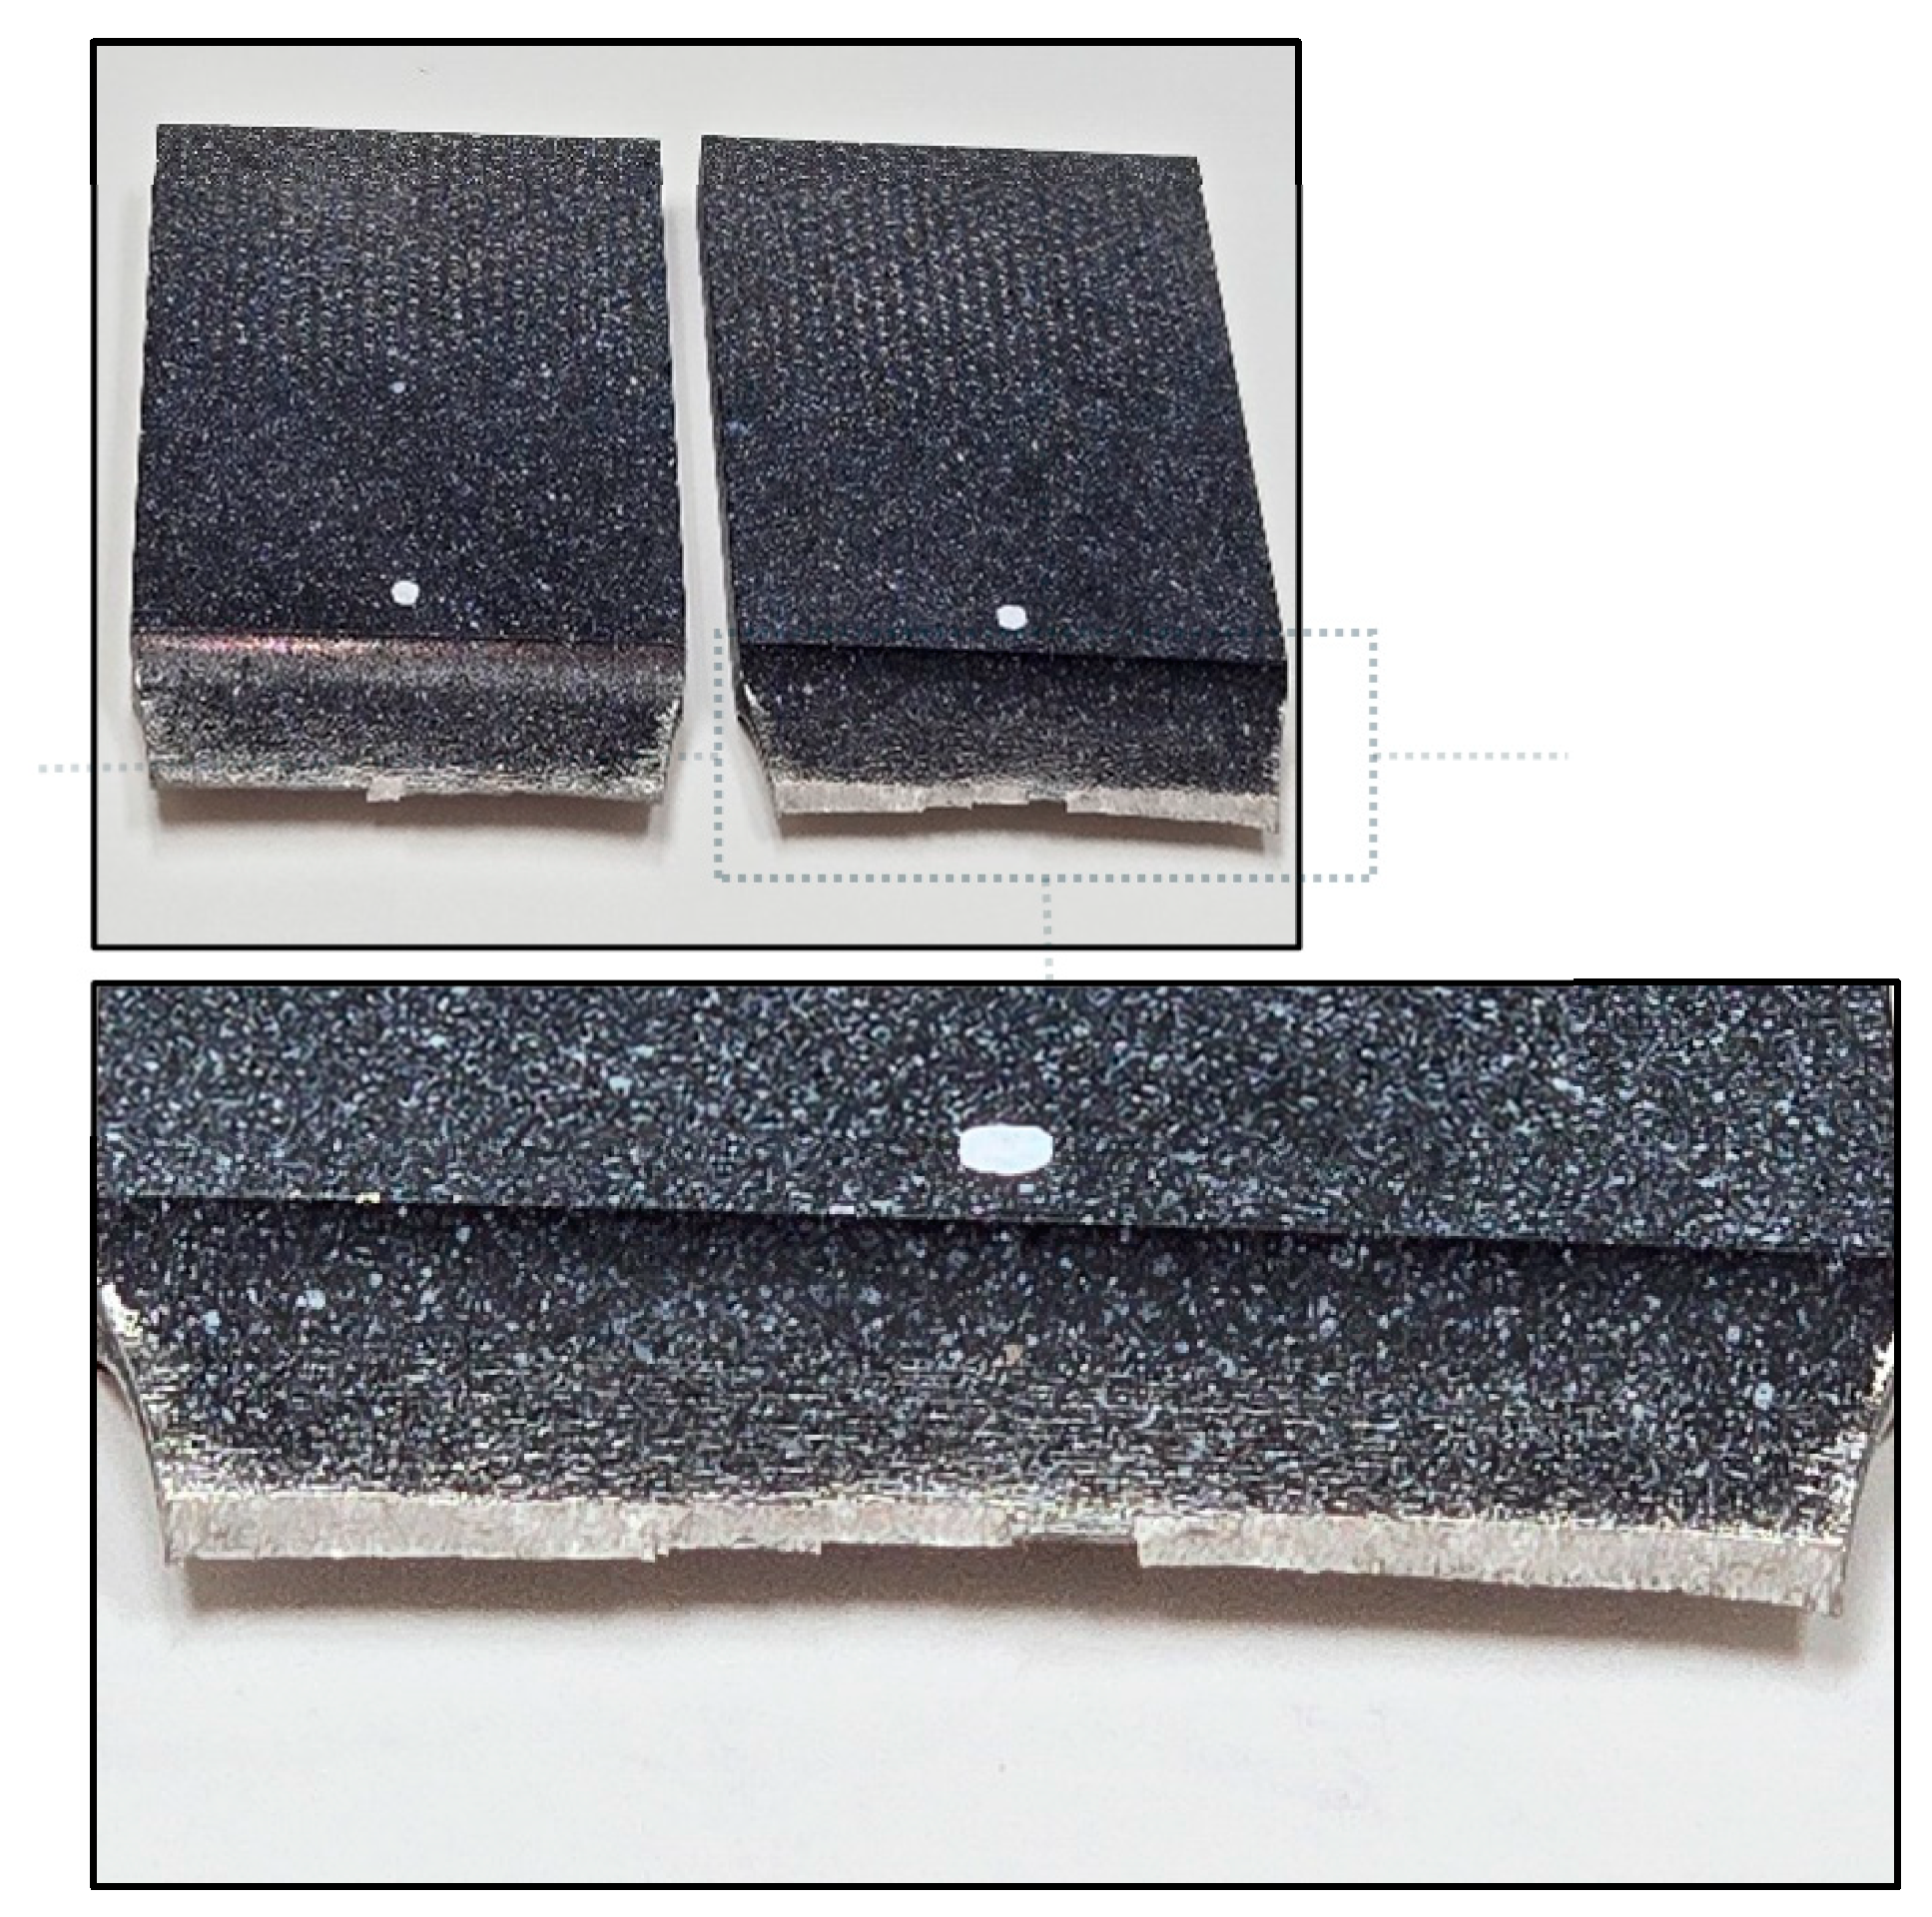
Ductile fracture of specimen-821452, SS304.
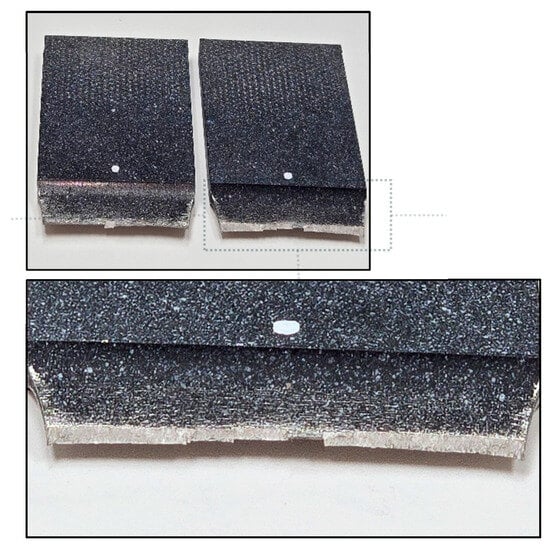
Figure 24.
Ductile fracture of specimen-821452, N60.
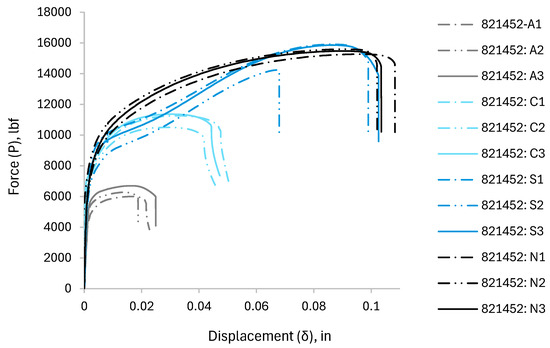
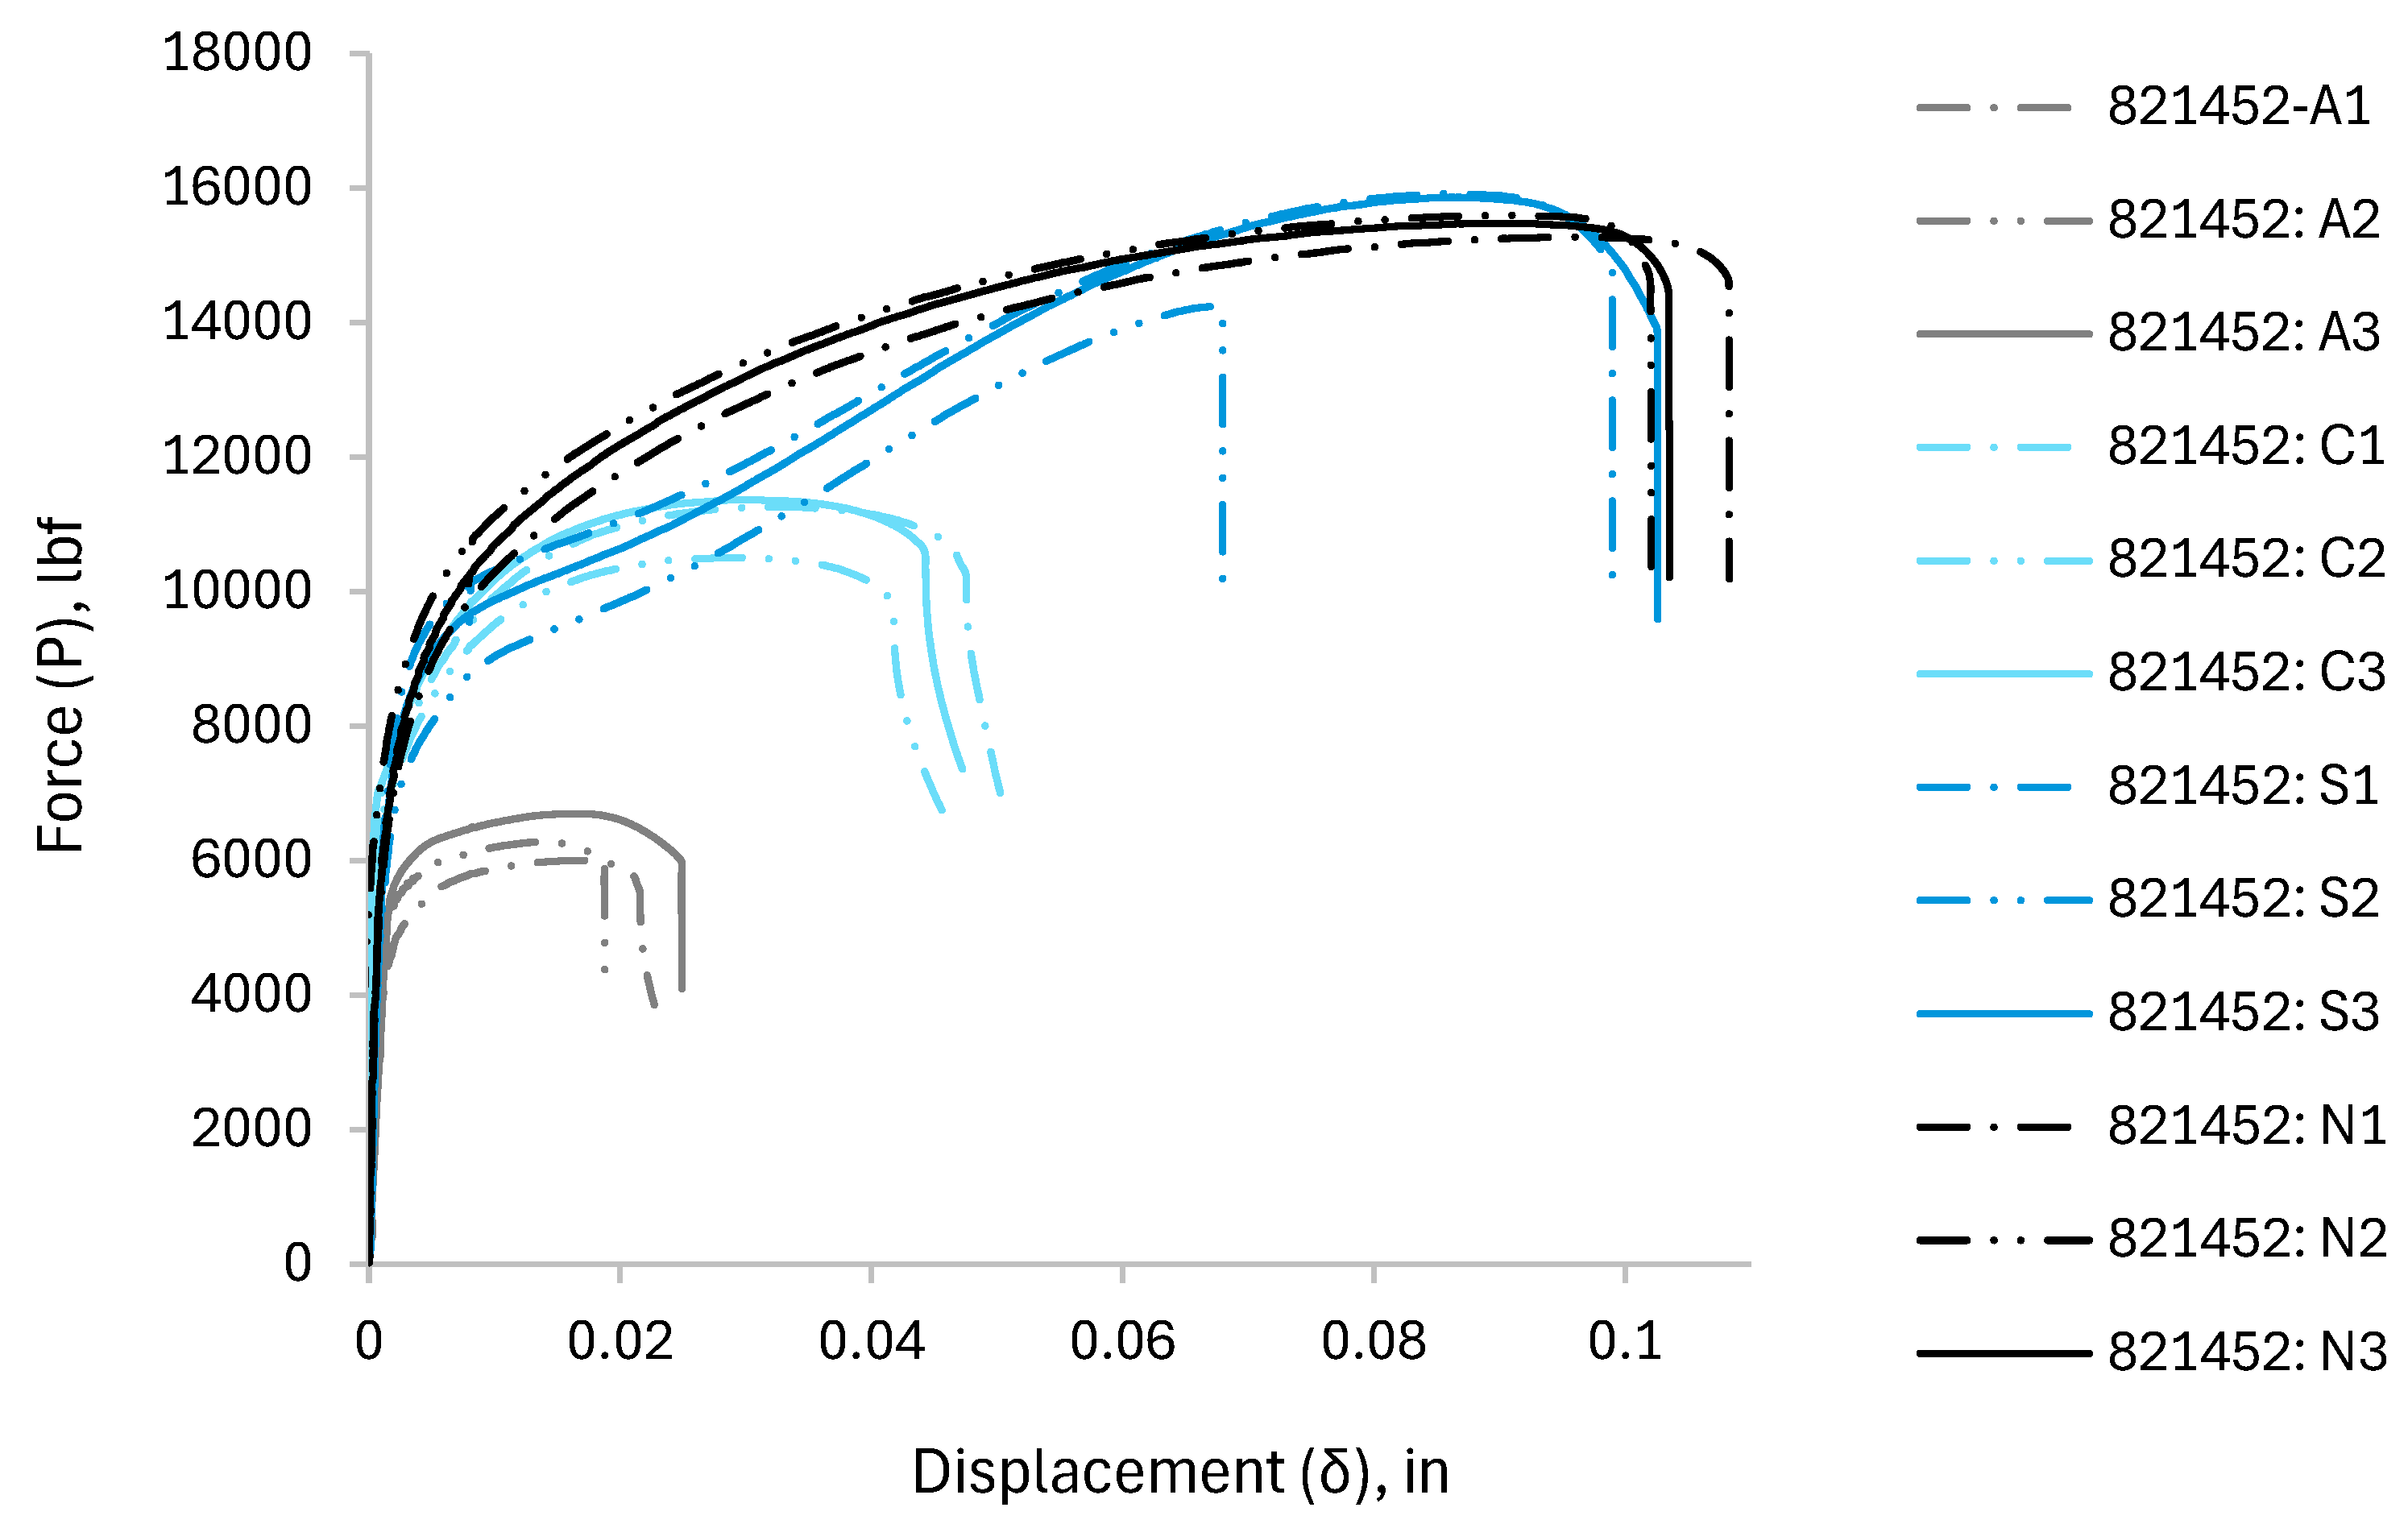
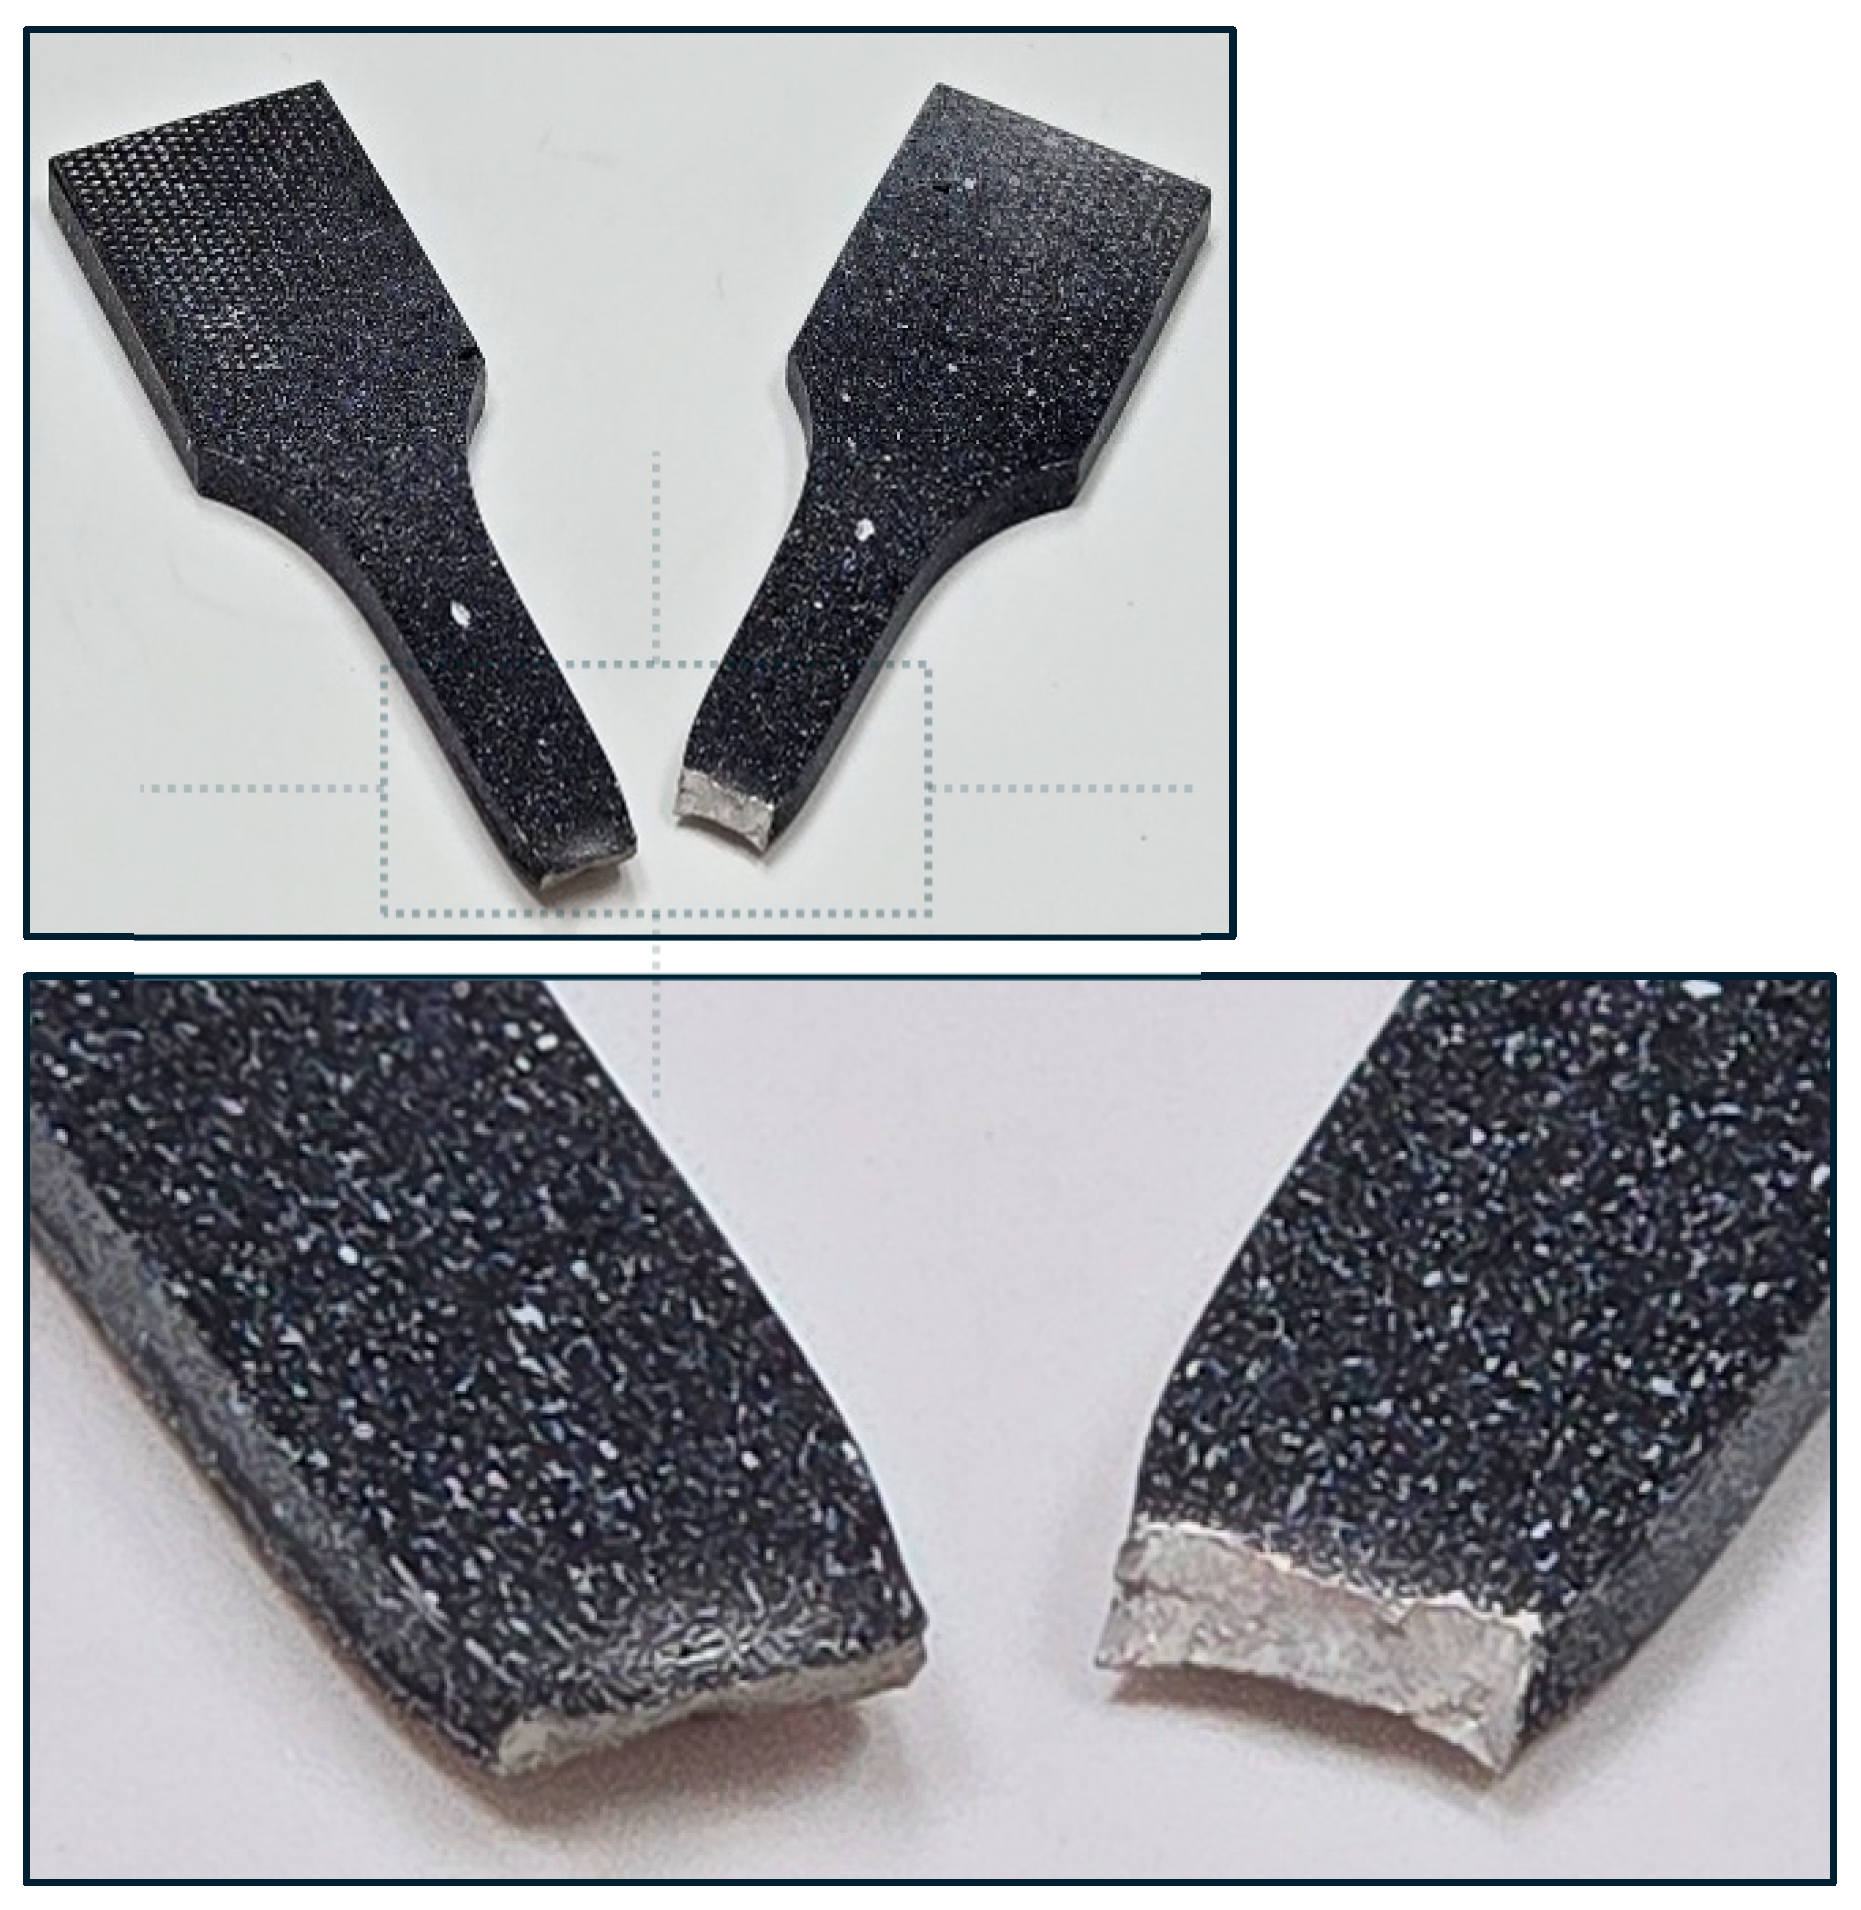
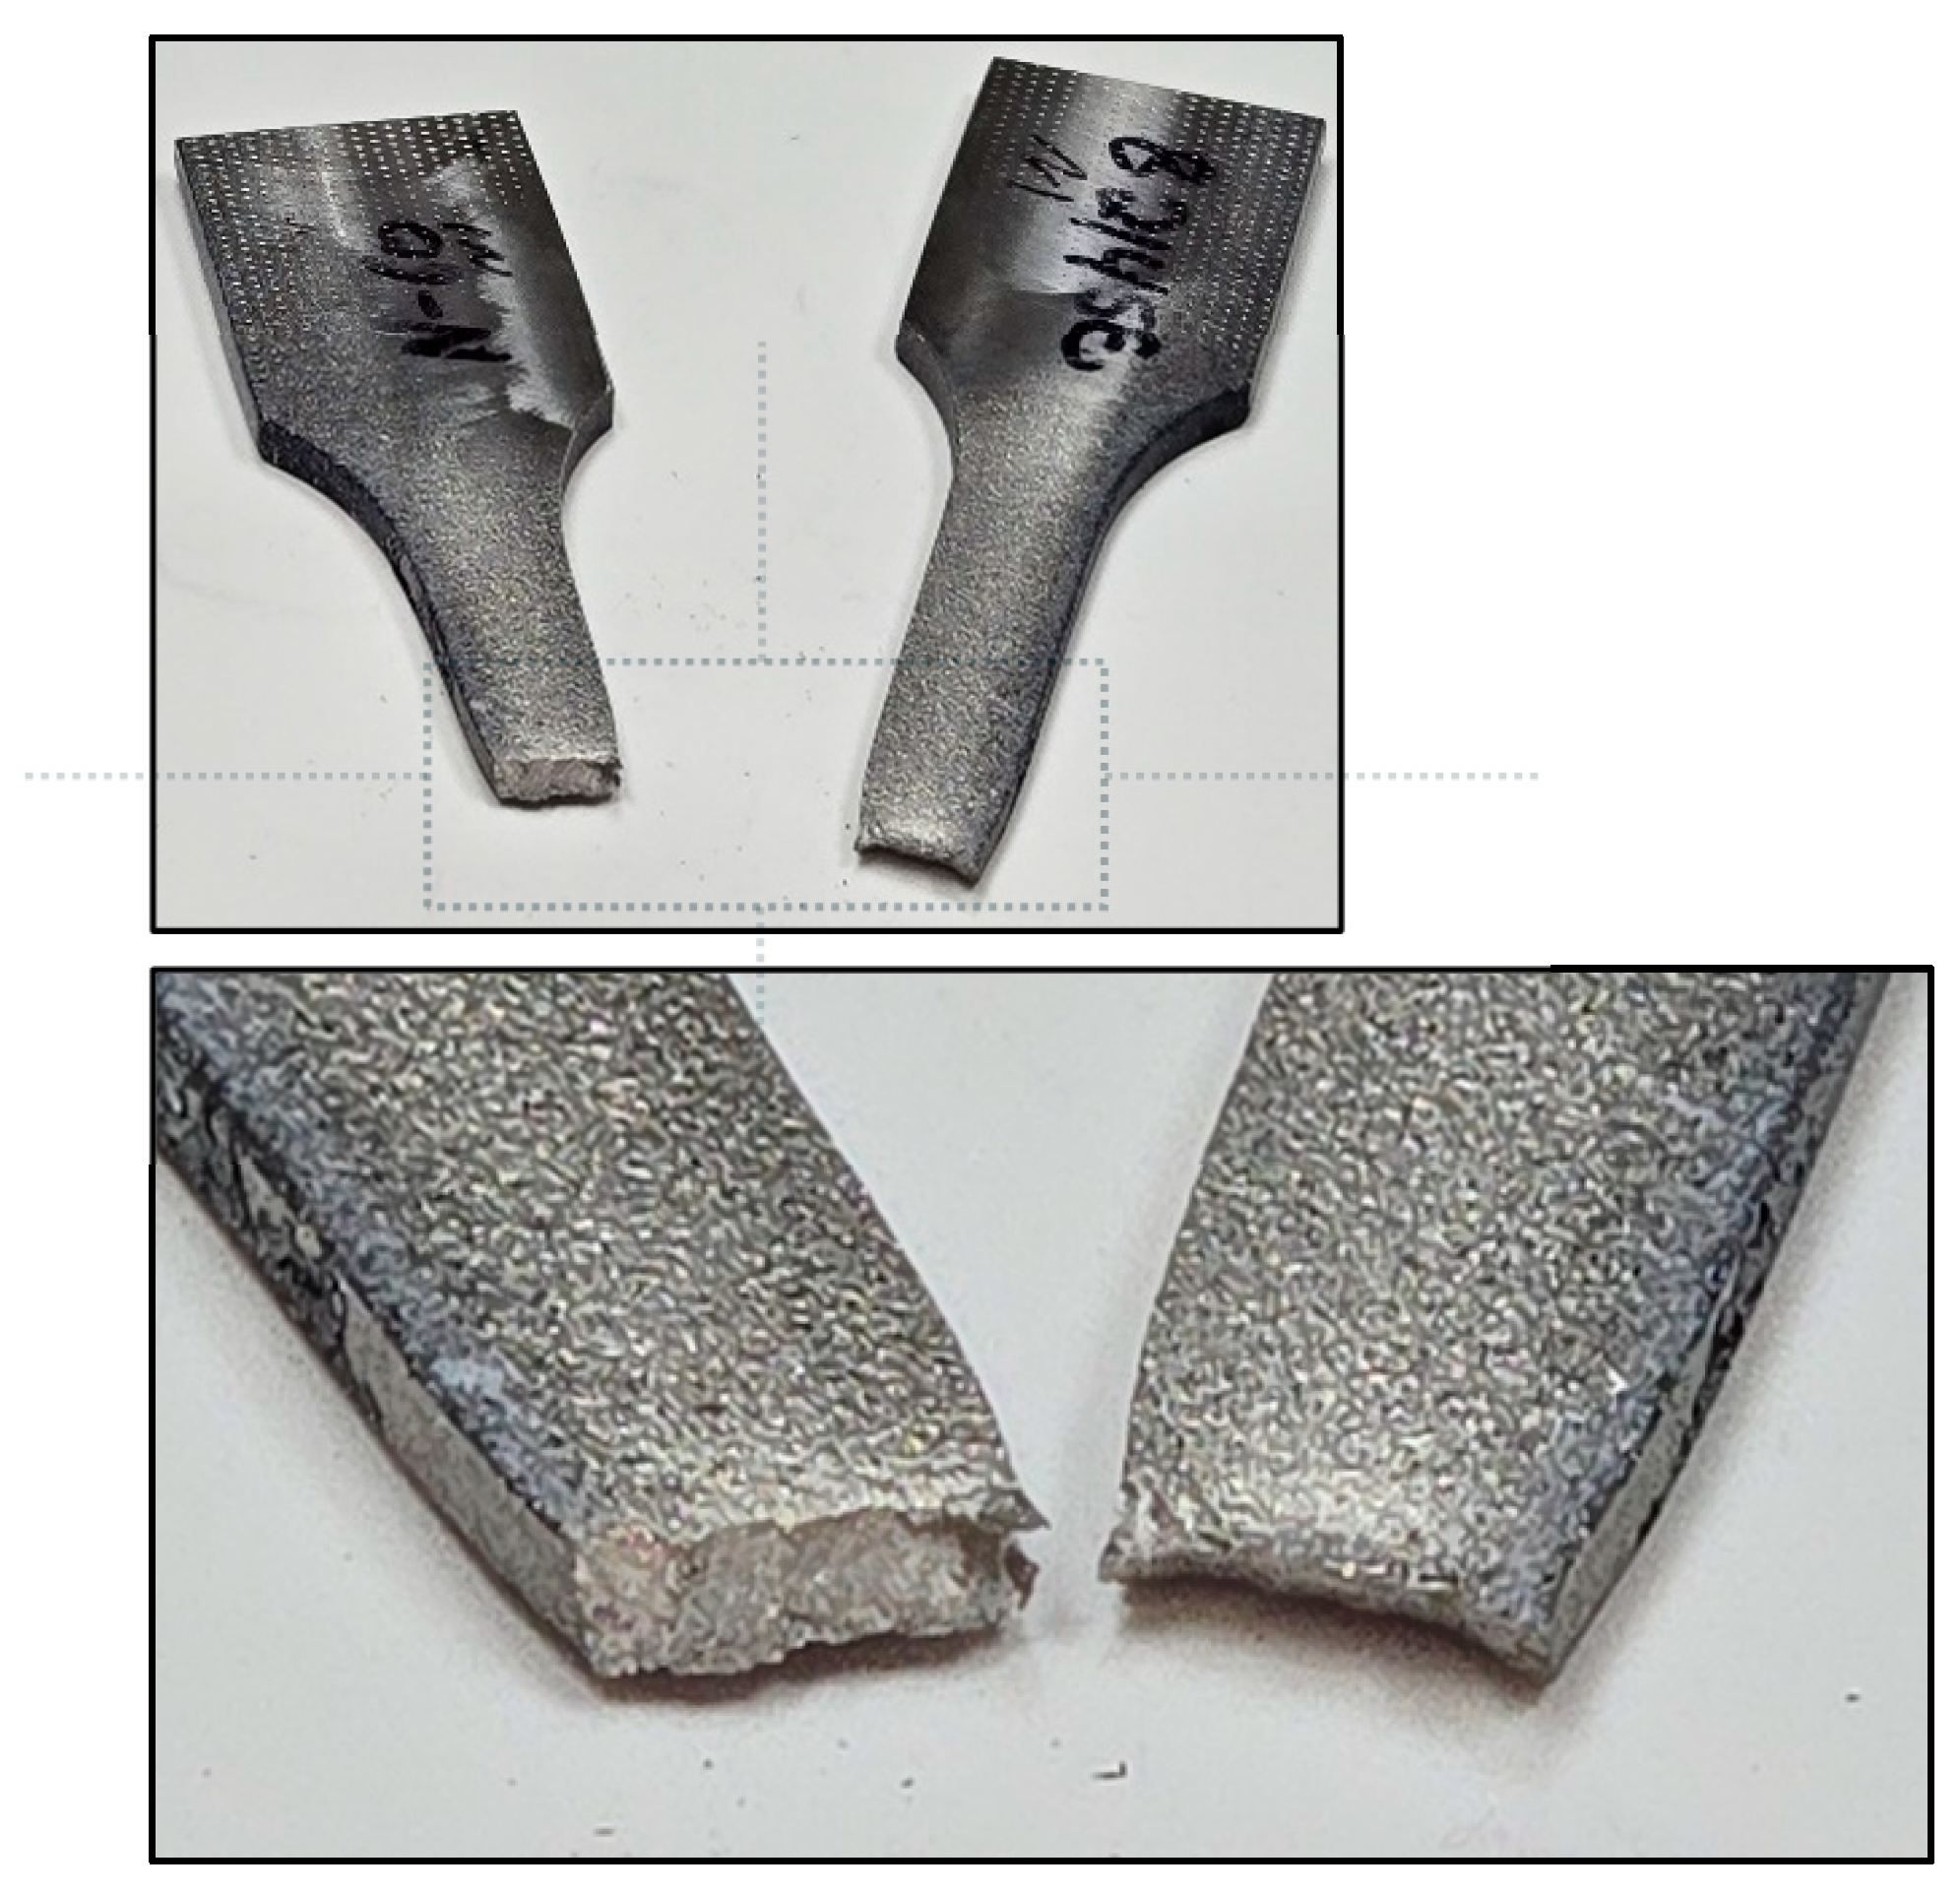
Figure 25.
curve for flat grooved plates (specimen-821452).
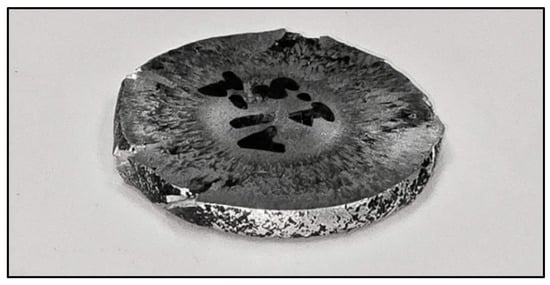
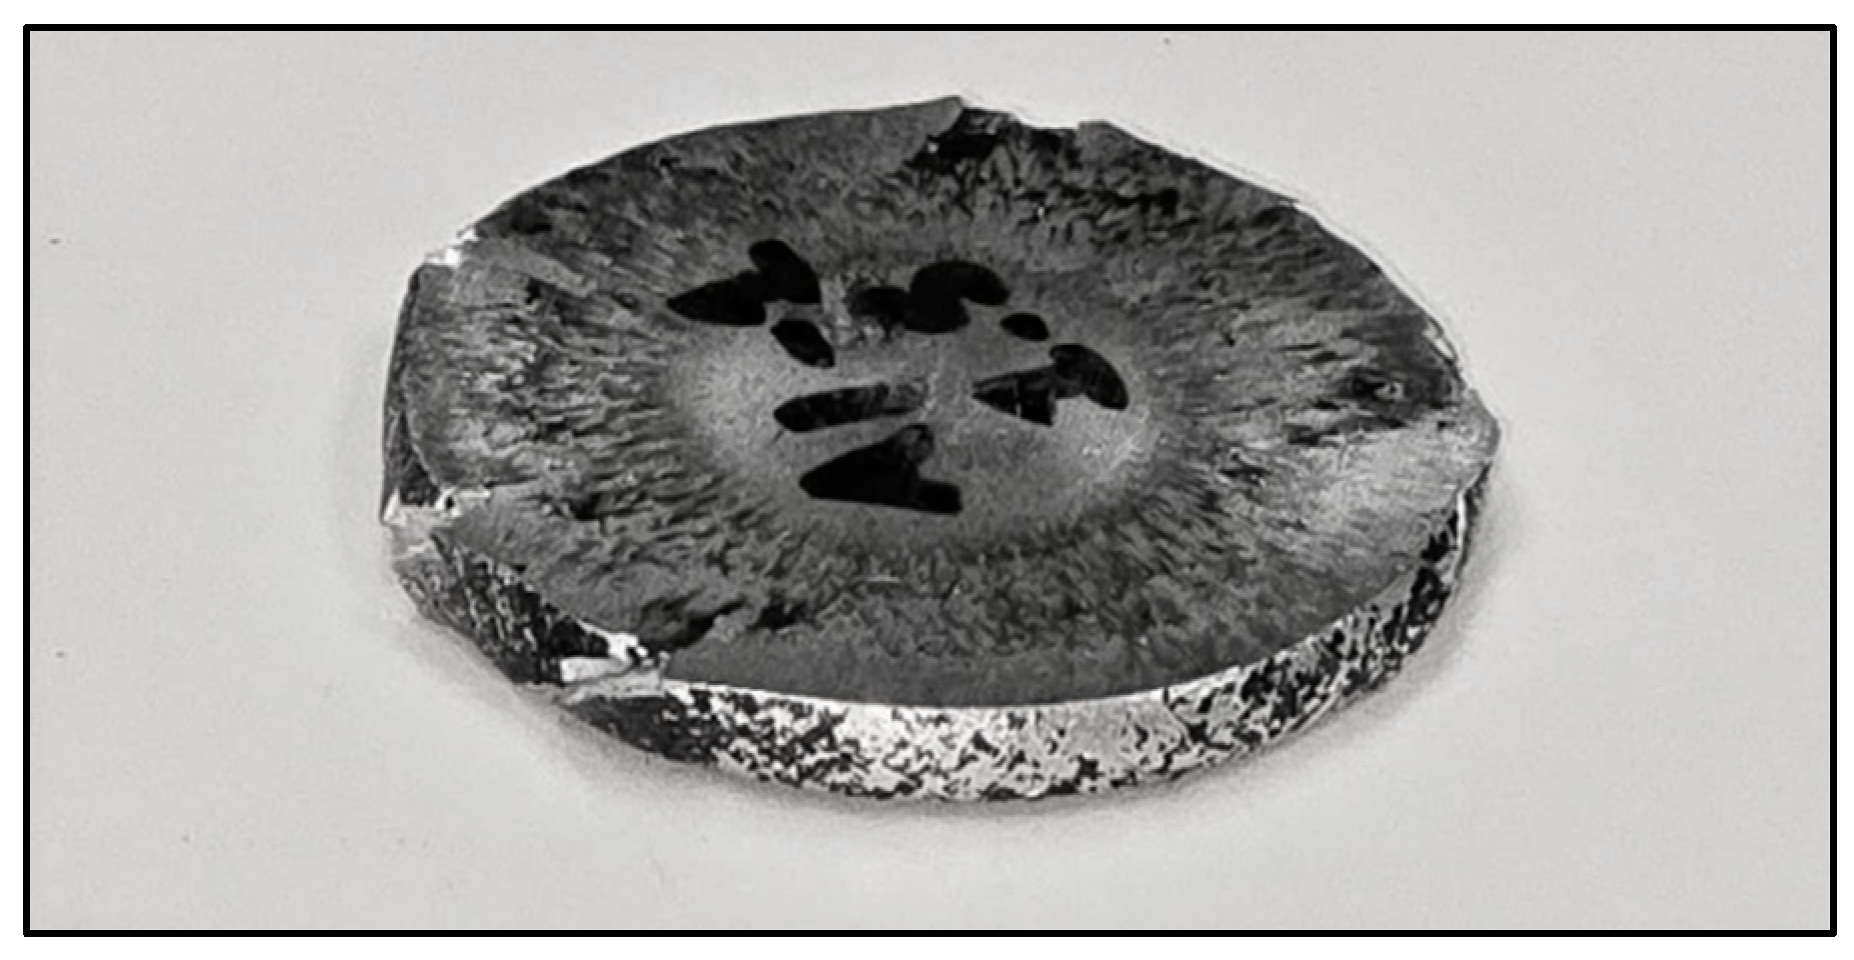
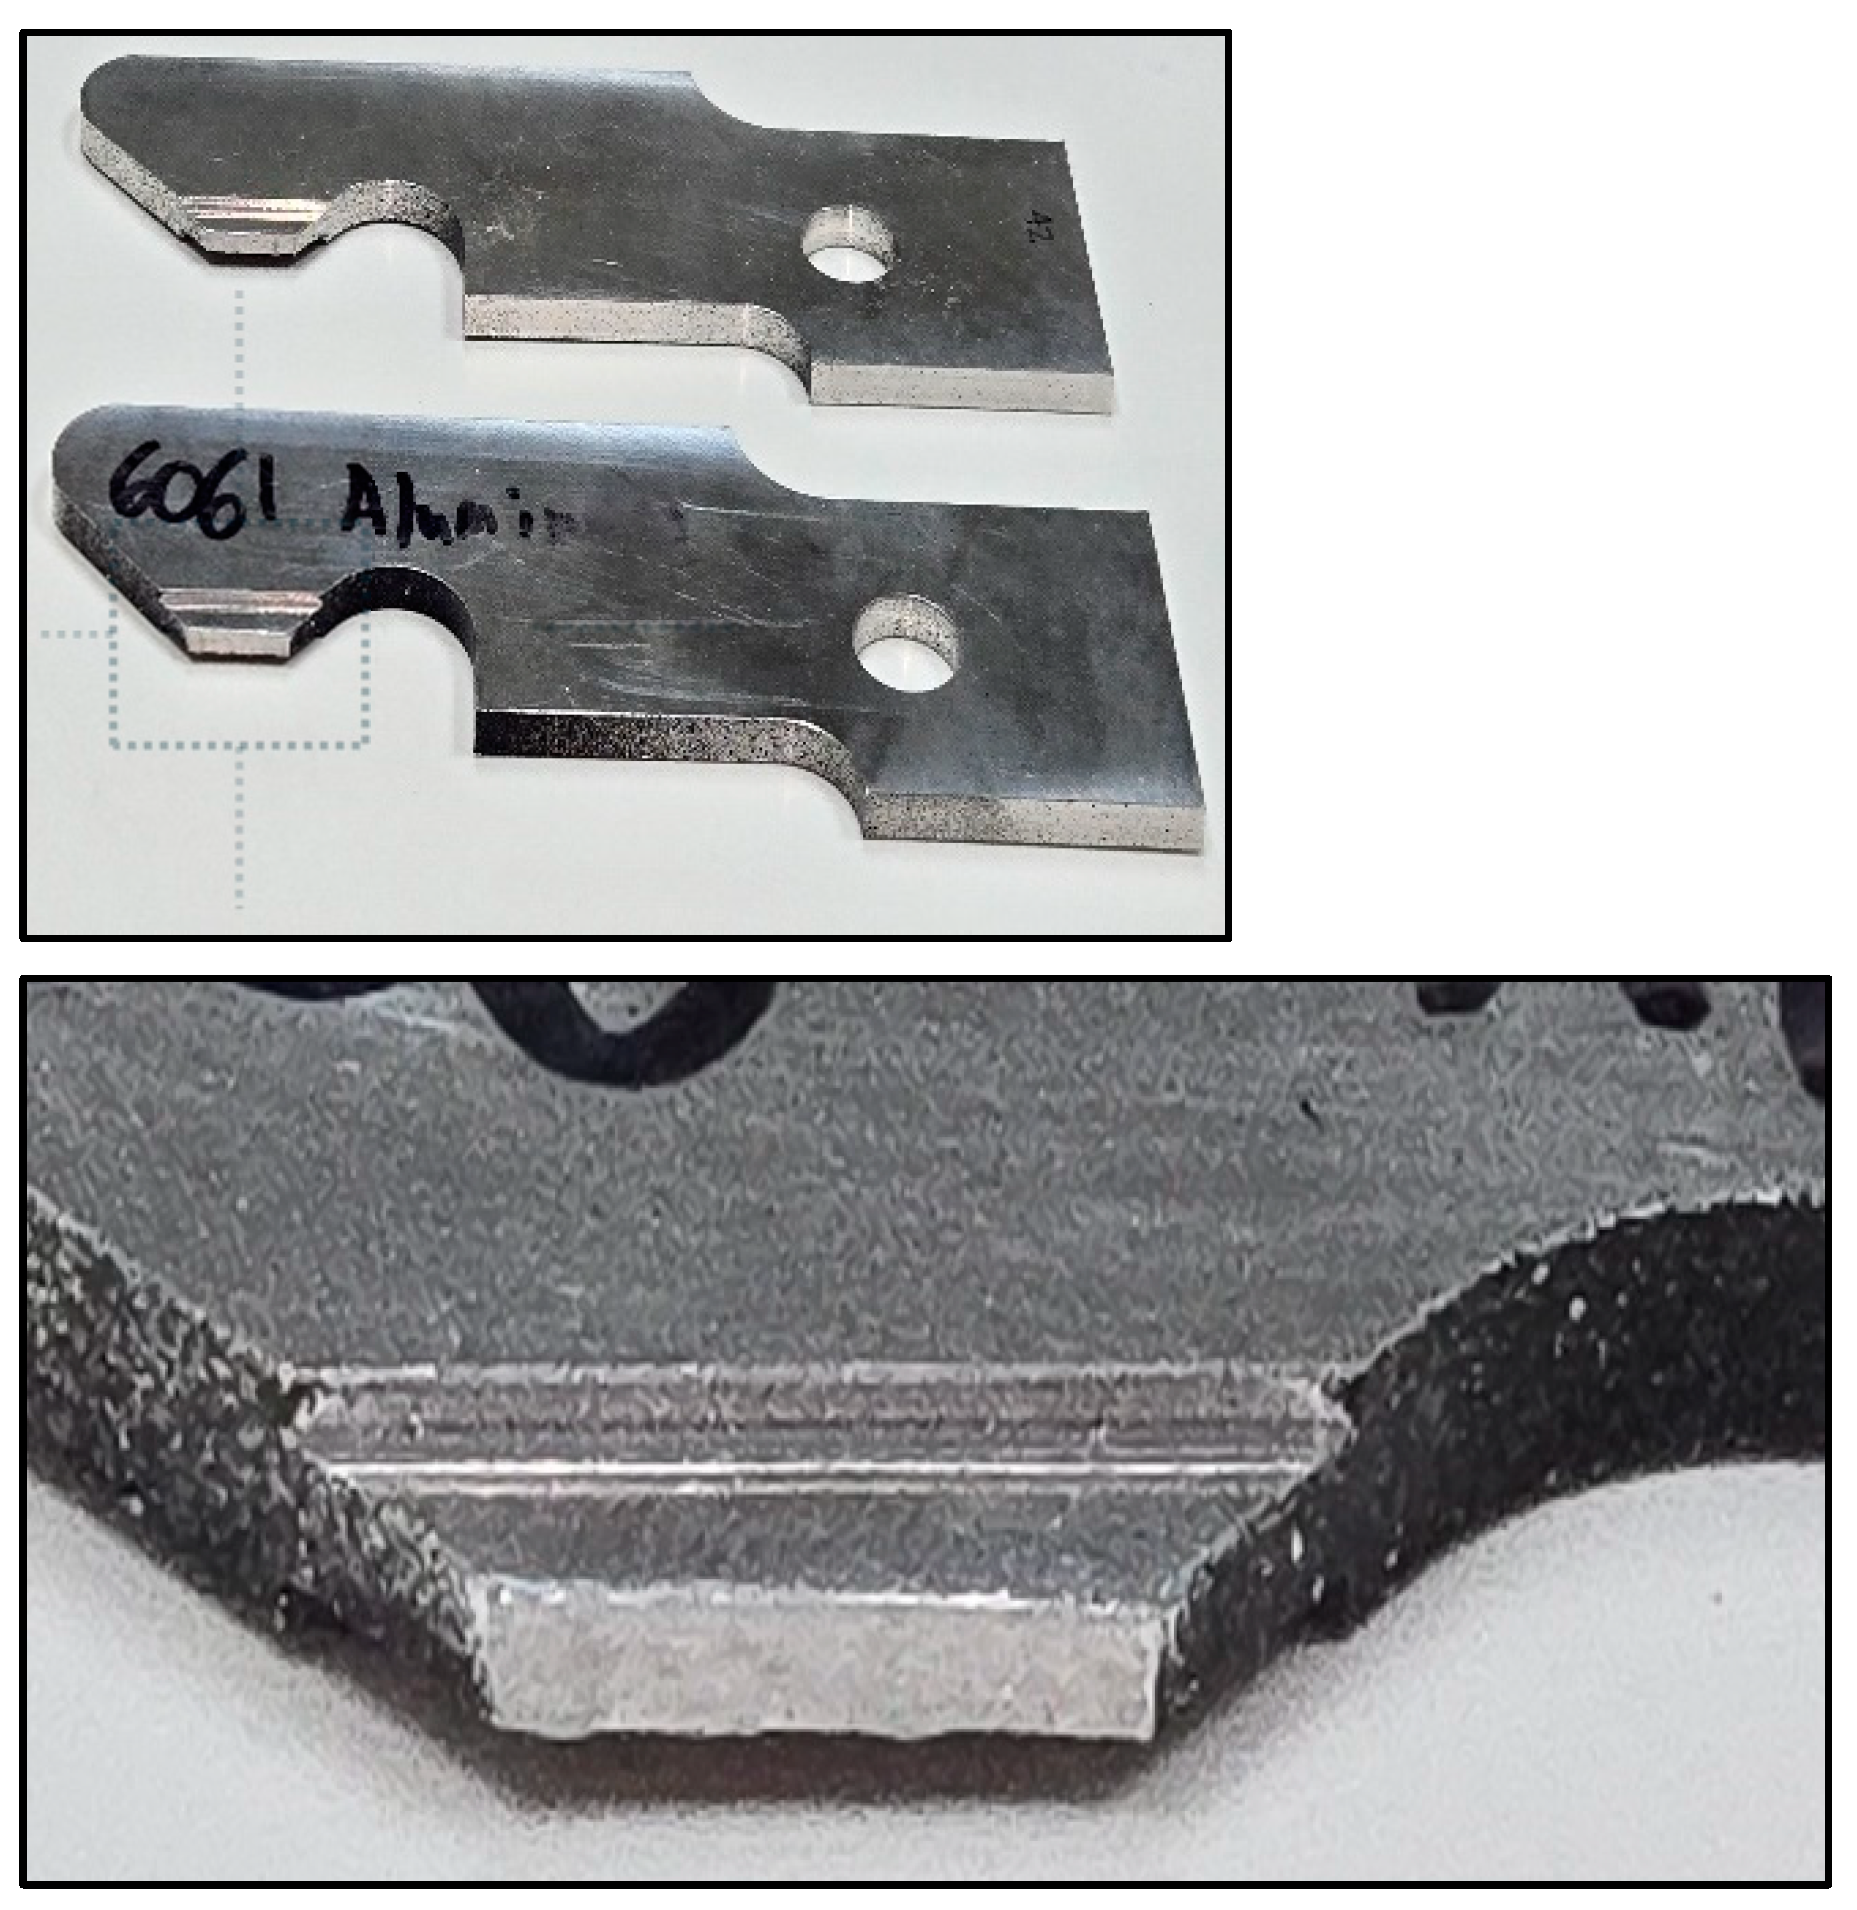
Figure 26.
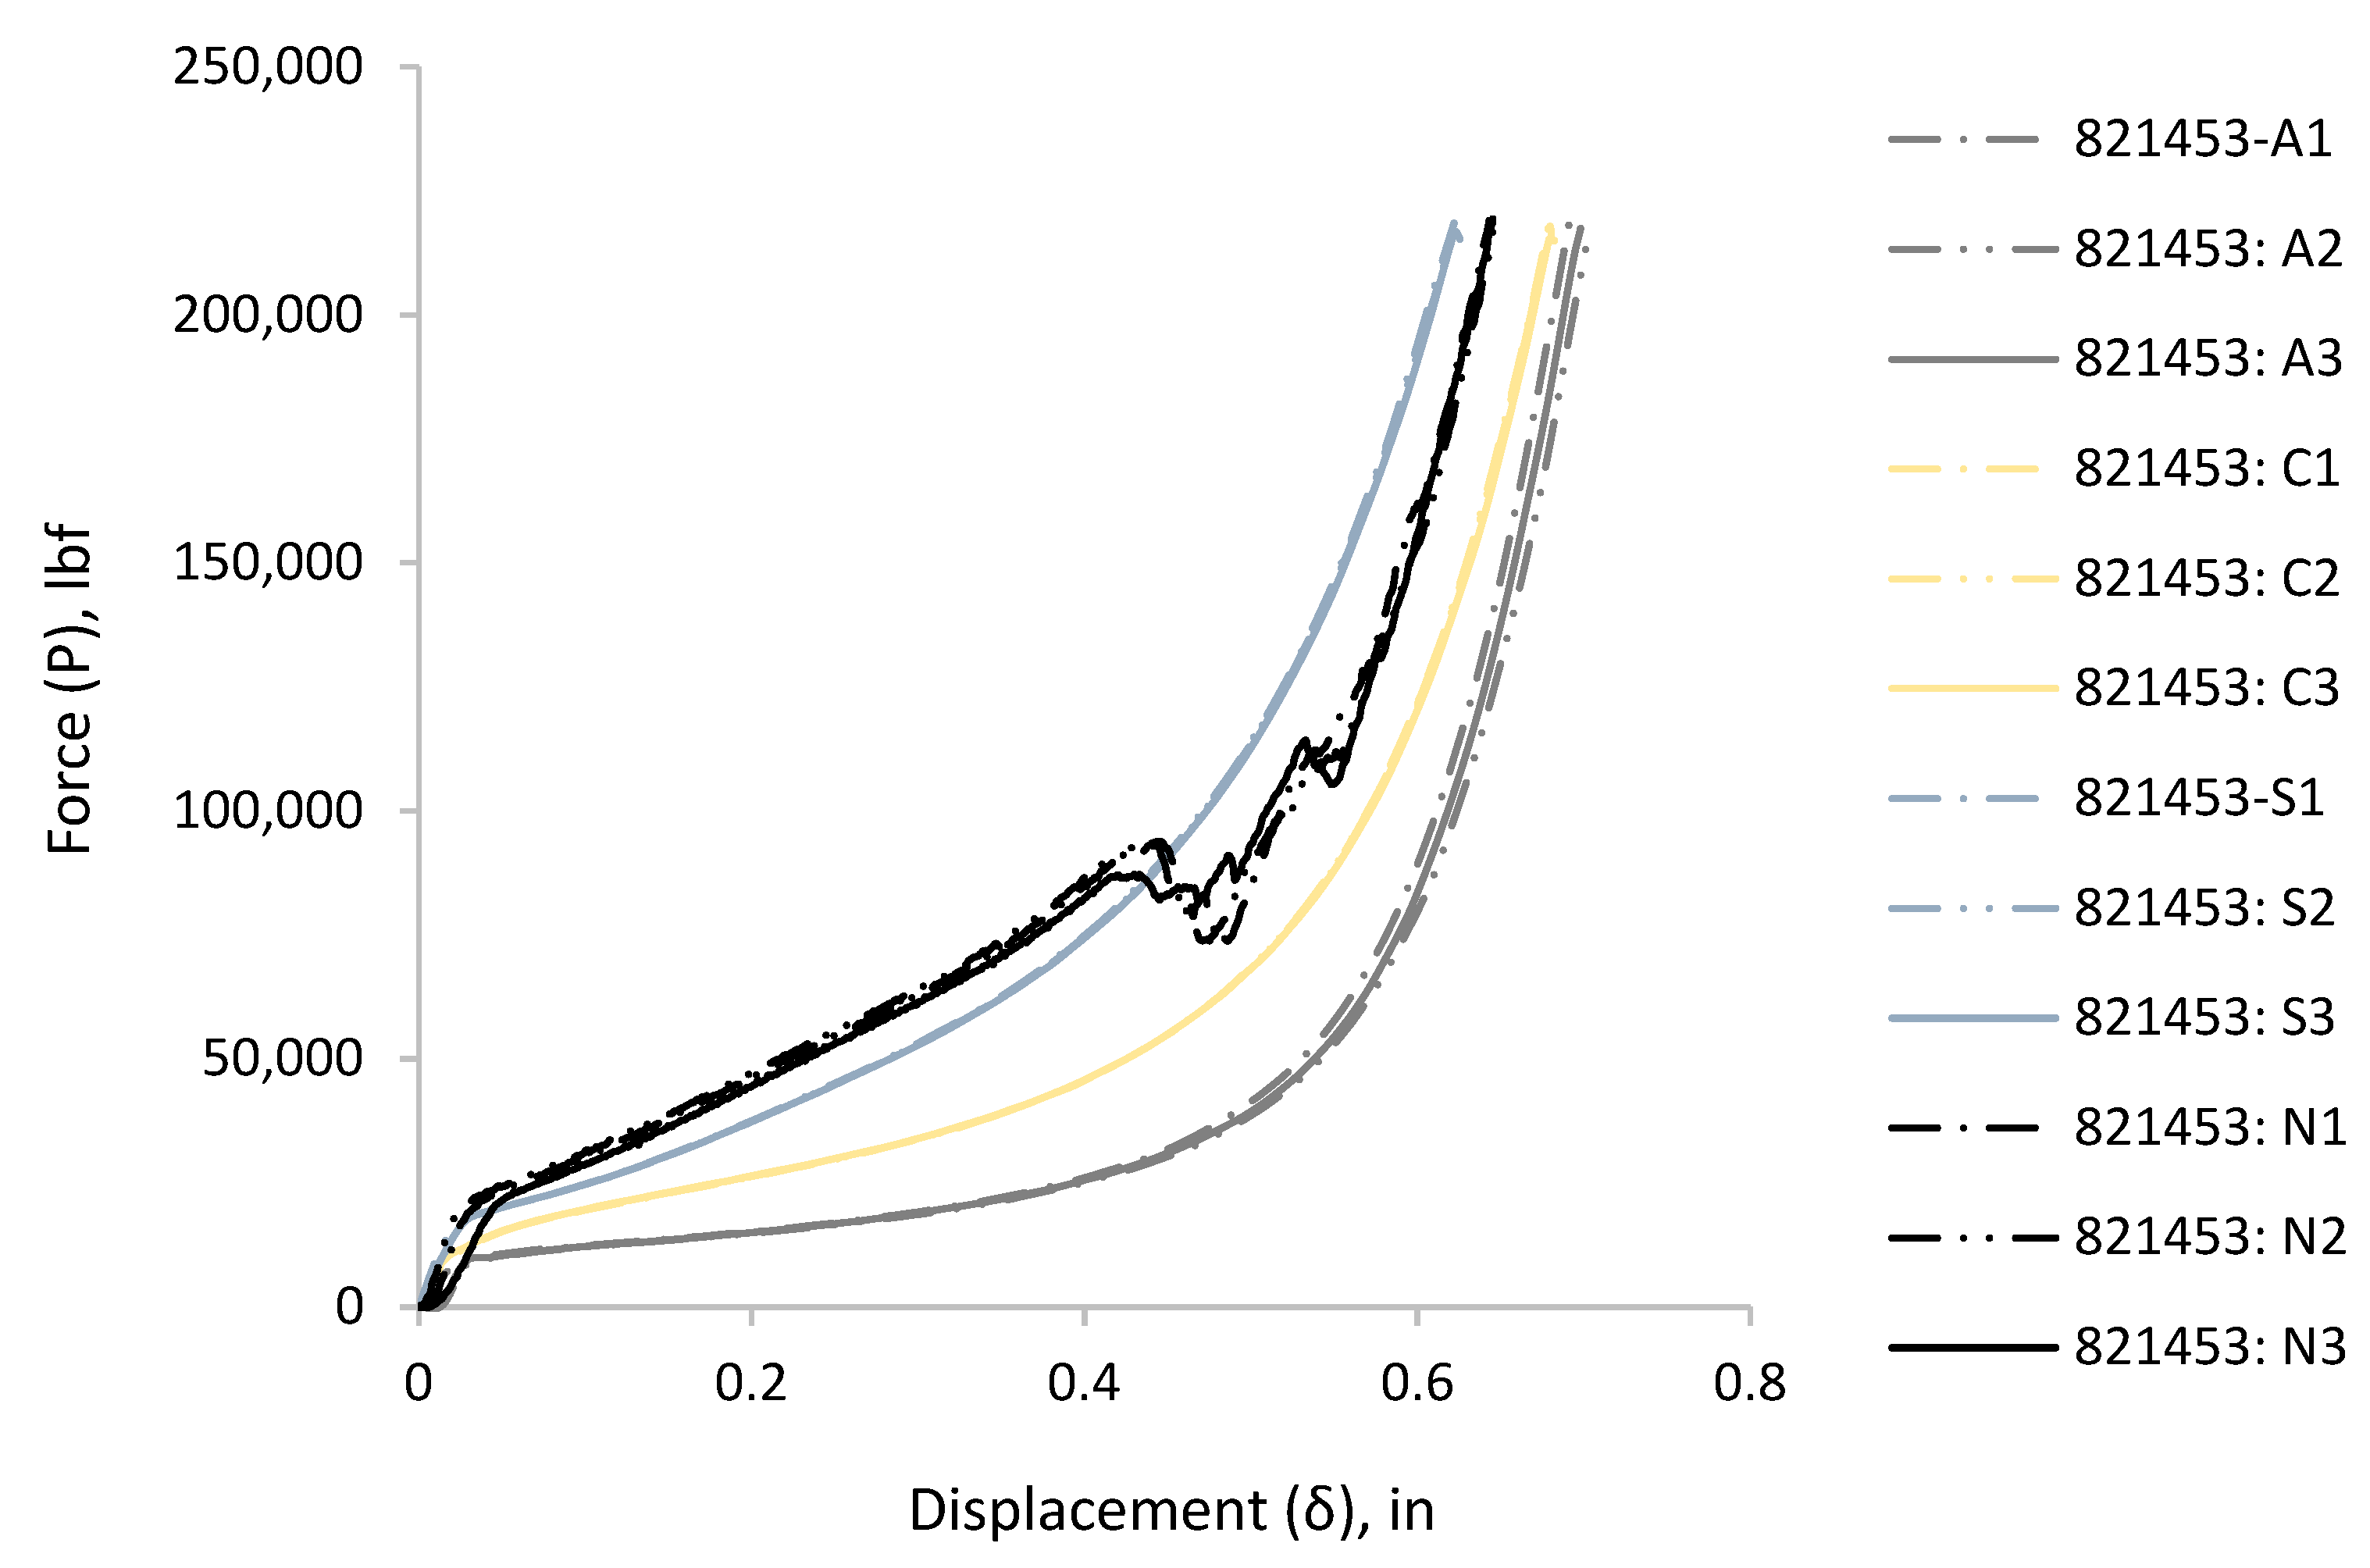
Final stage of compression for specimen-821453, Al6061.
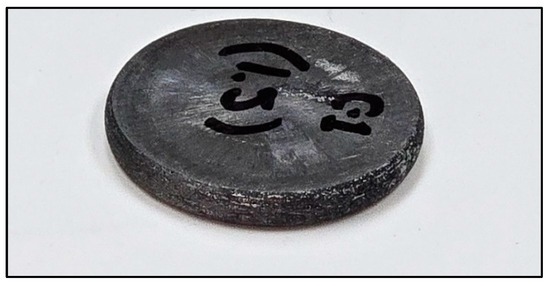
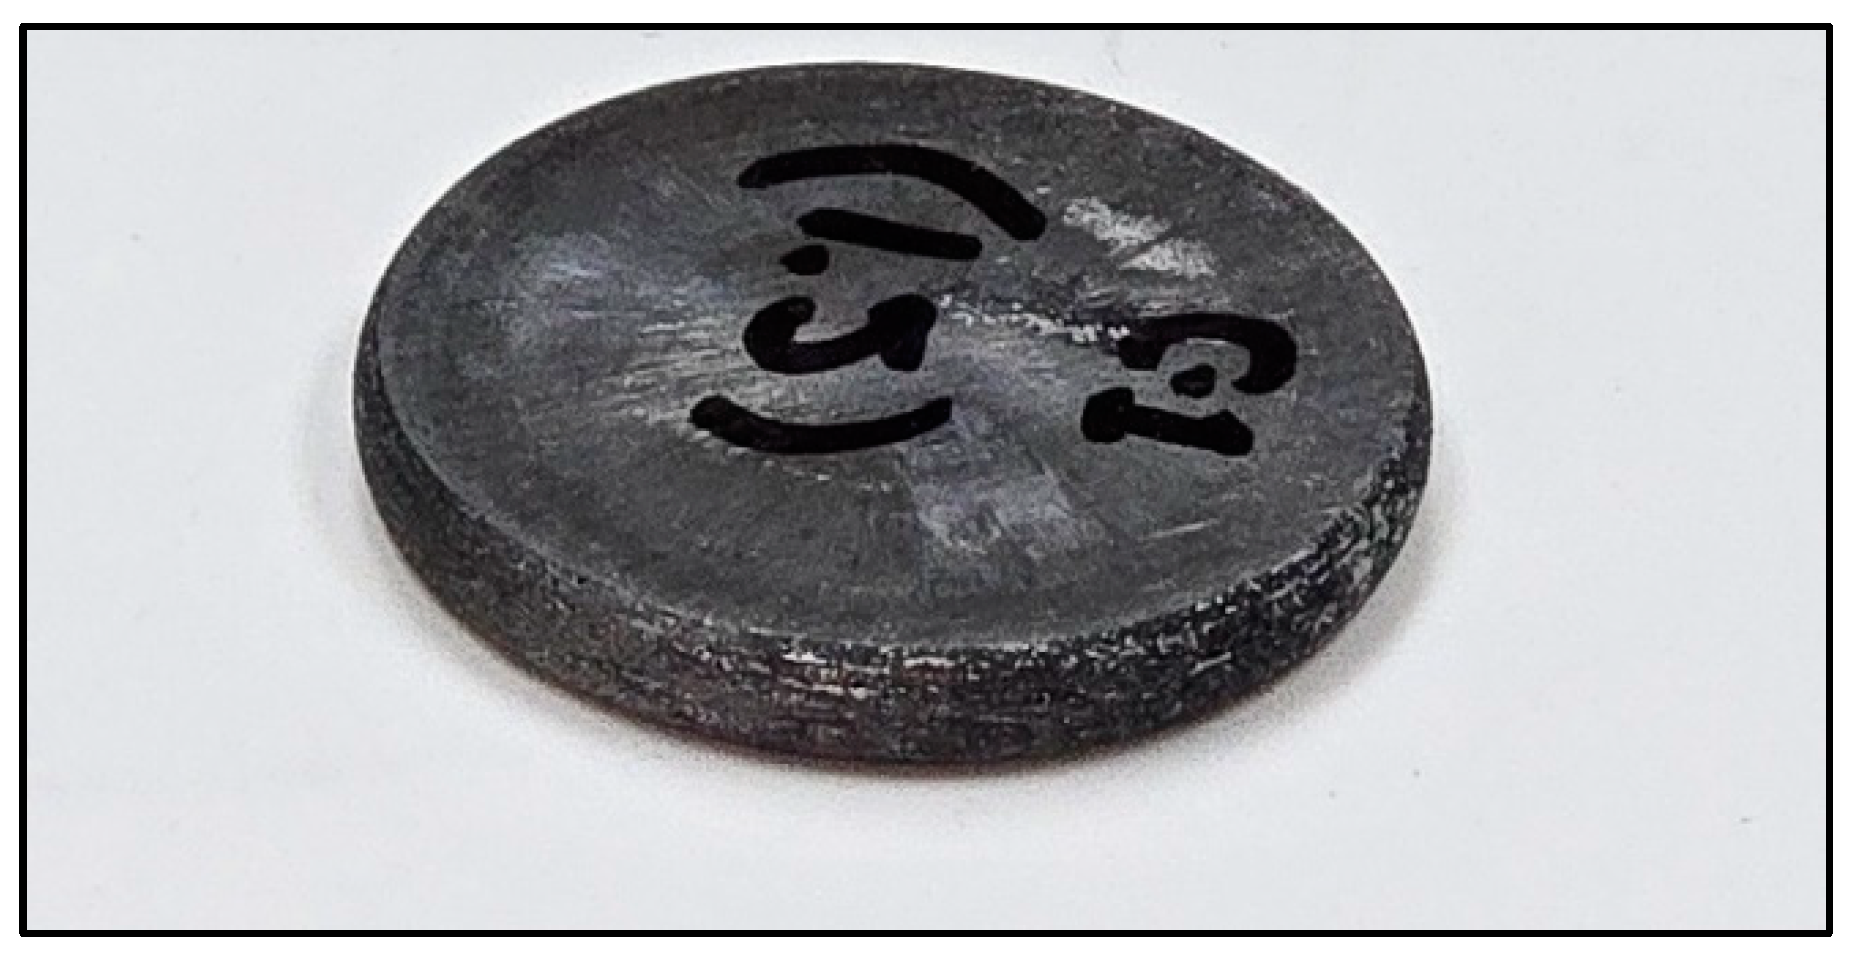
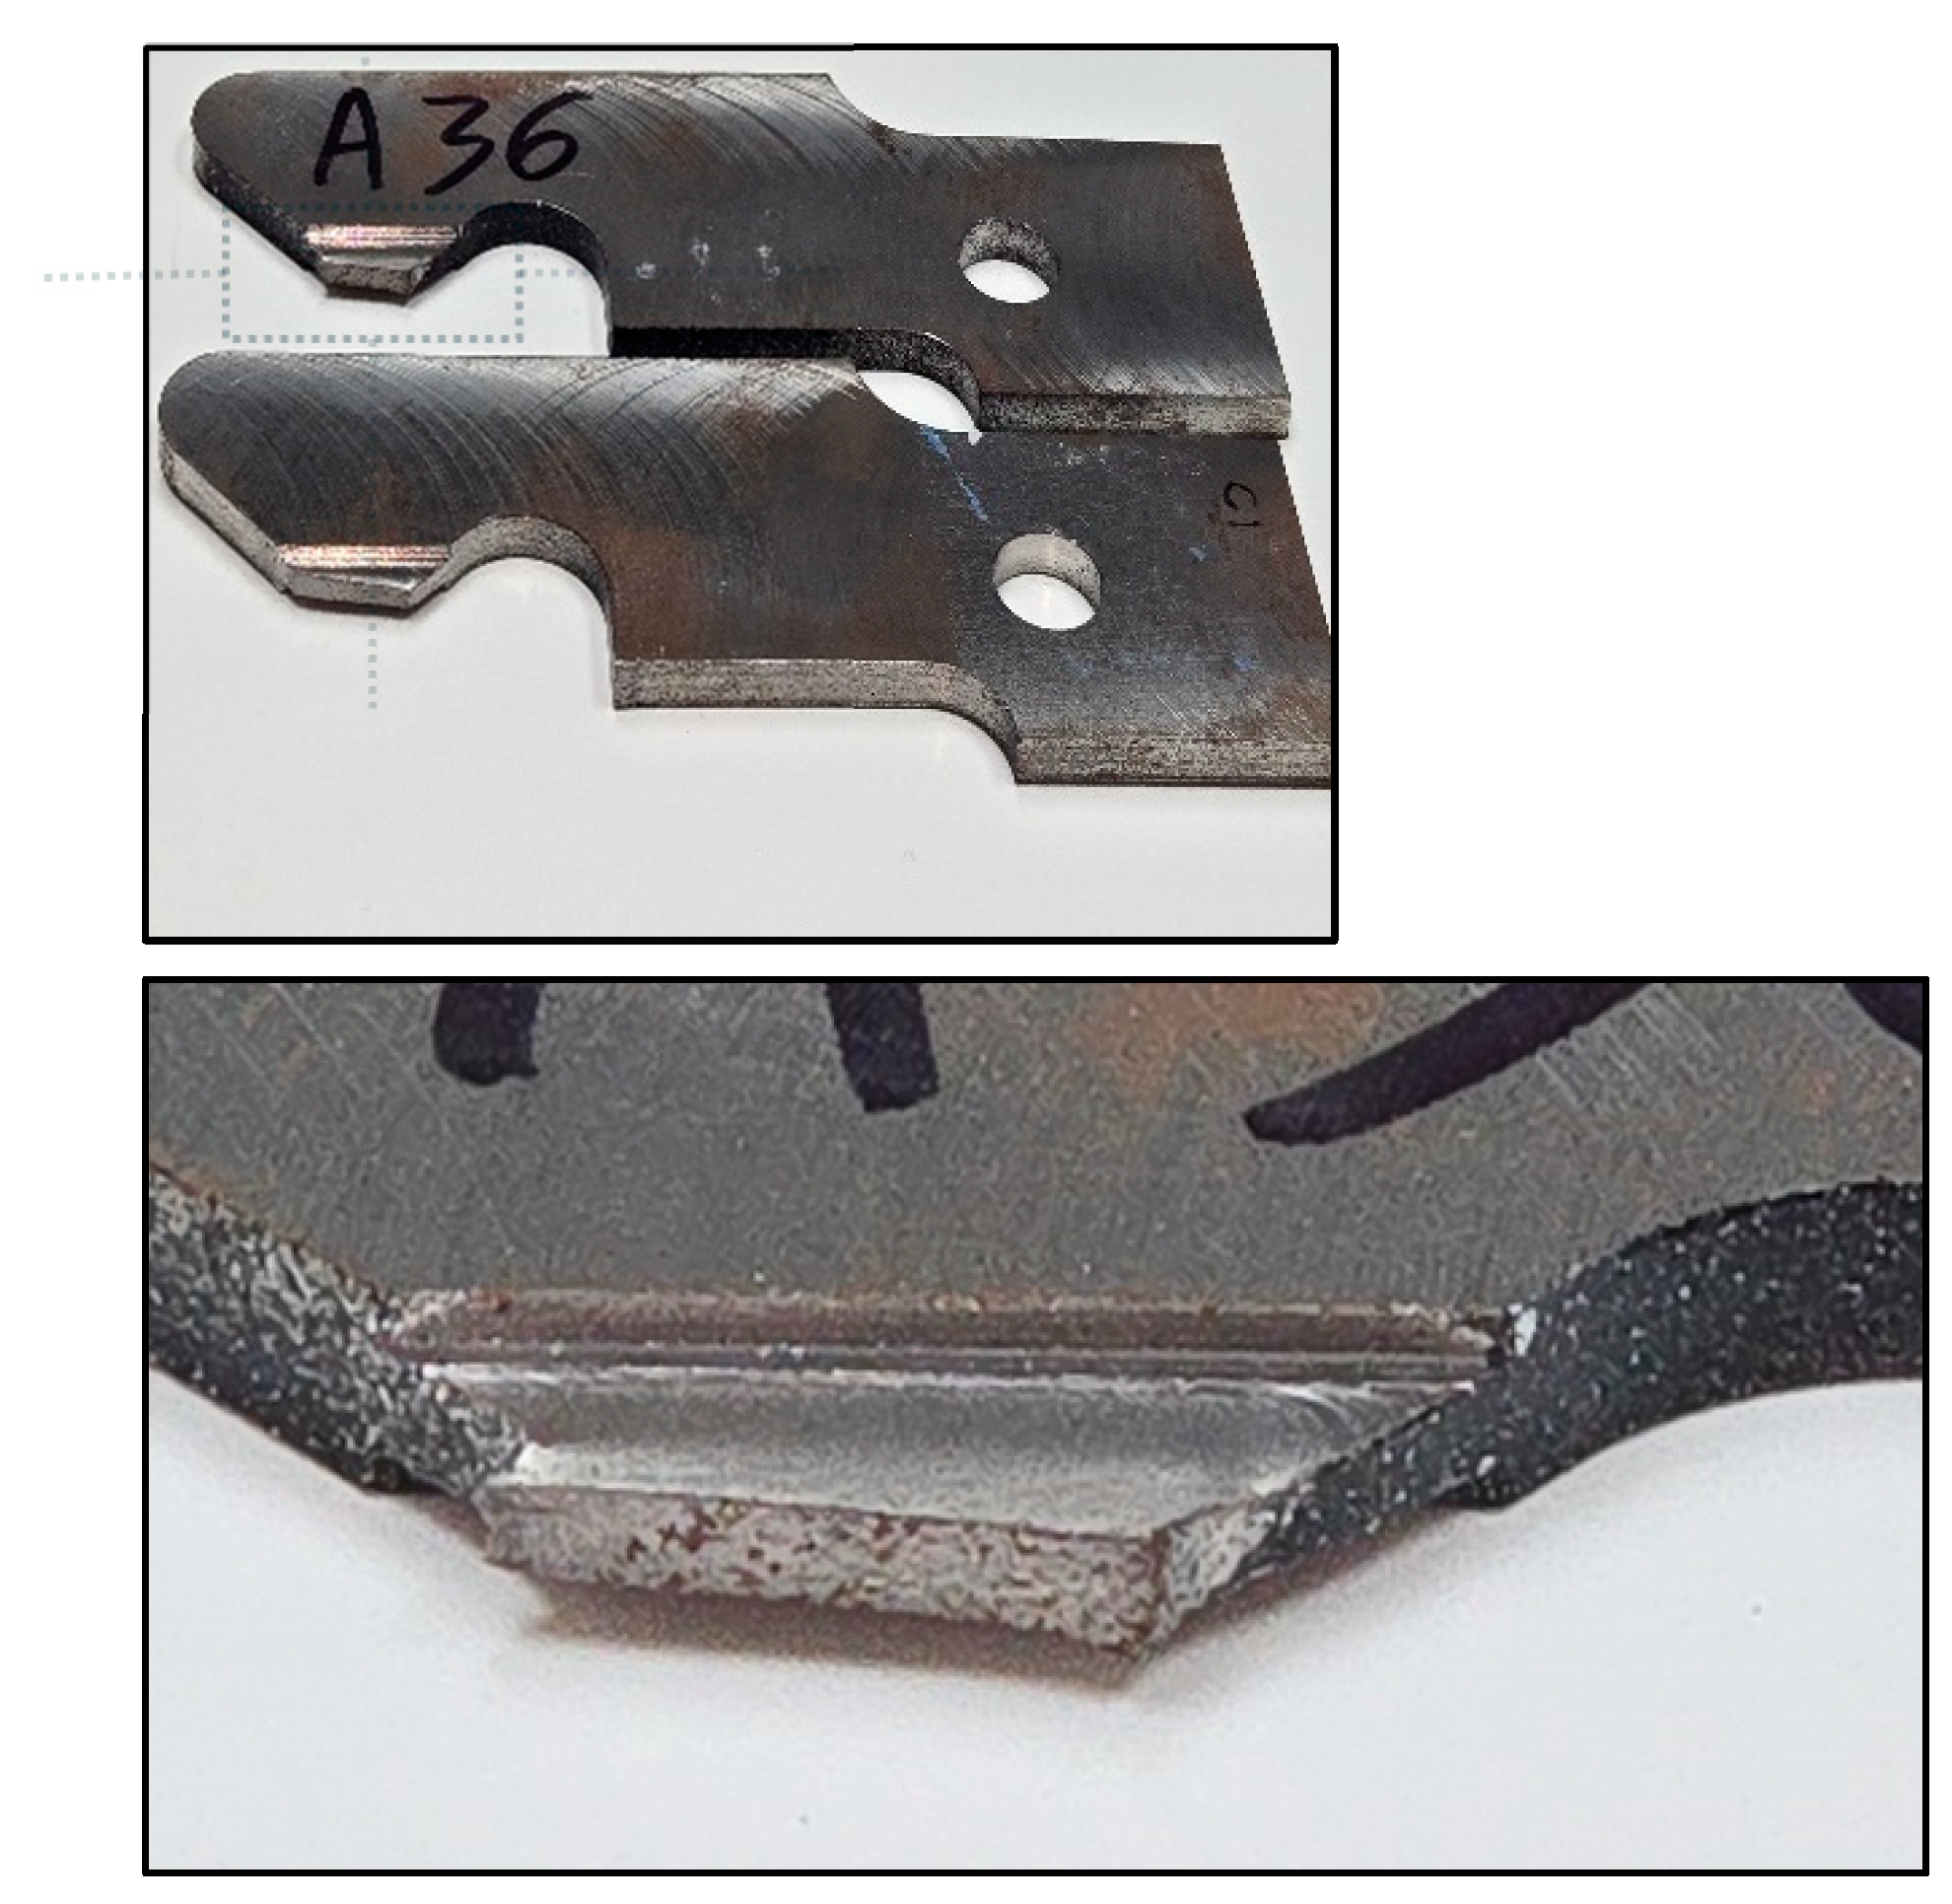
Figure 27.
Final stage of compression for specimen-821453, A36.

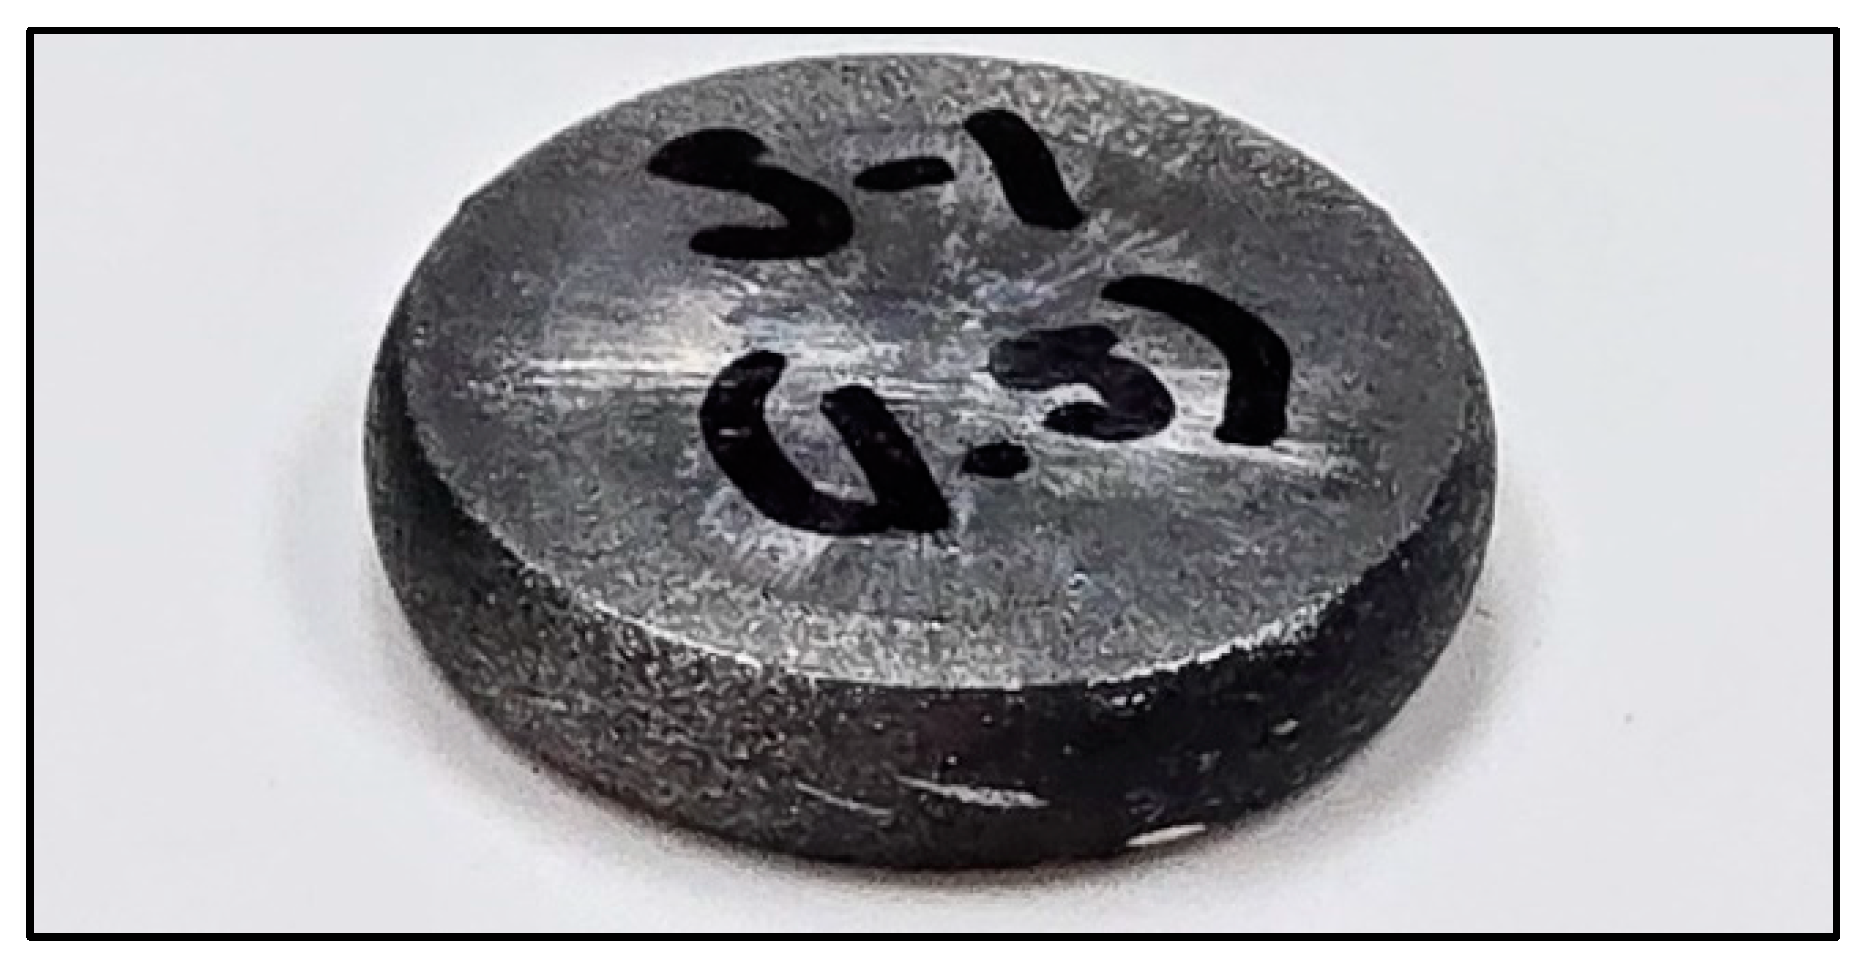
Figure 28.
Final stage of compression for specimen-821453, SS304.
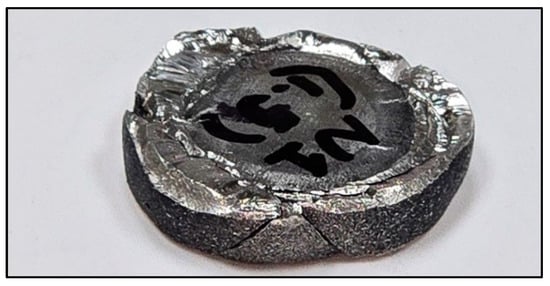
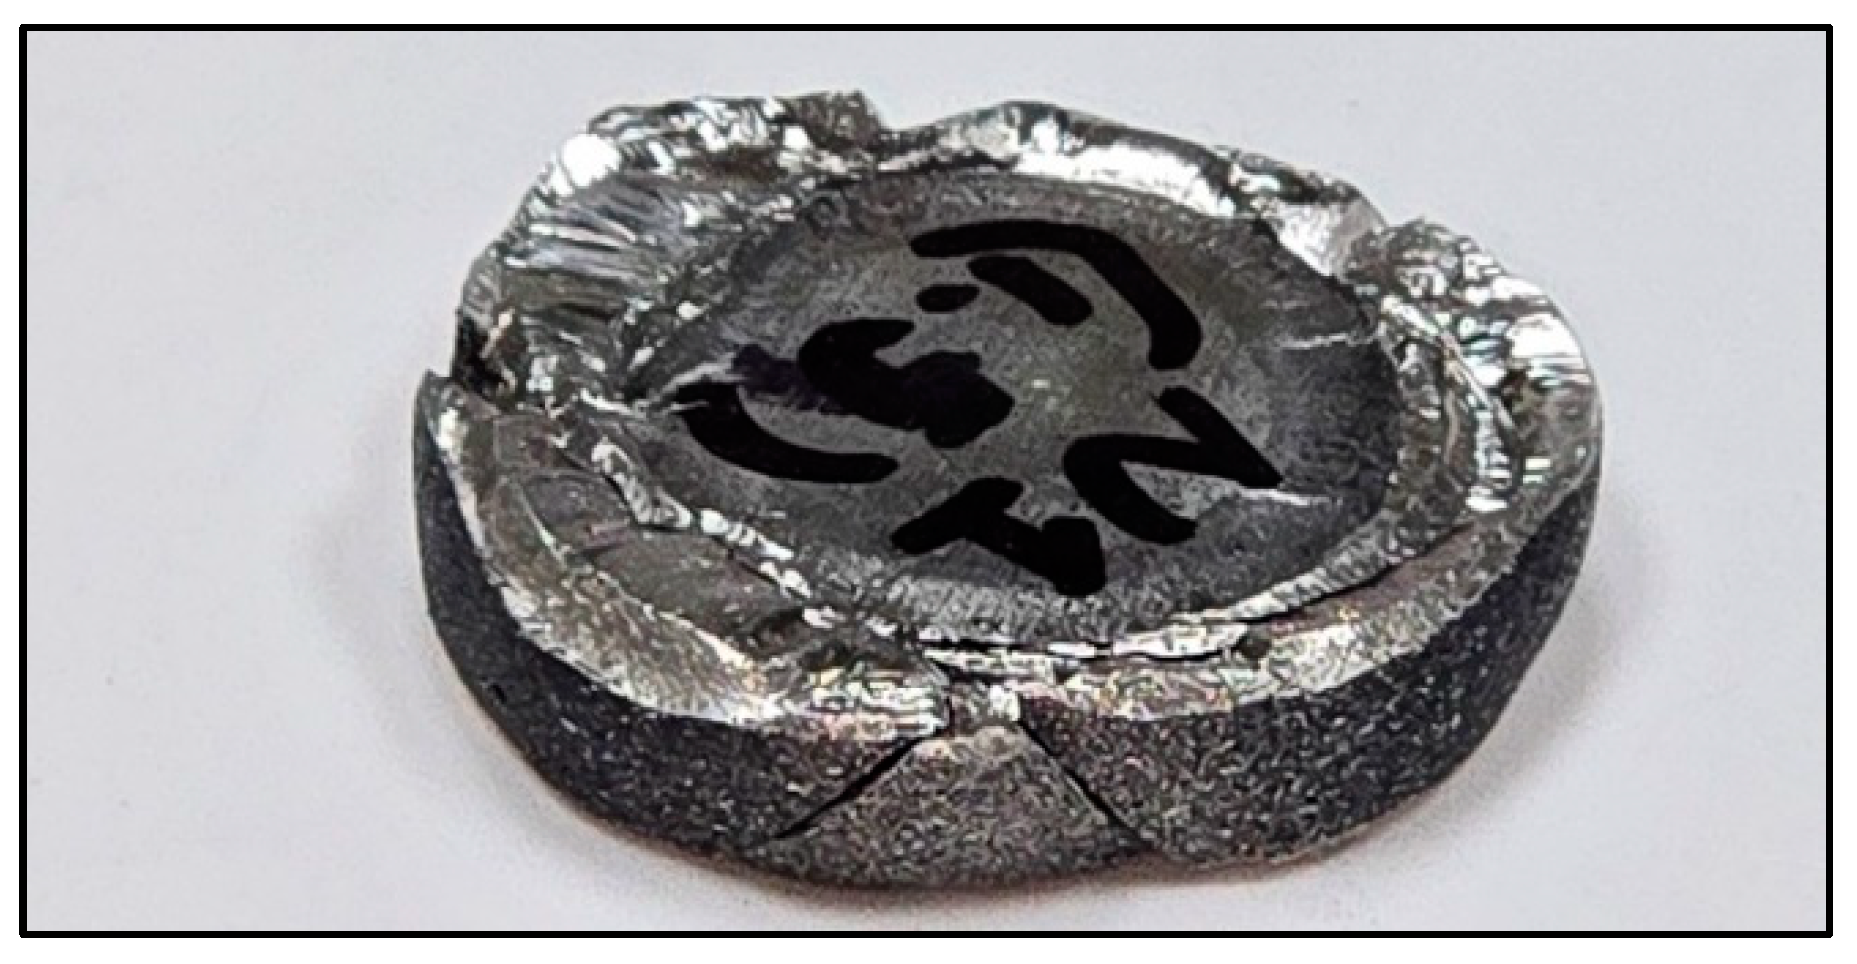
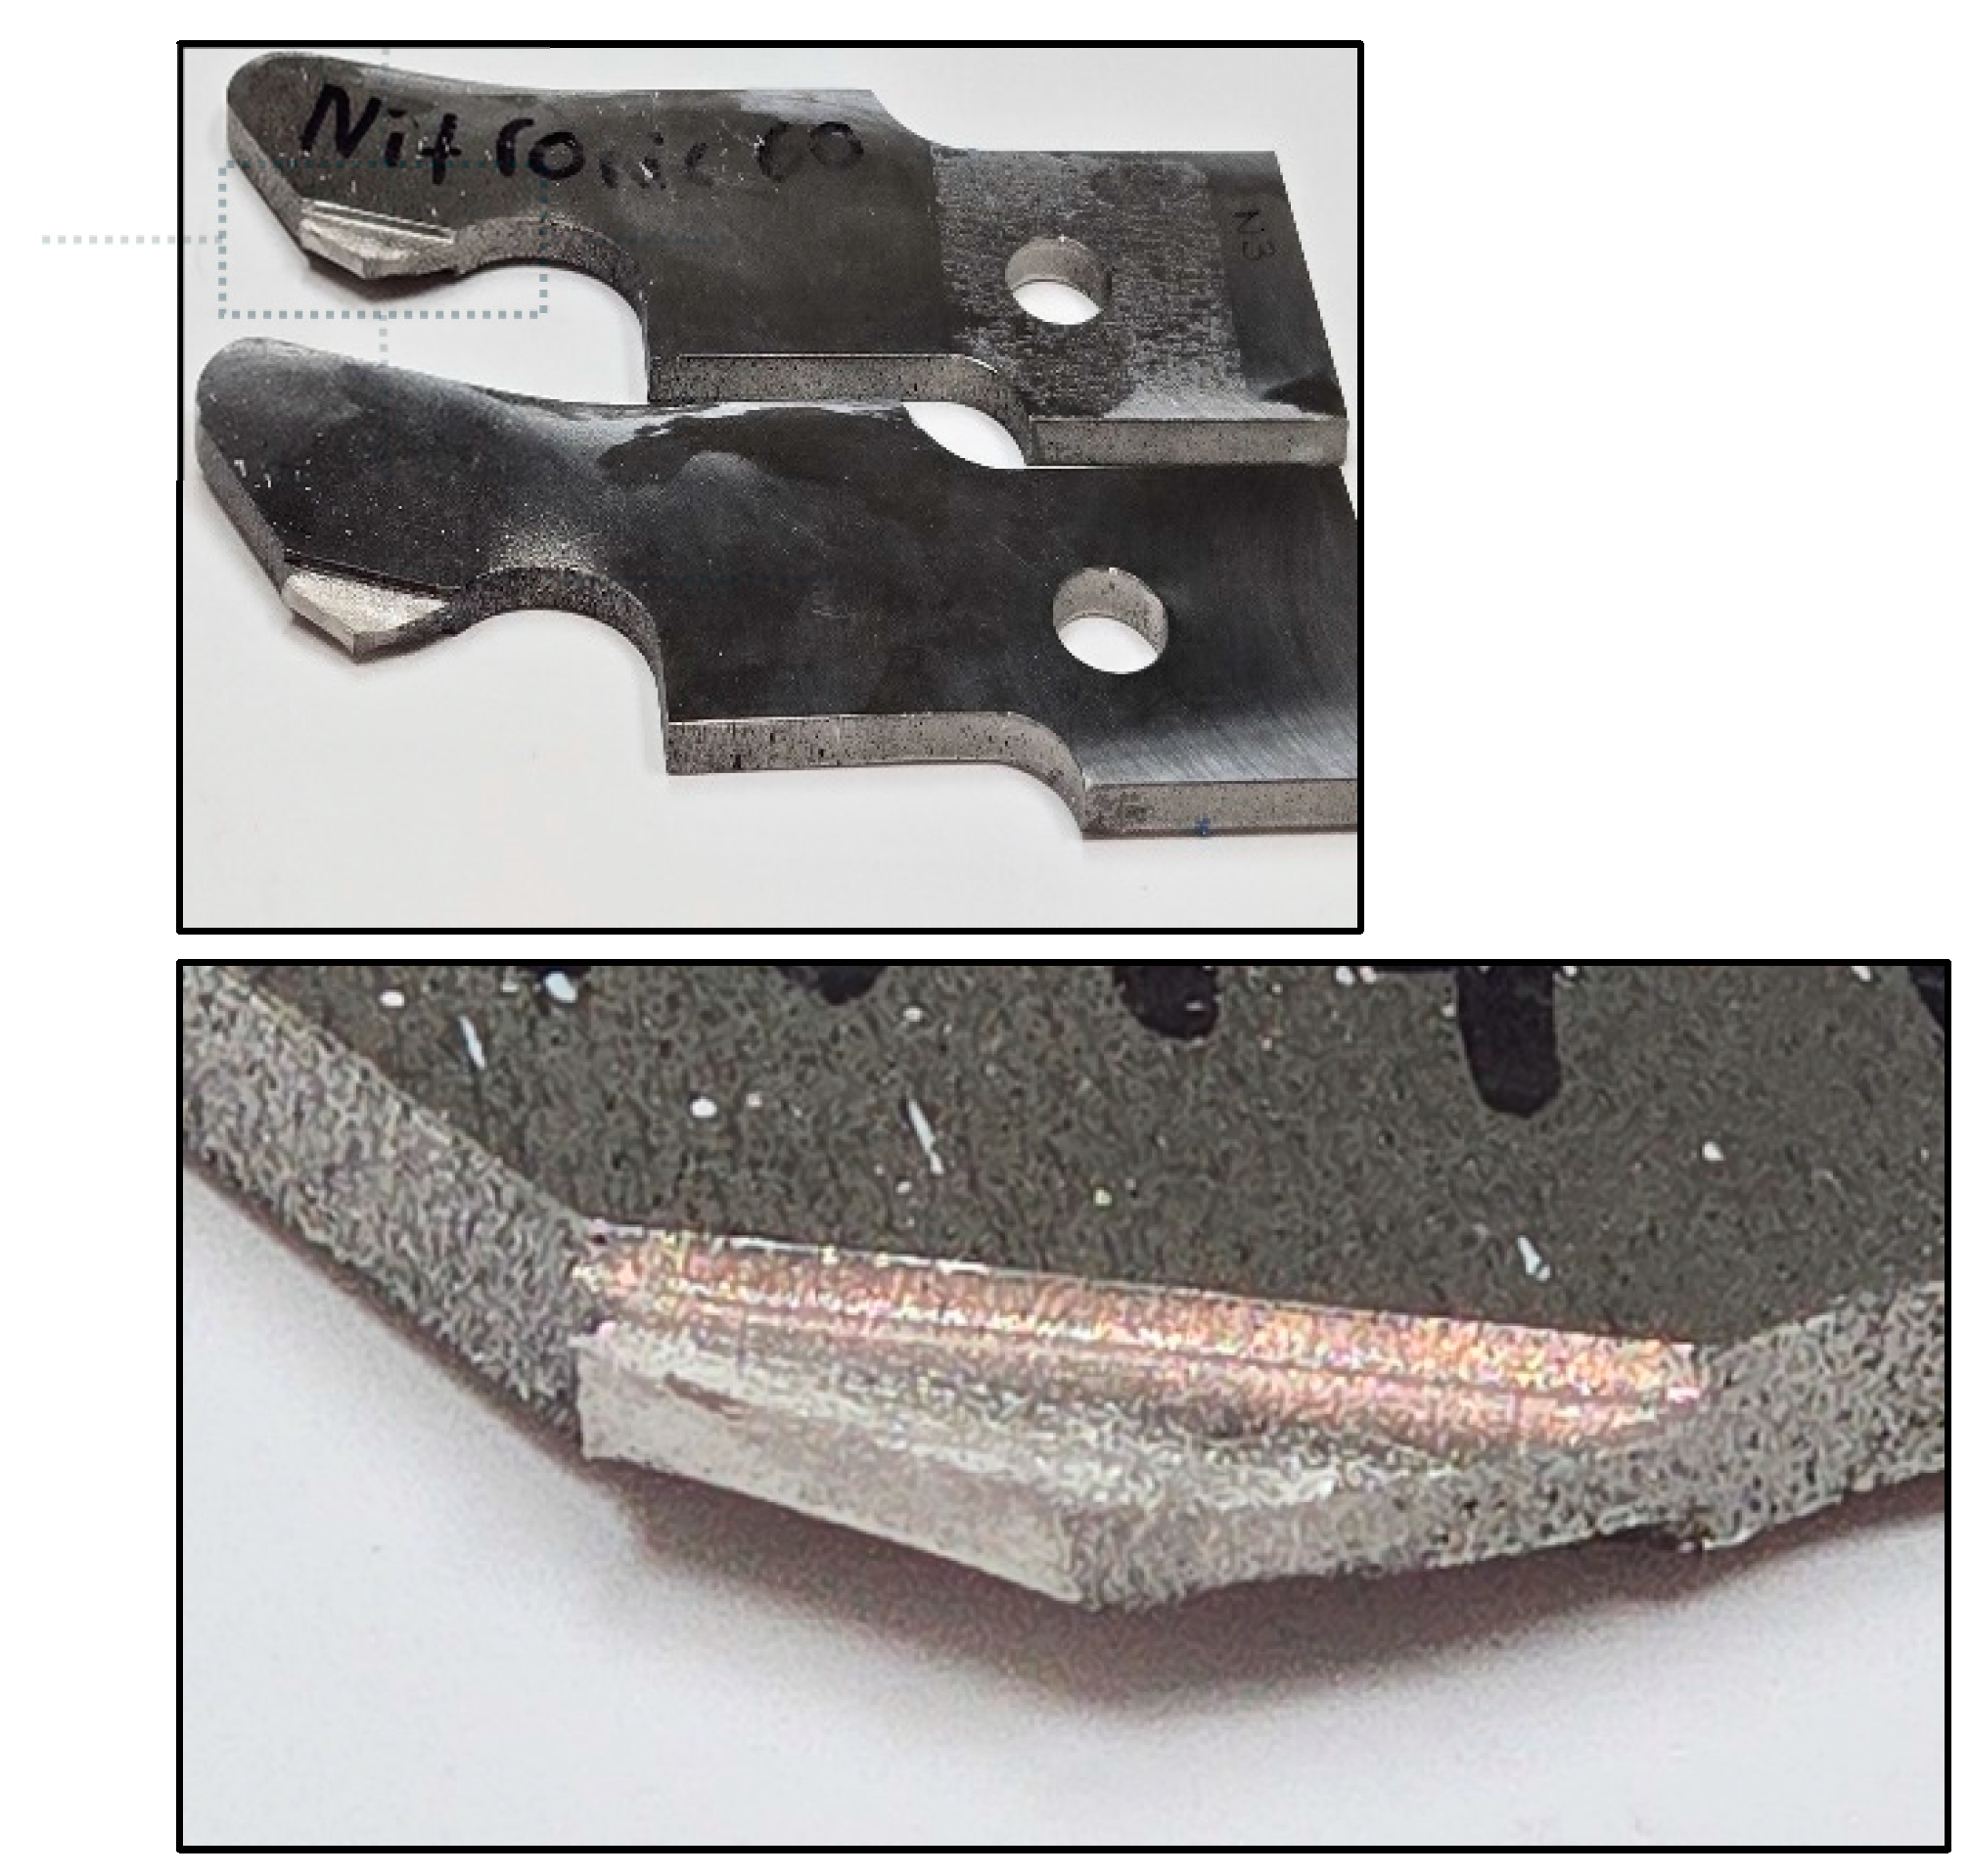
Figure 29.
Final stage of compression for specimen-821453, N60.

Figure 30.
curve for cylinders (specimen-821453).

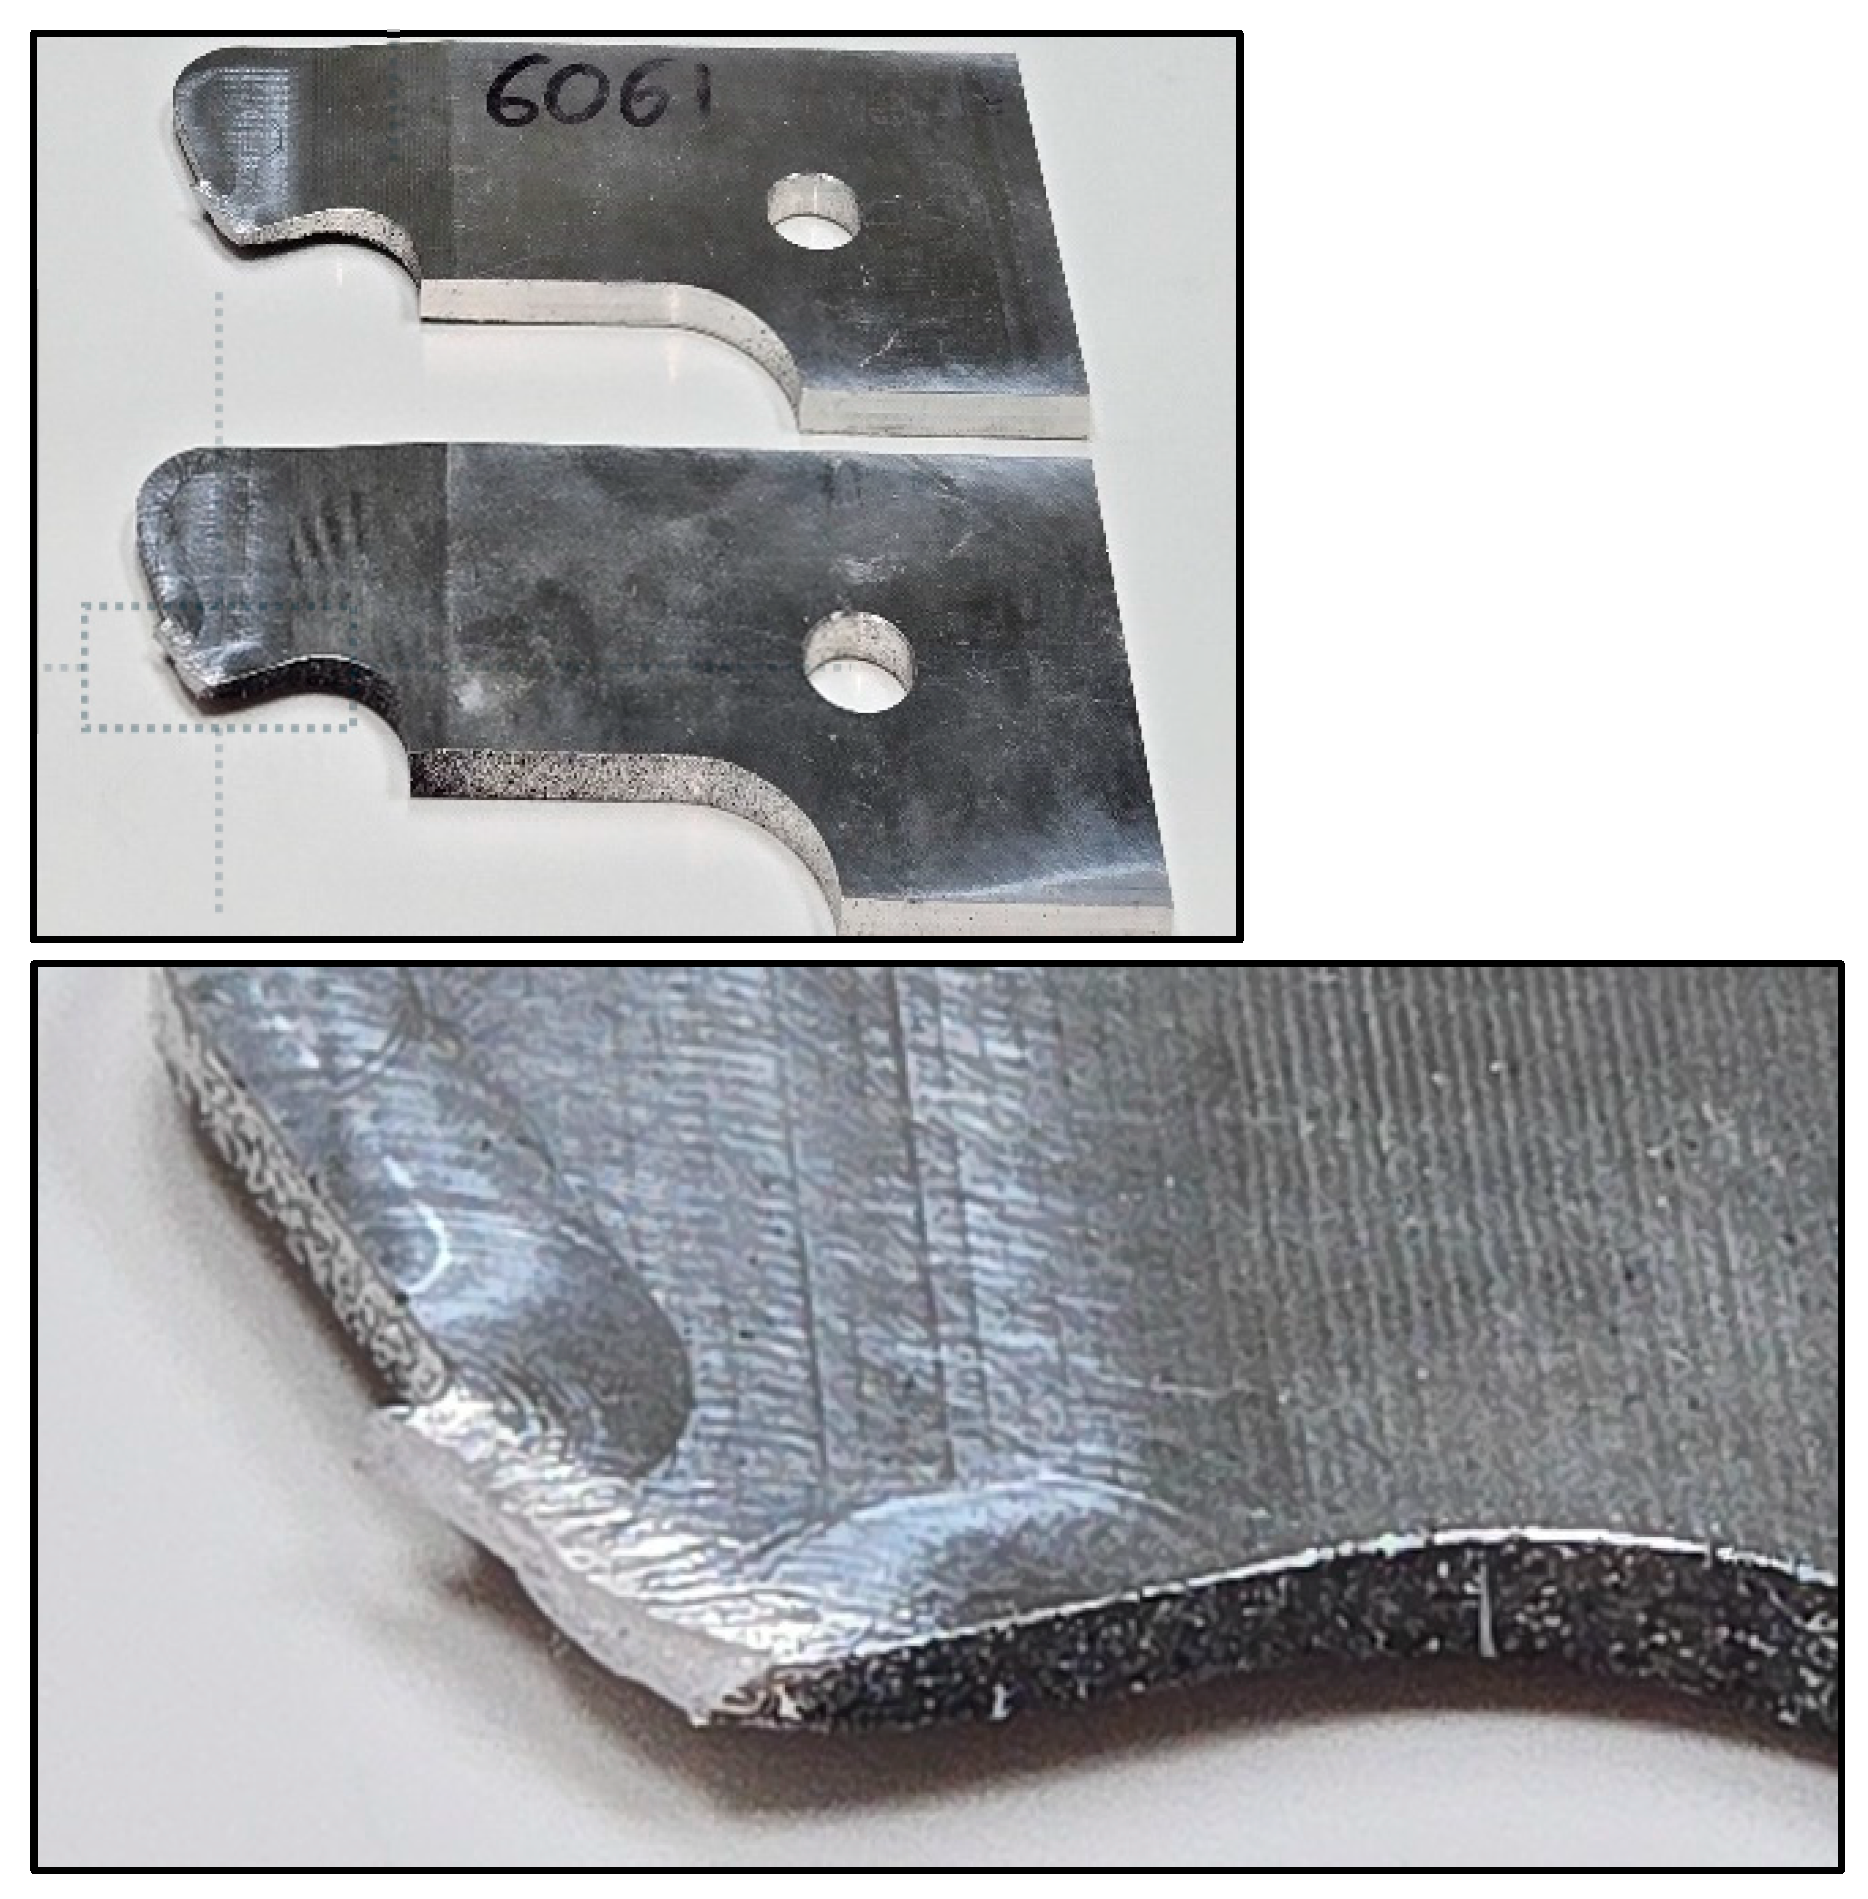
Figure 31.
Ductile fracture of specimen-821455, Al6061.
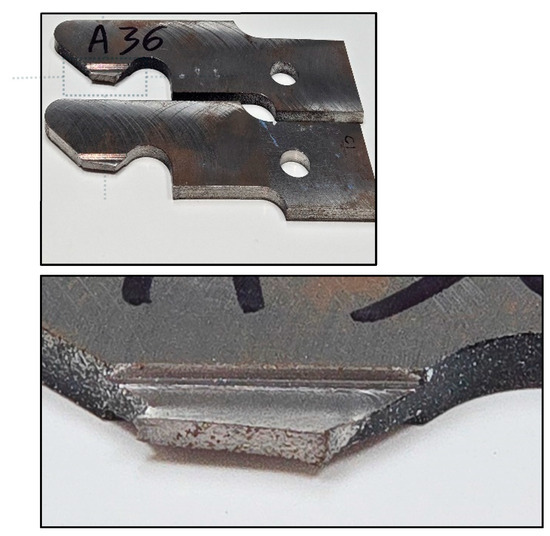
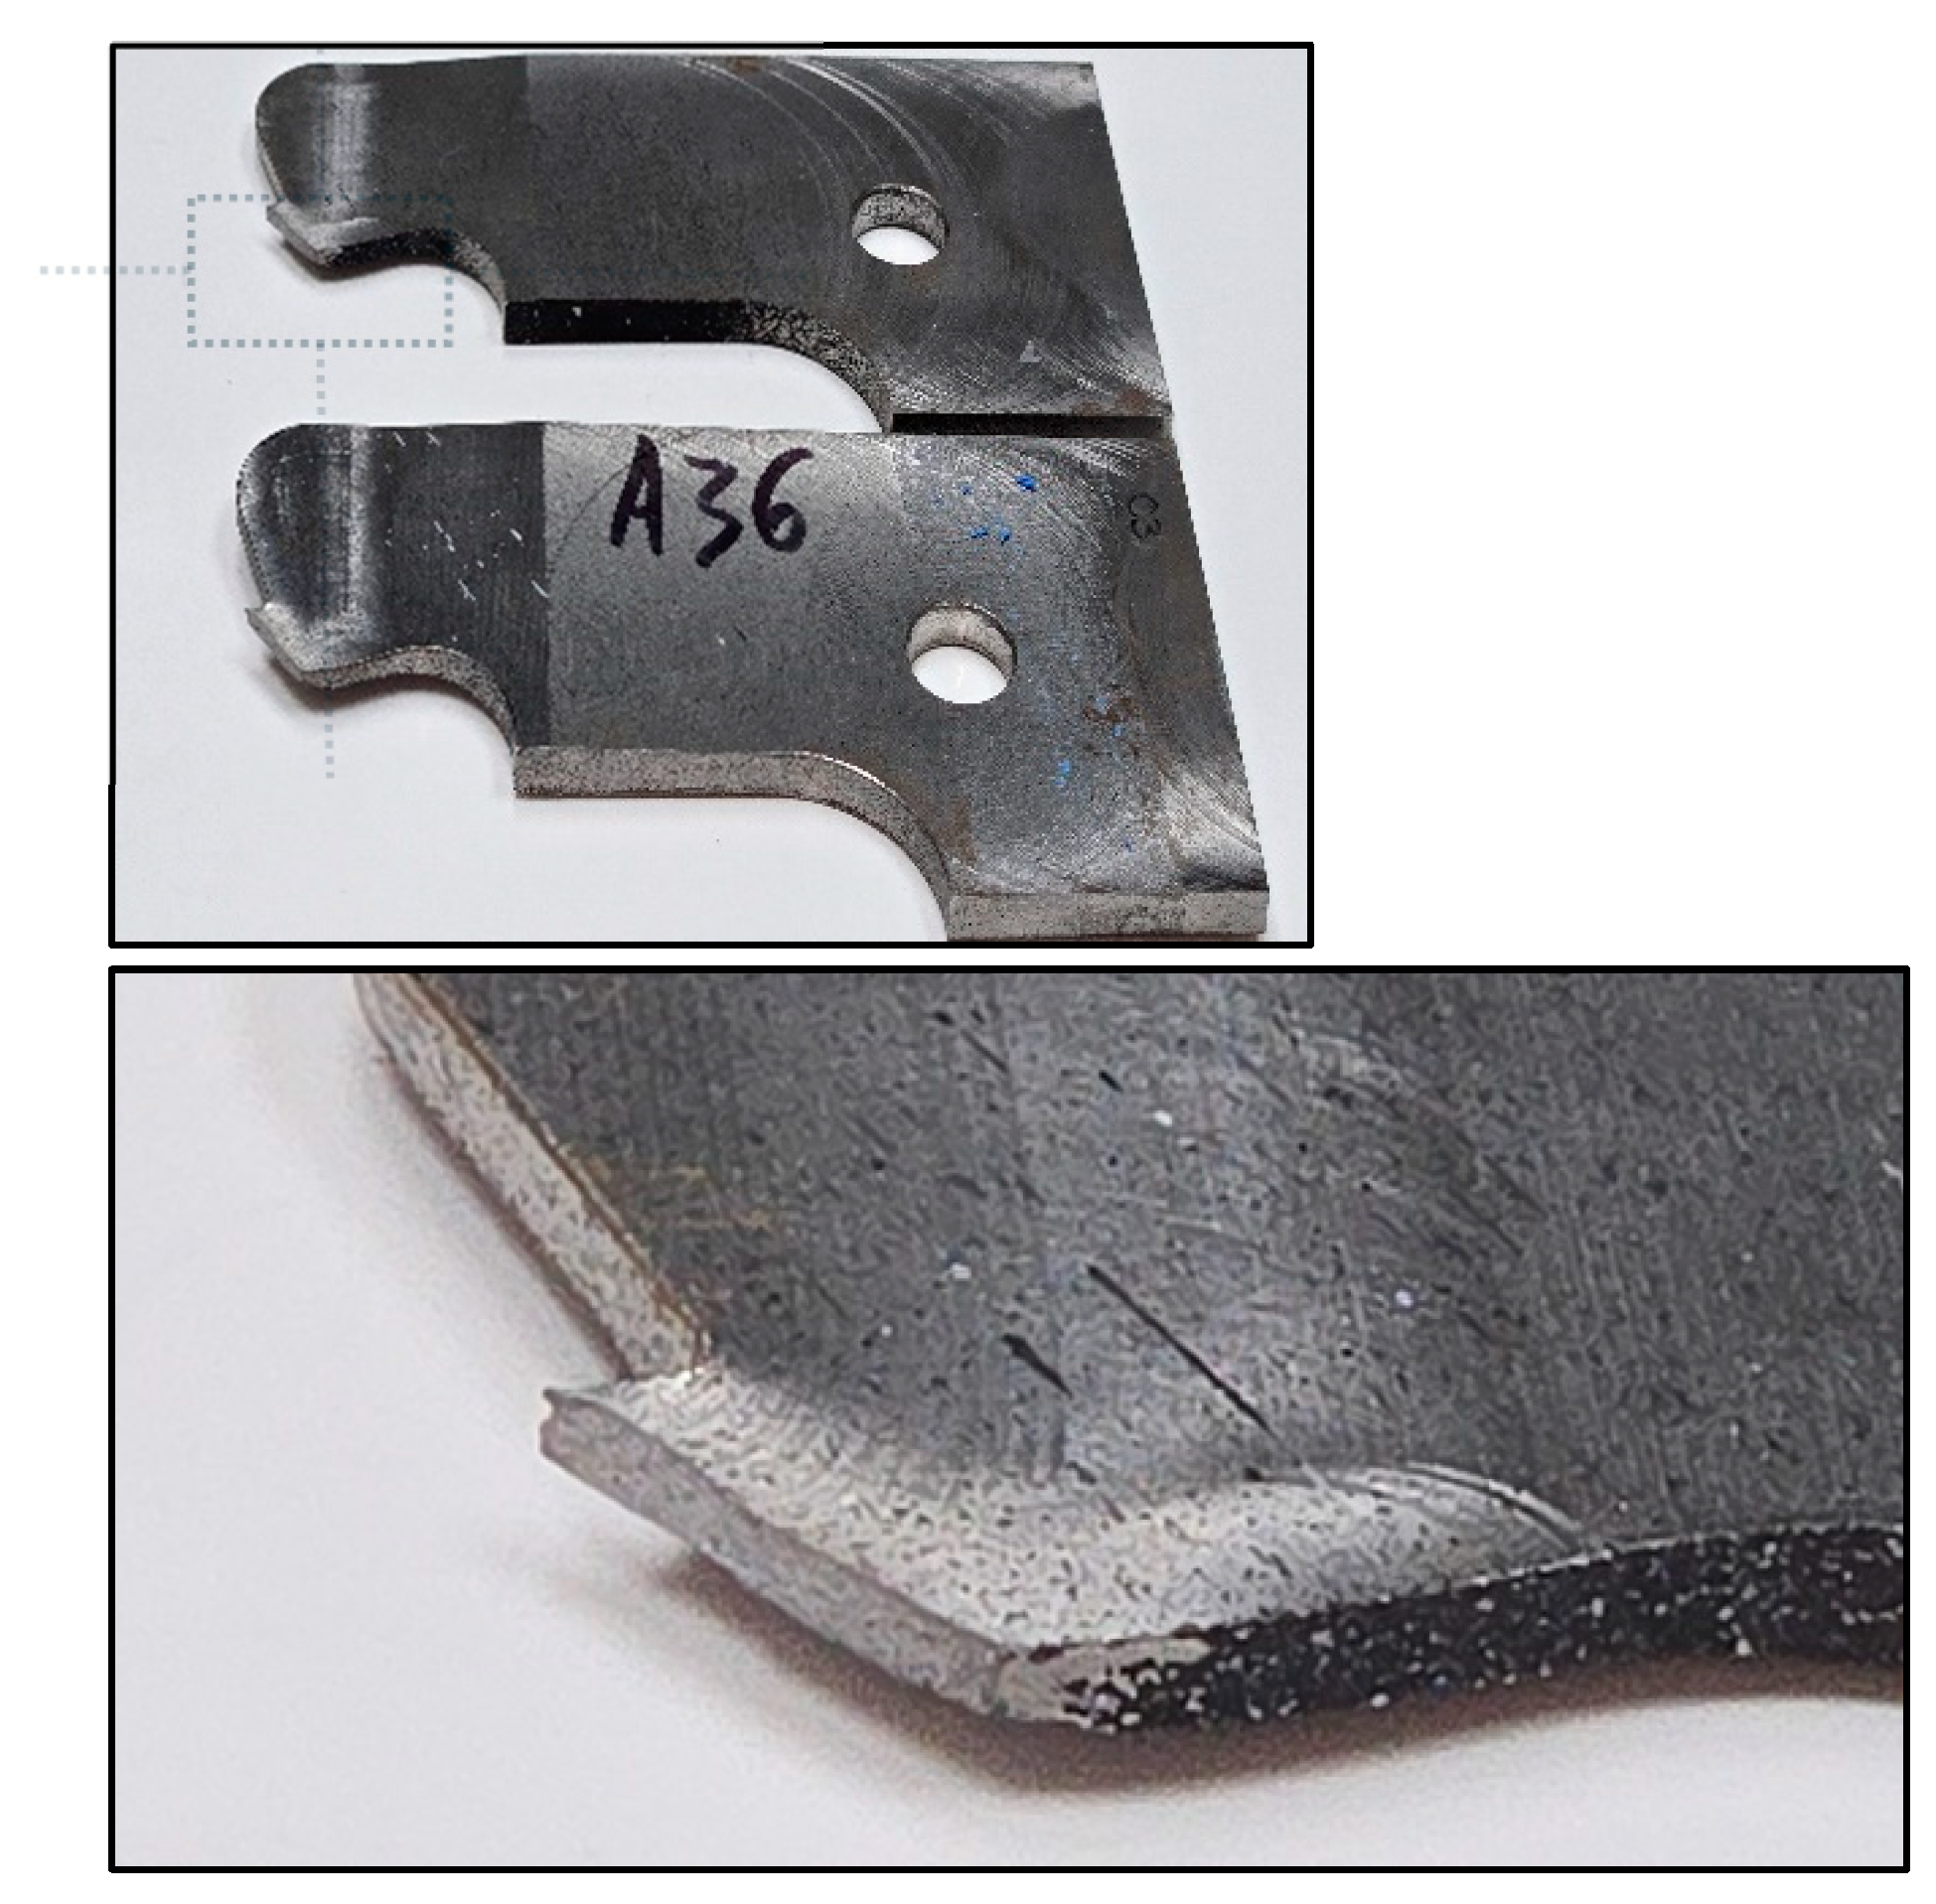
Figure 32.
Ductile fracture of specimen-821455, A36.
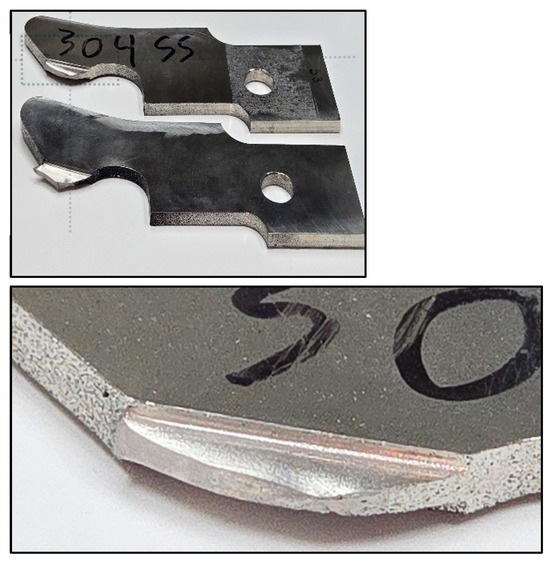
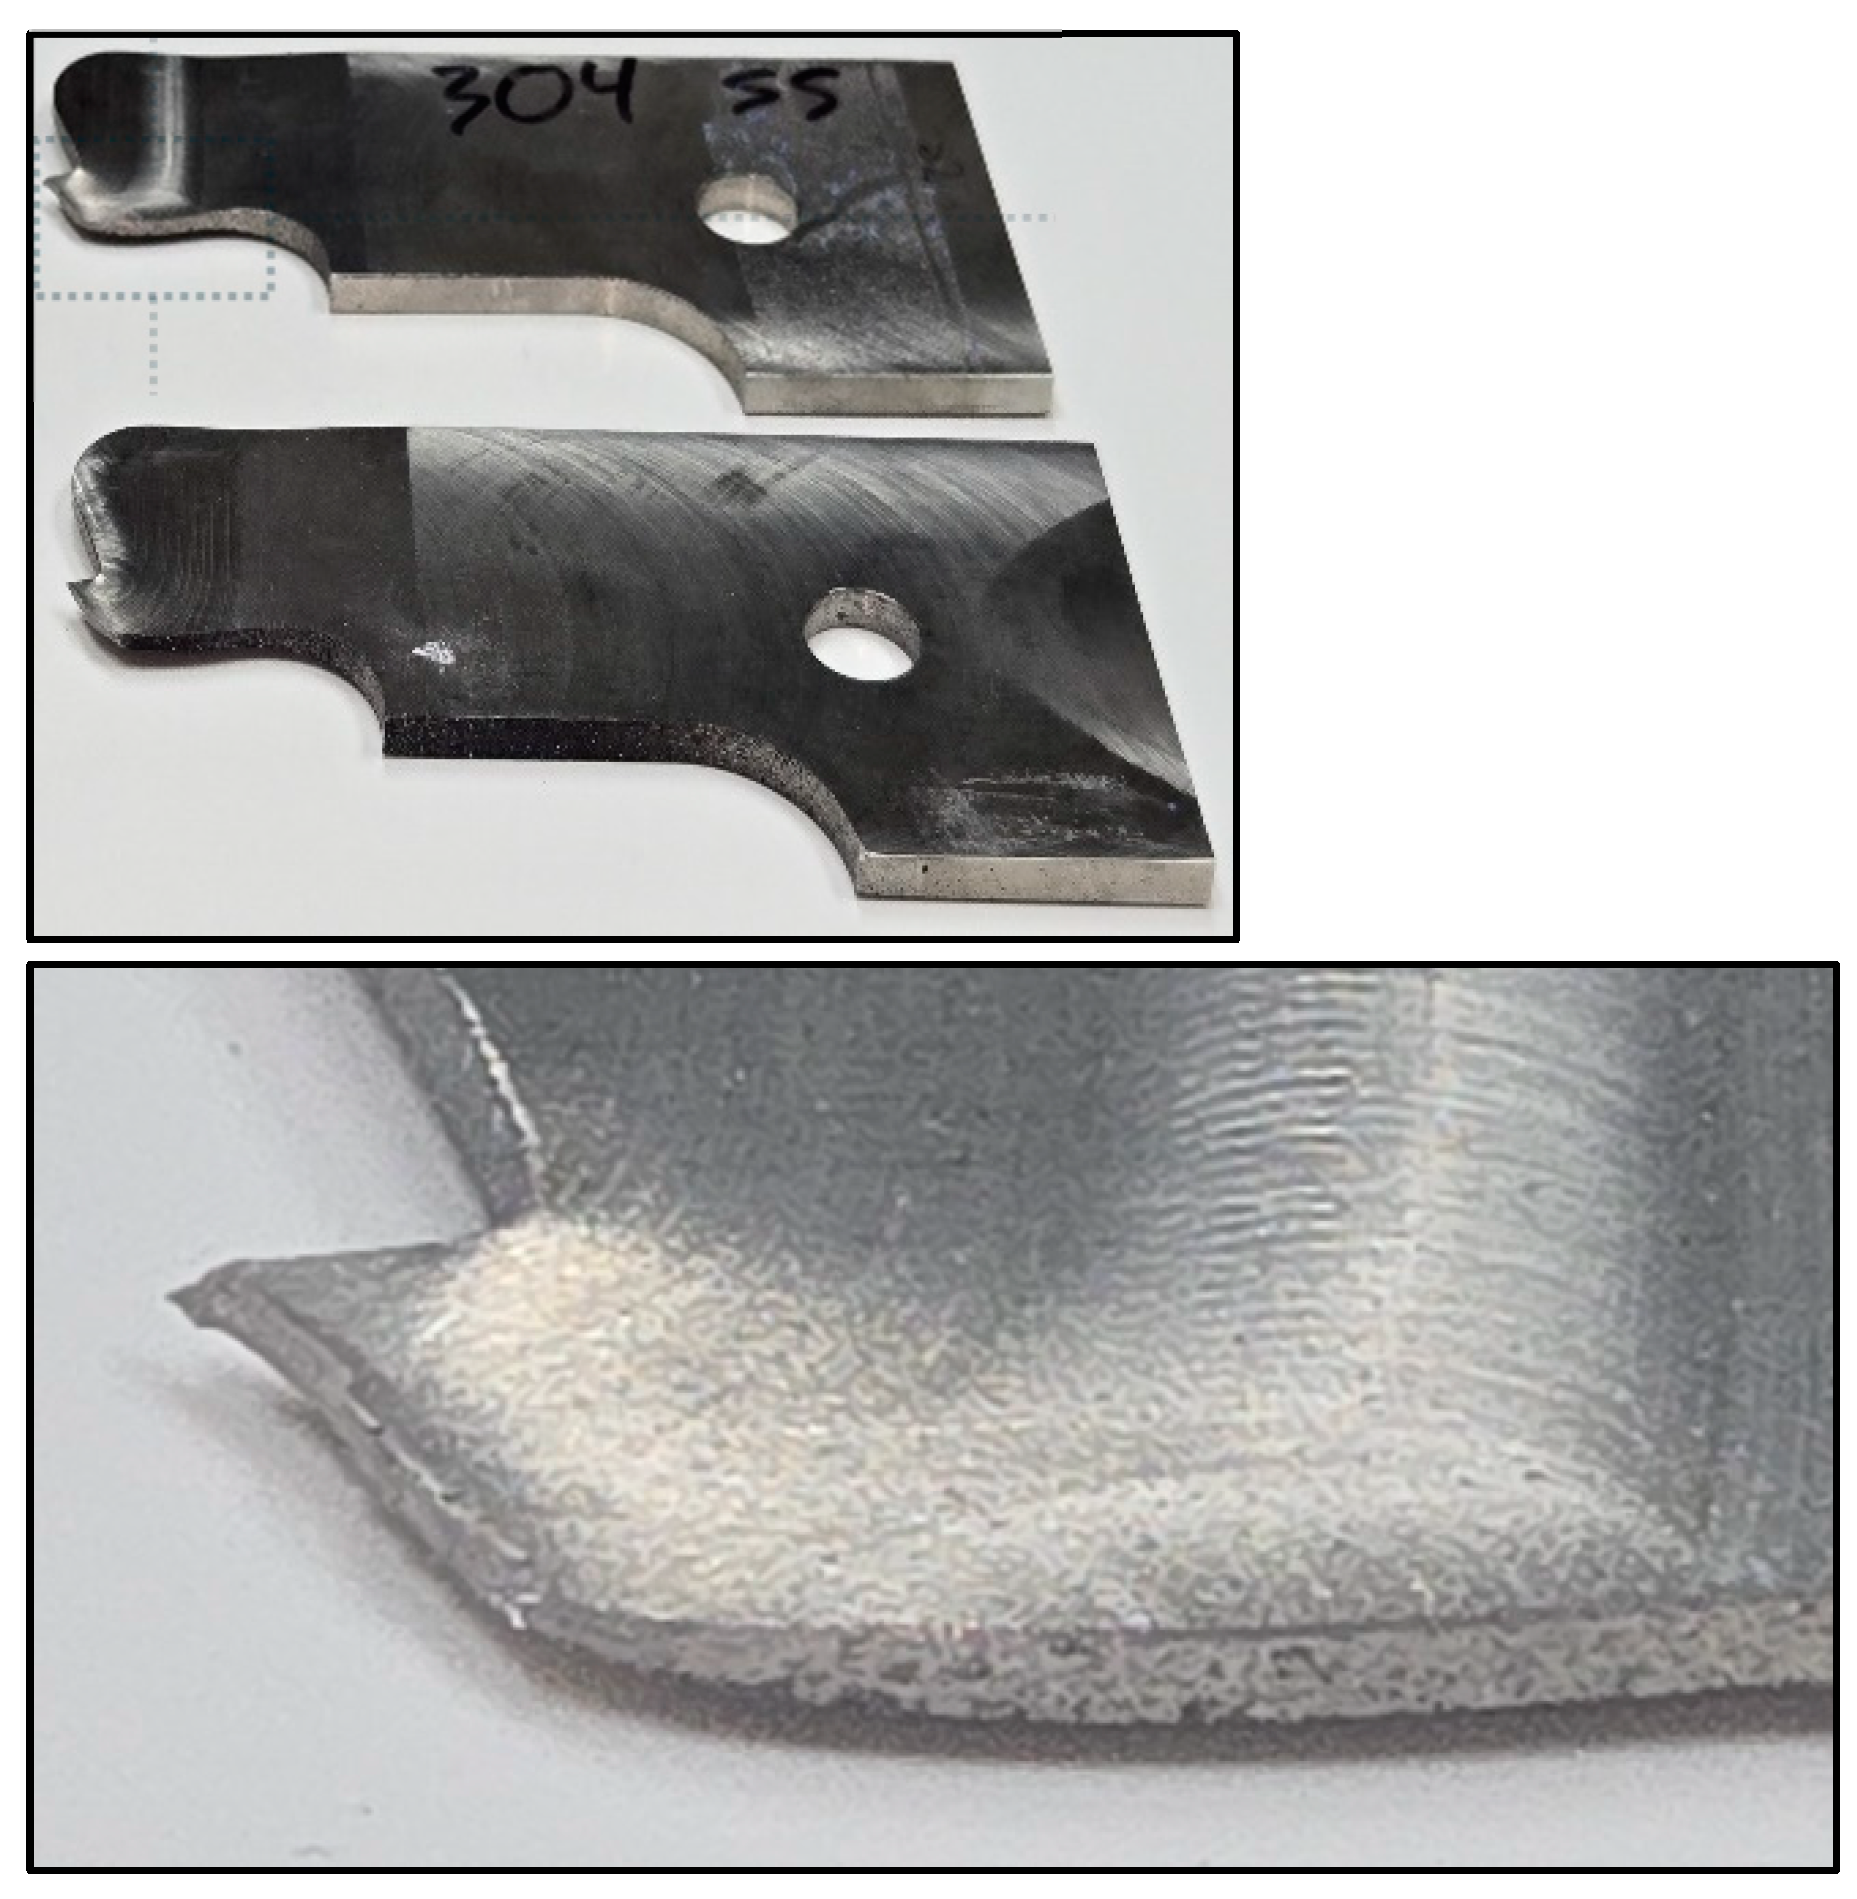
Figure 33.
Ductile fracture of specimen-821455, SS304.
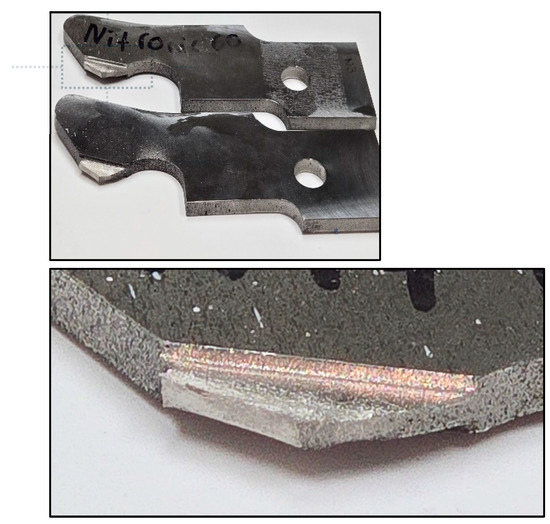
Figure 34.
Ductile fracture of specimen-821455, N60.
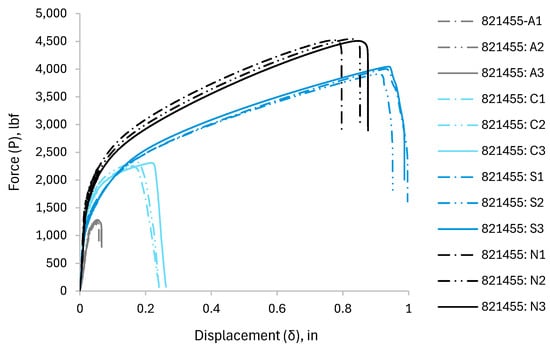
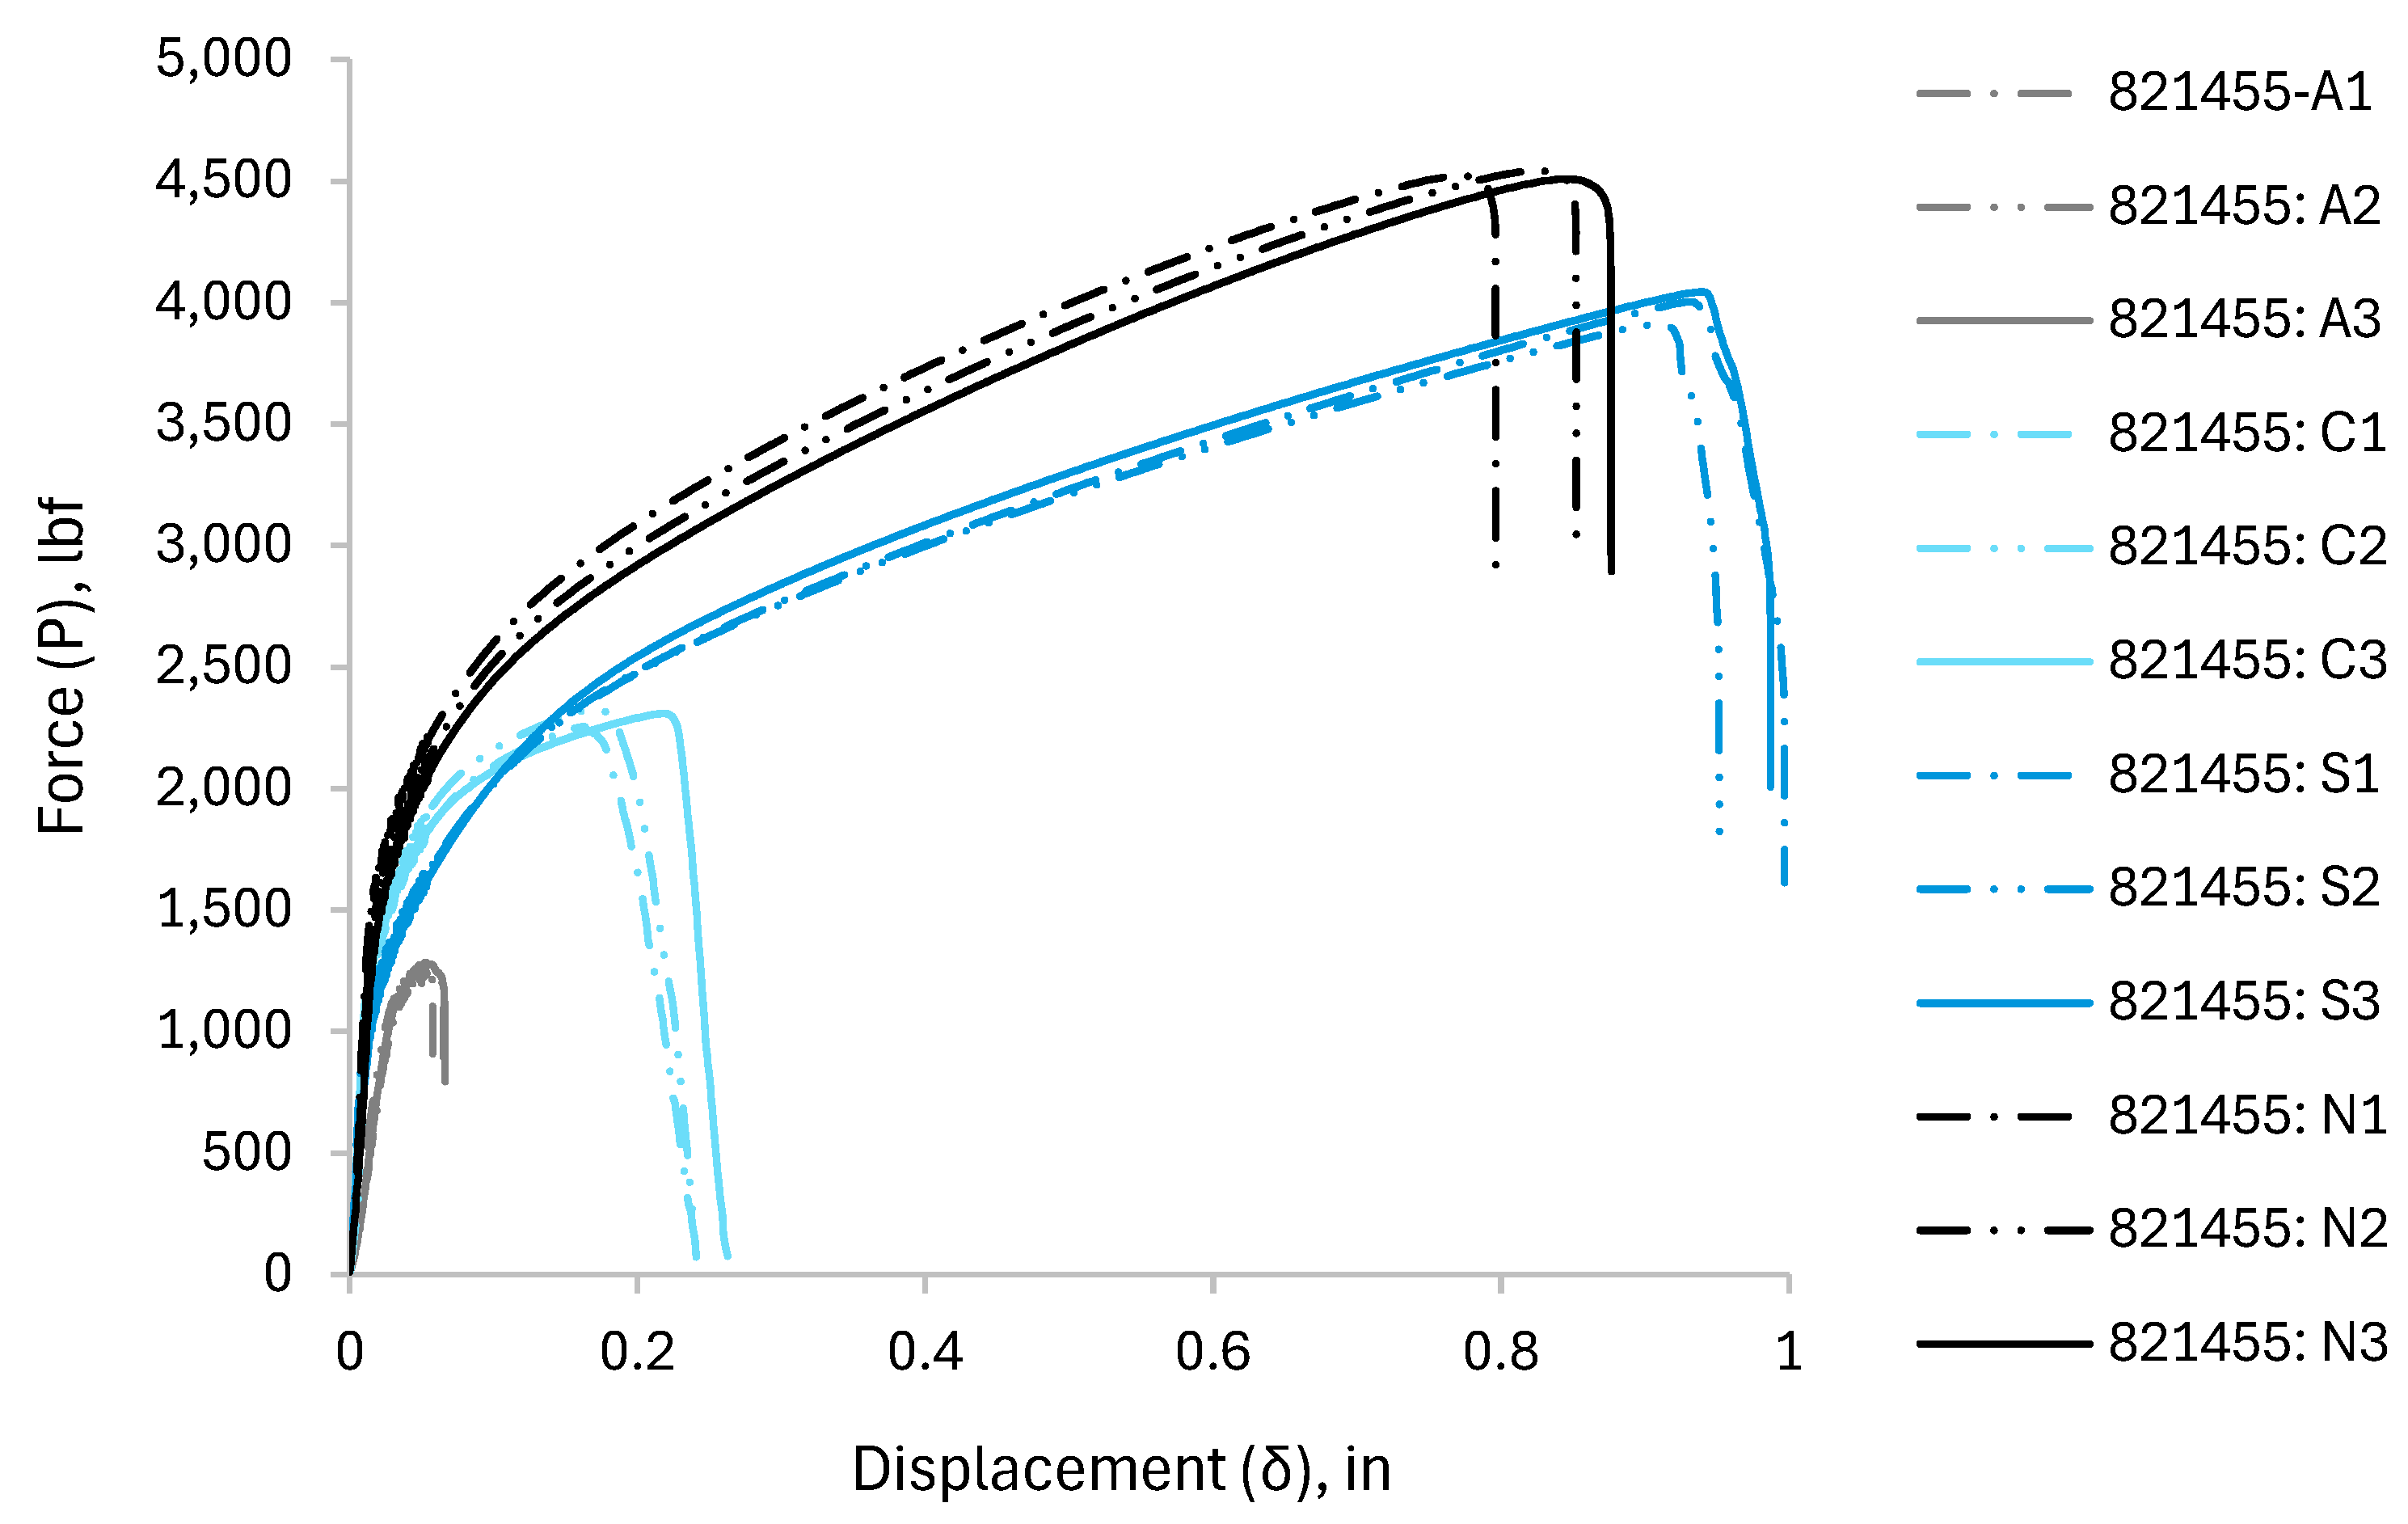
Figure 35.
curve for simple shear plates (specimen-821455).

Figure 36.
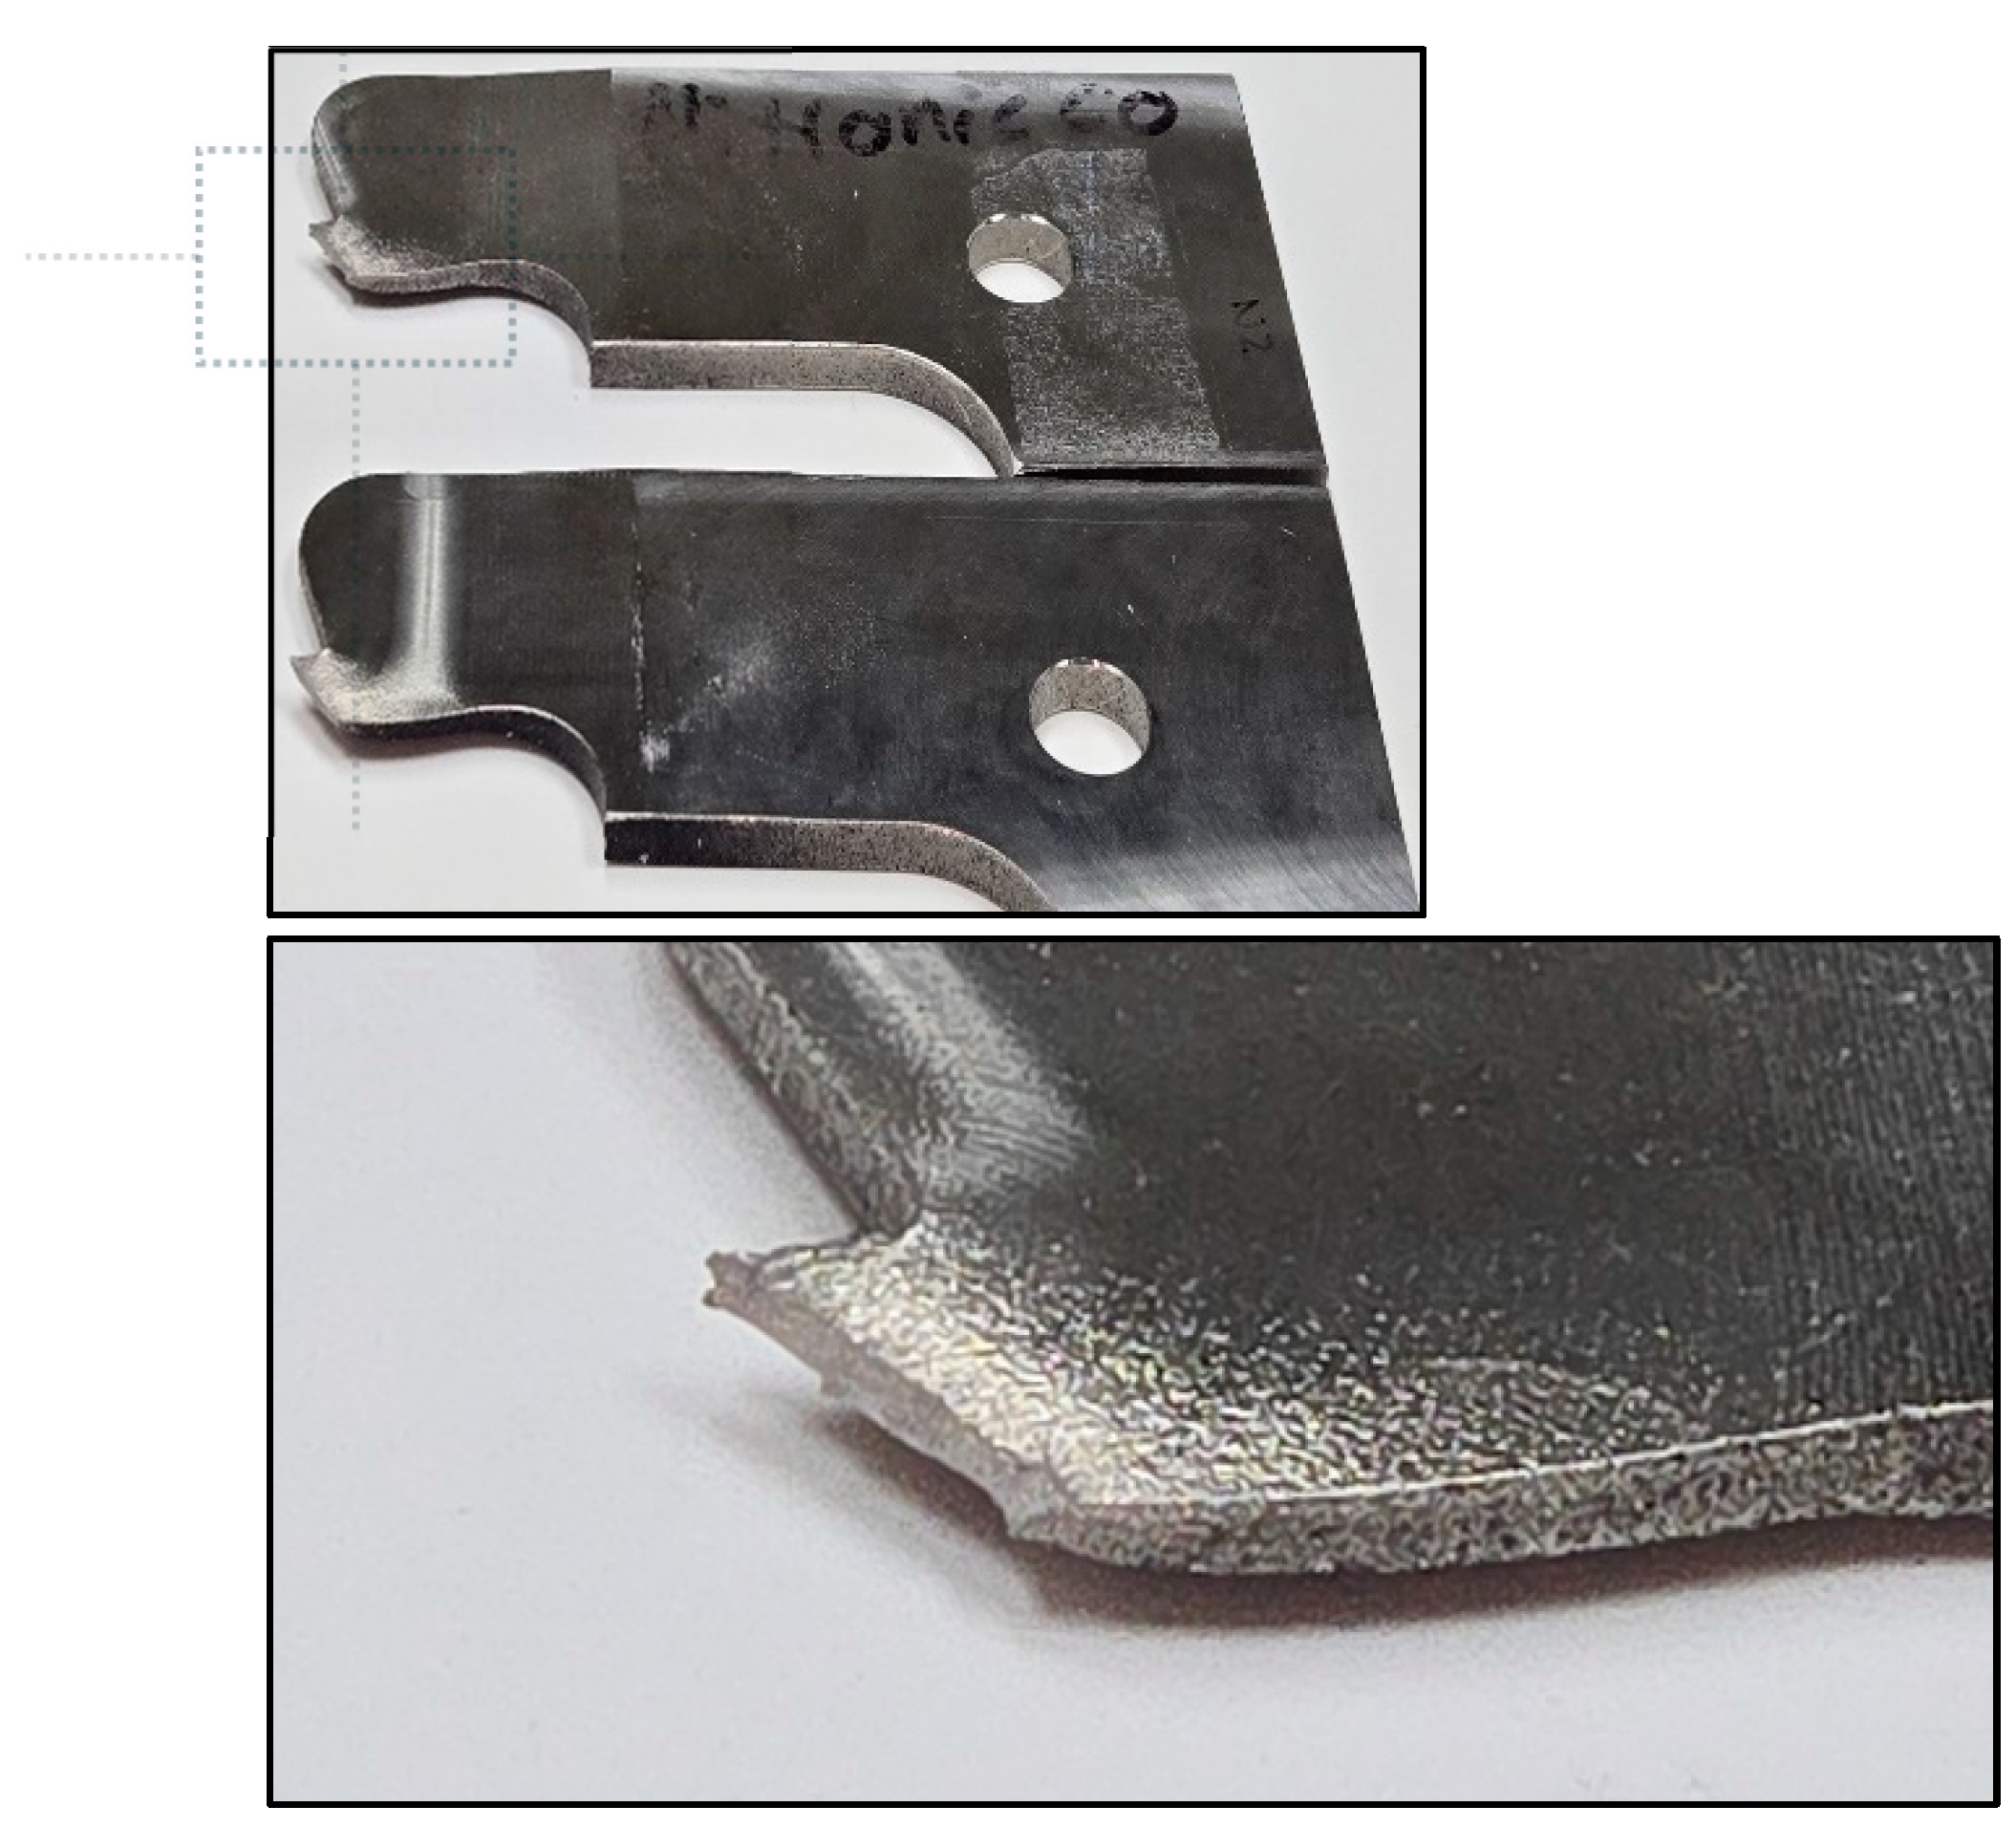
Ductile fracture of specimen-821456, Al6061.
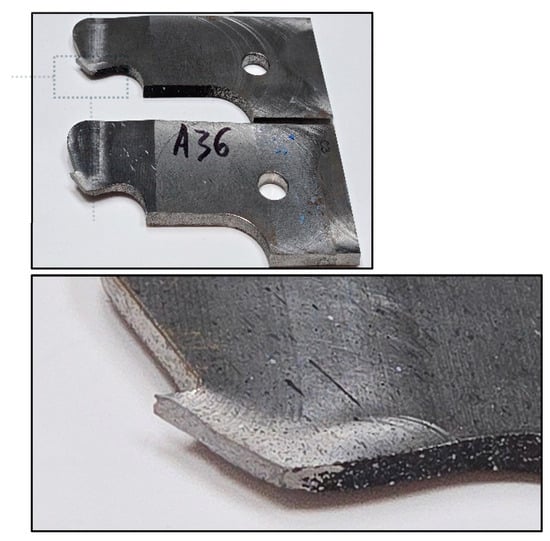
Figure 37.
Ductile fracture of specimen-821456, A36.
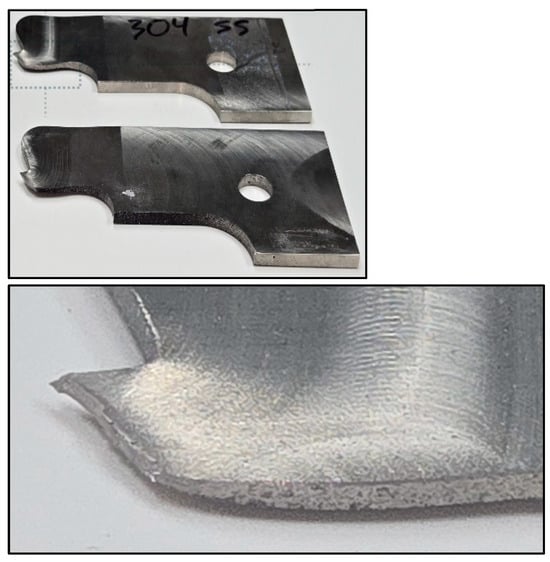
Figure 38.
Ductile fracture of specimen-821456, SS304.
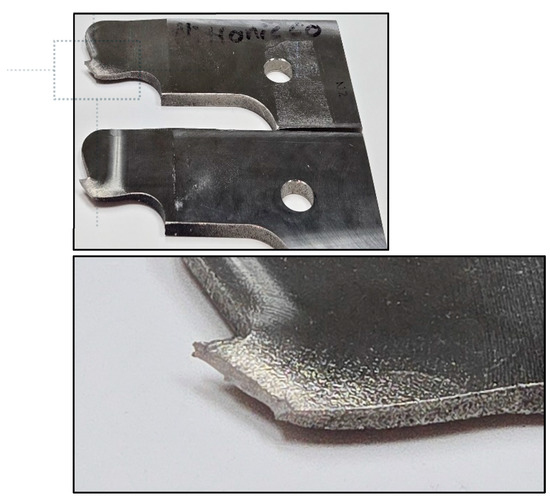
Figure 39.
Ductile fracture of specimen-821456, N60.
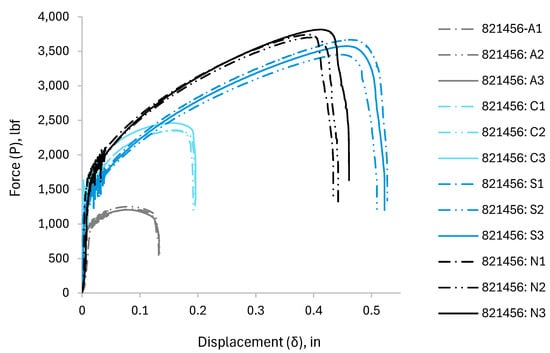
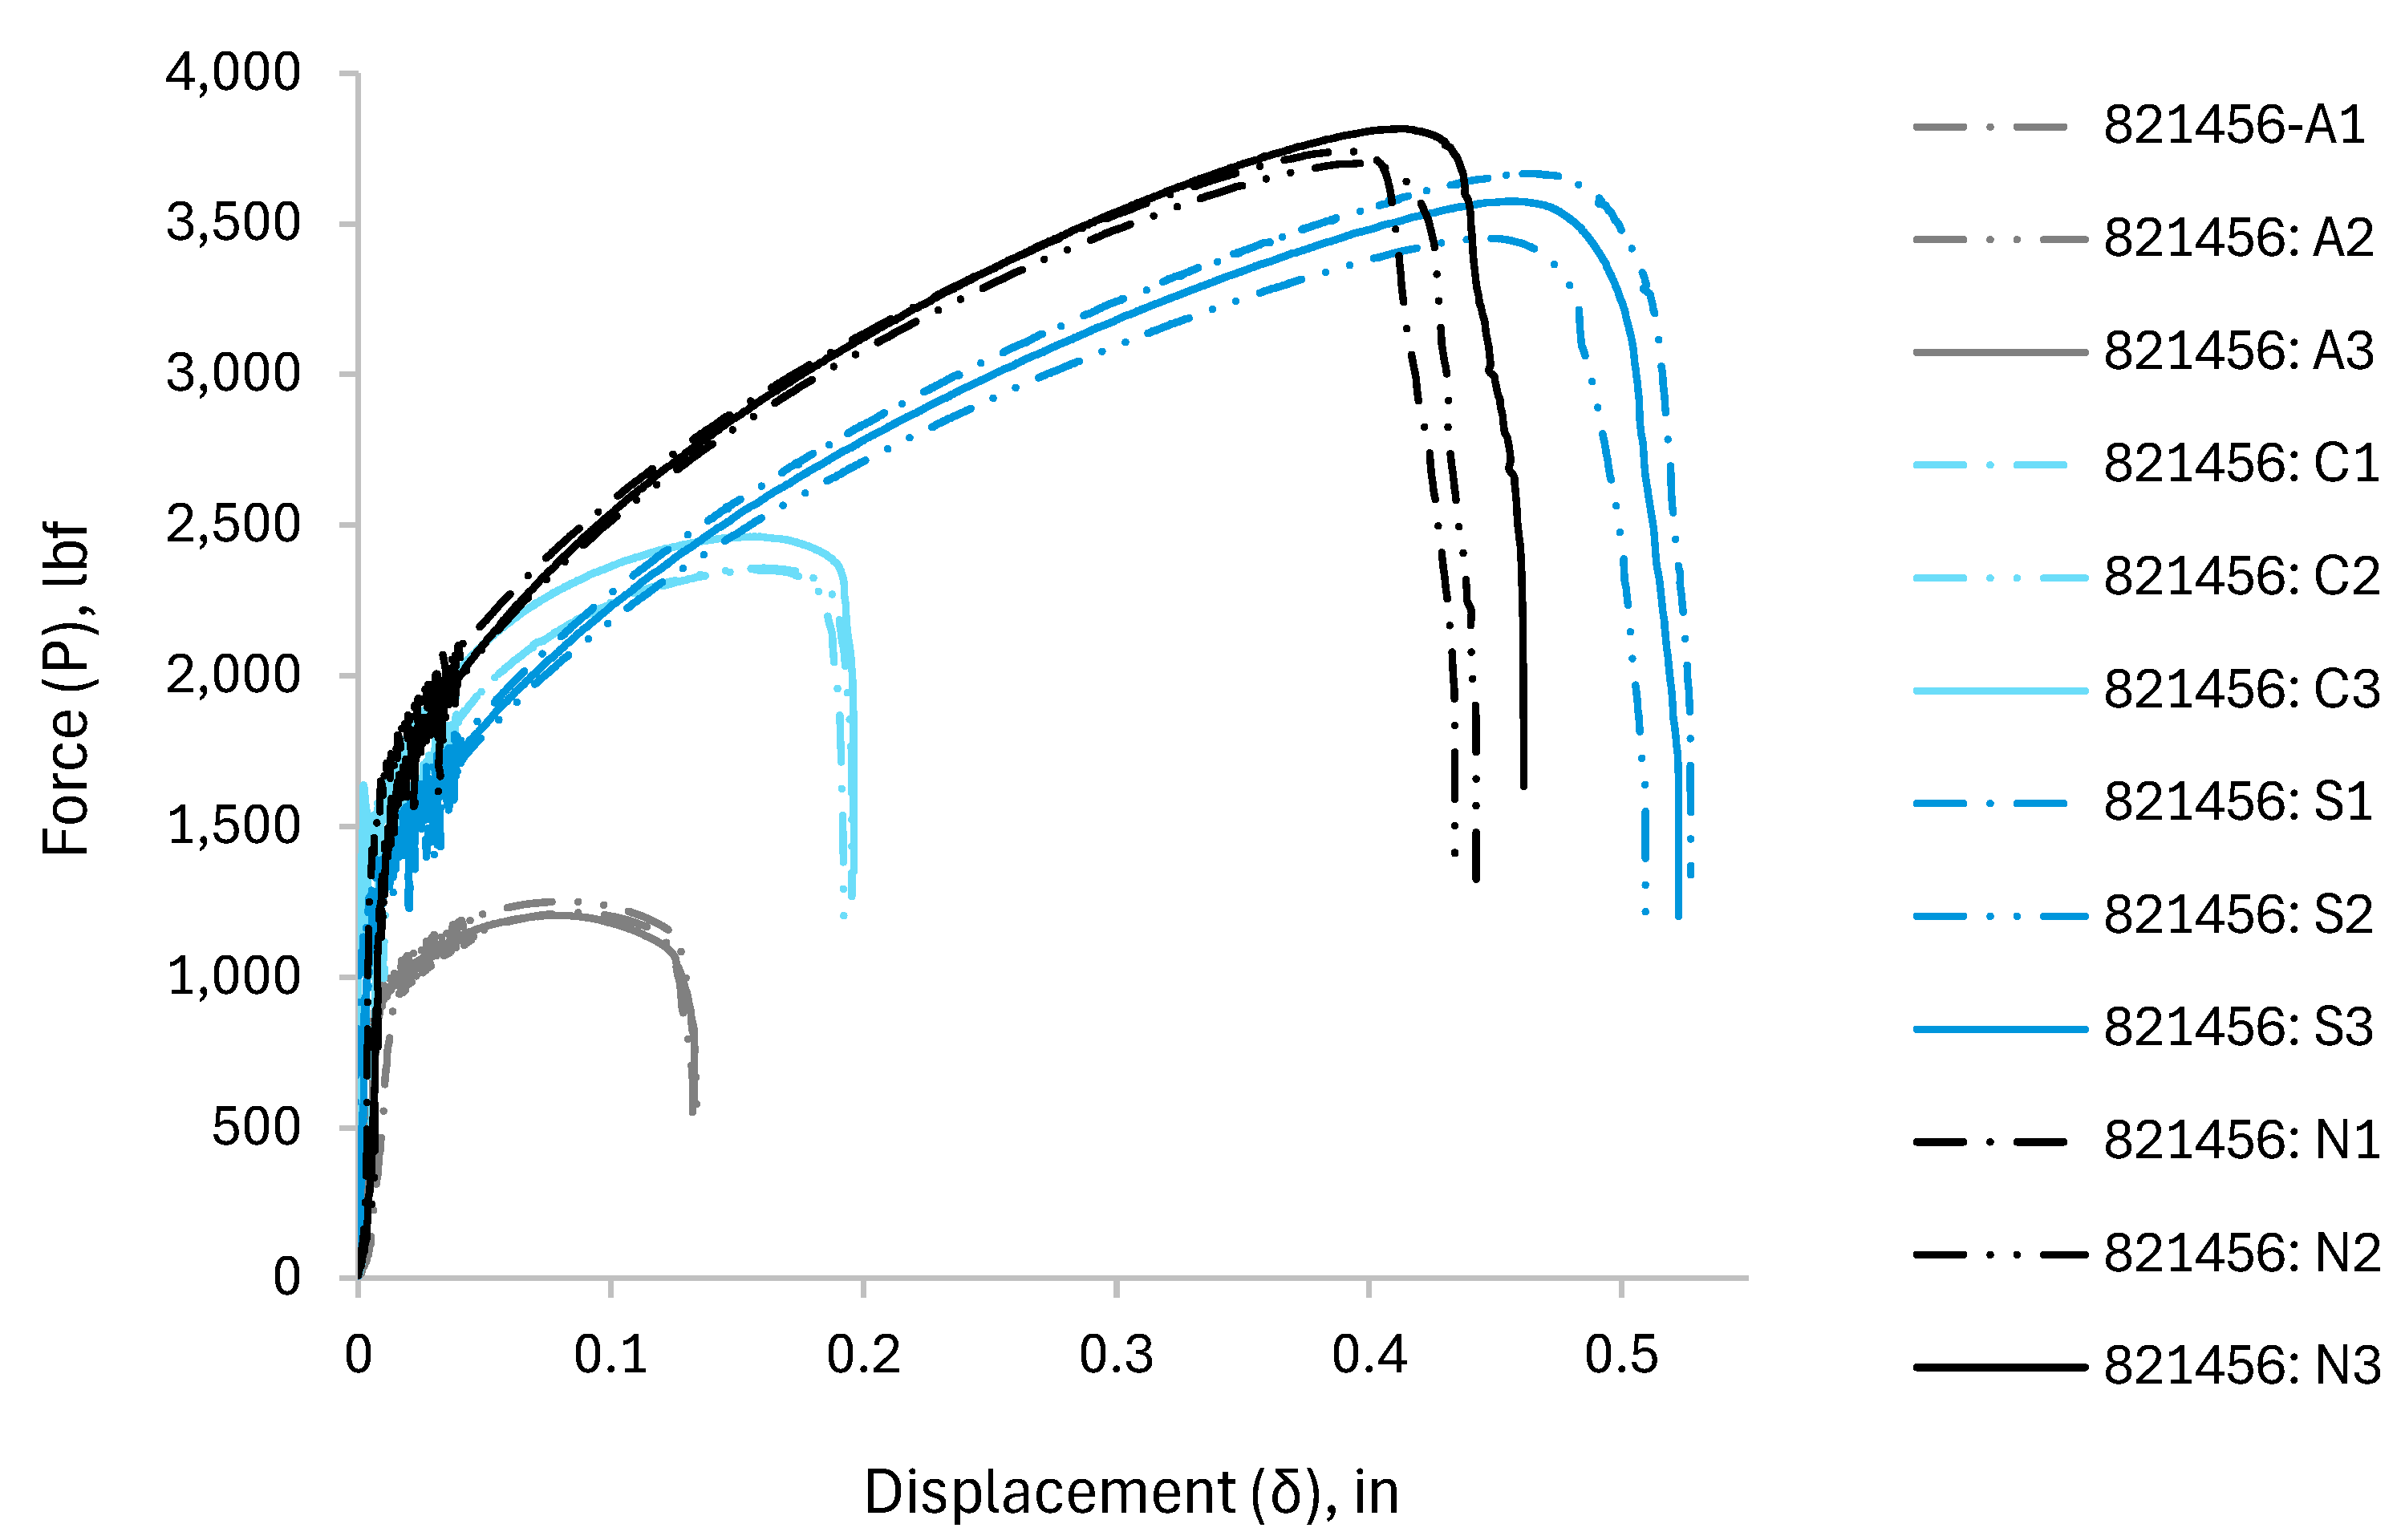
Figure 40.
curve for combined shear/tension plates (specimen-821456).
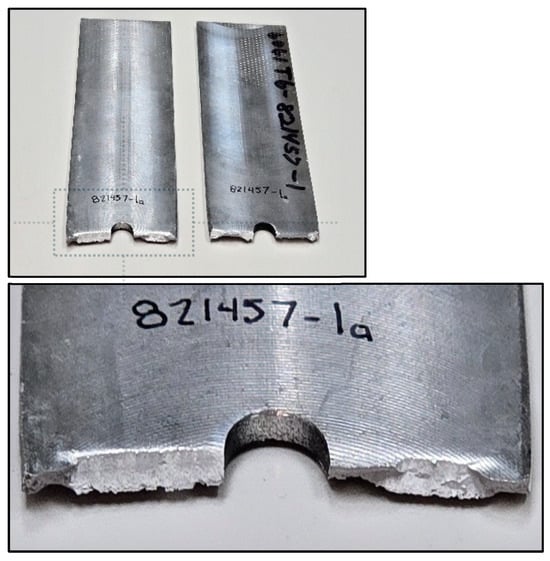
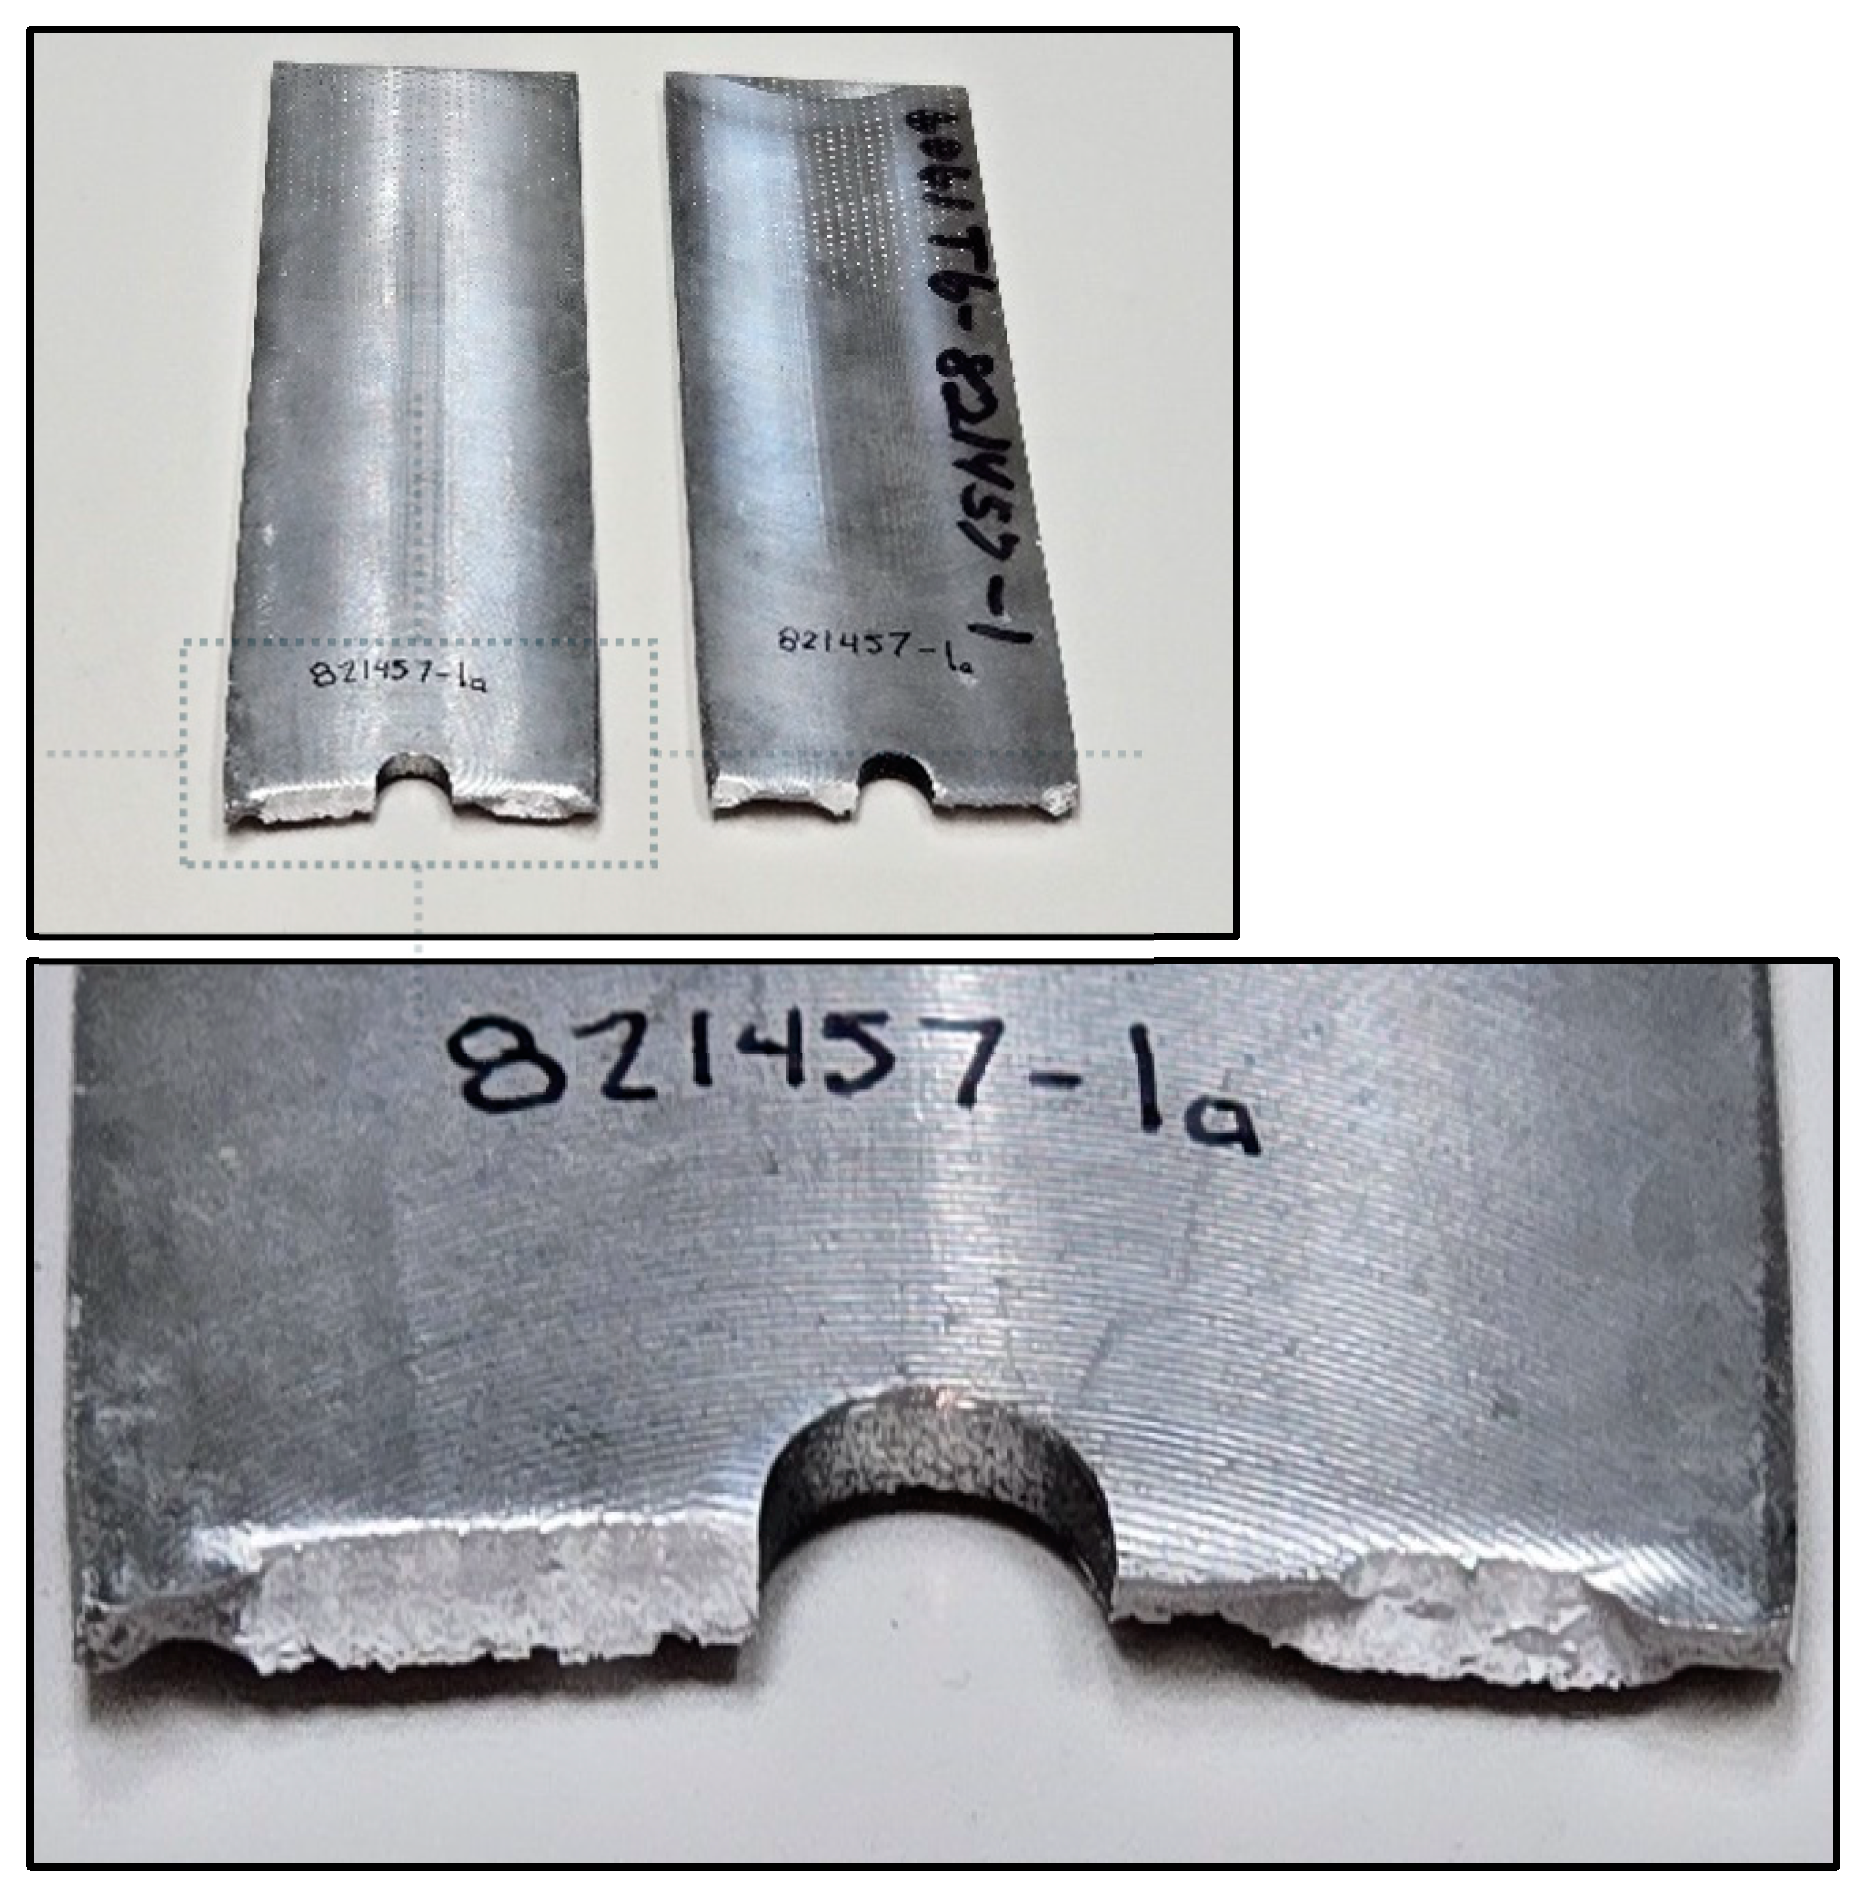
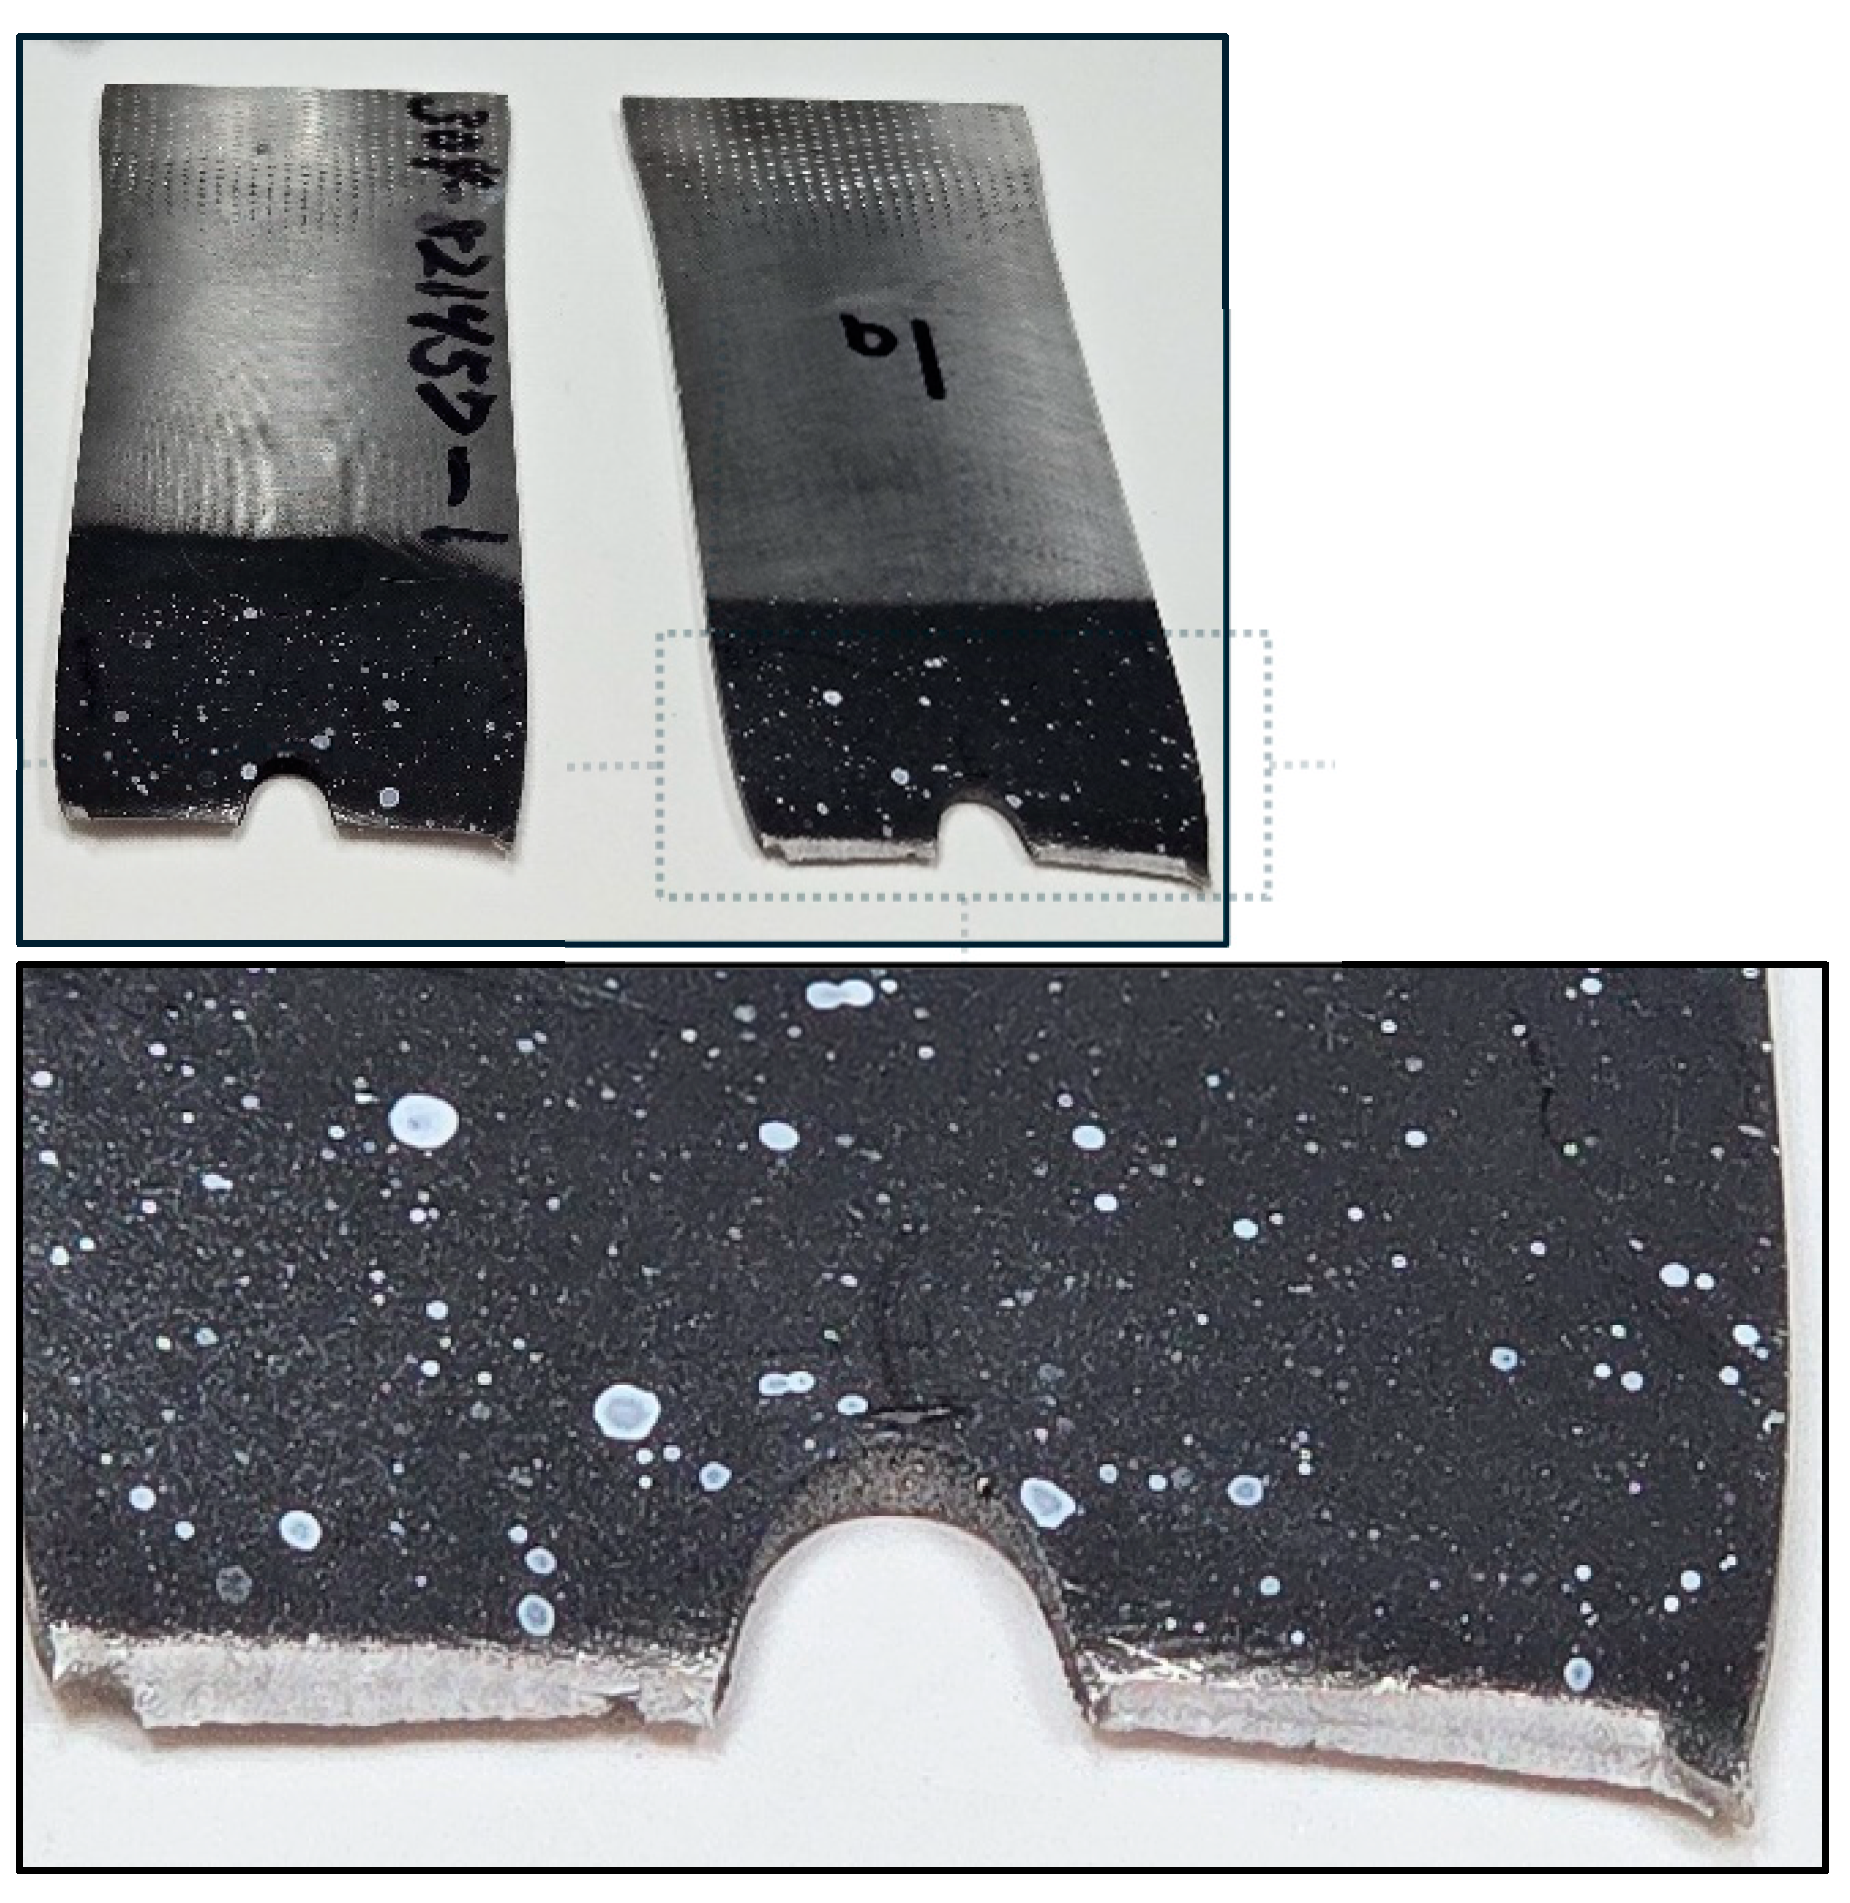
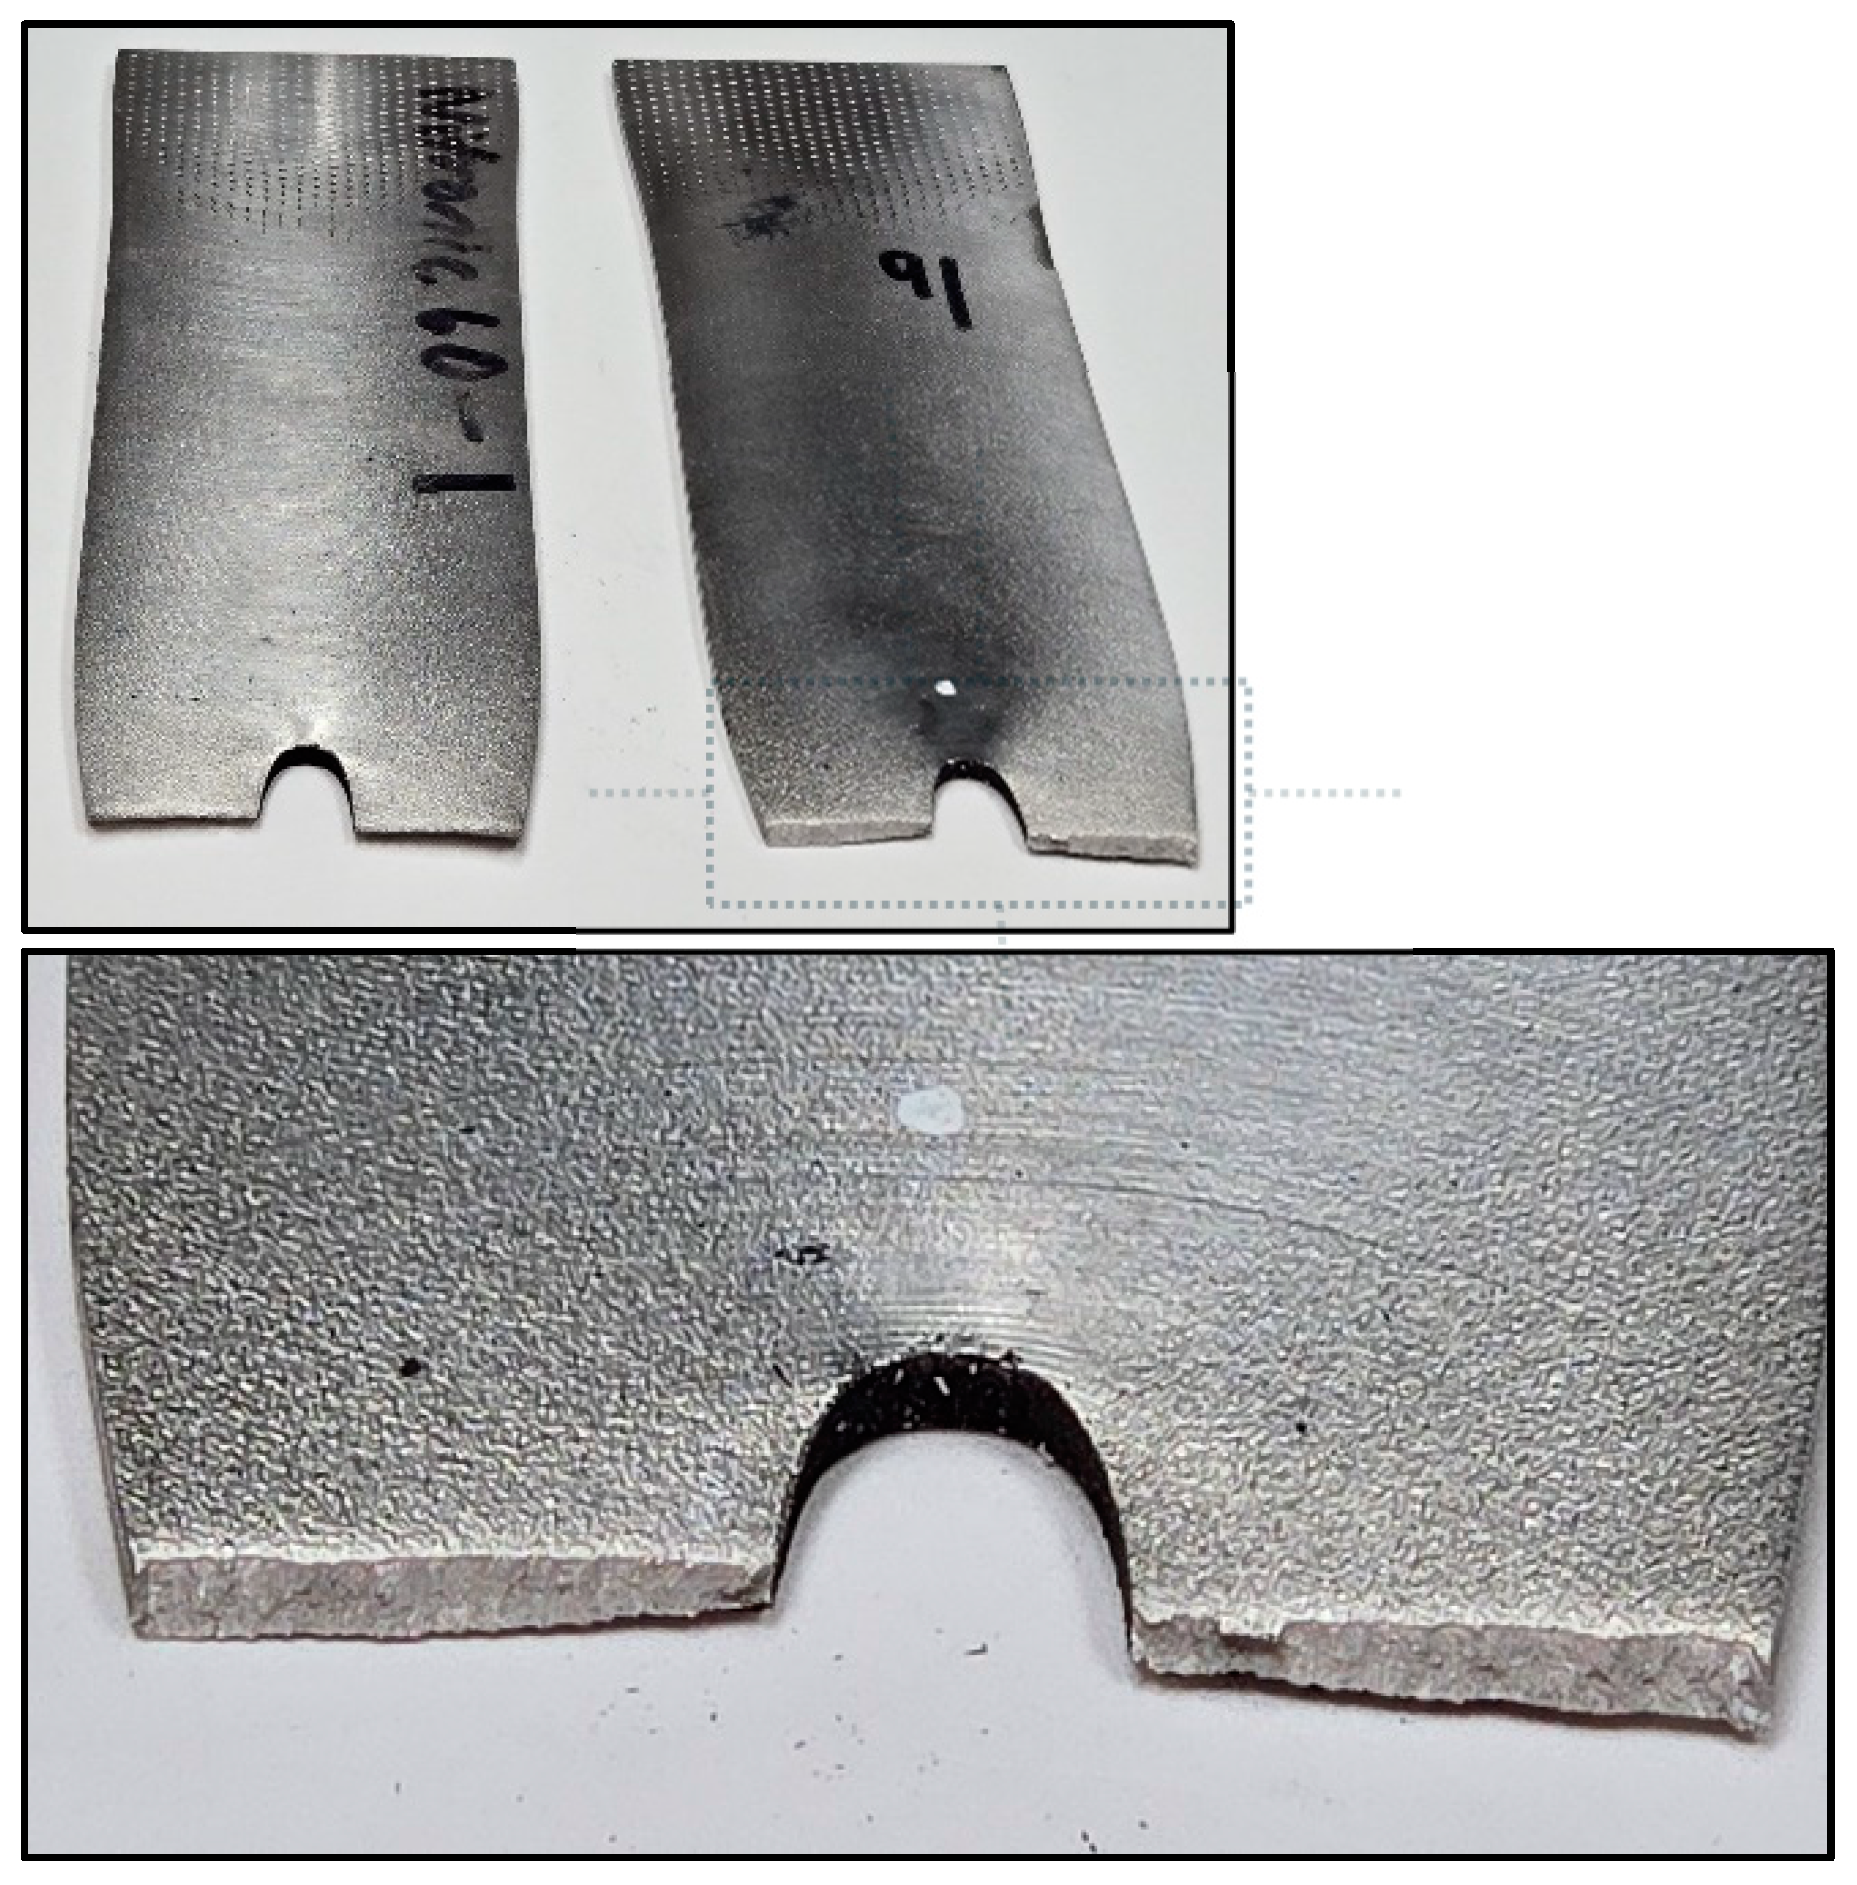
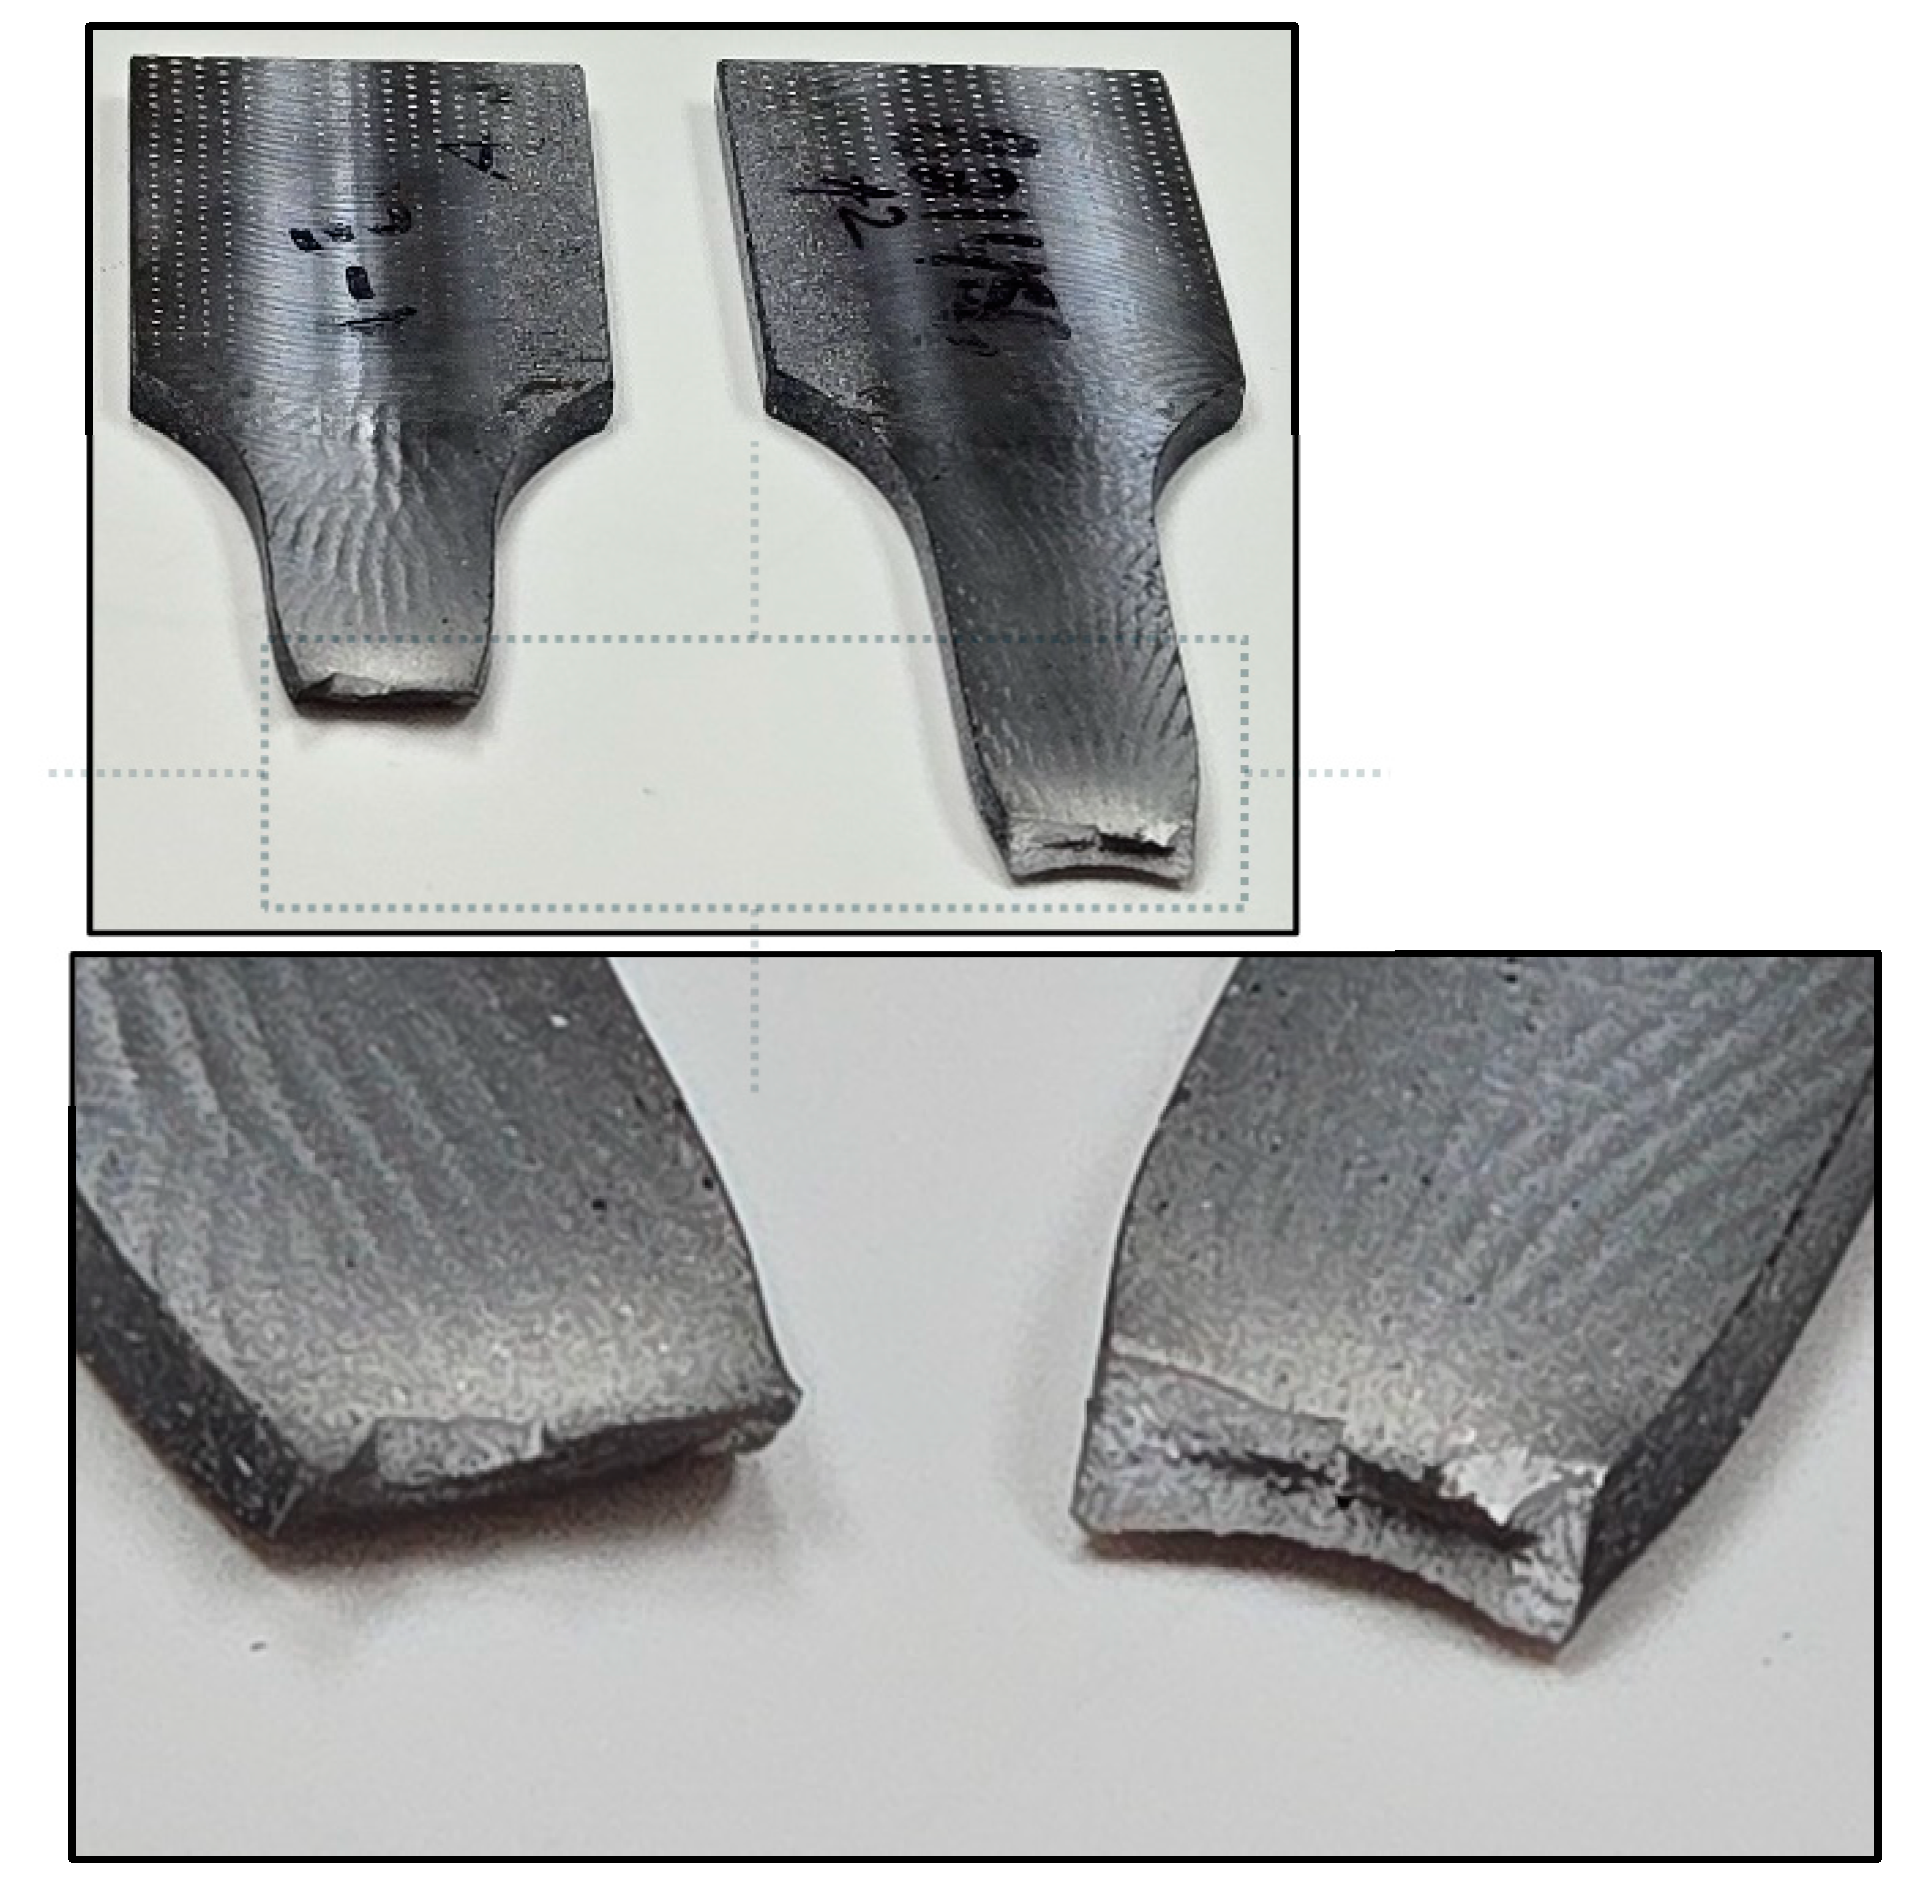
Figure 41.
Ductile fracture of specimen-821457, Al6061.
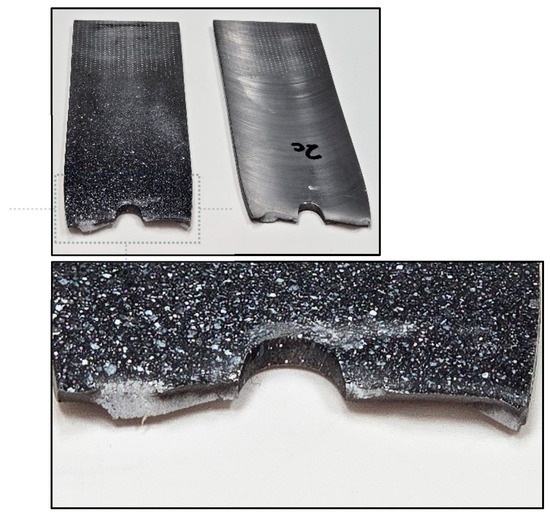
Figure 42.
Ductile fracture of specimen-821457, A36.
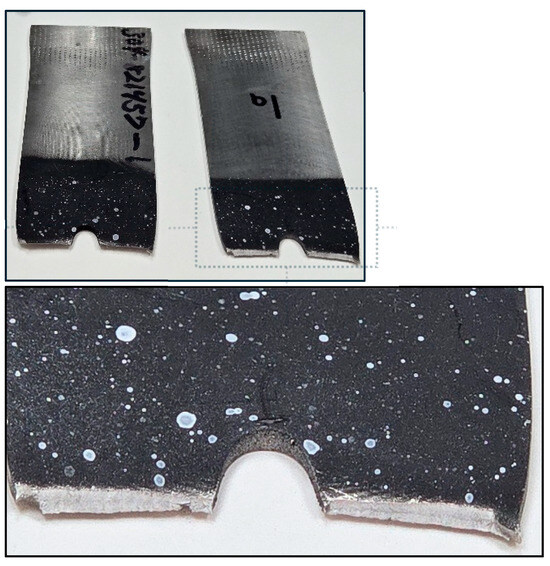
Figure 43.
Ductile fracture of specimen-821457, SS304.
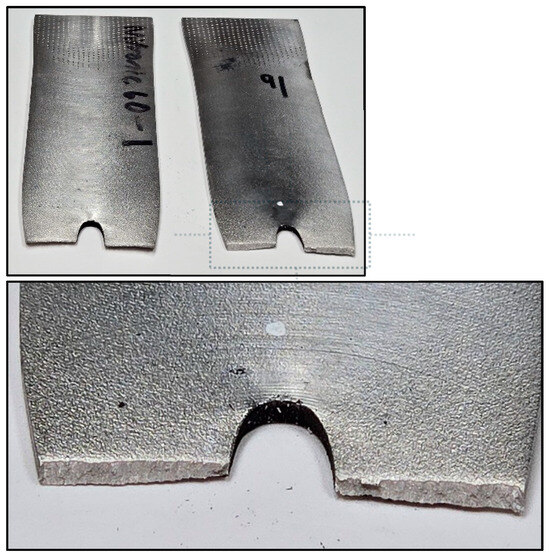
Figure 44.
Ductile fracture of specimen-821457, N60.
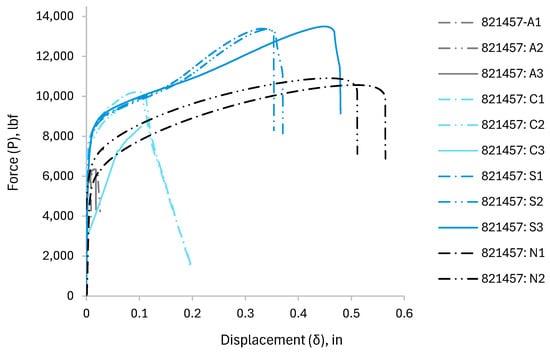
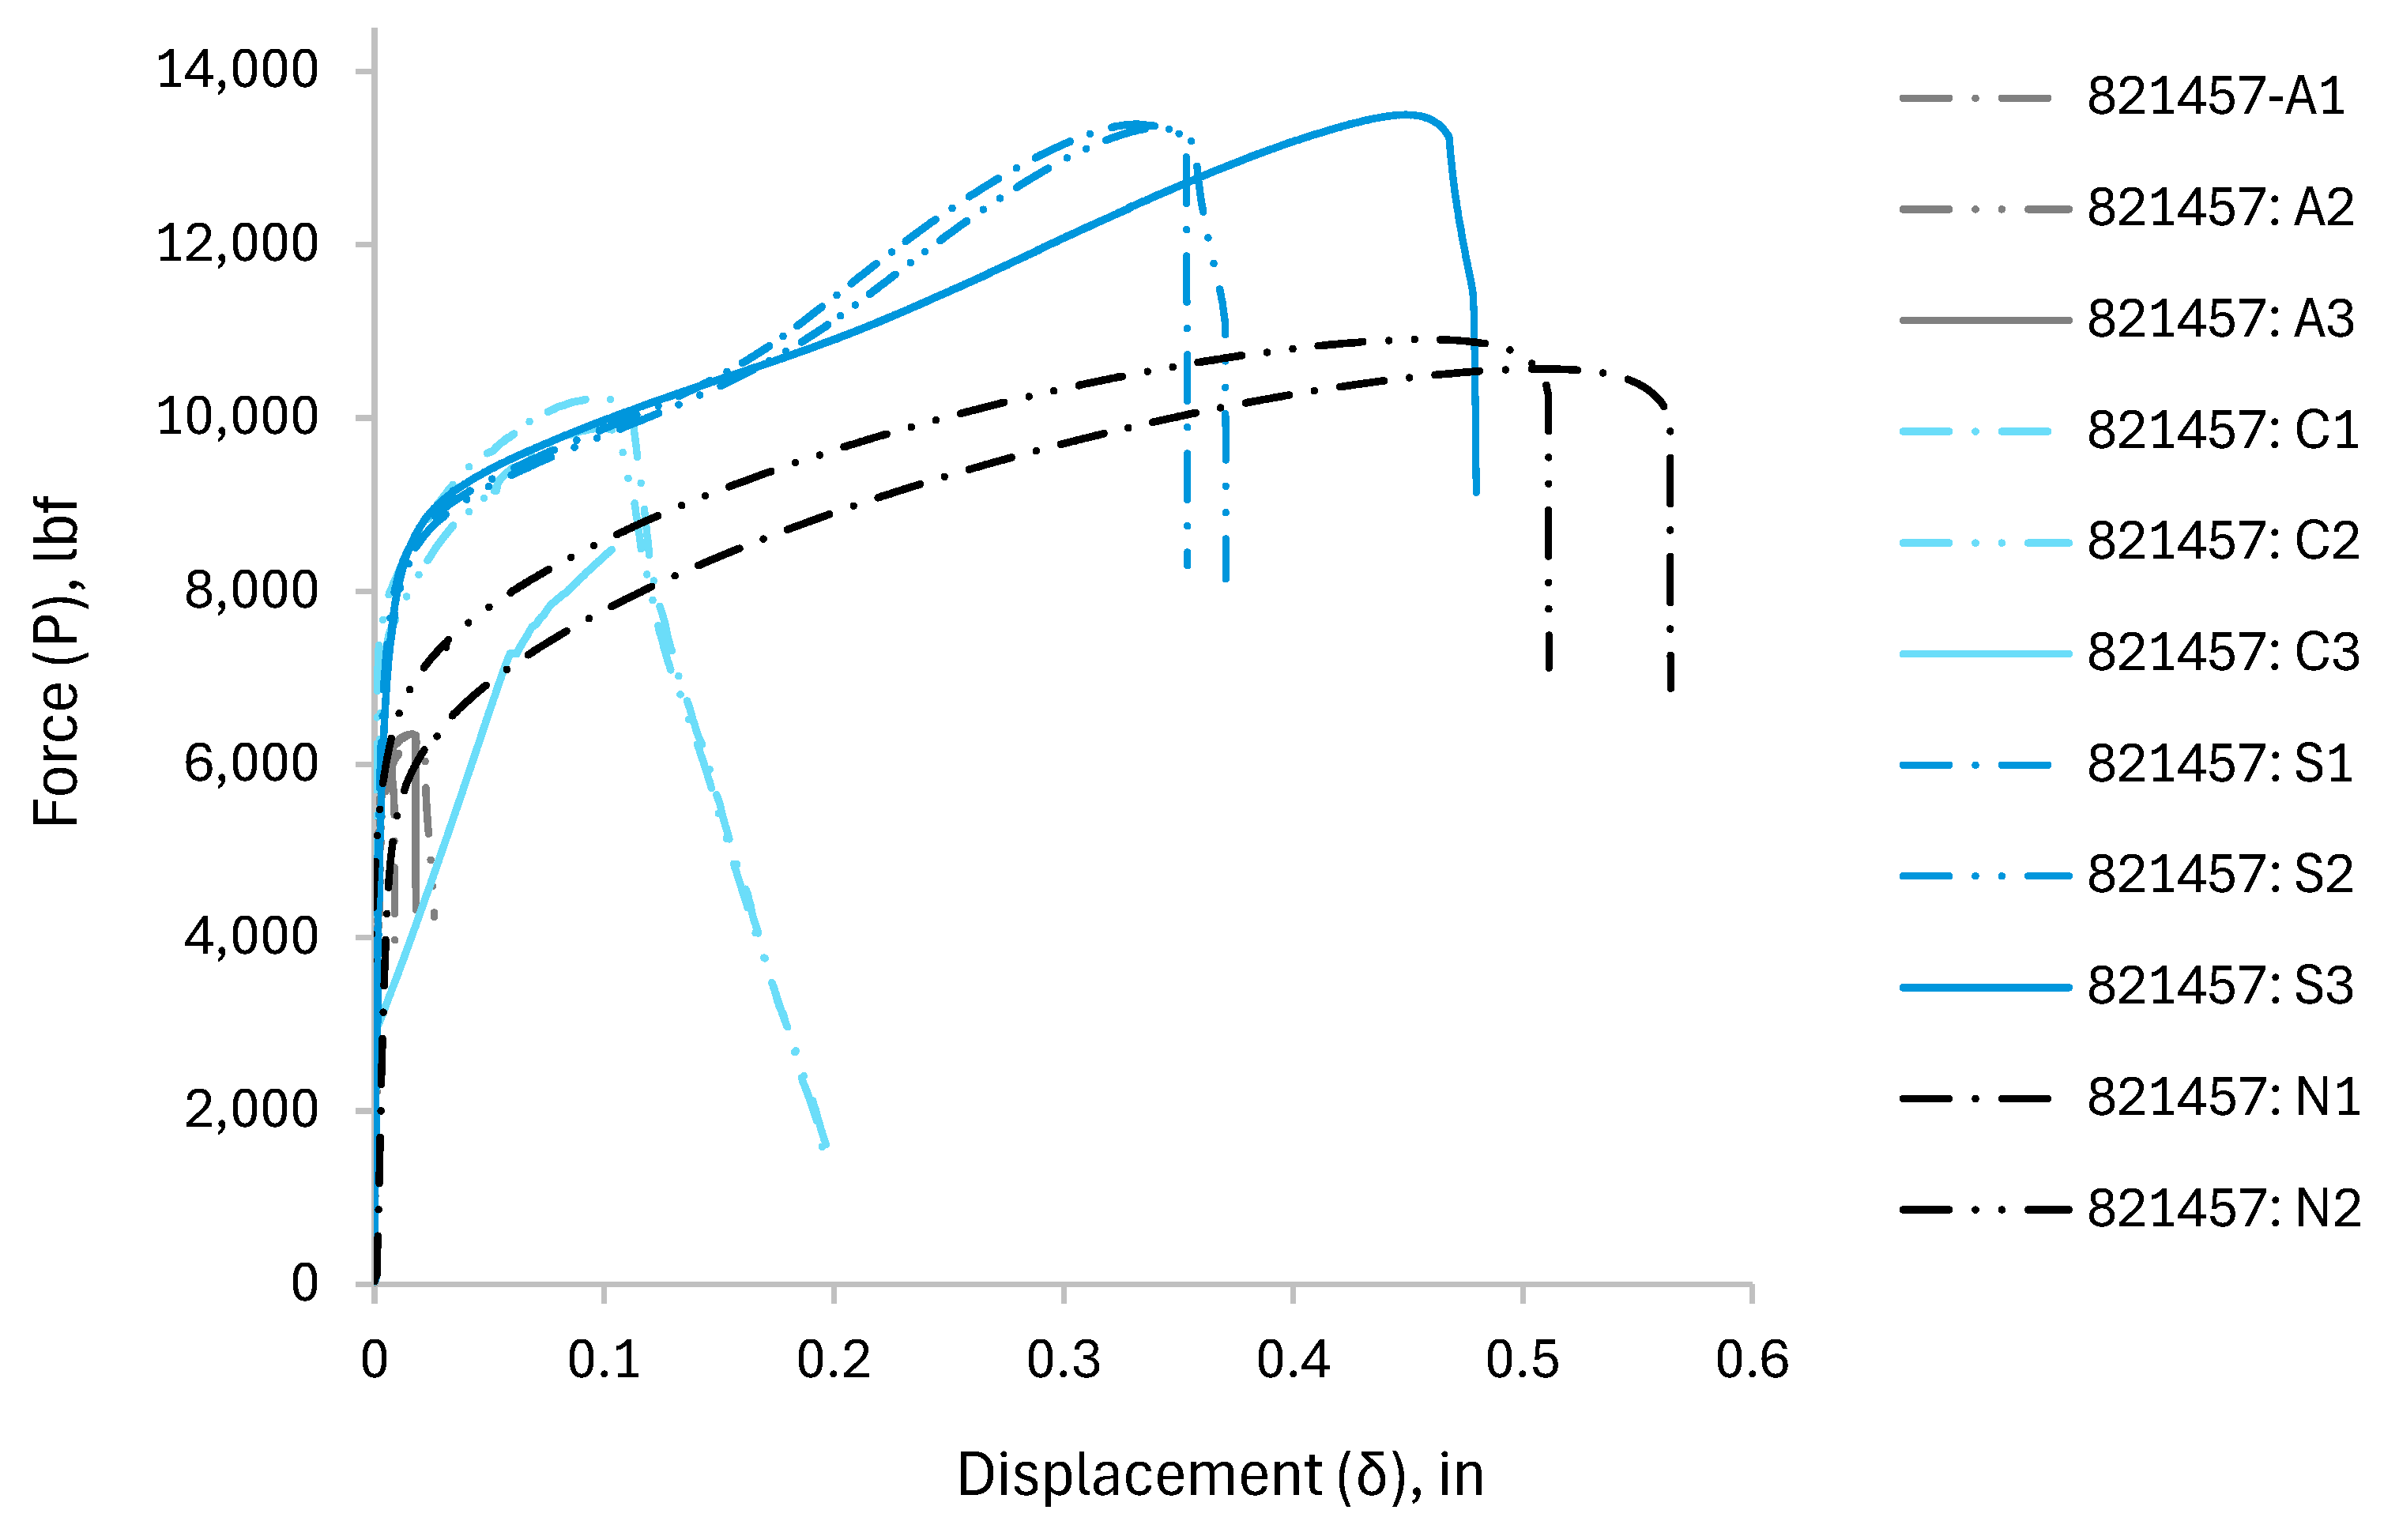
Figure 45.
curves for perforated plates (specimen-821457).
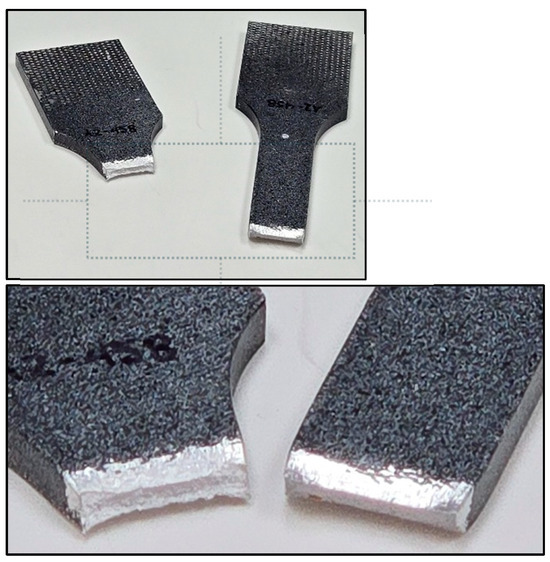
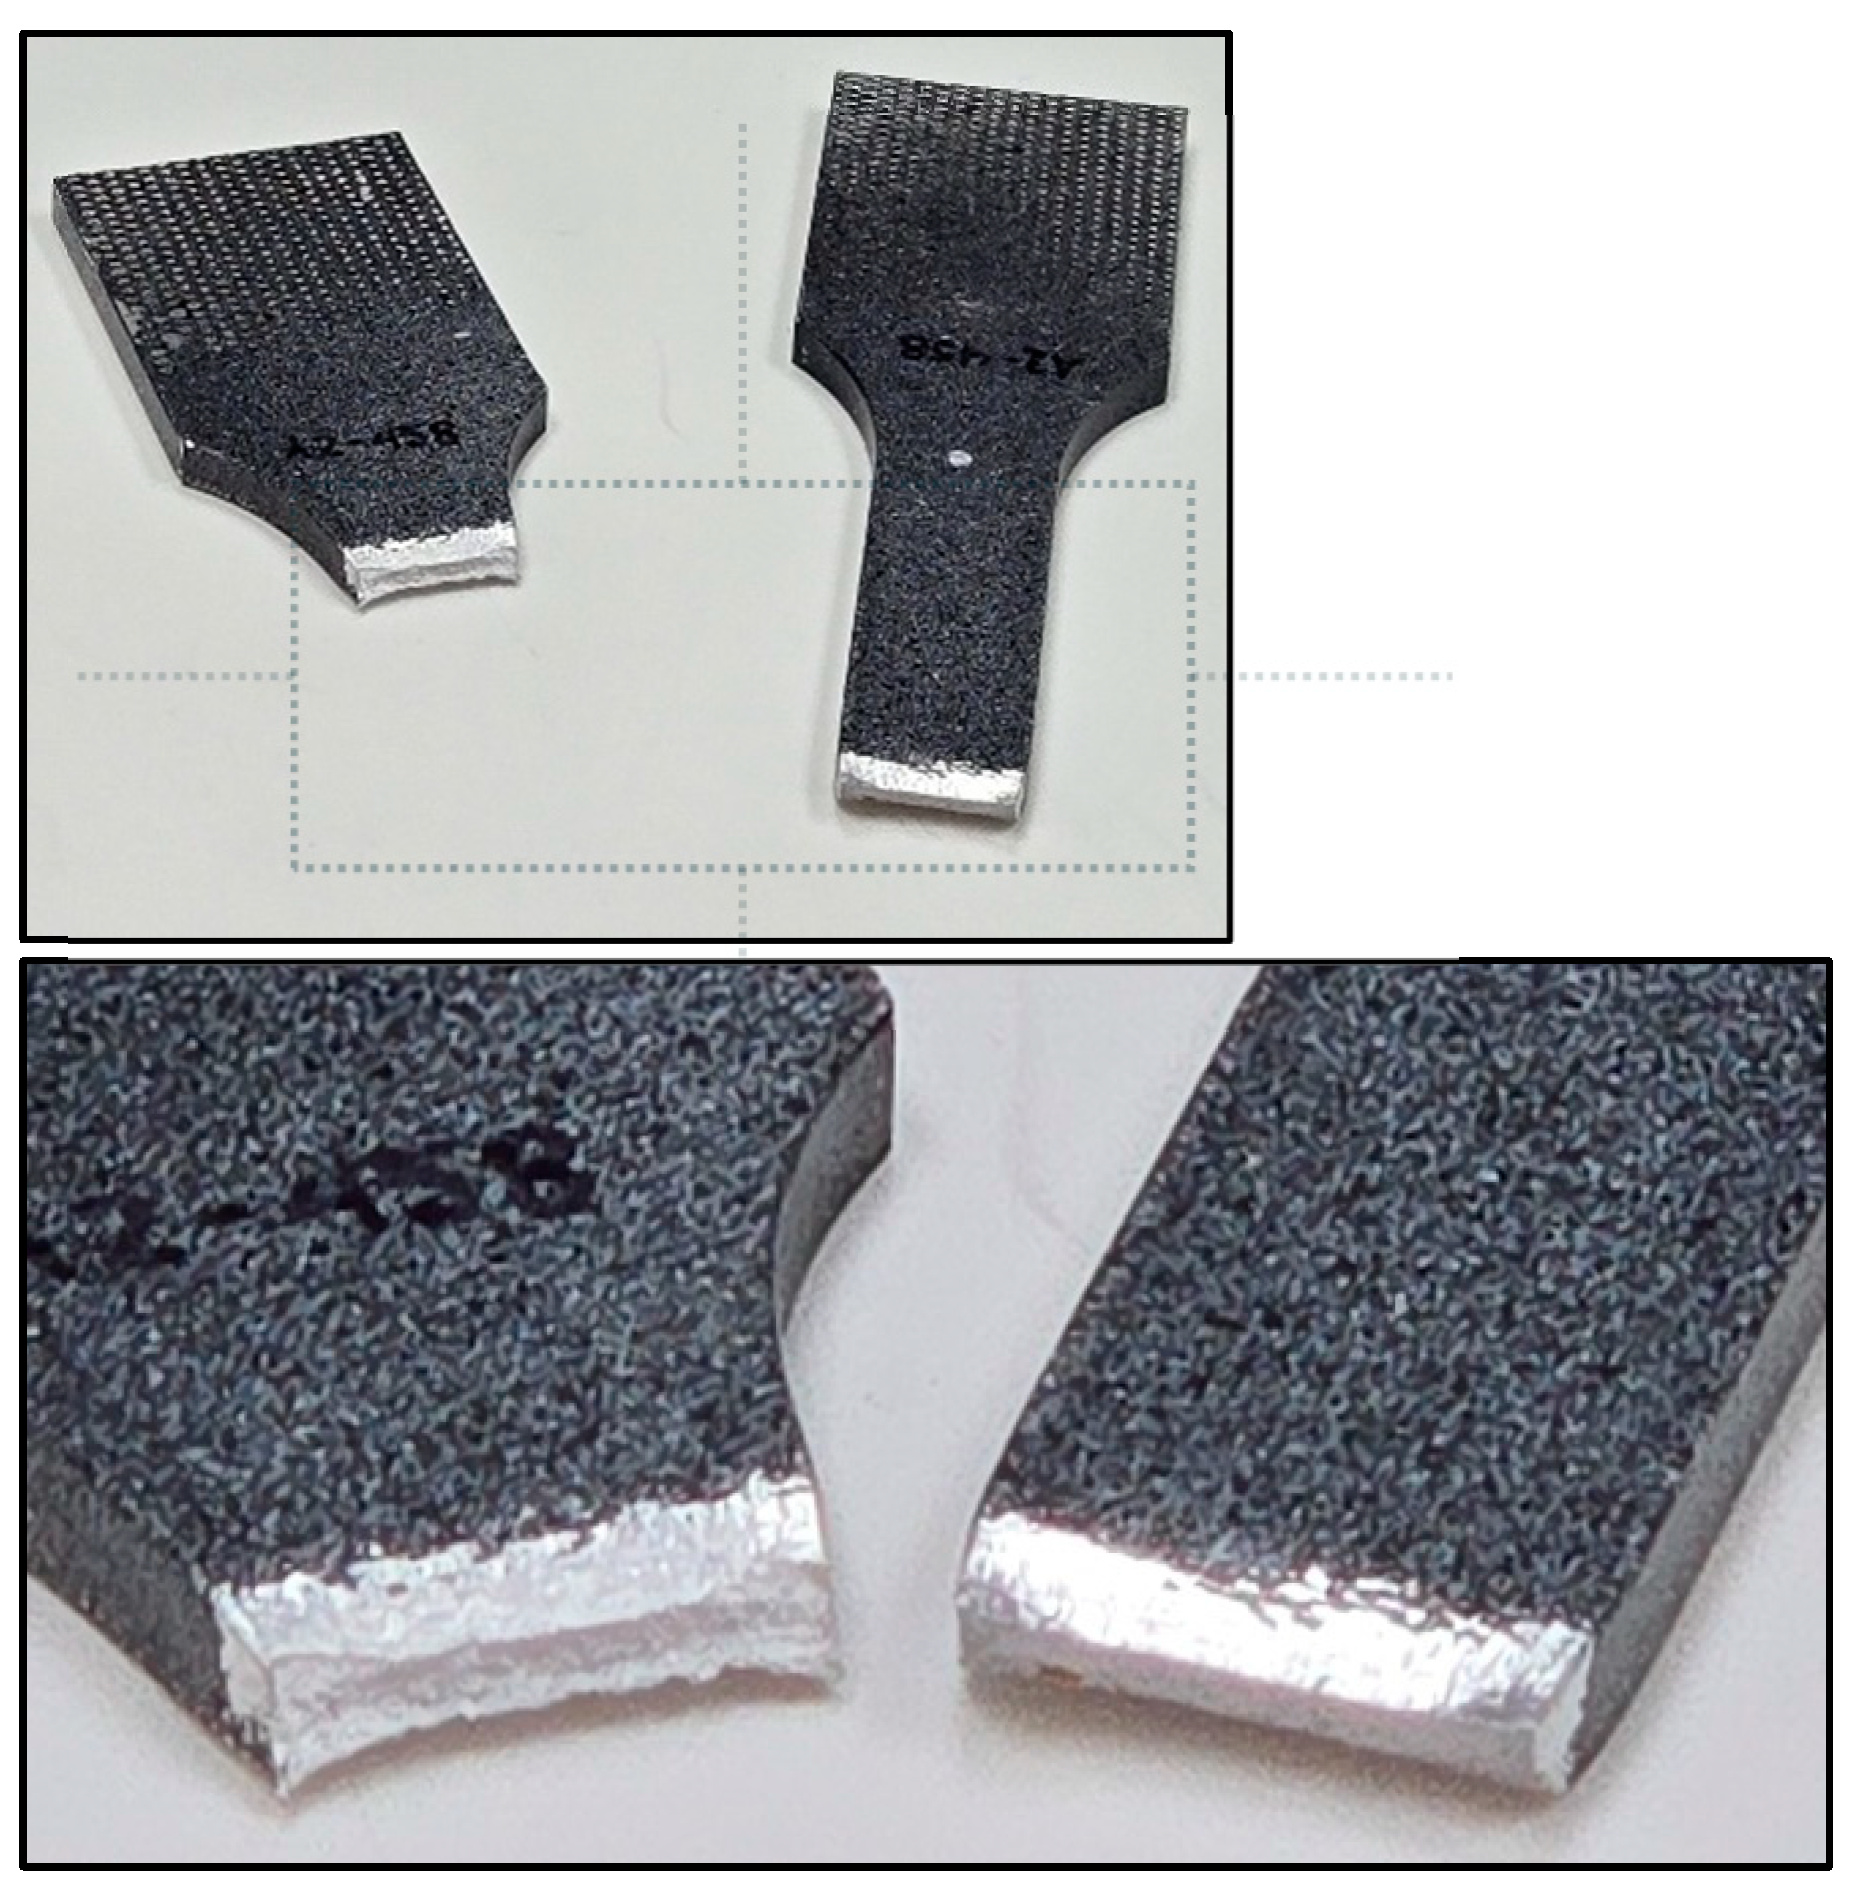
Figure 46.
Ductile fracture of specimen-821458, Al6061.
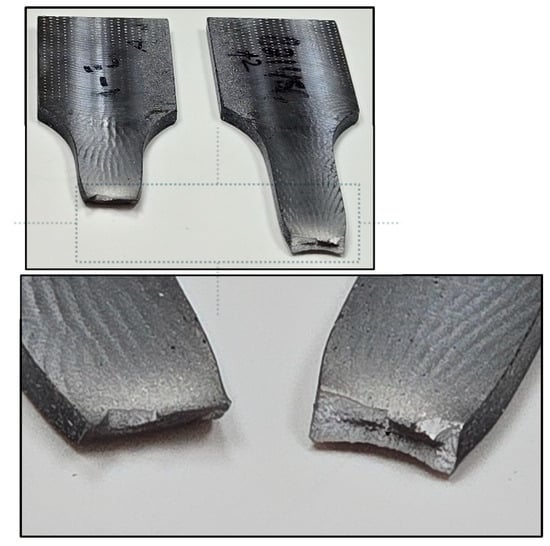
Figure 47.
Ductile fracture of specimen-821458, A36.
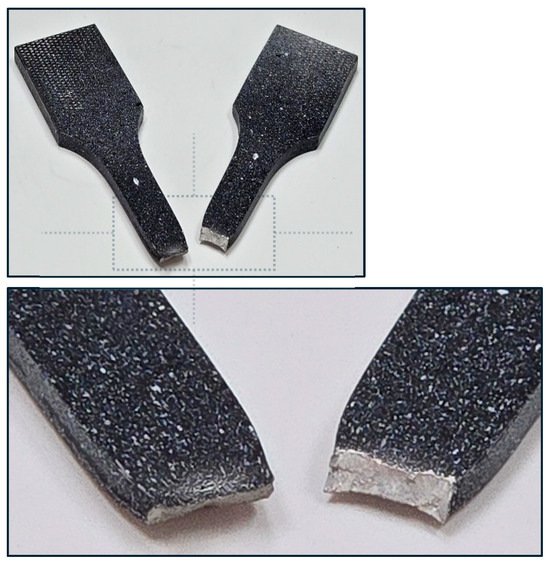
Figure 48.
Ductile fracture of specimen-821458, SS304.
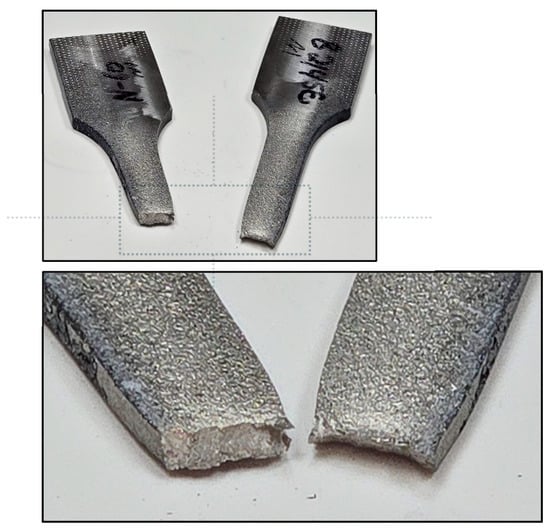
Figure 49.
Ductile fracture of specimen-821458, N60.
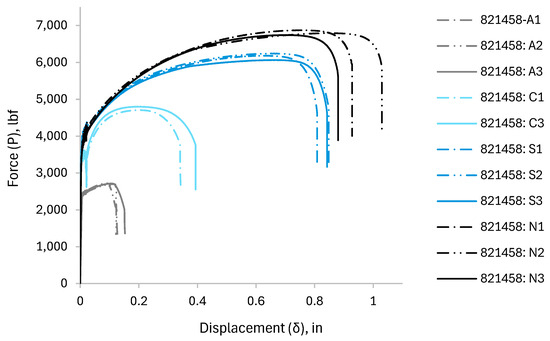
Figure 50.
curve for dog bones (specimen-821458).
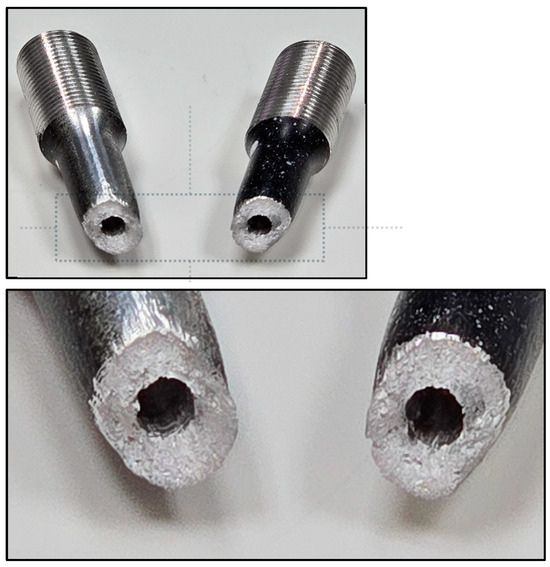
Figure 51.
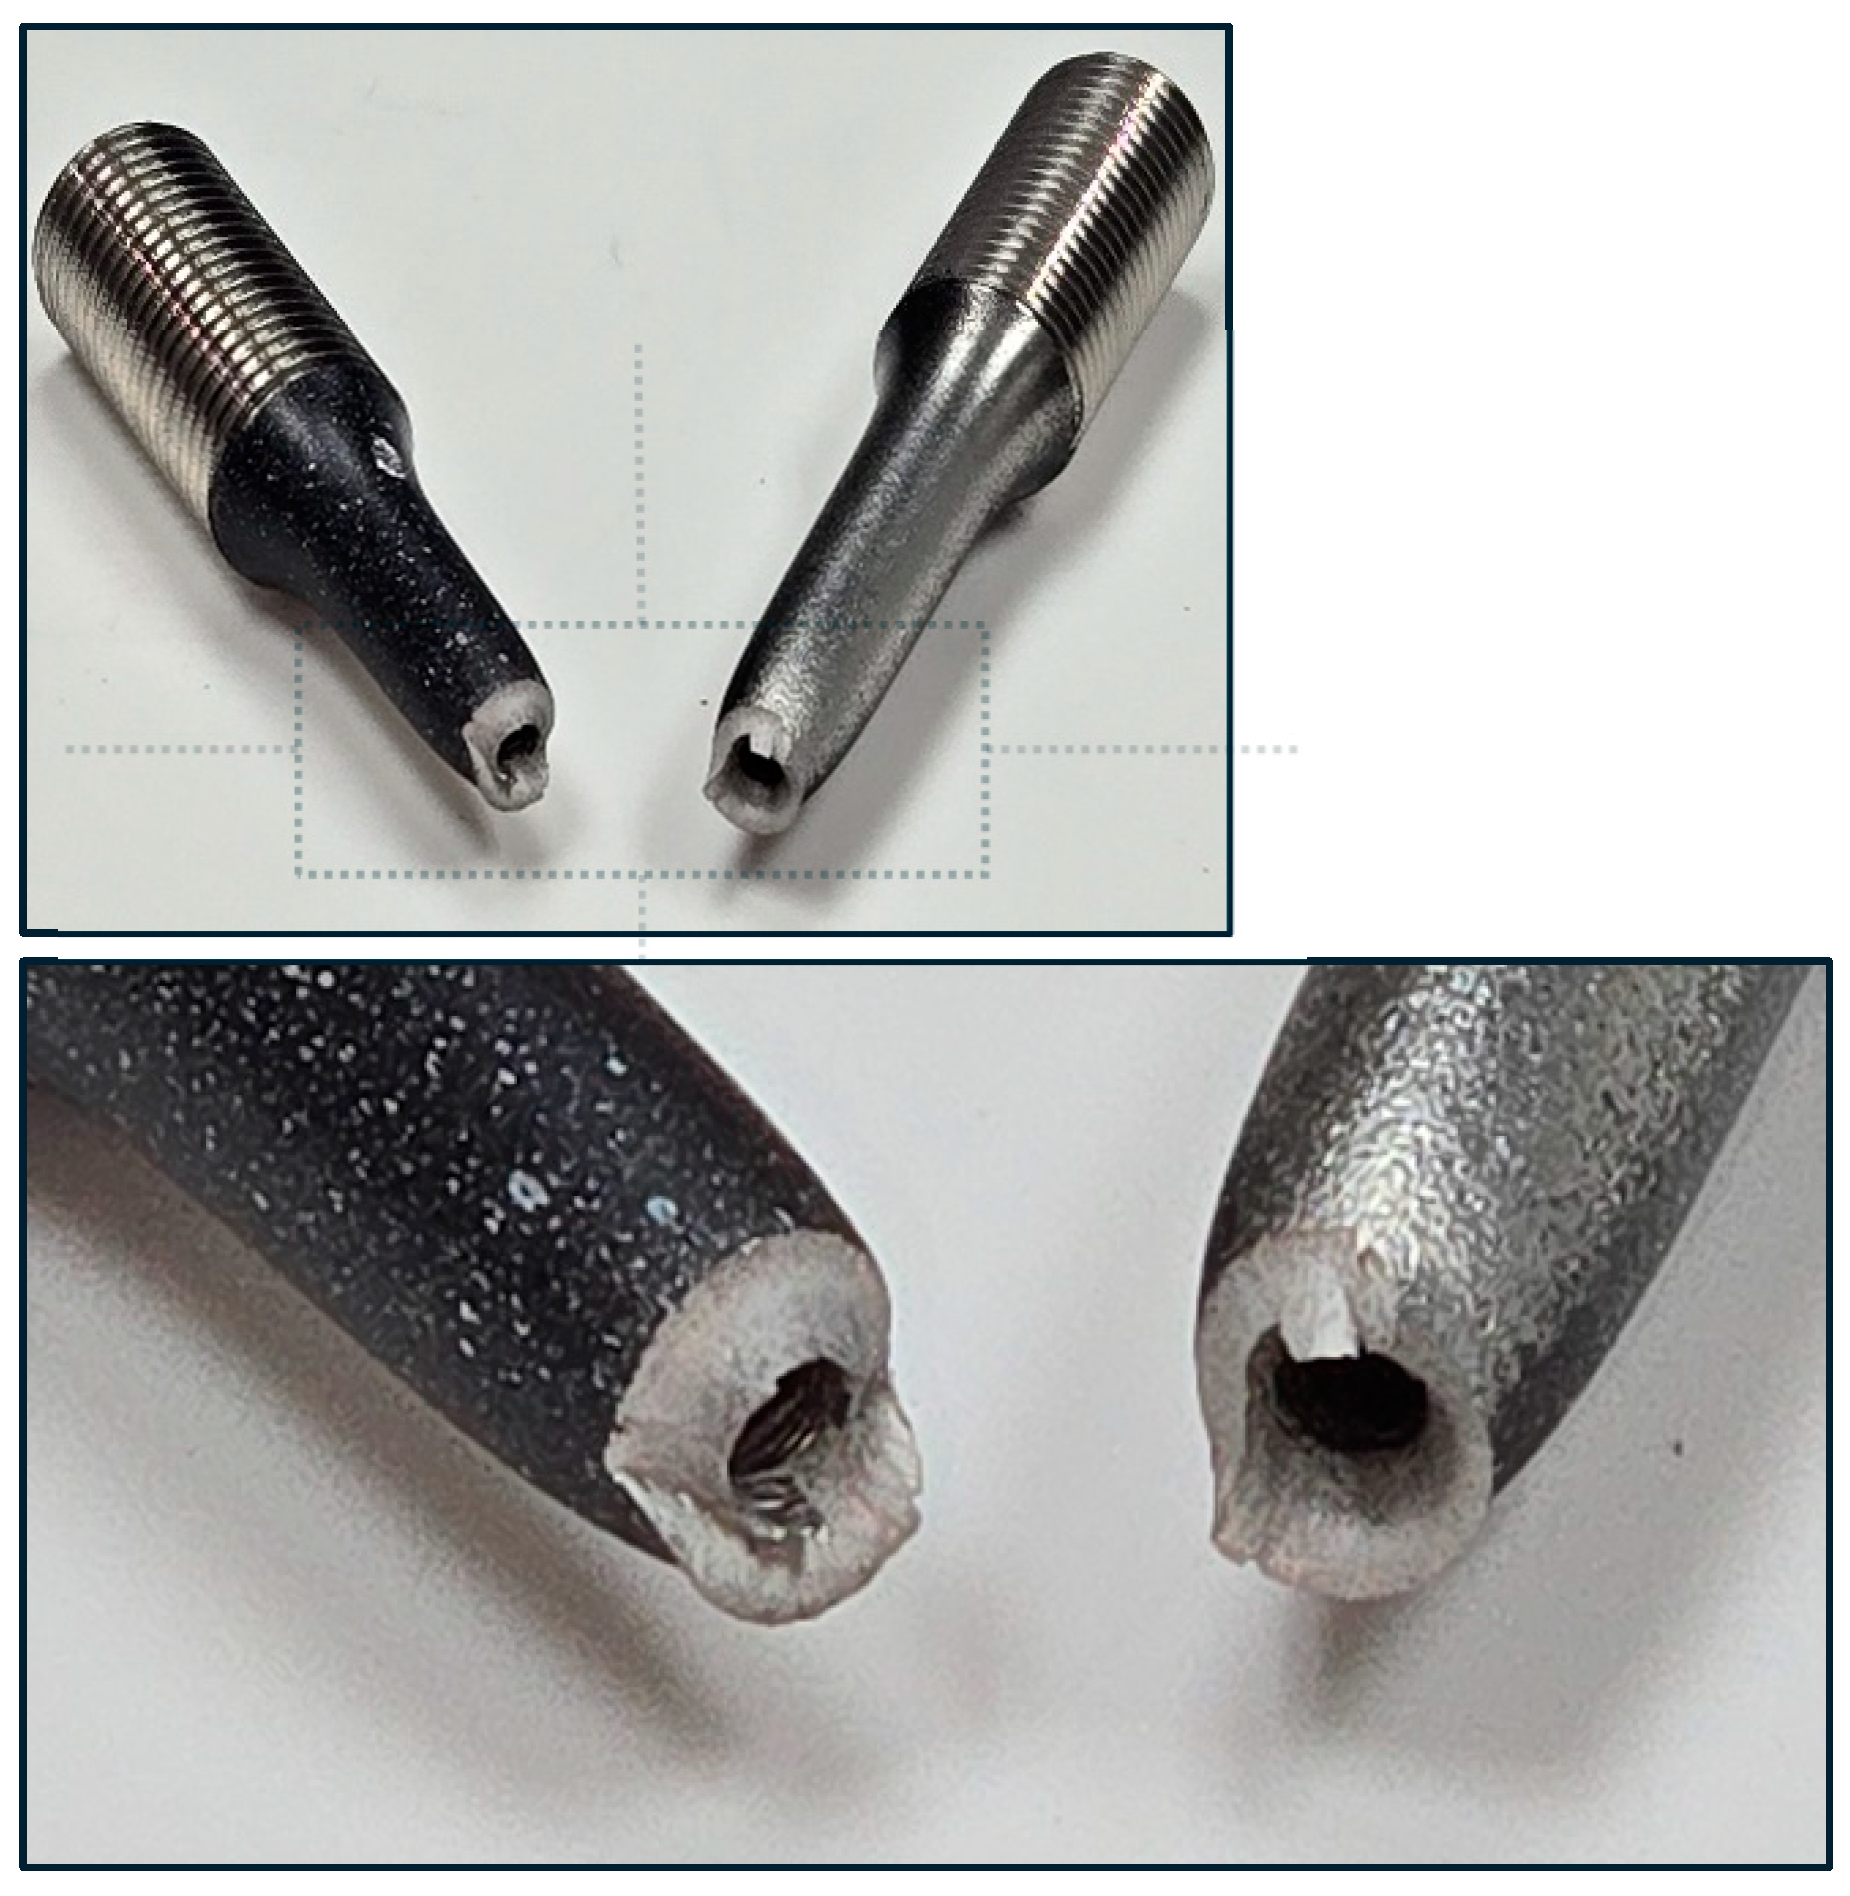
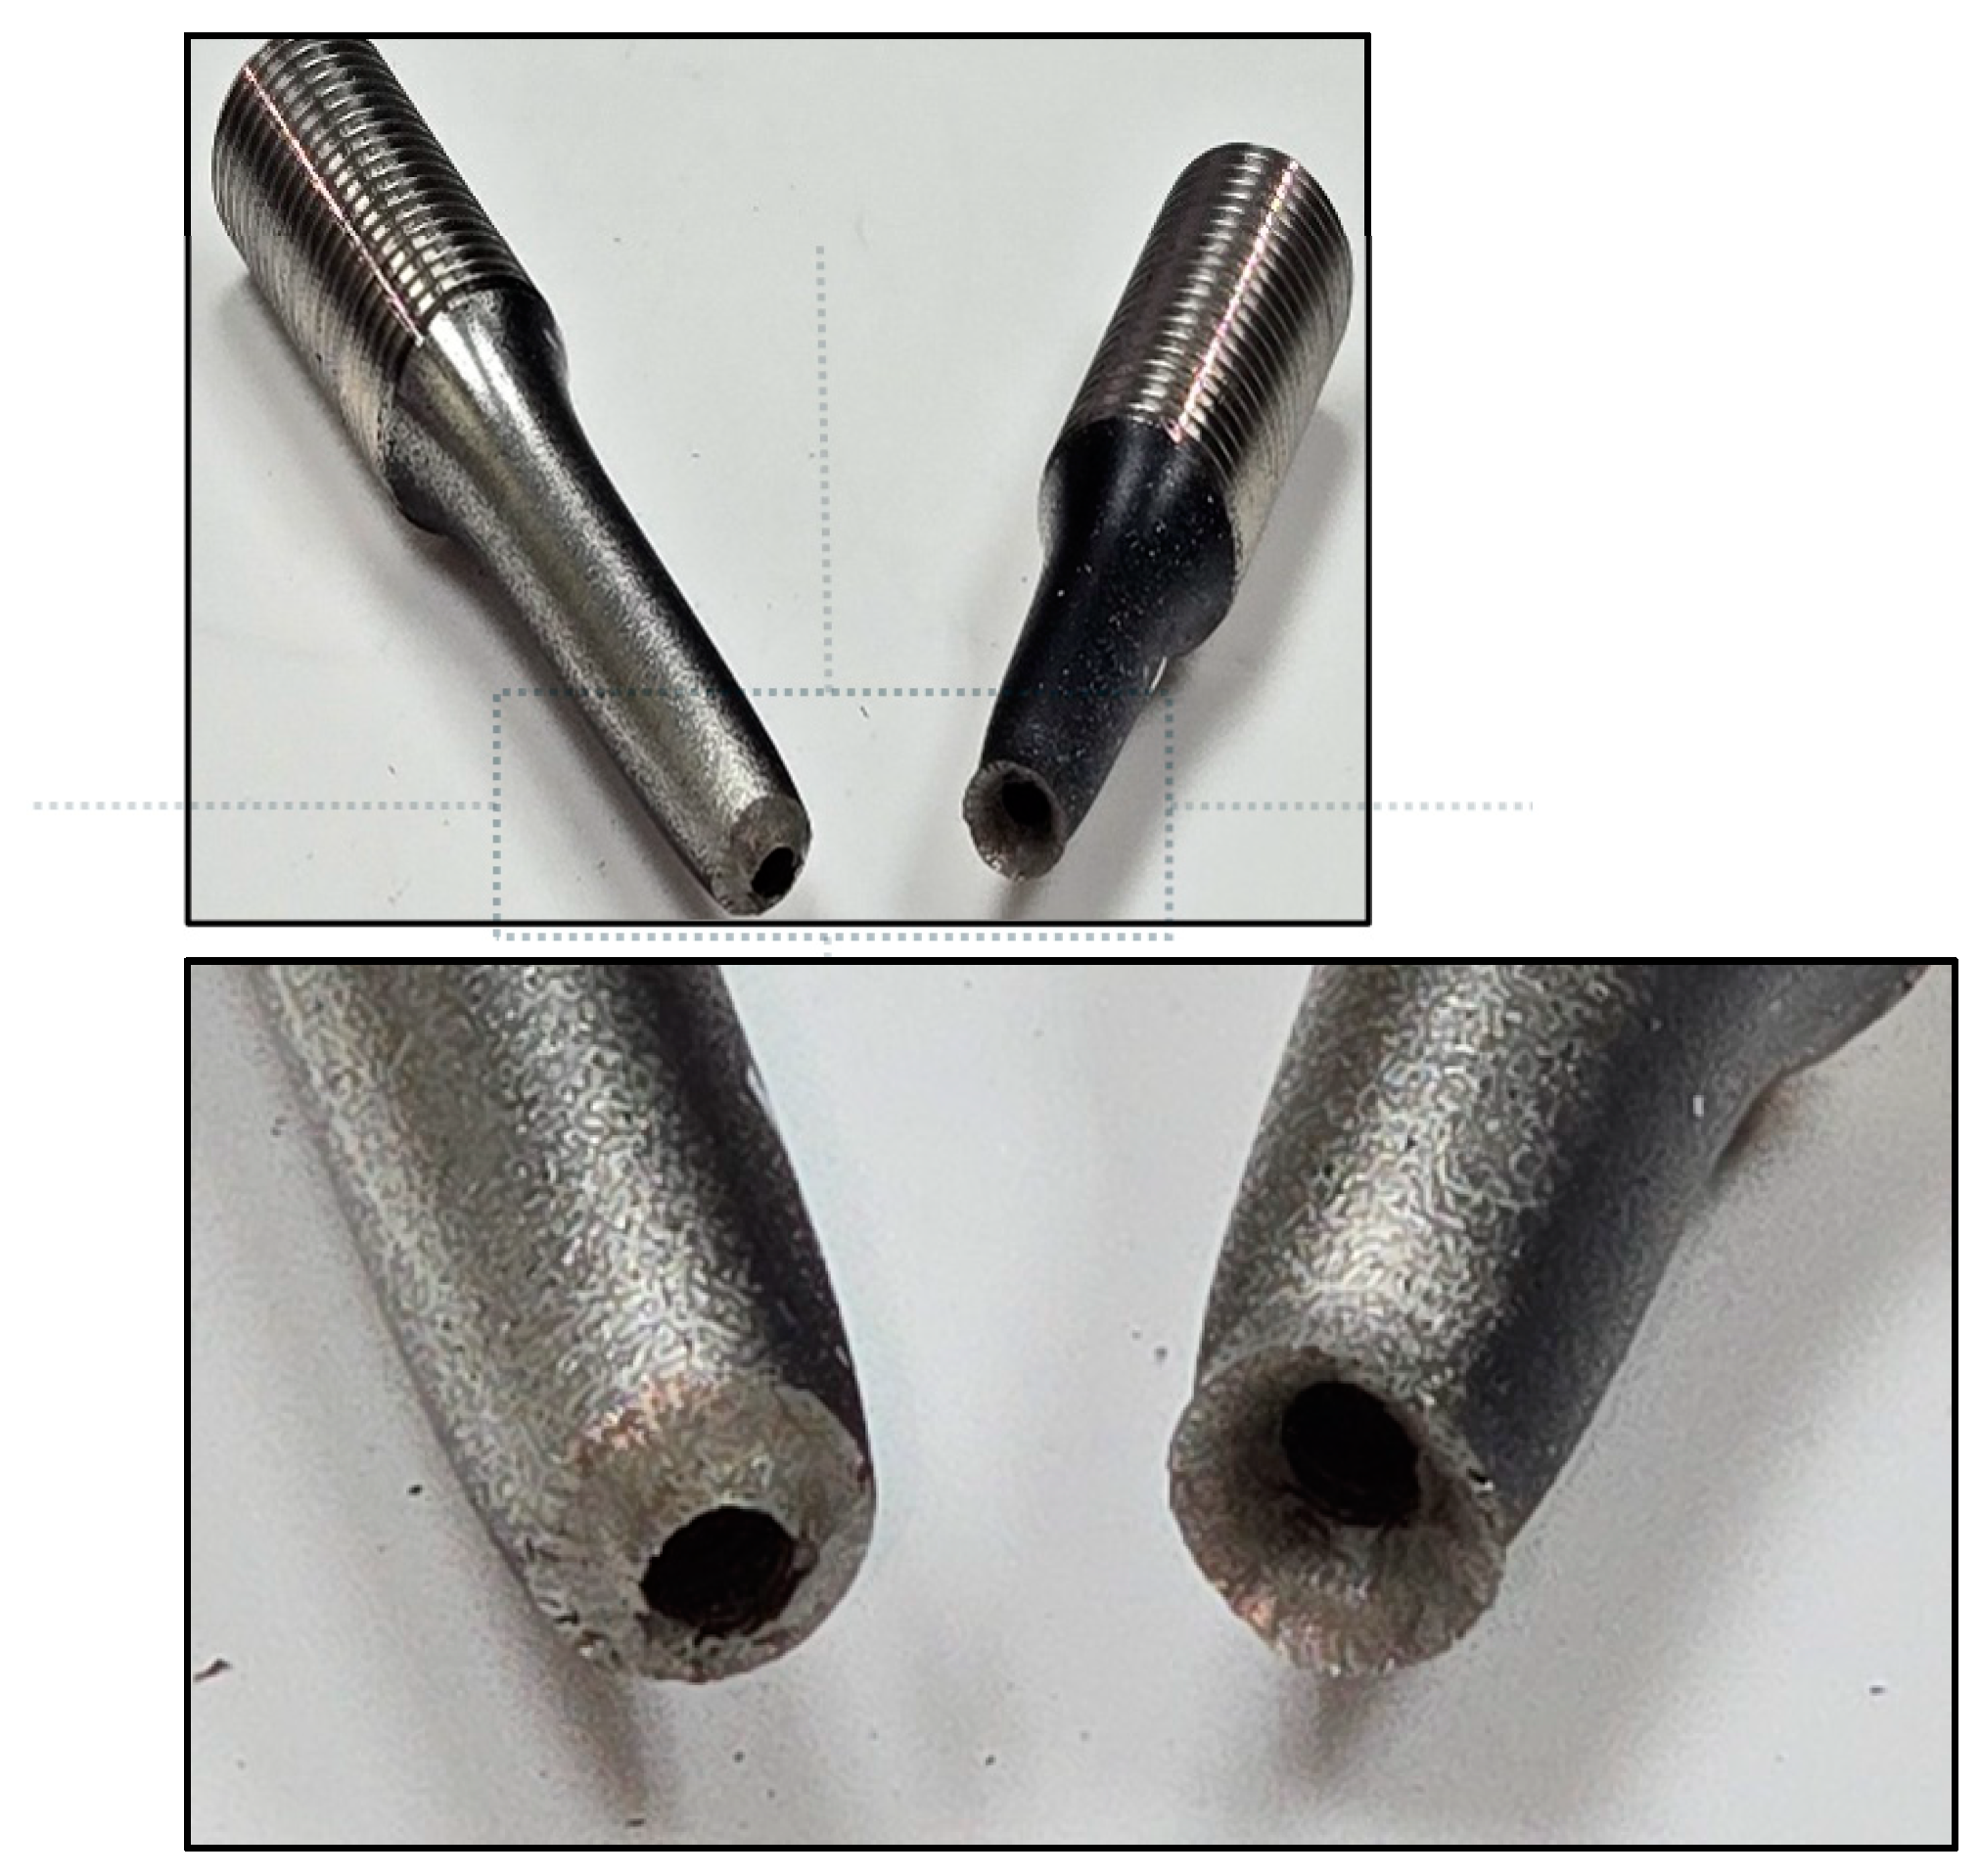
Ductile fracture of specimen-821459, Al6061.
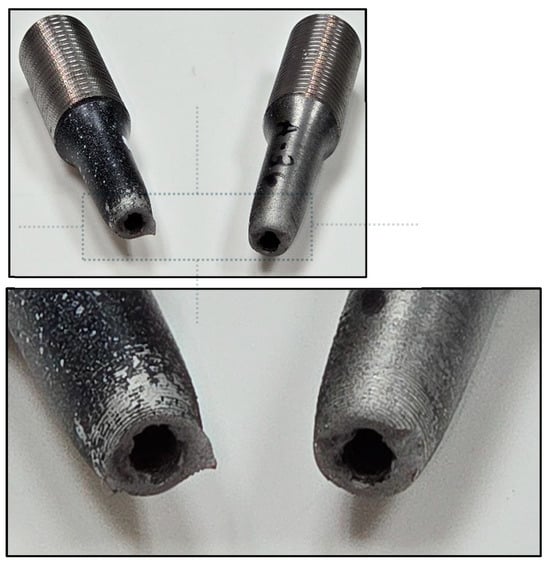
Figure 52.
Ductile fracture of specimen-821459, A36.
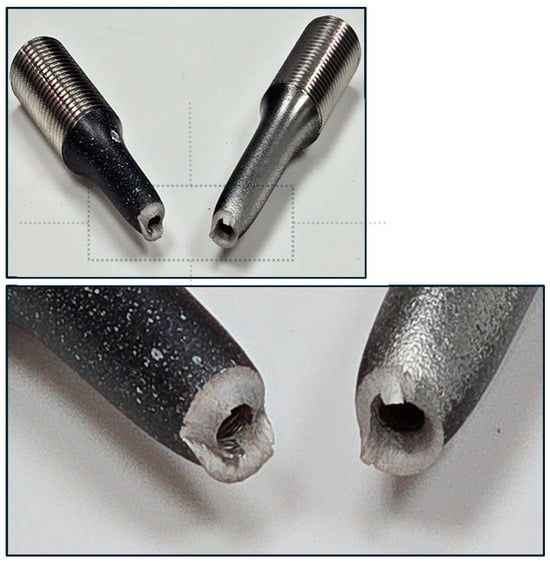
Figure 53.
Ductile fracture of specimen-821459, SS304.
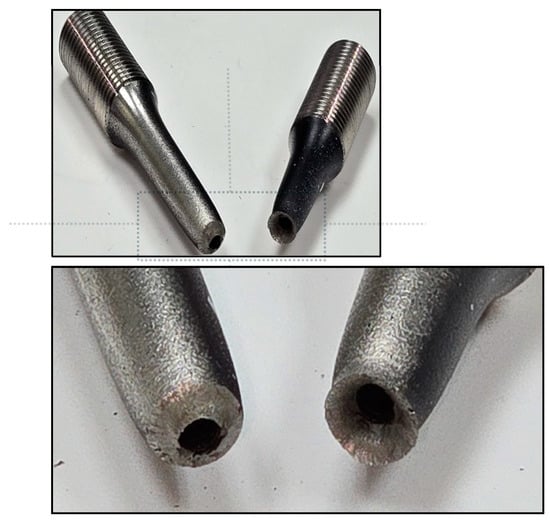
Figure 54.
Ductile fracture of specimen-821459, N60.
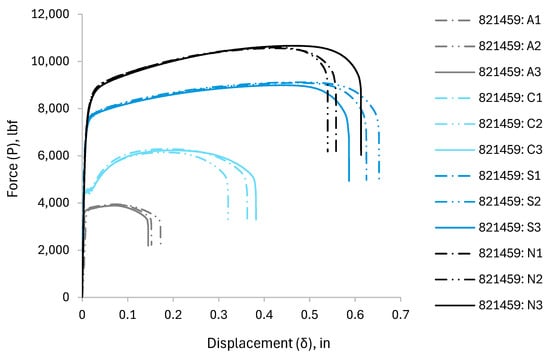
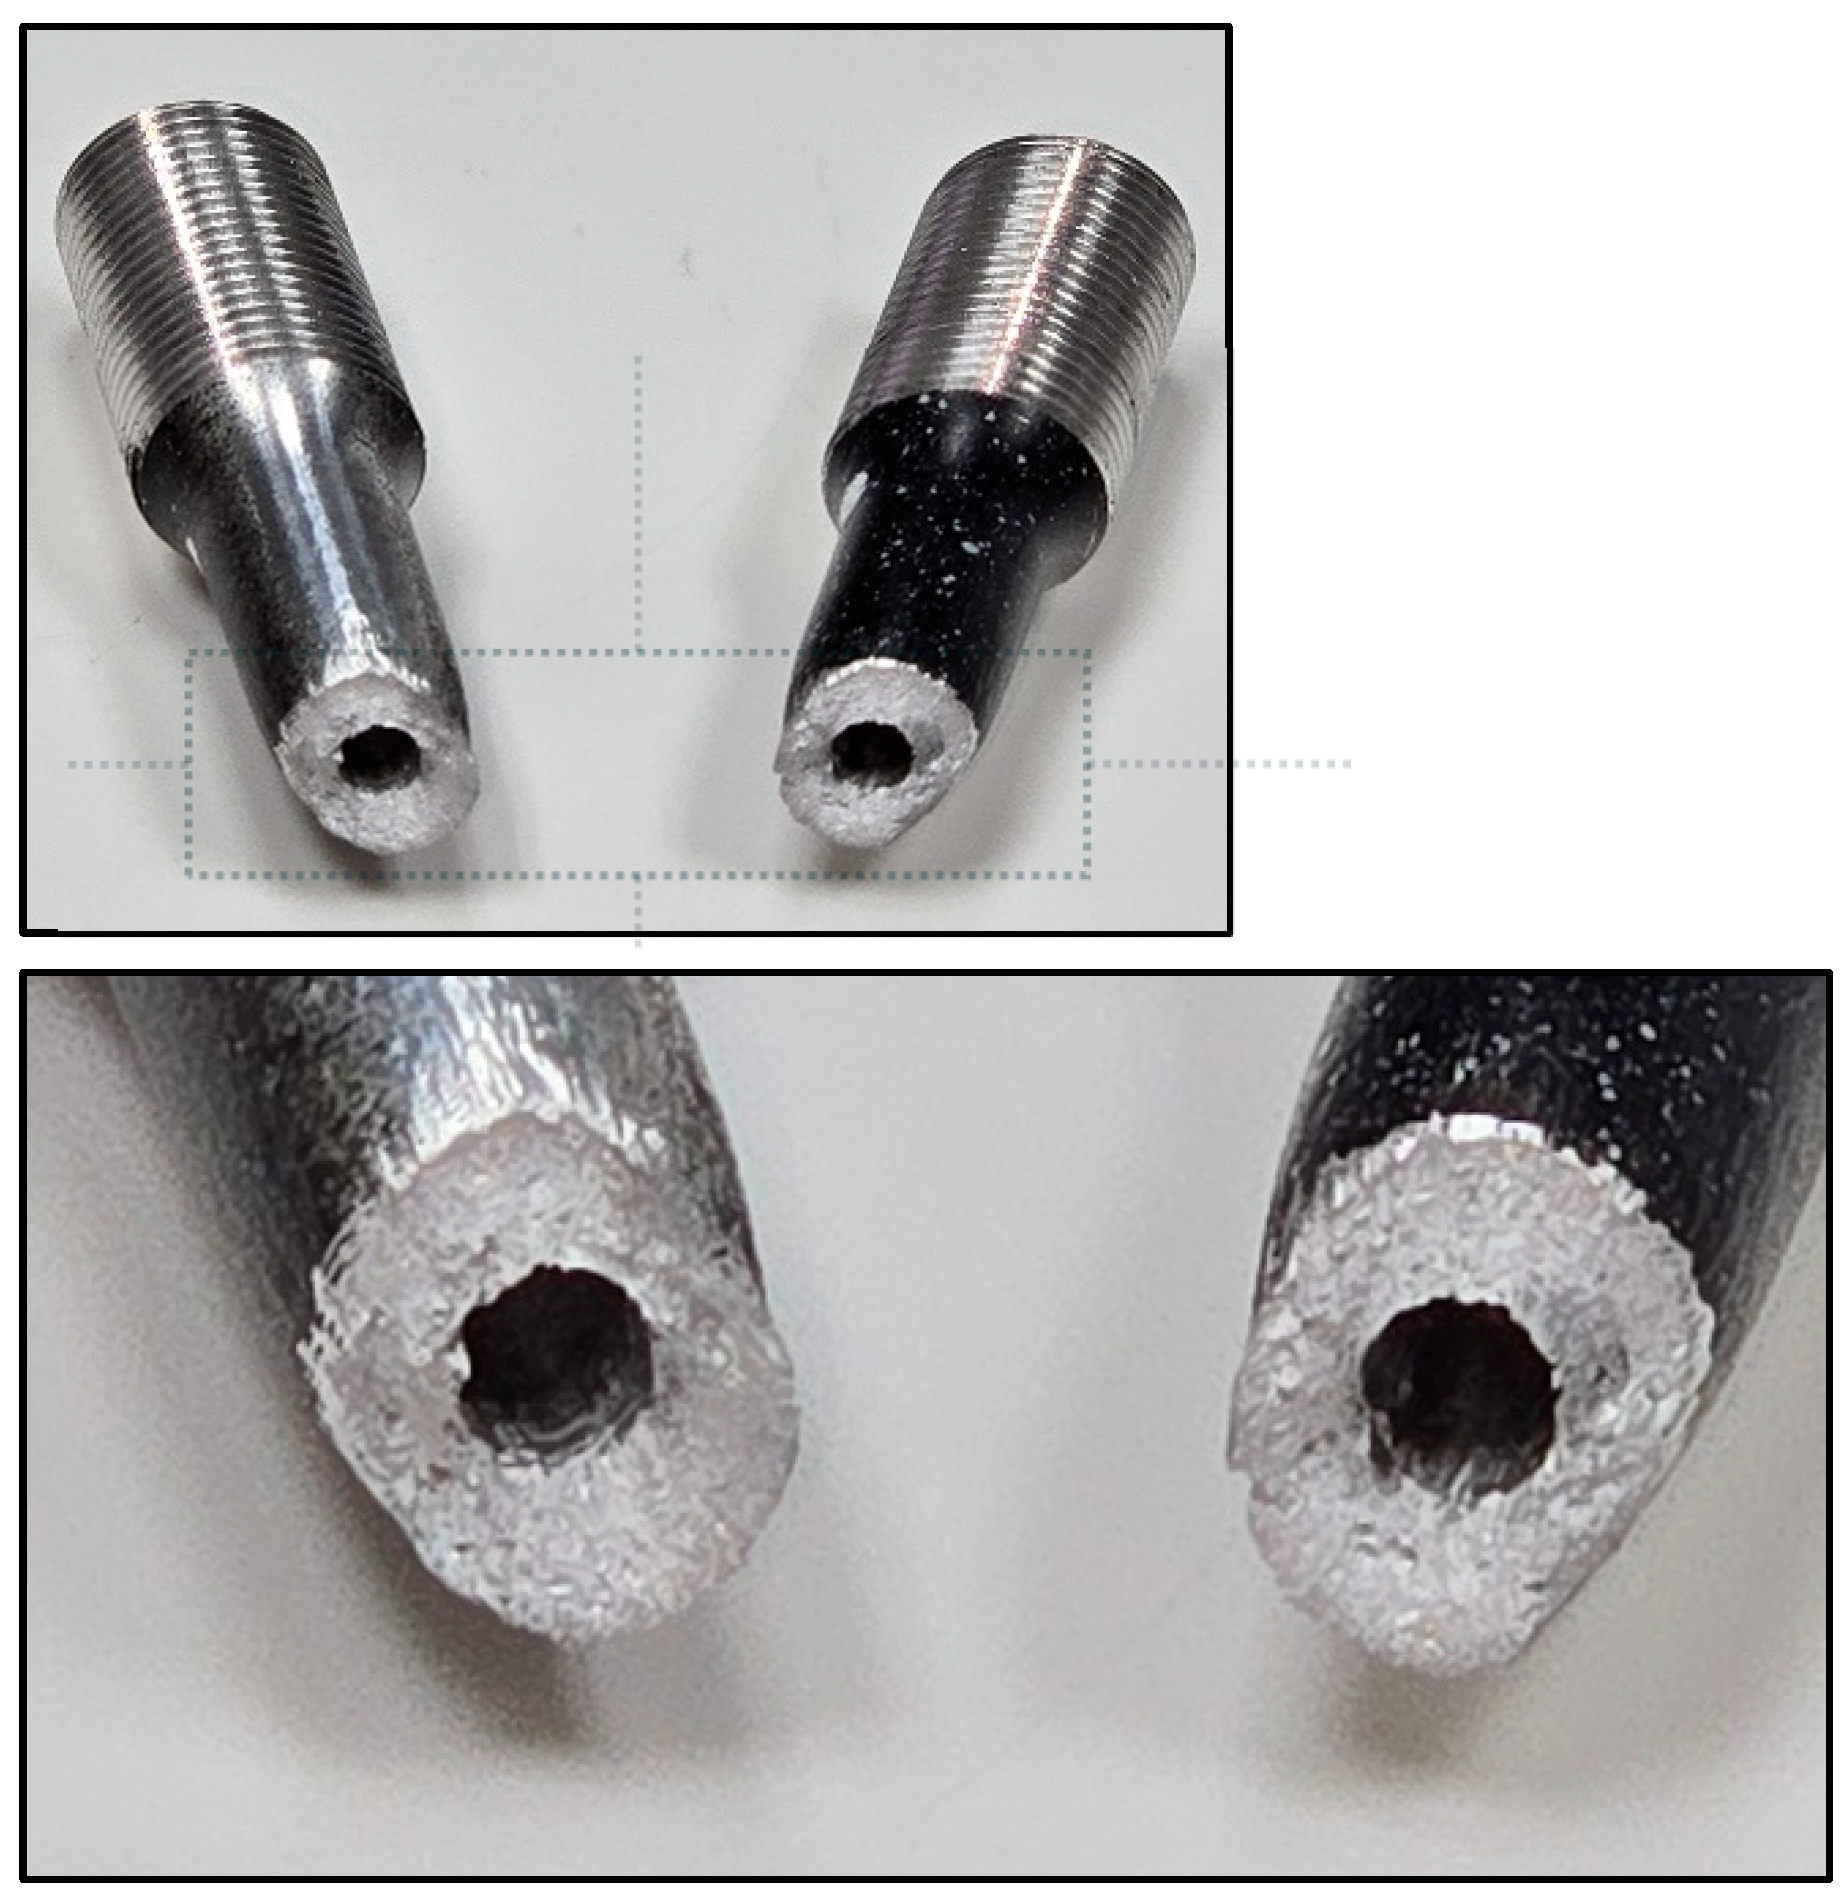
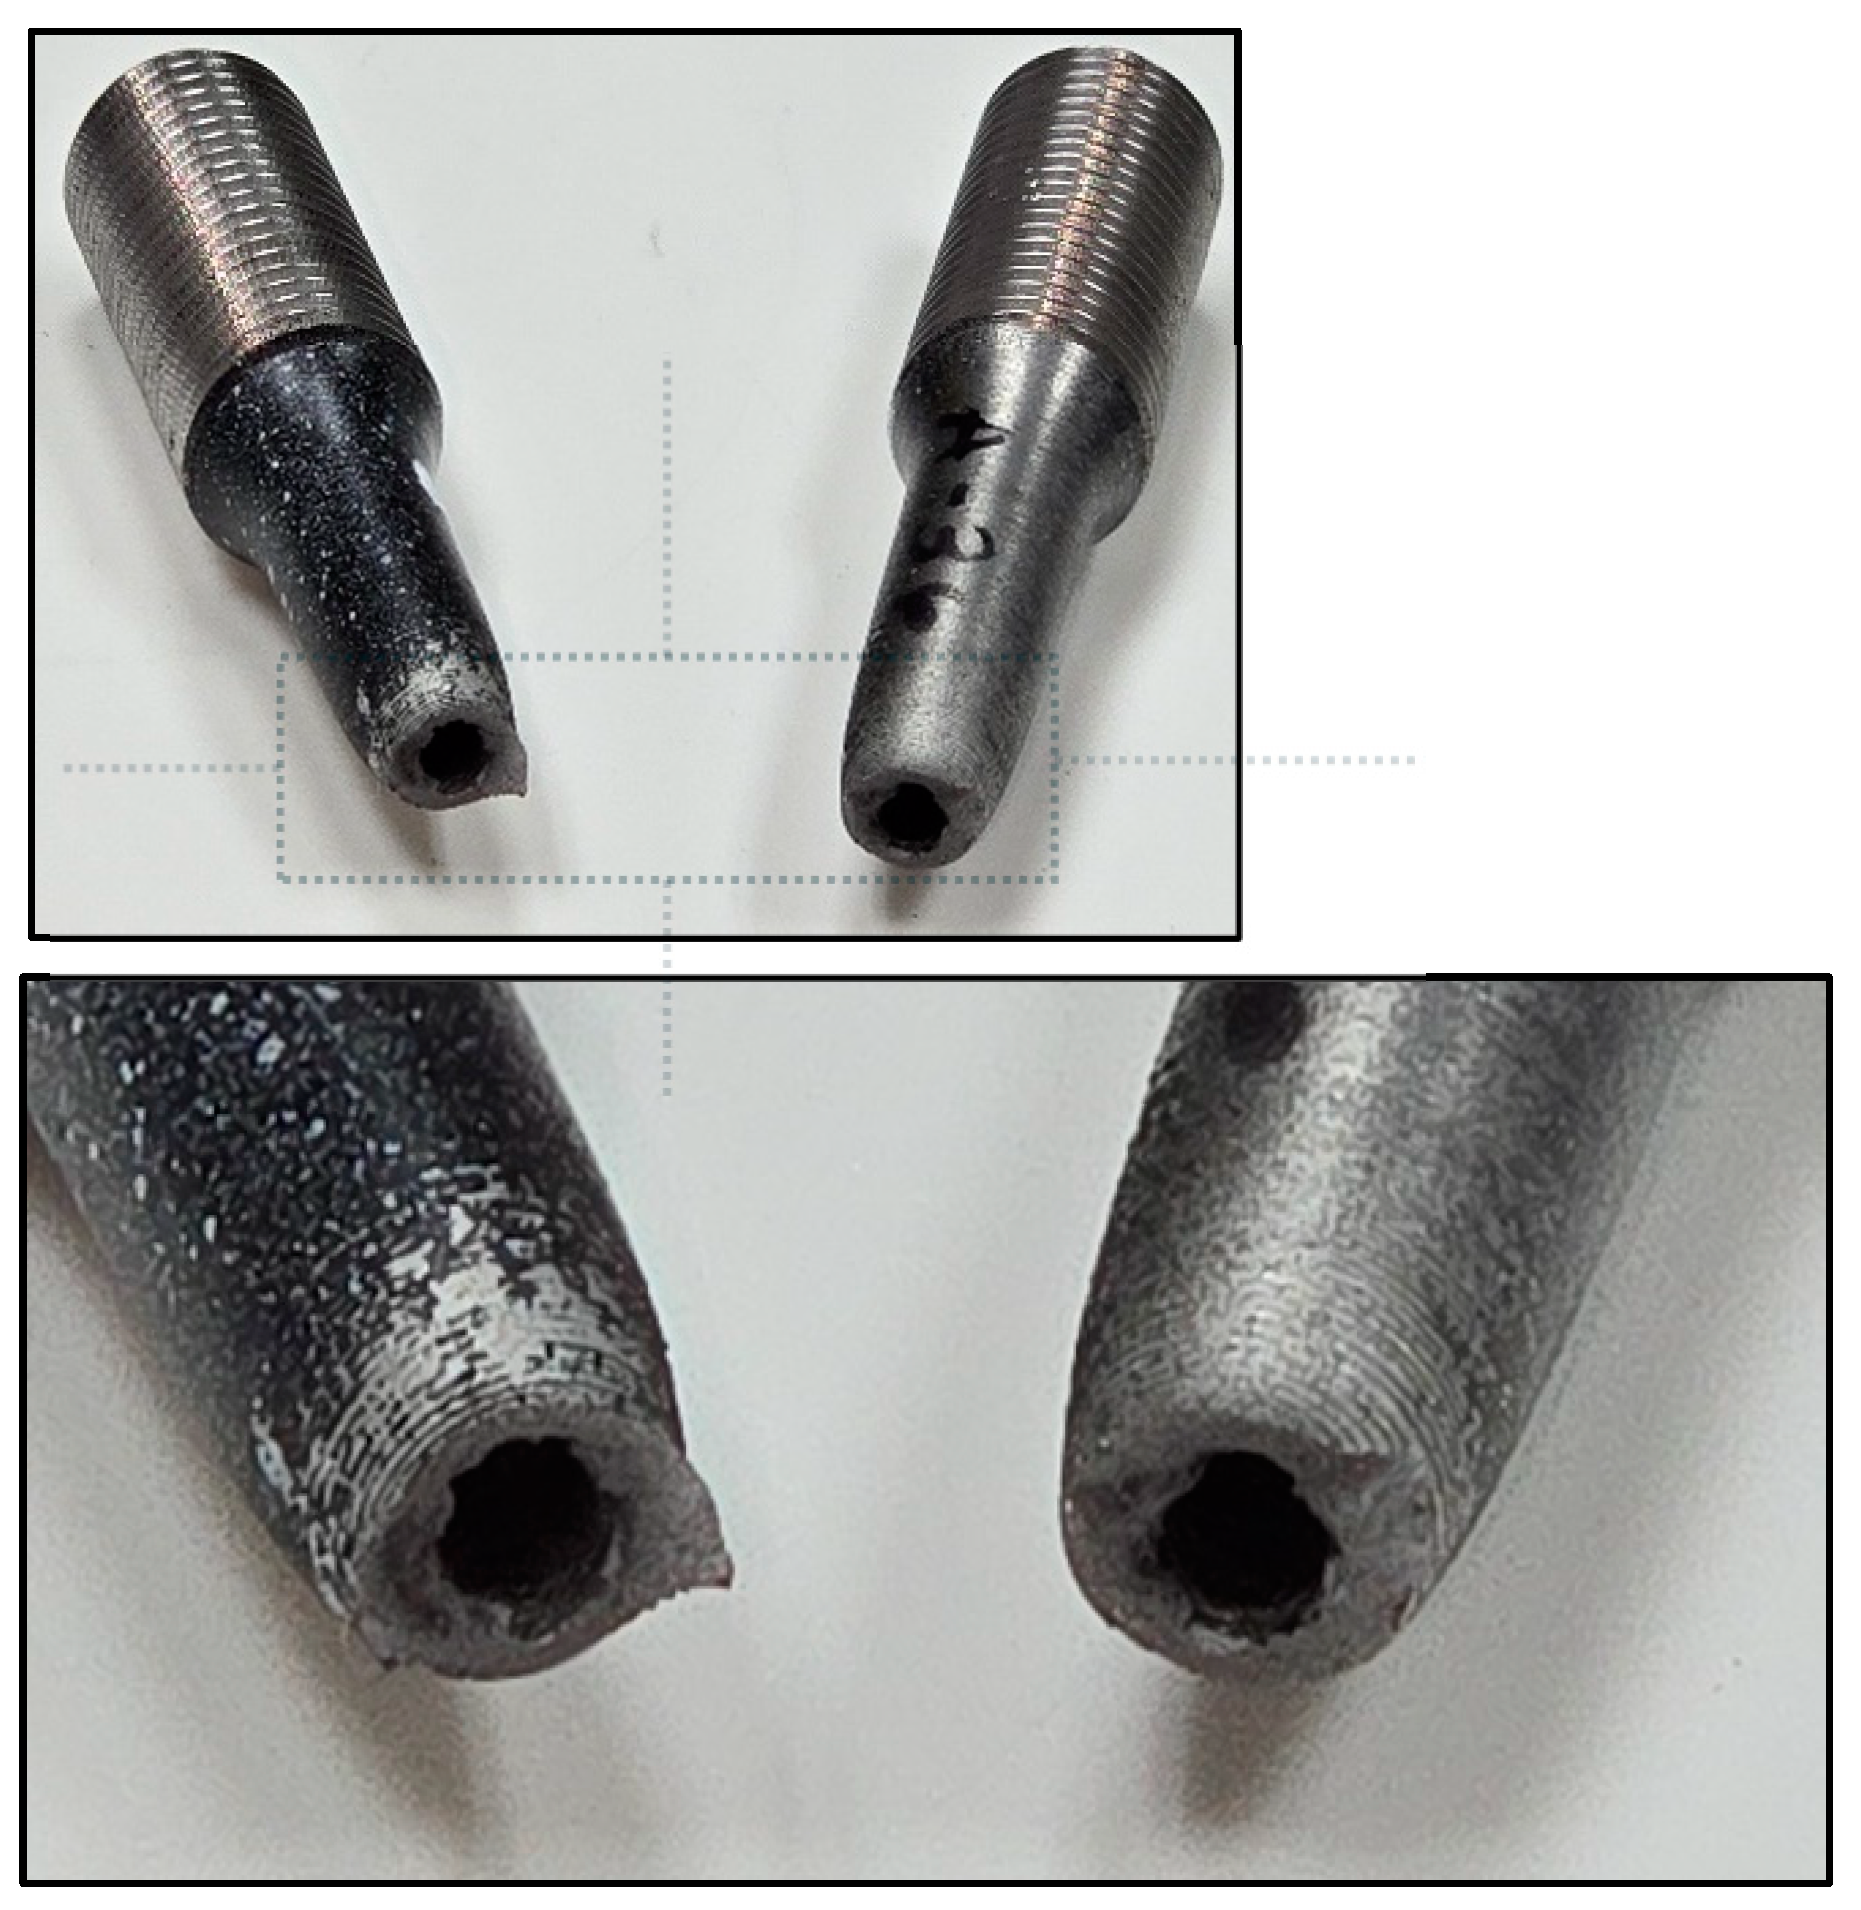
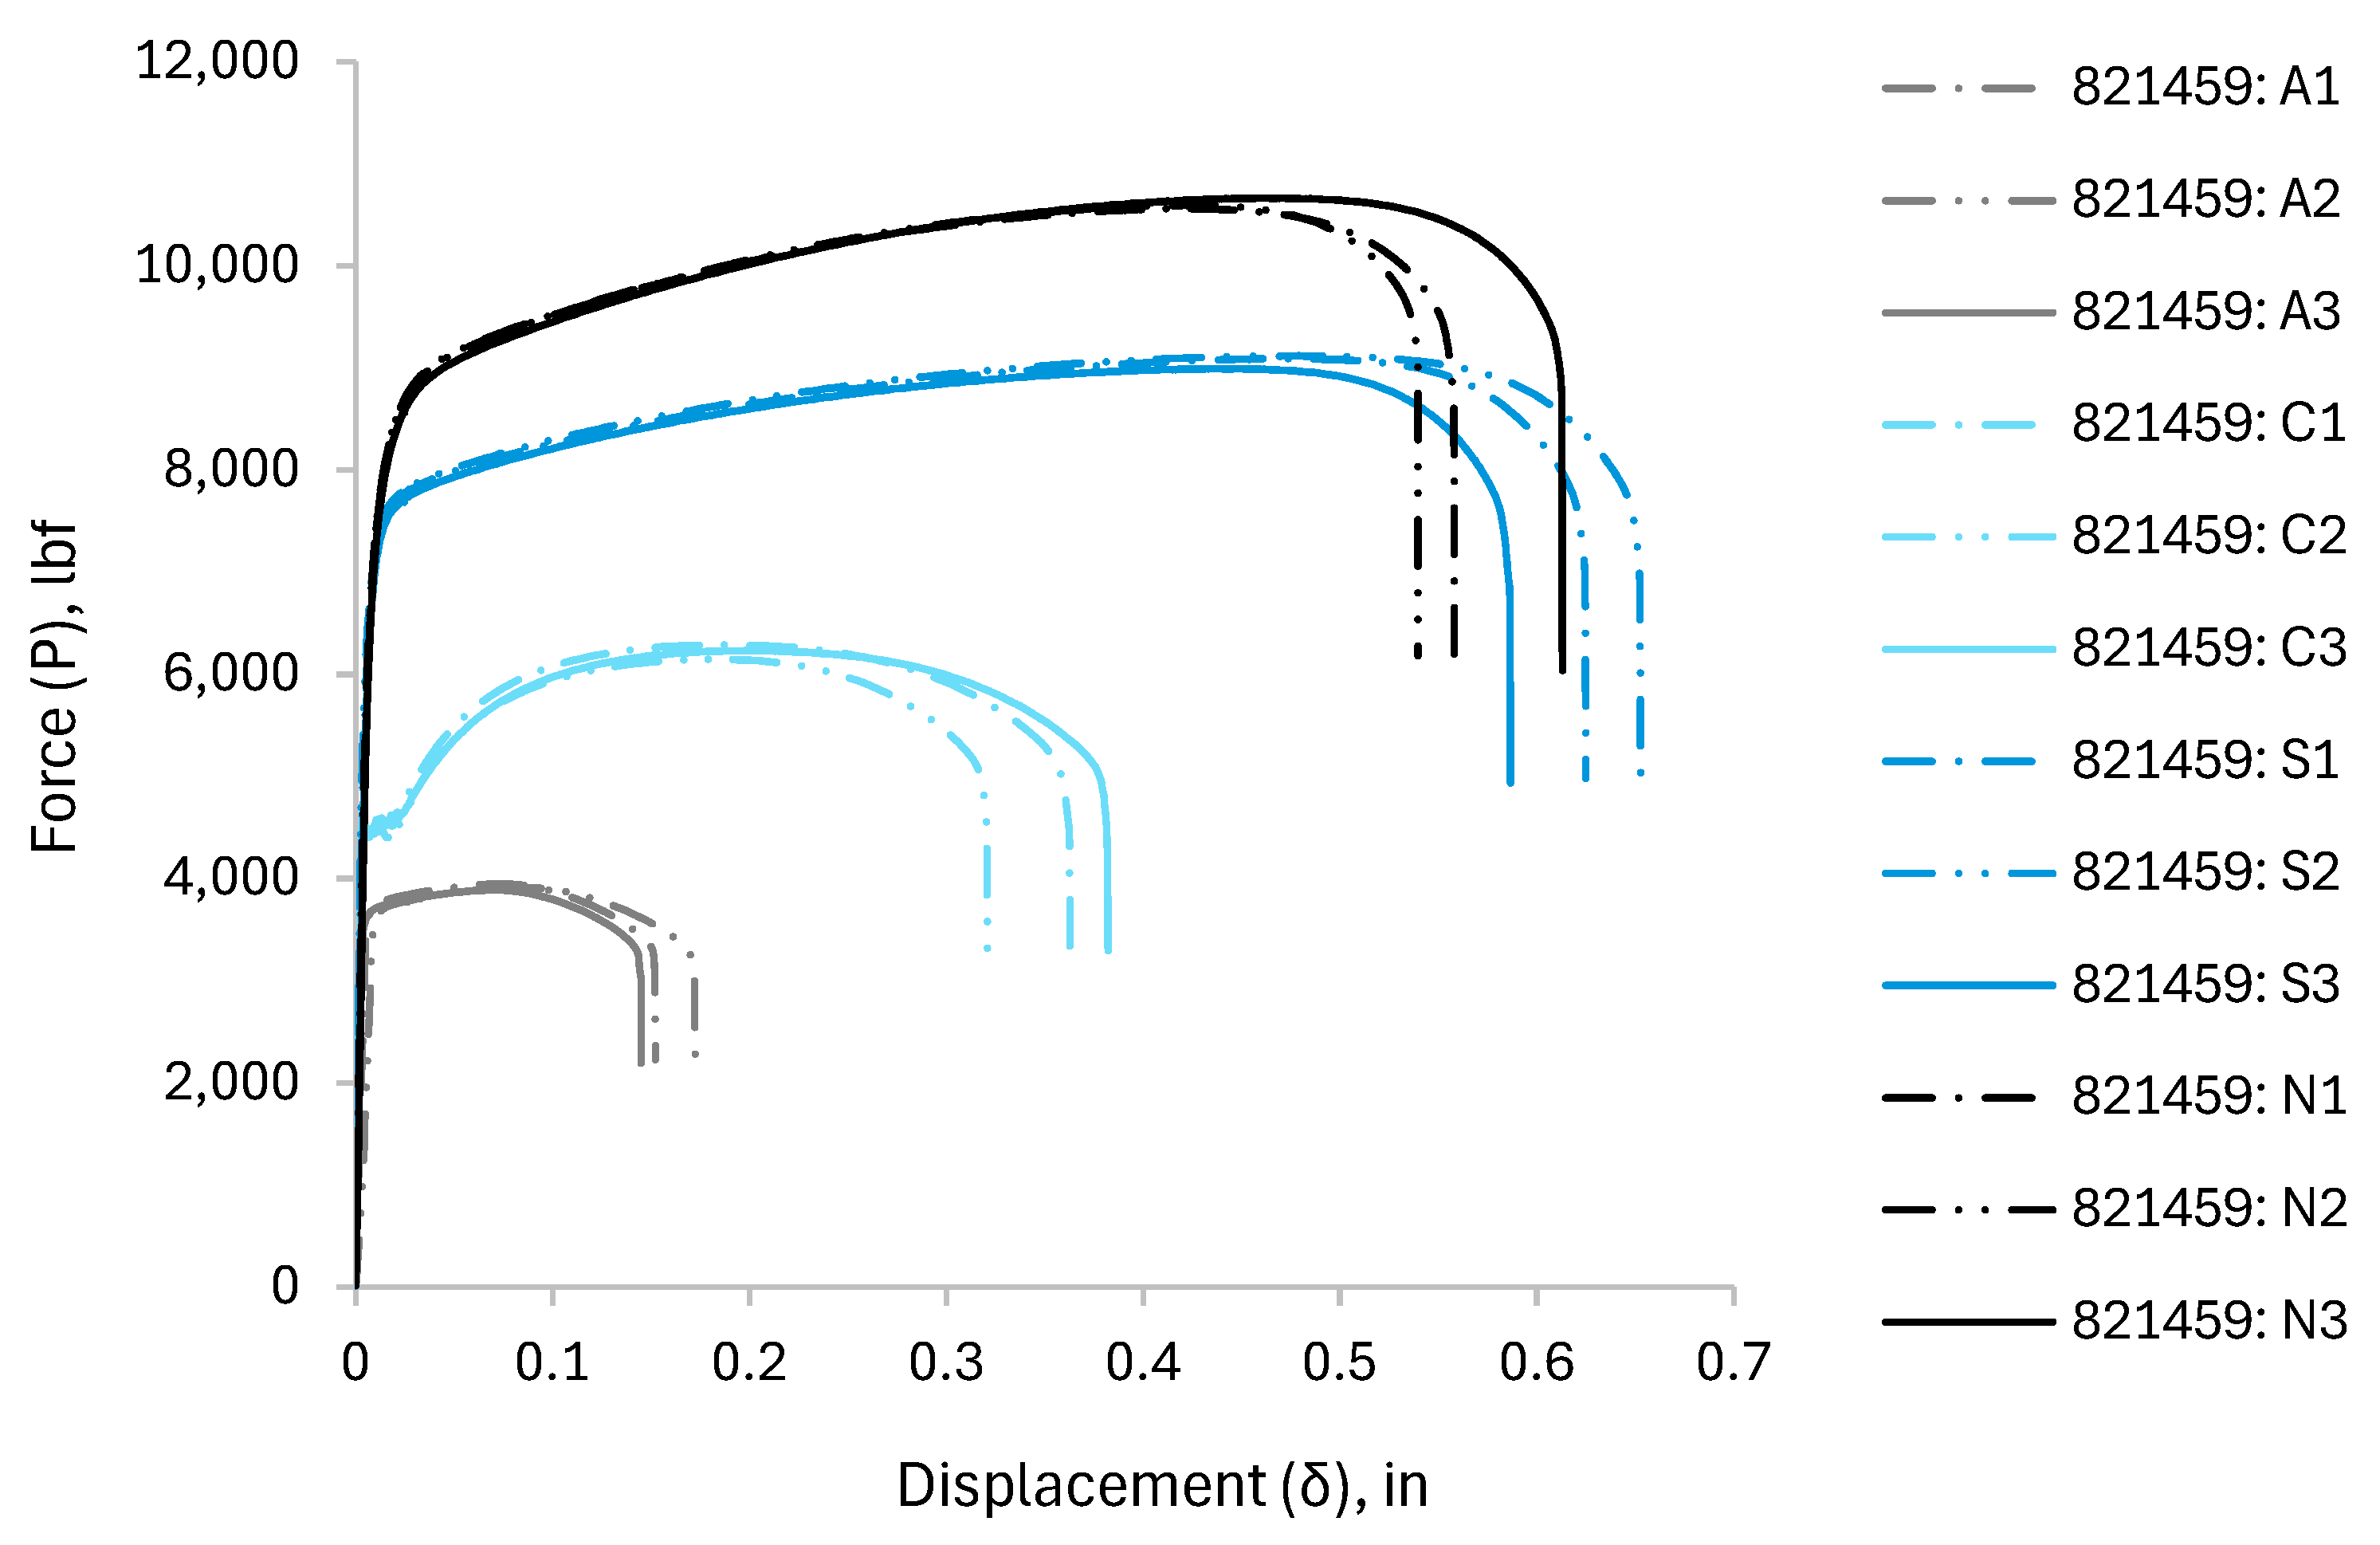
Figure 55.
curve for pipes (specimen-821459).
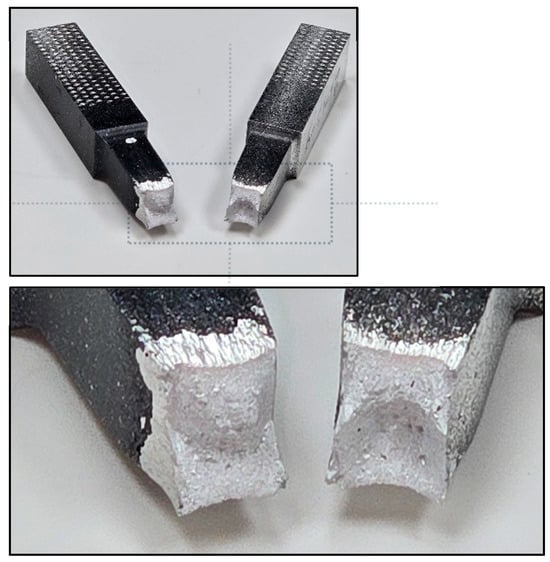
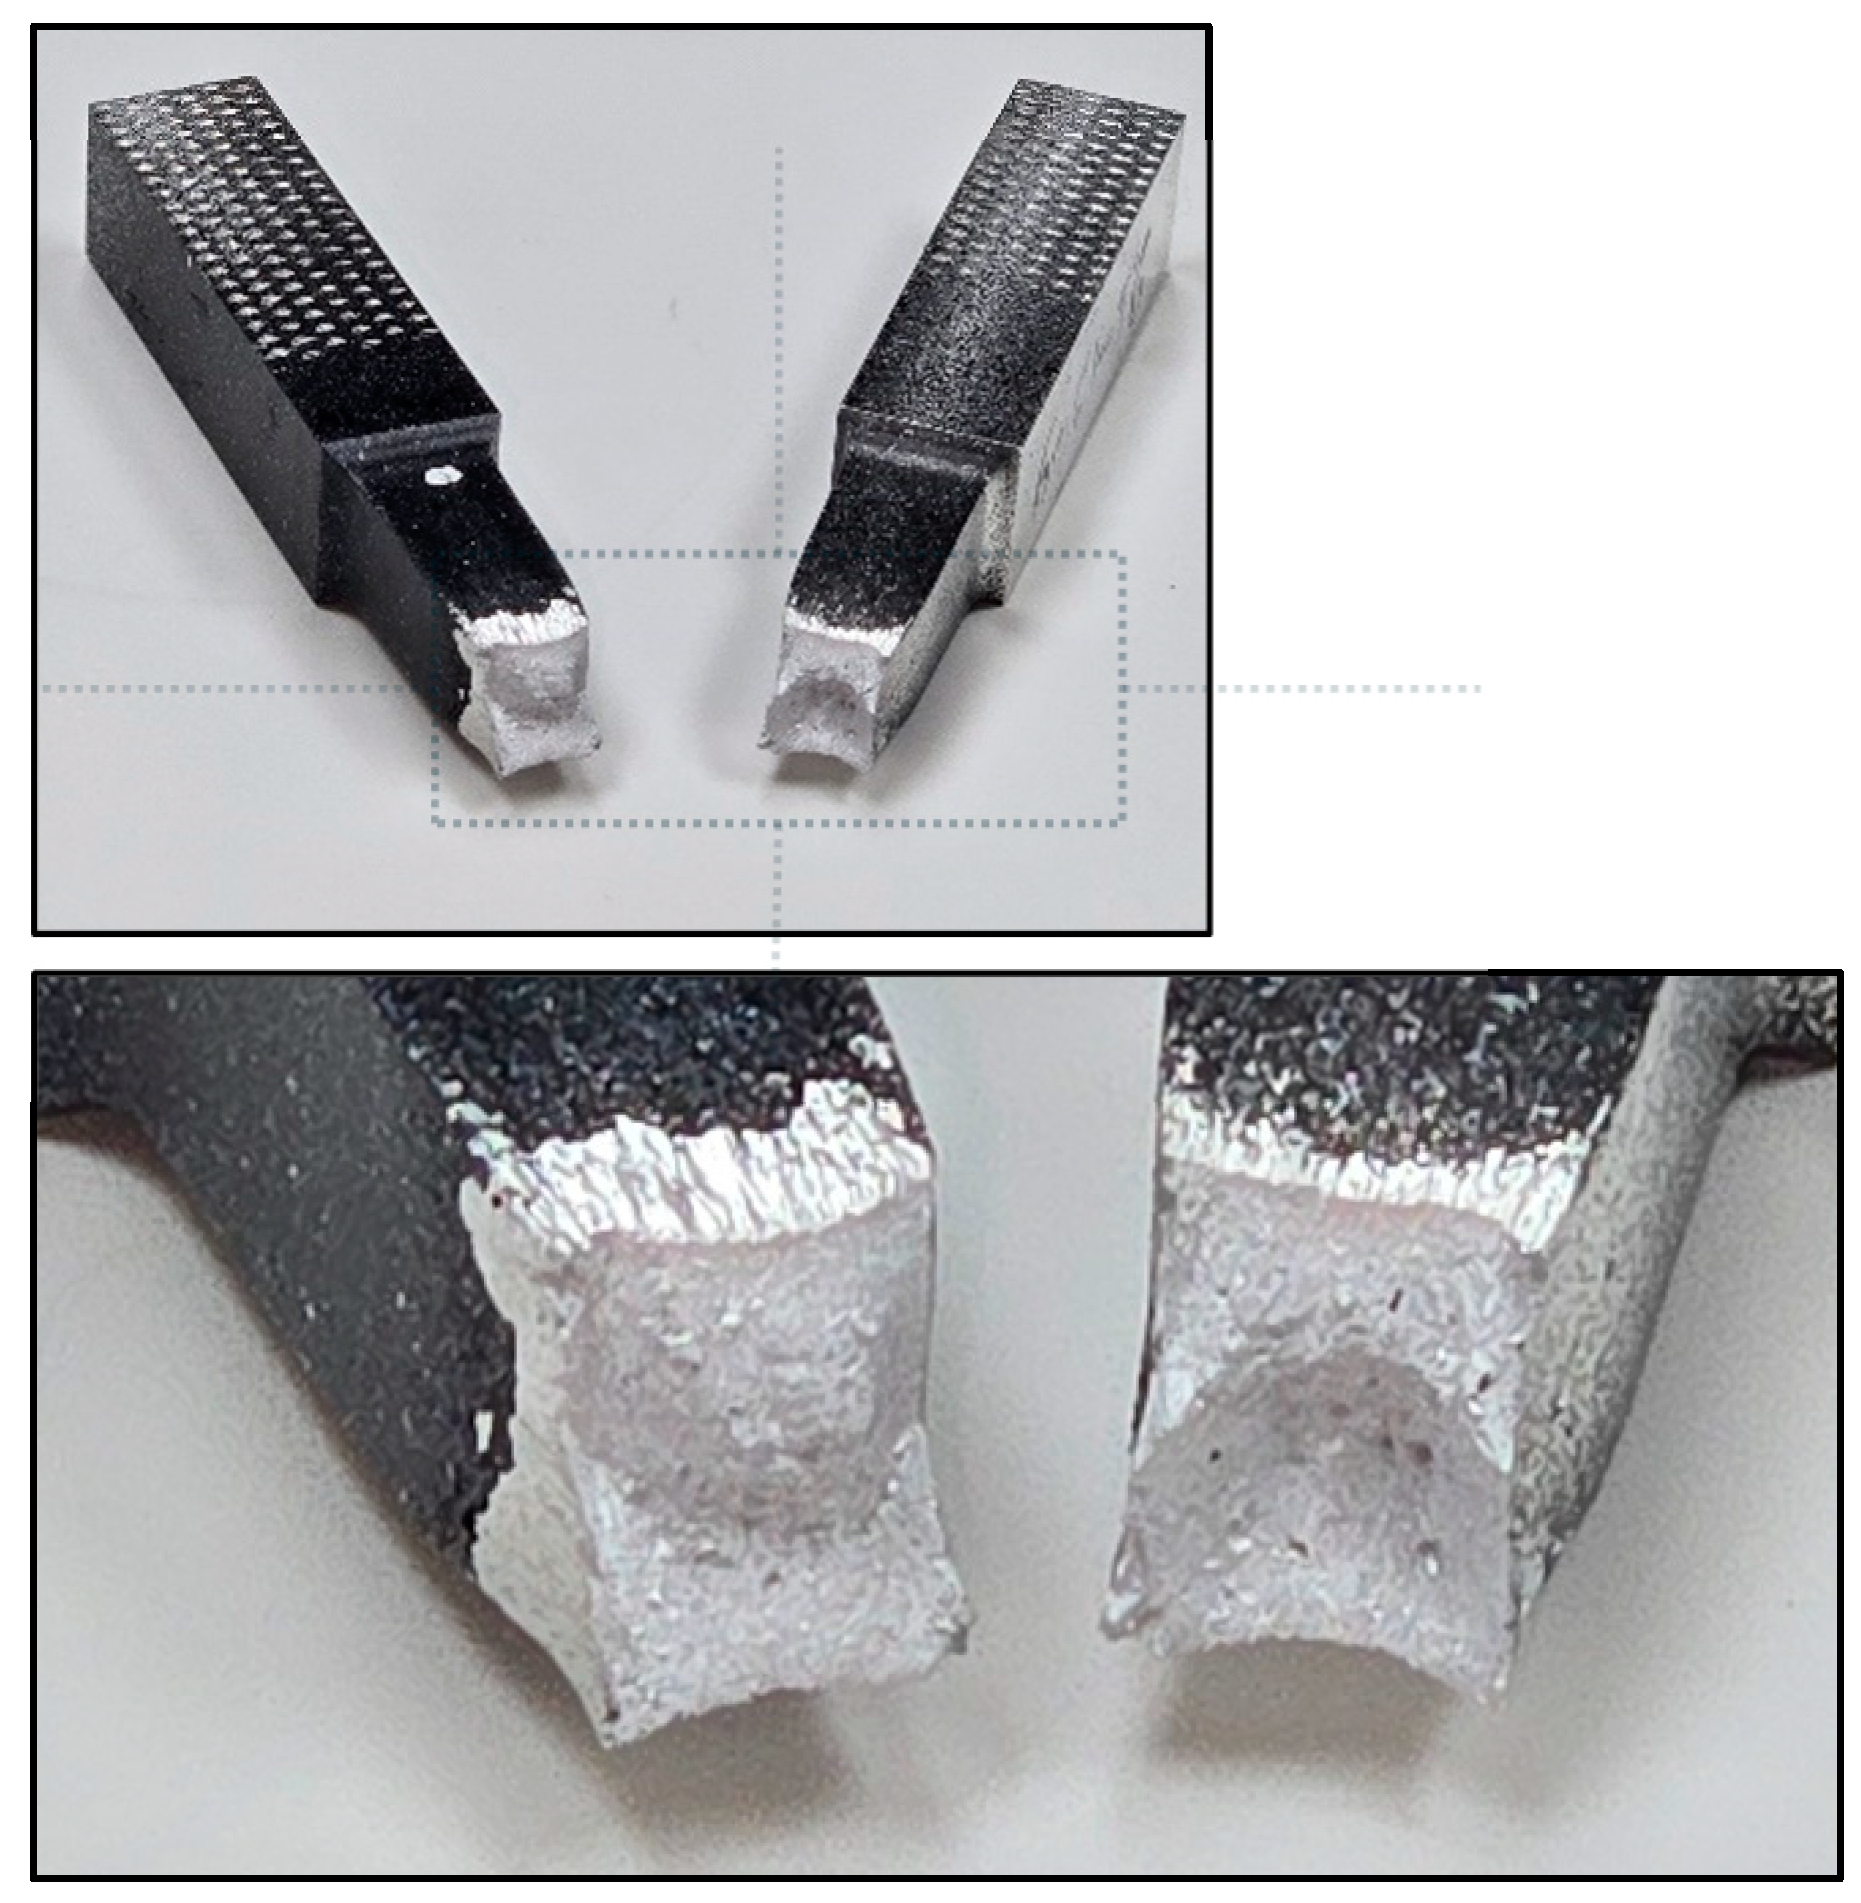
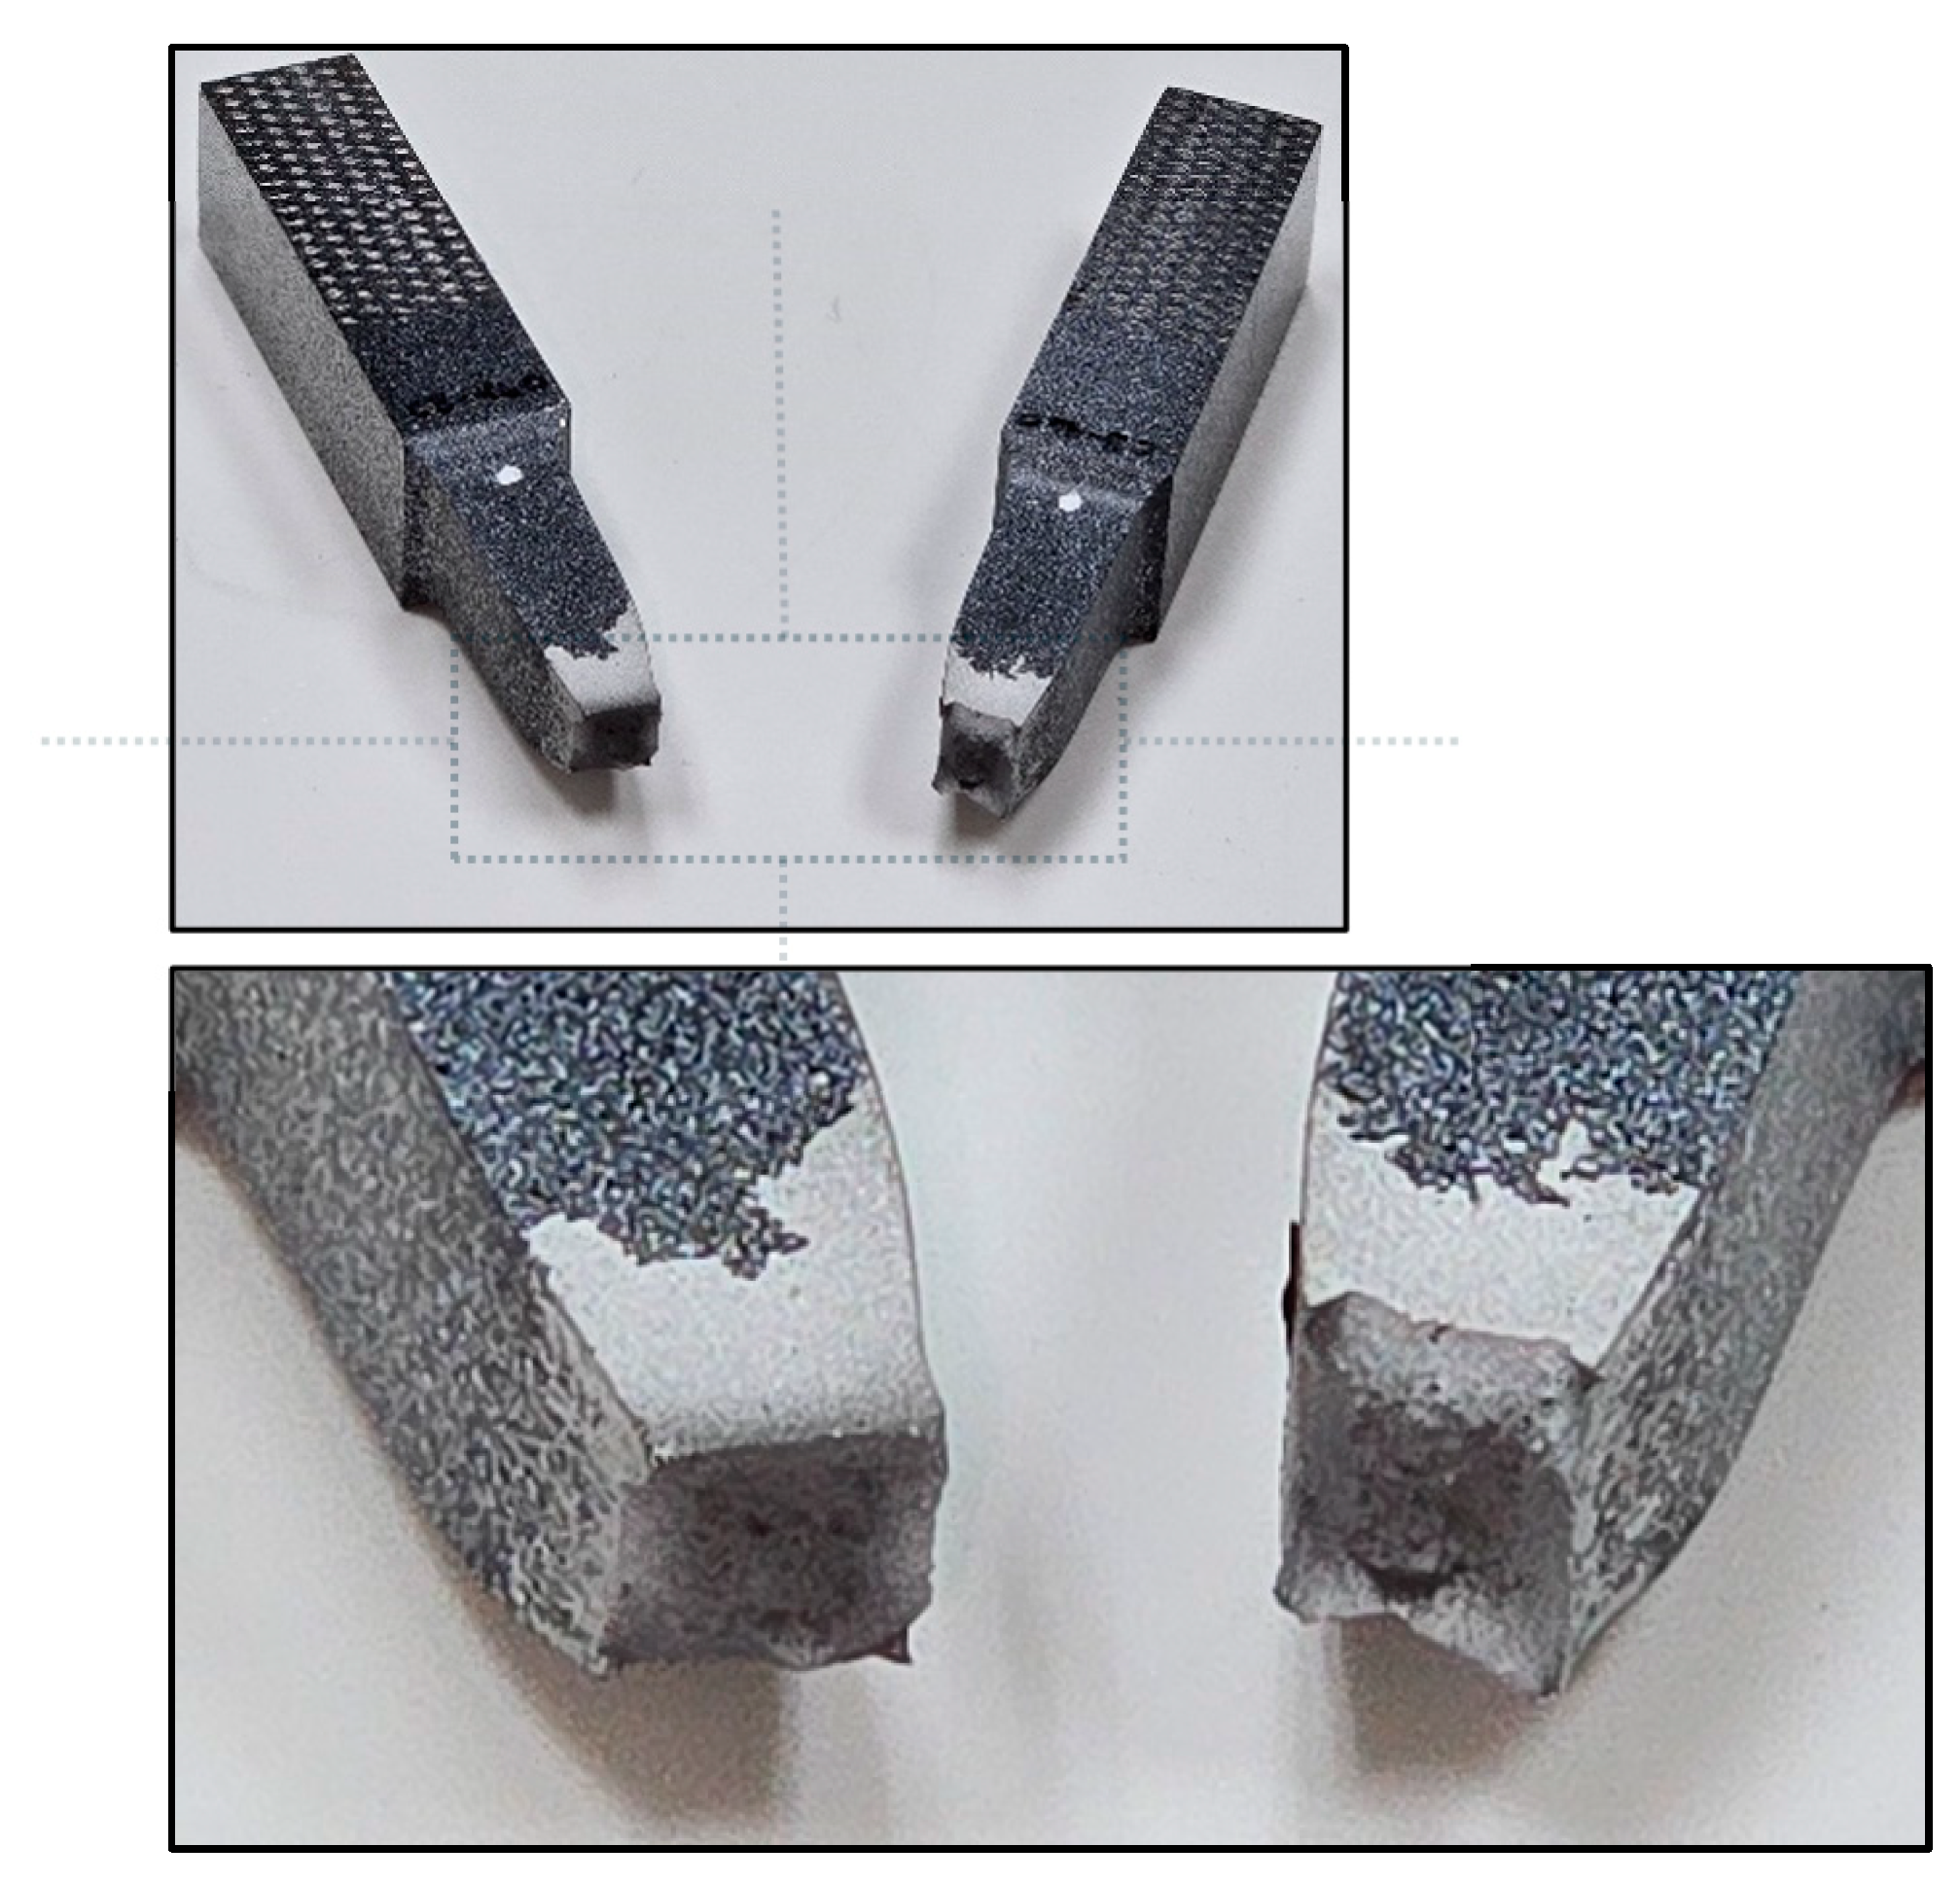
Figure 56.
Ductile fracture of specimen-821460, Al6061.

Figure 57.
Ductile fracture of specimen-821460, A36.
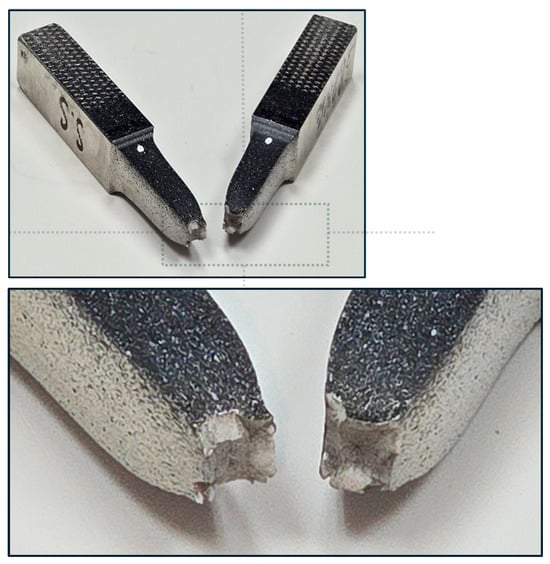
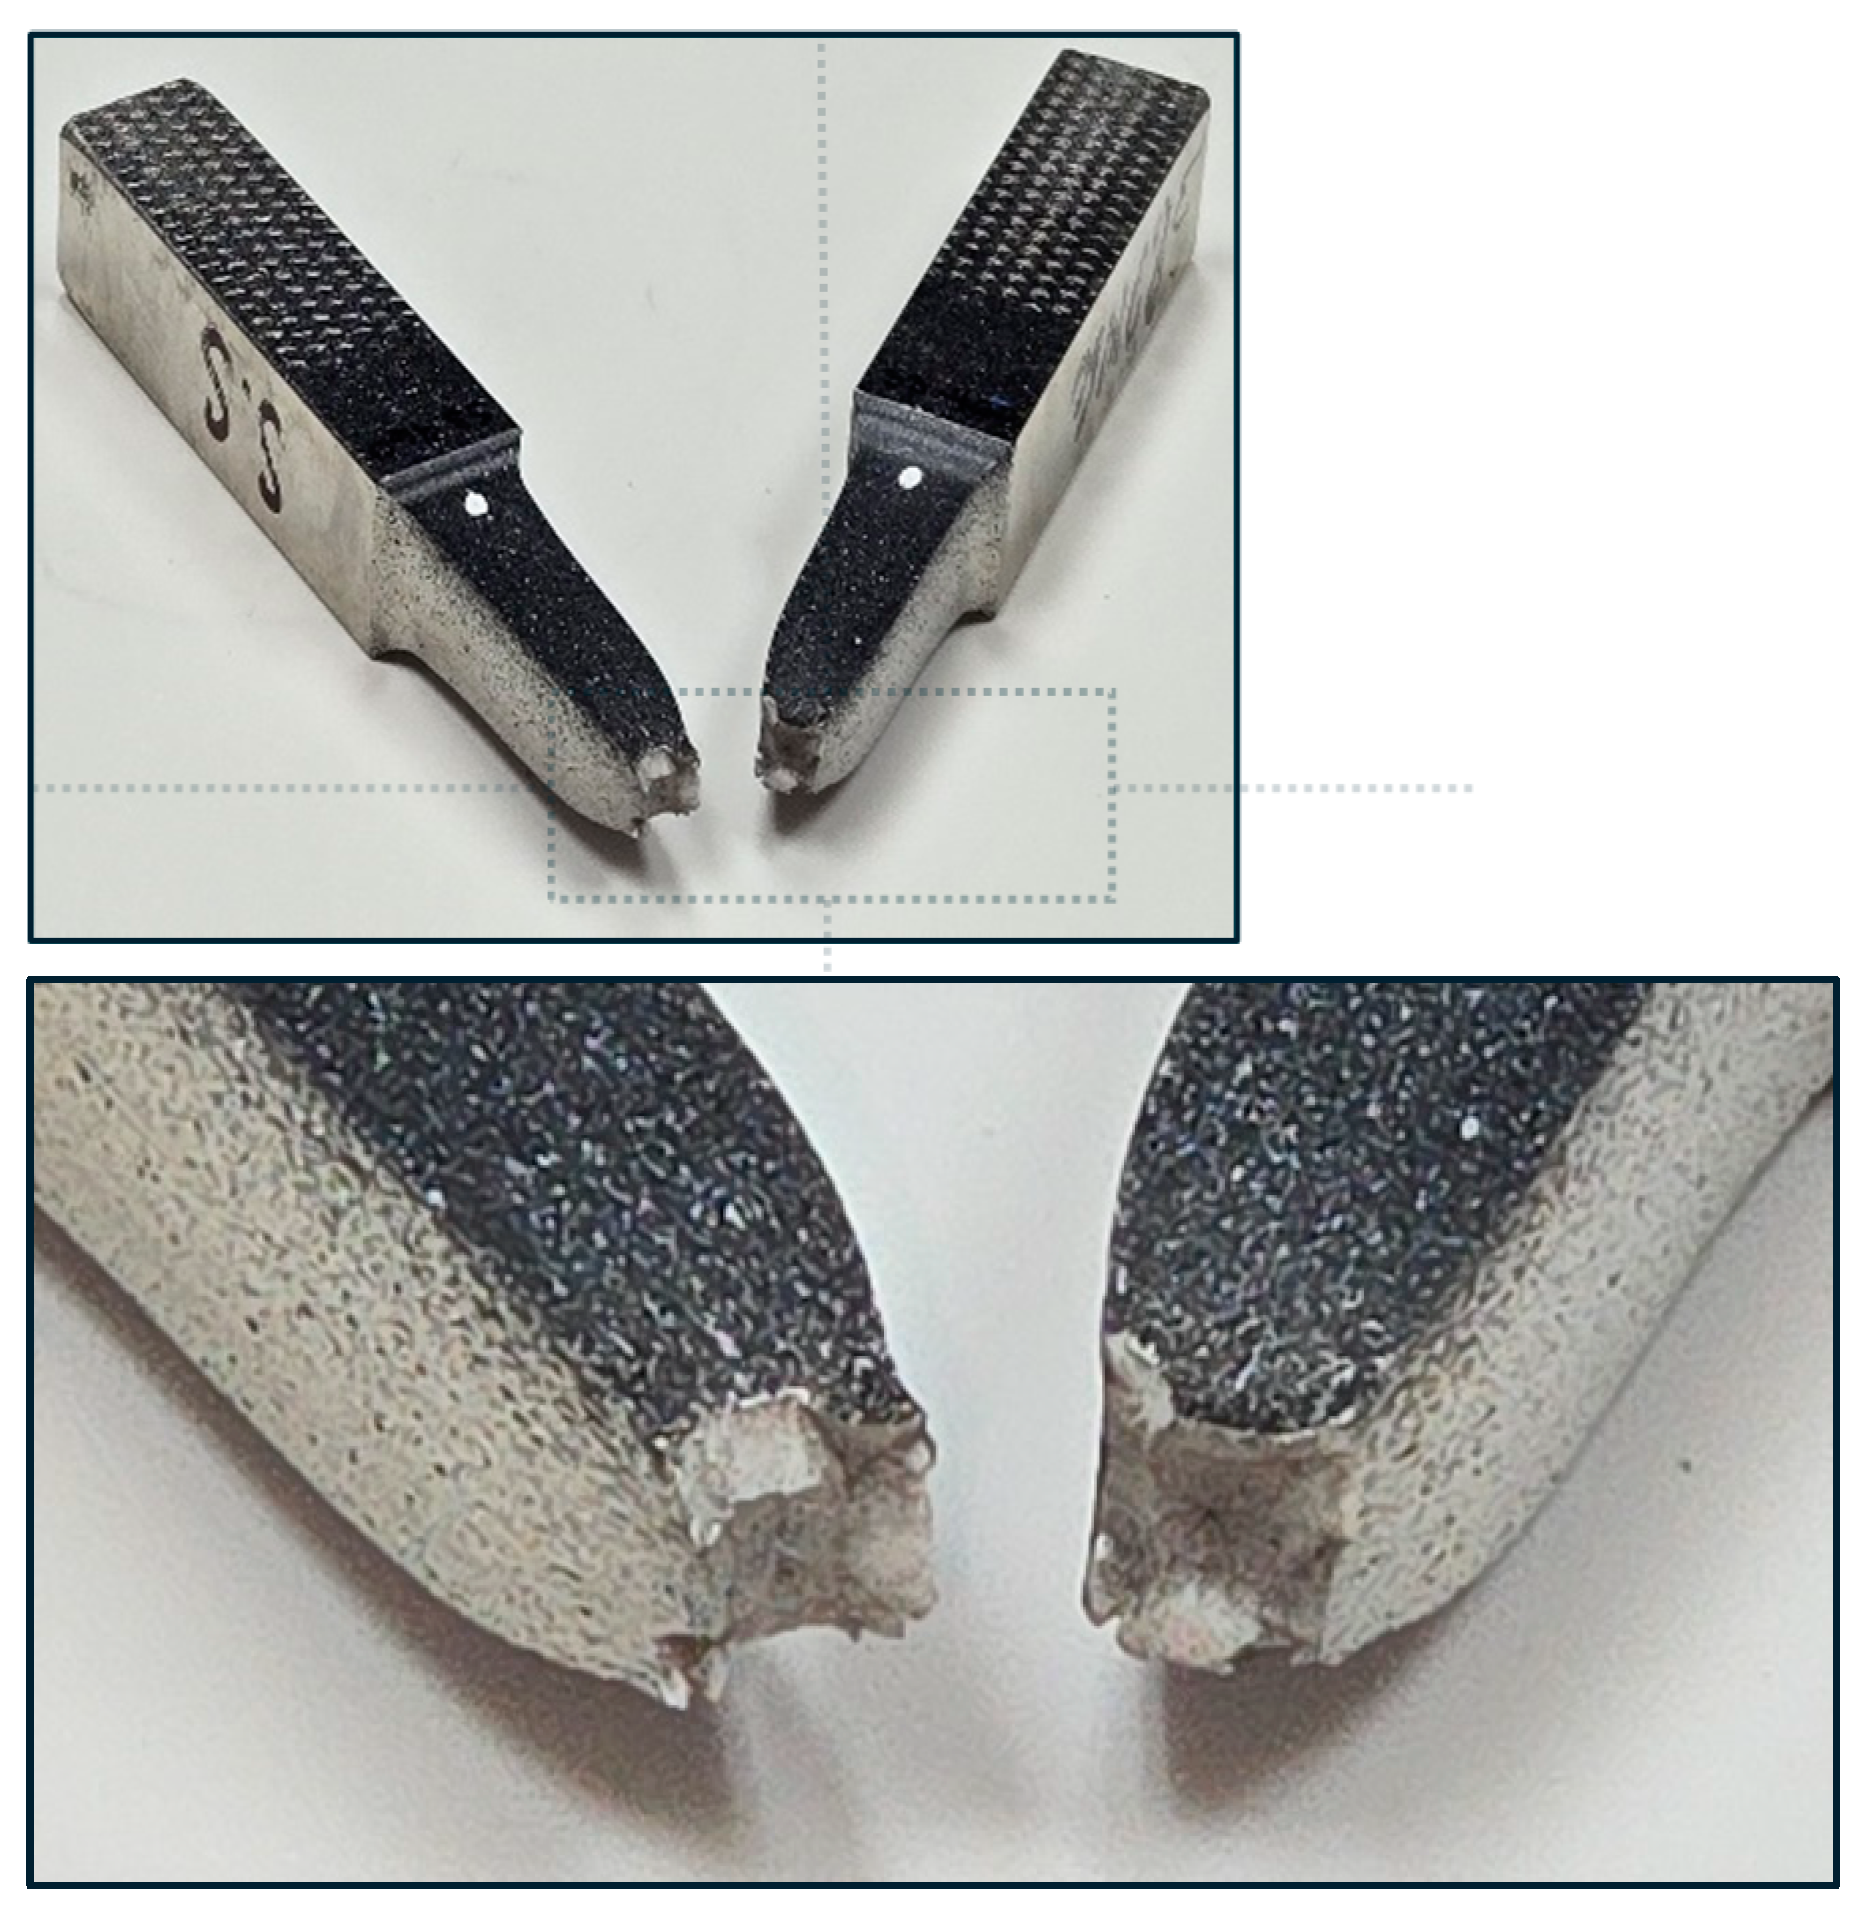
Figure 58.
Ductile fracture of specimen-821460, SS304.
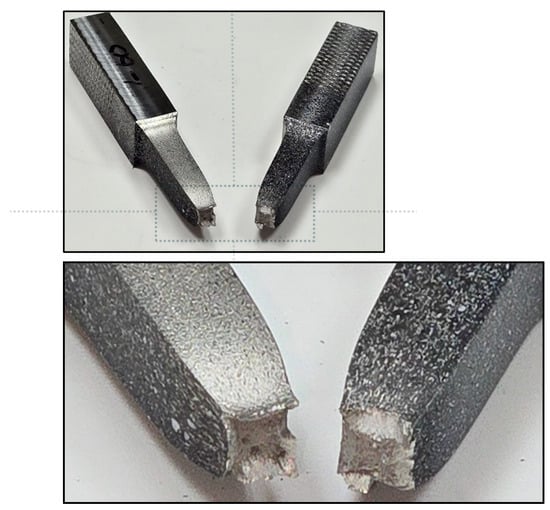
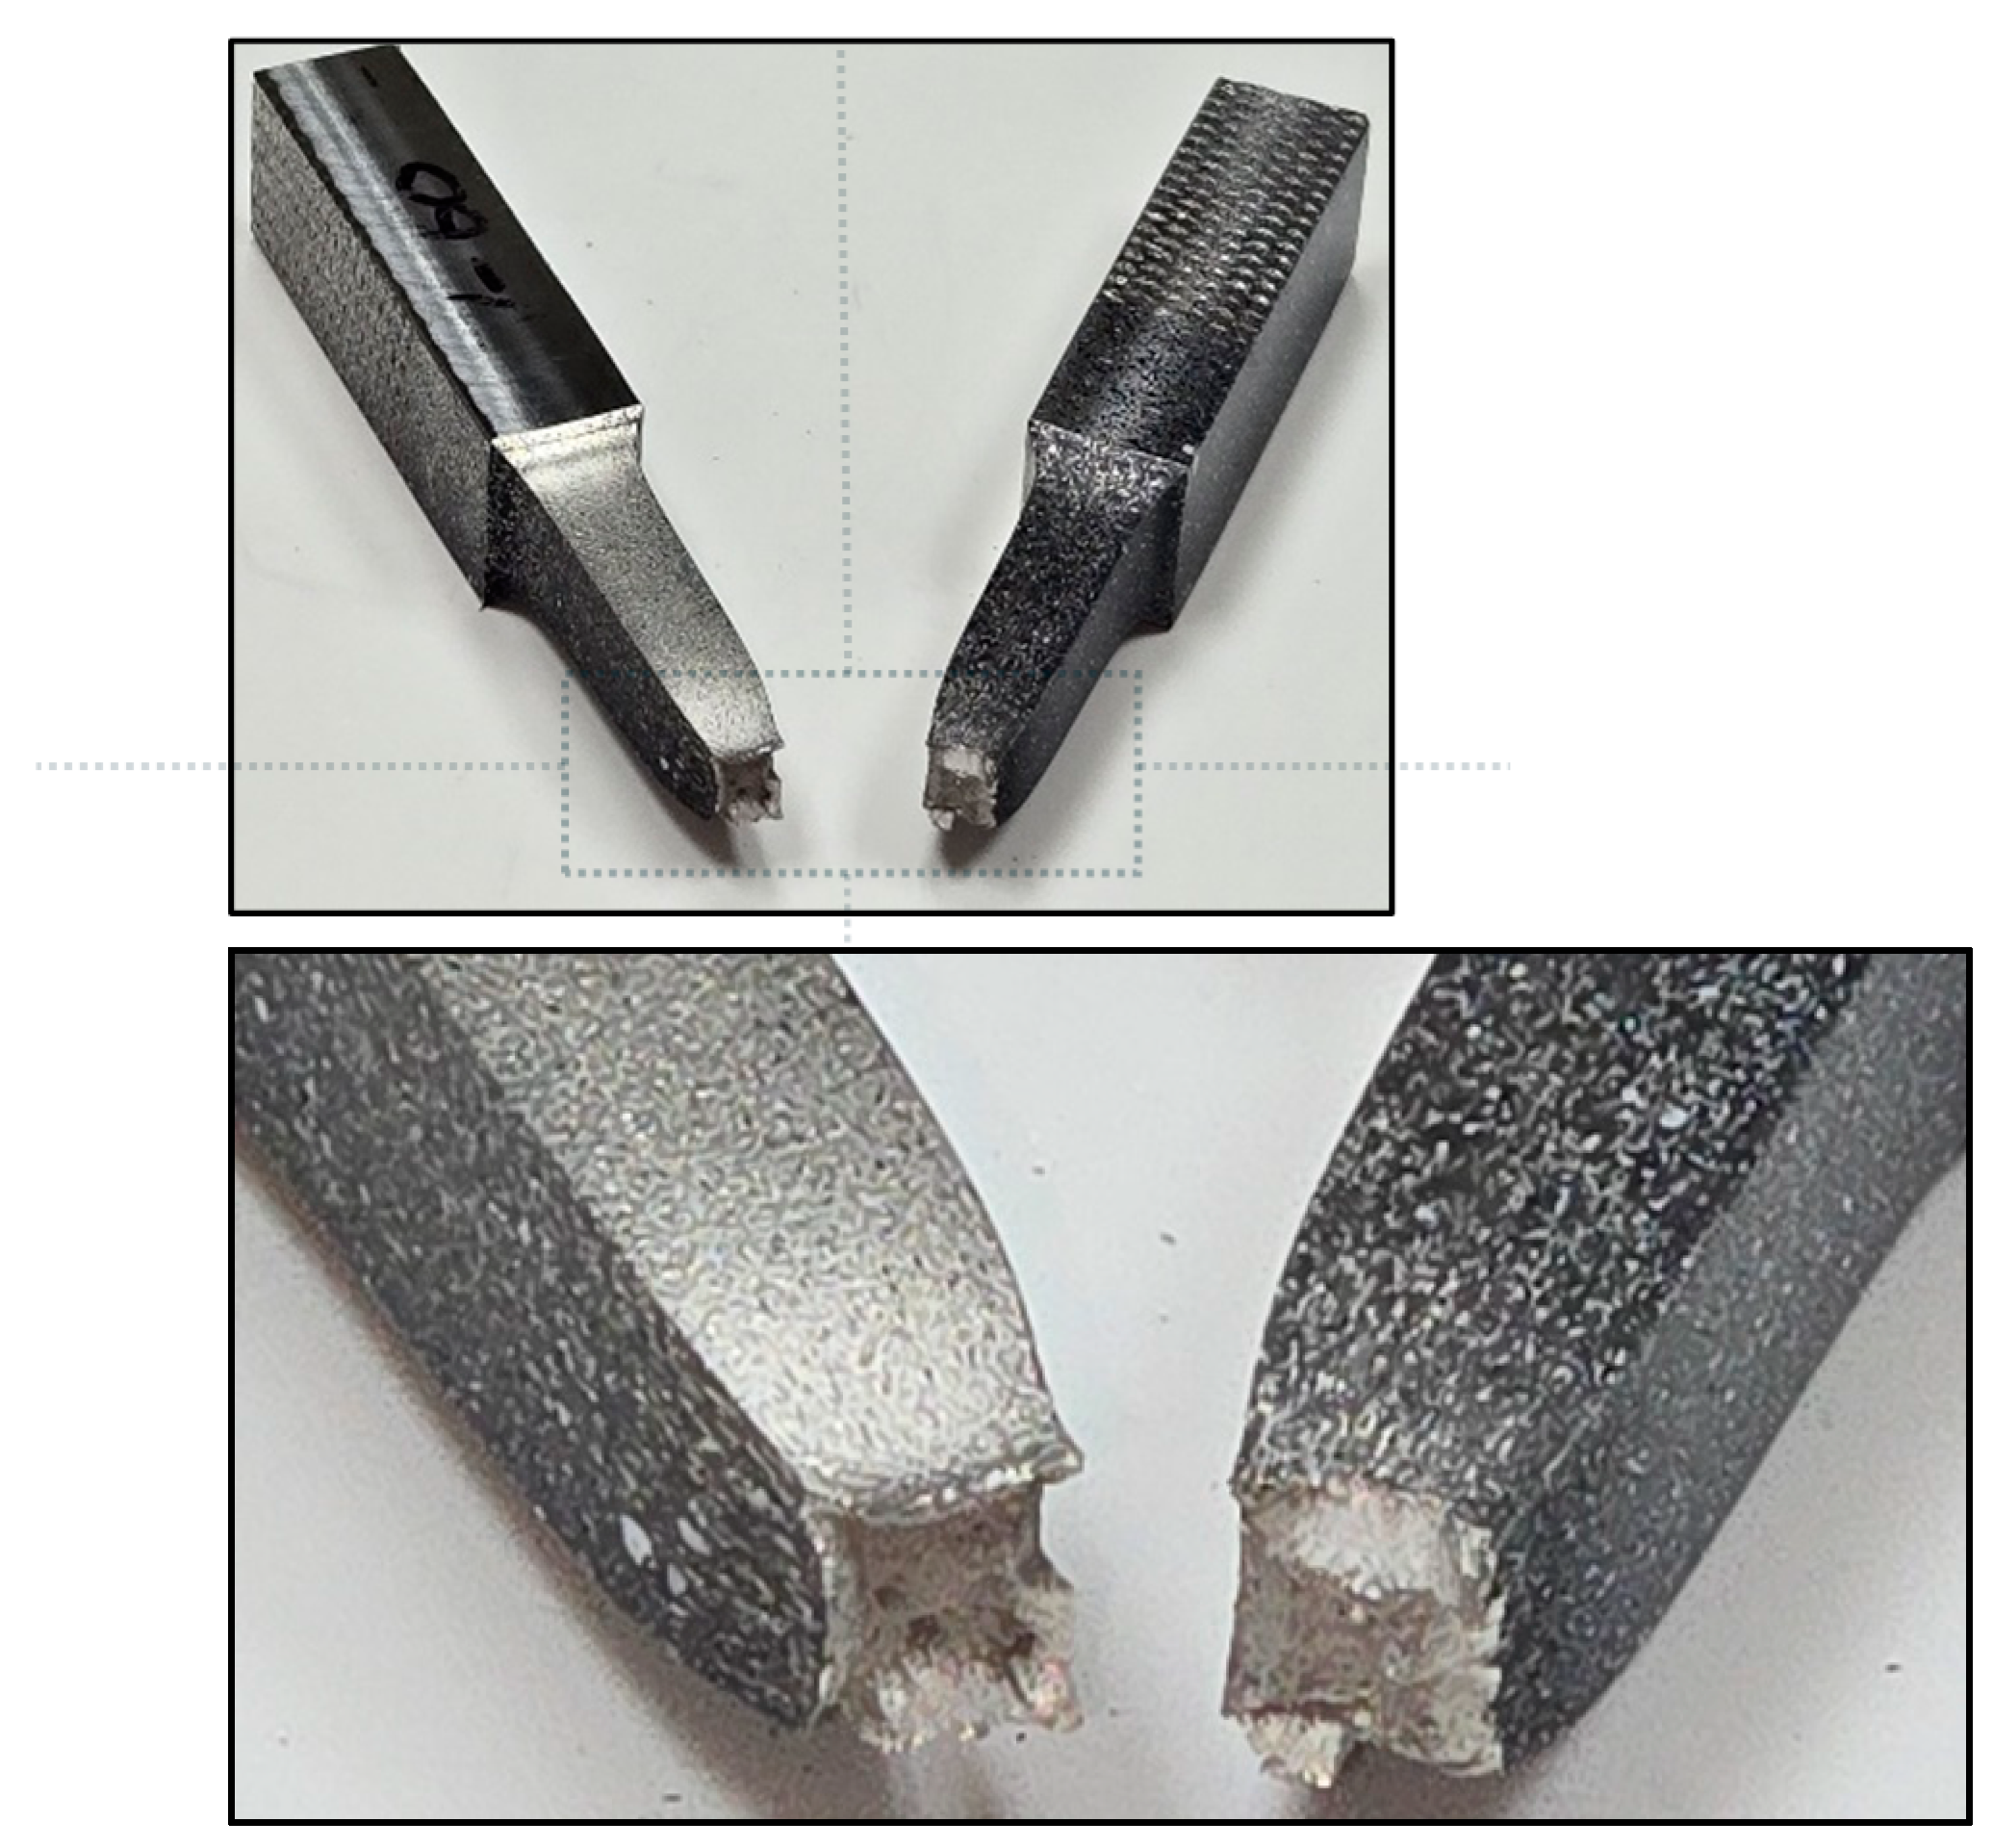
Figure 59.
Ductile fracture of specimen-821460, N60.
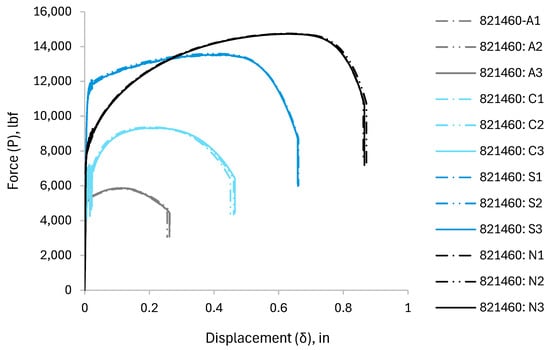
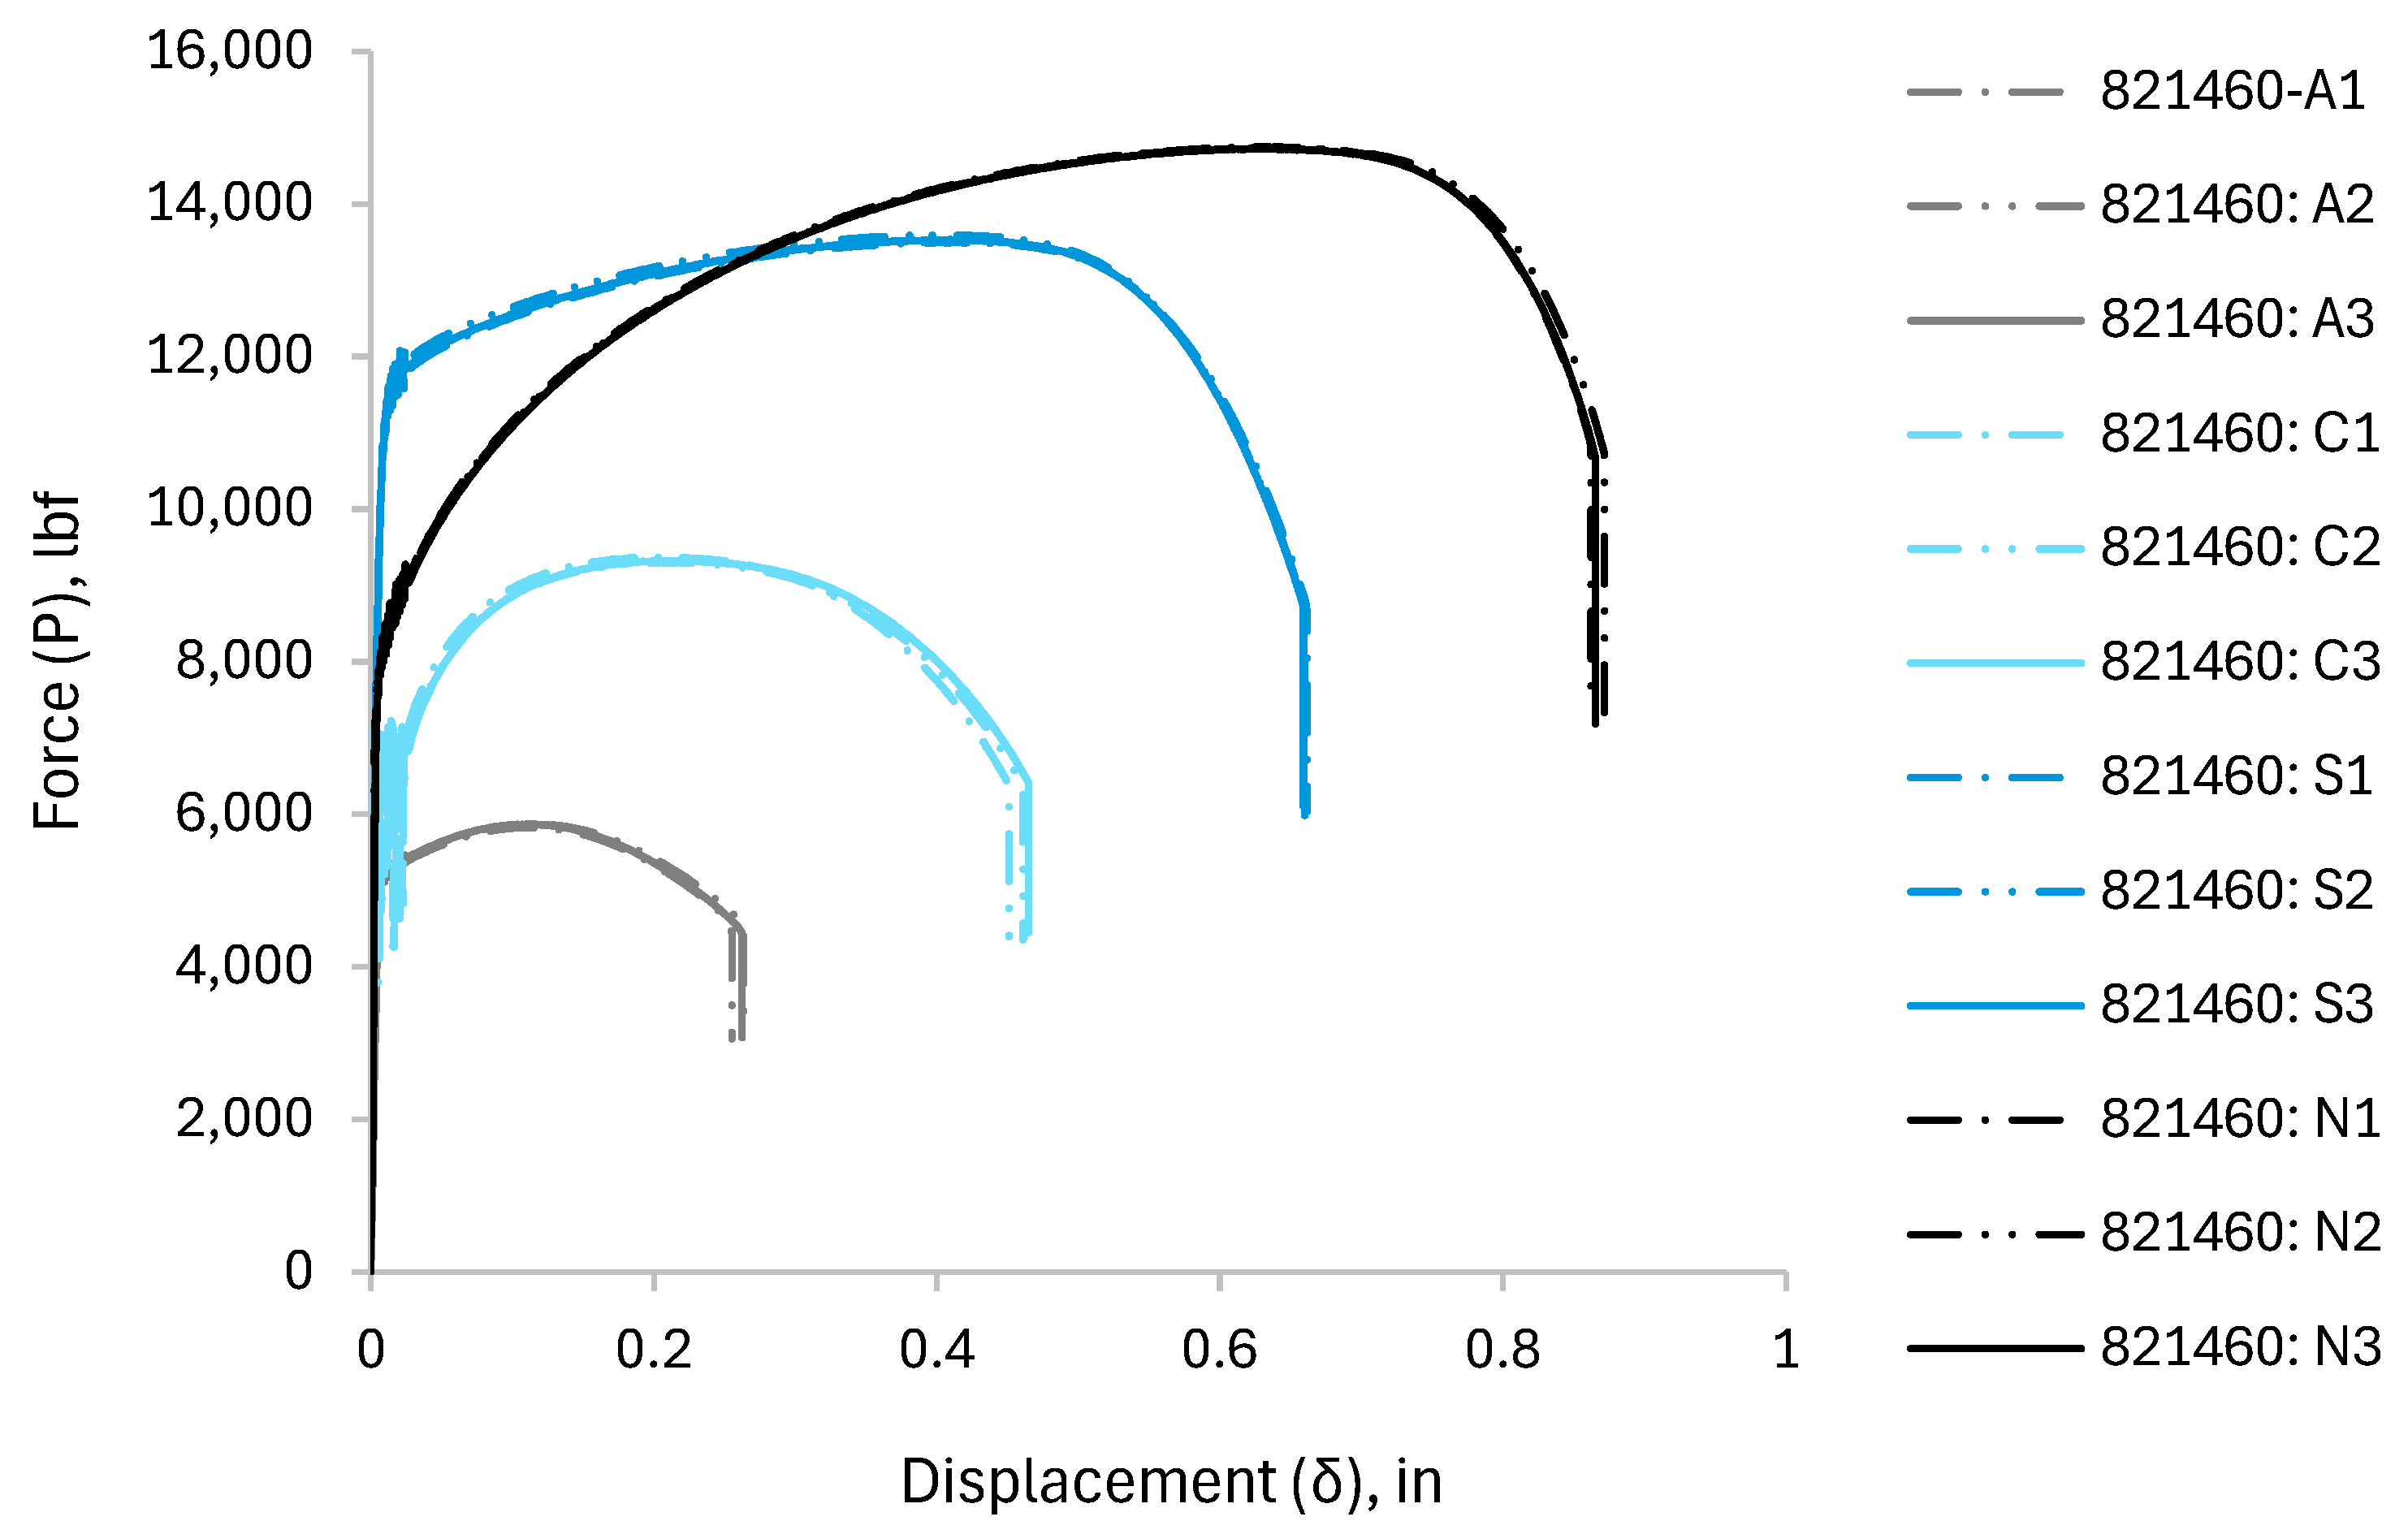
Figure 60.
curve for solid square bars (specimen-821460).
Table 3.
Smooth round bars’ mechanical properties.
Table 4.
Large-notched round bars’ mechanical properties.
Table 5.
Small-notched round bars’ mechanical properties.
Table 6.
Flat grooved plates’ mechanical properties.
Table 7.
Cylinders’ mechanical properties.
Table 8.
Simple shear plates’ mechanical properties.
Table 9.
Combined shear/tension plates’ mechanical properties.
Table 10.
Perforated plates’ mechanical properties.
Table 11.
Dog bones’ mechanical properties.
Table 12.
Pipes’ mechanical properties.
Table 13.
Solid square bars’ mechanical properties.
4. Discussion
Figure 5, Figure 6, Figure 7 and Figure 8 illustrate the typical fractures observed in the round bar test samples of the four metals. While all plastic behavior is important, the evaluation focused primarily on the plastic behavior near failure. It is essential to note that even when testing nearly identical sample types under uniform conditions, the resulting curves frequently vary due to factors such as the installation of the samples before loading, slight discrepancies in specimen thickness, and minor variations in chemical composition. To improve the accuracy of the experiment and reduce errors in the results, three samples are assessed per test specimen. Considering the force–displacement curves for each set of three samples, these tests demonstrated remarkable repeatability.
Fracture was observed in all tests except for the cylindrical compression specimens (refer to Figure 26, Figure 27, Figure 28 and Figure 29), which showed no signs of fracture in any metal. Each of the compression specimens experienced significant displacement, albeit in reverse order of toughness, with Aluminum 6061-T6 demonstrating the greatest displacement. This occurred due to the hardness of the platens (17-4 PH Stainless Steel, HRC 40). During testing, the platens plastically deformed, which limited the load that could be imparted to the test specimens. To account for the platen plasticity, the platens were cut into small pull-test specimens away from the area of plastic deformation, and pull tests were performed. The resulting elastic–plastic material properties, including the platens, were then used in the compression FEA models. Additionally, Digital Image Correlation (DIC) was used to capture the overall deformation of the test accurately for comparison with the FEA models. The FEA modeling takes place in Part Two of the study. Because failure did not occur, limiting plastic strains versus triaxiality are not provided with these tests. This will be acknowledged in the final results of this study for the portion of the results that are affected. While not reaching failure, the data is beneficial as it fills in some data where there were no data. The tests showed greatly increased plastic equivalent strains in compression without failure. This data is important to evaluations where underestimating plastic strains to failure represent a conservative result. Of course, achieving failure in future tests would be a desirable result.
The simple shear plate (821455) and the combined shear/tension plate (821456) test specimens were intended to produce simple shear and combined shear/tension, respectively. Refer to Figure 31, Figure 32, Figure 33, Figure 34, Figure 35, Figure 36, Figure 37, Figure 38 and Figure 39. During testing, rotations occurred that caused a tensile component to be added to the 821455-test specimen and additional tensile loading to be added to the 821456-test specimen. These rotations were most apparent in the higher strength A36 Carbon Steel, 304 Stainless Steel, and Nitronic 60 metals, although all the test data remained reliable. For future testing, however, an adjustment in the test specimen geometries (gauge thickness) could minimize this issue.
5. Summary and Conclusions
Part One of the study has provided a reasonable set of test data for use in Part Two. Part Two will involve replicating the test data through FEA models of the test specimens. The FEA models then will be used to establish plastic equivalent strain and triaxiality at failure data. This approach will ultimately facilitate the development of a comprehensive material property definition that links failure strain (plastic equivalent strain) to stress triaxiality for Aluminum 6061-T6, A36 Carbon Steel, 304 Stainless Steel, and Nitronic 60 metals. These metals are commonly used in the nuclear industry due to their favorable properties, including high strength, corrosion resistance, and radiation tolerance. They are also employed in the manufacturing of shipping containers, handling tools, and other components essential for safe and efficient nuclear reactor operation. The results from this study will aid in developing a comprehensive material property definition that links failure strain (plastic equivalent strain) to stress triaxiality, ensuring integrity, preventing structural failures, and maintaining safety.
Most of the testing occurred as planned, with minor exceptions. During the testing of the cylinder (821453), platen plasticity occurred, which limited the deformation in the test specimens. This issue was particularly pronounced during the testing of the higher toughness metals (e.g., the Nitronic 60). As a result, some additional testing was performed to help facilitate Part Two of the study. Additional testing involved slicing the platens into tension test specimens to establish their elastic–plastic material properties. This makes it possible to include elastic–plastic platen models into the FEA models performed in Part Two. This was a satisfactory solution for this research. However, for subsequent experiments, it is recommended to use platens with a higher hardness value for the 821453-specimen tests. In general, for the compression tests performed, no fracture occurred. Instead, the tests were performed to produce as much plastic strain as possible, given the limitations of the tests.
During the evaluation of the simple shear plate (821455) and combined shear/tension plate (821456), rotations occurred that added tensile loading where shear loading was desired. These rotations were most apparent in the higher-strength metals (e.g., the Nitronic 60), although all the test data remained reliable. It is recommended for subsequent experiments that an adjustment in the test specimen geometries (gauge thickness) be performed to minimize this issue.
Author Contributions
Conceptualization, R.H., R.S. and A.E.; methodology, R.H., R.S. and A.E.; software, R.H. and R.S.; validation, R.H. and R.S.; formal analysis, R.H. and R.S.; investigation, R.H. and R.S.; resources, R.H.; data curation, R.H.; writing—original draft preparation, R.H.; writing—review and editing, R.H., R.S. and A.E.; visualization, R.H.; supervision, R.S. and A.E.; project administration, R.H.; funding acquisition, R.H. All authors have read and agreed to the published version of the manuscript.
Funding
This research was funded by the Idaho National Laboratory.
Data Availability Statement
The raw data supporting the conclusions of this article will be made available by the authors on request.
Acknowledgments
The authors are grateful for the support of this research. This research made use of Idaho National Laboratory’s High Performance Computing systems located at the Collaborative Computing Center and supported by the Office of Nuclear Energy of the U.S. Department of Energy and the Nuclear Science User Facilities under Contract No. DE-AC07-05ID14517.
Conflicts of Interest
The authors declare no conflicts of interest.
References
- Blanton, P.S. Physical Test Report for Drop Test of a 9975 Radioactive Material Shipping Packaging. WSRC-RP-97-00944. 1997. Available online: https://www.osti.gov/servlets/purl/565502 (accessed on 13 April 2025).
- Snow, S.; Morton, D.K.; Rahl, T.E.; Ware, A.G. Preliminary Drop Testing Results to Validate an Analysis Methodology for Accidental Drop Events of Containers for Radioactive Materials; American Society of Mechanical Engineers Pressure Vessels and Piping: Atlanta, GA, USA, 2001. [Google Scholar]
- Snow, S.; Morton, D.K.; Rahl, T.E.; Blandford, R.K.; Hill, T.J. Drop Testing of DOE Spent Nuclear Fuel Canisters; American Society of Mechanical Engineers Pressure Vessell and Piping: Denver, CO, USA, 2005. [Google Scholar]
- Morton, D.K.; Snow, S.D.; Rahl, T.E.; Blandford, R.K. Impact Testing of Stainless-Steel Material at Room and Elevated Temperatures. In Proceedings of the ASME Pressure Vessels and Piping Conference, San Antonio, TX, USA, 22–26 July 2007. [Google Scholar] [CrossRef]
- Blandford, R.K.; Morton, D.K.; Snow, S.D.; Rahl, T.E. Tensile Stress-Strain Results for 304L and 316L Stainless Steel Plate at Temperature. In Proceedings of the ASME Pressure Vessels and Piping Conference, San Antonio, TX, USA, 22–26 July 2007. [Google Scholar] [CrossRef]
- Morton, D.K.; Snow, S.D.; Rahl, T.E.; Blandford, R.K.; Hill, T.J. Can DOE Canister Containment Drop Be Maintained After Accidental Drop Events? 2007. Available online: https://www.researchgate.net/publication/294629784_Can_DOE_canister_containment_drop_be_maintained_after_accidental_drop_events (accessed on 13 April 2025).
- Morton, D.K.; Blandford, R.K.; Snow, S.D. Impact Testing of Stainless-Steel Material at Cold Temperatures. In Proceedings of the ASME Pressure Vessels and Piping Conference, Chicago, IL, USA, 27–31 July 2008. [Google Scholar] [CrossRef]
- Snow, S.D.; Morton, D.K.; Pleins, E.L.; Keating, R. Strain-Based Acceptance Criteria for Energy-Limited Events; Pressure Vessels and Piping Division (Publication) PVP 7; American Society of Mechanical Engineers: 2009. Available online: https://asmedigitalcollection.asme.org/PVP/proceedings/PVP2008/48302/183/330653 (accessed on 13 April 2025).
- Wu, H.J.; Tseng, C.C.; Cheng, S.S. A Numerical Analysis for a BWR Fuel Assembly Drop Event. J. Nucl. Sci. Technol. 2006, 43, 1068–1073. [Google Scholar] [CrossRef]
- Jakšić, N.; Nilsson, K.F. Finite element modelling of the 1-m drop test on a steel bar for the CASTOR cask. Nucl. Eng. Des. 2009, 239, 201–213. [Google Scholar] [CrossRef]
- Aquaro, D.; Zaccari, N.; Prinzio, M.D.; Forasassi, G. Numerical and experimental analysis of the impact of a nuclear spent fuel cask. Nucl. Eng. Des. 2010, 240, 706–712. [Google Scholar] [CrossRef]
- Kim, H.J.; Yim, J.S.; Lee, B.H.; Oh, J.Y.; Tahk, Y.W. Drop Impact Analysis of Plate-Type Fuel Assembly in Research Reactor. Nucl. Eng. Technol. 2014, 46, 529–540. [Google Scholar] [CrossRef]
- Lin, M.; Wang, J.; Wu, B.; Li, Y. Dynamic analysis of dry storage canister and the spent fuels inside under vertical drop in HTR-PM. Ann. Nucl. Energy 2021, 154, 108030. [Google Scholar] [CrossRef]
- Oka, J.M.; Vaidya, R.U.; Davis, J.T.; Webber, K.W.; Walzel, R.K. Nuclear material container drop testing using finite element analysis with verification using digital Image correlation. Nucl. Eng. Des. 2024, 421, 113057. [Google Scholar] [CrossRef]
- Bao, Y. Prediction of Ductile Crack Formation in Uncracked Bodies. Ph.D. Dissertation, Massachusetts Institute of Technology, Cambridge, MA, USA, 2003. [Google Scholar]
- Bao, Y.; Wierzbicki, T. A Comparative Study on Various Ductile Crack Formation Criteria. J. Eng. Mater. Technol. 2004, 126, 314–324. [Google Scholar] [CrossRef]
- Bao, Y.; Wierzbicki, T. On fracture locus in the equivalent strain and stress triaxiality space. Int. J. Mech. Sci. 2005, 46, 81–98. [Google Scholar] [CrossRef]
- Gurson, A.L. Continuum Theory of Ductile Rupture by Void Nucleation and Growth. Part I. Yield Criteria and Flow Rules for Porous Ductile Media. University of North Texas Libraries, UNT Digital Library. 1975. Available online: https://digital.library.unt.edu/ark:/67531/metadc1448204/ (accessed on 31 March 2025).
- Johnson, G.R.; Cook, W.H. Fracture Characteristics of Three Metals Subjected to Various Strains, Strain Rates, Temperatures and Pressures. Eng. Fract. Mech. 1985, 21, 31–48. [Google Scholar] [CrossRef]
- Rice, J.R.; Tracey, D.M. On the ductile enlargement of voids in triaxial stress fields. J. Mech. Phys. Solids 1969, 17, 201–217. [Google Scholar] [CrossRef]
- McClintock, F.A.; Irwin, G.R. Plasticity Aspects of Fracture Mechanics in “Fracture Toughness Testing and Its Applications, ASTM STP 381”; Brown, W.F., Ed.; American Society for Testing and Materials: Philadelphia, PA, USA, 1965. [Google Scholar]
- McClintock, F.A. A criterion of ductile fracture by the growth of holes. J. Appl. Mech. 1968, 35, 363–371. [Google Scholar] [CrossRef]
- McClintock, F.A. Uniaxial Stress-Strain Relations for Surface Roughening in Behavior of Defects at High Temperatures; Ainsworth, R.A., Skelton, R.P., Eds.; Mechanical Engineering Publications: London, UK, 1993. [Google Scholar]
- Hancock, J.; Mackenzie, A. On the mechanisms of ductile failure in high-strength steels subjected to multi-axial stress-states. J. Mech. Phys. Solids 1975, 24, 147–160. [Google Scholar] [CrossRef]
- Thomson, R.D.; Hancock, J.W. Ductile failure by void nucleation, growth and coalescence. Int. J. Fract. 1984, 26, 99–112. [Google Scholar] [CrossRef]
- Alves, M.; Jones, N. Influence of hydrostatic stress on failure of axisymmetric notched specimens. J. Mech. Phys. Solids 1999, 47, 643–667. [Google Scholar] [CrossRef]
- Mirone, G. Role of stress triaxiality in elastoplastic characterization and ductile failure prediction. Eng. Fract. Mech. 2007, 74, 1203–1221. [Google Scholar] [CrossRef]
- Yu, H.; Jeong, D. Application of a stress triaxiality dependent fracture criterion in the finite element analysis of unnotched Charpy specimens. Theor. Appl. Fract. Mech. 2010, 54, 54–62. [Google Scholar] [CrossRef]
- Choung, J.; Nam, W.; Lee, D.; Song, C.Y. Failure strain formulation via average stress triaxiality of an EH36 high strength steel. Ocean Eng. 2014, 91, 218–226. [Google Scholar] [CrossRef]
- Rodríguez-Millán, M.; Vaz-Romero, Á.; Arias, Á. Failure behavior of 2024-T3 aluminum under tension-torsion conditions. J. Mech. Sci. Technol. 2015, 29, 4657–4663. [Google Scholar] [CrossRef]
- Kanazawa, D.; Yoneyama, S.; Ushijima, K.; Naito, J.; Chinzei, S. Evaluating Stress Triaxiality and Fracture Strain of Steel Sheet Using Stereovision. In Advancement of Optical Methods in Experimental Mechanics; Conference Proceedings of the Society for Experimental Mechanics Series; Yoshida, S., Lamberti, L., Sciammarella, C., Eds.; Springer: Cham, Switzerland, 2017; Volume 3. [Google Scholar] [CrossRef]
- Brünig, M.; Gerke, S.; Schmidt, M. Damage and failure at negative stress triaxialities: Experiments, modeling and numerical simulations. Int. J. Plast. 2018, 102, 70–82. [Google Scholar] [CrossRef]
- Børvik, T.; Hopperstad, O.; Berstad, T. On the influence of stress triaxiality and strain rate on the behavior of a structural steel. Part II. Numerical study. Eur. J. Mech.—A/Solids 2003, 22, 15–32. [Google Scholar] [CrossRef]
- Anderson, D.; Winkler, S.; Bardelcik, A.; Worswick, M. Influence of stress triaxiality and strain rate on the failure behavior of dual-phase DP780 steel. Mater. Des. 2018, 60, 198–207. [Google Scholar] [CrossRef]
- Huang, J.; Guo, Y.; Qin, D.; Zhou, Z.; Li, D.; Li, Y. Influence of stress triaxiality on the failure behavior of Ti-6Al-4V alloy under a broad range of strain rates. Theor. Appl. Fract. Mech. 2018, 97, 48–61. [Google Scholar] [CrossRef]
- Li, Z.; Lu, S.; Yang, W.; Zhang, T. Study on the Ductile Fracture Rule of 6061-T6 Aluminum Alloy Sheet Under Different Strain Conditions. Trans. Indian Inst. Met. 2019, 72, 2721–2728. [Google Scholar] [CrossRef]
- Seidt, J.D.; Park, C.-K.; Buyuk, M.; Lowe, R.L.; Wang, L.; Carney, K.S.; Du Bois, P.; Gilat, A.; Kan, C.-D. An experimental investigation of the influence of the state of stress on the ductile fracture of 2024–T351 Aluminum. J. Eng. Mater. Technol. 2022, 144, 041006. [Google Scholar] [CrossRef]
- Zhang, X.; Wen, J.; Zhang, X.; Wang, X.; Tu, S. Effects of the stress state on plastic deformation and ductile failure: Experiment and numerical simulation using a newly designed tension-shear specimen. Fatigue Fract. Eng. Mater. Struct. 2019, 42, 2079–2092. [Google Scholar] [CrossRef]
- Kiran, R.; Khandelwal, K. Experimental Studies and Models for Ductile Fracture in ASTM A992 Steels at High Triaxiality. J. Struct. Eng.-ASCE 2014, 140, 04013044. [Google Scholar] [CrossRef]
- Cho, Y.; Lee, C.; Yee, J.-J.; Kim, D.-K. Modeling of Ductile Fracture for SS275 Structural Steel Sheets. Appl. Sci. 2021, 11, 5392. [Google Scholar] [CrossRef]
- Othmen, K.B.; Haddar, N.; Jegat, A.; Manach, P.-Y.; Elleuch, K. Ductile fracture of AISI 304L stainless steel sheet in stretching. Int. J. Mech. Sci. 2019, 172, 105404. Available online: https://www.sciencedirect.com/science/article/pii/S0020740319328693 (accessed on 13 April 2025). [CrossRef]
- Seo, J.M.; Kim, H.T.; Kim, Y.J.; Yamada, H.; Kumagai, T.; Tokunaga, H.; Miura, N. Effect of strain rate and stress triaxiality on fracture strain of 304 stainless steels for canister impact simulation. Nucl. Eng. Technol. 2022, 54, 2386–2394. [Google Scholar] [CrossRef]
- Xing, M.; Liu, Y.; Lu, J.; Huang, X.; Wang, X.; Xue, J.; Zhang, F.; Du, F. Fracture Criterion Calibration and Finite Element Simulation in SUS304 Stainless Steel. Materials 2024, 17, 5711. [Google Scholar] [CrossRef]
- ABAQUS. Dassault Systèmes R2021x User Assistance; ABAQUS: 2021. Available online: https://eu1.iam.3dexperience.3ds.com/login?service=https%3a%2f%2fhelp.3ds.com%2fHelpProductsDS.aspx (accessed on 13 April 2025).
- ASTM E8/E8M 2021; Standard Test Methods for Tension Testing of Metallic Materials. ASTM International: West Conshohocken, PA, USA, 2021. [CrossRef]
- ASTM E9 2019; Standard Test Methods of Compression Testing of Metallic Materials at Room Temperature. ASTM International: West Conshohocken, PA, USA, 2019.
- Driemeier, L.; Brünig, M.; Micheli, G.; Alves, M. Experiments on stress-triaxiality dependence of material behavior of aluminum alloys. Mech. Mater. 2010, 42, 207–217. Available online: https://www.sciencedirect.com/science/article/pii/S0167663609001999 (accessed on 13 April 2025). [CrossRef]
- Zhu, P.; Zhang, Q.; Xu, H.; Ouyang, Y. Experimental and numerical investigation on plasticity and fracture behaviors of aluminum alloy 6061-T6 extrusions. Arch. Civ. Mech. Eng. 2021, 21, 88. [Google Scholar] [CrossRef]
- Fu, Q.; Li, D.; Song, H.; Liu, X.; Xu, J.; Jiang, N. Shear Fracture Criterion of Advanced High-Strength Steel Based on Stress Triaxiality and Equivalent Strain. J. Eng. Mater. Technol. 2022, 145, 1–24. [Google Scholar] [CrossRef]
- Roy, B.K.; Korkolis, Y.P.; Arai, Y.; Araki, W.; Iijima, T.; Kouyama, J. Plastic deformation of AA6061-T6 at elevated temperatures: Experiments and modeling. Int. J. Mech. Sci. 2022, 216, 106943. Available online: https://www.sciencedirect.com/science/article/pii/S0020740321006536 (accessed on 13 April 2025). [CrossRef]
- Yan, J.B.; Kong, G.; Zhang, L. Low-temperature tensile behaviors of 6061-T6 aluminum alloy: Tests, analysis, and numerical simulation. Structures 2023, 56, 105054. [Google Scholar] [CrossRef]
- Ganjiani, M.; Ghobadi, S.; Faraji, G. Evaluating the ductile failure characteristics of CuZn30 brass under different stress conditions. Eng. Fail. Anal. 2025, 167 Pt A, 108932. Available online: https://www.sciencedirect.com/science/article/pii/S1350630724009786 (accessed on 13 April 2025). [CrossRef]
- Nam, A.; Choung, J. Prediction of failure strain according to stress triaxiality of a high strength marine structural steel. In Collision and Grounding of Ships and Offshore Structures; Taylor & Francis Group: London, UK, 2013. [Google Scholar] [CrossRef]
- Baruscotti, A.; Miori, N.; Concli, F. Determination of the Fracture Locus of a Cor-Ten Steel at Low and High Triaxiality Ranges. Appl. Sci. 2025, 15, 3569. [Google Scholar] [CrossRef]


Disclaimer/Publisher’s Note: The statements, opinions and data contained in all publications are solely those of the individual author(s) and contributor(s) and not of MDPI and/or the editor(s). MDPI and/or the editor(s) disclaim responsibility for any injury to people or property resulting from any ideas, methods, instructions or products referred to in the content. |
© 2025 by the authors. Licensee MDPI, Basel, Switzerland. This article is an open access article distributed under the terms and conditions of the Creative Commons Attribution (CC BY) license (https://creativecommons.org/licenses/by/4.0/).