A Quantitative Comparison among Different Algorithms for Defects Detection on Aluminum with the Pulsed Thermography Technique


Abstract
:1. Introduction
2. Theory: Pulsed Thermography
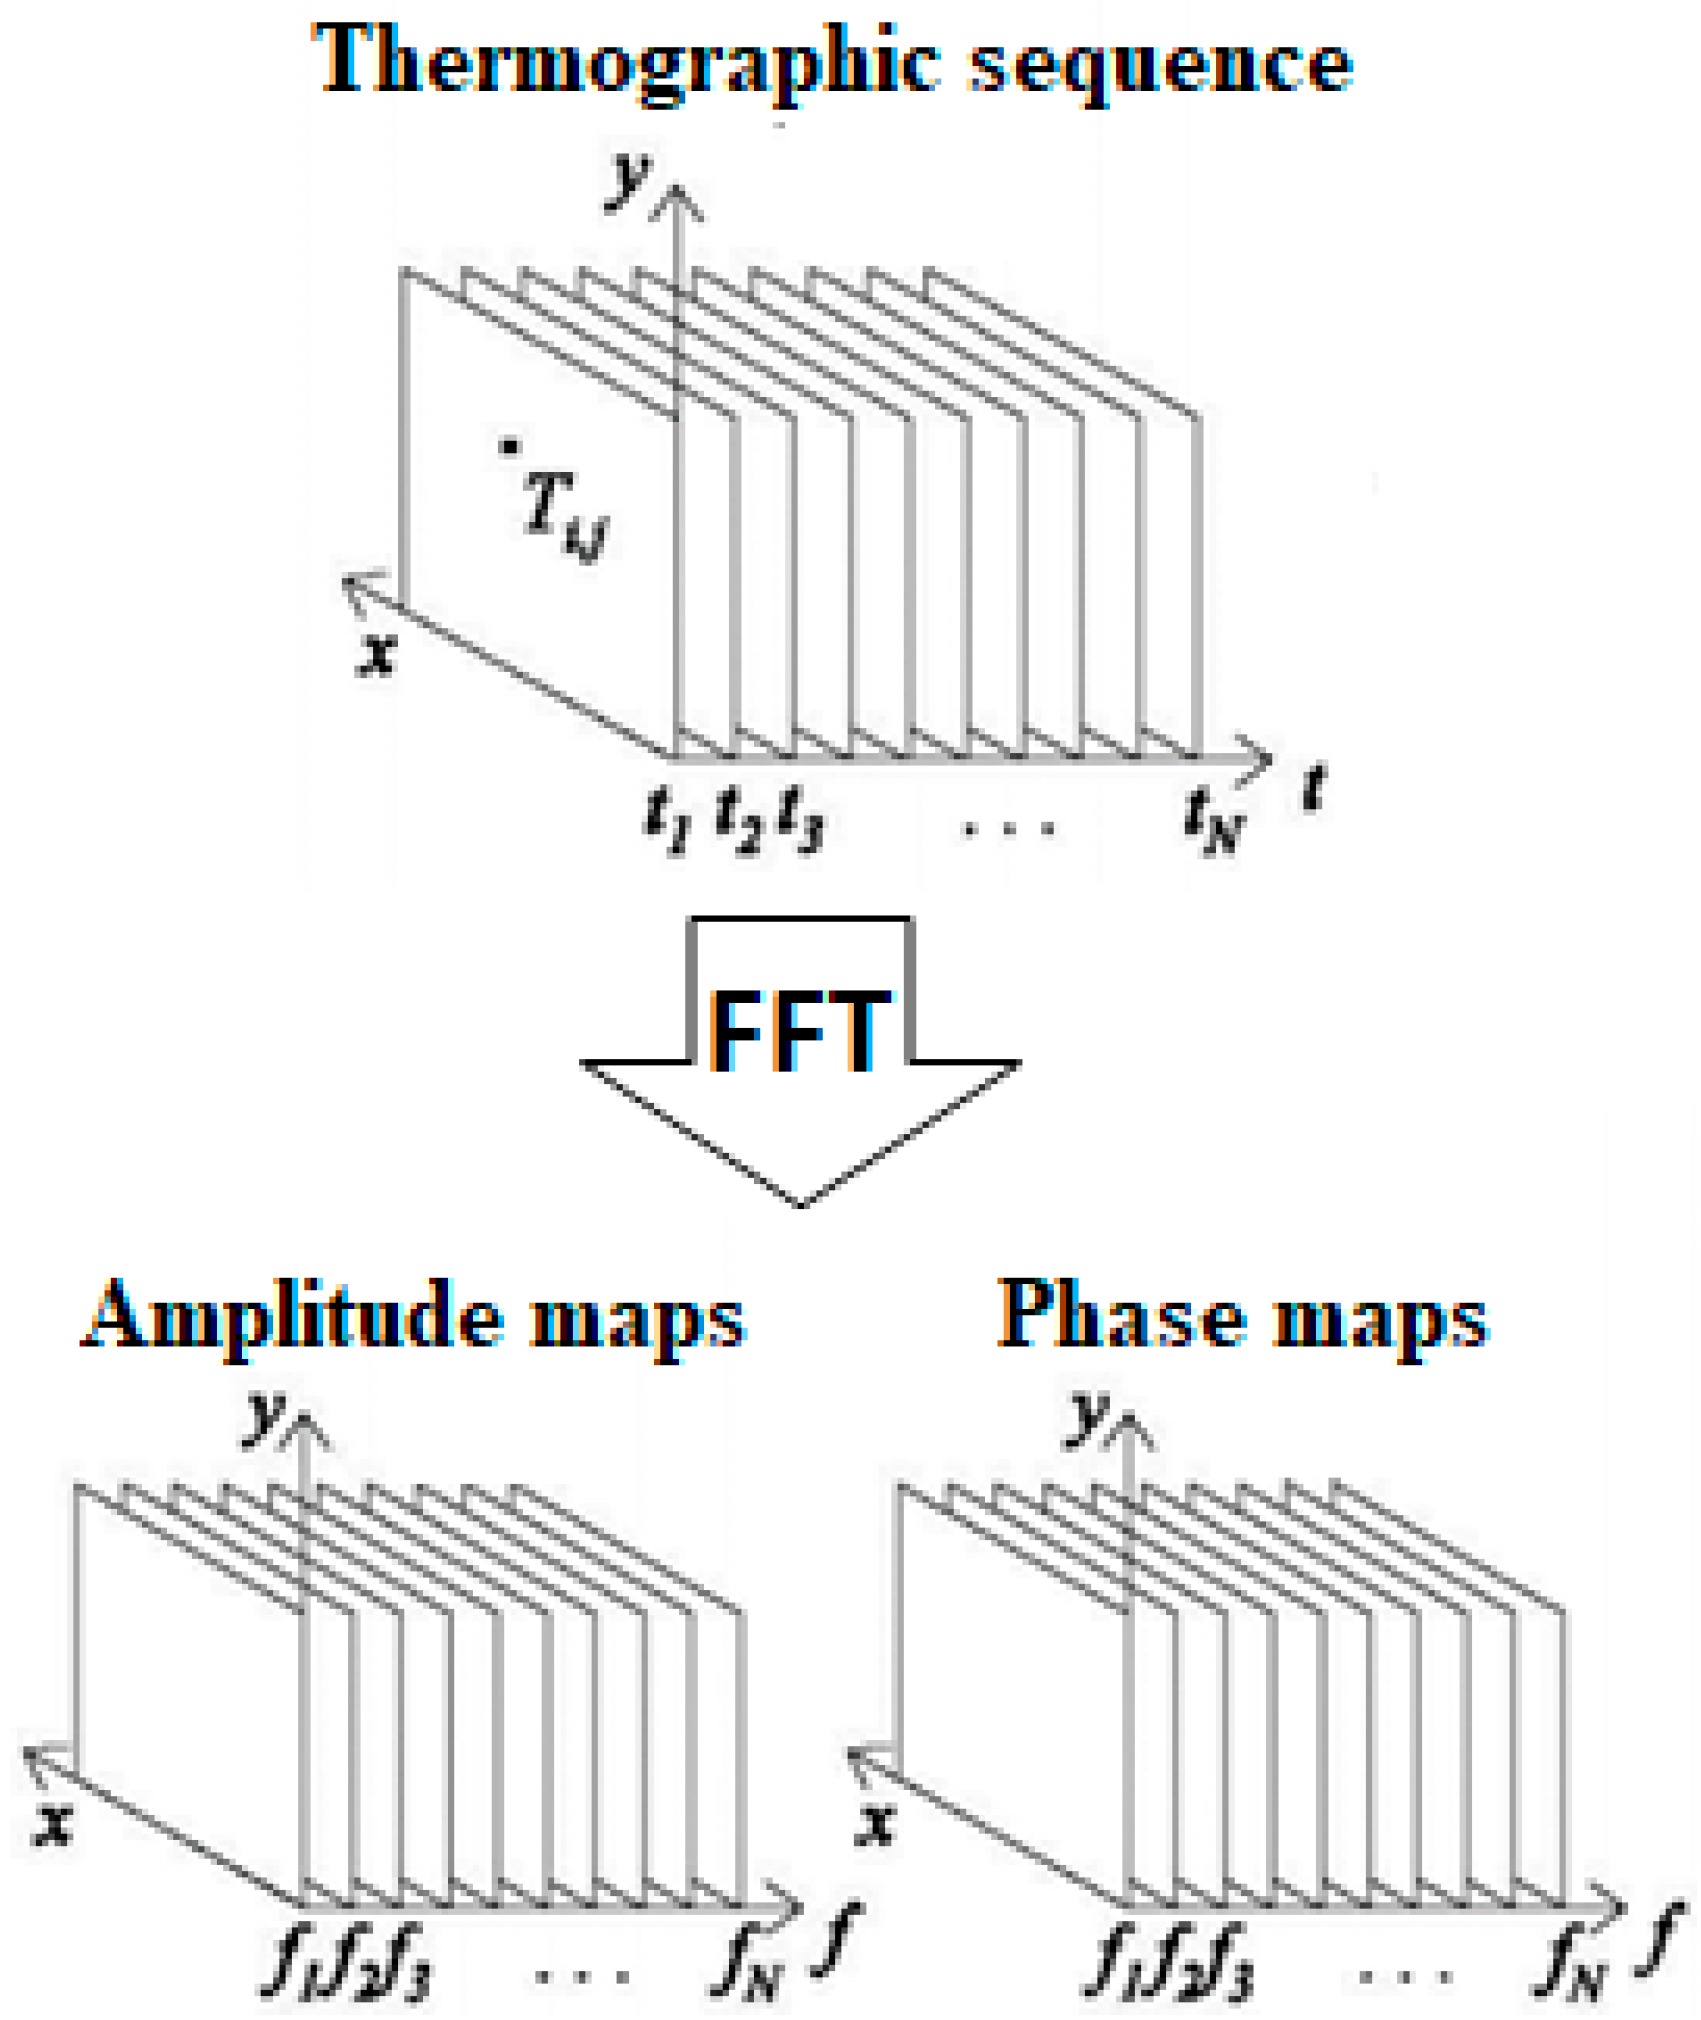
2.1. Post-Processing Algorithms: Pulsed Phase Thermography (PPT)
2.2. Post-Processing Algorithms: Thermal Signal Reconstruction (TSR)
2.3. Post-Processing Algorithms: Principal Component Thermography (PCT)
2.4. Post-Processing Algorithms: Slope and R2
3. Materials and Methods
3.1. Materials and Experimental Set-Up
3.2. Processing of Thermographic Data
- Importing of the thermographic sequence (3D matrix);
- Subtracting of the average of the first ten cold frames to the whole sequence to obtain the ΔT values over time;
- Adding an offset value to the pixels in the frames where a negative ΔT value is reached. These pixels occur in the last frames of the sequence and represent a small part of the frame. Hence, they do not affect normalization; this step evaluates ΔT values in the logarithmic scale.
- Normalising the local temperature values at any time by dividing them to the value evaluated at time t’ sufficiently near to the pulse occurrence (the time t’ corresponds to the instant in which the maximum ΔT is reached) [19].
- The 3D final temperature matrix is divided in seven intervals over time in order to process the data with the proposed algorithms.
- -
- The fft function for the PPT algorithm and the angle and the abs functions to obtain the phase and the amplitude maps, respectively;
- -
- The svd function for the PCT algorithm;
- -
- The polifyt, polyval and polyder functions for the TSR (5°), Slope and R2 algorithms.
4. Results
4.1. Preliminary Analysis
- number of detected defects;
- maximum SBC;
4.2. Comparison of the Different Algorithms in Terms of SBC
4.3. Comparison of the Different Algorithms in Terms of the Number of Detected Defects
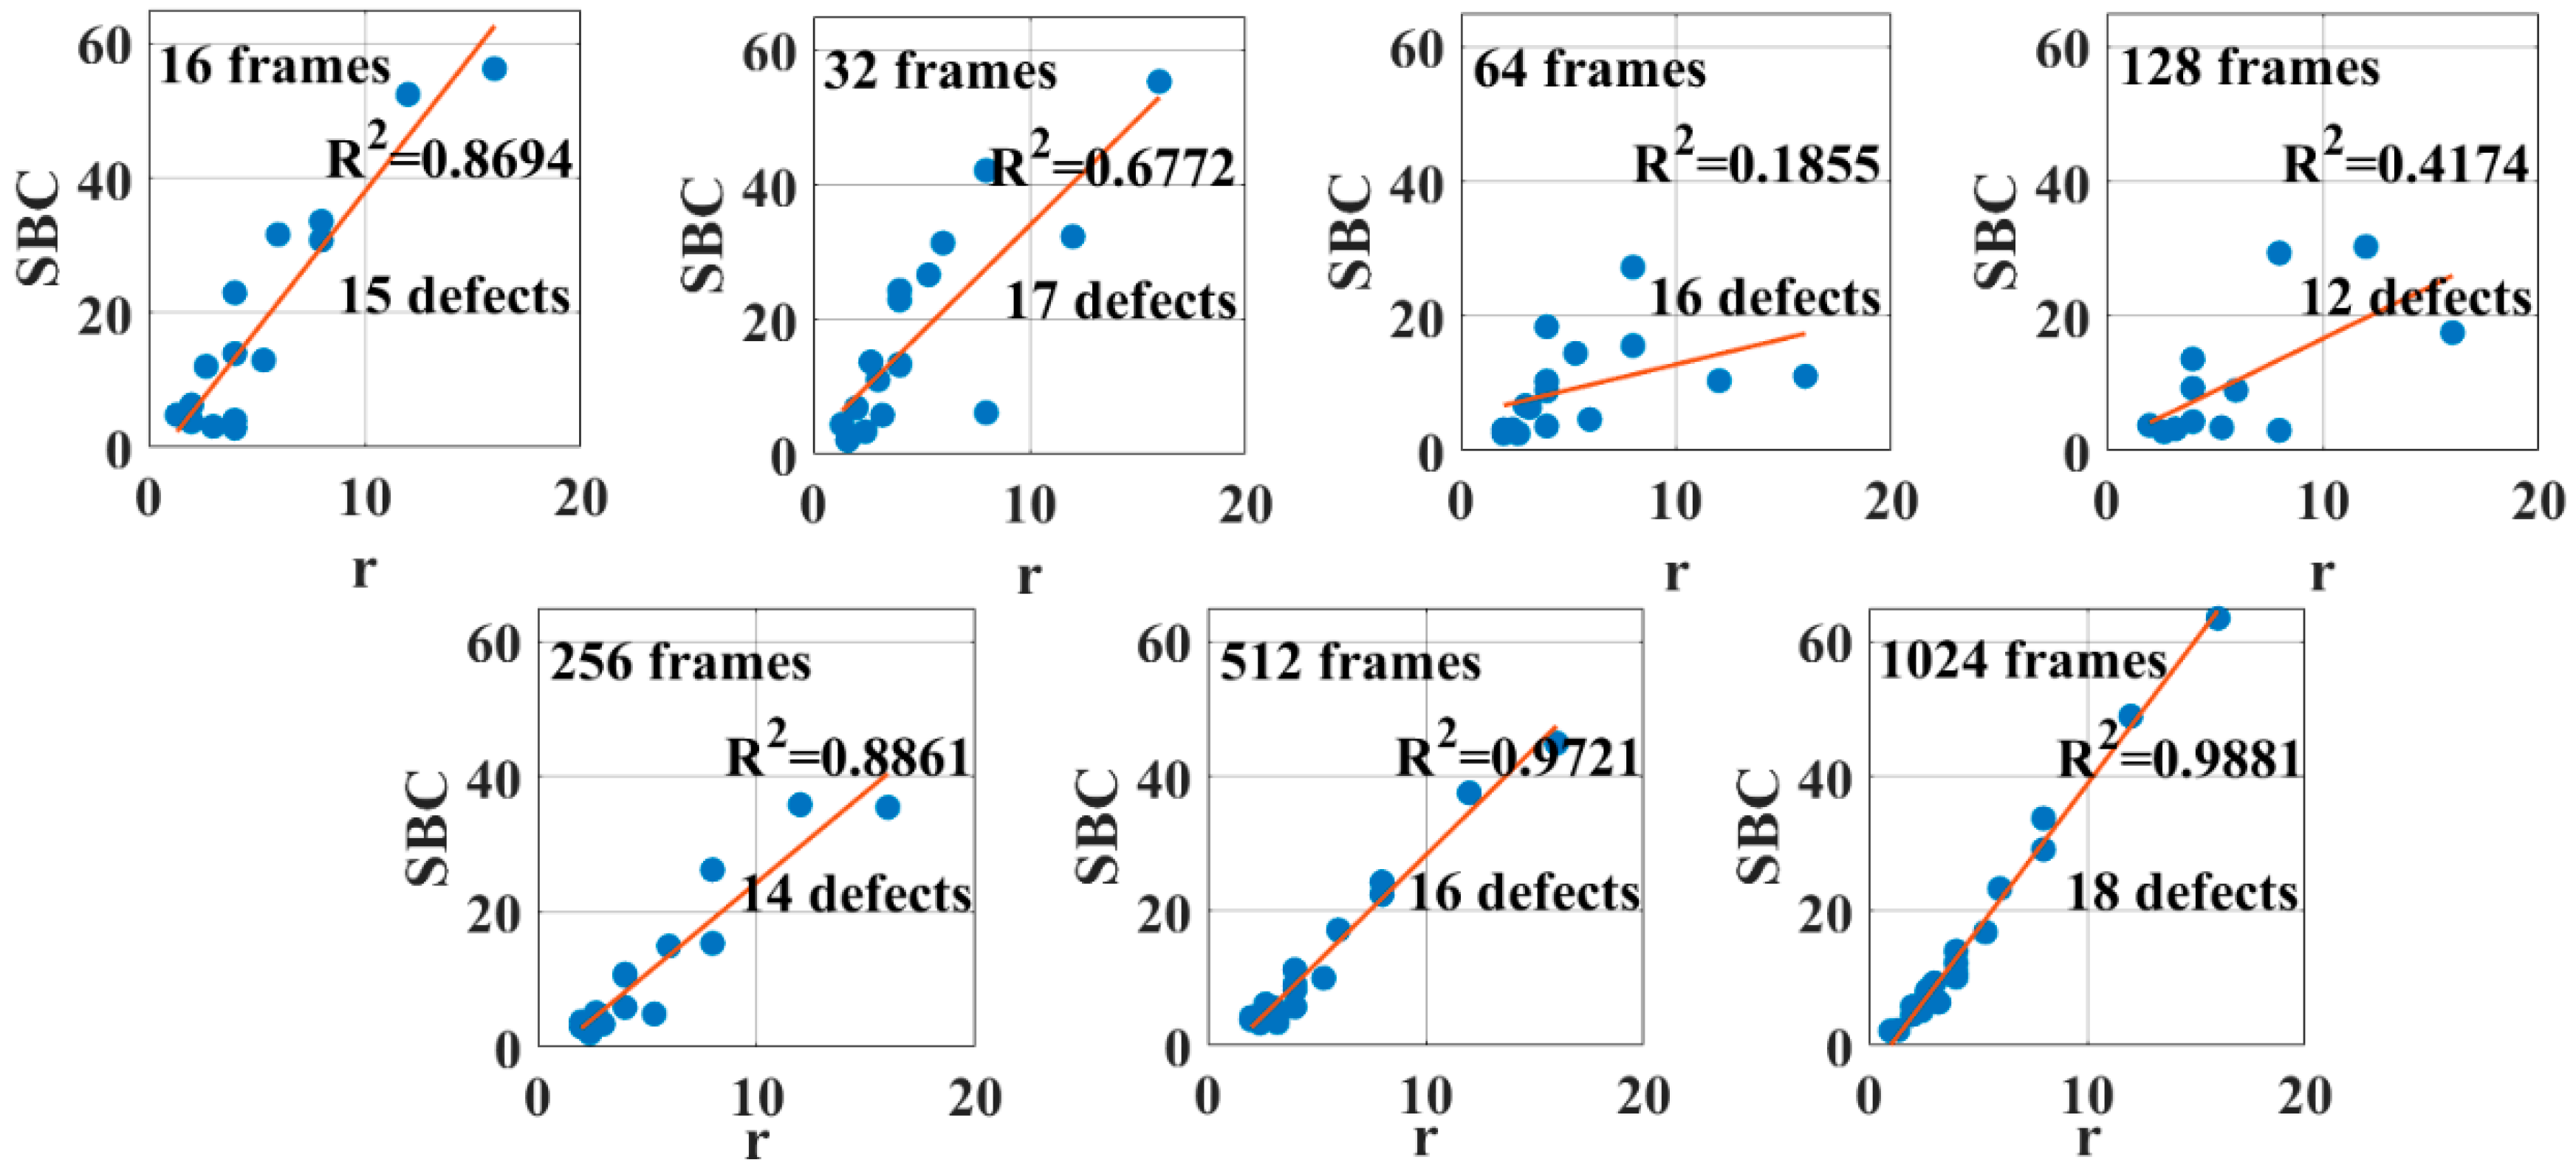
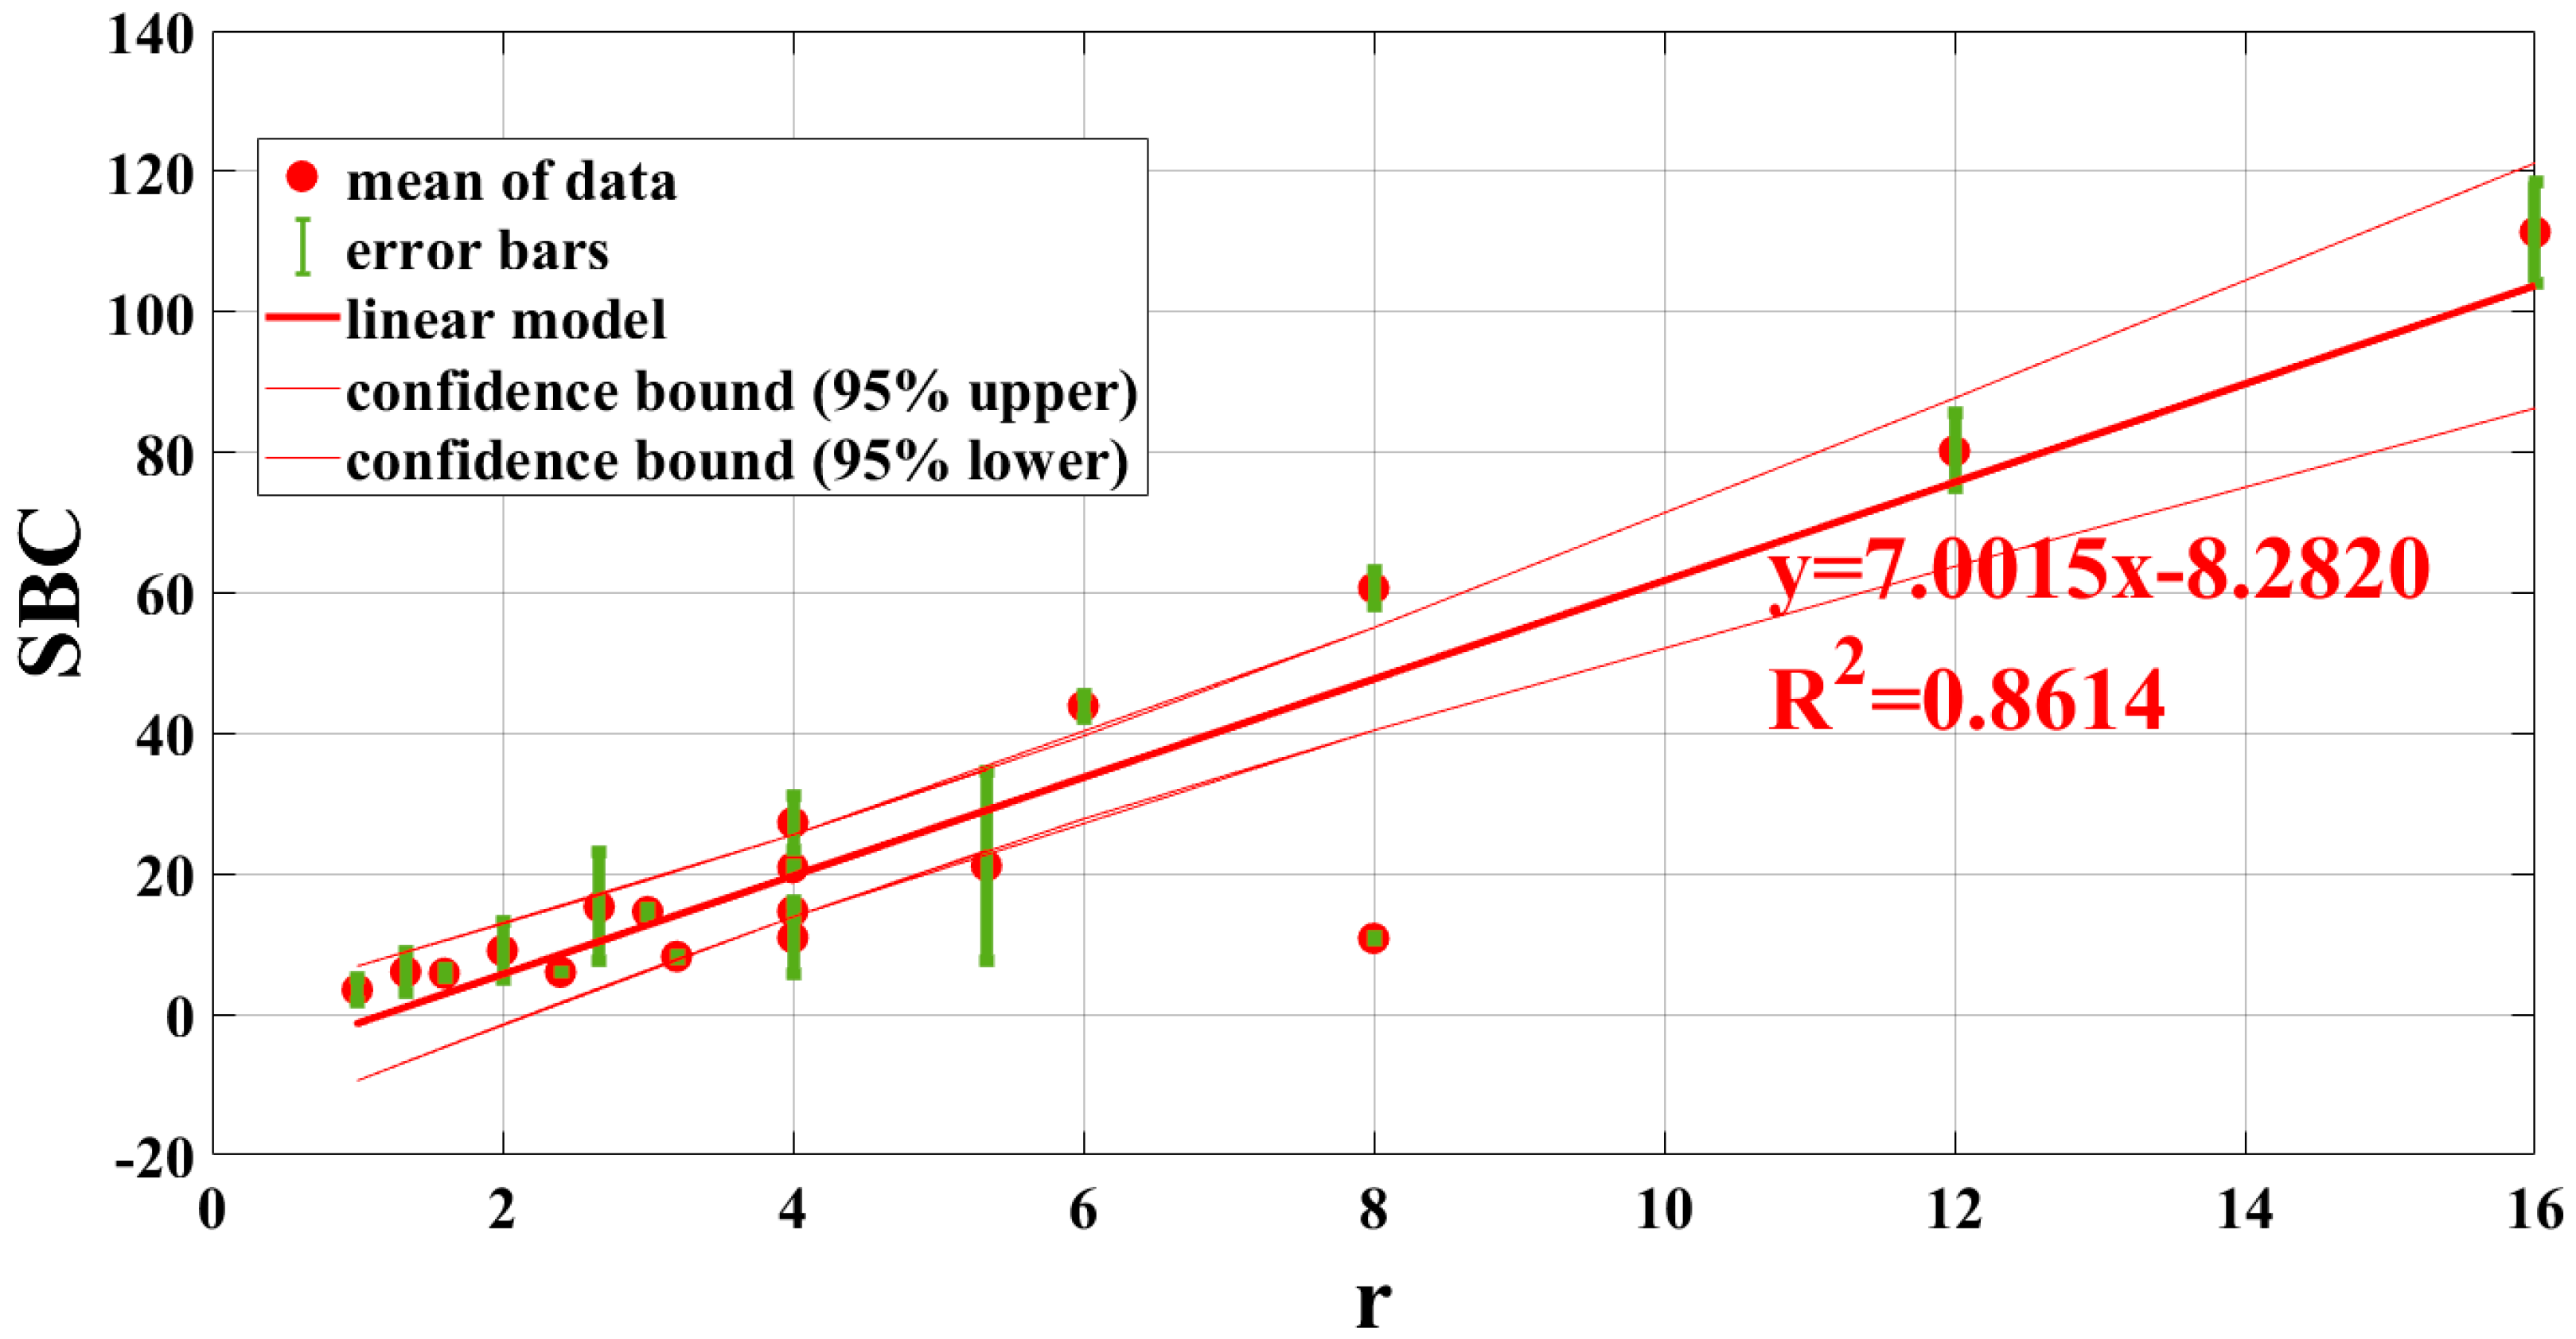
4.4. Comparison of the Different Algorithms: Correlation between SBC and r
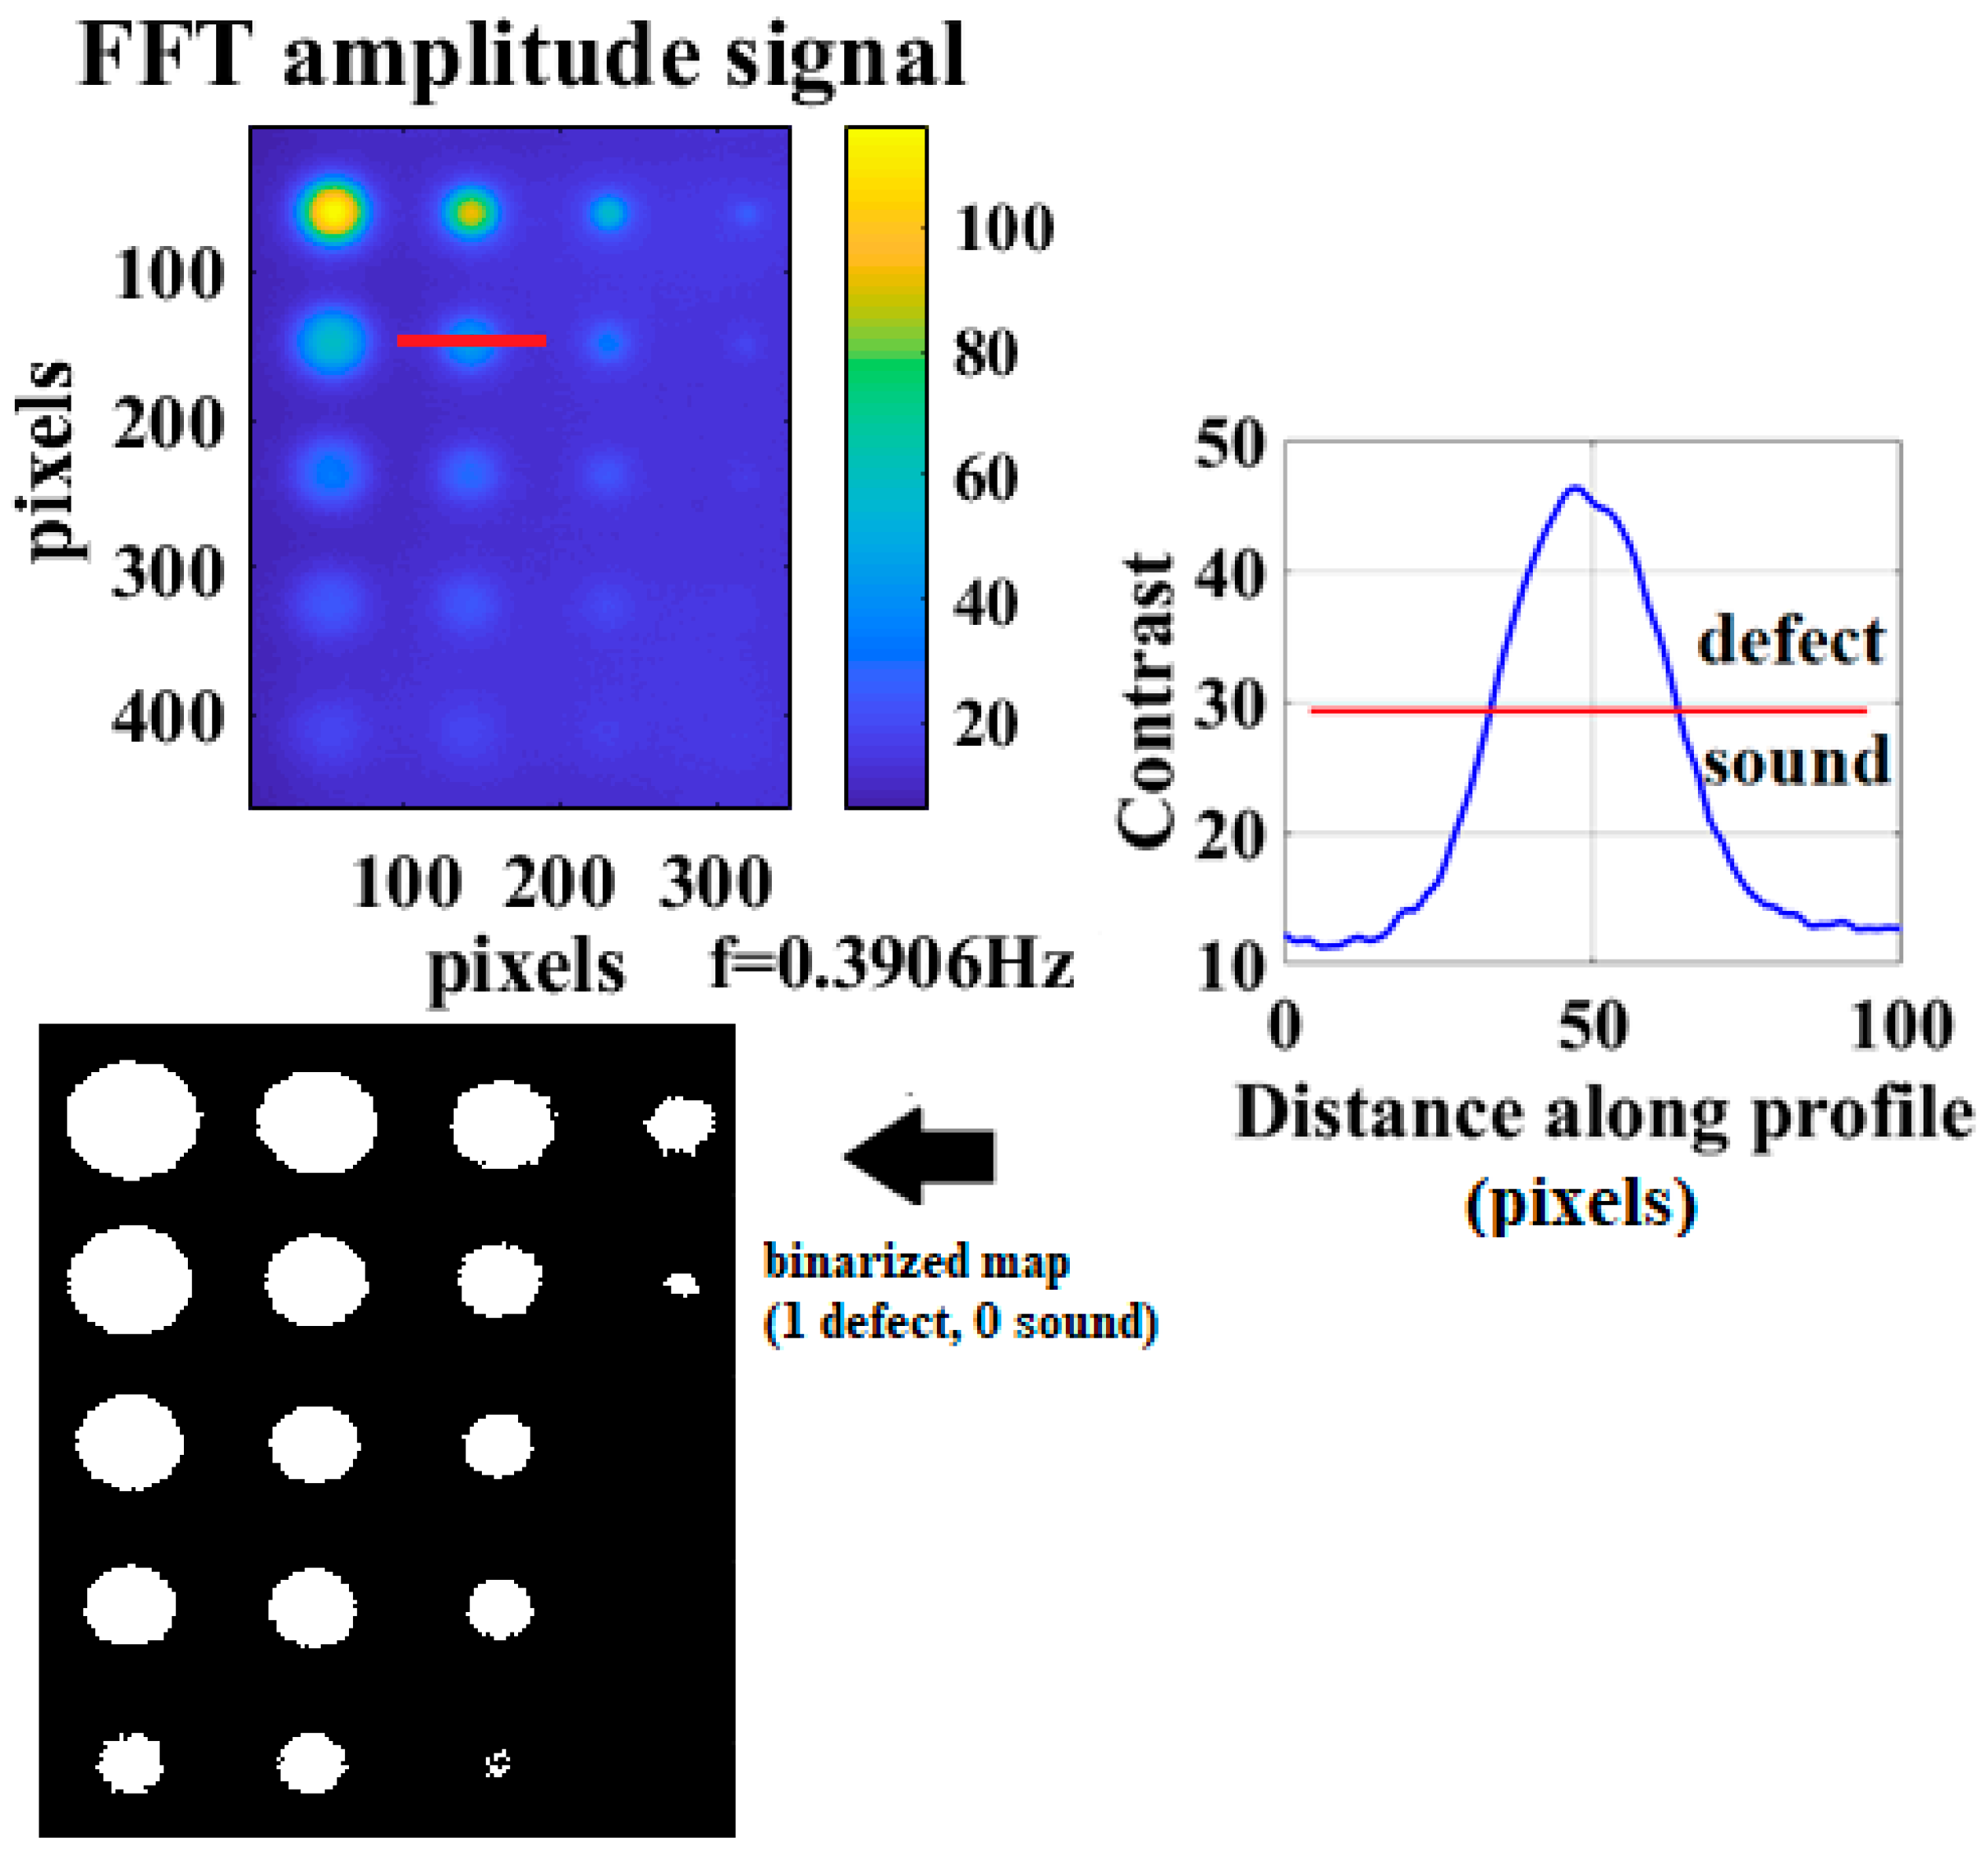
4.4.1. Quantitative Analysis: The Proposed Procedure Based on the Correlation between the SBC and the Aspect Ratio r
4.5. Comparison of Different Algorithms in Terms of Maximum SBC, Number of Detected Defects and the Correlation SBC vs. r
5. Discussion
6. Conclusions
- the PCT algorithm shows the maximum SBC value;
- the R2 algorithm is the faster one since it finds the greatest number of defects (19/20) with only 32 analyzed frames;
- the 2nd derivative (TSR), the slope, the amplitude, and the PCT algorithms seem to obtain a very good correlation between the SBC and the aspect ratio r with a square correlation coefficient of R2 > 0.9.
- the PCT algorithm, in this case, has returned a very good compromise on the results: the greatest number of detected defects with a very good SBC value and a good correlation between the SBC and the aspect ratio r, but with 1024 frames.
- the application of a new proposed procedure applied on the amplitude data (PPT) obtains the size and the depth of a defect with errors less than 5%;
Author Contributions
Funding
Conflicts of Interest
References
- Wilczek, A.; Długosz, P.; Hebda, M. Porosity Characterization of Aluminium Castings by Using Particular Non-destructive Techniques. J. Nondestruct. Eval. 2015, 34, 26. [Google Scholar] [CrossRef]
- Postolache, O.; Pereira, M.D.; Ramos, H.G.; Lopes Riberio, A. NDT on Aluminum Aircraft Plates based on Eddy Current Sensingand Image Processing. In Proceedings of the I2MTC 2008—IEEE International Instrumentation and Measurement Technology Conference, Victoria, BC, Canada, 12–15 May 2008. [Google Scholar]
- Bo, H.; Yu, R.; Zou, H. Magnetic non-destructive testing method for thin-plate aluminum alloys. NDT E Int. 2012, 47, 66–69. [Google Scholar]
- Maldague, X.P.V. Theory and Practice of Infrared Technology of Non-Destructive Testing; John Wiley & Sons, Inc.: Hoboken, NJ, USA, 2001; ISBN 0-471-18190-0. [Google Scholar]
- Hidalgo-Gato, R.; Andrés, J.R.; López-Higuera, J.M.; Madruga, F.J. Quantification by Signal to Noise Ratio of Active Infrared Thermography Data Processing Techniques. Opt. Photonics J. 2013, 3, 20–26. [Google Scholar] [CrossRef]
- Tamborrino, R.; Palumbo, D.; Galietti, U.; Aversa, P.; Chiozzi, S.; Luprano, V.A.M. Assessment of the effect of defects on mechanical properties of adhesive bonded joints by using non-destructive methods. Compos. Part B 2016, 91, 337–345. [Google Scholar] [CrossRef]
- Pitarresi, G.; Galietti, U. A quantitative analysis of the thermoelastic effect in CFRP composite materials. Strain 2010, 46, 446–459. [Google Scholar] [CrossRef]
- Pittaresi, G.; Conti, A.; Galietti, U. Investigation on the influence of the surface resin rich layer on the thermoelastic signal from different composite laminate lay-ups. Appl. Mech. Mater. 2005, 3–4, 167–172. [Google Scholar] [CrossRef]
- Beata, O.-T. Time-resolved evaluation of inductive pulse heating measurements. QIRT J. 2009, 6, 3–19. [Google Scholar]
- Beata, O.T. Lock-in inductive thermography for surface crack detection. In Proceedings of the Proc. SPIE 10661, Thermosense: Thermal Infrared Applications XL, Orlando, FL, USA, 14 May 2018. [Google Scholar]
- Roemer, J.; Uhl, T.; Piczonka, L. Laser spot thermography for crack detection in aluminum structures. In Proceedings of the 7th International Symposium on NDT in Aerospace, Bremen, Germany, 16–18 November 2015. [Google Scholar]
- Maldague, X.P.; Shiryaev, V.V.; Boisvert, E.; Vavilov, V.P. Transient thermal nondestructive testing (NDT) of defects in aluminum panels. In Proceedings of the Proc. SPIE 2473, Thermosense XVII: An International Conference on Thermal Sensing and Imaging Diagnostic Applications, Orlando, FL, USA, 28 March 1995. [Google Scholar]
- Ibarra-Castanedo, C.; González, D.A.; Klein, M.; Pilla, M.; Vallerand, S.; Maldague, X. Infrared image processing and data analysis. Infrared Phys. Technol. 2004, 46, 75–83. [Google Scholar] [CrossRef]
- Ibarra-Castanedo, C.; Bendada, A.; Maldague, X. Image and signal processing techniques in pulsed thermography. GESTS Int. Trans. Comput. Sci. Eng. 2005, 22, 89–100. [Google Scholar]
- Ibarra-Castanedo, C. Quantitative Subsurface Defect Evaluation by Pulsed Phase Thermography: Depth Retrieval with the Phase. Ph.D. Thesis, Université Laval, Québec, QC, Canada, 2005. [Google Scholar]
- Ibarra-Castanedo, C.; González, D.A.; Maldague, X. Automatic Algorithm for Quantitative Pulsed Phase Thermography Calculations. In Proceedings of the 16th WCNDT—World Conference on Nondestructive Testing, Montreal, QC, Canada, 30 August–3 September 2004. [Google Scholar]
- Maldague, X.; Couturier, J.-P.; Marinetti, S.; Salerno, A.; Wu, D. Advances in pulsed phase thermography. QIRT J. 1996. [Google Scholar] [CrossRef]
- Sun, J. Analysis of data processing methods for pulsed thermal imaging characterization of delaminations. QIRT J. 2013, 10, 9–25. [Google Scholar] [CrossRef]
- Balageas, D.L. Defense and illustration of time-resolved pulsed thermography for NDE. QIRT J. 2012, 9, 3–32. [Google Scholar] [CrossRef]
- Shepard, S.M. Advances in Pulsed Thermography. In Proceedings of the Proc. SPIE—The International Society for Optical Engineering, Thermosense XXVIII, Orlando, FL, USA, 23 March 2001; Rozlosnik, A.E., Dinwiddie, R.B., Eds.; SPIE: Bellingham, WA, USA, 2001; Volume 4360, pp. 511–515. [Google Scholar]
- Roche, J.-M.; Balageas, D.L. Detection and characterization of composite real-life damage by the TSR-polynomial coefficients RGB-projection technique. In Proceedings of the Conference: XIIth Quantitative InfraRed Thermography Conference (QIRT 2014), Bordeaux, France, 7–11 July 2014. [Google Scholar] [CrossRef]
- Balageas, D.L.; Roche, J.M.; Leroy, F.H.; Gorbach, A.M. The thermographic signal reconstruction method: A powerful tool for the enhancement of transient thermographic images. In Proceedings of the ICB Seminar 2013 on Advances of IR-Thermal Imaging in Medicine, Warsaw, Poland, 30 June–3 July 2013. [Google Scholar]
- Benitez, H.; Ibarra-Castanedo, C.; Loaiza, H.; Caicedo, E.; Bendada, A.; Maldague, X. Defect Quantification with Thermographic Signal Reconstruction and Artificial Neural Networks. QIRT J. 2006. [Google Scholar] [CrossRef]
- Balageas, D.L.; Chapuis, B.; Deban, G.; Passilly, F. Improvement of the detection of defects by pulse thermography thanks to the TSR approach in the case of a smart composite repair patch. In Proceedings of the 10th International Conference on Quantitative InfraRed Thermography, Burnaby, BC, Canada, 22–24 June 2010. [Google Scholar]
- Rajic, N. Principal Component Thermography. In Defence Science & Technology; Airframes and Engines Division Aeronautical and Maritime Research Laboratory: Fairbairn, Canberra, Australia, 2002. [Google Scholar]
- Parvataneni, R. Principal Component Thermography for Steady Thermal Perturbation Scenarios. Ph.D. Thesis, Clemson University, Clemson, CO, USA, 2009. [Google Scholar]
- Rajic, N. Principal component thermography for flaw contrast enhancement and flaw depth characterisation in composite structures. Compos. Struct. 2002, 58, 521–528. [Google Scholar] [CrossRef]
- Duan, Y. Probability of Detection Analysis for Infrared Nondestructive Testing and Evaluation with Applications including a Comparison with Ultrasonic Testing. Ph.D. Thesis, Université Laval, Québec, QC, Canada, 2014. [Google Scholar]
- Ibarra-Castanedo, C.; Bendada, A.; Maldague, X. Thermographic Image Processing for NDT. In Proceedings of the IV Conferencia Panamericana de END, Buenos Aires, Argentina, 22–26 October 2007; pp. 1–12. [Google Scholar]
- Ibarra-Castanedom, C.; González, D.A.; Galmiche, F.; Bendada, A.; Maldague, X.P. On signal transforms applied to pulsed thermography (Chapter 5). Recent Res. Dev. Appl. Phys. 2006, 9, 101–127. [Google Scholar]
- Palumbo, D.; Galietti, U. Damage Investigation in Composite Materials by Means of New Thermal Data Processing Procedures. Strain 2016, 52, 276–285. [Google Scholar] [CrossRef]
- D’Accardi, E.; Palumbo, D.; Tamborrino, R.; Galietti, U. Quantitative analysis of thermographic data through different algorithms. Procedia Struct. Integrity 2017, 8, 354–367. [Google Scholar] [CrossRef]
- D’Accardi, E.; Palumbo, D.; Tamborrino, R.; Cavallo, P.; Galietti, U. Pulsed Thermography: Evaluation and quantitative analysis of defects through different post-processing algorithms. In Proceedings of the Conference QIRT 2018, Berlin, Germany, 25–29 June 2018. [Google Scholar] [CrossRef]
- Gruber, J.; Gresslehner, K.H.; Sekelja, J.; Mayr, G.; Hendorfer, G. Signal to Noise Ratio Threshold in Active Thermography. In Proceedings of the 6th International symposium for NDT in Aerospace, Madrid, Spain, 12–14 November 2014; p. 8. [Google Scholar]
- Giorleo, G.; Meola, C. Comparison between pulsed and modulated thermography in glass-epoxy laminates. NDT E Int. 2002, 35, 287–292. [Google Scholar]
- Popow, V.; Gurka, M. Determination of depth and size of defects in carbon-fiber-reinforced plastic with different methods of pulse thermography. In Proceedings of the SPIE 10599, Nondestructive Characterization and Monitoring of Advanced Materials, Aerospace, Civil Infrastructure, and Transportation XII, Denver, CO, USA, 27 March 2018. [Google Scholar] [CrossRef]
- Oswald-Tranta, B. Time and frequency behavior in TSR and PPT evaluation for flash thermography. QIRT J. 2017, 14, 164–184. [Google Scholar] [CrossRef]


| Numeration of Flat Bottom Holes (Figure 5) | Diameter | Depth |
|---|---|---|
| A1 A2 A3 A4 A5 | A 16 mm | A1 1 mm A2 2 mm A3 3 mm A4 4 mm A5 5 mm |
| B1 B2 B3 B4 B5 | B 12 mm | B1 1 mm B2 2 mm B3 3 mm B4 4 mm B5 5 mm |
| C1 C2 C3 C4 C5 | C 8 mm | C1 1 mm C2 2 mm C3 3 mm C4 4 mm C5 5 mm |
| D1 D2 D3 D4 D5 | D 4 mm | D1 1 mm D2 2 mm D3 3 mm D4 4 mm D5 5 mm |
| Algorithm | Maximum SBC |
|---|---|
| PCT (2nd principal component) | 49.11 |
| TSR 2nd derivative | 46.06 |
| TSR 1st derivative | 45.47 |
| R2 | 28.96 |
| Slope | 28.74 |
| PPT (phase) | 21.89 |
| PPT (amplitude) | 10.62 |
| Number of Analyzed Frames | Square of Correlation Coefficient (R2) | Number of Detected Defects |
|---|---|---|
| 16 frames | 0.87 | 15 defects |
| 32 frames | 0.68 | 17 defects |
| 64 frames | 0.19 | 16 defects |
| 128 frames | 0.42 | 12 defects |
| 256 frames | 0.89 | 14 defects |
| 512 frames | 0.97 | 16 defects |
| 1024 frames | 0.99 | 18 defects |
| Algorithm | Number of Analyzed Frames | Linearity (R2) |
|---|---|---|
| TSR 1st derivative | 1024 frames | 0.86 |
| TSR 2nd derivative | 256 frames | 0.92 |
| PPT (phase) | 128 frames | 0.49 |
| PPT (amplitude) | 512 frames | 0.98 |
| PCT (2nd principal component) | 1024 frames | 0.96 |
| R2 | 512 frames | 0.64 |
| Slope | 1024 frames | 0.98 |
| Defect B2 | Nominal Size | Estimate Size | %Relative Error | Nominal Depth | Estimate Depth | %Relative Error |
| 12 mm | 12.59 mm | 4.92% | 2.0 mm | 2.05 mm | 2.27% |
| Algorithm | Number of Analyzed Frames (Linearity Optimization) | Linearity (R2) | Number of Analyzed Frames (Number of Detected Defects) | Number of Detected Defects |
|---|---|---|---|---|
| TSR 1st derivative | 1024 frames | 0.86 | 128 frames | 18 |
| TSR 2nd derivative | 256 frames | 0.92 | 512 frames | 19 |
| PPT (phase) | 128 frames | 0.49 | 128 frames | 18 |
| PPT (amplitude) | 512 frames | 0.98 | 256 frames | 17 |
| PCT (2nd principal component) | 1024 frames | 0.96 | 1024 frames | 19 |
| R2 | 512 frames | 0.64 | 32 frames | 19 |
| Slope | 1024 frames | 0.98 | 1024 frames | 17 |
© 2018 by the authors. Licensee MDPI, Basel, Switzerland. This article is an open access article distributed under the terms and conditions of the Creative Commons Attribution (CC BY) license (http://creativecommons.org/licenses/by/4.0/).
Share and Cite
D’Accardi, E.; Palumbo, D.; Tamborrino, R.; Galietti, U. A Quantitative Comparison among Different Algorithms for Defects Detection on Aluminum with the Pulsed Thermography Technique. Metals 2018, 8, 859. https://doi.org/10.3390/met8100859
D’Accardi E, Palumbo D, Tamborrino R, Galietti U. A Quantitative Comparison among Different Algorithms for Defects Detection on Aluminum with the Pulsed Thermography Technique. Metals. 2018; 8(10):859. https://doi.org/10.3390/met8100859
Chicago/Turabian StyleD’Accardi, Ester, Davide Palumbo, Rosanna Tamborrino, and Umberto Galietti. 2018. "A Quantitative Comparison among Different Algorithms for Defects Detection on Aluminum with the Pulsed Thermography Technique" Metals 8, no. 10: 859. https://doi.org/10.3390/met8100859
APA StyleD’Accardi, E., Palumbo, D., Tamborrino, R., & Galietti, U. (2018). A Quantitative Comparison among Different Algorithms for Defects Detection on Aluminum with the Pulsed Thermography Technique. Metals, 8(10), 859. https://doi.org/10.3390/met8100859