Electrostatic Separation of Copper and Glass Particles in Pretreated Automobile Shredder Residue

Abstract
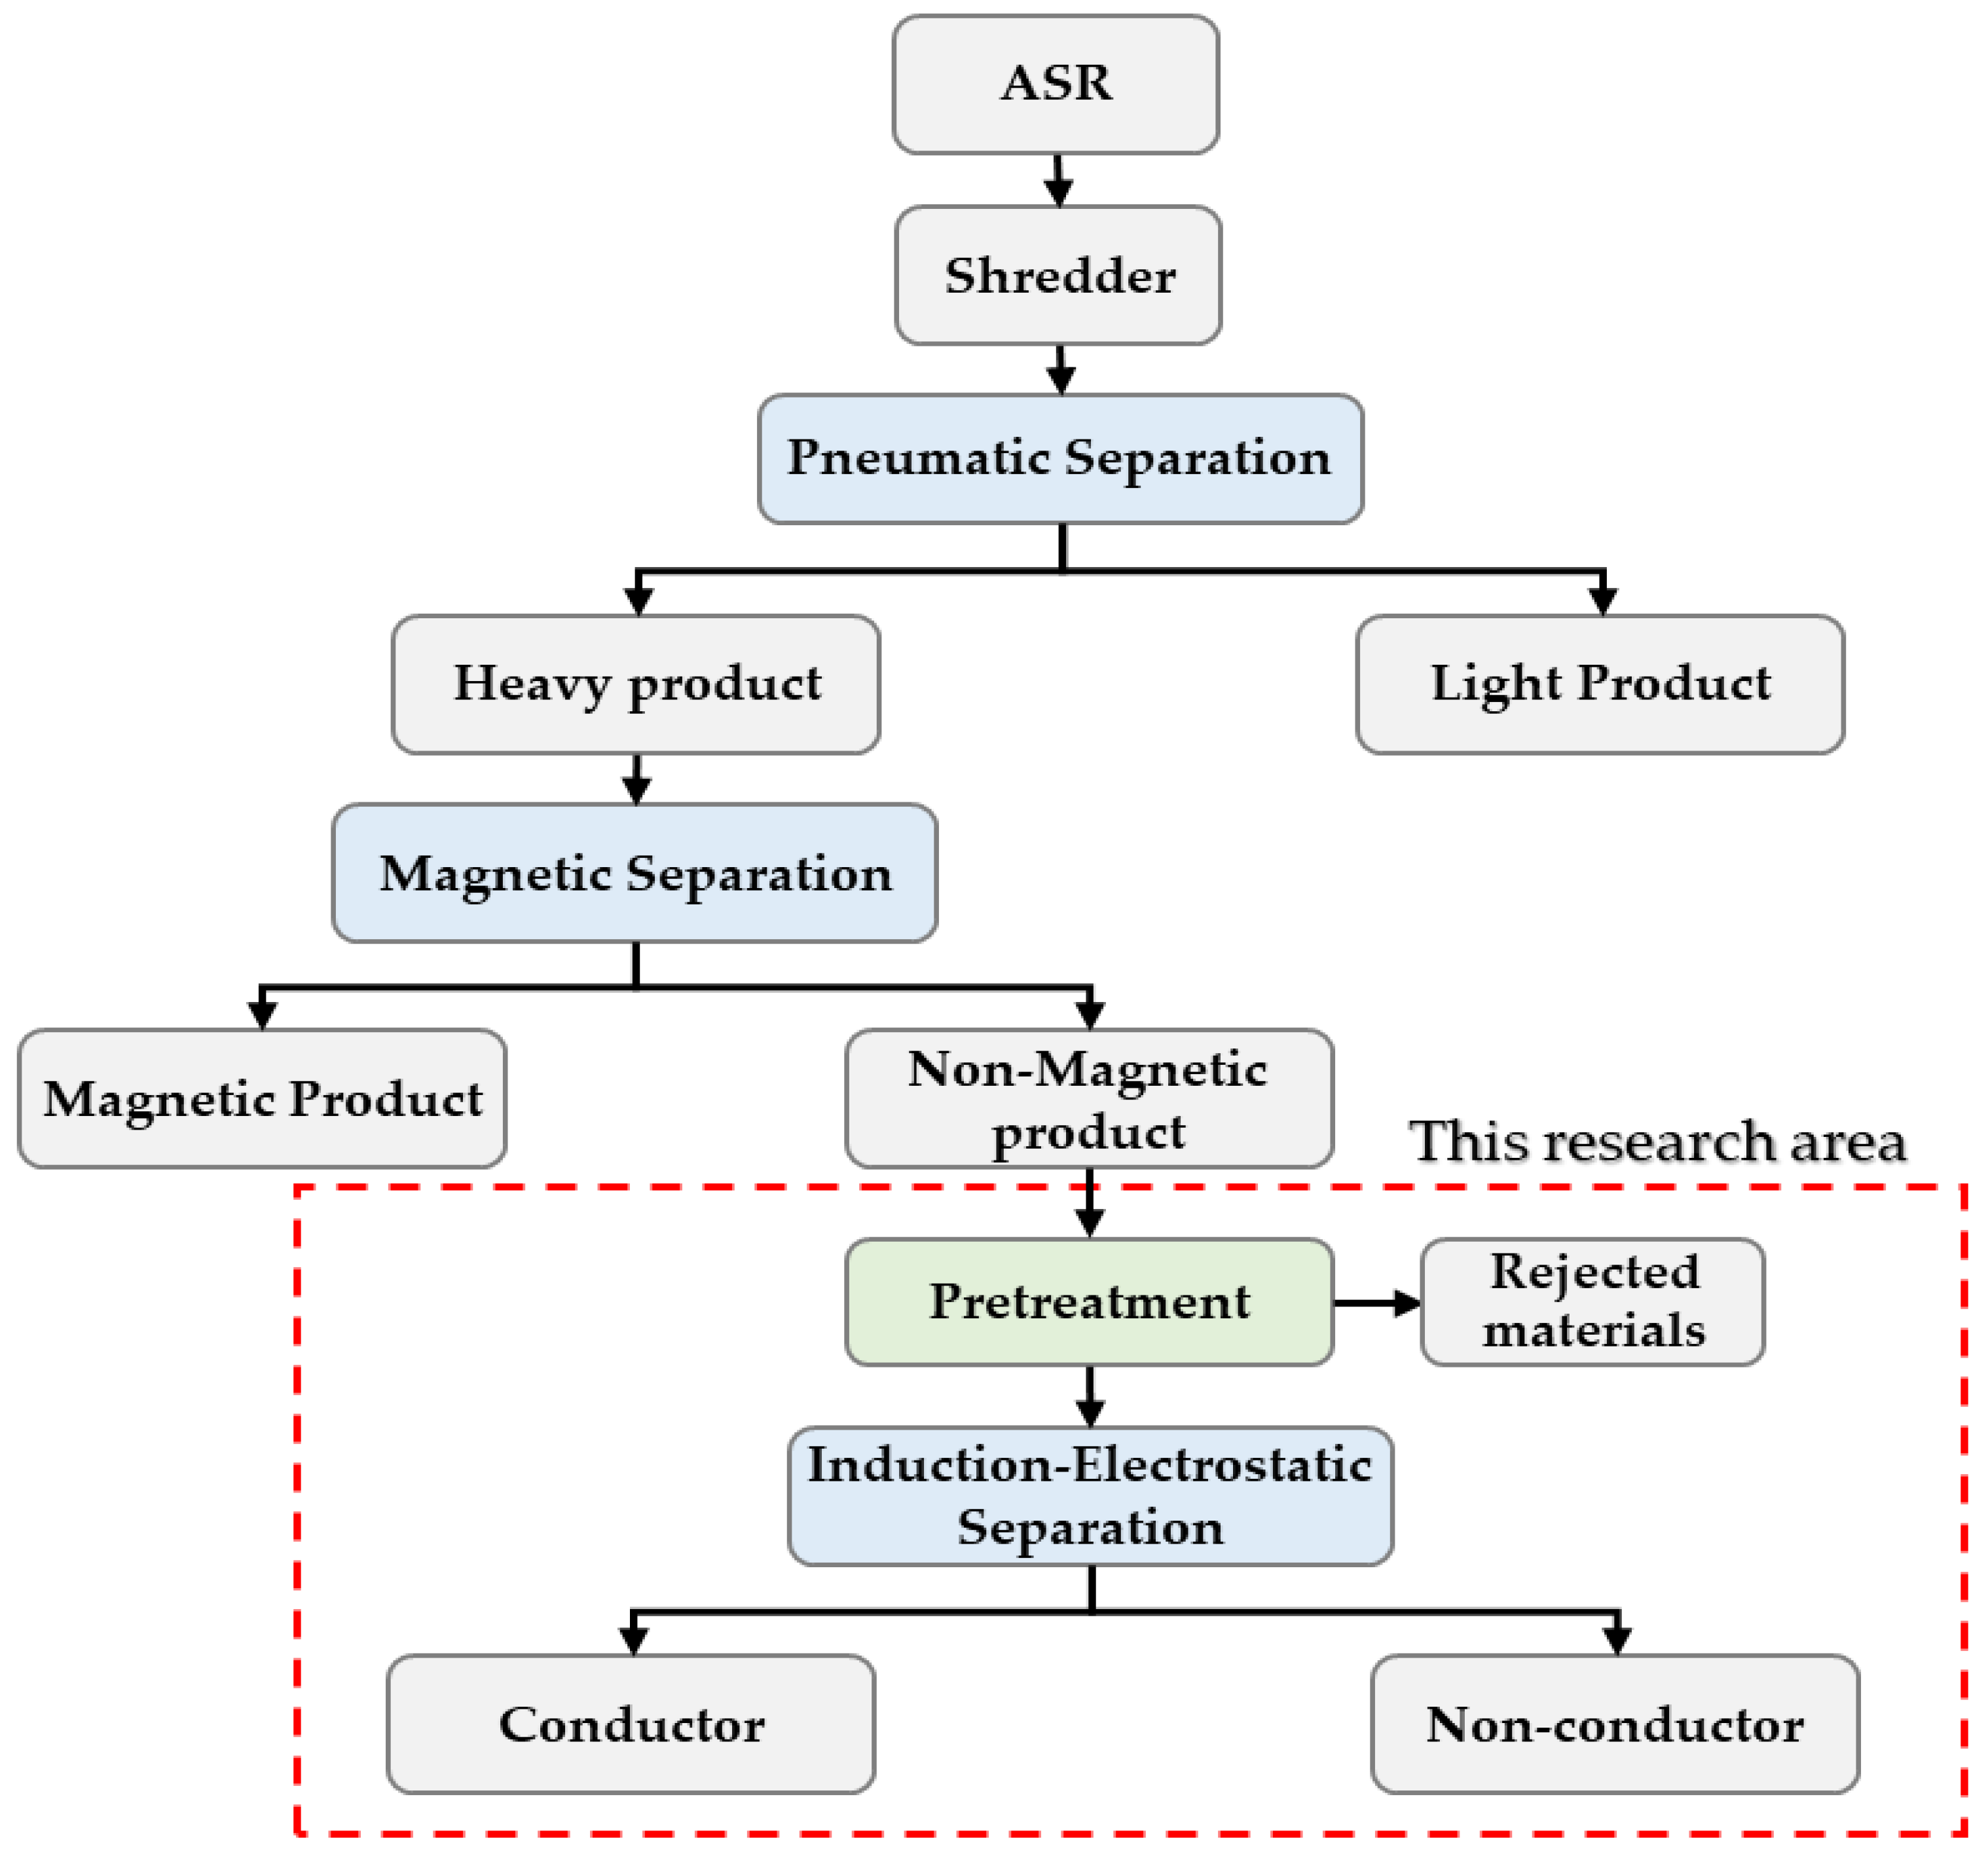
:1. Introduction
2. Materials and Experimental
2.1. Materials
2.2. Experiments
2.2.1. Pretreatment
- →
- Sieving was conducted using a 40 mesh screen for 5 min for the ASR sample. Then, any product that remained above the mesh after sieving was used for the separation test and any samples that fell through the mesh were discarded. The discarded materials were approximately 3% of all samples and consisted of numerous fine glass attaching the conductive material and other non-metals (plastics, etc.), and only a small amount of copper. The oversized materials consisted of glass and conductors, such as copper and aluminum.
- →
- Washing was carried out by stirring 50 g of the samples in a 2-L beaker filled with tap water at 2000 rpm for 10 min. Fluff, wood, and the fine powder attached to glass particles were floated on the surface during washing and their mass was less than 1% of all samples. The remaining materials were dried at 60 °C for 24 h.
- →
- Pyrolysis was performed by using an electric furnace (SF-30, Cerin Ceramics Co., Ltd, Namyangju, Korea). A crucible containing 50 g of the sample was placed in the furnace and heated for 2 h at a minimum temperature of 200 °C. After pyrolysis, the sample was allowed to cool by leaving it at room temperature (24 °C) for 24 h.
- →
- Oxidation was conducted by using a hydrogen peroxide solution (Duksan Pure Chemicals Co., Ltd., Ansan, Korea). The organic matter that had adhered to the glass particles was oxidized and removed by using hydrogen peroxide with a concentration of 0.5 M at 60 °C for 2 h, after which the sample was dried at 60 °C for 24 h.
- →
- Sieving/washing was performed as the combination of sieving and washing pretreatments described above.
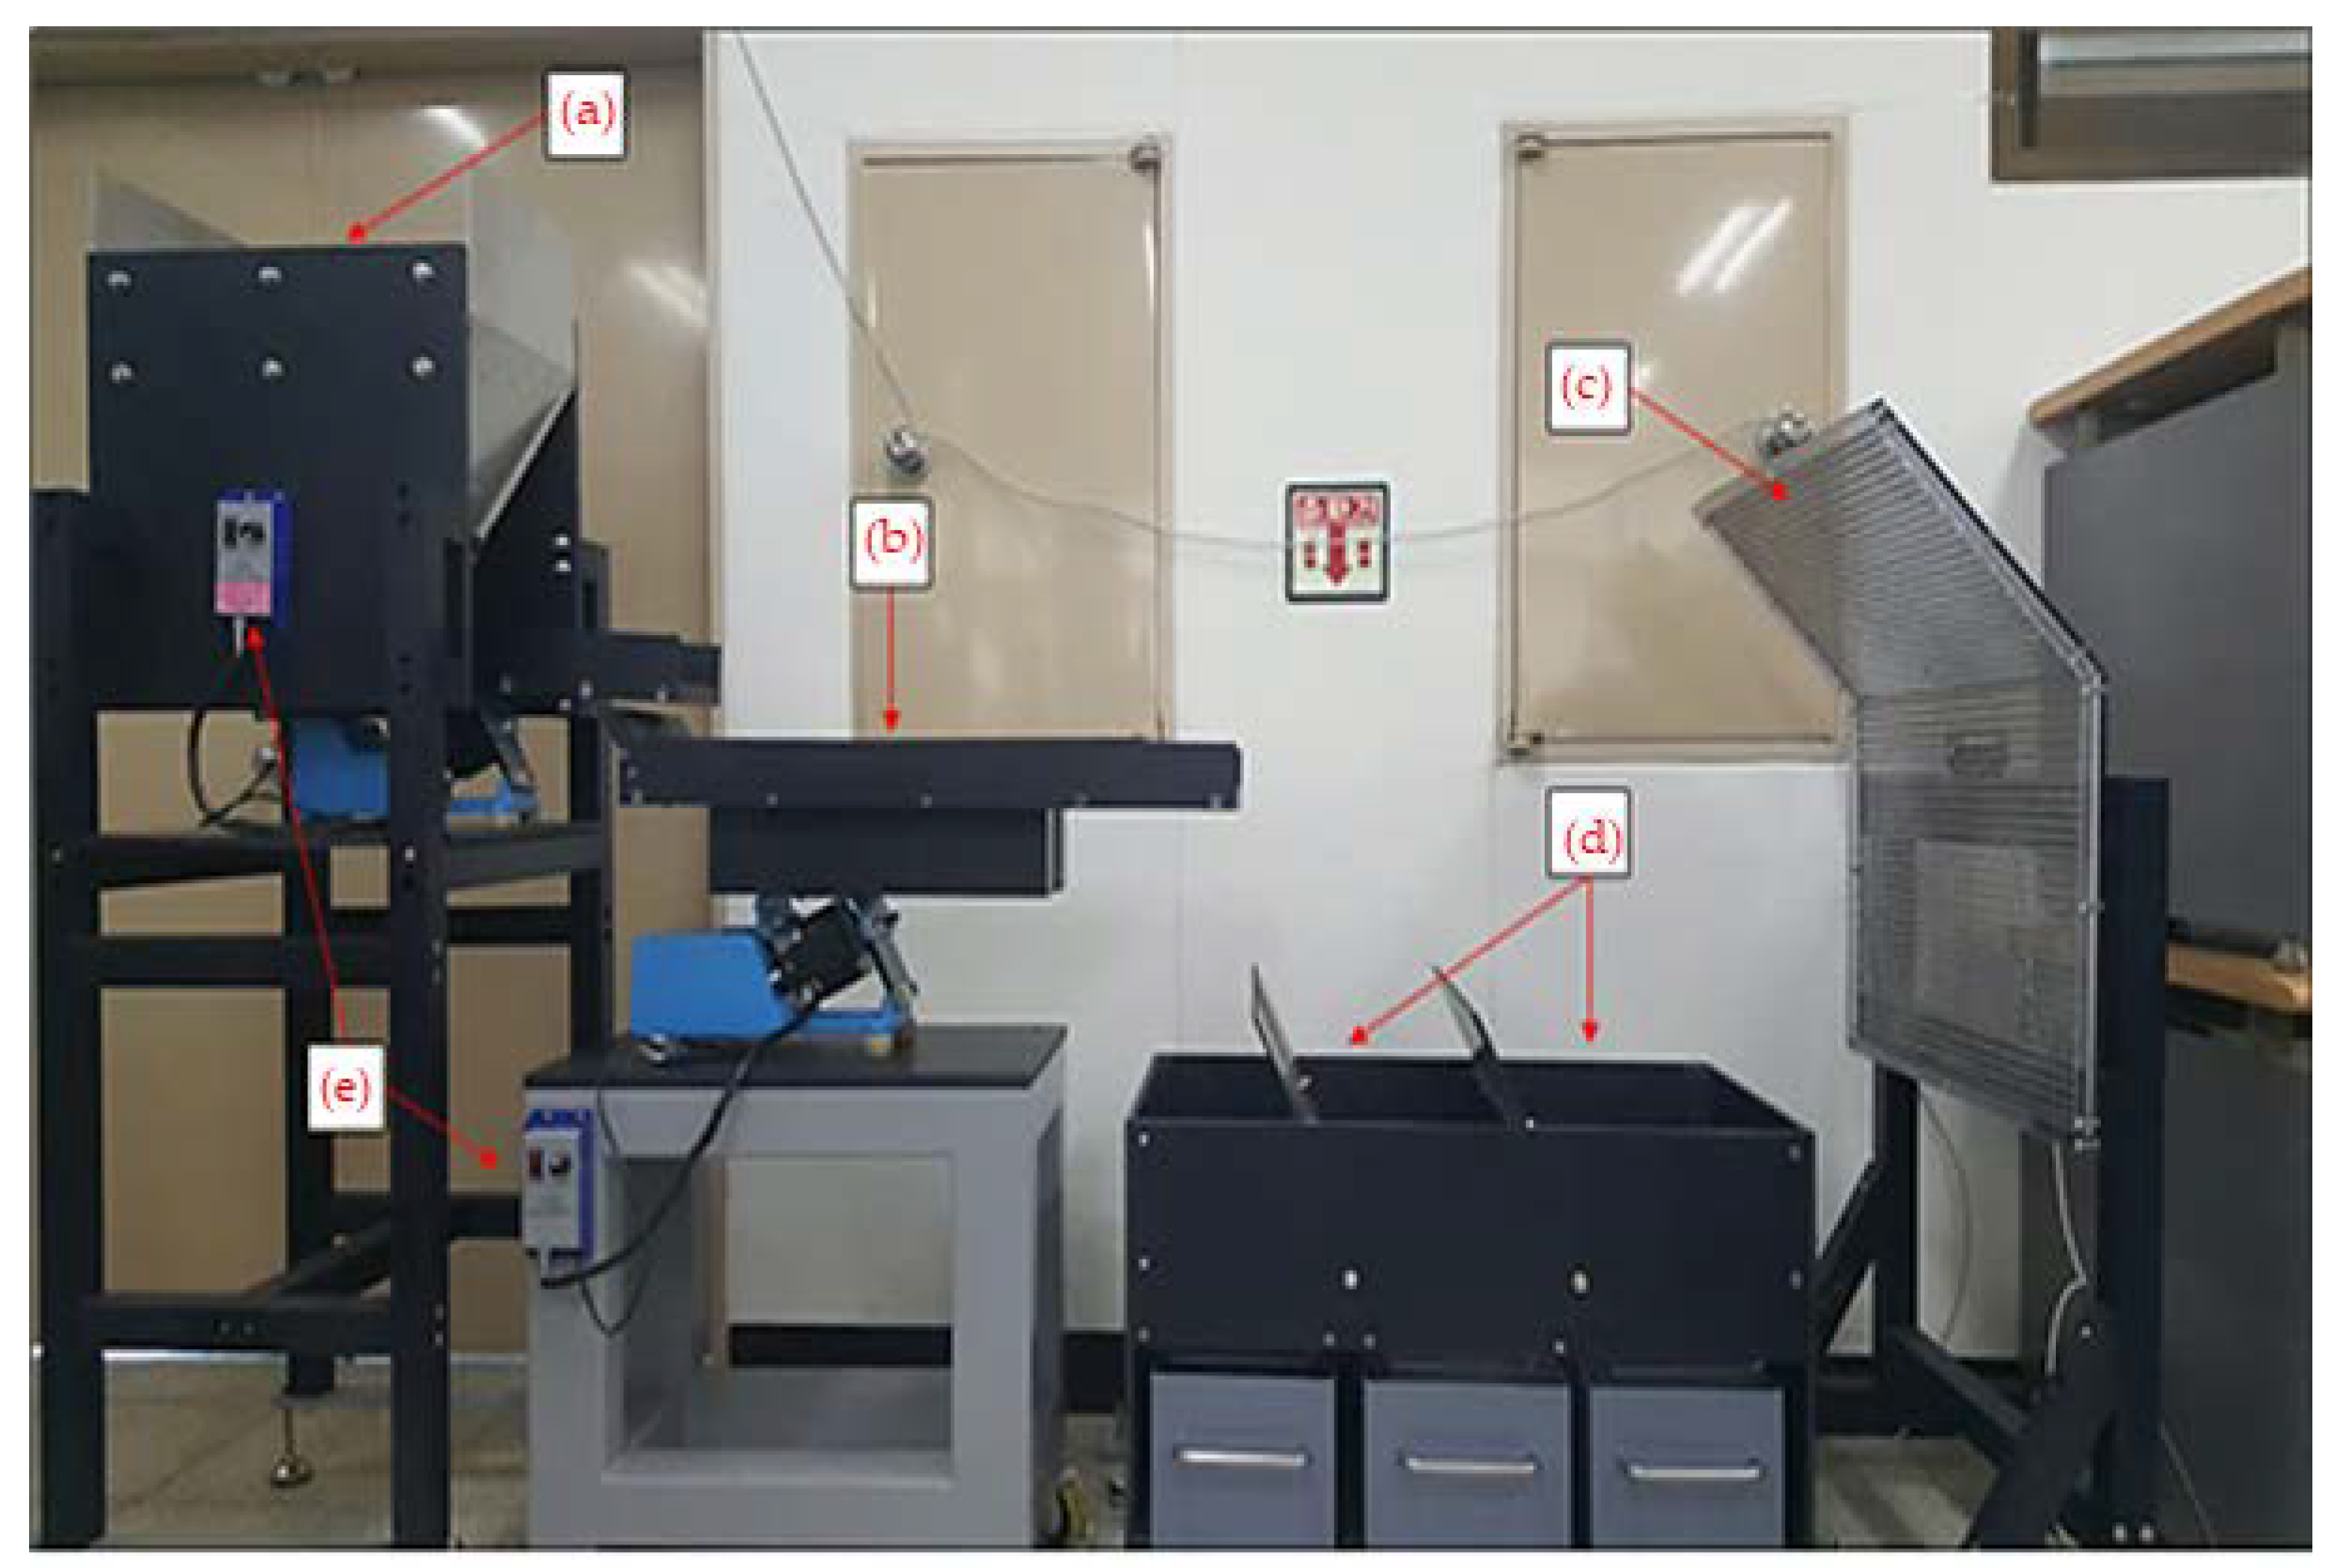
2.2.2. Induction Electrostatic Separation
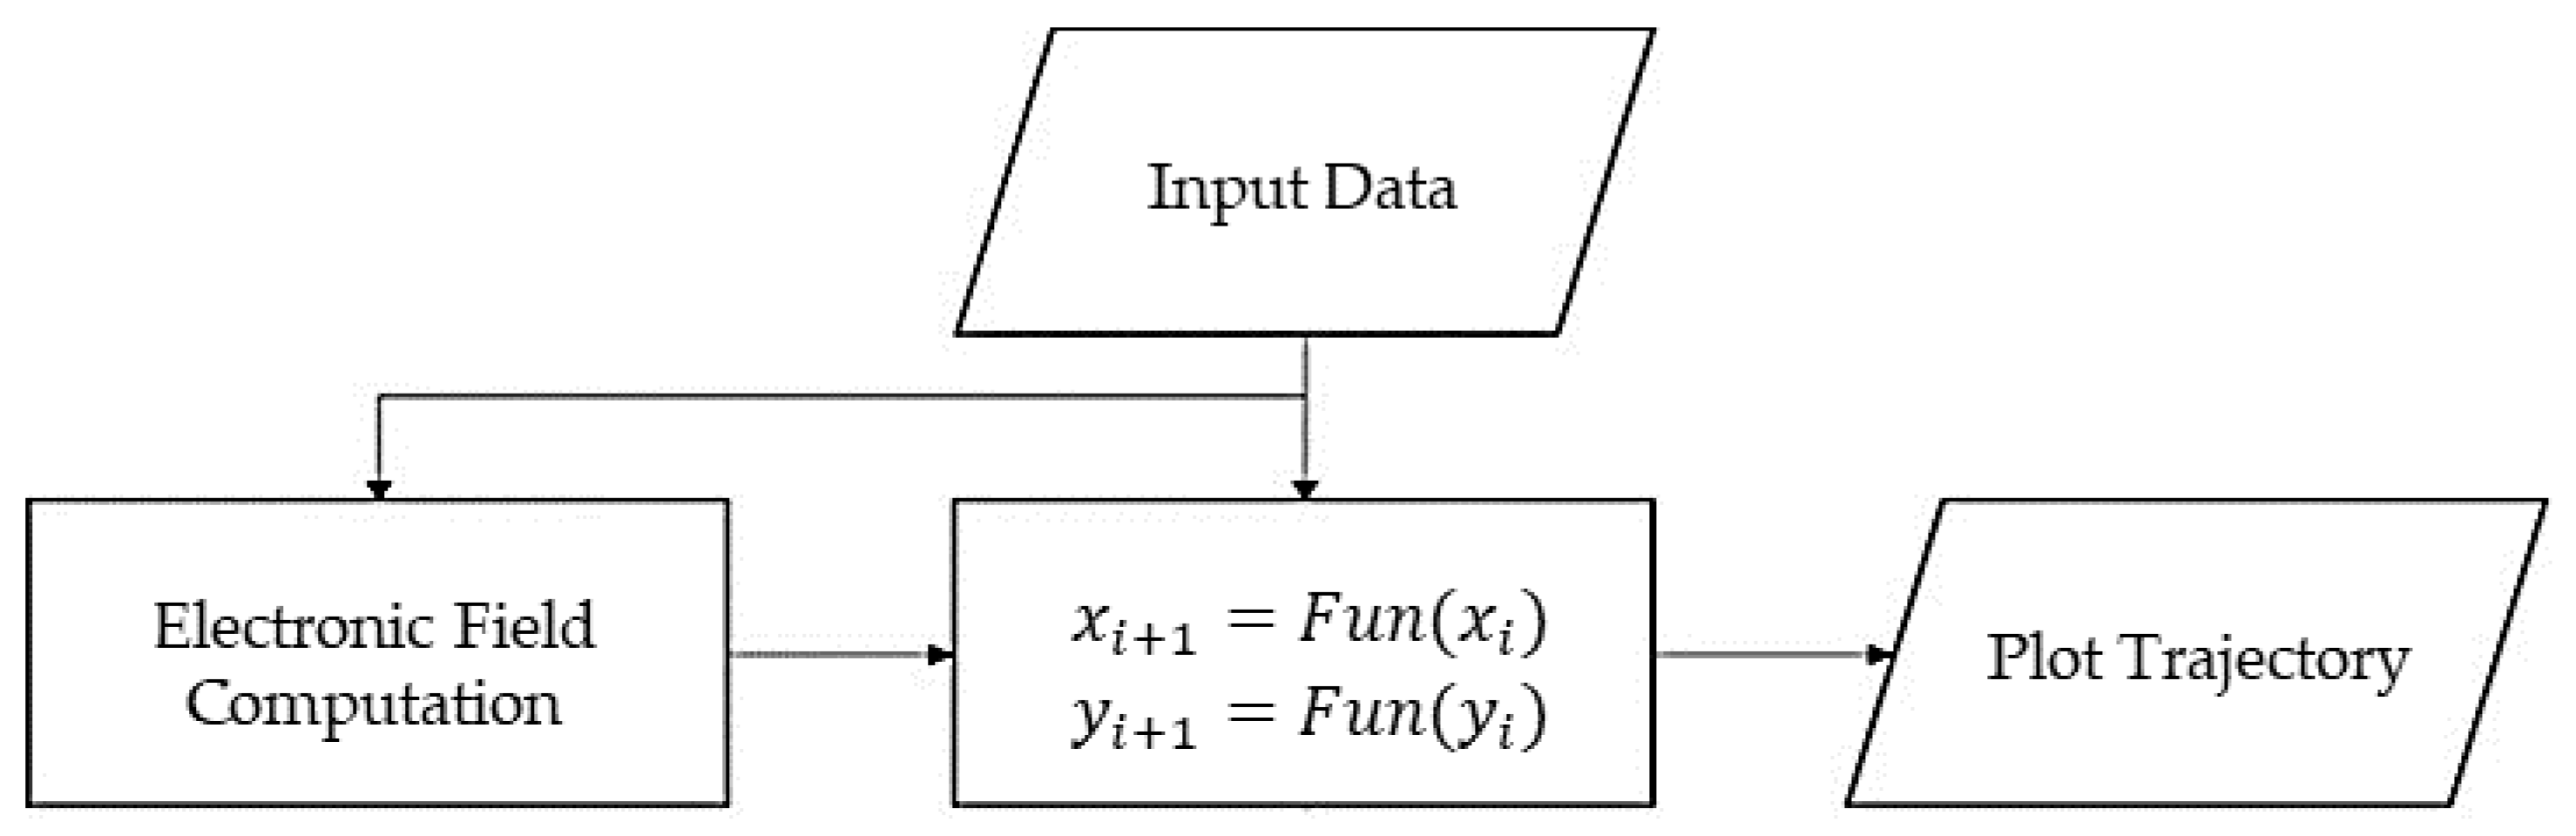
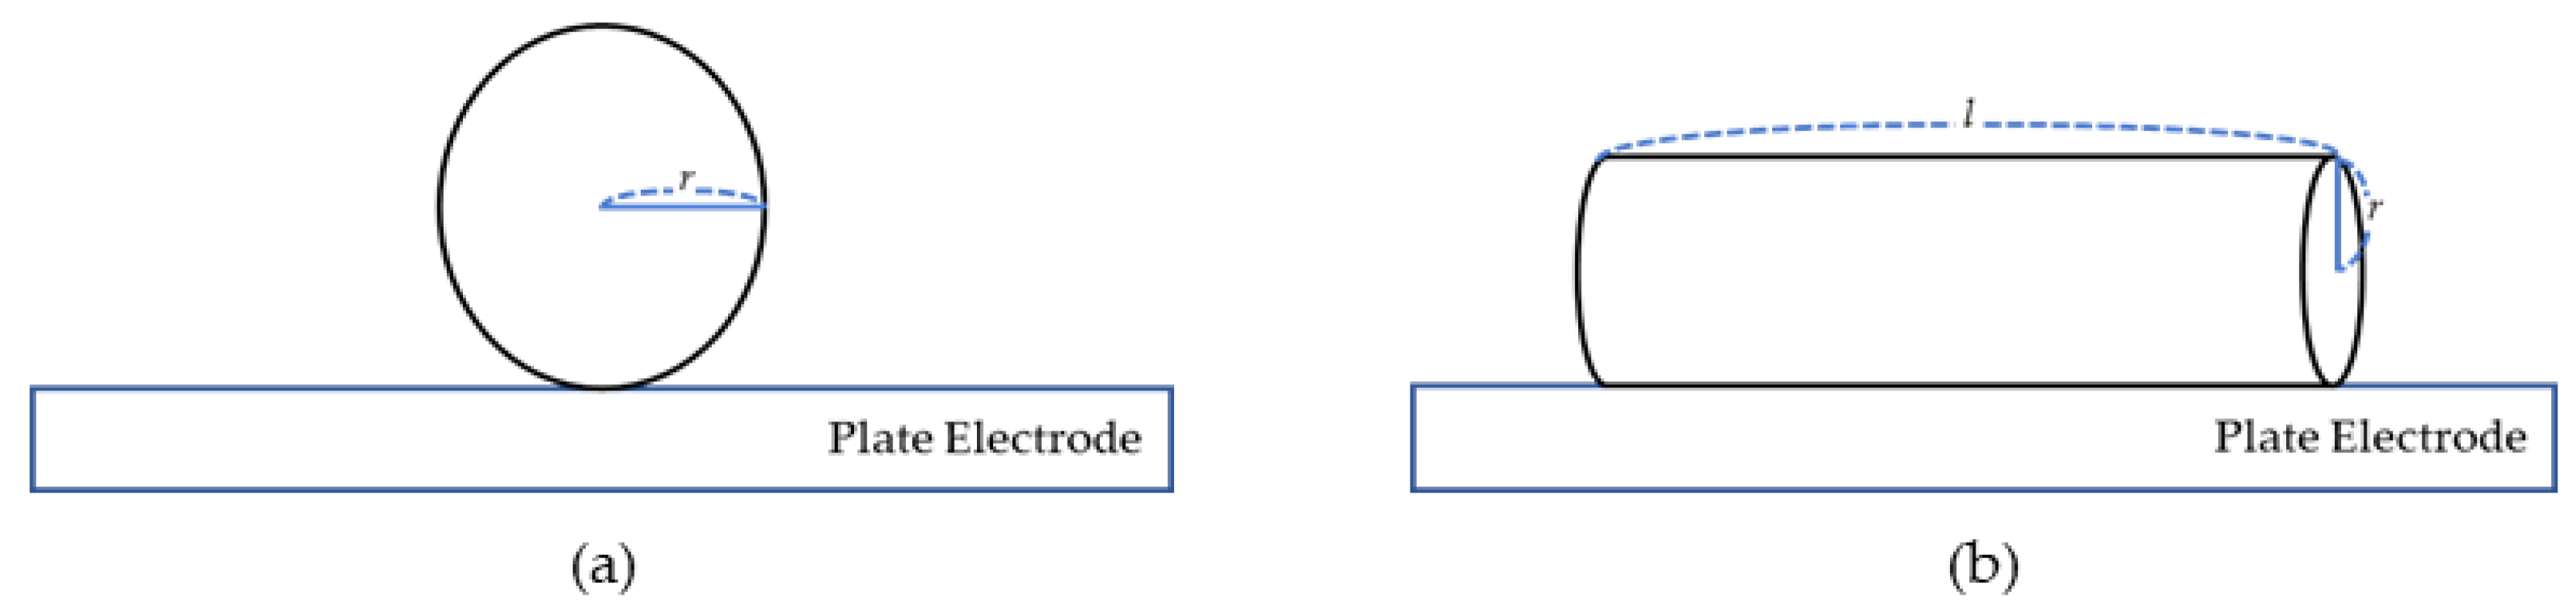
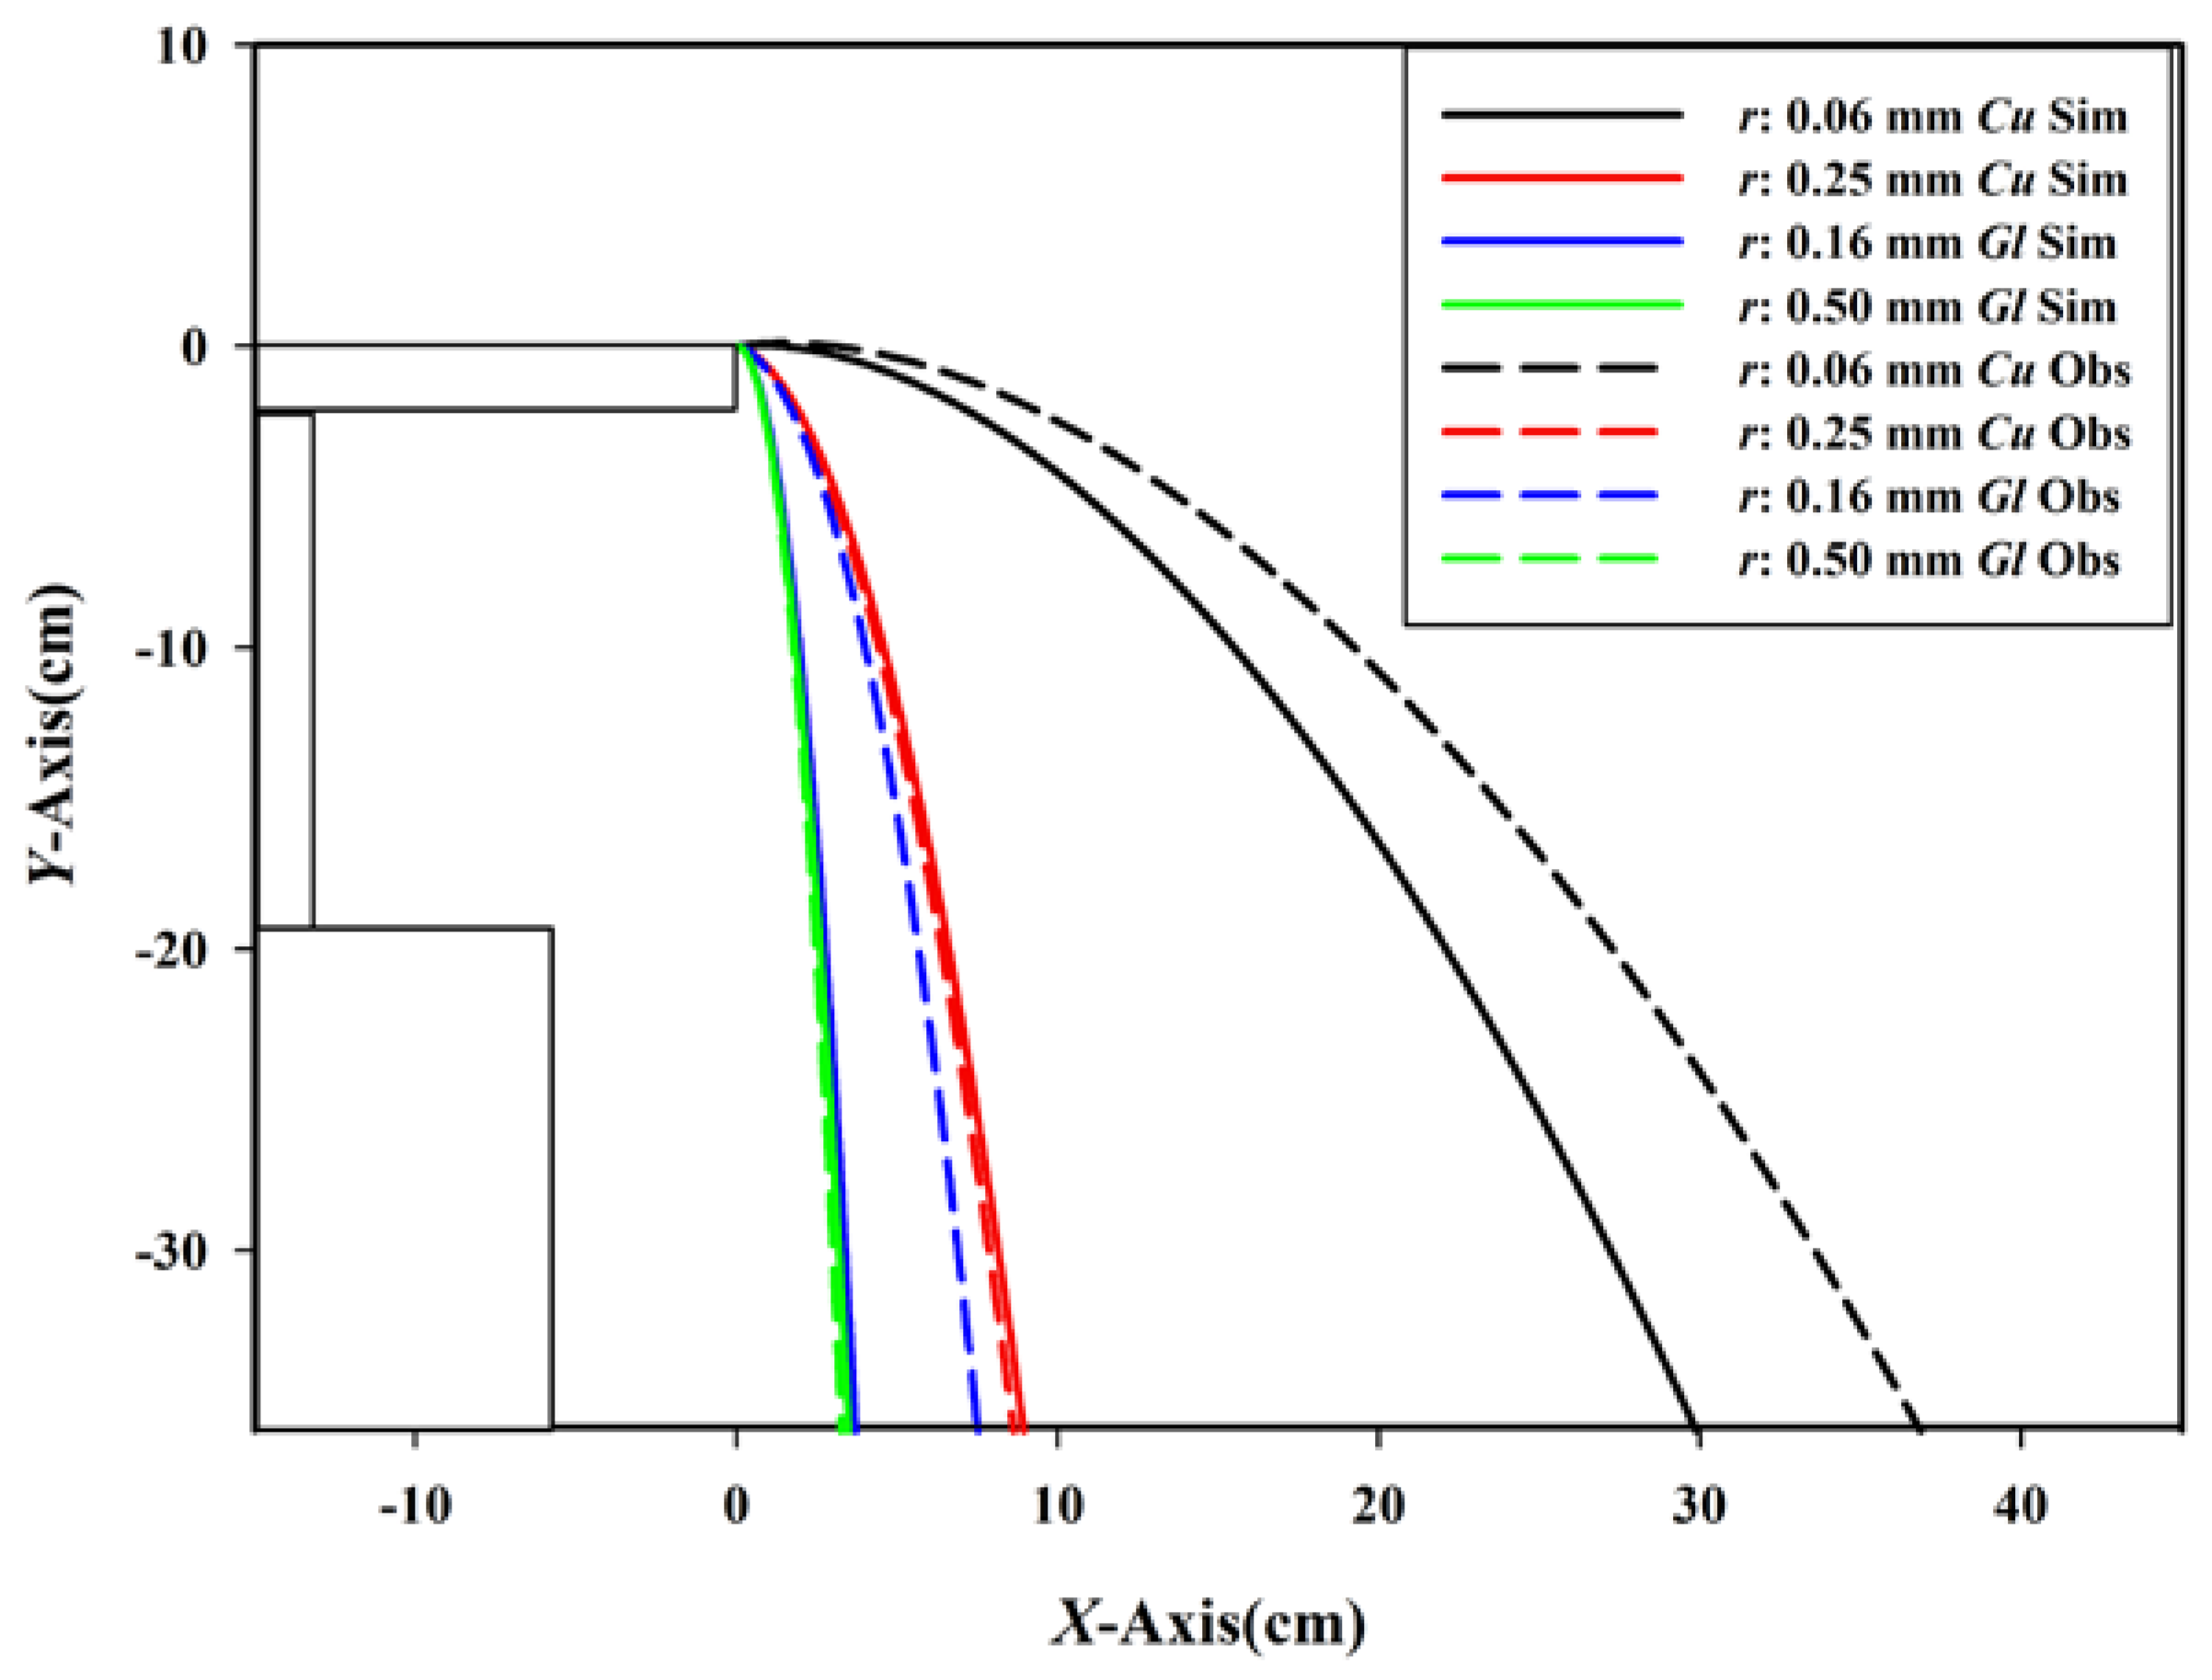
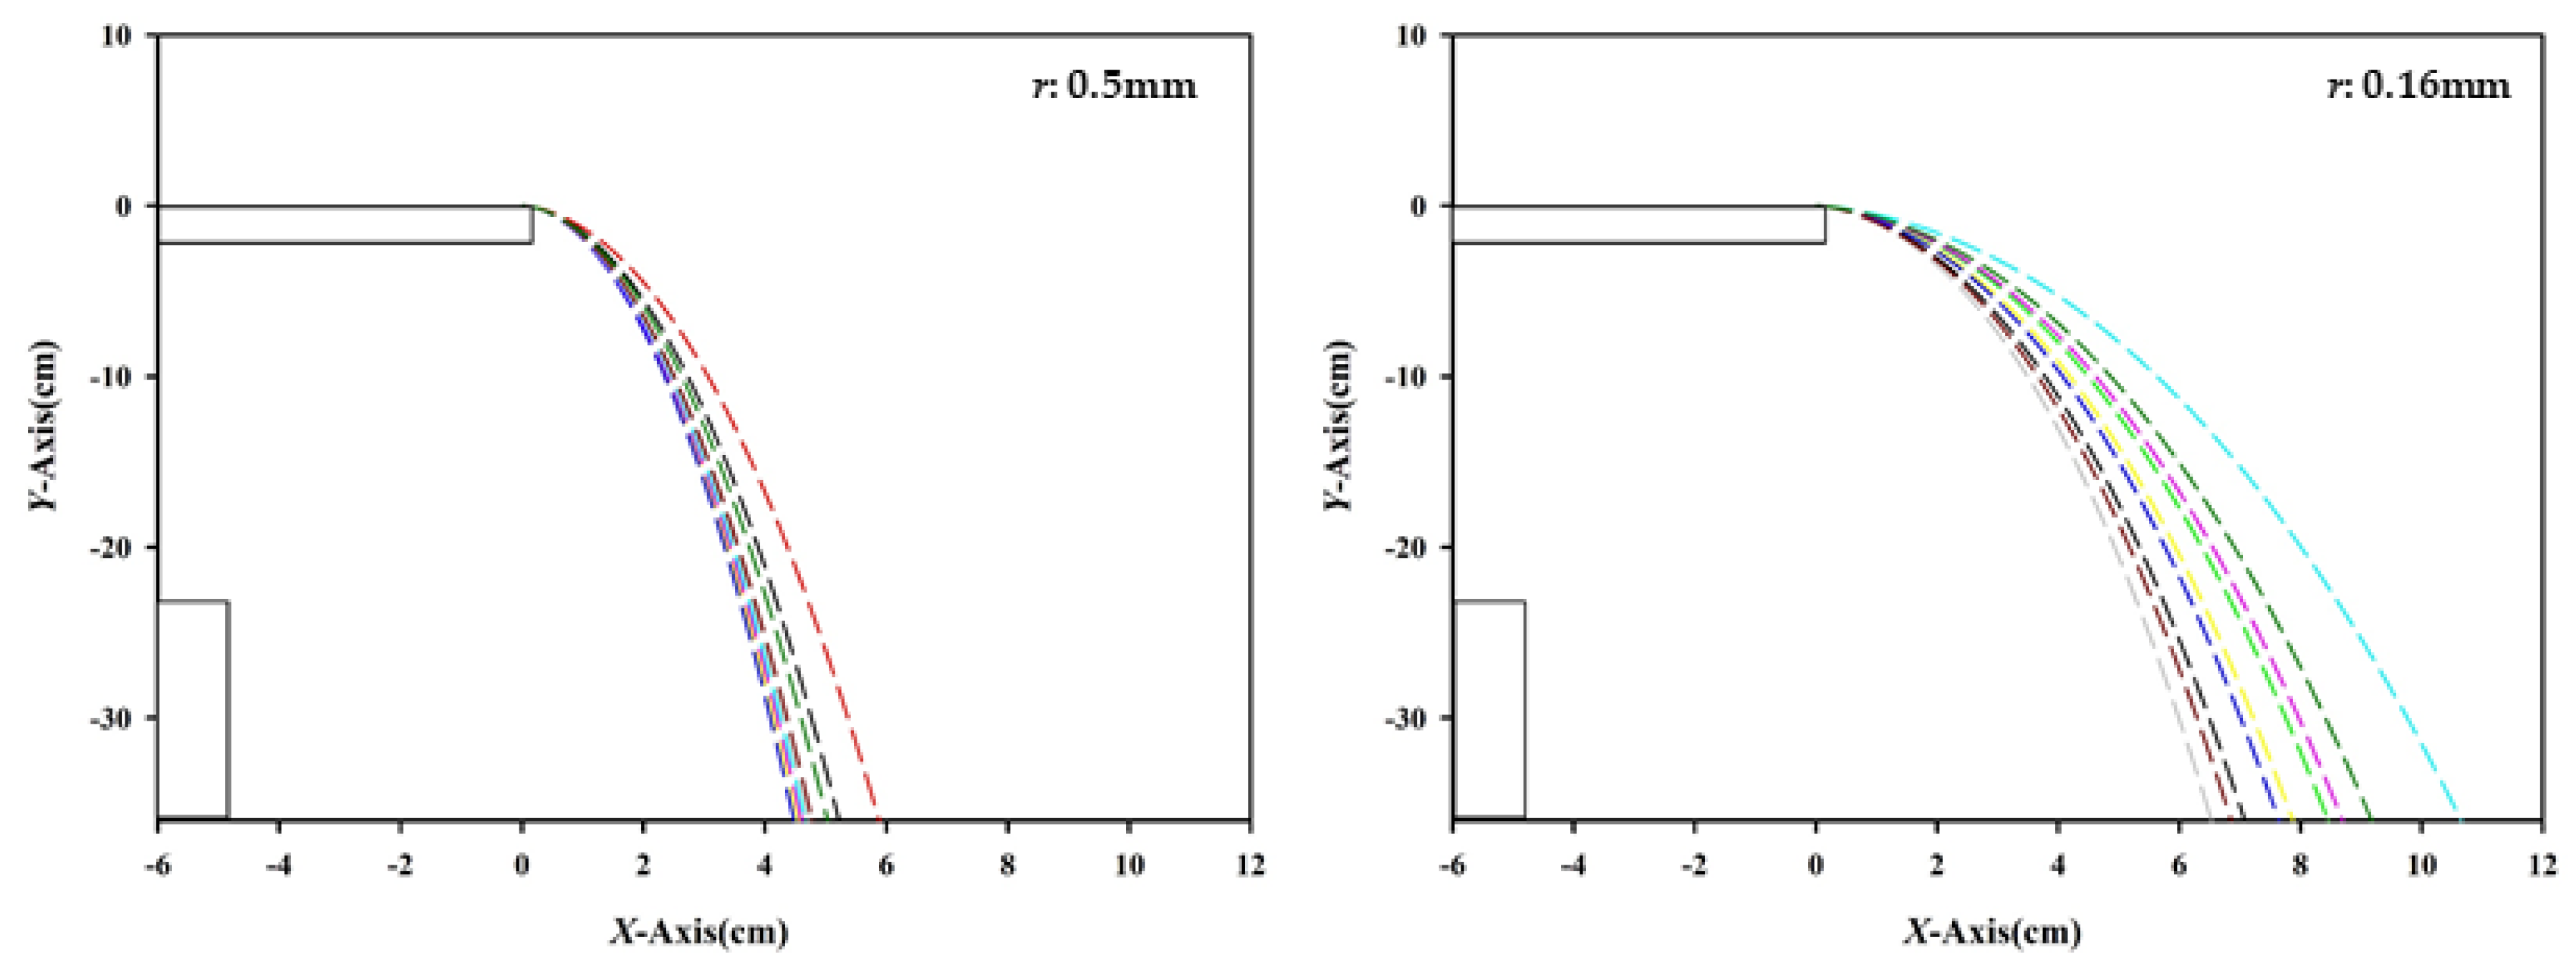
2.2.3. Particle Trajectory Analysis
3. Results
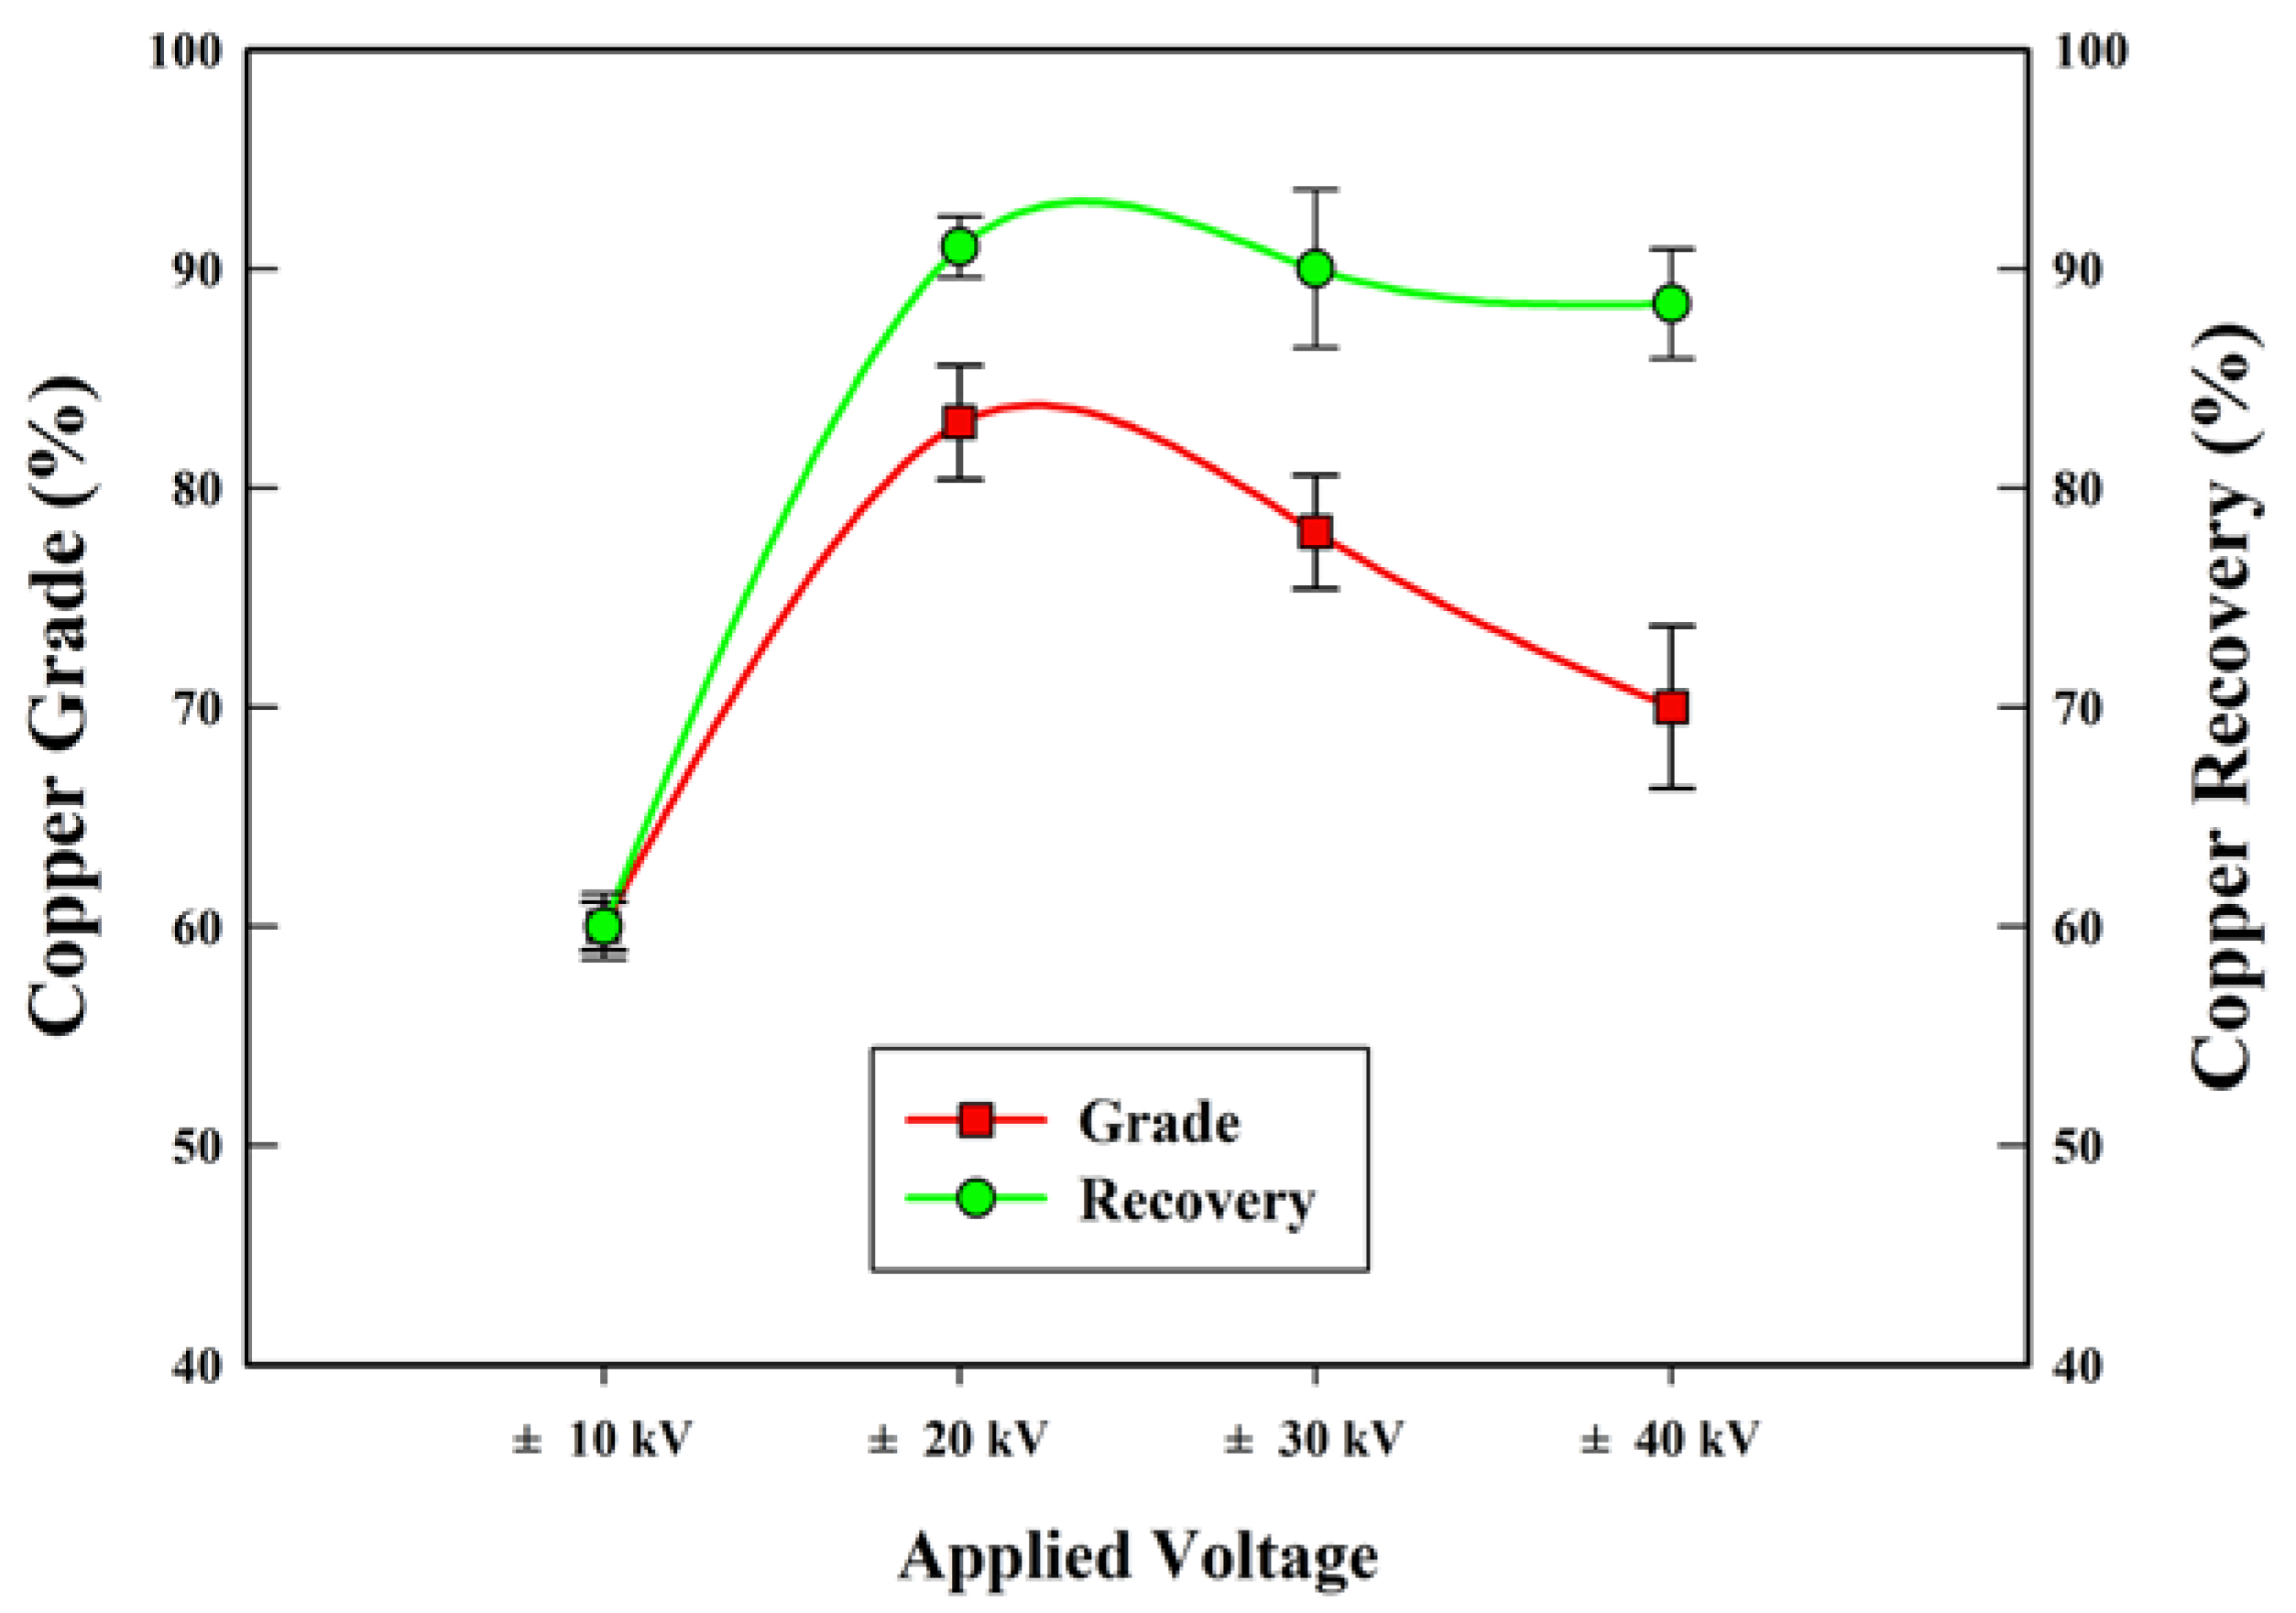
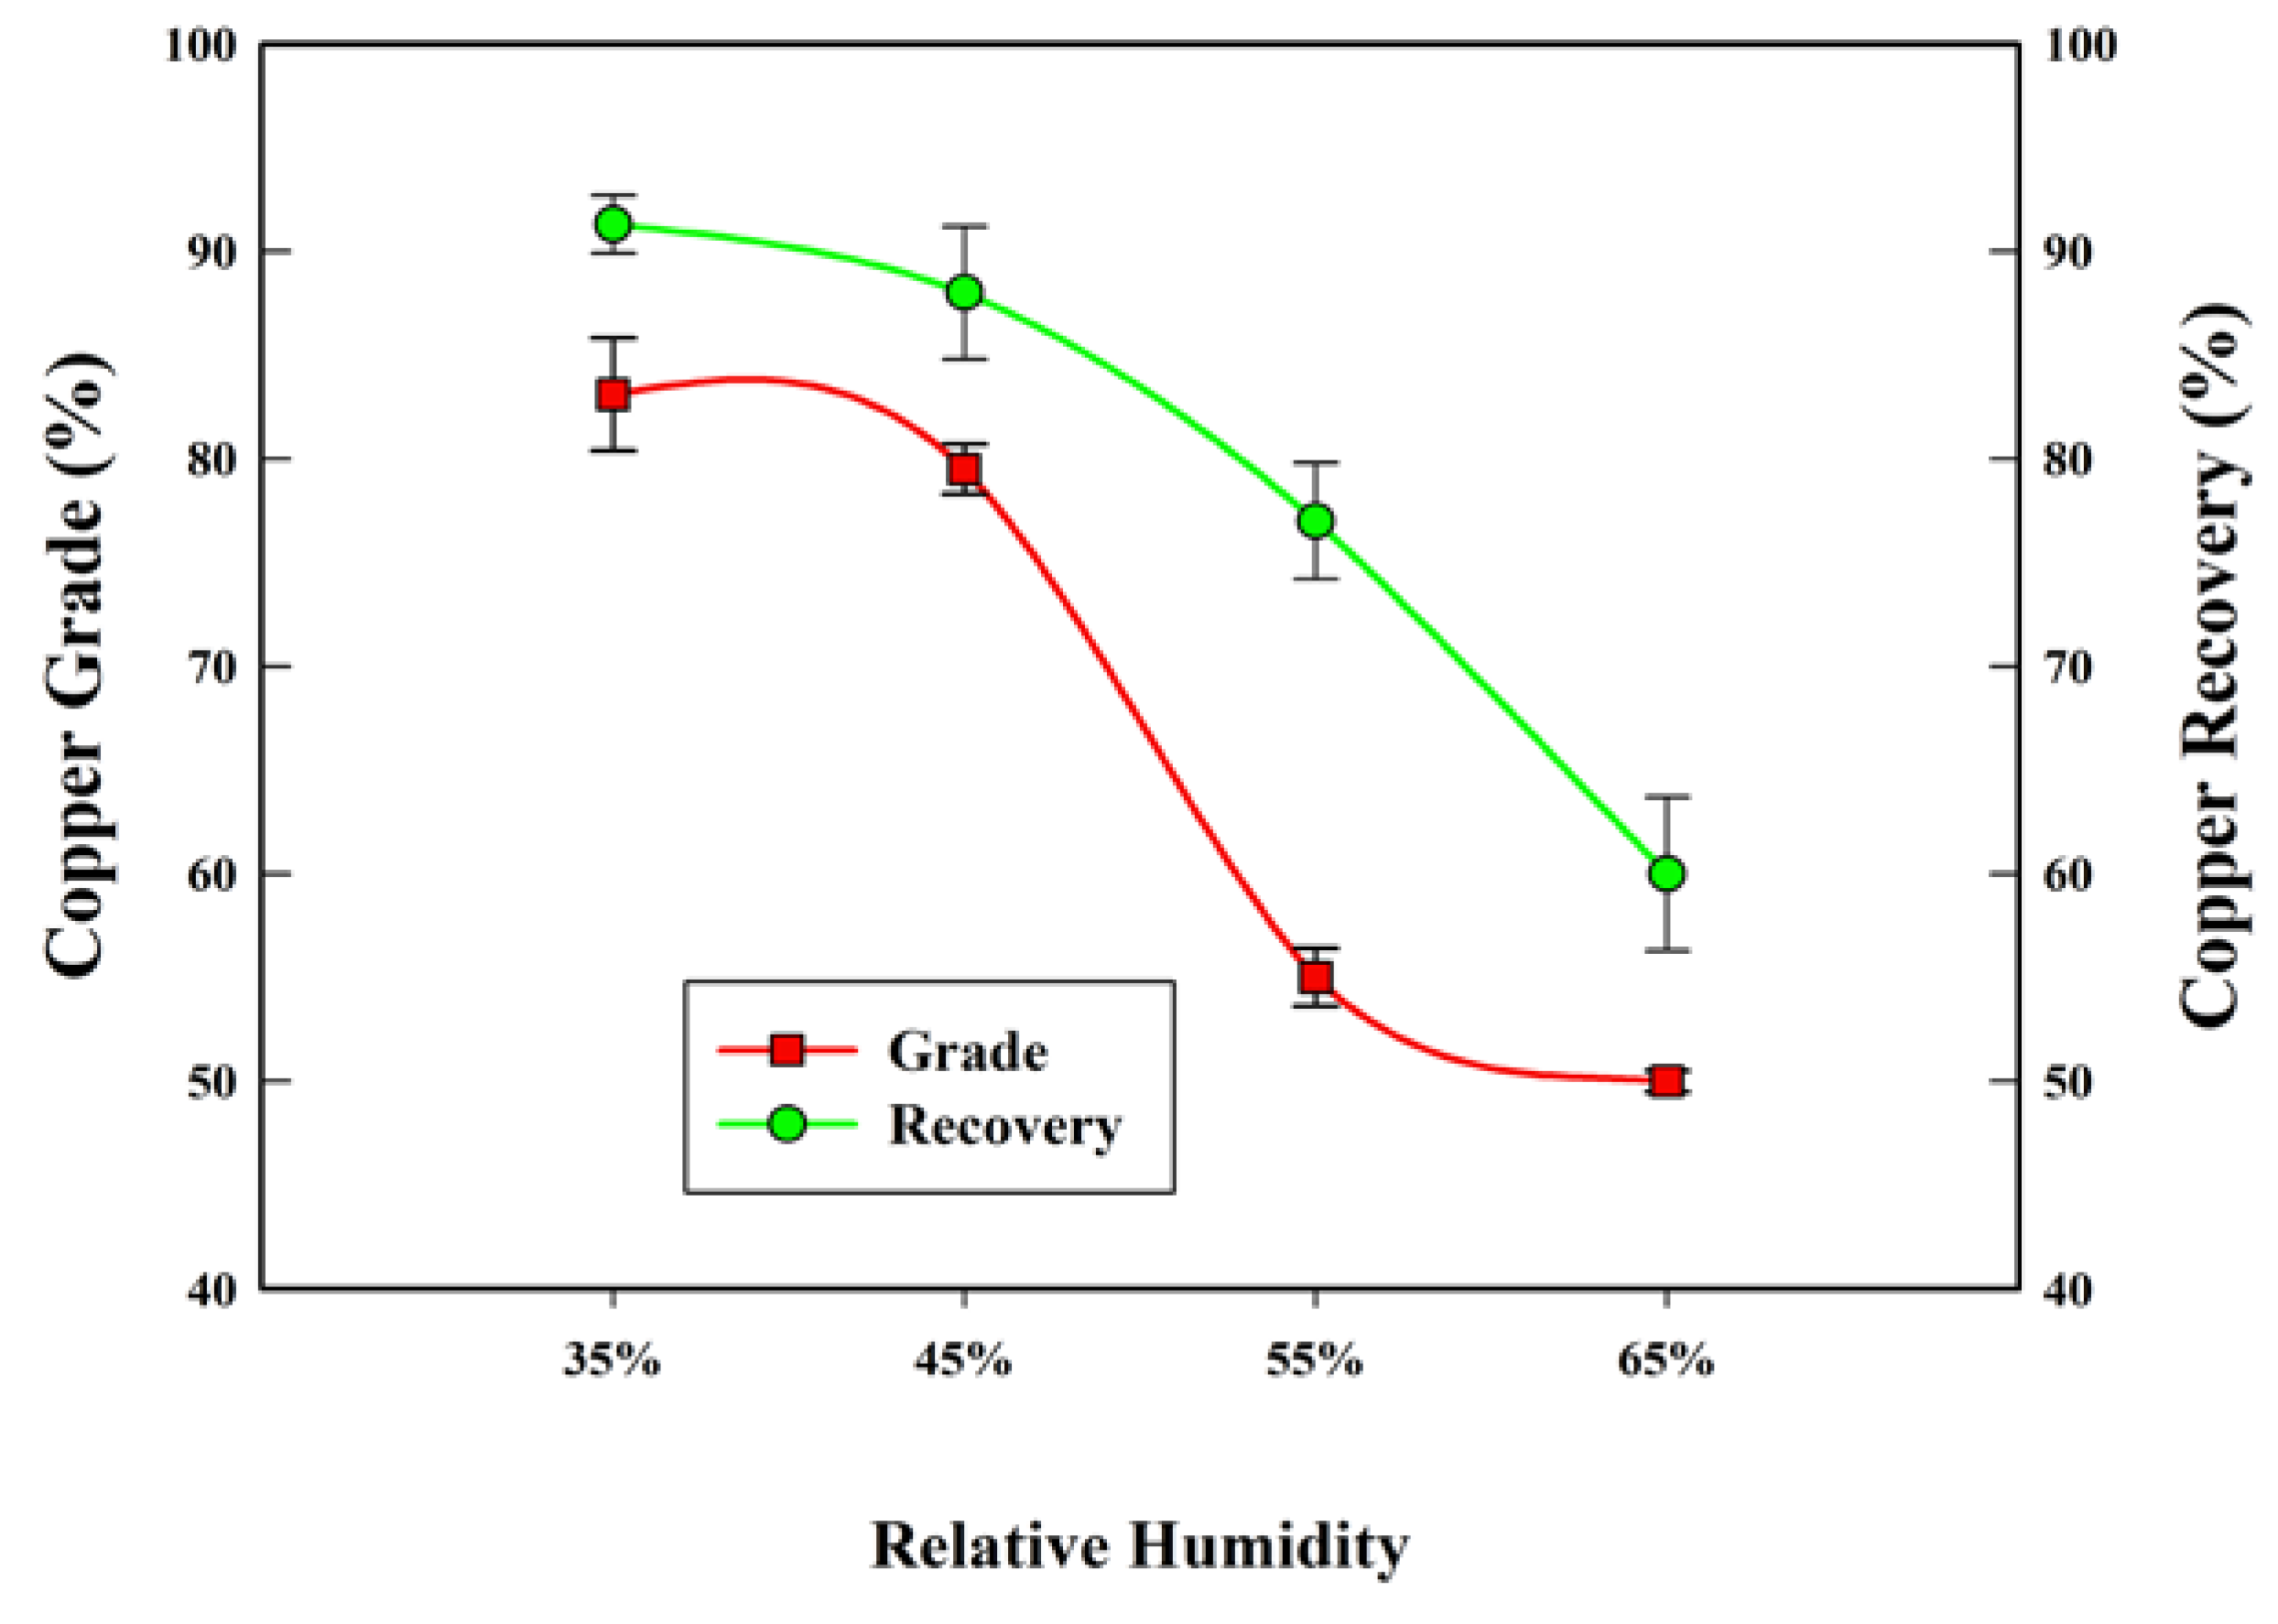
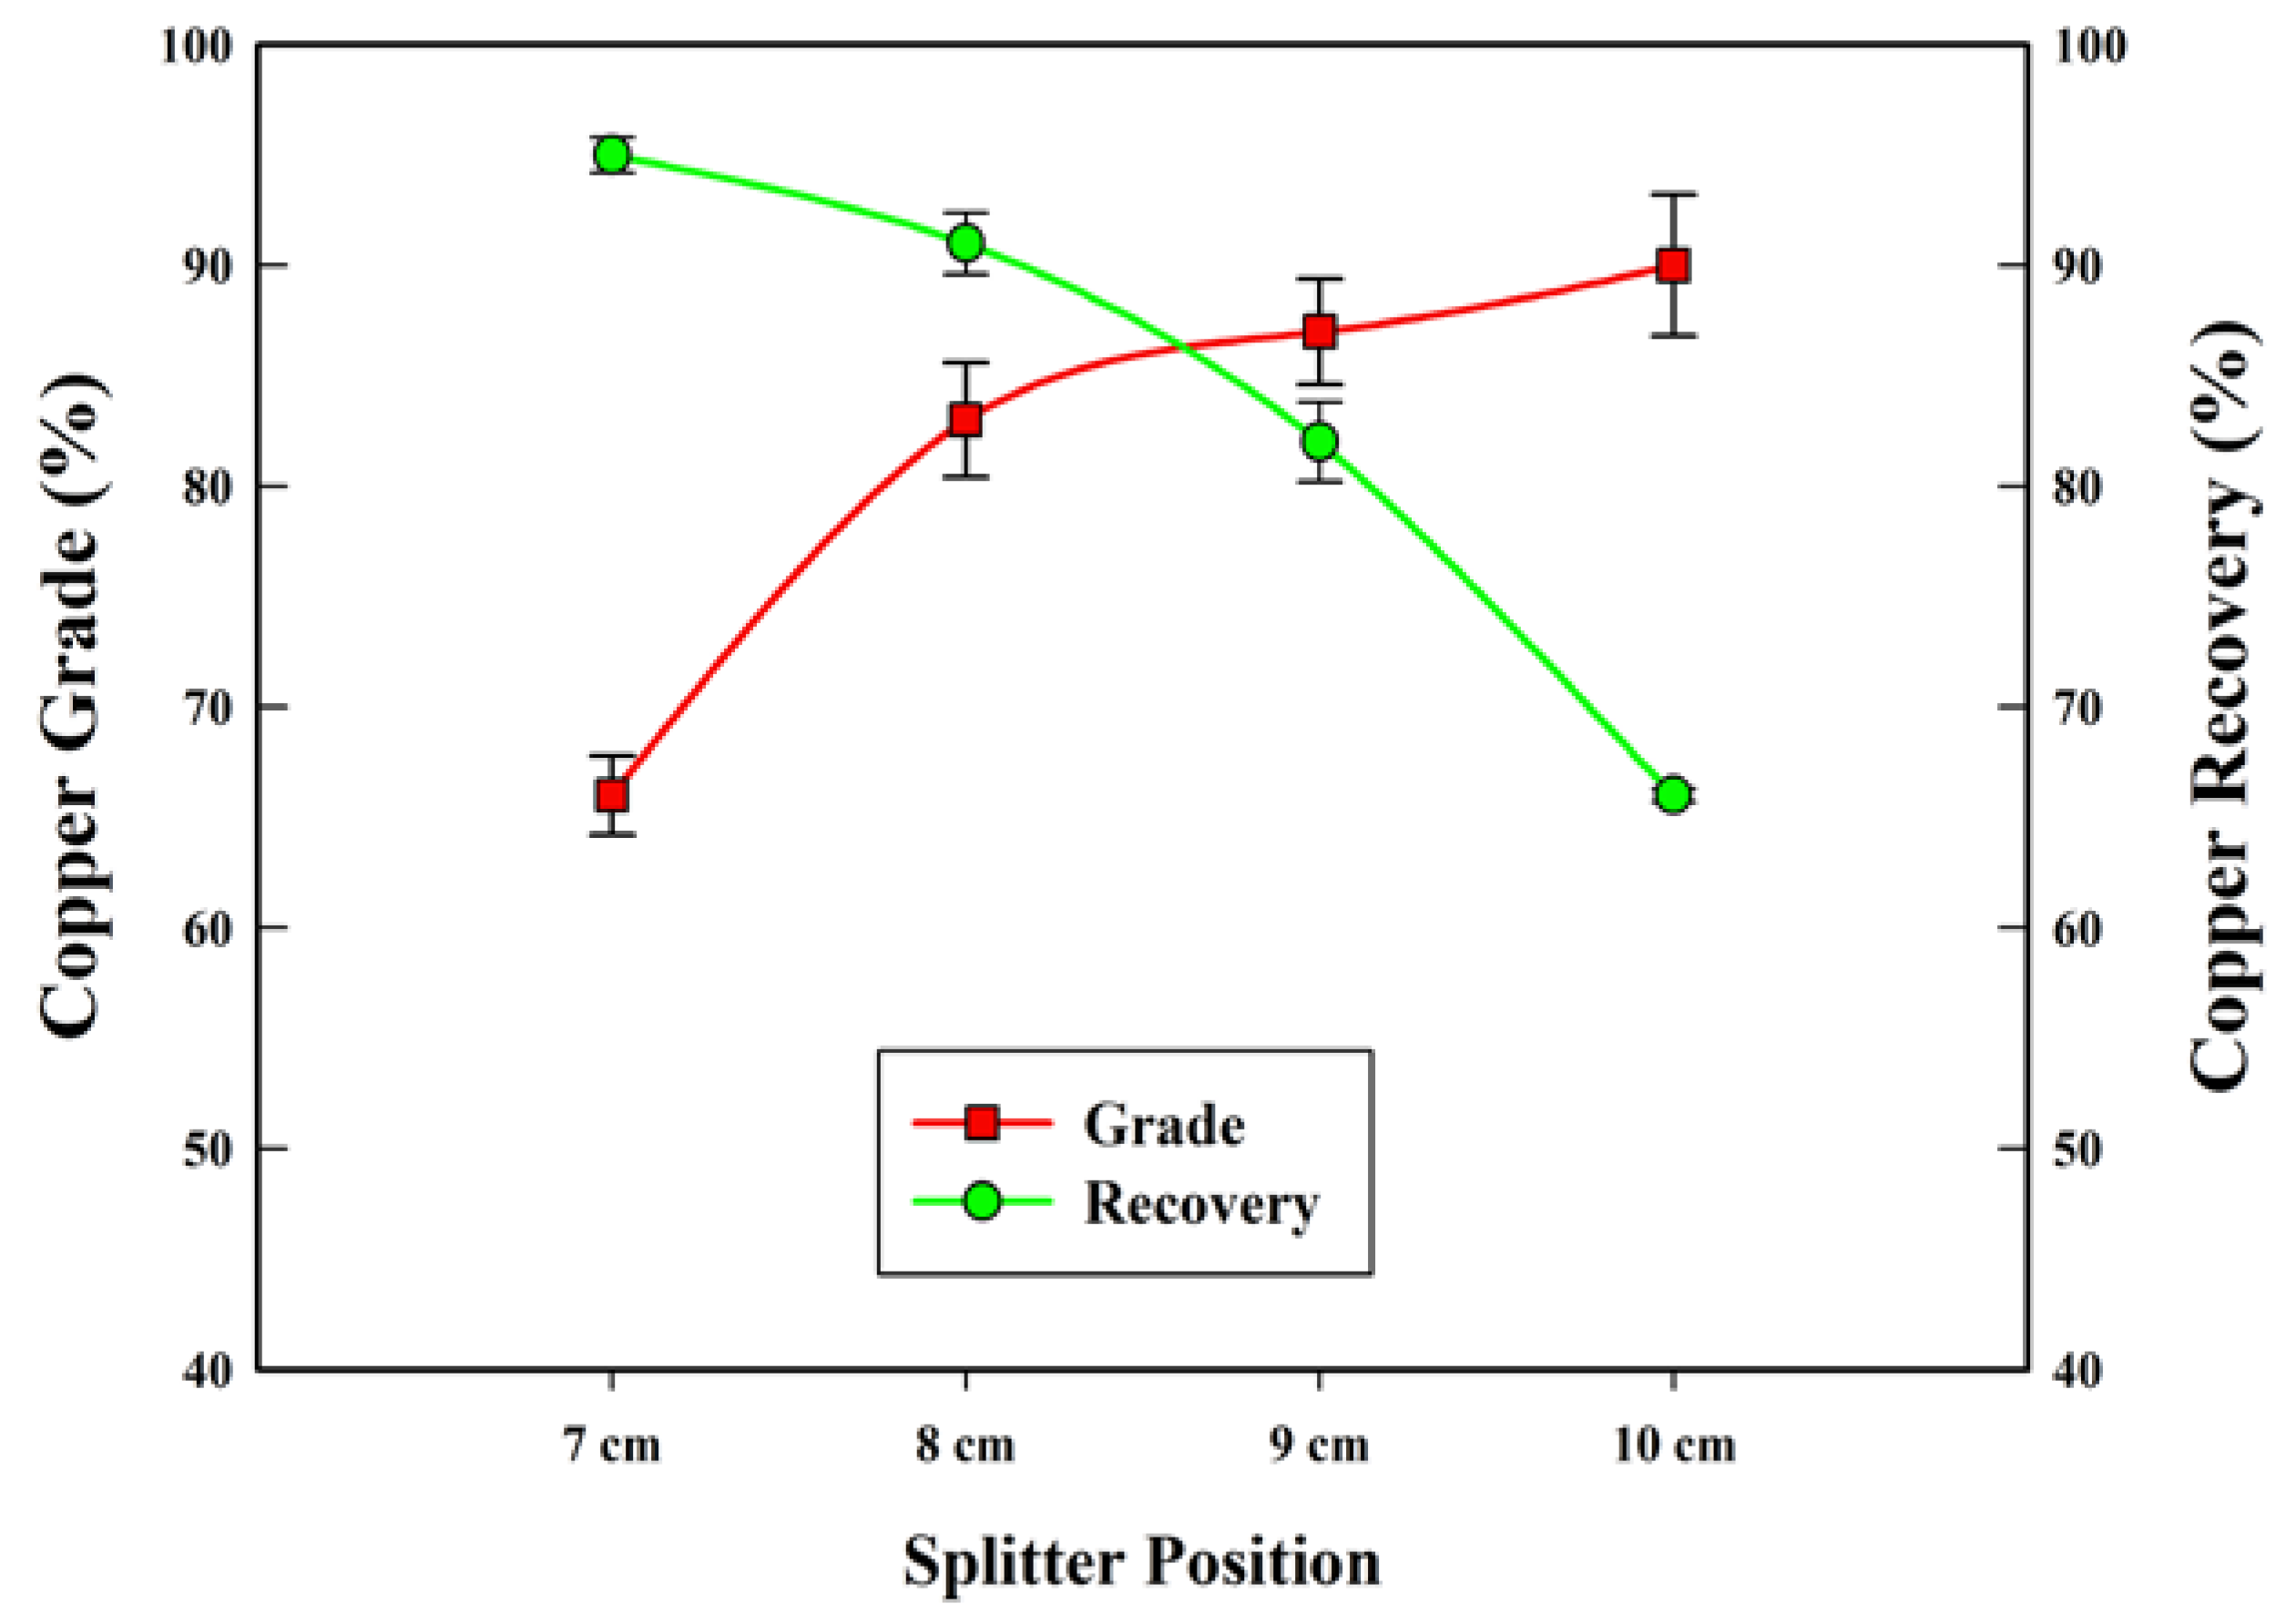
3.1. Separation Test
3.2. Trajectory Analysis
4. Conclusions
Author Contributions
Funding
Conflicts of Interest
Nomenclature
| E | Electric field strength (V/m) |
| Fd | Air drag force (N) |
| Fe | Electric force (N) |
| Fg | Gravity force (N) |
| g | Acceleration due to gravitation (m/s2) |
| l | Length of the particle (m) |
| m | Mass of the particle (kg) |
| Q | Quantity of electricity (C) |
| r | Radius of the particle (m) |
| V | Velocity of particle (m/s) |
| η | Viscosity of Air (Ns/m2) |
References
- Cossu, R.; Lai, T. Automotive shredder residue (ASR) management: An overview. Waste Manag. 2015, 45, 143–151. [Google Scholar] [CrossRef] [PubMed]
- Korea, M.O.E.O. Act on resource circulation of electrical and electronic equipment and vehicles. Available online: ttp://www.law.go.kr/lsInfoP.do?lsiSeq=188594&urlMode=engLsInfoR&viewCls=engLsInfoR#0000. (accessed on 25 October 2018).
- Parliament, E. Directive 2000/53/EC of the european parliament and of the council of 18 September 2000 on end-of life vehicles. Off. J. Eur. Communities 2000, 21, L269. [Google Scholar]
- Sakai, S.-I.; Noma, Y.; Kida, A. End-of-life vehicle recycling and automobile shredder residue management in japan. J. Mater. Cycles Waste Manag. 2007, 9, 151–158. [Google Scholar] [CrossRef]
- Kim, K.-H.; Joung, H.-T.; Nam, H.; Seo, Y.-C.; Hong, J.H.; Yoo, T.-W.; Lim, B.-S.; Park, J.-H. Management status of end-of-life vehicles and characteristics of automobile shredder residues in korea. Waste Manag. 2004, 24, 533–540. [Google Scholar] [CrossRef] [PubMed]
- Santini, A.; Passarini, F.; Vassura, I.; Serrano, D.; Dufour, J.; Morselli, L. Auto shredder residue recycling: Mechanical separation and pyrolysis. Waste Manag. 2012, 32, 852–858. [Google Scholar] [CrossRef] [PubMed]
- Kuwayama, Y.; Ito, M.; Hiroyoshi, N.; Tsunekawa, M. Jig separation of crushed automobile shredded residue and its evaluation by float and sink analysis. J. Mater. Cycles Waste Manag. 2011, 13, 240–246. [Google Scholar] [CrossRef]
- Alunno Rossetti, V.; Di Palma, L.; Ferraro, A. Production and characterization of aggregate from nonmetallic automotive shredder residues. J. Mater. Civ. Eng. 2010, 23, 747–751. [Google Scholar] [CrossRef]
- Fabrizi, L.; Bevilacqua, P. Wire separation from automotive shredder residue. Phys. Sep. Sci. Eng. 2003, 12, 145–165. [Google Scholar] [CrossRef]
- Lee, H.-Y.; Oh, J.-K. A study on the shredding of end-of-life vehicles and materials separation. Geochem. Eng. 2003, 6, 100–105. [Google Scholar] [CrossRef]
- Tripathy, S.K.; Ramamurthy, Y.; Kumar, C.R. Modeling of high-tension roll separator for separation of titanium bearing minerals. Powder Technol. 2010, 201, 181–186. [Google Scholar] [CrossRef]
- Tilmatine, A.; Medles, K.; Bendimerad, S.-E.; Boukholda, F.; Dascalescu, L. Electrostatic separators of particles: Application to plastic/metal, metal/metal and plastic/plastic mixtures. Waste Manag. 2009, 29, 228–232. [Google Scholar] [CrossRef] [PubMed]
- Wu, J.; Li, J.; Xu, Z. Electrostatic separation for recovering metals and nonmetals from waste printed circuit board: Problems and improvements. Environ. Sci. Technol. 2008, 42, 5272–5276. [Google Scholar] [CrossRef] [PubMed]
- Vlad, S.; Mihailescu, M.; Rafiroiu, D.; Iuga, A.; Dascalescu, L. Numerical analysis of the electric field in plate-type electrostatic separators. J. Electrostat. 2000, 48, 217–229. [Google Scholar] [CrossRef]
- Tilmatine, A.; Medles, K.; Younes, M.; Bendaoud, A.; Dascalescu, L. Roll-type versus free-fall electrostatic separation of tribocharged plastic particles. IEEE Trans. Ind. Appl. 2010, 46, 1564–1569. [Google Scholar] [CrossRef]
- Richard, G.; Salama, A.R.; Medles, K.; Lubat, C.; Touhami, S.; Dascalescu, L. Electrostatic separation of two types of copper wires from electric cable wastes. In Proceedings of the 2016 Electrostatics Joint Conference, West Lafayette, IN, USA, 13–16 June 2016. [Google Scholar]
- Mihailescu, M.; Samuila, A.; Urs, A.; Morar, R.; Iuga, A.; Dascalescu, L. Computer-assisted experimental design for the optimization of electrostatic separation processes. IEEE Trans. Ind. Appl. 2002, 38, 1174–1181. [Google Scholar] [CrossRef]
- Labair, H.; Touhami, S.; Tilmatine, A.; Hadjeri, S.; Medles, K.; Dascalescu, L. Study of charged particles trajectories in free-fall electrostatic separators. J. Electrostat. 2017, 88, 10–14. [Google Scholar] [CrossRef]
- Li, J.; Lu, H.; Xu, Z.; Zhou, Y. A model for computing the trajectories of the conducting particles from waste printed circuit boards in corona electrostatic separators. J. Hazard. Mater. 2008, 151, 52–57. [Google Scholar] [CrossRef] [PubMed]
- Li, J.; Xu, Z.; Zhou, Y. Theoretic model and computer simulation of separating mixture metal particles from waste printed circuit board by electrostatic separator. J. Hazard. Mater. 2008, 153, 1308–1313. [Google Scholar] [CrossRef] [PubMed]
- Lu, H.; Li, J.; Guo, J.; Xu, Z. Movement behavior in electrostatic separation: Recycling of metal materials from waste printed circuit board. J. Mater. Process. Technol. 2008, 197, 101–108. [Google Scholar] [CrossRef]
- Wu, J.; Li, J.; Xu, Z. An improved model for computing the trajectories of conductive particles in roll-type electrostatic separator for recycling metals from WEEE. J. Hazard. Mater. 2009, 167, 489–493. [Google Scholar] [CrossRef] [PubMed]
- Kim, B.-U.; Han, O.-H.; Jeon, H.-S.; Baek, S.-H.; Park, C.-H. Trajectory analysis of copper and glass particles in electrostatic separation for the recycling of ASR. Metals 2017, 7, 434. [Google Scholar] [CrossRef]
- Kelly, E.; Spottiswood, D. The theory of electrostatic separations: A review part I. Fundamentals. Miner. Eng. 1989, 2, 33–46. [Google Scholar] [CrossRef]
- Kelly, E.; Spottiwood, D. The theory of electrostatic separations: A review part II. Particle charging. Miner. Eng. 1989, 2, 193–205. [Google Scholar] [CrossRef]
- Kelly, E.; Spottiswood, D. The theory of electrostatic separations: A review part III. The separation of particles. Miner. Eng. 1989, 2, 337–349. [Google Scholar] [CrossRef]
- Dodbiba, G.; Shibayama, A.; Miyazaki, T.; Fujita, T. Electrostatic separation of the shredded plastic mixtures using a tribo-cyclone. Phys. Sep. Sci. Eng. 2002, 11, 63–92. [Google Scholar] [CrossRef]
- Vlad, S.; Iuga, A.; Dascalescu, L. Numerical computation of conducting particle trajectories in plate-type electrostatic separators. IEEE Trans. Ind. Appl. 2003, 39, 66–71. [Google Scholar] [CrossRef]


| Materials | Copper | Aluminum | Glass | Other Materials | Total |
|---|---|---|---|---|---|
| Weight (g) | 5.39 | 0.74 | 50.76 | 3.26 | 60.15 |
| wt% | 8.96 | 1.23 | 84.39 | 5.42 | 100 |
| Experimental Conditions | |
|---|---|
| Feed rate (g/min) | 50 |
| Distance between electrode (m) | 0.6 |
| Initial speed (m/s) | 0.13 |
| Applied voltage (kV) | 10, 20, 30, 40 |
| Relative humidity (%) | 35, 45, 55, 65 |
| Splitter position (cm) | 7, 8, 9, 10 |
© 2018 by the authors. Licensee MDPI, Basel, Switzerland. This article is an open access article distributed under the terms and conditions of the Creative Commons Attribution (CC BY) license (http://creativecommons.org/licenses/by/4.0/).
Share and Cite
Kim, B.-U.; Park, C.-H. Electrostatic Separation of Copper and Glass Particles in Pretreated Automobile Shredder Residue. Metals 2018, 8, 879. https://doi.org/10.3390/met8110879
Kim B-U, Park C-H. Electrostatic Separation of Copper and Glass Particles in Pretreated Automobile Shredder Residue. Metals. 2018; 8(11):879. https://doi.org/10.3390/met8110879
Chicago/Turabian StyleKim, Beom-Uk, and Chul-Hyun Park. 2018. "Electrostatic Separation of Copper and Glass Particles in Pretreated Automobile Shredder Residue" Metals 8, no. 11: 879. https://doi.org/10.3390/met8110879