Article

Nominal Stress-Based Equal-Fatigue-Bearing-Capacity Design of under-matched HSLA Steel Butt-welded Joints

State Key Laboratory of Advanced Welding and Joining, Harbin Institute of Technology, Harbin 150001, China
*
Author to whom correspondence should be addressed.
Metals 2018, 8(11), 880; https://doi.org/10.3390/met8110880
Submission received: 24 September 2018 / Revised: 21 October 2018 / Accepted: 27 October 2018 / Published: 28 October 2018

Abstract

:
Under-matched welds could minimize the tendency of cold cracking and reduce the preheating operations when high strength steels are welded. However, its low load-carrying capacity might make the high strength parent metal meaningless. With the aim of improving the fatigue limit of under-matched butt-welded joints, this work establishes a nominal stress based fatigue design method for under-matched butt welds while considering its heterogeneous mechanical features. The fatigue life of the base metal is set to be the design goal for the under-matched butt-welded joints, which has scarce been tried before. An equal-fatigue-bearing capacity (EFBC) design method fit for the under-matched butt-welded joints is thus applied with the aims of equal fatigue limit of base metal. X-shaped butt-welded joint is selected to carry out experimental verification where HSLA steel Q550 as the base metal and ER70S-6 as the under-matched filler metal are used. The results show that the EFBC method proposed here is feasible. Note that the EFBC method is valid only in high cycle fatigue.

1. Introduction

In most engineering metallic structures, welded joints are often the locations for the crack initiation due to inherent metallurgical, geometrical stress concentration, heterogeneity in mechanical properties, and presence of residual stresses. Recently, multi-material design approach are adopted in building engineering structures where number of materials with significantly different mechanical properties are joined to produce weight and cost-efficient structures [1]. Structural weld joints, particularly bi-material (dissimilar) joints usually exhibit substantial mechanical heterogeneity in elastic-plastic deformation and fracture properties. This heterogeneity is commonly called “strength mismatch” and expressed as yield strength mismatch. Strength mismatch affects the constraint conditions near the crack tip, and hence have an effect on the fracture behavior and toughness of the structure [2]. For this reason, weld strength mismatch has been a topic of research.
The selection of welding process and consumables to achieve overmatching weld zone for protecting weld zone from deformations is a common practice in fabrication that limits the chances of risk failure at the welded joint. Many welding codes require weld filler metal for overmatching, primarily to protect weld from plastic strain localization when local stress exceeds the yield strength of the structure. However, for high strength steels, production of strength overmatching weld deposit usually creates difficulties while maintaining adequate fracture toughness and resistance against hydrogen assisted cracking. As a consequence, under-matched welds are sometimes used in joining high strength steels with the aim of minimizing hydrogen induced cold cracking tendency [3], reducing or even preventing costly preheating operations [4].
However, it should be noted that under-matched welds could have negative effect on the load-carrying capacity of the structural components, which makes the use of high strength parent metal meaningless. In fact, the performance of the structural component is related to the grade of mismatch, weld geometry, and loading mode [5]. The under-matched welds are particularly sensitive if the welds operate under tension perpendicular to the weld seam [1]. Thus, improving load-carrying capacity of under-matched welds while maintaining its advantage becomes a vital problem to be solved.
At present, the improvement methods of weld fatigue strength can be divided into two categories: Post-weld treatment (PWT) and pre-weld fatigue design. PWT includes tungsten inert gas welding (TIG) dressing, shot peening, roller-burnishing, ultrasonic impact, and the recently developed high-frequency mechanical impact (HFMI) technologies [6]. Many studies show that PWT can efficiently reduce the residual stress field and reduce the local weld defects [7]. As a result, the fatigue performance of welds can be significantly improved after reasonable PWT. Current fatigue design and assessment methods of welding structure follow many codes and standards including nominal stress method, structural stress method, effective notch stress method, and fracture mechanics method [8]. The global stress method (also known as the nominal stress method) is the simplest and widely used approach to design welds against fatigue. When either nominal stresses cannot be calculated unambiguously or a reference fatigue curve for a specific welded geometry is not available, either hot-spot or local stress based approaches are recommended to be used. The structural hot-spot stress method is applied on the component surface by determining linear-elastic stress states at either two or three reference points. Subsequently, structural stresses are extrapolated to the weld toes at the hot spots using these reference stress states. Structural stresses can be determined experimentally using strain gauges attached to the component’s surface at various distances from the weld toe or estimated via linear-elastic Finite Element (FE) models [9]. The effective notch stress approach uses linear-elastic stresses determined at either the weld toe or the weld root by introducing a fictitious fillet having radius equal to 1 mm. This strategy is applicable to welded joints with the thickness larger than (or equal to) 5 mm. On the contrary, when the relevant thickness is lower than 5 mm, the effective notch stress approach is recommended as being applied by using a fictitious radius of 0.05 mm [10]. This approach can be used to assess welded joint in which the fatigue crack initiation takes place not only at weld toes, but also at weld roots [11]. Fracture mechanics may be used to determine the fatigue properties of welded joints with imperfections. In such cases, to calculate the stress intensity factor the presence of an initial crack is assumed based on metallurgical evidence, the detection limit of the used inspection method, or fitting from fatigue data [8]. There are also other methods that have been developed to assess the fatigue behavior of welded components such as the Notch Stress Intensity Factors (NSIFs) approach and Strain Energy Density (SED) method [12].
Note that the PWT are suitable for all kinds of welding structures while the existing fatigue design and assessment methods are mainly focused on the homogeneous structures. In principle, the methods for homogenous structures can be applied to welded structures, if the fatigue properties of the weakest material are used; for instance, for overmatched welds, those of the base metal. However, such a simplified approach can lead to an unduly conservative result. Thus fatigue design and assessment methodology specific to strength mismatched structures was needed. In fact, SINTAP Procedure [13] introduced a novel flaw assessment route for strength mismatch welds which was also taken over by European Fitness for Service Network (FITNET) fitness-for-service (FFS) procedure [14] for the treatment of conventional multi-pass and advanced (laser and friction stir) welded structures [15]. However, this method mainly focuses on the assessment of defective welding structures under static tensile load. The fatigue design and assessment methods specific for strength mismatched structures are limited. Thus, improving fatigue performance of mismatched welds through reasonable fatigue design is a subject worth studying.
Welded joints display heterogeneous mechanical properties and also exhibit highly heterogeneous microstructural variations locally. Adequate fatigue design and assessment method consequently should be incorporated into such highly heterogeneous mechanical/microstructural features. Thus, the welded joints can be regarded as a kind of heterogeneous material and its fatigue behavior is related not only to the stress state, but also to the initiation position of fatigue cracks [16,17]. As different fatigue crack initiation sites of heterogeneous structure show disparate fatigue crack propagation paths. Meanwhile, the fatigue crack growth rate and the critical crack propagation size are material-related physical quantities [18,19], which is proved by various fatigue limit assessment techniques [20,21,22,23,24,25,26]. Consequently, changes in the geometric proportions of the constituent materials on the fatigue crack propagation path will directly affect the maximum fatigue bearing capacity of the heterogeneous material.
Under-matched welds are sometimes used in joining high strength steels with the aim of minimizing hydrogen induced cold cracking tendency, reducing or even preventing costly preheating operations. However, under-matched welds could lower the load-carrying capacity of the structural components. Meanwhile, the fatigue design and assessment methods specific for strength mismatched welded structures are limited. This is primarily because that welded joints display heterogeneous mechanical properties and also exhibit highly heterogeneous microstructural variations locally. In order to improve the fatigue limit of under-matched butt welds, this work tries to establish a fatigue design method for under-matched butt welds while considering its heterogeneous mechanical features.

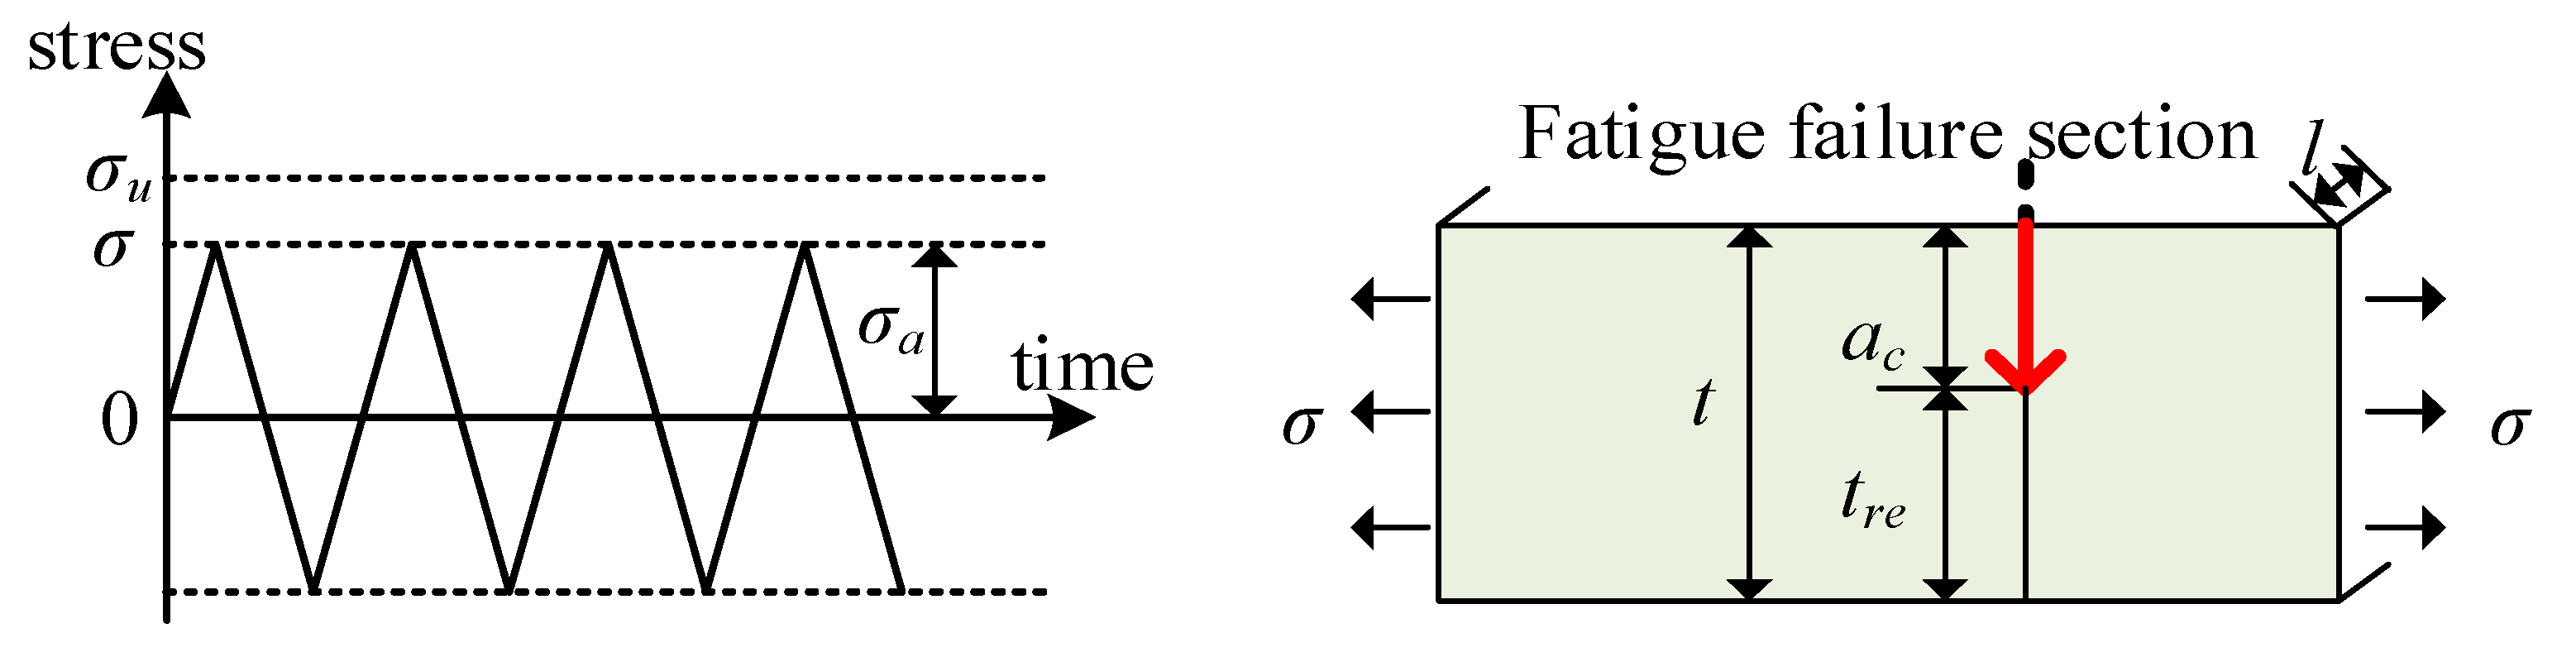
2. Nominal Stress Based Fatigue Assessment of Homogeneous Materials

The fatigue failure process of homogeneous materials shown in Figure 1 can be described as follows. The fatigue crack initiates and propagates to a certain length in the material. Then an instant rupture occurs when the stress value of the remaining bearing section of the specimen reaches the tensile strength σu of the homogeneous material [27,28].
From the fatigue failure process of homogeneous materials, it can be seen that the fatigue life of homogeneous materials N corresponds to the number of cycles before the fatigue crack propagates to the instant rupture section, tre. The dimension of the fatigue crack before reaching the instant rupture section can be referred to as the critical crack expansion dimension, ac.
A material fatigue failure process can be divided into three phases, namely the crack initiation phase, the crack propagation phase, and the instant rupture phase, to estimate the number of cycles experienced by fatigue cracks. Then the material strain-life (Δε-Ni) curve is used to obtain fatigue crack initiation life Ni [29,30], and the number of cycles Np experienced by a fatigue crack when propagating to a certain dimension is calculated taking integral of Paris formula [31,32]. Finally, Np is added to Ni to obtain the number of cycles experienced by a fatigue crack with a certain size. The main problem of this method is that the definition of fatigue crack initiation is not uniform, which will bring certain calculation error, and is inconvenient to use.
Since Wohler discovered the nominal stress–fatigue life (S–N) curve [33], it has undoubtedly become the most intuitive and effective method for characterizing the fatigue properties of materials. Many researchers, including Basquin [34], summed up the functional relationship between nominal stress and fatigue life of homogeneous materials on the basis of a large amount of material fatigue data, and continuously improved it. Most of the results show that there is an exponential relationship between the nominal stress on the load-bearing cross-section of the homogeneous material and the fatigue life in the high-cycle fatigue stage (1 × 10⁴–2 × 10⁶ stress cycles), that is:
( σ ) m · N = C
where m and C are material-related constants.
According to the nominal stress–fatigue life function of homogeneous materials, researchers can easily estimate the fatigue life of homogeneous materials under certain fatigue loads. However, the fatigue life N obtained from the nominal stress–fatigue life curve of the homogeneous material is just a result and cannot fully reflect the variation of fatigue crack growth rate during fatigue crack propagation. Therefore, to use the nominal stress–fatigue life curve of homogeneous material to estimate the number of cycles that a fatigue crack undergoes when expanding a certain dimension in a homogeneous material, the average propagation rate of fatigue cracks v ¯ needs to be introduced,
v ¯ = a c / N
Thus, the number of cycles Na experienced by a fatigue crack of a certain size a in the homogeneous material can be estimated according to the following equation:
N a = a / v ¯ = a · C · ( t · l ) m ( t P σ u · l ) · ( P ) m

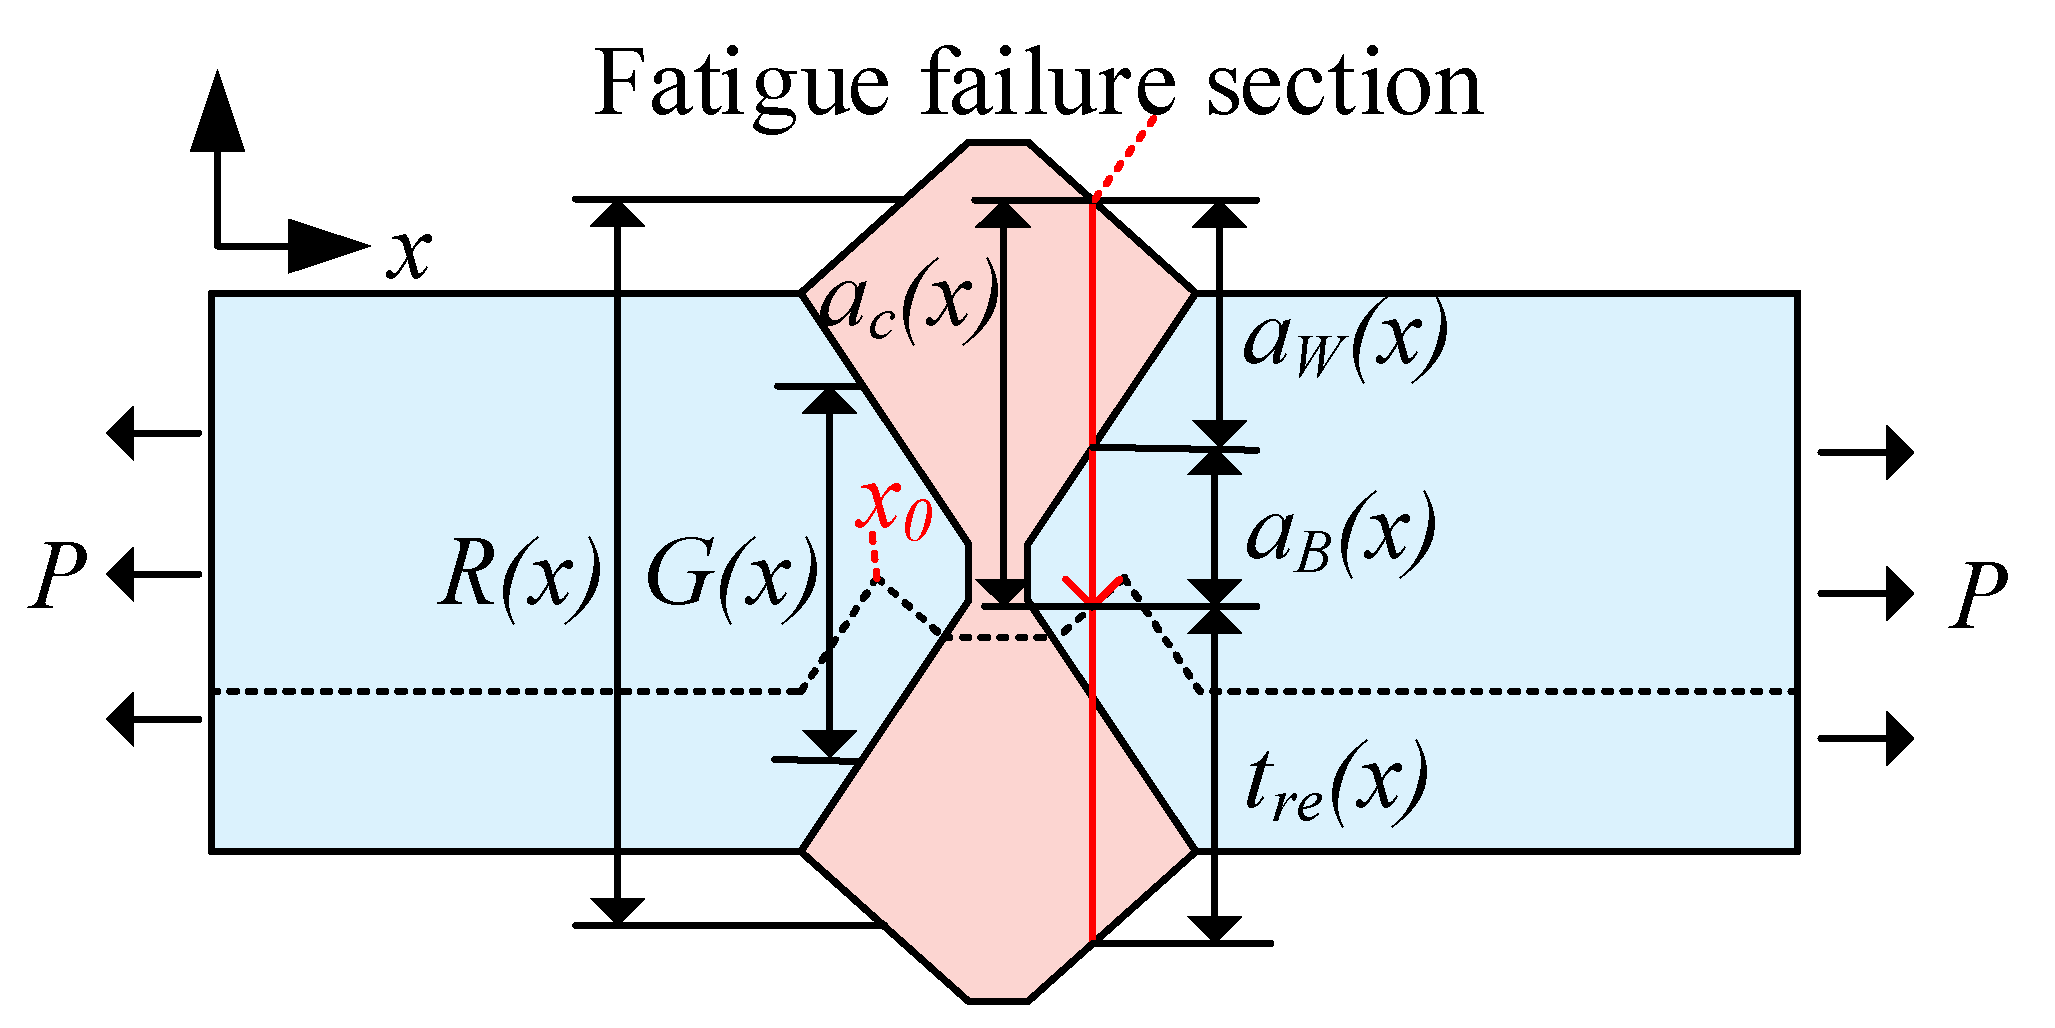
3. Nominal Stress Based Fatigue Assessment of Heterogeneous Materials

The heterogeneous material shown in Figure 2a is composed of homogenous materials L and H, and the tensile strength and fatigue limit of L are lower than that of H (shown in Figure 2b). Besides, the geometrical proportion of L and H varies along the loading direction. For a single crack initiates at the edge, the fatigue failure process of such heterogeneous material can be described as follows. The fatigue crack expands aL in the material L and aH in the material H. As the fatigue crack continues to grow, the stress on the remaining section of the material increases continuously. When the stress on the remaining section of the specimen reaches at a certain value, the instant rupture occurs in the heterogeneous material.
Similar to homogeneous materials, heterogeneous materials also show two-stage fatigue failure such as fatigue crack propagation and instant rupture. The difference in fatigue failure is that fatigue cracks may penetrate more than one material when spread in heterogeneous materials. In addition, the instant rupture section of homogeneous materials is only related to fatigue loading and material properties. However, the instant rupture section of the heterogeneous material is related not only to the fatigue load and the materials properties, but also to the geometric proportions of constituent materials on the load-bearing cross-section of the heterogeneous material.
The instant rupture section, tre(x) of the heterogeneous material shown in Figure 2 is a continuous piecewise function related to the crack initiation position x and can be described as follows:
t r e ( x ) = { P / ( σ u H · l ) + S L ( a , x ) , x x 0 P / ( σ u L · l ) , x x 0 }
where S L ( a , x ) represents the size of L on the remaining bearing section.
The load-bearing cross-section at x = x 0 can be called the characteristic load-carrying section. When the fatigue crack initiates at the characteristic load-carrying section, H would just meet the failure requirement after failure of L.
The fatigue life of the heterogeneous material shown in Figure 2 is the sum of the number of cycles consumed by L and H on the fatigue crack propagation path. According to (3), the fatigue life of the heterogeneous material can be expressed as follows:
N ( x ) = a L ( x ) · 1 a c L N L ( x ) + a H ( x ) · 1 a c H N H ( x )
where aL c(x) represents the critical fatigue crack length when the load bearing section size of L is t(x) and the nominal stress at the bearing section is σ. aH c(x) represents the critical fatigue crack length when the bearing section size of H is t(x) and the nominal stress at the bearing section is σ. L(x) represents the distribution function of L’s dimension along the x direction on the cross section of the heterogeneous material, while H(x) represents the distribution function of H’s dimension along the x direction on the cross section of the heterogeneous material. aL(x) and aH(x) respectively represents the size of the fatigue crack propagation through L and H before the fatigue crack propagates to the instant rupture section. NL(x) and NH(x) indicate the fatigue life of L and H when subjected to nominal fatigue stress σ, respectively. According to the nominal stress–fatigue life relationship of homogeneous materials (Equation (3)), NL(x) and NH(x) are functions related to the fatigue load P and the cross-sectional dimension t(x) of the heterogeneous material.
When the fatigue load P, the mechanical properties and geometric proportions of the constituent materials of the heterogeneous material are known, the fatigue life of the heterogeneous material can be further expressed as:
N ( x ) = C L · a L ( L ( x ) , H ( x ) ) · [ L ( x ) + H ( x ) ] m L [ L ( x ) + H ( x ) P σ u L · l ] · ( P l ) m L + C H · a H ( L ( x ) , H ( x ) ) · [ L ( x ) + H ( x ) ] m H [ L ( x ) + H ( x ) P σ u H · l ] · ( P l ) m H
Equation (6) shows that the fatigue life N(x) of the heterogeneous material that is related to geometric parameters L(x), H(x), the fatigue load P (kN), and mechanical properties of each component material.

4. Nominal Stress based EFBC Design of Under-Matched Butt-Welded Joints

Welded joints is a typical form of heterogeneous material with characteristics of heterogeneous materials. Therefore, the fatigue life estimation method for heterogeneous materials can be applied to welded joints.
In order to obtain equal fatigue limit of the welded joints with that of the parent metal, the fatigue limit of each cross section of the welded joint is required to be equal to that of the base metal NB, which can be expressed as:
N(x) = NB
Here we simplified the welded joints into bi-material model, so that the fatigue life estimation method for heterogeneous materials can be directly applied to welded joints. In addition, different groove forms in welded joints may affect the expression of each parameter in Equation (6). X-shaped butt-welded joints, as shown in Figure 3, Equation (6) is transformed to Equation (8).
N B = C W · [ R ( x ) G ( x ) ] · [ R ( x ) ] m W 2 · [ R ( x ) P σ b W · l ] · ( P l ) m W + C B · [ R ( x ) + G ( x ) t r e ( x ) ] · [ R ( x ) ] m B 2 · [ R ( x ) P σ b B · l ] · ( P l ) m B
The instant rupture section of the butt-welded joint, tre(x) in Equation (8) is a piecewise function that depends on the crack initiation position.
t r e ( x ) = { P σ b B · l + R ( x ) G ( x ) 2 , x x 0 P σ b W · l , x 0 x 0 }
The bearing section at x = x 0 is the characteristic bearing section of the butt-welded joint. When the welded joint experiences fatigue failure at the characteristic bearing section, the base metal would just meet the failure requirements after the failure of weld metal.
When the groove function G(x), fatigue load P, and the mechanical parameters of the base metal and the deposited metal are known, the geometric dimension R(x) of the X-shaped butt joint can be well-determined according to the EFBC realizing condition Equation (7). The curve enclosed by R(x) is the critical design curve for the EFBC butt-welded joint. The reason why this is called the critical design curve is that the design of the butt-welded joint according to this curve just makes the butt-welded joint equal fatigue bearing capacity to the base metal. This curve is unique, too.
When the fatigue life estimation method of heterogeneous materials is used, the S–N curve fitting function for homogeneous materials is employed. The effect of local stress concentration on the test piece is neglected as a prerequisite of nominal stress method. However, welded joints possess inevitable stress concentration due to geometric changes, especially at the weld toe, where the stress concentration is severe. In order to meet the preconditions of the application of nominal stress, the obtained critical design curve of the butt-welded joint needs to be geometrically optimized to reduce the local stress concentration. The geometric optimization method is not unique [35,36], but the optimized butt-welded joint design curve should contain the critical design curve to completely ensure that the butt-welded joint can meet the EFBC requirements.
This study adopts three-tangent-circle method to optimize the critical design curve of welded joints. As shown in Figure 4, due to the symmetry of the butt joints, only two radiuses, r1 and r2, need to be determined. The influence of the change of r1 on the stress concentration factor at the weld toe can be investigated using finite element method (FEM) to determine r1. Then r2 is determined according to the geometric relationship of the three tangent circles. As shown in Figure 5, the final butt-welded joint design parameters include the height of the reinforcement (h), the cover width (2w) of the reinforcement, and the radius of transition arc r1, r2.

5. Experimental Verification

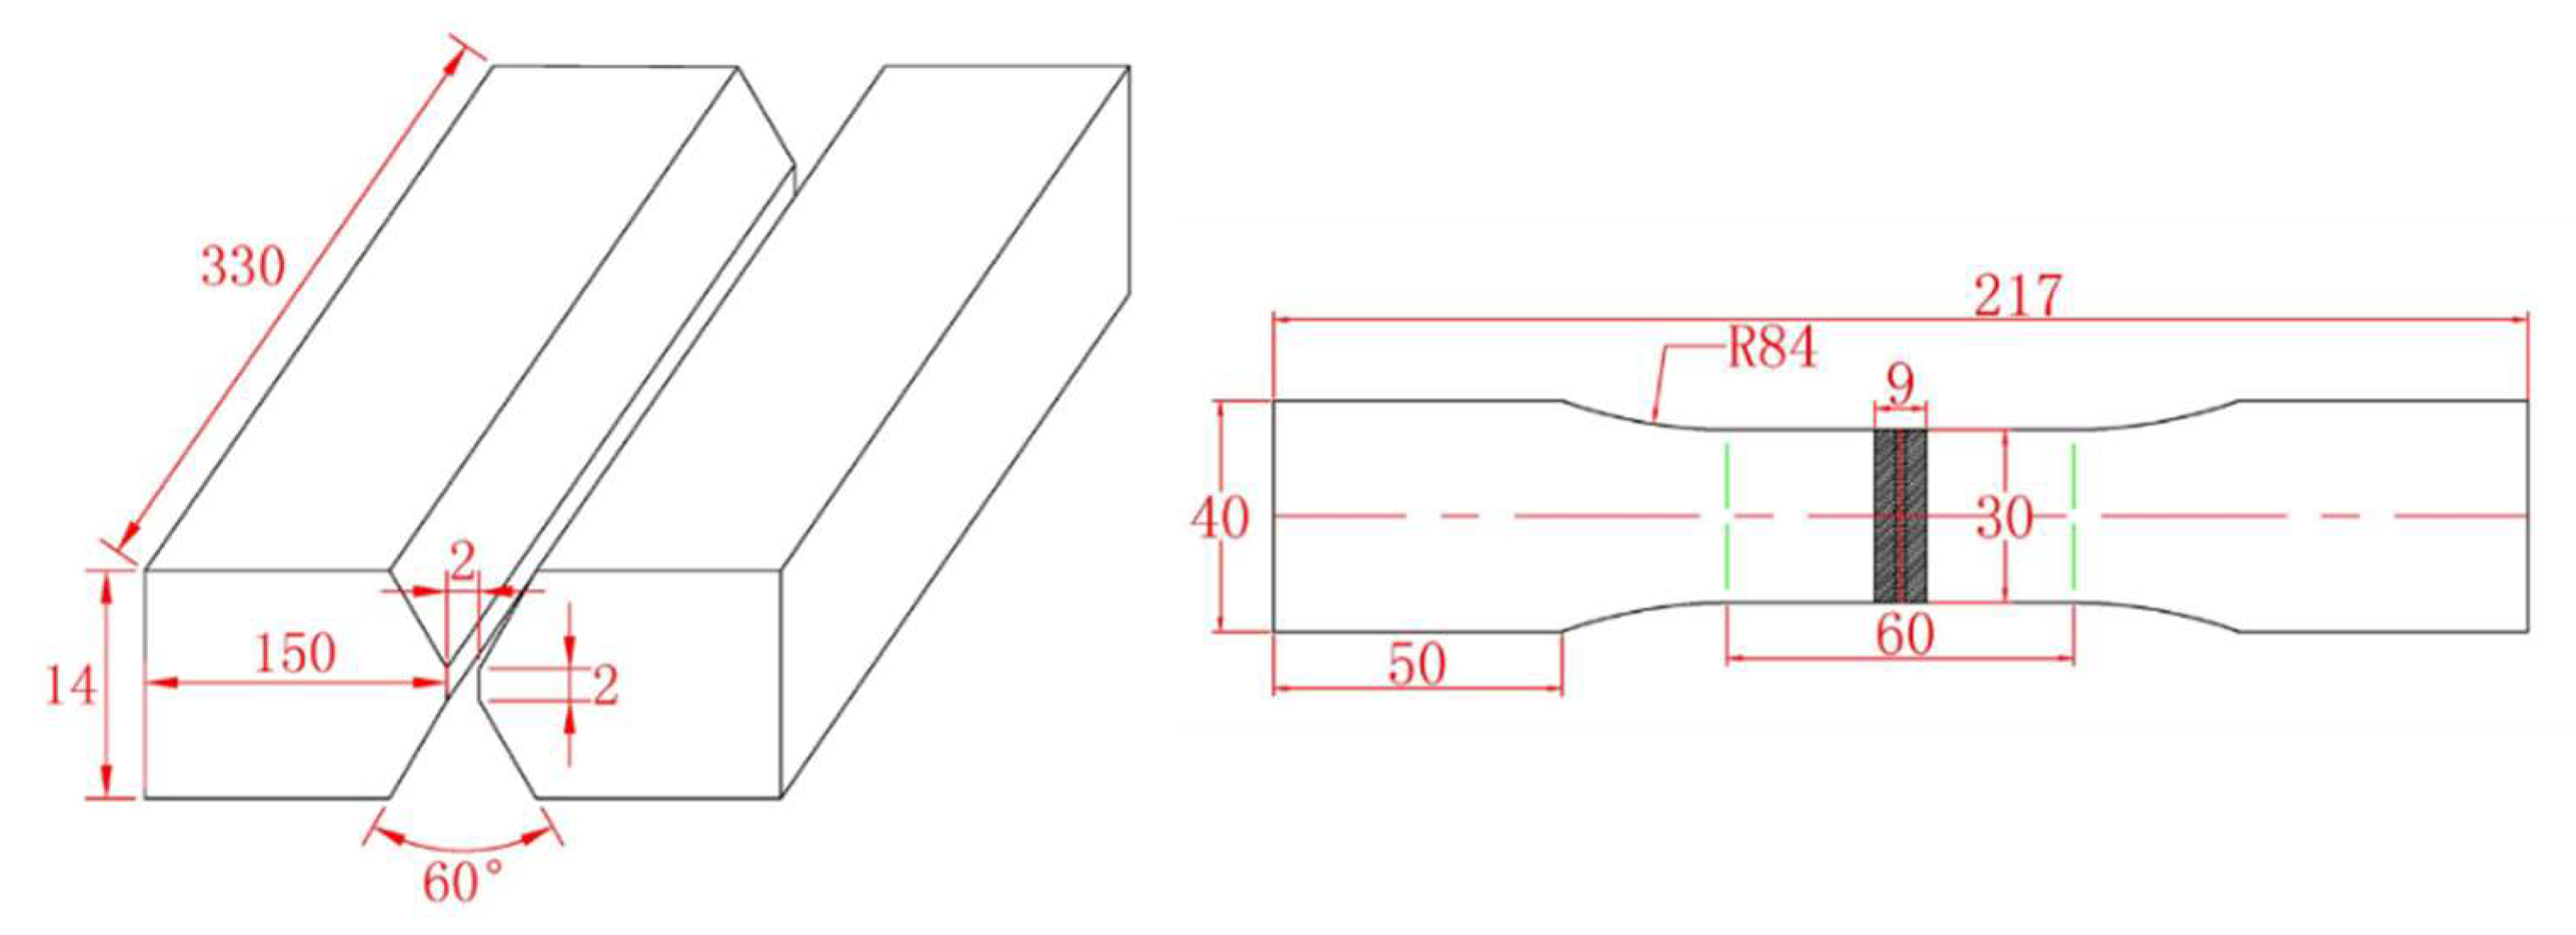
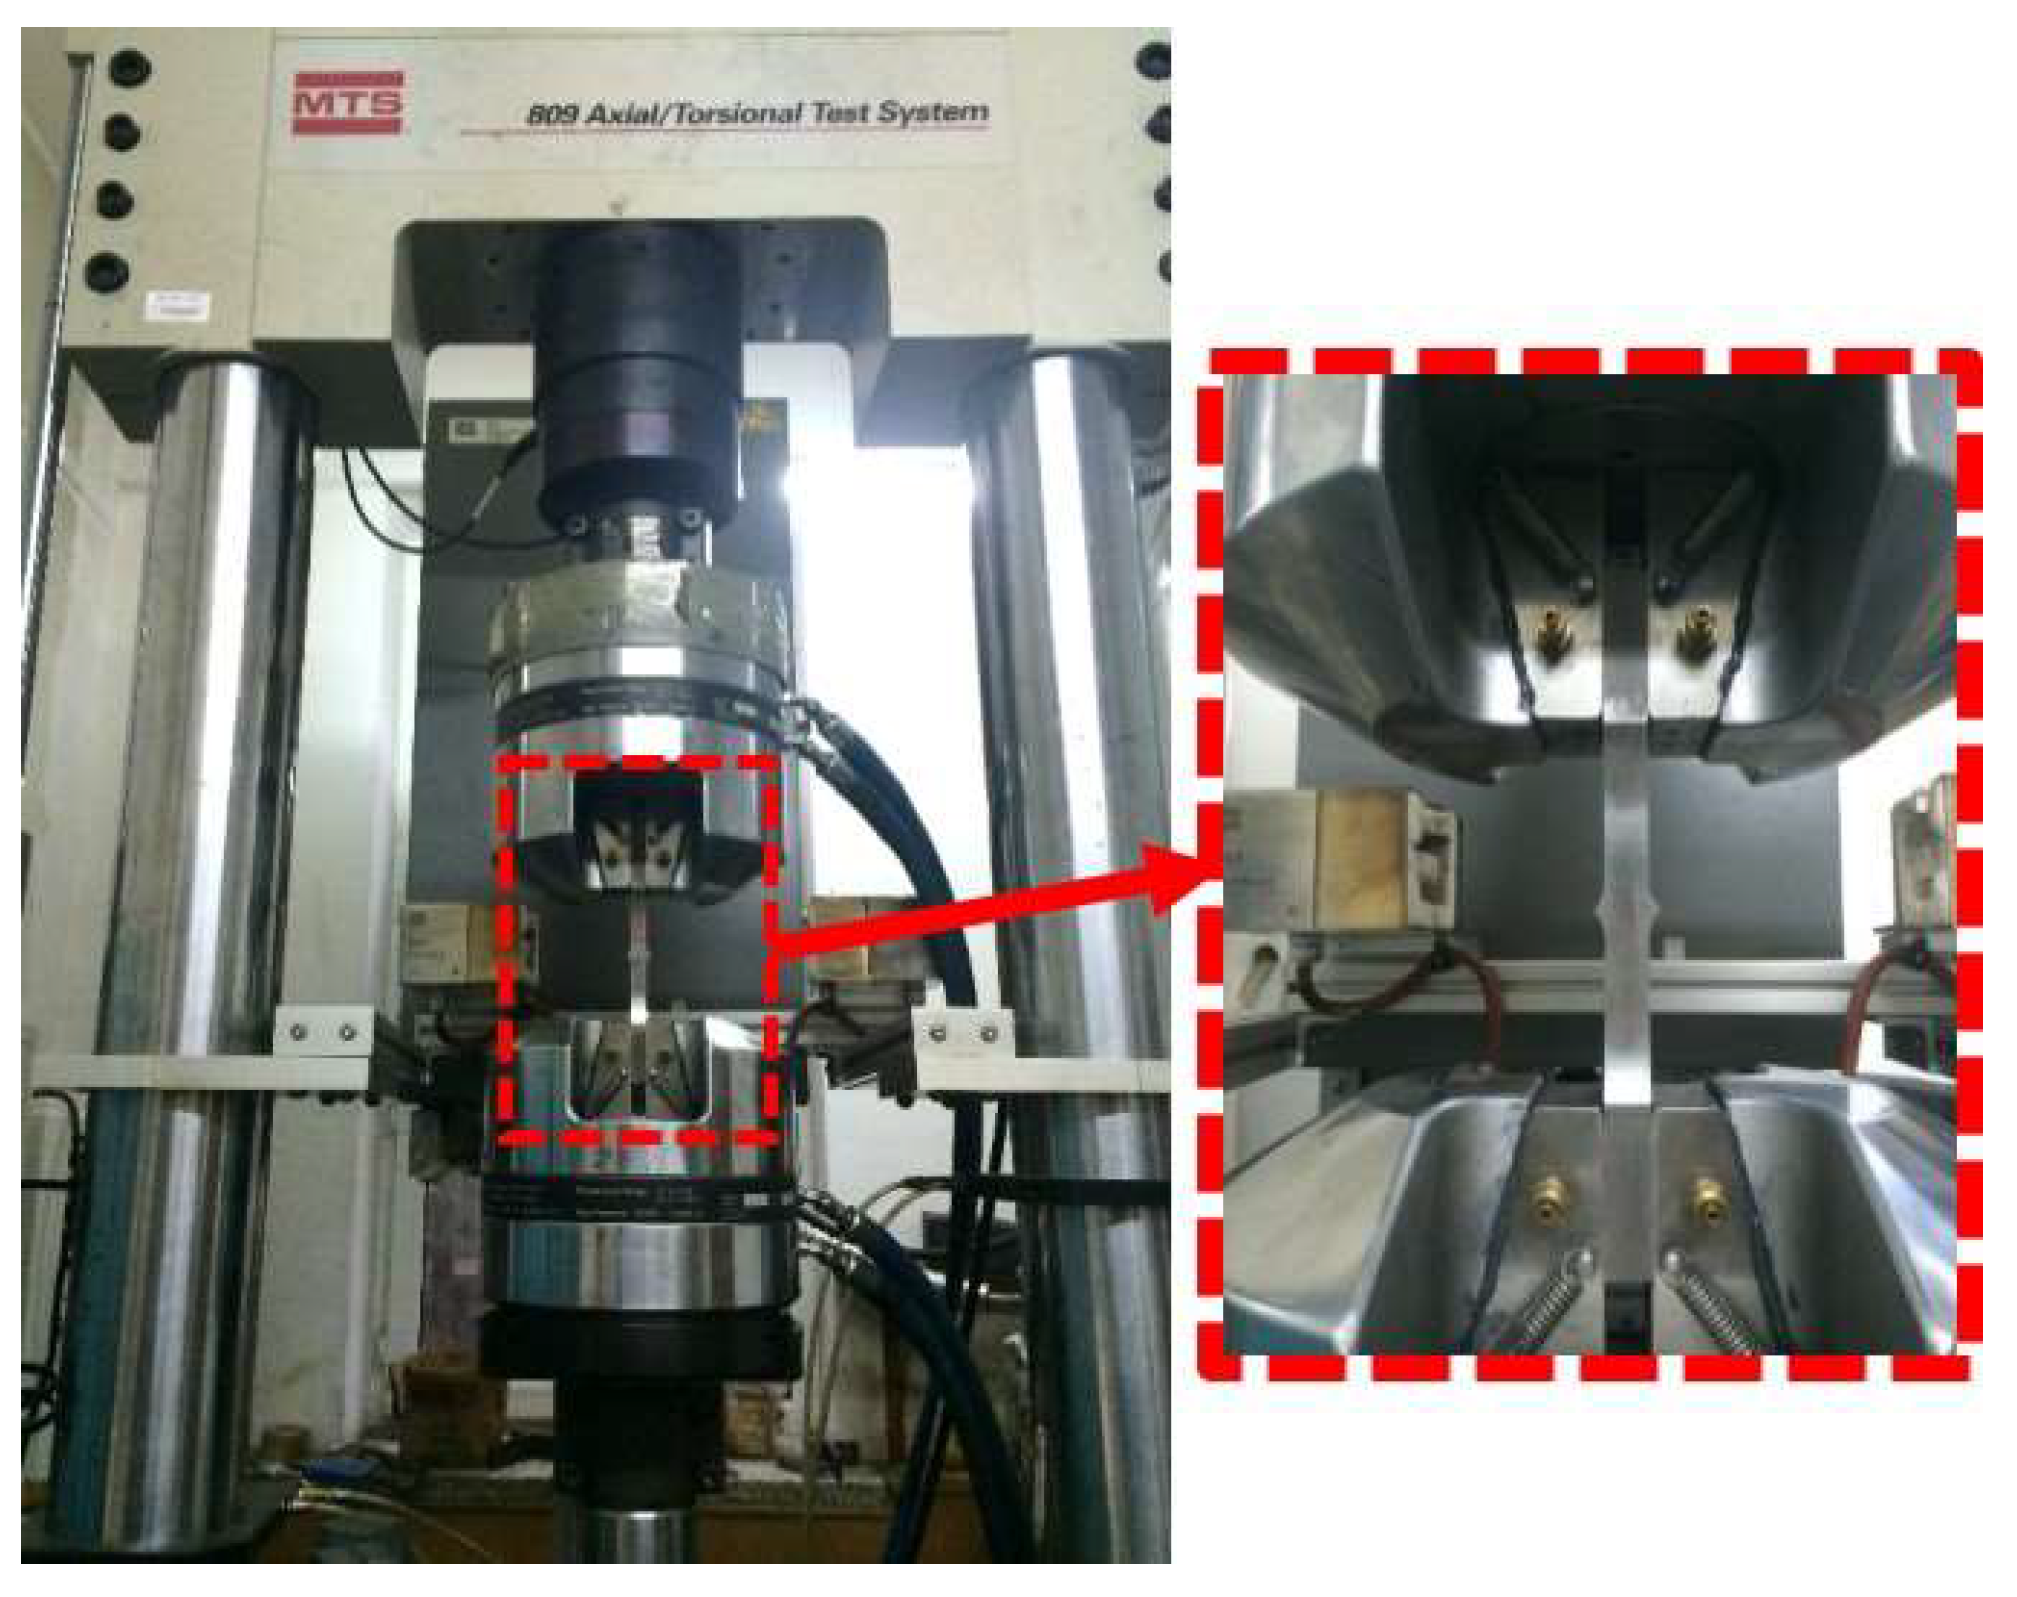
5.1. Test Specimen and Procedure

A HSLA steel Q550 (14 mm thick, 150 mm wide, 330 mm long) plate/sheet (Benxi Steel Group corporation, Benxi, China) and a welding wire ER70S-6 (diameter 1.2 mm) (Atlantic China Welding Consumables Company Limited, Zigong, China)were used as experimental materials for EFBC design and experimental verification of X-shaped butt-welded joints. The chemical composition and mechanical properties of the base metal and deposited metal are shown in Table 1. The S–N curve fitting function of the base metal and the deposited metal up to conventional fatigue limit (1 × 10⁷) was obtained using the tensile strength of the base metal and the deposited metal according to the method proposed by Meggiolaro [28]. The geometric parameters of the base metal and the fatigue specimen of butt-welded joints are shown in Figure 6.
The known conditions were brought into the EFBC realizing condition (7) of X-shaped butt-welded joints, and the critical design curve of X-shaped butt-welded joints with a design life of 2 million cycles was obtained.
Any discontinuity in a component alters the stress distribution on the neighborhood of the discontinuity. These stress concentrations (or can be called by stress raisers) often lead to local stresses higher than the nominal stress that would be calculated without considering the stress concentration effects. The theory of stress concentration factor [37] states that Kt is the ratio of the maximum local stress in the region of discontinuities to the nominal net section stress. It simply can be calculated by:
Kt = Smax/Snominal
where Smax represents the maximum local Von Mises stress and Snominal represents the nominal net section stress. It should be noted that the value of Kt is valid only for stress levels within the elastic range.
To reduce the stress concentration at the weld toe, a three-tangent-circle method is used to optimize the critical design curve of the butt-welded joint. Finite element method (FEM) method is employed to obtain the maximum local Von Mises stress. Abaqus 6.13 (Dassault Systèmes Americas Corporation, Waltham, MA, USA) is used to undertake FE linear-elastic analysis. Figure 7 shows the FEM model of the designed welded joint which is subjected to a uniaxial tensile load in the x direction. Half of the designed welded joint in the x direction is analyzed in the 2-D FEM calculations, taking into account the symmetry of the joint, as shown in Figure 7. The Young’s modulus 210 GPa and Poisson ratio 0.3 of common steels are used for analysis. The geometric properties correspond to those obtained by theoretical analysis and used in experiments. The weld toe is located at x = 0 in the illustrated coordinate axis. 8-node plane strain elements (CPE8) are used for analysis. The global mesh size is 0.5 mm and the total number of elements and nodes employed in the calculations are 928 and 2891, respectively. The initial tensile load is 100 MPa.
The obtained Mises stress and calculated nominal stress are applied to Equation (10) to get the stress concentration factor. The influence of the transition arc radius r1 on the distribution of the stress concentration factor along the welded joint is shown in Figure 8. The results show that the stress concentration factor at the weld toe gradually decreases with increasing r1. When r1 is 12 mm, the stress concentration factor at the weld toe decreases to 1.06. When r1 > 12mm, the degree of decrease in the stress concentration factor becomes lower, so r1 is chosen to be 13 mm. Then, according to the geometric relationship in three tangent circles shown in Figure 4, r2 is determined to be 0.8 mm.
The final design results of butt-welded joints are shown in Figure 9. The optimized fatigue design curve contains the critical design curve of butt-welded joints.
The welding process of this study includes a combination of TIG (Manual) and MAG to ensure the quality of welded joints. The specific welding procedure and corresponding parameters are shown in Table 2 and Figure 10.
As shown in Figure 10, the fatigue specimen is taken perpendicular to the welding direction. Wire-cutting and grinding were performed to the designed butt-welded joint, as shown in Figure 11, and the surface of the fatigue test specimen does not any obvious processing marks perpendicular to the loading direction. The macrograph of the welded joint was obtained by etching with a mixture solution of 4 vol.% nitric acid and 96 vol.% alcohol. Fatigue test of designed welded joint was conducted using electro-hydraulic servo fatigue testing machine (MTS 809 shown in Figure 12, MTS Systems Corporation, Eden Prairie, MN, USA).

5.2. Results and Discussion

There is a total number of three specimens are tested. The test results are shown in Table 3, where σa is the stress amplitude applied to the specimens and f is the loading frequency. R represents the stress ratio and T is the ambient temperature.
Statistical analysis of the fatigue data is carried out according to ISO 12107: 2012 [38] and the results are shown in Table 4. Where p corresponds to the reliability of the prediction (say 99% probability) and (1−α) is the confidence of the reliability statement. The coefficient k(P, 1−α) is the one-sided tolerance limit for a normal distribution, as given in ISO 12107: 2012 [38].
The statistical analysis results show that the lower limit of the fatigue life for a 0.1% probability of failure, at a confidence level of 95%, is 2,233,012, which is much higher than the design life of 2 million stress cycles. The results prove that the designed joint can meet the load-bearing requirements. Besides, according to the fatigue resistance S–N curves for steel (normal stress) based on nominal stress given by IIW [8], the highest fatigue limit of butt-welded joints under normal stress occurs in butt weld ground flush to plate (X-groove or V-groove, FAT. St. 112), which is much lower than the stress amplitude employed here. This illustrates that the combination of fatigue design and PWT method proposed here is reasonable and feasible.
Although the fatigue design method given in this study is effective, there are also certain preconditions and limitations on its application. Firstly, overall elastic behavior is assumed. This is because that the Basquin’s S–N curve exponential fitting formula is used in the design process which is only valid in high cycle fatigue of metallic material. Secondly, the residual stress of welded joints is sufficiently released during the sampling process and PWT, so that the experimental results agree well with our prediction although the residual stress is not considered during the design process. Actually, the influence of residual stress on fatigue behavior of welded joints is still a subject worth studying. However, there are simplified methods for the operator to take the residual stress into consideration, such as the fatigue enhancement factor f(R) recommended by IIW [8].

6. Conclusions

In order to improve the fatigue limit of under-matched butt welds, this work attempts to establish a fatigue design method for under-matched butt welds while considering its heterogeneous mechanical features. Following conclusions are listed below.
(1) Through analyzing the fatigue failure process of the homogeneous material, a nominal stress based method for estimating the fatigue life of homogeneous materials is summarized which can be used to estimate the number of cycles experienced by a fatigue crack when expanding a certain size in the homogeneous material.
(2) The welded joint is simplified into a bi-material heterogeneous material. By studying the relationship and difference between the fatigue failure process of heterogeneous materials and homogeneous materials, the fatigue life estimation method of homogeneous materials is generalized to heterogeneous materials, and a nominal stress based fatigue life estimation method of heterogeneous materials is obtained.
(3) The fatigue life estimation method for heterogeneous materials was applied to the fatigue design of under-matched butt-welded joints and the fatigue life of the base metal was set as the design goal. An EFBC design method for the under-matched butt-welded joints was thus applied with the aim of equal fatigue limit to the base metal.
(4) X-shaped butt-welded joint was selected to carry out experimental verification where HSLA steel Q550 as the base metal and ER70S-6 as the filler metal were used. The results show that the fatigue design method of butt-welded joints proposed here was feasible.

Author Contributions

X.W. and Y.L. performed the experiments; X.W., P.W., Z.D., and H.F. analyzed the data; X.W. and H.F. wrote the paper.

Funding

This research received no external funding.

Acknowledgments

The authors are grateful to their family and friends for their invaluable support in accomplishing the work.

Conflicts of Interest

The authors declare no conflict of interest.

References

  1. Koçak, M. Structural integrity of welded structures: Process–property–performance (3P) relationship. In Proceedings of the 63rd Annual Assembly and International Conference of the International Institute of Welding, Istanbul, Turkey, 11–16 July 2010. [Google Scholar]
  2. Rakin, M.; Medjo, B.; Gubeljak, N.; Sedmak, A. Micromechanical assessment of mismatch effects on fracture of high-strength low alloyed steel welded joints. Eng. Fract. Mech. 2013, 1093, 221–235. [Google Scholar] [CrossRef]
  3. Umekuni, A.; Masubuchi, K. Usefulness of under-matched welds for high-strength steels. Weld. J. 1997, 76, 256s. [Google Scholar]
  4. Loureiro, A.J.R. Effect of heat input on plastic deformation of under-matched welds. J. Mater. Process. Technol. 2002, 128, 240–249. [Google Scholar] [CrossRef]
  5. Ravi, S.; Balasubramanian, V.; Babu, S.; Nasser, S.N. Assessment of some factors influencing the fatigue life of strength mismatched HSLA steel weldments. Mater. Des. 2004, 25, 125–135. [Google Scholar] [CrossRef]
  6. Marquis, G.B.; Barsoum, Z. IIW Recommendations on High Frequency Mechanical Impact (HFMI) Treatment for Improving the Fatigue Strength of Welded Joints. In IIW Recommendations for the HFMI Treatment; Springer: Singapore, 2016; pp. 1–34. [Google Scholar]
  7. Walbridge, S.; Nussbaumer, A. A probabilistic assessment of the effect of post-weld treatment on the fatigue performance of tubular truss bridges. Eng. Struct. 2008, 30, 247–257. [Google Scholar] [CrossRef] [Green Version]
  8. Hobbacher, A. Recommendations for Fatigue Design of Welded Joints and Components; Springer: Berlin, Germany, 2016. [Google Scholar]
  9. Dong, P.; Hong, J.K.; De Jesus, A.M. Analysis of recent fatigue data using the structural stress procedure in ASME Div 2 rewrite. J. Press. Vessel Technol.-Trans. 2007, 129, 355–362. [Google Scholar] [CrossRef]
  10. Sonsino, C.M.; Fricke, W.; de Bruyne, F.; Hoppe, A.; Amhadi, A.; Zhang, G. Notch stress concepts for the fatigue assessment of welded joints–Background and applications. Int. J. Fatigue. 2012, 34, 2–16. [Google Scholar] [CrossRef]
  11. Zamzami, I.A.; Susmel, L. On the accuracy of nominal, structural, and local stress based approaches in designing aluminum welded joints against fatigue. Int. J. Fatigue. 2016, 101, 137–158. [Google Scholar] [CrossRef]
  12. Chebat, F.; Peron, M.; Viespoli, L.M.; Welo, T.; Berto, F. Fatigue Strength Assessment of Steel Rollers: On the Reliability of the Strain Energy Density Approach on Real Components. Appl. Sci. 2018, 8, 1015. [Google Scholar] [CrossRef]
  13. Kim, Y.J.; Koçak, M.; Ainsworth, R.A.; Zerbst, U. SINTAP defect assessment procedure for strength mismatched structures. Eng. Fract. Mech. 2000, 67, 529–546. [Google Scholar] [CrossRef]
  14. Koçak, M. FITNET fitness-for-service procedure: an overview. Weld. World. 2007, 51, 94–105. [Google Scholar] [CrossRef]
  15. Hadley, I. Validation of the European FITNET Fitness-For-Service Procedure: Incorporation of Weld Strength Mismatch into Fracture Assessment (Options 2 and 3); TWI Industrial Member Report Summary 890/2007; TWI: Cambridge, UK, 2007. [Google Scholar]
  16. Ravi, S.; Balasubramanian, V.; Nasser, S.N. Effect of notch location on fatigue crack growth behavior of strength-mismatched high-strength low-alloy steel weldments. J. Mater. Eng. Perform. 2004, 13, 758–765. [Google Scholar] [CrossRef]
  17. Zhang, C.; Lu, P.; Hu, X.; Song, X. Effect of buffer layer and notch location on fatigue behavior in welded high-strength low-alloy. J. Mater. Process. Technol. 2012, 212, 2091–2101. [Google Scholar] [CrossRef]
  18. Shanmugam, K.; Lakshminarayanan, A.K.; Balasubramanian, V. Effect of weld metal properties on fatigue crack growth behavior of gas tungsten arc welded AISI 409M grade ferritic stainless steel joints. Int. J Pres. Ves Pip. 2009, 86, 517–524. [Google Scholar] [CrossRef]
  19. Donato, G.H.; Magnabosco, R.; Ruggieri, C. Effects of weld strength mismatch on J and CTOD estimation procedure for SE (B) specimens. Int. J. Fracture. 2009, 159, 1–20. [Google Scholar] [CrossRef]
  20. Świątczak, T.; Tomczyk, M.; Więcek, B.; Pawlak, R.; Olbrycht, R. Defect detection in wire welded joints using thermography investigations. Mater. Sci. Eng. B. 2012, 177, 1239–1242. [Google Scholar] [CrossRef]
  21. Ummenhofer, T.; Medgenberg, J. On the use of infrared thermography for the analysis of fatigue damage processes in welded joints. Int. J. Fatigu. 2009, 31, 130–137. [Google Scholar] [CrossRef]
  22. Palumbo, D.; De Finis, R.; Serio, L.M.; Galietti, U.; De Filippis, L.A.C. Thermographic signal analysis of friction stir welded AA 5754 H111 joints. Proceedings of SPIE—The International Society for Optics and Photonics, San Diego, CA, USA, 19–23 August 2018. [Google Scholar]
  23. Corigliano, P.; Epasto, G.; Guglielmino, E.; Risitano, G. Fatigue analysis of marine welded joints by means of DIC and IR images during static and fatigue tests. Eng. Fract. Mech. 2017, 183, 26–38. [Google Scholar] [CrossRef]
  24. De Filippis, L.A.C.; Serio, L.M.; Palumb, D.; De Finis, R.; Galietti, U. Optimization and characterization of the Friction Stir Welded Sheets of AA 5754-H111: Monitoring of the quality of joints with thermographic techniques. Materials 2017, 10, 1165. [Google Scholar] [CrossRef] [PubMed]
  25. Ganesh, K.C.; Vasudevan, M.; Balasubramanian, K.R.; Chandrasekhar, N.; Mahadevan, S.; Vasantharaja, P.; Jayakumar, T. Modeling, prediction and validation of thermal cycles, residual stresses and distortion in type 316 LN stainless steel weld joint made by TIG welding process. Procedia Eng. 2014, 86, 767–774. [Google Scholar] [CrossRef]
  26. Tomlinson, R.A.; Marsavina, L. Thermoelastic investigations for fatigue life assessment. Exp. Mech. 2004, 44, 487–494. [Google Scholar] [CrossRef] [Green Version]
  27. Chandran, K.R. A universal functional for the physical description of fatigue crack growth in high-cycle and low-cycle fatigue conditions and in various specimen geometries. Int. J. Fatigue 2017, 102, 261–269. [Google Scholar] [CrossRef]
  28. Chandran, K.R. A physically based universal functional to characterize the mechanism of fatigue crack growth in materials. Scr. Mater. 2015, 107, 115–118. [Google Scholar] [CrossRef]
  29. Meggiolaro, M.A.; Castro, J.T.P. Statistical evaluation of strain-life fatigue crack initiation predictions. Int. J. Fatigue 2004, 26, 463–476. [Google Scholar] [CrossRef]
  30. Brennan, F.P. The use of approximate strain-life fatigue crack initiation predictions. Int. J. Fatigue 1994, 16, 351–356. [Google Scholar] [CrossRef]
  31. Paris, P.C.; Gomez, M.P.; Anderson, W.E. A rational analytic theory of fatigue. Trend Eng. 1961, 13, 9. [Google Scholar]
  32. Paris, P.C. A critical analysis crack propagation laws. J. basic eng. 1963, 85, 528–533. [Google Scholar] [CrossRef]
  33. Suresh, S. Fatigue of Materials. Cambridge University Press: Cambridge, UK, 1998. [Google Scholar]
  34. Basquin, O.H. The Exponential Law of Endurance Tests. Proc. Am. Soc. Test. Mater. 1910, 2, 625–630. [Google Scholar]
  35. Mattheck, C.; Baumgartner, A.; Kriechbaum, R.; Walther, F. Computational methods for the understanding of biological optimization mechanisms. Comp. Mater. Sci. 1993, 1, 302–312. [Google Scholar] [CrossRef]
  36. Sokołowski, J.; Zolésio, J.P. Introduction to Shape Optimization: Shape Sensitity Analysis; Springer: Berlin/Heidelberg, Germany, 1992; pp. 7432–7437. [Google Scholar]
  37. Pilkey, W.D.; Pilkey, D.F. Peterson’s Stress Concentration Factors; John Wiley & Sons: Hoboken, NJ, USA, 2008. [Google Scholar]
  38. ISO 12107: 2012. Metallic Materials-Fatigue Testing-Statistical Planning and Analysis of Data; ISO Copyright Office: Geneva, Switzerland, 2012. [Google Scholar]
Figure 1. Fatigue failure process of homogeneous materials.
Metals 08 00880 g001
Figure 2. (a) Comparison of fatigue failure process between homogeneous and heterogeneous materials; (b) Mechanical properties of L and H.
Metals 08 00880 g002
Figure 3. Double Y butt-welded joint.
Metals 08 00880 g003
Figure 4. Three-tangent-circle geometric optimization methods.
Metals 08 00880 g004
Figure 5. Design parameters of the equal-fatigue-bearing capacity (EFBC) method.
Metals 08 00880 g005
Figure 6. Geometric parameters of the base metal and the specimen of butt-welded joints. (Unit: mm).
Metals 08 00880 g006
Figure 7. Finite element (FE) model of the designed welded joint.
Metals 08 00880 g007
Figure 8. The influence of the transition arc radius r1 on the distribution of stress concentration factor along the welded joint.
Metals 08 00880 g008
Figure 9. EFBC design results of Q550d (ER50-6) butt-welded joints.
Metals 08 00880 g009
Figure 10. Welding process and sampling method.
Metals 08 00880 g010
Figure 11. Macrograph of the weld.
Metals 08 00880 g011
Figure 12. Fatigue testing system (MTS 809).
Metals 08 00880 g012
Table 1. Chemical composition and mechanical properties of the base metal and weld metal.
Material 1C Wt.%Si Wt.%Mn Wt.%σu (MPa)σy (MPa)SN fitting formula
Q550D0.050.0221.74777678 σ 11.1 · N f = 5.9 × 10 33
ER70S-60.070.841.49543438 σ 11.1 · N f = 1.1 × 10 32
Table 2. Welding procedure and corresponding parameters used to produce the welds.
SequenceWelding ProcessCurrent Type/PolarityArc Voltage(V)Welding Current(A)Welding Speed(mm/s)Shielding Gas/Flow Rate(L/min)
1TIG(manual)DC(+)23.52201Ar/13
2–7MAGDC(-)343508.5CO2/5Ar/18
8–9MAGDC(-)29.62808.5CO2/5Ar/18
Table 3. Fatigue test results of the designed welds.
Sample No.σa (MPa)f (Hz)RT (°C)N (Stress Cycles)
1#134.1100.1252,650,633
2#134.1100.1252,587,627
3#134.1100.1252,620,122
Table 4. Statistical analysis of the fatigue data.
p/%(1−α)k(p, 1−α)N(p, 1−α)
1095−6.1582,440,063
90−4.2582,494,026
595−7.6552,398,369
90−5.312,464,002
195−10.552,319,749
90−7.342,407,083
0.195−13.862,233,012
90−9.6512,343,883

