Article

Parametric Analysis of Macro-Geometrical Deviations in Dry Turning of UNS A97075 (Al-Zn) Alloy

by
Sergio Martín Béjar
,
Francisco Javier Trujillo Vilches
*,
Carolina Bermudo Gamboa
and
Lorenzo Sevilla Hurtado
Civil, Material and Manufacturing Engineering Department, EII, University of Malaga, 29071 Malaga, Spain
*
Author to whom correspondence should be addressed.
Metals 2019, 9(11), 1141; https://doi.org/10.3390/met9111141
Submission received: 28 September 2019 / Revised: 22 October 2019 / Accepted: 23 October 2019 / Published: 24 October 2019
(This article belongs to the Special Issue Metal Machining—Recent Advances, Applications and Challenges)

Abstract

:
Macro-geometrical deviations play a very important role in the functionality and reliability of structural parts for aircraft. The use of environmentally friendly techniques, such as dry machining, may negatively affect these deviations. Despite its importance, there is a lack of research that analyzes them as a function of the cutting parameters in the case of aluminum alloys for aeronautical purpose. In this work, the cutting speed and feed influence on several macro-geometrical deviations (parallelism, straightness, circular run-out, roundness, concentricity, total circular run-out and cylindricity) in dry turning of UNS A97075 alloy was analyzed. The main novelty of this work lies in the use of high slenderness parts used in further fatigue tests. The results showed that feed seems to be the most influential parameter in most of the deviations studied. In addition, the parts with lower rigidity exhibited higher sensitivity to change with the cutting parameters. Finally, different parametric models were proposed to obtain the geometrical deviations as a function of the cutting parameters.

1. Introduction

One of the most appreciated quality requirements in machining processes is related to the surface integrity (SI) concept [1]. Field et al. [2,3] defined the SI as the inherent or enhanced condition of a surface produced in machining operations or other surface generation processes. Griffiths [4] defined it as the topological, mechanical, chemical and metallurgical worth of a manufactured surface and its relationship with its functional performance. A new definition of this concept is developed by Astakhov [5], who defined it as a set of properties (both, superficial and in-depth) of an engineering surface that affect its service behavior. These properties include geometrical, physical-chemical and biological parameters.
In more recent works, Gómez-Parra et al [6,7] provided an expanded view of the SI concept, defining the SI as a set of properties that the material surface exhibits, acquires or becomes modified during a forming process. These properties can be analyzed from three points of view connected to each other: micro-geometrical (surface roughness, micro and macro cracks, waviness, particle adhesion), macro-geometrical (cylindricity, concentricity, straightness) and physical-chemical properties (micro hardness, residual stress, stress corrosion, tensile strength, fatigue behavior). The authors highlight that these properties may not only improve the functional performance of the part, but also worsen it.
The macro-geometrical deviations or material mechanical properties inclusion within the SI definition presents great controversy. On one hand, the macro-geometrical deviations and the mechanical properties affect not only the part surface, but also the bulk. On the other hand, the mechanical properties are included within the surface physical-chemical properties. The surface is considered as a whole, and not only from the micro-geometrical and physical-chemical approach at a point on the surface. In this way, the macro-geometrical deviations may affect negatively the mechanical behavior or increase the appearance of micro-geometrical or physical-chemical defects, and vice versa. Thereby, these three points of view are interconnected and may not be considered in isolation. Regardless of their inclusion or not within the SI definition, the macro-geometrical deviations play a fundamental role in mechanical properties [8,9], such as fatigue behavior [10]. In that way, fatigue test standards are very demanding regarding the tolerances of these geometrical deviations [11].
Fatigue behavior is one of the most important properties to take into account in the behavior of aircraft structural parts in service [12]. The quality requirements of these components are highly demanding because they are placed in critical areas. Consequently, geometrical tolerances (at macro and micro scale) are usually very narrow in order to make their assembly easier and to improve their functionality, reliability and longevity [13,14]. However, these high-quality demands result in higher costs. Hence, one of the most important challenges is to balance the manufacturing process performance of these components, from four different points of view: functional, economic, environmental and energetic [15,16,17].
Light alloys (mainly Al and Ti alloys) are widely used in the manufacturing of structural parts for aircrafts, individually or combined with composites (such as carbon fiber reinforced polymers, CFRP) to form fiber metal laminates structures. Specifically, aluminum alloys series 2000 (Al-Cu) and 7000 (Al-Zn) are used in the components under fatigue load in service, such as the pressurized cabins fuselage, ribs, spars and wings upper/lower skins [18,19,20]. Machining (mainly milling, drilling and turning) is frequently used to manufacture these structures [21,22]. The current trend in machining of these alloys moves towards reducing or eliminating the use of cutting fluids (dry machining), due to environmental and occupational health reasons [23,24,25]. The machining process based on the minimum quantity of cooling lubrication (MQCL) or the minimum quantity of lubrication (MQL) are good alternatives [26]. However, the performance balance of dry machining is currently a challenge. On one hand, the CFRP/Al structures show a bad behavior under wet machining conditions and the mixture of aluminum chip, CFRP and cutting fluids is complex and expensive to recycle [27]. On the other hand, dry machining results in very aggressive cutting conditions, which gives rise to a fast temperature increase in the cutting area and fast tool wear [28]. This fact may negatively affect the surface integrity of the machined parts. Hence, the environmental component of the process performance is improved, whereas the economical and functional components may be reduced.
Within this context, the cutting parameters (cutting speed, feed and cutting depth) play a very important role [29]. A large amount of research can be found in the literature analyzing the cutting parameters influence on the SI micro-geometrical aspects of dry machined wrought aluminum alloys [28,30,31,32,33] taking in to account the influence of the tool wear, chip geometry or axial machining length. Usually, the mean average roughness (Ra) is the selected parameter to evaluate these deviations. Most of the research agree that feed is the most influential cutting parameter on Ra, showing Ra a general trend to increase with feed [34,35,36]. Some of these works develop parametric models that allow predicting the Ra evolution as a function of the cutting parameters. Usually, these models adopt a potential form [35,36,37,38] due to the simplicity of the model, where the exponent of each variable represent the influence in the general term, and to the good fit that the models usually show. In addition, some authors show a relationship between Ra and the cutting forces [8,39]. Therefore, an online monitoring of micro-geometrical deviations was carried out to analyze this relationship.
Nevertheless, there is a lack of research focused on the analysis of the cutting parameters influence on macro-geometrical deviations for these alloys, despite their importance and influence on the functional behavior of these parts [9]. Clares et al. [7] proposed an experimental methodology to evaluate the SI in dry turning of aerospace alloys from the three aforementioned points of view (geometrical, at micro and macro scale and physical-chemical features). Sánchez-sola et al. [40] studied the cutting speed (vc = 40–170 m/min) and feed (f = 0.05–0.30 mm/r) influence on straightness, parallelism and roundness of the UNS A92024 alloy. The cylindrical bars (200 mm length, 80–120 mm diameter) were dry turned. The worst results were obtained when the highest f and lowest vc values were used. A general trend to increase the straightness and parallelism with f was found for low vc. An opposite trend was found for high vc, with a strong dispersion in the results for the highest f values. Regarding the roundness, its value tends to increase with f, regardless vc. No clear trend was found with vc. On the one hand, Sánchez-sola et al. explain that straightness and parallelism are measured along the whole part and, therefore, they are more influenced by the roughness profile, chip generation, built-up edge (BUE) detaching and, as a result, by the cutting parameters. On the other hand, roundness is measured from the transversal section. Hence, it is less influenced by these parameters. In addition, exponential parametric models were obtained. These models showed a good fit for high f and low vc.
Trujillo et al. [9] analyzed the cutting parameters influence (vc = 40–200 m/min; f = 0.05–0.20 mm/r) on roundness, circular run-out, straightness and parallelism of dry turned UNS 97075 alloy cylindrical bars (150 mm length, 30–60 mm diameter). The cutting depth (ap) remained constant (1 mm). These geometrical deviations showed low sensitivity to change with the cutting parameters, unlike what was observed for micro-geometrical deviations, strongly influenced by f. However, vc exhibited higher influence on straightness and parallelism, whereas f showed higher influence on roundness and circular run-out. These results can be explained in a similar way that were exposed in [40]. The exponential parametric models were also developed for each macro-geometrical deviation. Parallelism and straightness models exhibited a good fit for low vc. However, the roundness and circular run-out showed a good fit for all vc tested. Finally, Trujillo et al. highlighted that these models should be tested under different conditions (cutting parameters range, specimens’ geometry) to check their generality.
It is necessary to point out that these previous studies have been carried out on low slenderness parts. Nevertheless, the structural parts for the aircraft usually show high slenderness rates [41]. Therefore, extended research on slender parts should be developed in order to analyze the cutting parameters’ influence on the macro-geometrical deviations and their influence on mechanical properties, such as fatigue behavior. Given the aforementioned, the main novelty of the study, this work focusses on the analysis of the cutting speed and feed influence on several geometrical deviations (straightness, parallelism, circular run-out, roundness, concentricity and cylindricity) of dry turned UNS A97075 alloy. For this purpose, the specimens with high slenderness were used. These specimens were designed to be used in further fatigue tests. Finally, the different experimental parametric models were developed. These models allow predicting some geometrical deviations as a function of the cutting parameters within the studied range.

2. Materials and Methods

Several dry turning tests were carried out on UNS A97075-T6 alloy specimens in order to evaluate the cutting parameters’ influence on different macro-geometrical deviations. This material is widely used in the manufacturing of aeronautical structural parts that work under compressive and fatigue loads [42]. Arc atomic emission spectroscopy (AES) was used to obtain the tested alloy composition (% mass). The results are shown in Table 1.
The final specimens’ geometry obtained from cylindrical bars (D = 20 mm) was selected according to the rotating bar bending fatigue test standard, ISO 1143:2010 [11]. Among the different geometries proposed in this standard, the cylindrical smooth geometry was selected. On the one hand, this geometry is less rigid that those used in previous research [9,40], being this one of the main novelties of this work. On the other hand, these specimens are being used in current works regarding the cutting parameters influence on fatigue behavior. The specimens’ shape and geometrical dimensions are shown in Figure 1. In addition, it is necessary to highlight that the standard quality requirements regarding the cylindricity and concentricity are strongly demanding. Therefore, the specimen slenderness was taken into account and calculated as the relation between the lengths (L = 167 mm) and the lower diameter (d = 7.6 mm), being this value, 22.37.
The machining tests were conducted in a Computer Numerical Control (CNC) turning center. The different combinations of cutting speed (vc) and feed (f) were used (Table 2). The cutting depth (ap) remained constant. Every test was performed under dry conditions, in order to use environmentally friendly techniques. It must be pointed that although low cutting speeds are not recommended for machining aluminum alloys, these alloys are often hybridized with other materials in which these low cutting speeds are required, such as fiber metal laminates, FML (CFRP +Al + Ti). In addition, this fact allows the comparison with previous studies on the geometrical deviations performed in the same cutting parameters range [9,40]. Every test was performed under dry conditions in order to use environmentally friendly techniques.
The tool (Figure 2) was an uncoated WC-Co insert (ISO DCMT 11T308-14 IC20) and each test was carried out using a new tool to ensure identical initial conditions. The cutting angles setup can be observed in Table 3. The tool geometry and position respect the specimen allow the machining of the entire specimen profile with a single operation. Additionally, these geometrical cutting conditions reduce the deflection effect on slenderness parts due to the predominance of the axial cutting forces over the radial cutting forces. Due to the cutting tool geometry (a major cutting-edge angle of 66.5°), the force axial component is dominant over the radial component. Therefore, the bending effect on sample was limited.
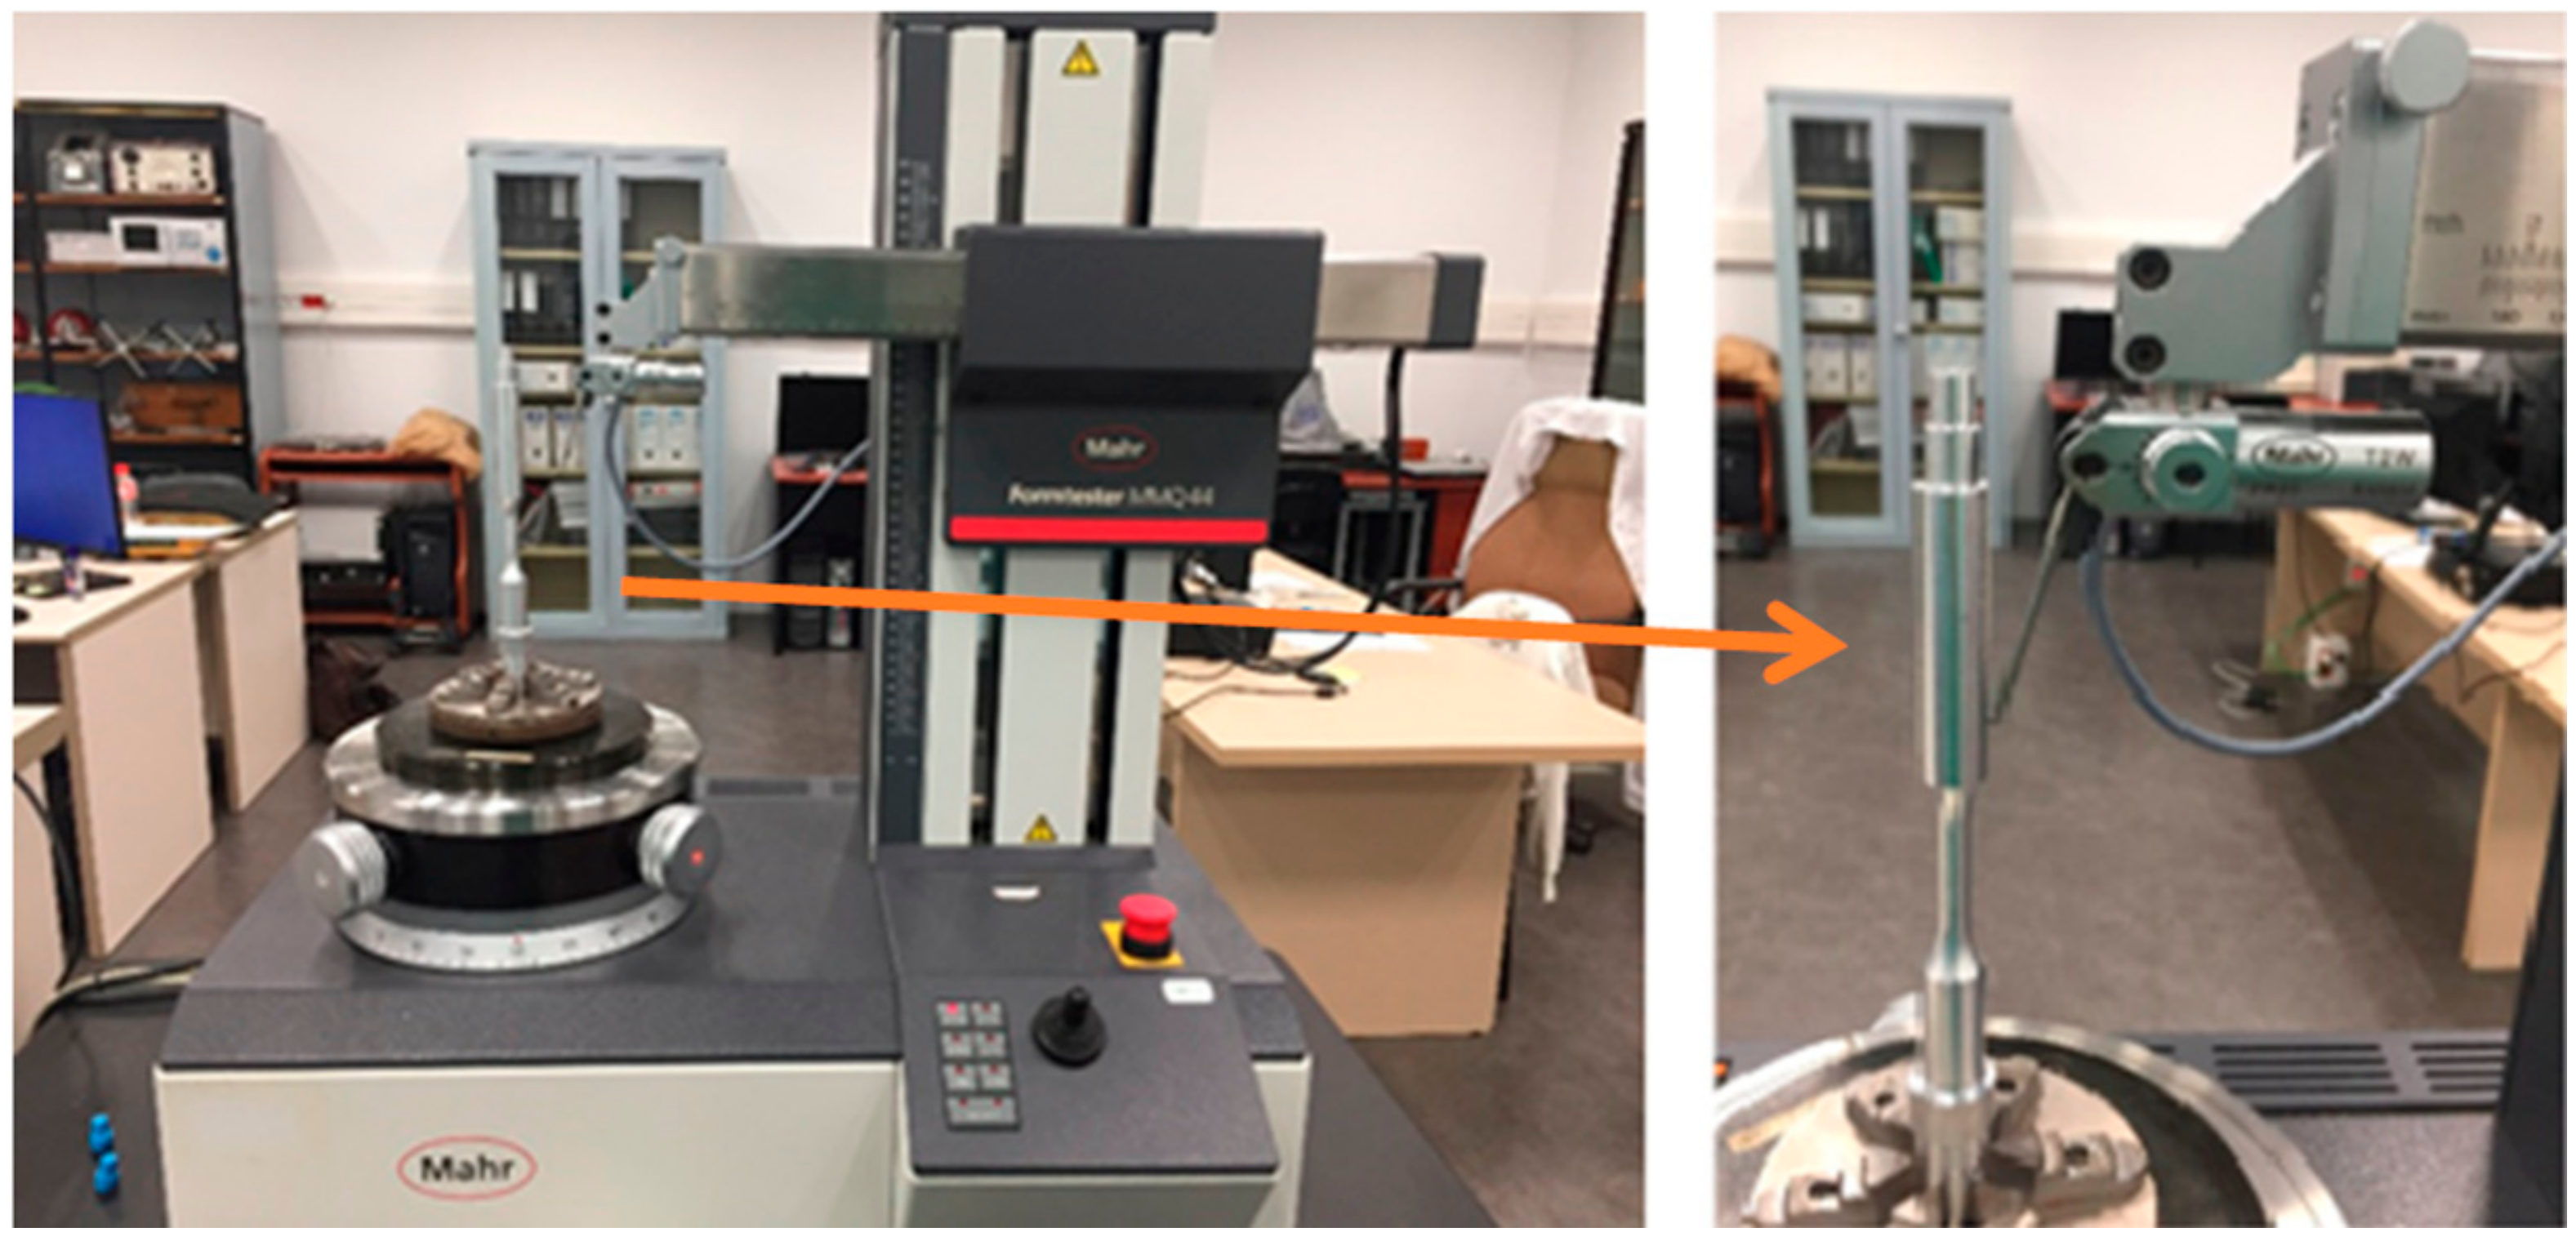
Once the specimens were machined, different macro-geometrical deviations were controlled in the calibrated area (parallelism, straightness, circular run-out, roundness, concentricity, total run out and cylindricity). The experimental setup is shown in Figure 3. A millesimal dial gauge with a measuring span of 12.5 mm, scale division of 0.001 mm and a maximum permissible error (MPE) of 4 µm, was used to control these deviations. This device was placed on the tool carriage to avoid removing the specimen from the turning center and achieve a faster process. Previously, the setup rigidity and the run-out of the spindle were controlled in order to assess their contribution to the part run-out. This contribution was found to be negligible. In addition, some of the specimens were off-line measured in a geometrical deviation measurement machine (Figure 4) in order to validate the experimental setup. The differences found did not exceed 10%.
The circular run-out (CRO) was measured along six sections (S1 to S6, separated 4 mm from each other) in the calibrated area (Figure 5a). For each section, twelve measurements were performed at 30° each. The parallelism (PAR) was controlled along twelve generatrix (G1–G12), separated 30° from each other, Figure 5b.
The circular run-out (CRO) was obtained as the difference between the maximum and the minimum profile radius (RmaxRmin), as in Figure 6a [42]. The roundness (RON) and concentricity (CON) were calculated from the CRO experimental results (Figure 6a). Among the different mathematical methods available, the least squares circles method [43] was applied in this work. To evaluate the least square circumference center, a nonlinear iterative mathematical model was considered, minimizing the function error (Equation (1)) and taking the seed as the rotation center.
SSE ( a , b ) = i = 1 n R x i a 2 y i b 2 2
where different variables corresponding with:
  • R: Radius of the profile
  • xi: x coordinate of profile point
  • yi: y coordinate of profile point
  • a: x coordinate of the center of the least square circumference
  • b: y coordinate of the center of the least square circumference
Once the center of the least square circumference has been calculated, RON is obtained as the difference between the radiuses of two concentric circumferences (JmaxJmin) which delimit the area containing all points of the profile, as in Figure 6a. The CON is the distance between the rotation center (0, 0) and the least squares circumference center previously obtained (a, b) (Equation (2)).
CON = a 2 + b 2
The parallelism (PAR) was obtained as the distance between two parallel lines (XmaxXmin), which delimit the area containing all the profile points and are parallel to the work piece axis (Figure 6c). The straightness (STR) was calculated as the distance between two parallel lines (DmaxDmin) which delimit the area containing all the profile points and are parallel to the least squares regression line (Figure 6c).
Taking into account the total calibrated area volume, the total circular run-out (TCRO) was calculated as the difference between the maximum and minimum of every radio sections measured (TmaxTmin) in the calibrated area (Figure 6b). Finally, the cylindricity (CYL) was obtained as the difference between two co-axial cylinders, such that their radial difference is at a minimum (PmaxPmin), as in Figure 6d.
The theorical PAR respect CYL was taken in to account. Considering the tool tip radius (r = 0.8 mm), the depth of cut (ap = 1 mm) and the worst feed rate condition (f = 0.20 mm/r), the scallop calculated is 6.27 µm. The standard 1143:2010 allows a maximum of 20 µm. Therefore, the scallop value for each feed rate implemented in this work is considered within the standard values.

3. Results and Discussion

3.1. Parallelism and Straightness

Figure 7 shows STR and PAR experimental results as a function of vc and f. In Figure 7a, the PAR shows a general trend to slightly increase at low f (0.05–0.10 mm/r), regardless vc. From f = 0.10 mm/r to 0.20 mm/r, PAR tends to decrease, whereas it remains more or less constant for vc = 60 and 80 m/min. Notwithstanding this, a higher dispersion can be observed. From f = 0.15 to 0.20 mm/r, PAR remains constant for vc = 40 and 60 m/min. Nevertheless, PAR tends to increase for vc = 80 m/min for this f range. In fact, the worst results (and the highest dispersion) are obtained when the highest f and vc are combined.
Figure 7b shows that STR presents a higher dependence on the cutting parameters studied than PAR. On one hand, the highest values are always obtained for vc = 80 m/min, regardless f. In addition, a general trend to increase STR with f is observed, mainly from f = 0.05 to 0.10 mm/r and from f = 0.15 to 0.20 mm/r. On the other hand, for the low range of f studied (0.05 to 0.10 mm/r), STR tends to increase with f, regardless vc. Nevertheless, in general terms, vc seems to be the most influent parameter. Moreover, its effect increased when it is combined with the highest vc (80 m/min). In addition, these results show higher deviations than other research with a less slender workpiece [9,40].
These results can be explained taking into account how PAR and STR are measured along the machining length. This fact results in a higher dependence of those geometrical deviations on the built-up edge (BUE) formation and detaching vibrations and/or deflections of the specimen. Figure 8 shows the tool rake face for vc = 40 m/min, for f 0.05 and 0.10 mm/r. These images show that the indirect adhesion wear phenomenon is higher for 0.10 mm/r. A similar trend was found for vc = 60 and 80 m/min. Therefore, STR is more sensitive to the BUE formation at low f. For higher f values (0.15–0.20 mm/r), STR becomes less sensitive to BUE (with similar intensity at high f values) and more sensitive to vibrations, more noticeable for vc = 80 m/min (Figure 9).
These results have revealed two important differences with previous research on similar alloys, in which more rigid specimens were used [9,40]. First, both PAR and STR have shown higher values. As a result, these macro-geometrical deviations tend to increase with the specimen slenderness. In addition, previous work did not reveal a clear influence of the cutting parameters on PAR and STR. However, only vc seemed to be slightly more influential at high values. However, in this work, PAR and STR behavior was more sensitive with f, and its effect was maximized at a high cutting speed.

3.2. Circular Run-out, Roundness and Concentricity

Figure 10 shows CRO experimental results as a function of the cutting parameters for each section. With the different sections (1–6) in mind, the specimen slenderness and the experimental setup rigidity play a special role. Further sections from the chuck (1–3) have exhibited higher CRO deviations, whereas closer sections (4–6) have shown lower values. This general trend is more noticeable for vc = 40 and 60 m/min, regardless of f, whereas it is less evident for vc = 80 m/min. Therefore, the specimen slenderness and rigidity are more influential at low vc. Nevertheless, vibrations become more relevant at high vc.
In addition, Figure 11 plots the average CRO (taking all sections into account) as a function of f and vc. In general, f seems to be the most influential parameter. The circular run-out (CRO) exhibits a general trend to increase with f, regardless vc. This fact becomes more noticeable at high cutting speed values. The general trend is less clear with regard to vc. Between f = 0.05 and 0.10 mm/r, the highest CRO value is obtained for vc = 40 and 60 m/min, respectively. However, for f = 0.20 mm/r, the worst result is found for vc = 80 m/min. As a result, the combination of the highest f and vc values result in the highest CRO deviations. The high vibration levels, produced when the high values of cutting speed and feed are used, should explain this behavior.
The RON and CON deviations can be calculated from CRO experimental results and Equations (1) and (2).
Figure 12 plots the RON experimental results in the function of the cutting parameters, for each section. A general trend to increase RON deviations in the function of f can be observed, regardless of vc. However, a strong increment in the function of vc can be noticed for f = 0.20 mm/r. Trivial variations of RON in the function of the section relativity position can be observed, except for vc = 80 m/min and f = 0.20 mm/r, where severe cutting conditions show an increase on the central sections (2–5). Taking into account that feed is the most influenced parameter in cutting forces, regardless of vc [31,44], this fact can be explained due to an increment of deflections, especially in a slender specimen, where the cutting forces are increased in the higher range of f. Notably, the CON evolution for the different sections measured can be considered as a function or the results shown for CRO (Figure 10) and RON (Figure 12).
Figure 13 plots the RON and CON mean values (considering all the sections) as a function of f and vc. A general trend to increase RON mean values with f is observed, regardless of vc, as in Figure 13a. This increment is more evident from f = 0.15 to 0.20 mm/r and softer for vc = 40 m/min. Regarding vc, the general trend is less clear. Only between f = 0.15 and 0.20 mm/r there is a trend to increase RD with vc. The worst results are obtained when the highest values of f (0.20 mm/r) and vc (60 and 80 m/min) are tested. Hence, the trend is very similar as that observed for CRO. Nevertheless, the cutting parameters influence is more evident on RON than on CRO. This fact is a consequence of deleting the concentricity effect, which shows a less clear trend with the cutting parameters, as in Figure 13b. The CON average values (Figure 13b) show a general trend to increase with f, but softer than RON. Regarding vc, the CON values are more scattered, showing different behavior at a low and high feed.
Considering that CRO is related with RON and CON, it is necessary to point out that CON takes more importance in CRO for low vc and f values, whereas RON influence is more noticeable for higher values.
The found trend is slightly different from those obtained in previous research for UNS A97075 and UNS A92024 alloys [9,40]. CRO and RON sensitivity to change with the cutting parameters was very low (in specimens with higher rigidity). Nevertheless, this sensitivity increases when the specimen geometry is less rigid, especially with f. In addition, the deviations values are significantly higher for high slenderness specimens.

3.3. Total Circular Run-out and Cylindricity

Figure 14a shows the TCRO values as a function of vc and f. No clear trend can be observed as a function of vc or f for this deviation. From f = 0.05 to 0.10 mm/r, TCRO tends to increase for vc = 60 and 80 m/min, whereas it tends to decrease for vc = 40 m/min. From f = 0.10 to 0.20 mm/r, its value remains more or less constant, for vc = 40 and 60 m/min, regardless of f. However, TCRO only shows a general trend to increase with f for vc = 80 m/min. This fact is more noticeable for f = 0.20 mm/r, where the worst result is obtained. Therefore, TCRO exhibits less sensitivity to change with the cutting parameters than CRO, RON or STR, and similar to CON. The value of TCRO strongly depends on the maximum value of CRO in each section, but also on the angular position where that maximum value is obtained. Therefore, the maximum value for CRO in one section may occur in a different angular position than another one and, as a result, the effect of the cutting parameters may be less evident.
Finally, Figure 14b plots the CYL values as a function of f and vc. For this deviation, the influence of f is more evident. A general trend to increase CYL with f can be observed in a wide range of vc studied. This effect is more noticeable at vc = 80 m/min, mainly at higher f values (0.15–0.20 mm/r). The worst results appear when the highest f (0.20 mm/r) is combined with high vc (60 and 80 m/min). For vc = 60 m/min, this trend is fulfilled from 0.05 to 0.10 mm/r and 0.20 mm/r. Nevertheless, for f = 0.15 mm/r, a significant decrease is observed. Therefore, in a similar way than CRO, RON or STR, CYL exhibits a higher sensitivity to change with f than vc. This behavior was to be expected, taking into account that CYL combines the effect of the profile deviations along the specimen length, as well as along its section.

3.4. Geometrical Tolerance in Rotating Bar Bending Specimens

ISO 1143:2010 standard establishes the different geometrical tolerances for the rotating bar bending specimen, in order to minimize their effect in the fatigue behavior. In this sense, in the expected fatigue fracture zone, the standard indicates a CYL and CON maximum tolerance deviation. These requirements are 20 μm for CYL and 15 μm for CON, between sections S1 and S6 [11]. Nevertheless, the geometrical deviations in a manufacturing process are usually far from the standard requirements. Therefore, it may be interesting to compare these requirements with those obtained in the manufacturing process under different conditions.
On the one hand, the CON values were below the required standard limit, in general. Only higher values of f (0.15 and 0.20 mm/r), in combination with high vc (60 and 80 m/min) exceed that limit. Therefore, the influence of CON on fatigue behavior may not be neglected under these cutting conditions. On the other hand, only for low f and vc value combinations (f = 0.05 mm/r, vc = 40 and 60 m/min), the CYL results were below the standard requirements (Figure 12b). This is due to the stronger influence of the cutting parameters on this geometrical deviation. As a result, there is a wide range of cutting conditions where the CYL deviations should be considered in the fatigue behavior analysis.

3.5. Parametric Models for Macro-Geometrical Deviations

The experimental results suggest the possibility of obtaining parametric models that allow relating some of the analyzed geometrical deviations with the cutting parameters. These experimental models may be useful to predict these deviations before machining [9,40]. These models were developed for those deviations (GD) that have shown a greater dependence on the cutting parameters (STR, CRO and RON). Different models were tested. The best fit was obtained for a potential model, as shown in Equation (3).
GD = C v c x f y
where C, x and y are constant. Table 4 shows the results obtained for these constants. It is necessary to point out that these models have shown, in general, a reasonable fit (coefficient of determination, R² ≈ 0.6–0.7).
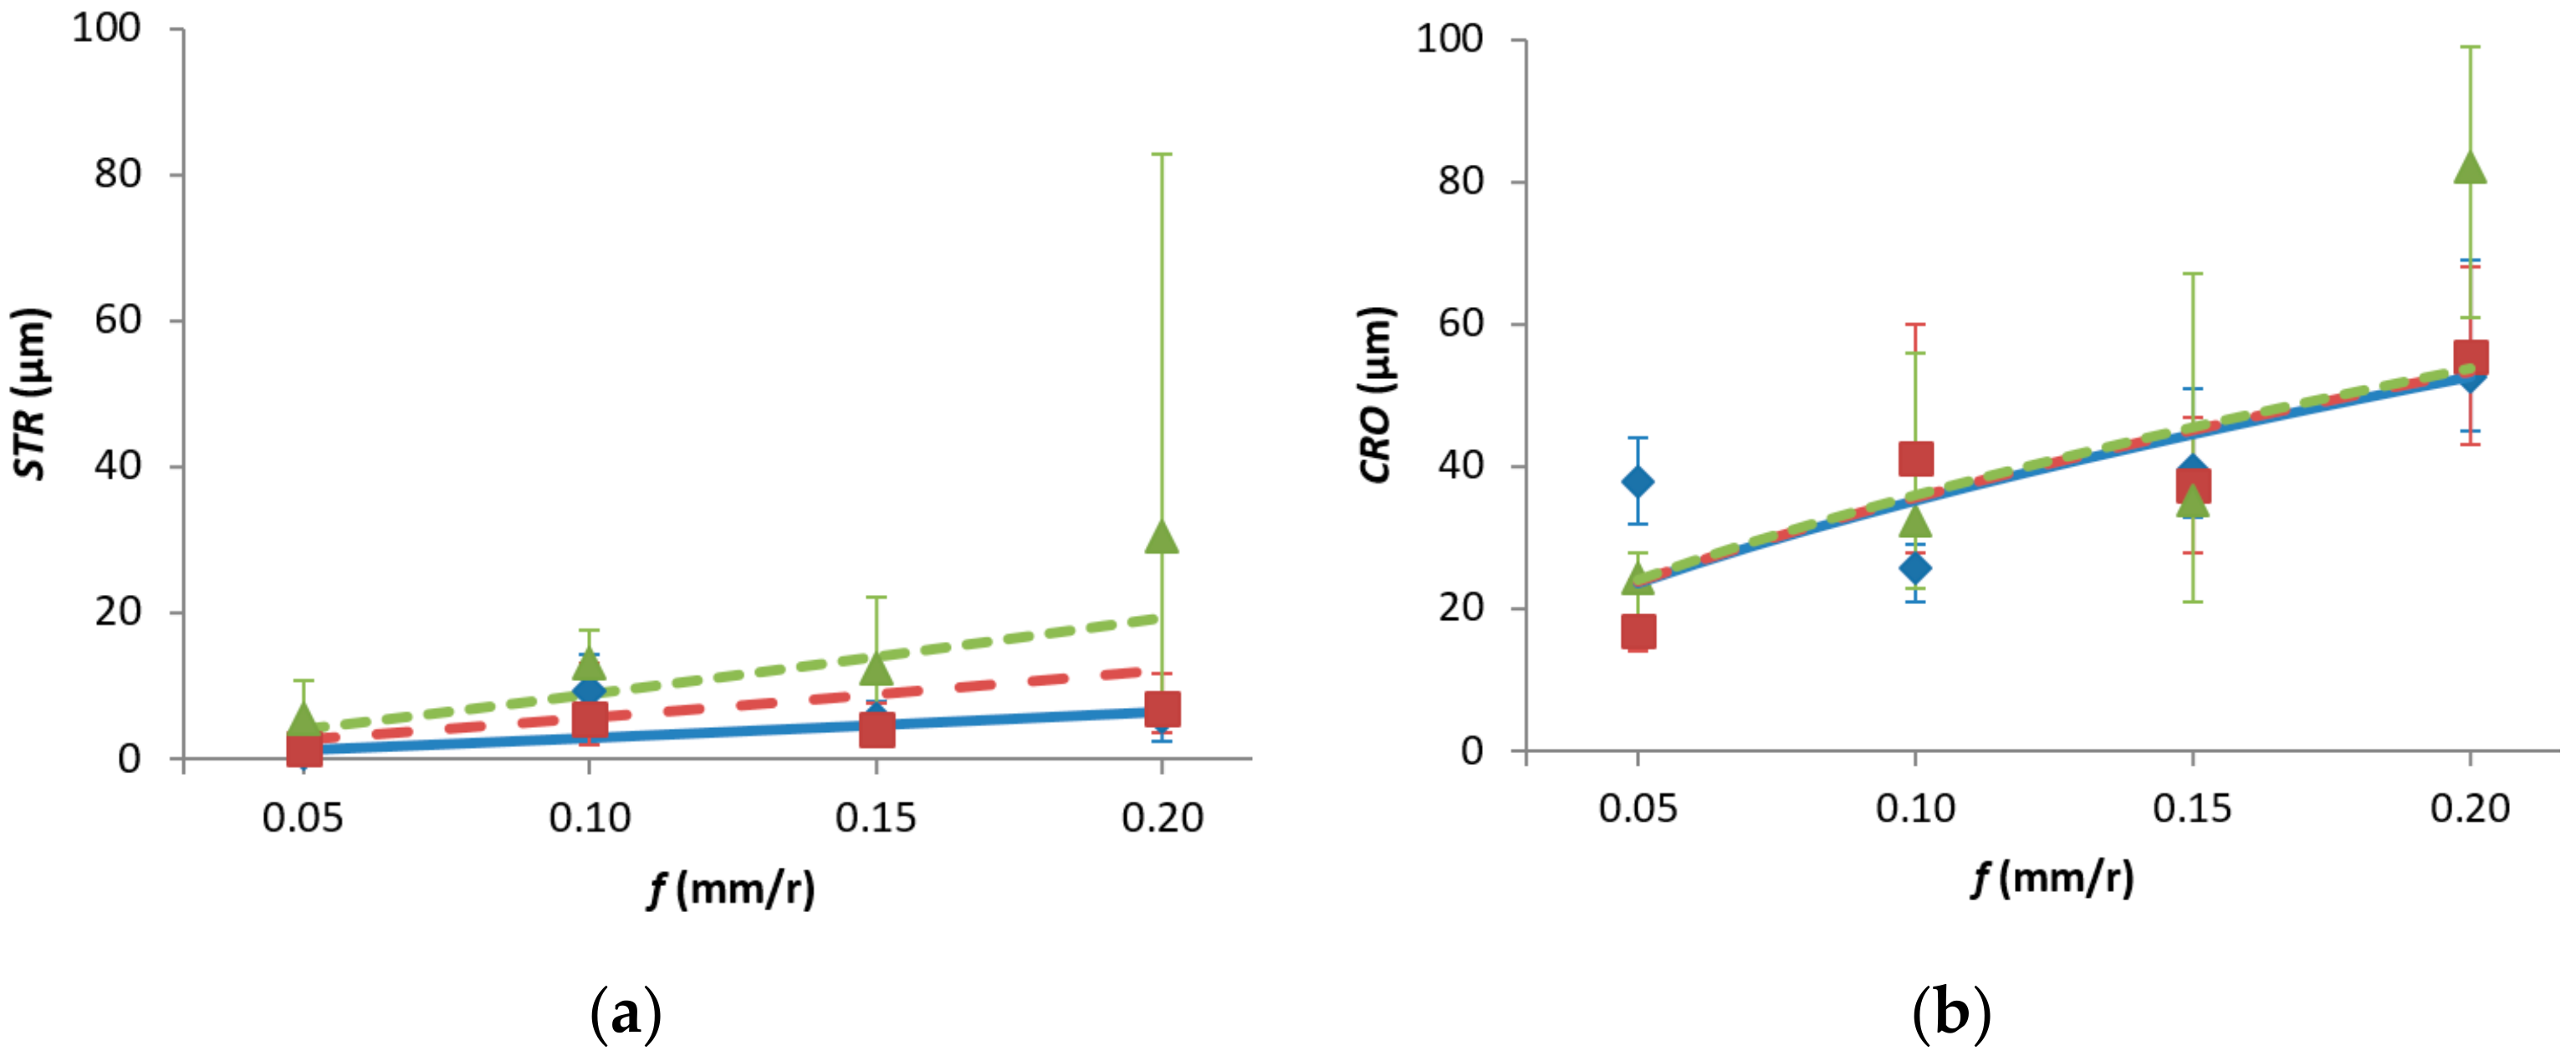
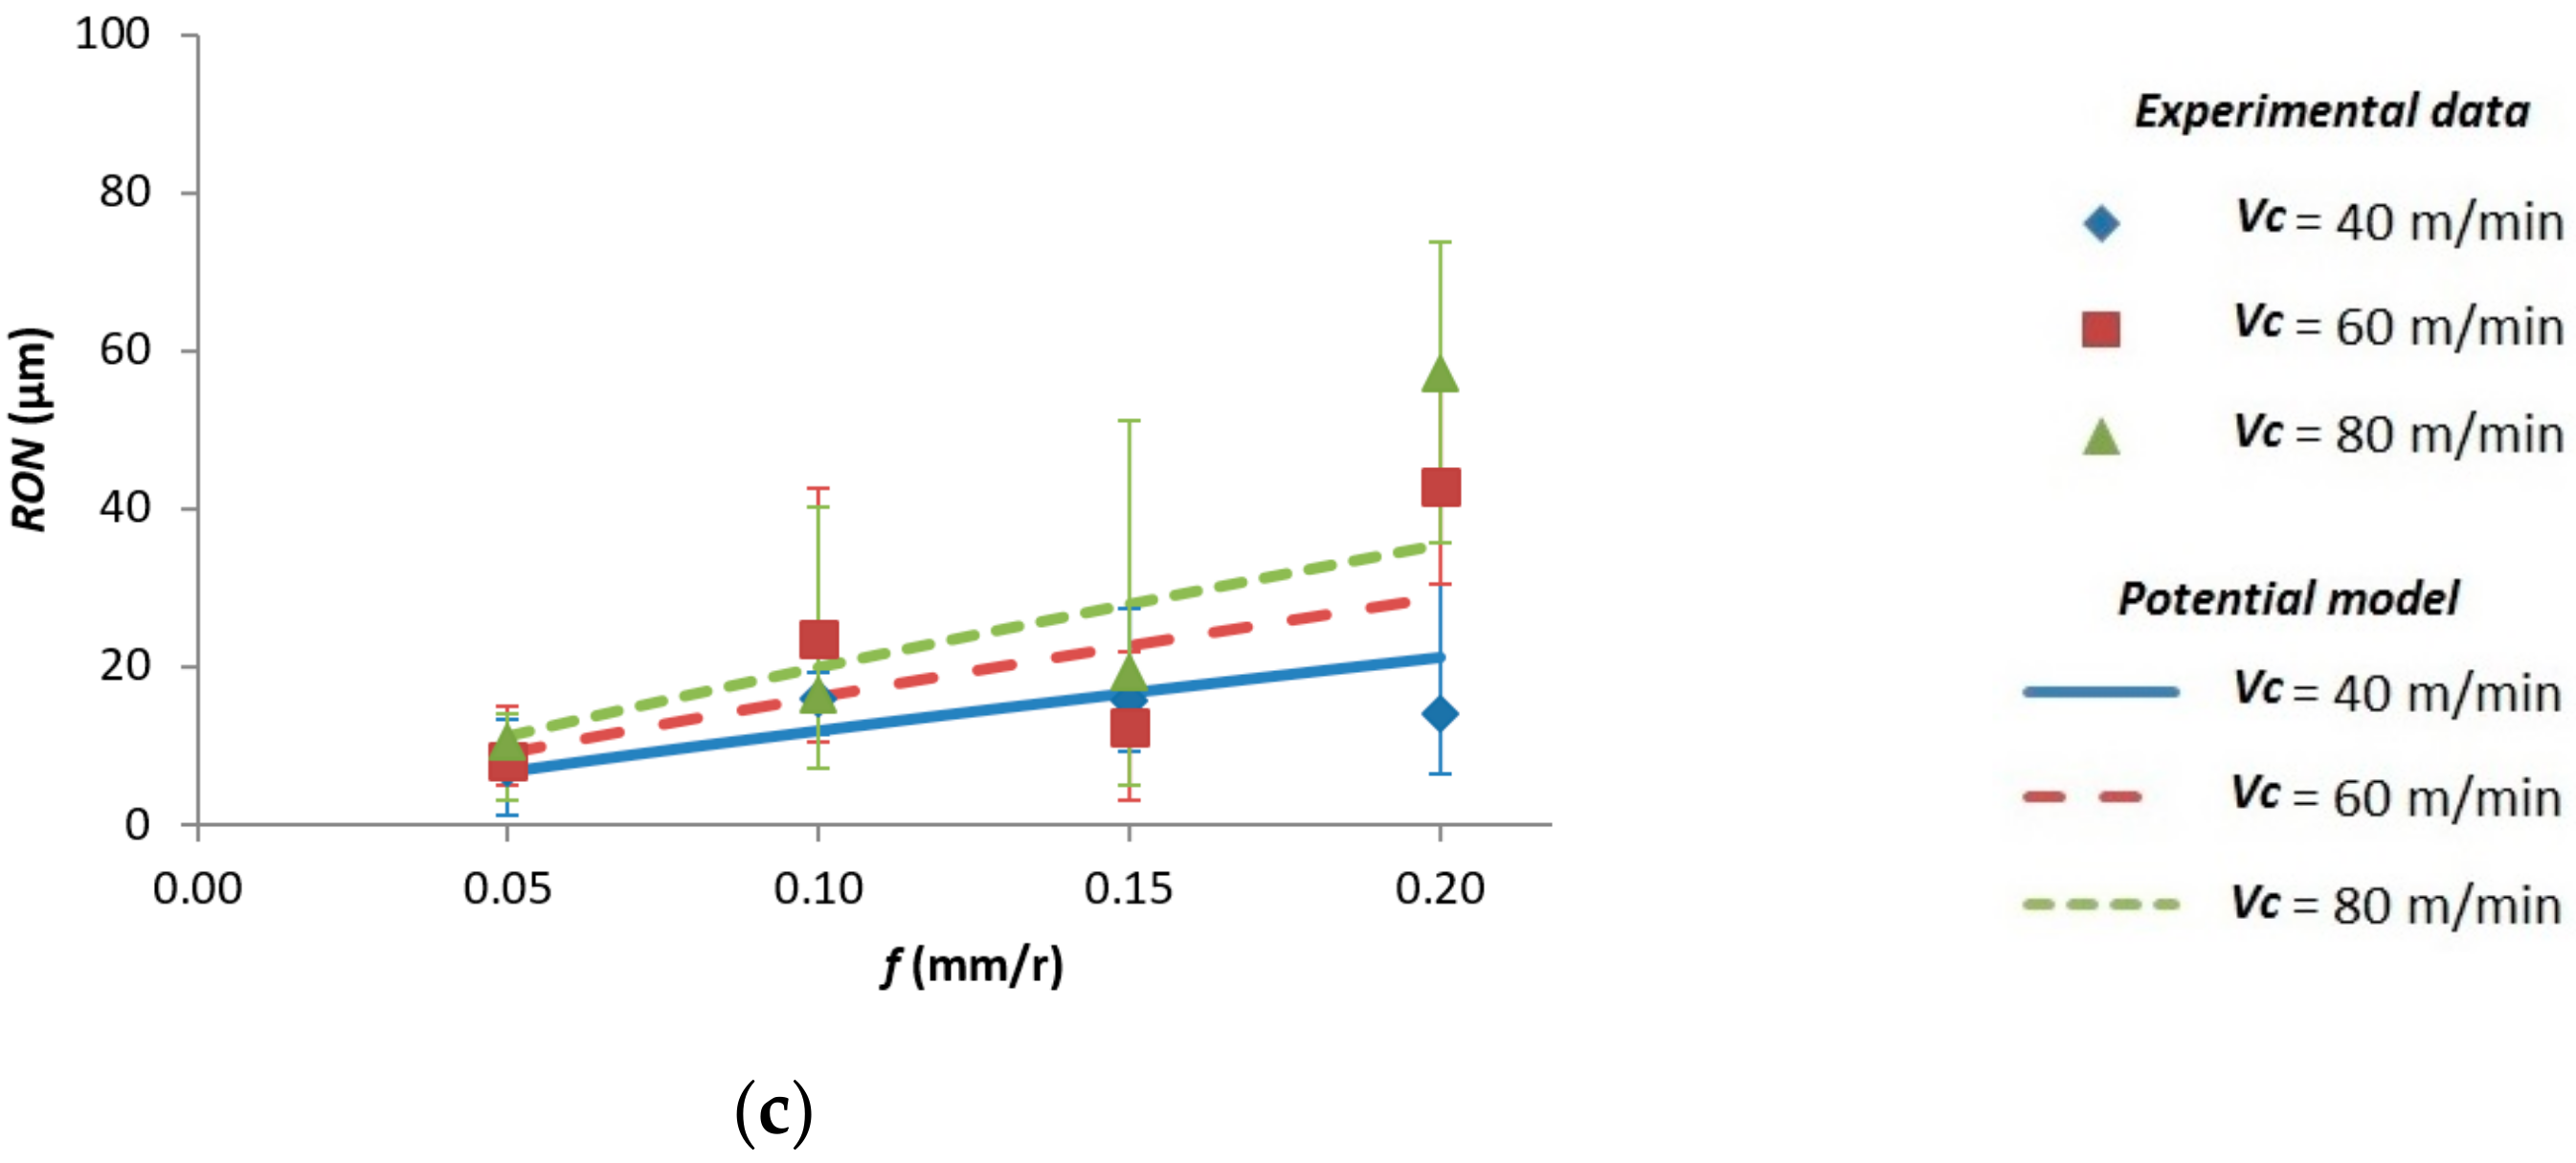
Figure 15 plots the experimental data versus the model results, for STR, CRO and RON respectively. Regarding STR, both cutting parameters (f and vc) show a strong influence on the model. Nevertheless, the higher value of the x exponent indicates a higher influence of the cutting speed. This is in good agreement with the experimental results (previously discussed). Only for f = 0.20 mm/r and vc = 80 m/min, the model shows a worse fit (Figure 15a).
This fact may be a consequence of the higher dispersion in the experimental data. This can be considered as normal, taking into account the higher vibration levels obtained for this cutting parameter combination, as previously discussed.
With regard to CRO, the x low value indicates a negligible influence of vc. This fact can be also observed in Figure 15b. Therefore, f is the most influential parameter. This is in good agreement with the experimental observations, as previously commented. However, this is the model that showed a worse fit. This may be explained due to the fact that CRO includes the effect of RON and CON. The effect of the cutting parameters on CON was not clear. As a result, the CRO experimental results exhibited higher dispersion and, therefore, the model for CRO showed a lower fit (Figure 15b).
Finally, the model for RON shows a similar value for x and y. Hence, the influence of both cutting parameters (vc and f) is similar, as previously commented. In addition, the model for RON shows a better fit than for CRO. However, as it happens for STR, the model shows a lower fit for the highest values of vc and f. As a result, it is useful only for the low range of vc and f studied.
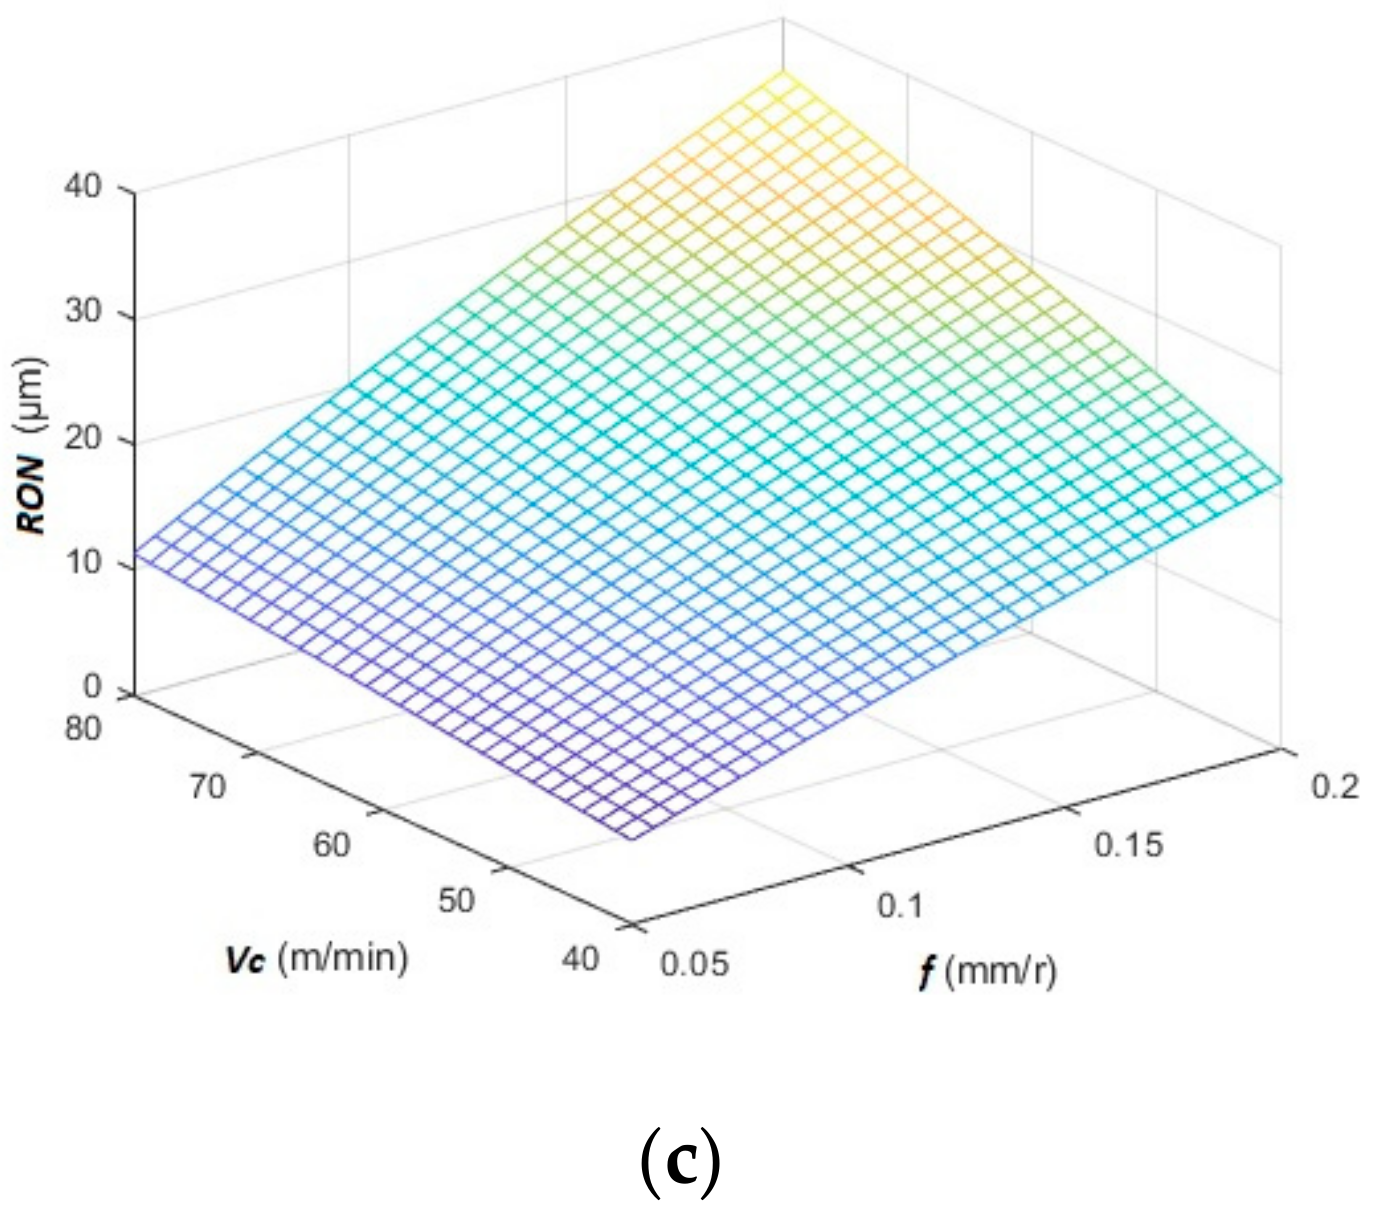
Additionally, Figure 16 plots these parametric potential models in 3D, where each geometrical deviation is represented by a surface. As previously commented, Figure 16a,c (STR and RON, respectively) show a strong dependence of vc and f, whereas Figure 16b exhibits a very low influence with vc. In addition, an increment in these deviations can be observed when the cutting parameters are increased.
It is necessary to point out that similar models have been obtained in previous research, for specimens with low slenderness (UNS A97075 and UNS A92024 alloys) [9,40]. Those models presented an exponential form for these macro-geometrical deviations under similar cutting conditions. Notwithstanding this, they exhibited a lower sensitivity to change with the cutting parameters due to the higher rigidity of the specimens’ geometry. Therefore, the potential models presented in this work are more suitable for specimens with higher slenderness. Finally, it is necessary to highlight that these models are valid within the range of the tested cutting parameters and under the cutting conditions exposed. The general validity of these models should be contrasted in further works, under different conditions. However, they are useful for a better understanding of the experimental results obtained.

4. Conclusions

In this work, the influence of the cutting speed and feed on several macro-geometrical deviations (parallelism, straightness, circular run-out, roundness, concentricity, total circular run-out and cylindricity) in dry turning of UNS A97075 (Al-Zn) alloy was analyzed. The analysis was performed using high slenderness parts in order to compare the experimental results with previous research carried out with more rigid parts.
Straightness has exhibited a general trend to increase with the feed, regardless the cutting speed. This trend was more evident at low feed values. The worst results were obtained when the highest cutting speed and feed rate were combined. These results should be explained taking into account that this deviation is measured along the specimen length. Therefore, it is influenced by the BUL and BUE formation and detaching, the process rigidity, the part slenderness and vibrations. On one hand, at low feed, the BUE formation and detaching becomes more relevant and the feed rate influence is more noticeable. On the other hand, at high cutting speed, vibrations become more relevant and the sensitivity to change with the cutting speed is higher.
Regarding parallelism, the influence was less evident and no clear trend was found as a function of the feed rate or cutting speed. Notwithstanding this, the obtained results for both deviations were higher than those obtained in previous works with more rigid parts under similar cutting conditions.
The circular run-out and roundness showed a general trend to increase with the feed rate. This dependence was more evident for the roundness. The cutting speed influence was lower in both cases. The feed rate effect worsened when it was combined with high cutting speeds. With regard to the evolution of those deviations along the specimen section, further sections from the chuck have shown higher deviations, whereas closer sections have exhibited lower values. This general trend was more noticeable at a low cutting speed, regardless of f. In addition, an increased f influence was observed in the sections more distant from the chuck. Hence, vibrations became more relevant at a high spindle rotational speed, whereas the specimen slenderness and rigidity were more influential at a low cutting speed.
Regarding concentricity, no clear trend was found. Therefore, its sensitivity to change with the cutting parameters was lower. Usually, this deviation is more influenced by the rigidity setup and spindle concentricity than by the cutting parameters.
Furthermore, no clear trend was observed as a function of the cutting parameters for the total circular run-out. Therefore, this deviation exhibited lower sensitivity to change with the cutting parameters. This fact may be explained taking into account that this deviation strongly depends on the maximum value of the circular run-out in each section, but also on the angular position for this value.
With regard to cylindricity, this deviation showed a general trend to increase with the feed rate in a wide range of cutting speeds studied. Its sensitivity to change with the feed was higher than with the cutting speed, in a similar way than the circular run-out, the roundness or the straightness. This is due to the fact that cylindricity combines the effect of the profile deviations along the specimen length, as well as along its section.
Therefore, the experimental results revealed higher sensitivity to change with the cutting parameters than the results obtained in previous research with lower slenderness parts, for most macro-geometrical deviations. In addition, the feed rate seems to be the most influential parameter whereas the cutting speed has shown less influence. On the other hand, the obtained deviations have been noticeably higher in parts with lower slenderness, compared with those obtained in previous research with more rigid parts of UNS A92024 and UNS A97075 alloys.
Additionally, the experimental results for CON and CYL have been compared with the quality requirements of the specimens used in the rotating bar bending fatigue test standard (ISO 1143:2010). The results revealed that there is a wide range of cutting conditions where both geometrical deviations should be considered for the fatigue behavior analysis.
Finally, a set of potential parametric models were proposed for STR (vc, f), CRO (vc, f) and RON (vc, f). These models exhibited a reasonable fit for STR and RON, whereas the fit for CRO was lower. These models may be useful to analyze the influence of cutting conditions (vc, f) in these deviations before machining. It is necessary to point out that these models are useful in the range of cutting conditions evaluated and can be considered as a first step to obtain more complex models. In addition, these models were compared with other models obtained from the tests with less slender specimens (20 times less slenderness). In spite of this, the results dispersion is of the same order.
It is necessary to point out that although the study was carried out on the parts with a geometry different from that used for the manufacture of aircraft structural parts, this work revealed the importance of this kind of analysis in further works. In addition, it can be considered as the starting point to analyze the influence of the geometrical deviations on mechanical properties, such as fatigue behavior.

Author Contributions

S.M.B. and F.J.T.V. conceived and designed the experiments; S.M.B. performed the experiments; S.M.B., F.J.T.V., C.B.G. and L.S.H. analyzed the data; S.M.B. and F.J.T.V. wrote the paper; L.S.H. and C.B.G. revised the paper.

Funding

This research received no external funding.

Acknowledgments

The authors thank the University of Cádiz for its form measuring equipment and the University of Malaga-Andalucia Tech Campus of international Excellence for its economic contribution to this paper.

Conflicts of Interest

The authors declare no conflict of interest.

References

  1. Grzesik, W. Introduction. In Advanced Machining Processes of Metallic Materials; Elsevier: Amsterdam, The Netherlands, 2017; pp. 1–5. [Google Scholar]
  2. Field, M.; Kahles, J.F. Review of surface integrity of machined components. Ann. CIRP 1971, 20, 153–163. [Google Scholar]
  3. Field, M.; Kahles, J.F.; Cammett, J.T. A review of measuring methods for surface integrity. CIRP Ann. Manuf. Technol. 1972, 21, 219–238. [Google Scholar]
  4. Griffiths, B. Manufacturing Surface Technology: Surface Integrity & Functional Performance; Butterworth-Heinemann: Oxford, UK, 2001. [Google Scholar]
  5. Astakhov, V.P. Surface Integrity—Definition and Importance in Functional Performance. In Surface Integrity in Machining; Springer: London, UK, 2010; pp. 1–35. [Google Scholar]
  6. Gómez Parra, A. Study of the influence of machining on the functional performance of aluminum alloys for strategic use in the aeronautical industry. Ph.D. Thesis, Universidad de Cádiz, Cadiz, Spain, 2016. [Google Scholar]
  7. Clares Rodriguez, J.M.; Vazquez Martinez, J.M.; Gomez-Parra, A.; Puerta Morales, F.J.; Marcos, M. Experimental Methodology for Evaluating Workpieces Surface Integrity in Dry Turning of Aerospace Alloys. In Proceedings of the Annals of DAAAM, the 26th International DAAAM Symposium, Zadar, Croatia, 18–25 October 2015; pp. 0849–0855. [Google Scholar]
  8. Risbood, K.A.; Dixit, U.S.; Sahasrabudhe, A.D. Prediction of surface roughness and dimensional deviation by measuring cutting forces and vibrations in turning process. J. Mater. Process. Technol. 2003, 132, 203–214. [Google Scholar] [CrossRef]
  9. Trujillo, F.J.; Sevilla, L.; Marcos, M. Cutting speed-feed coupled experimental model for geometric deviations in the dry turning of UNS A97075 Al-Zn alloys. Adv. Mech. Eng. 2014, 2014, 382435. [Google Scholar] [CrossRef]
  10. Abroug, F.; Pessard, E.; Germain, G.; Morel, F.; Chové, E. The influence of machined topography on the HCF behaviour of the Al 7050 alloy. Procedia Eng. 2018, 213, 613–622. [Google Scholar] [CrossRef]
  11. ISO 1143:2010 (E). Metallic materials: Rotating Bar Bending Fatigue Testing. Available online: https://www.iso.org/standard/41875.html (accessed on 28 September 2019).
  12. Javidi, A.; Rieger, U.; Eichlseder, W. The effect of machining on the surface integrity and fatigue life. Int. J. Fatigue 2008, 30, 2050–2055. [Google Scholar] [CrossRef]
  13. M’Saoubi, R.; Outeiro, J.C.; Chandrasekaran, H.; Dillon, O.W., Jr.; Jawahir, I.S. A review of surface integrity in machining and its impact on functional performance and life of machined products. Int. J. Sustain. Manuf. 2008, 1, 203. [Google Scholar]
  14. Martín-Béjar, S.; Trujillo, F.J.; Herrera, M.; Sevilla, L.; Marcos, M. Experimental methodology design for fatigue behaviour analysis of turned aluminum alloys. Procedia Manuf. 2017, 13, 73–80. [Google Scholar] [CrossRef]
  15. Apostolos, F.; Alexios, P.; Georgios, P.; Panagiotis, S.; George, C. Energy efficiency of manufacturing processes: A critical review. Procedia CIRP 2013, 7, 628–633. [Google Scholar] [CrossRef]
  16. Gómez-Parra, A.; Puerta, F.J.; Rosales, E.I.; González-Madrigal, J.M.; Marcos, M. Study of the influence of cutting parameters on the Ultimate Tensile Strength (UTS) of UNS A92024 alloy dry turned bars. Procedia Eng. 2013, 63, 796–803. [Google Scholar] [CrossRef]
  17. Trujillo, F.J.; Sevilla, L.; Marcos, M. Experimental parametric model for indirect adhesion wear measurement in the dry turning of UNS A97075 (Al-Zn) alloy. Materials 2017, 10, 152. [Google Scholar] [CrossRef] [PubMed]
  18. Starke, E.A.; Staley, J.T. Application of modern aluminium alloys to aircraft. Fundam. Alum. Metall. 2011, 747–783. [Google Scholar] [CrossRef]
  19. Santos, M.C.; Machado, A.R.; Sales, W.R.; Barrozo, M.A.S.; Ezugwu, E.O. Machining of aluminum alloys: a review. Int. J. Adv. Manuf. Technol. 2016, 86, 3067–3080. [Google Scholar] [CrossRef]
  20. Polmear, I.J. 3-Wrought aluminium alloys. In Light Alloys, 4th ed.; Butterworth-Heinemann: Oxford, UK, 2005; pp. 97–204. [Google Scholar]
  21. Trent, E.M.; Wright, J.R. Metal Cutting, 4th ed.; Butterworth-Heinemann: Oxford, UK, 2000. [Google Scholar]
  22. Campbell, F.C. Manufacturing Technology for Aerospace Structural Materials; Elsevier Science: Amsterdam, The Netherlands, 2006. [Google Scholar]
  23. Sugihara, T.; Nishimoto, Y.; Enomoto, T. On-machine tool resharpening for dry machining of aluminum alloys. Procedia CIRP 2014, 24, 68–73. [Google Scholar] [CrossRef]
  24. Goindi, G.S.; Sarkar, P. Dry machining: A step towards sustainable machining—Challenges and future directions. J. Clean. Prod. 2017, 165, 1557–1571. [Google Scholar] [CrossRef]
  25. Krolczyk, G.M.; Maruda, R.W.; Krolczyk, J.B.; Wojciechowski, S.; Mia, M.; Nieslony, P.; Bukzik, G. Ecological trends in machining as a key factor in sustainable production—A review. J. Clean. Prod. 2019, 218, 601–615. [Google Scholar] [CrossRef]
  26. Maruda, R.W.; Krolczyk, G.M.; Wojciechowski, S.; Zak, K.; Habrat, W.; Nieslony, P. Effects of extreme pressure and anti-wear additives on surface topography and tool wear during MQCL turning of AISI 1045 steel. J. Mech. Sci. Technol. 2018, 32, 1585–1591. [Google Scholar] [CrossRef]
  27. Chen, L.; Hsieh, C.-C.; Wetherbee, J.; Yang, C.-L. Characteristics and treatability of oil-bearing wastes from aluminum alloy machining operations. J. Hazard. Mater. 2008, 152, 1220–1228. [Google Scholar] [CrossRef]
  28. García-Jurado, D.; Vazquez-Martinez, J.M.; Gámez, A.J.; Batista, M.; Puerta, F.J.; Marcos, M. FVM based study of the influence of secondary adhesion tool wear on surface roughness of dry turned Al-Cu aerospace alloy. Procedia Eng. 2015, 132, 600–607. [Google Scholar] [CrossRef]
  29. Trujillo, F.J.; Sevilla, L.; Martín, F.; Bermudo, C. Analysis of the chip geometry in dry machining of aeronautical aluminum alloys. Appl. Sci. 2017, 7, 132. [Google Scholar]
  30. Trujillo, F.J.; Sevilla, L.; Marcos, M. Influence of the axial machining length on microgeometrical deviations of horizontally dry-turned UNS A97075 Al-Zn alloy. Procedia Eng. 2013, 63, 405–412. [Google Scholar] [CrossRef]
  31. Gökkaya, H. The effects of machining parameters on cutting forces, surface roughness, Built-Up Edge (BUE) and Built-Up Layer (BUL) during machining AA2014 (T4) Alloy. J. Mech. Eng. 2010, 56, 584–593. [Google Scholar]
  32. Rubio, E.M.; Camacho, A.M.; Sánchez-Sola, J.M.; Marcos, M. Surface roughness of AA7050 alloy turned bars: Analysis of the influence of the length of machining. J. Mater. Process. Technol. 2005, 162–163, 682–689. [Google Scholar] [CrossRef]
  33. Horváth, R.; Drégelyi-Kiss, A. Analysis of surface roughness of aluminum alloys fine turned: United phenomenological models and multi-performance optimization. Meas. J. Int. Meas. Confed. 2015, 65, 181–192. [Google Scholar] [CrossRef]
  34. Jomaa, W.; Songmene, V.; Bocher, P. Surface finish and residual stresses induced by orthogonal dry machining of AA7075-T651. Materials 2014, 7, 1603. [Google Scholar] [CrossRef]
  35. De Lacerda, J.C.; Martins, G.D.; Signoretti, V.T.; Teixeira, R.L.P. Evolution of the surface roughness of a low carbon steel subjected to fatigue. Int. J. Fatigue 2017, 102, 143–148. [Google Scholar] [CrossRef]
  36. Novovic, D.; Dewes, R.C.; Aspinwall, D.K.; Voice, W.; Bowen, P. The effect of machined topography and integrity on fatigue life. Int. J. Mach. Tools Manuf. 2004, 44, 125–134. [Google Scholar] [CrossRef]
  37. Trujillo, F.J.; Sevilla, L.; Salguero, J.; Batista, M.; Marcos, M. Parametric potential model for determining the microgeometrical deviations of horizontally dry-turned UNS A97075 (Al–Zn) alloy. Adv. Sci. Lett. 2013, 19, 731–735. [Google Scholar] [CrossRef]
  38. Trujillo, F.J.; Marcos, M.; Sevilla, L. Experimental prediction model for roughness in the turning of UNS A97075 alloys. Mater. Sci. Forum 2014, 797, 59–64. [Google Scholar] [CrossRef]
  39. Salguero, J.; Puerta, F.J.; Gomez-Parra, A.; Trujillo, F.J.; Sevilla, L.; Marcos, M. An analysis of geometrical models for evaluating the influence of feed rate on the roughness of dry turned UNS A92050 (Al-Cu-Li) alloy. Adv. Mater. Process. Technol. 2016, 2, 578–589. [Google Scholar] [CrossRef]
  40. Sánchez Sola, J.M.; Batista, M.; Salguero, J.; Gómez, A.; Marcos, M. Cutting speed-feed based parametric model for macro-geometrical deviations in the dry turning of UNS A92024 Al-Cu alloys. Key Eng. Mater. 2012, 504–506, 1311–1316. [Google Scholar] [CrossRef]
  41. Benchergui, D.; Svoboda, C. Aircraft design. Aerosp. America 2012, 50, 28. [Google Scholar]
  42. ISO 1101:2017 (E). Geometrical Product Specifications (GPS)—Geometrical tolerancing—Tolerances of Form, Orientation, Location and Run-Out. Available online: https://www.iso.org/obp/ui/#iso:std:iso:1101:ed-4:v1:en (accessed on 28 September 2019).
  43. Sui, W.; Zhang, D. Four methods for roundness evaluation. Phys. Procedia 2012, 24, 2159–2164. [Google Scholar] [CrossRef]
  44. Wojciechowski, S. Machined surface roughness including cutter displacements in milling of hardened steel. Metrol. Meas. Syst. 2011, 18, 429–440. [Google Scholar] [CrossRef]
Figure 1. Specimens geometrical dimensions (mm).
Metals 09 01141 g001
Figure 2. Specimen positioning and turning operation tool.
Metals 09 01141 g002
Figure 3. Geometrical control setup on the specimen calibrated area.
Metals 09 01141 g003
Figure 4. Form measuring system.
Metals 09 01141 g004
Figure 5. (a) The roundness (RON), circular run-out (CRO) and concentricity (CON) measured sections; (b) straightness (STR) and parallelism (PAR) measured generatrix.
Metals 09 01141 g005
Figure 6. Macrogeometrical deviations: (a) RON, CON and CRO, (b) total circular run-out (TCRO), (c) STR and PAR and (d) cylindricity (CYL).
Metals 09 01141 g006
Figure 7. (a) Parallelism and (b) straightness deviation as a function of cutting speed (vc) and feed (f).
Metals 09 01141 g007
Figure 8. Stereoscopic optical microscopy (SOM) of the tool rake face (40×) after the tests performed for (a) f = 0.05 mm/r and (b) f = 0.10 mm/r, for vc = 40 m/min.
Metals 09 01141 g008
Figure 9. Stereoscopic optical microscopy (SOM) of the tool rake face (40×) after the tests performed for (a) f = 0.15 mm/r and (b) f = 0.20 mm/r, for vc = 80 m/min.
Metals 09 01141 g009
Figure 10. Circular run-out deviations for (a) vc = 40 m/min, (b) vc = 60 m/min and (c) vc = 80 m/min.
Metals 09 01141 g010aMetals 09 01141 g010b
Figure 11. Circular run-out mean values as a function of cutting speed (vc) and feed (f).
Metals 09 01141 g011
Figure 12. Roundness deviations for (a) vc = 40 m/min, (b) vc = 60 m/min and (c) vc = 80 m/min.
Metals 09 01141 g012
Figure 13. Mean deviations values in function of vc and f for (a) roughness and (b) concentricity.
Metals 09 01141 g013
Figure 14. Mean deviations values as a function of vc and f for the (a) total circular run-out, and (b) cylindricity.
Metals 09 01141 g014
Figure 15. Potential models as a function of vc and f (a) straightness, (b) circular run-out and (c) roundness.
Metals 09 01141 g015aMetals 09 01141 g015b
Figure 16. Potential models for (a) STR = g(vc, f), (b) CRO = h(vc, f) and (c) RON = j(vc, f).
Metals 09 01141 g016aMetals 09 01141 g016b
Table 1. Tested alloy composition (% mass).
ZnMgCuCrSiMnAl
6.012.611.880.190.080.07Rest
Table 2. Cutting parameters.
vc (m/min)f (mm/r)ap (mm)
40
60
80
0.051.0
0.10
0.15
0.20
Table 3. Cutting angles setup.
Cutting AnglesValue
Relief angle (α)
Cutting edge angle (β)66°
Rake angle (γ)17°
Major cutting edge angle (κr)62.5°
Insert included angle (ε)55°
Table 4. Model coefficients.
GDCxy
STR0.1201.5741.123
CRO119.7200.0280.584
RON5.2970.7360.832