Abstract
Residual stresses can affect both the static strength and the fatigue endurance of welded joints. Residual stresses can be assessed by numerical simulation; however, the simulation of the welding process is a complex task that requires knowledge of several parameters, many of which can only be estimated with some uncertainty. The reduction in the number of these parameters can lead to a more feasible and efficient study. In this work, the finite element method is used to assess the capability of different thermal methods used to simulate a single pass of the gas metal arc welding process in reproducing the temperature distribution around the weld. Results of the simulations are compared to experimental measurements of the surface temperature close to the welding area. The thermal techniques analyzed adopt different levels of complexity, from the basic implementation of a constant initial temperature assigned to a given material volume, to the more comprehensive and widespread Goldak’s double-ellipsoid model. The study shows that, close to the weld seam, very similar thermal behaviors can be achieved by employing each one of the analyzed methods. Secondly, considering the constant initial temperature method, the comparison between experimental measurements and numerical simulations showed a fairly good agreement, suggesting that a relatively simple method (i.e., requiring the setting of only one parameter) can be used to efficiently reproduce the thermal history of a welding process.
1. Introduction
Different production processes can cause residual stresses, and, among these, the following are worthy of mention: surface treatments [1], welding [2], additive manufacturing [3], and plastic deformation [4].
Residual stresses after welding are difficult to detect and are present in most welded structures. Most of the time, residual stresses are detrimental to the integrity of a component; they can cause accidental failure and dimensional defects in the part. Therefore, tensile residual stresses limit the load-carrying capacity and safety margins of mechanical components under operation, and an effective engineering design can only be achieved if they are adequately known.
On the other hand, compressive residual stresses are sought after to delay the initiation and propagation of cracks and thus to increase the fatigue life (e.g., the crack closure effect explained as by [5]). Micro- and macromechanisms are the origin of a stress field inside a part, e.g., inelastic deformations, temperature gradients, and phase transformation to name a few. During welding, all three of these mechanisms are significant, occurring simultaneously all through the production process. Nowadays, the use of the finite element method (FEM) is increasing in different fields of study, being also employed for the residual stresses evaluation [6]. The use of FEM has some advantages with respect to experimental methods, such as the number of physical prototypes that can be analyzed, the associated costs, and, above all, the total time that is required for a complete analysis [7]. However, it is a challenge to deal with all the parameters involved in this kind of process, so simplifications are required [8]. Usually, some input parameters are varied and then the simulation output is studied in order to evaluate their influence. In particular, for the simulation of the welding process, independently from the used software, the focus can be on the process parameters that can be set up for the joining process (e.g., welding speed, welding power, welding technology, etc.) or non-process parameters, such as materials and geometric variables (e.g., material parameters, joint geometry, elements thickness, etc.).
The focus of this work relies on the numerical aspect of the thermal simulation [9], and in which way the material thermal properties affect the results. The process parameters and the joint geometry are kept fixed, as they are both well known, while uncertainties in the material parameters are considered as being the main issue. Other authors already studied the effect of the production process; see, for example, the effect of the heat source distribution, energy input and welding speed on temperature variation as discussed by [10]. Furthermore, a comparison of different simulation techniques of the welding process are discussed to understand to what extent simplified models can be adopted to simulate the temperature distribution close to the weld. Three numerical methods are considered in the following: An initial constant temperature of the welding seam’s elements, constant heat flux and the well known Goldak heat source distribution [11]. The Goldak’s double-ellipsoid heat source distribution was taken as the reference welding simulation process, as it is widely used in the literature ([12,13,14]). The constant starting temperature technique [15] and the volumetric heat flux [16] were compared with Goldak’s double-ellipsoid model to appreciate the differences in the simulated thermal behavior of the three models. Finally, a sensitivity analysis was performed to rank the parameters in order of importance, thus determining the ones that exhibit the greatest influence on simulation results.
2. Material
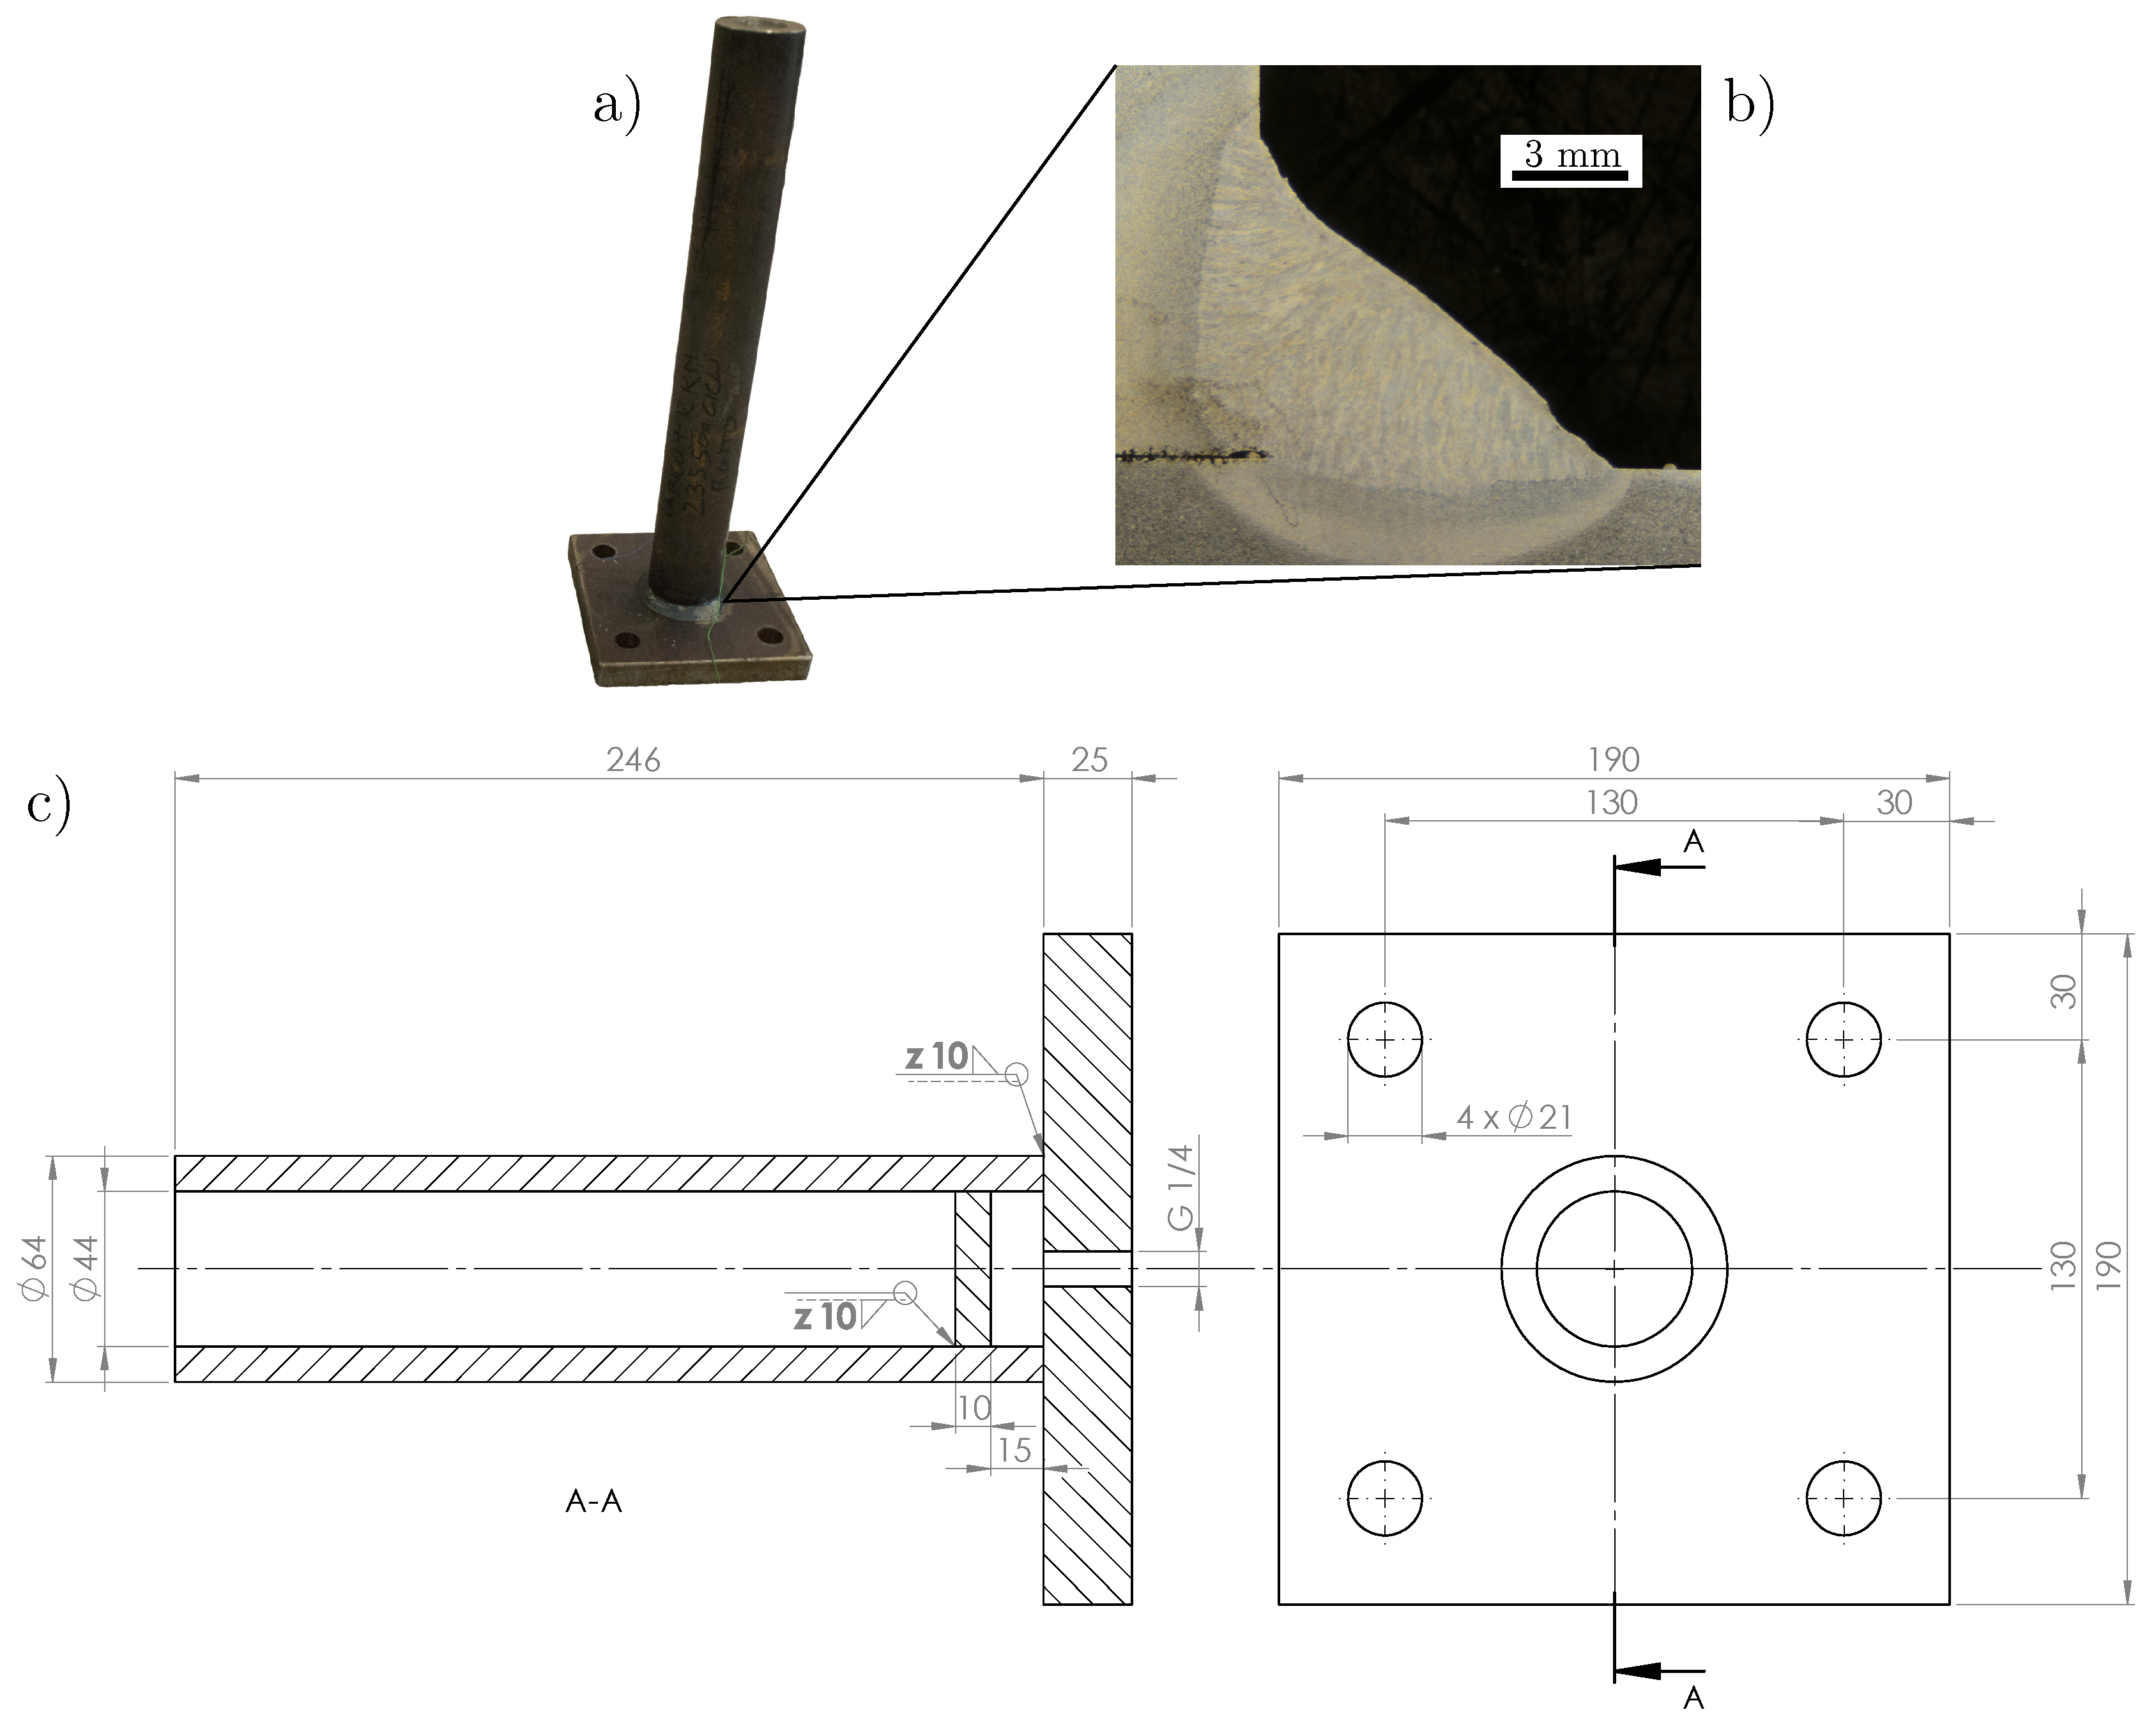
The studied model refers to the tube-to-plate welded joint geometry shown in Figure 1a, with a T-weld seam, as shown in Figure 1b. A technical drawing of the specimen is shown in Figure 1c. The specimen (of steel grade S355JR) was composed of a tube with an internal diameter of 44 and a thickness of 10 , which was joined by seam welding to a square plate with side length of 190 and a thickness of 25 . Four holes with a diameter of 21 were drilled in the plate corners as well as one 10 hole in the centre of the plate to make it possible to carry out fatigue tests ([17,18,19]). Furthermore, a reinforcement was placed inside the tube at a distance of 15 from the plate surface. Both of the welding procedures were performed in a single pass using gas metal arc welding (GMAW) with the process parameters shown in Table 1, with a TransPuls Synergic 4000 (FRONIUS INTERNATIONAL GMBH, Pettenbach, Austria) machine. The welding of the tube to the plate was performed manually, fixing in advance the position of the tube by means of welding spots. The welding torch was kept still, and, using a rotating table, the welding speed was adjusted directly by the operator. The welding process can be considered as steady-state in the middle part, while transient effects are more pronounced at the start and the end of the weld seam.
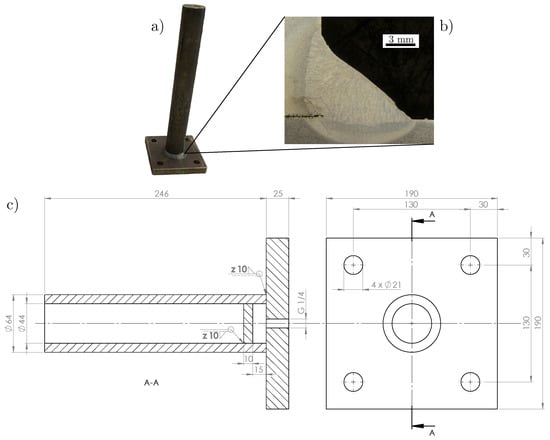
Figure 1.
Real sample (a), micrograph of the weld seam (b), technical drawing of the specimen (c).

Table 1.
Welding process parameters.
3. Methods
3.1. Thermal Analysis
The numerical simulations were performed using the Ansys 19.2 software (Ansys Inc., Canonsburg, Pennsylvania, United States). Specifically, a transient nonlinear simulation was used for the thermal analysis. A full 3D model was used to take into account the asymmetry caused by the welding operation, which distributes heat over the specimen progressively in a hoop direction.
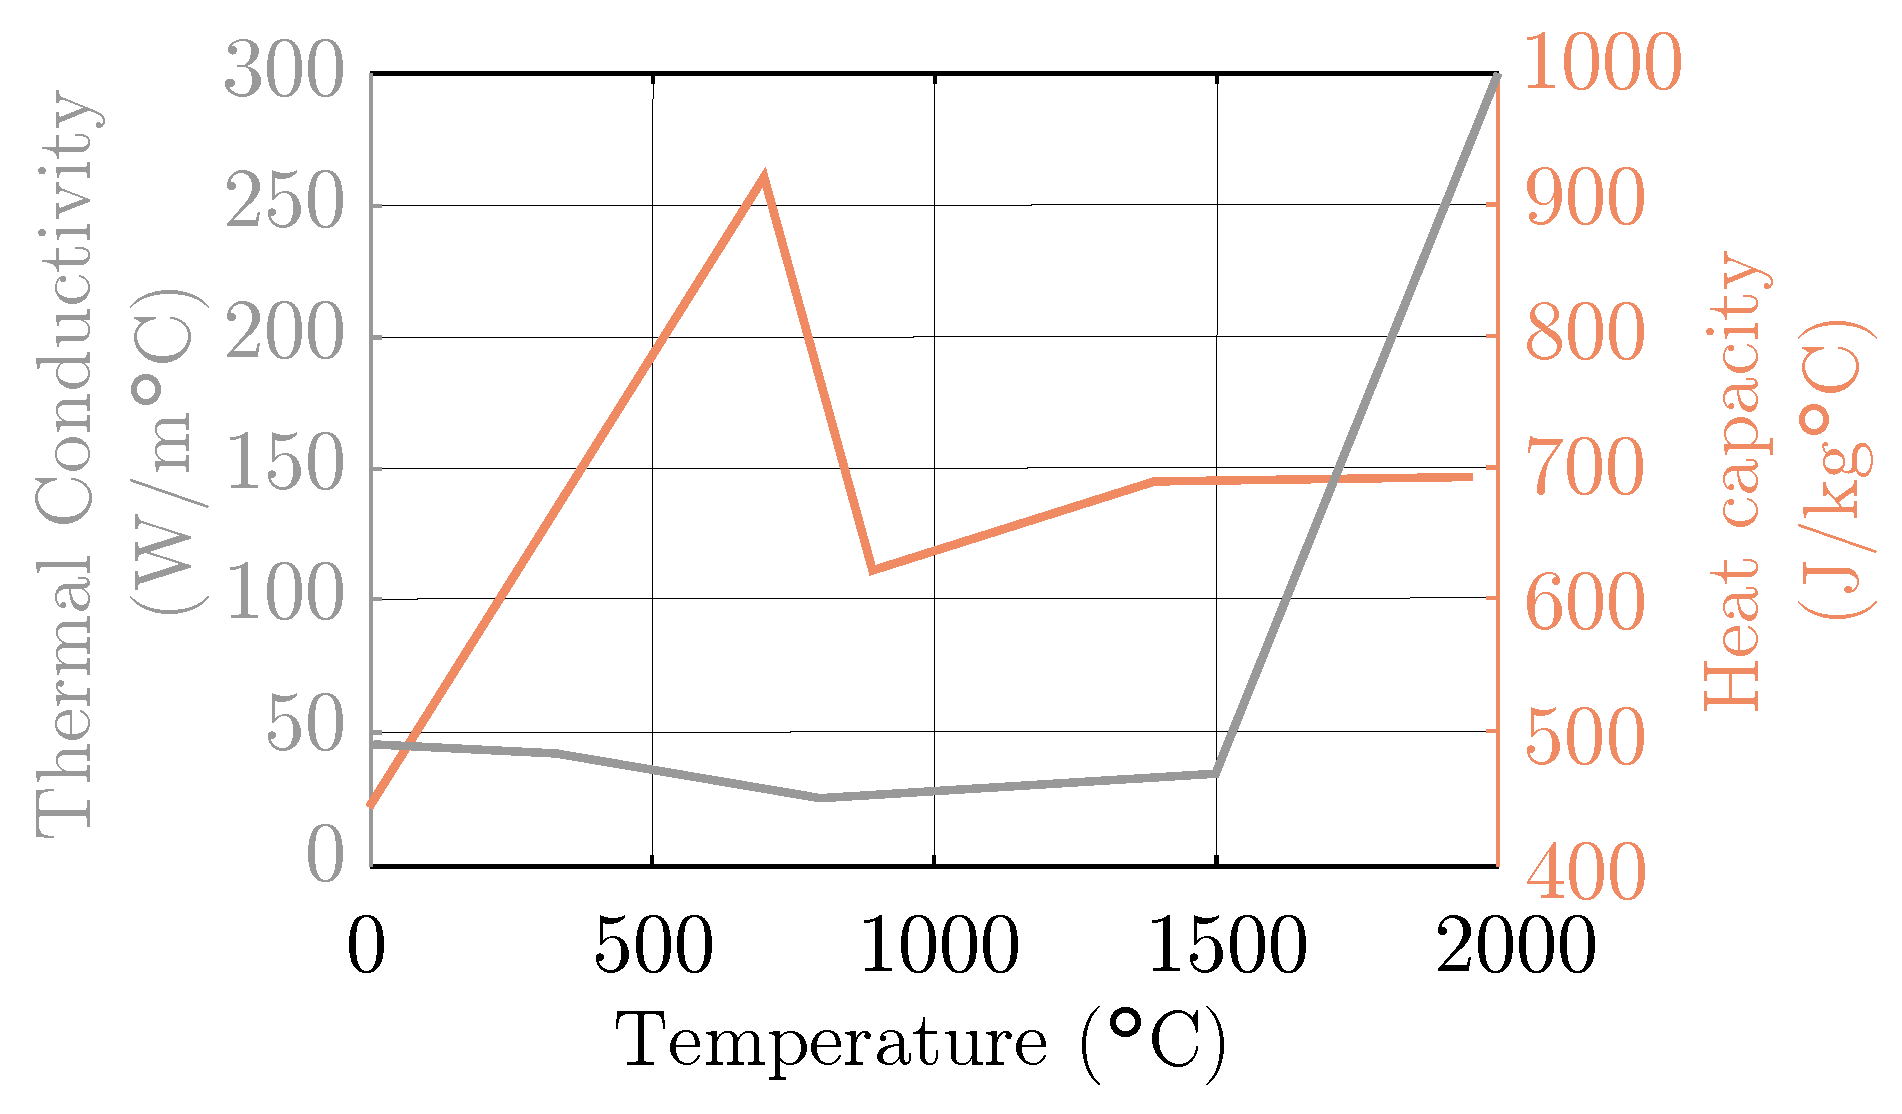
A SOLID70 element was adopted for the 3D analysis; it is a brick with eight nodes that uses the temperature as the only degree of freedom. The temperature-dependent thermal material properties were collected from different sources ([16,20,21,22,23]). In the following, the properties taken as references are the ones derived from [20]. In particular, referring to Figure 2, a fictitious increase in the coefficient of thermal conductivity was introduced, specifically, for the heat transfer in the melting pool at 2000 C, as suggested by [24].
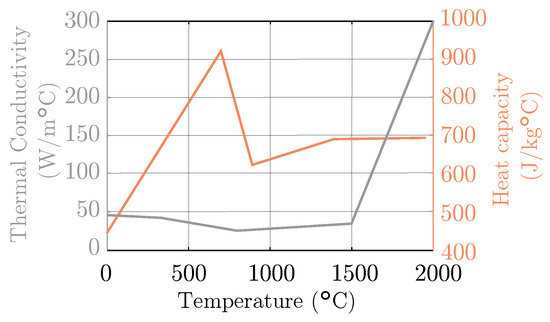
Figure 2.
Temperature dependent thermal material properties derived from [20].
Meanwhile, both convection and radiation were considered constant. The heat convection coefficient was set to a value of 20 W m−2 K−1 on all the surfaces except the bottom one in order to simulate the heat transfer between steel and air. In particular, for the bottom surface, the heat sink effect was considered, as a result of contact with the metallic support during welding; the heat convection coefficient was set to a value of 500 W m−2 K−1, which is comparable to the one used by [25]. In addition, the radiation was taken into account through the emissivity coefficient set at 0.79 at ambient temperature. Generally, the convection is significant for lower temperatures than radiation; instead, for temperatures close to the material melting point, radiation is more relevant. However, no sensitivity was detected for emissivity and convection coefficients in the set of values found in the literature, as shown in Section 4.1.
The main focus of the simulation was the welding process. Three different methods were considered and used to evaluate their capability in reproducing the experimental results. The selected methods are listed below:
- Constant initial temperature (CIT), as explained in Section 3.2;
- Constant volumetric heat flux (CVHF), as explained in Section 3.3;
- Goldak’s heat source distribution (GHSD), as explained in Section 3.4.
The thermal analysis follows the equilibrium Equation (1), as described by [26]:
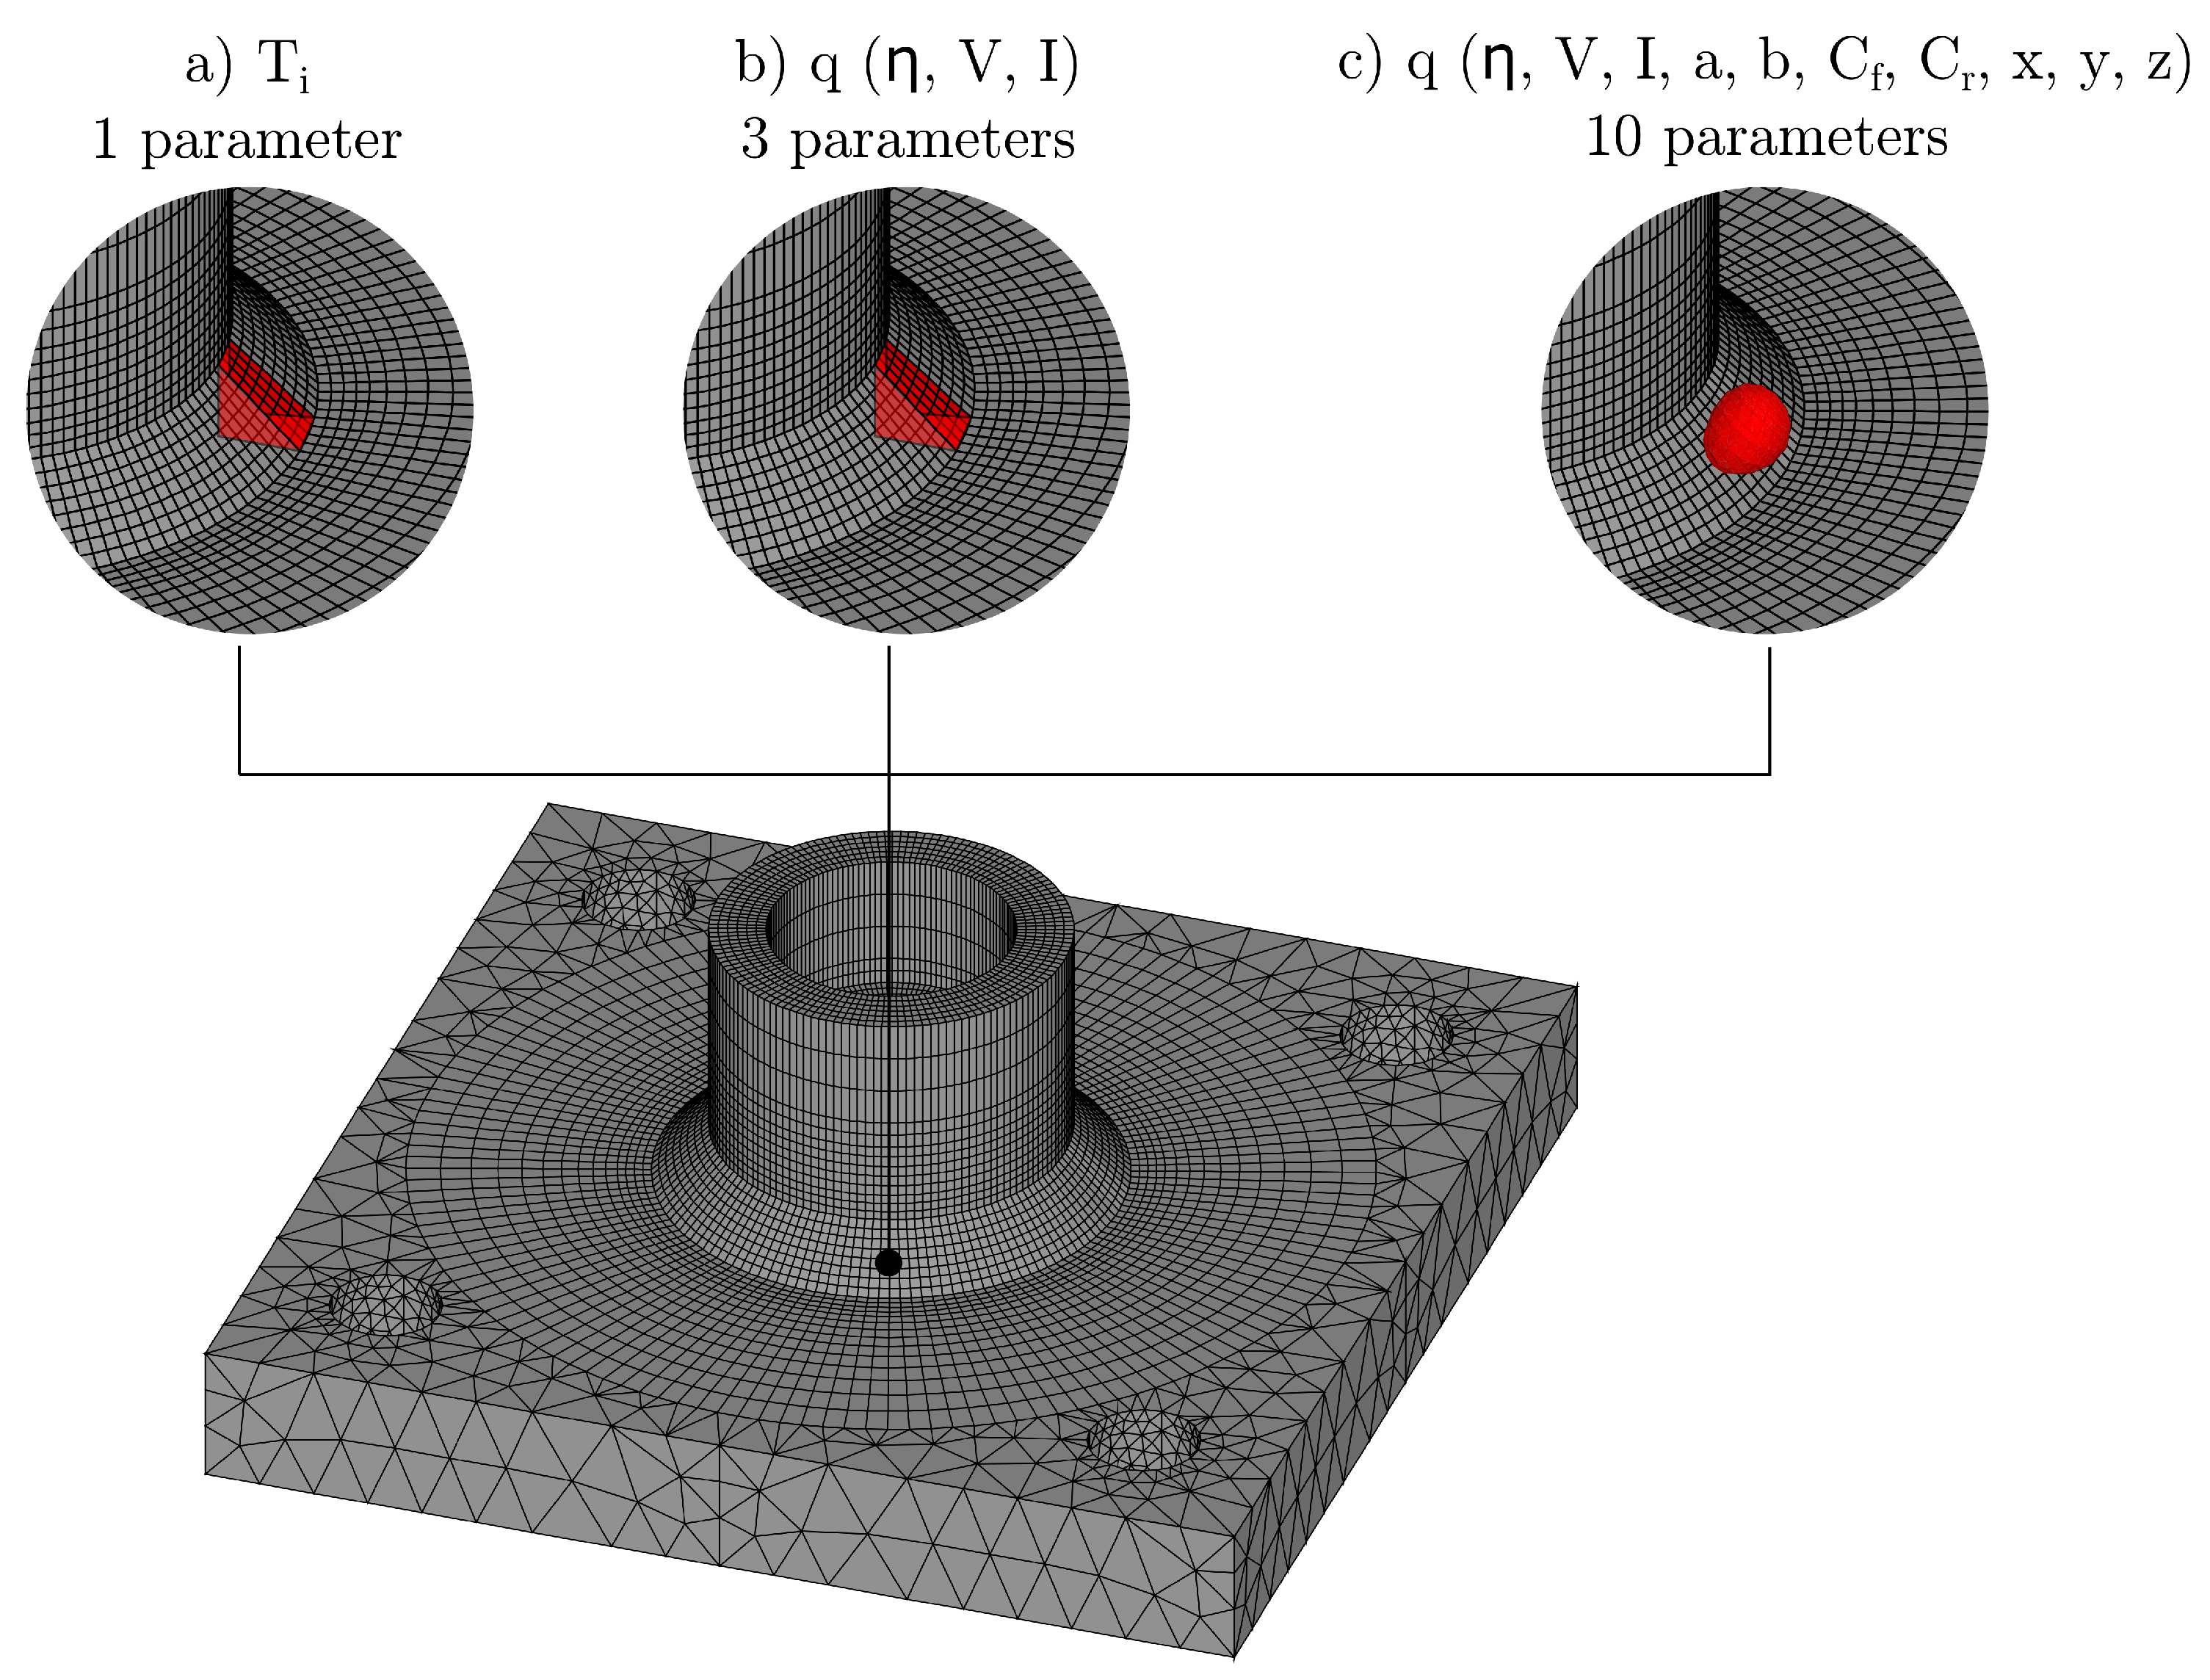
where is the internal heat source rate, and k, , and are the conductivity, specific heat and density of the material, respectively. Figure 3 qualitatively illustrates the three techniques applied in the FEM; in particular, the parameters of Figure 3a–c are described in the following sections. In Figure 3a, a set of elements is chosen and an initial temperature of is assigned to them, after which, the cooling process is simulated by a transient thermal simulation. In Figure 3b, constant volumetric heat flux is applied to the elements belonging to the weld seam. The model activation time is a function of the total welding time and the number of activated elements—while, in Figure 3c, a double-ellipsoid function is used to select the nodes depending on their coordinates with subsequent application of a volumetric heat flux whose intensity depends from the node’s coordinates.
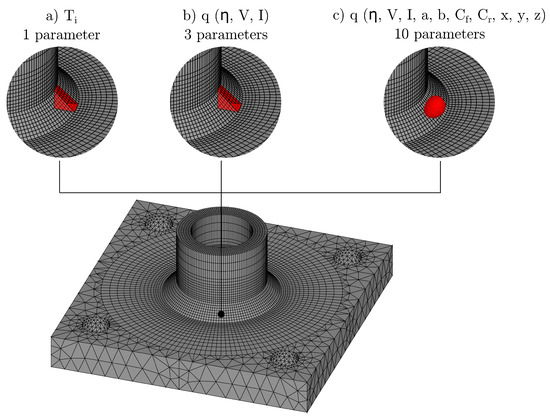
Figure 3.
Meshed specimen (bottom) and simulation techniques applied on the welding seam: constant initial temperature (a), constant heat flux (b), and Goldak’s double-ellipsoid model (c).
It can be immediately noticed that one of the main differences among the applied methods is the number of parameters on which they depend, one for CIT, three for CVHF, and ten for GHSD. It comes out that the use of the CIT and CVHF methods can be handled more easily than the other one. Nevertheless, from a thermal point of view, the CIT has some limitations in accurately describing the thermal profile during welding. A transitory is necessary before the simulated temperature profile matches the real temperature profile, as described later in Section 3.2. In addition, the activation of elements at a fixed temperature does not allow for the study of a moving, tilted heat source [27]. Methods like CIT and CVHF are usually based on tuneable parameters, which are necessary for the correct setting of the heat source [28].
3.2. Constant Initial Temperature
The first method consisted of a sequential activation of elements with the same temperature; to do this, an “element birth and death” technique was applied. The procedure, which is now implemented in all of the most modern FEM software, deactivates the elements by multiplying their conductivity (or stiffness depending on the simulation type) for a severe reduction factor; as soon as the element is reactivated, the key quantities return to their full original values. The elements to which the CIT is applied were chosen according to the real geometry of the weld seam, as shown in Figure 4. After their activation, the elements exchange heat with the surrounding material; the transient temperature field (T), function of time (t), follows the equilibrium Equation (1). It is worth noting that the use of the “element birth and death” technique approximates the welding process in a discrete way, by activating only a finite set of elements. In this case, because only the initial temperature condition was set. Another example of the application of this technique can be found in [15]. The application of this method is immediate and easy, even for complex joint geometry; actually, only the elements selection is needed and just one parameter has to be set. Nonetheless, it is worth noting that the real complex process of material deposition with phase transition (e.g., [29]) is not simulated, and, therefore, the temperature that has to be settled on has to be considered as a fictitious parameter that has no real basis.

Figure 4.
Activated elements for the constant initial temperature (CIT) model with a temperature of (left) cross section of the weld seam (right).
3.3. Constant Volumetric Heat Flux
The volumetric heat flux consists of a constant uniform heat distribution that follows Equation (2):
where (/) is the volumetric heat flux, U () is the welding voltage, I () is the current, is the efficiency of the welding process, and V () is the volume to which the flux is applied. The main used parameters are given in Table 2. Additionally, in this case, the factor has no physical interpretation, but its purpose is to fine-tune the volumetric heat flux to reach the desired temperature as observed in the experimental test.

Table 2.
Numerical input parameters employed during the calibration of the models.
The heat flux was activated sequentially on a set of elements belonging to the welding seam through the “element birth and death” technique. Again, the simulation has a discrete nature due to the activation of specific set of elements. With reference to Equation (1), the internal heat source is given by . Different authors already applied this technique (see e.g., [16,30]).
3.4. Goldak’s Heat Source Distribution
The double-ellipsoid heat source proposed by Goldak is based on the following set of equations:
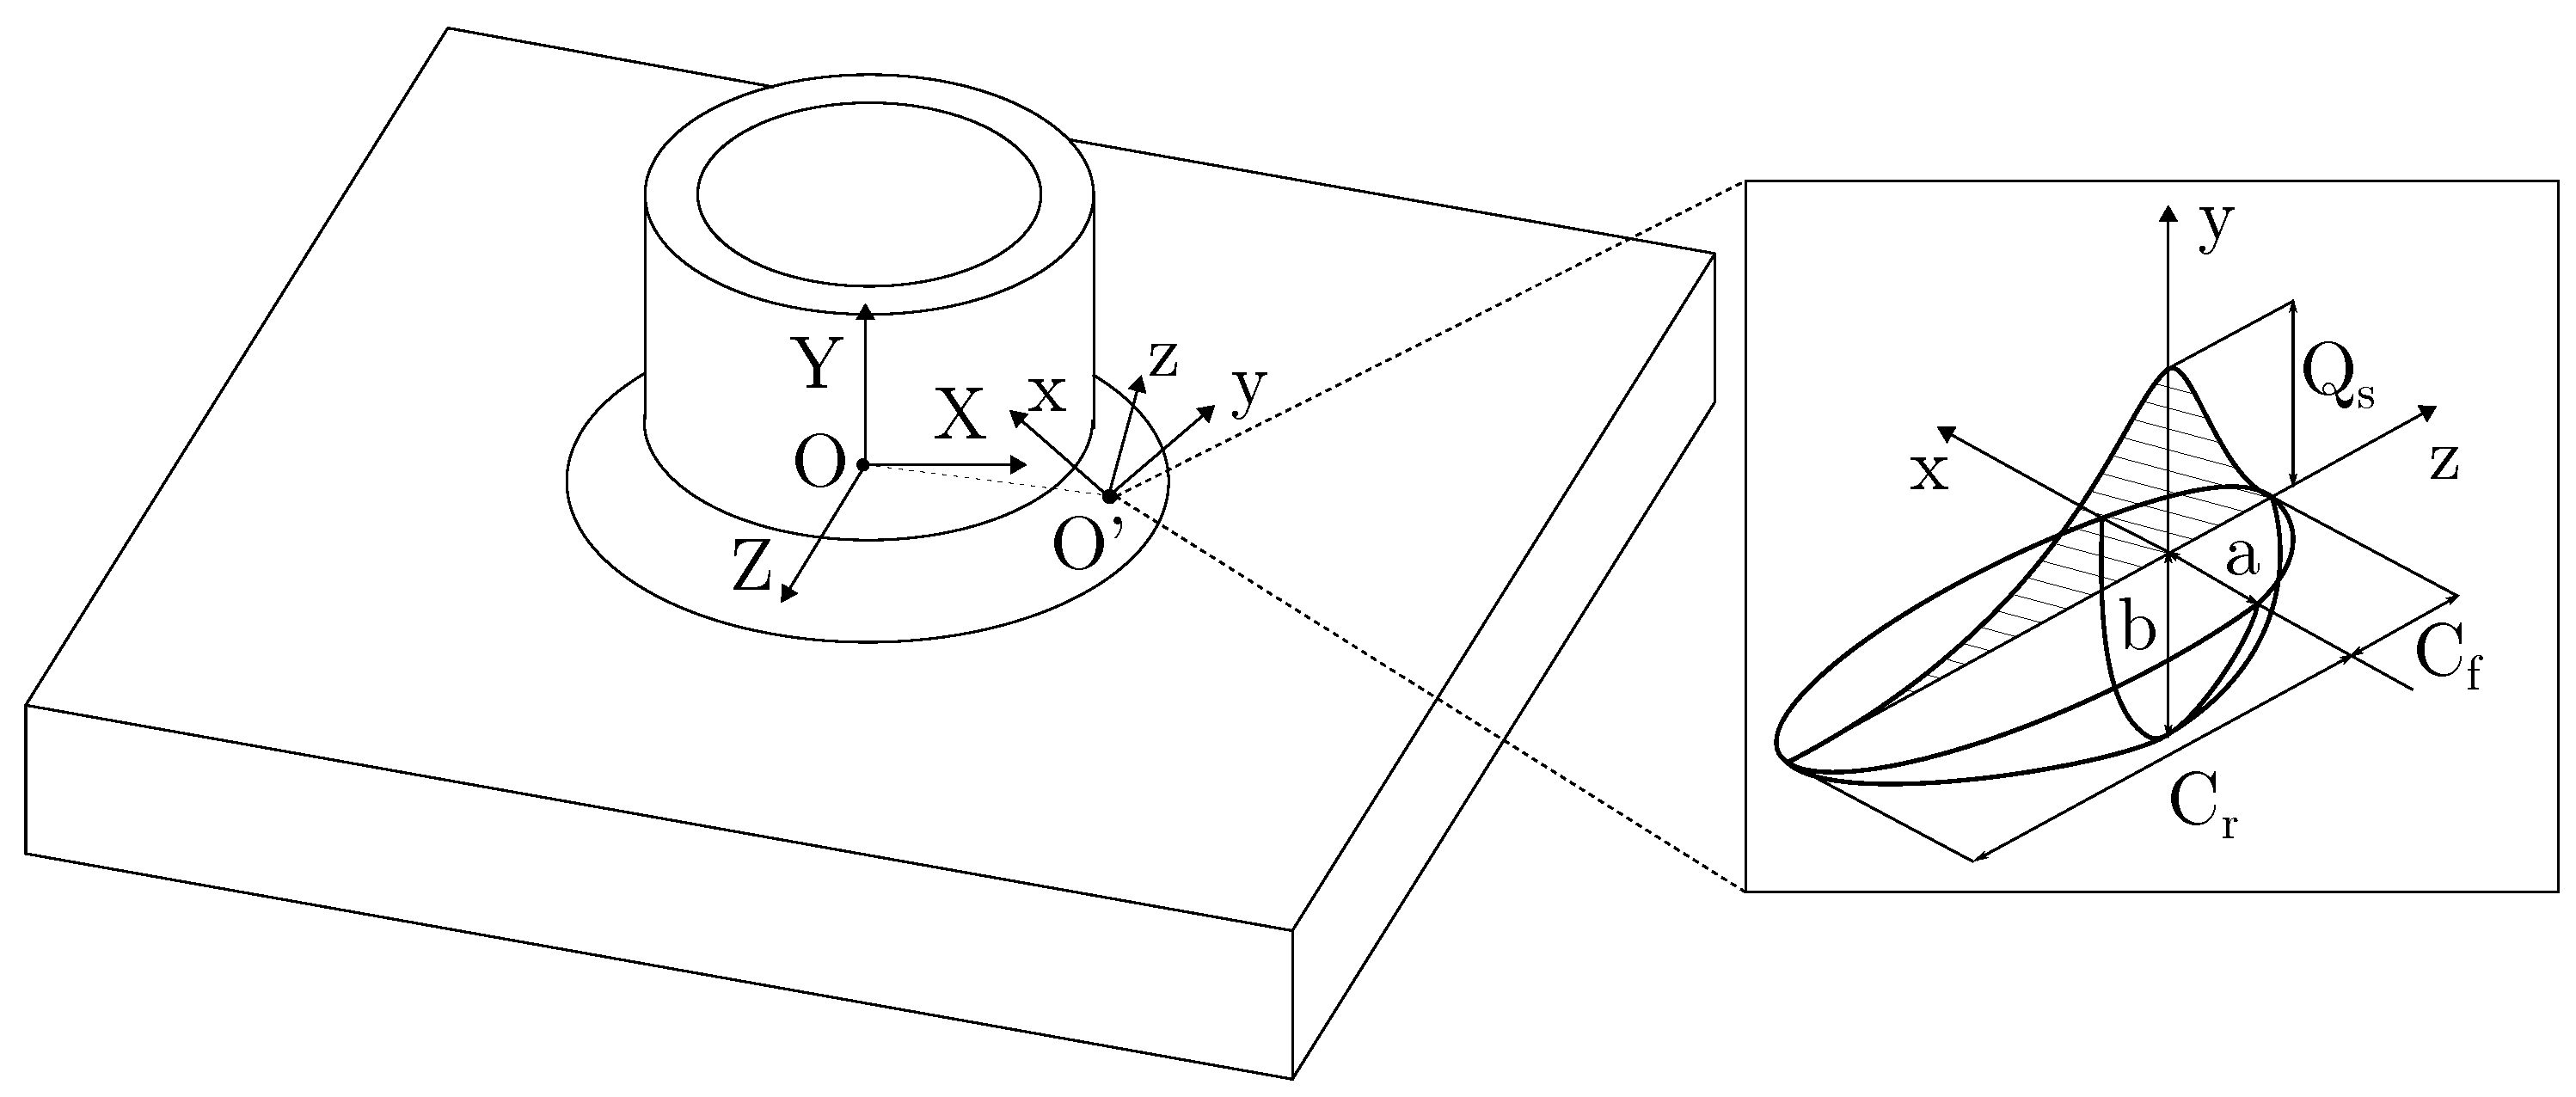
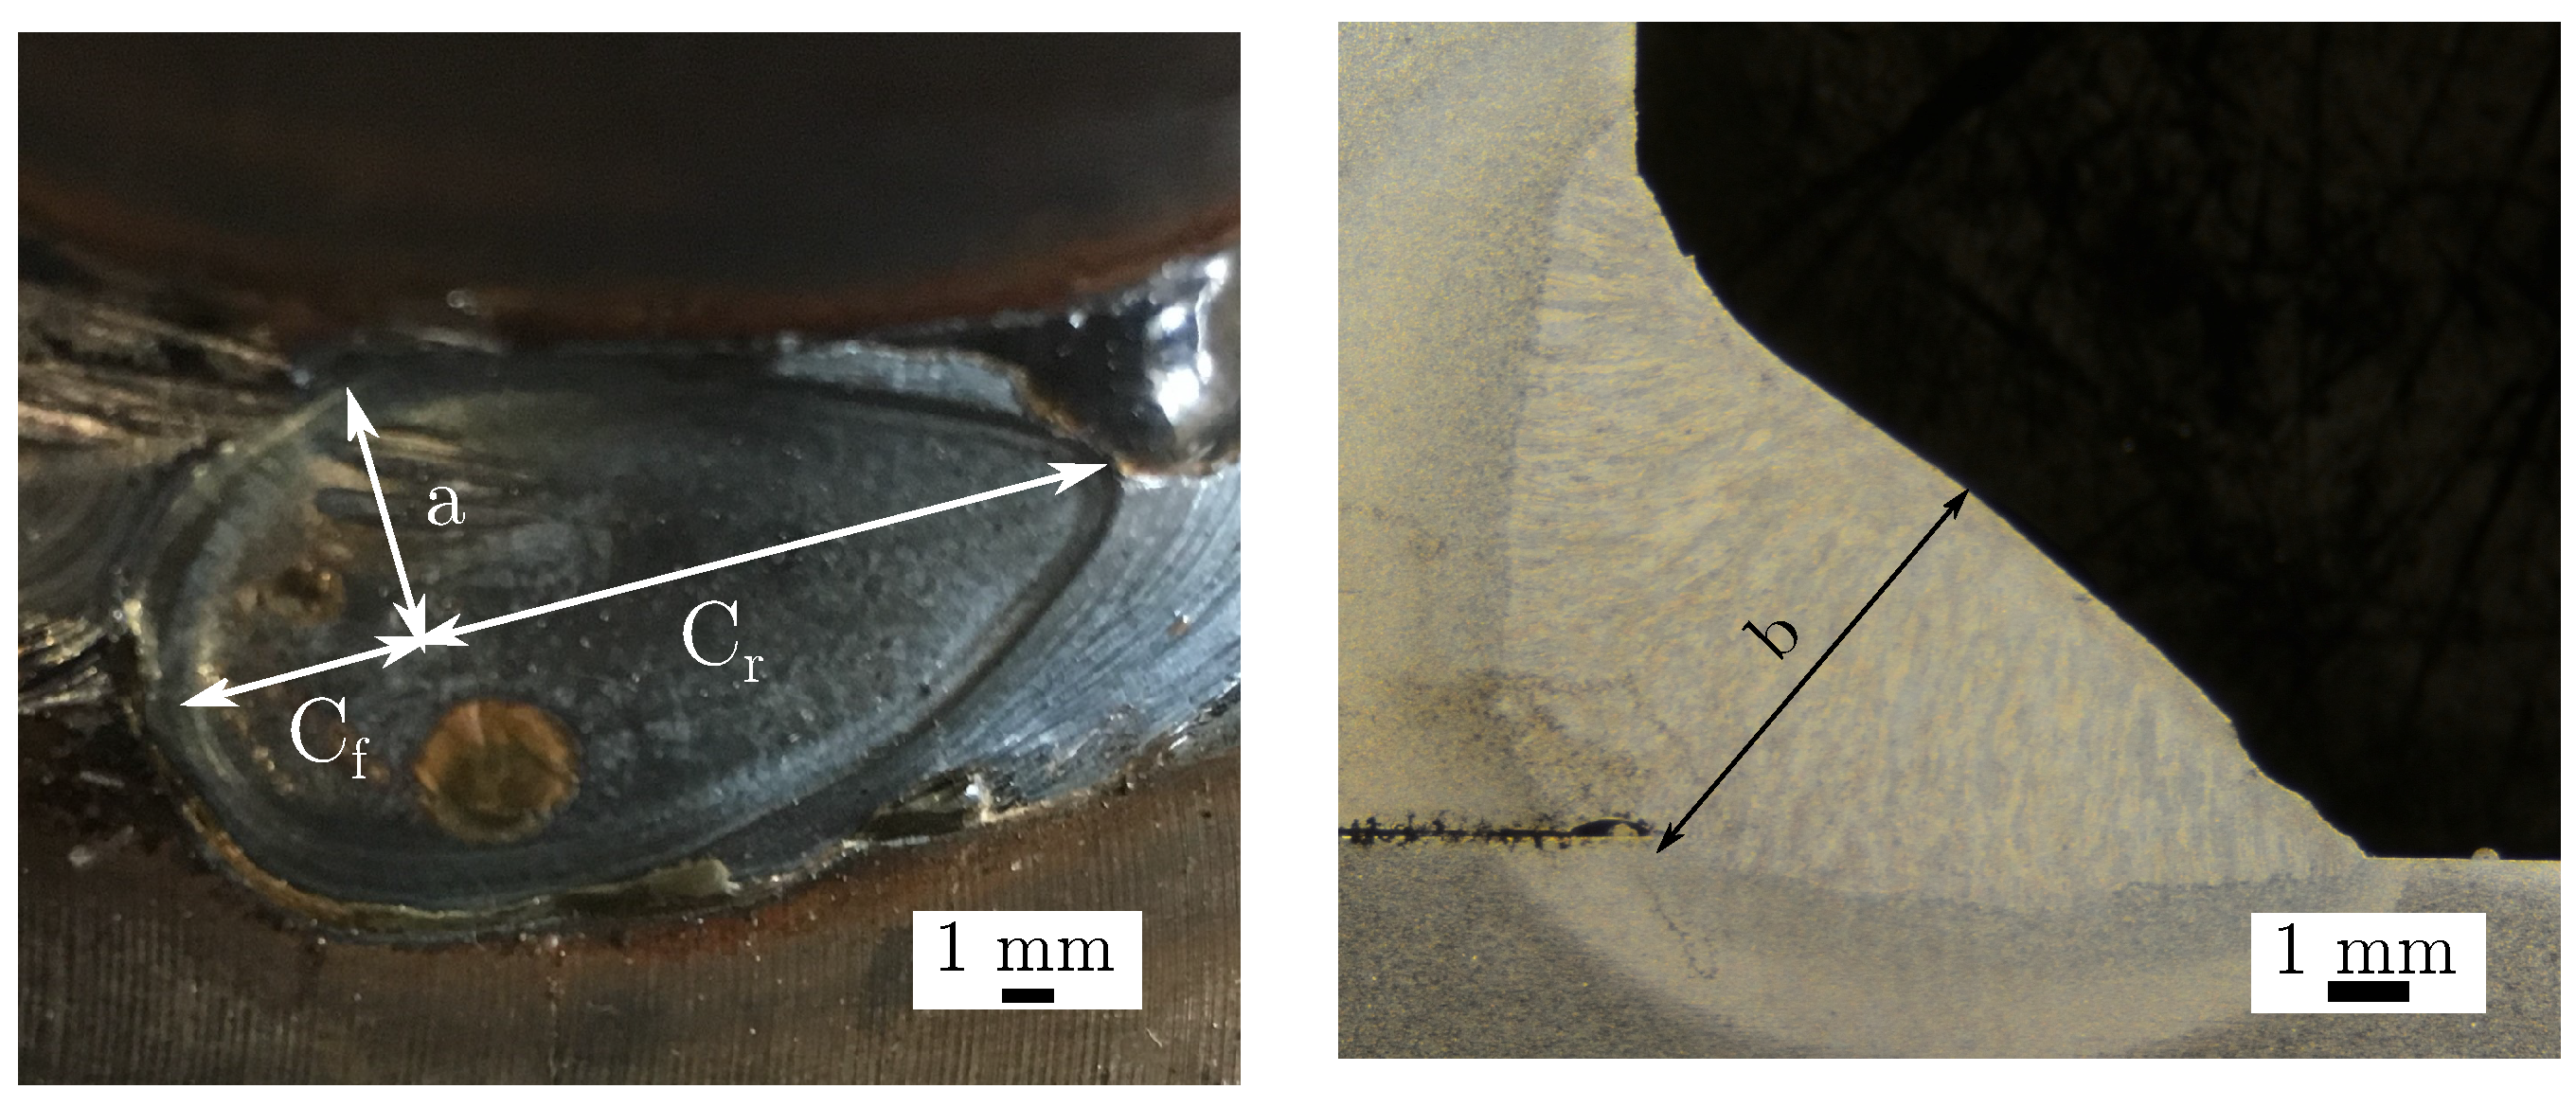
where () is the heat distribution of the welding heat source, U () is the welding voltage and I () is the current of the welding process, while is the efficiency of the process. In Equations (4) and (5), and (/) are, respectively, the front and rear ellipsoidal heat distribution amount at point (x,y,z), while a, b, and are geometrical parameters of the ellipse. The geometrical parameters were collected directly from the fusion zone, as shown in Figure 5 and Figure 6; in this way, the ellipsoid geometry is experimentally described, as was already done by [31]. Finally, the terms and are the strength distributions of the ellipsoid.
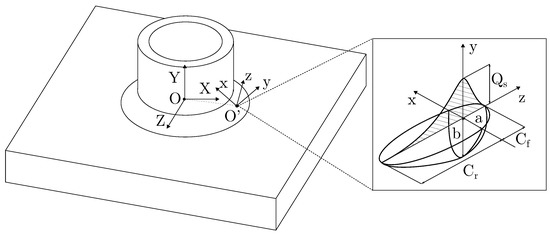
Figure 5.
Coordinate system transformation between global and local reference frame, for Goldak’s double-ellipsoid model.
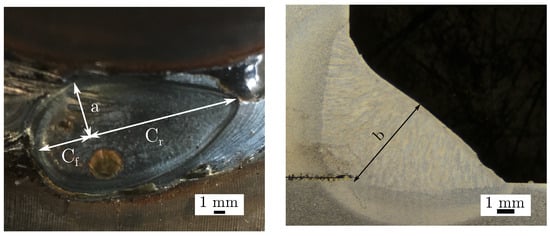
Figure 6.
Goldak’s heat source parameters obtained directly by the fusion zone.
For the application of the Goldak model, it is necessary to define a coordinate system, which, for instance, has to keep track of the welding torch movement; in this way, the Goldak distribution can replicate the real heat distribution without using the “element birth and death” technique. For the analyzed case, the coordinate system required for this particular joint geometry is represented in Figure 5, while Matrices (8) and (9) define it mathematically.
The two systems (X, Y, Z) and (x, y, z) of Figure 5 can be linked by the homogeneous transformation matrix written in the global reference system:
In Matrix (8), t is the welding time, is the angular rotation speed of the welding torch with respect to the Y axes, and and are geometrical parameters, representing the external tube diameter and welding width (whose magnitude is given in Figure 1), respectively.
3.5. Weld Pool Shape
All three models were validated by comparing the molten pool cross section between the real specimen and simulation results. The reference melting temperature of the material is .
Figure 7 and Figure 8 show the thermal solutions derived from the implemented Goldak and heat flux models, respectively. In particular, Figure 7a and Figure 8a represent the thermal gradient in the weld seam surroundings, in which the melted areas are coloured in grey. It is worth noting that, in the case of CVHF of Figure 8a, the dashed line marks the division between the deactivated elements on the right and the molten area on the left. In addition, Figure 7b and Figure 8b are cross sections, in which the weld pool penetration is displayed. Comparing the sub-figures (b) and (c), it can be seen that both models approximate fairly well the real geometry of the weld seam.

Figure 7.
Goldak’s double-ellipsoid model: Overview of the thermal solution (a), finite-element (FE)-model cross section of the weld seam (b), real cross section of the weld seam (c).

Figure 8.
Heat flux model: Overview of the thermal solution (a), FE-model cross section of the weld seam (b), and real cross section of the weld seam (c).
On the other hand, it could be expected that the CIT method, being an extremely simplified model, would not provide an accurate description of the the temperature distribution. For instance, a comparison between the CIT method and the weld pool geometry is shown in Figure 9. Clearly, the very physics of the CIT model make it impossible to correctly represent the weld pool geometry at the element activation time illustrated in Figure 4. Nonetheless, the geometry of the melted zone is well represented after a few tenths of a second after the element activation, Figure 9b. As for the GHSD and CVHF, and even for the CIT method, the characteristic temperature distribution, the stretched-left shape of the melt area, could be detected. This typical shape is due to the different cooling rates caused by the different pipe and plate thicknesses. This effect is also highlighted in the micrography of Figure 9c. In addition, the same distinction made for CVHF between the molten zone and deactivated elements is also shown here by a dashed line.

Figure 9.
Constant initial temperature: Overview of the thermal solution (a), FE-model cross section of the weld seam (b), and real cross section of the weld seam (c).
The comparison between the methods reasonably shows that the CIT method can be meaningfully applied even for a subsequent mechanical simulation.
3.6. Experimental Set-Up
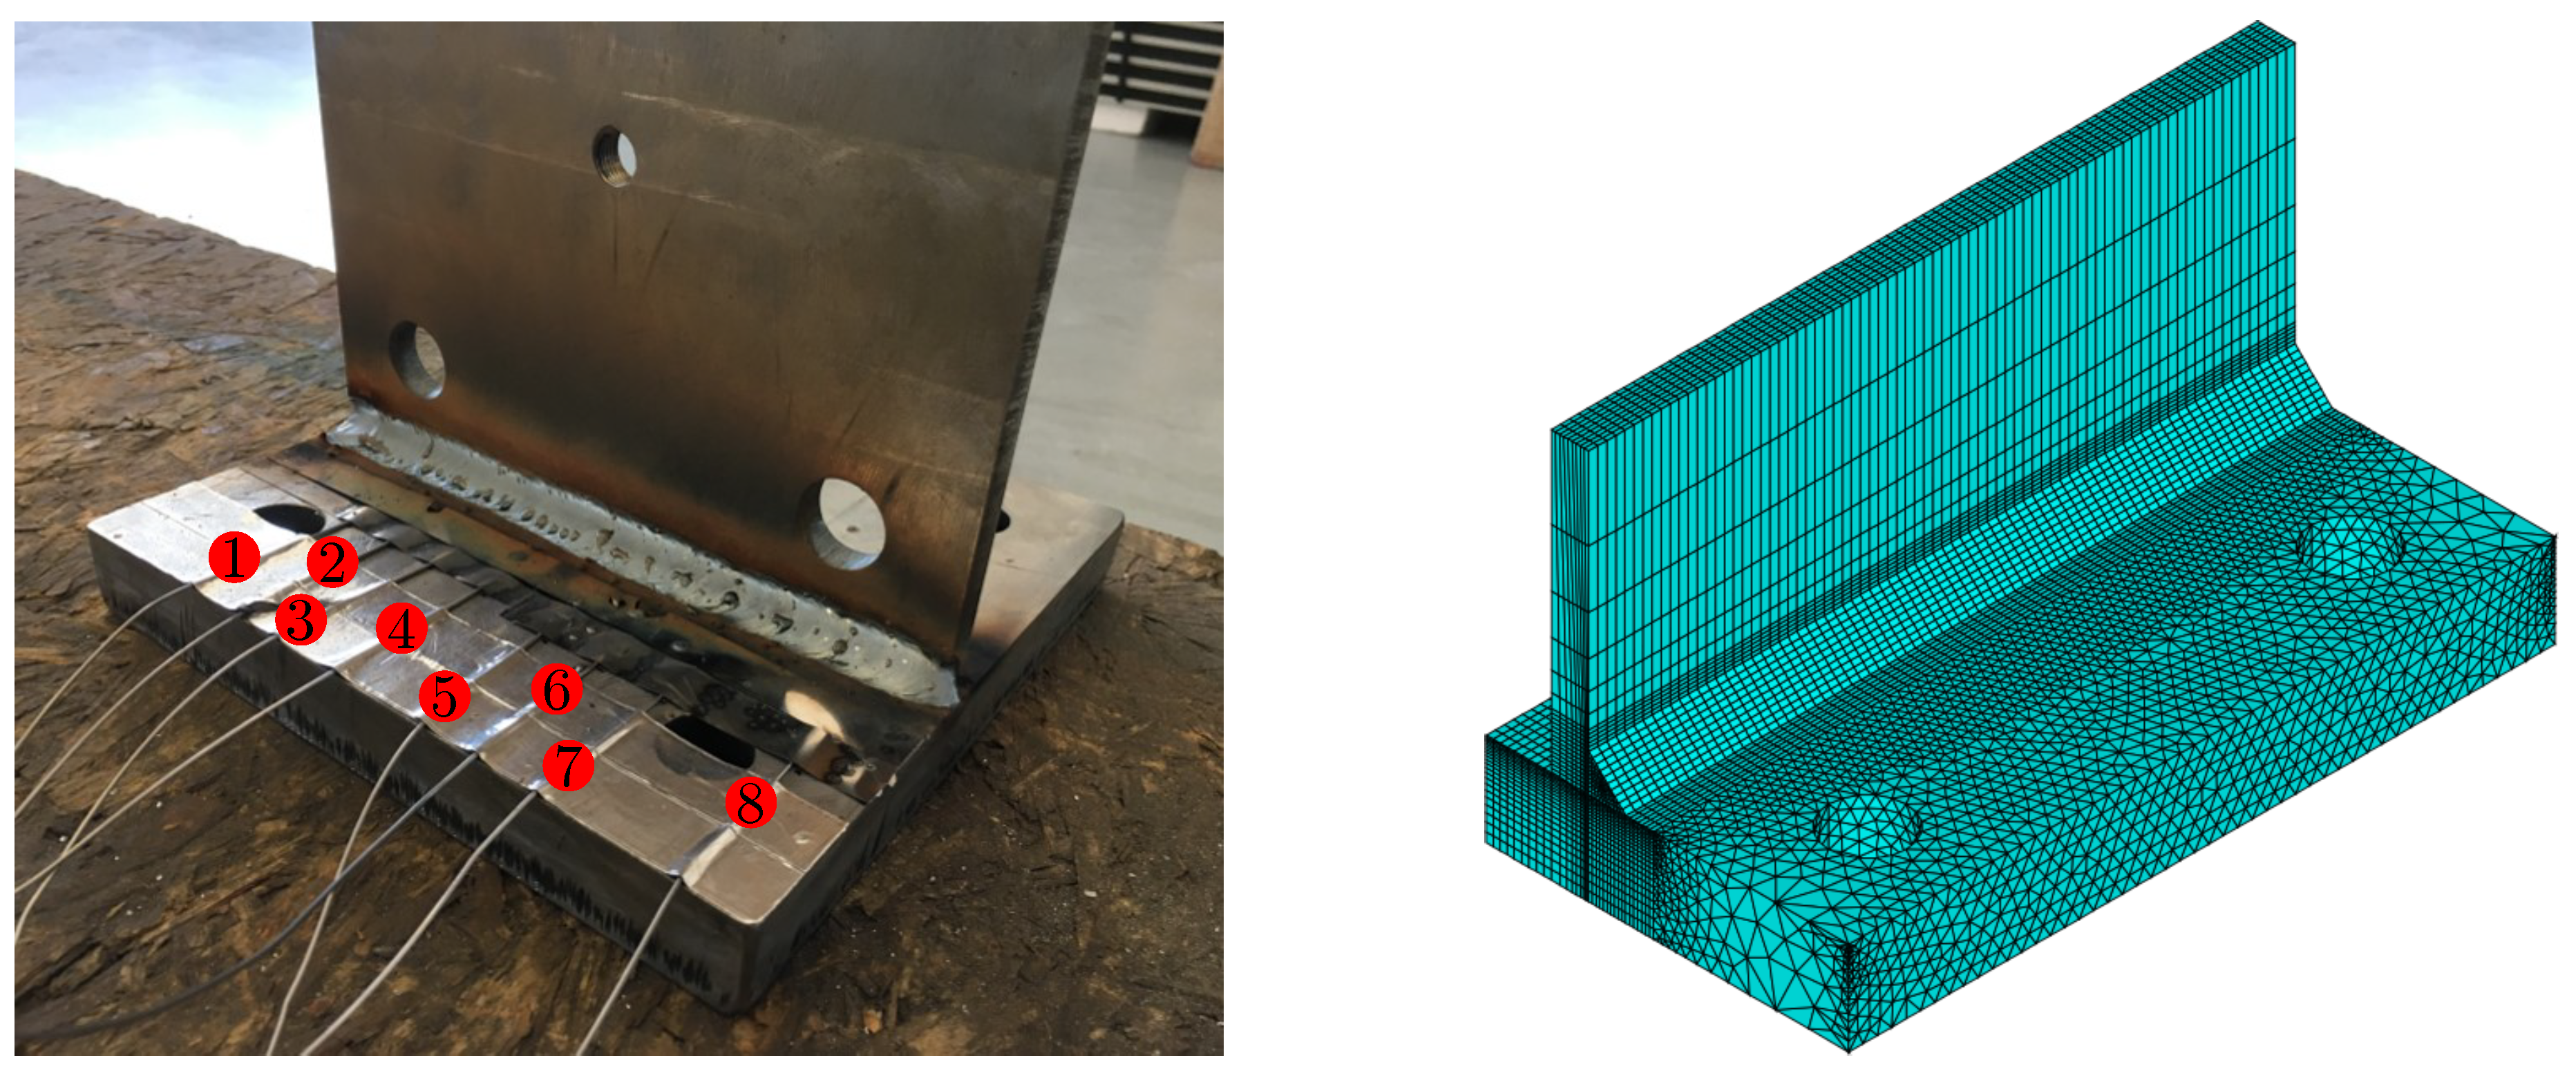
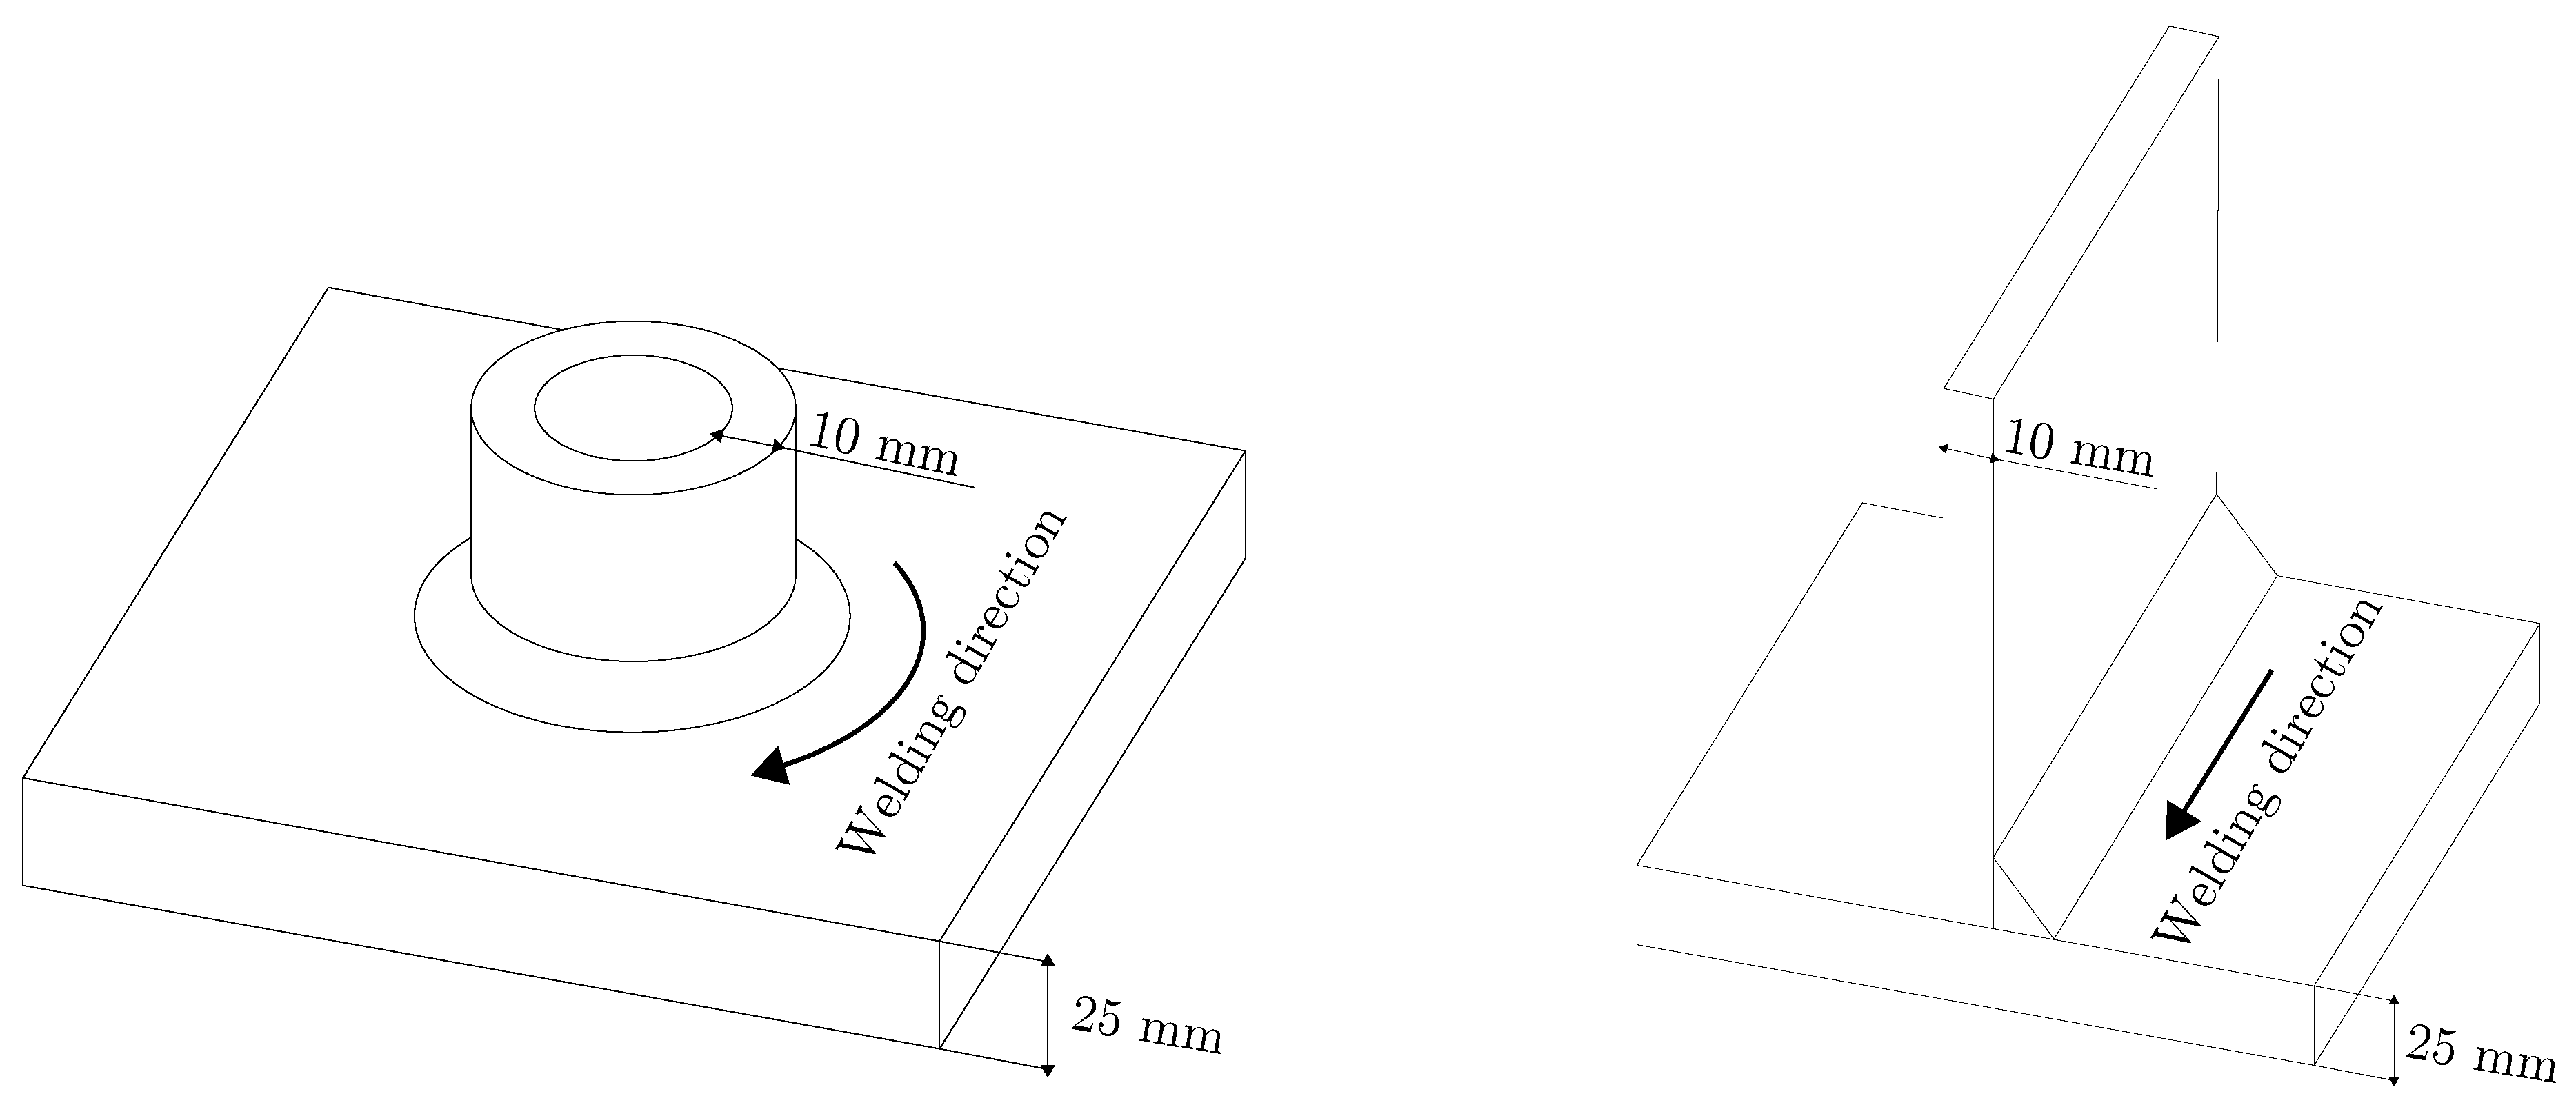
The results of the numerical simulations were discussed and verified through experimental activity. Temperature over time was measured in different points of the plate surface by thermocouples, as shown in Figure 10. For practical experimental reasons, a simplified specimen geometry was selected instead of a real one, in order to measure the temperature over time distribution. The simplified geometry was required because the welding process of the original specimen does not allow for easy positioning of the thermocouples, as already described in Section 2. In this case, the welding process took place by keeping the sample still, with the subsequent movement of the welding torch. As in the case of the real test specimen, the welding process was also steady, except for a starting and for an ending transient phase. The experimental procedure was set up in order to use the same weld speed as in the real tube-to-plate specimen. The specimen geometry shown in Figure 11 was selected, in which the main parameters that influence the thermal behavior, i.e., material, plates and wall thickness, were kept the same as in the pipe-to-plate specimen object of this study.
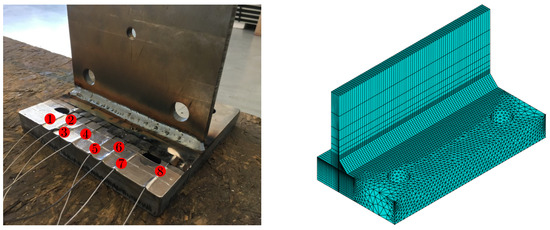
Figure 10.
Experimental set-up for temperature measurement (left) and FE-model (right) of the simplified specimen.
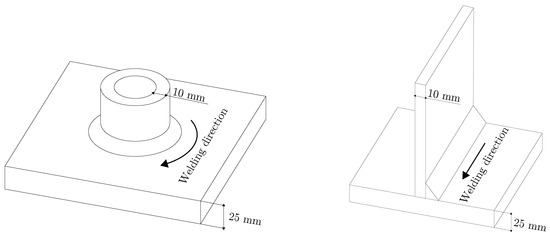
Figure 11.
Real specimen’s geometry (left), simplified specimen’s geometry (right).
Eight thermocouples of K type (Nickel/Chrome–Nickel/Aluminium) with a maximum detectable temperature of 1473 and a diameter of 1 were placed at different distances from the weld seam in order to compare the numerical and experimental results at different positions, as summarized in Table 3. The temperature readings were taken simultaneously through a data logger Pico TC-08 (Pico Technology, Cambridgeshire, UK), operating at a frequency of 1 , with cold junction compensation.

Table 3.
Thermocouples’ distance from the welding seam: d = distance, = thermocouple’s number.
4. Results and Discussion
4.1. Sensitivity Analysis
A sensitivity analysis was performed to evaluate the influence of different input parameters on the temperature distribution over time. As an example, the temperature–time history on the plate surface, the point at 3 from the weld toe is discussed in the following. A different study was carried out on the parameters described below:
- Thermal Conductivity, k (W m−1 K−1);
- Heat Capacity, c (J kg−1 K−1);
- Convection, h (W m−2 K−1);
- Emissivity, .
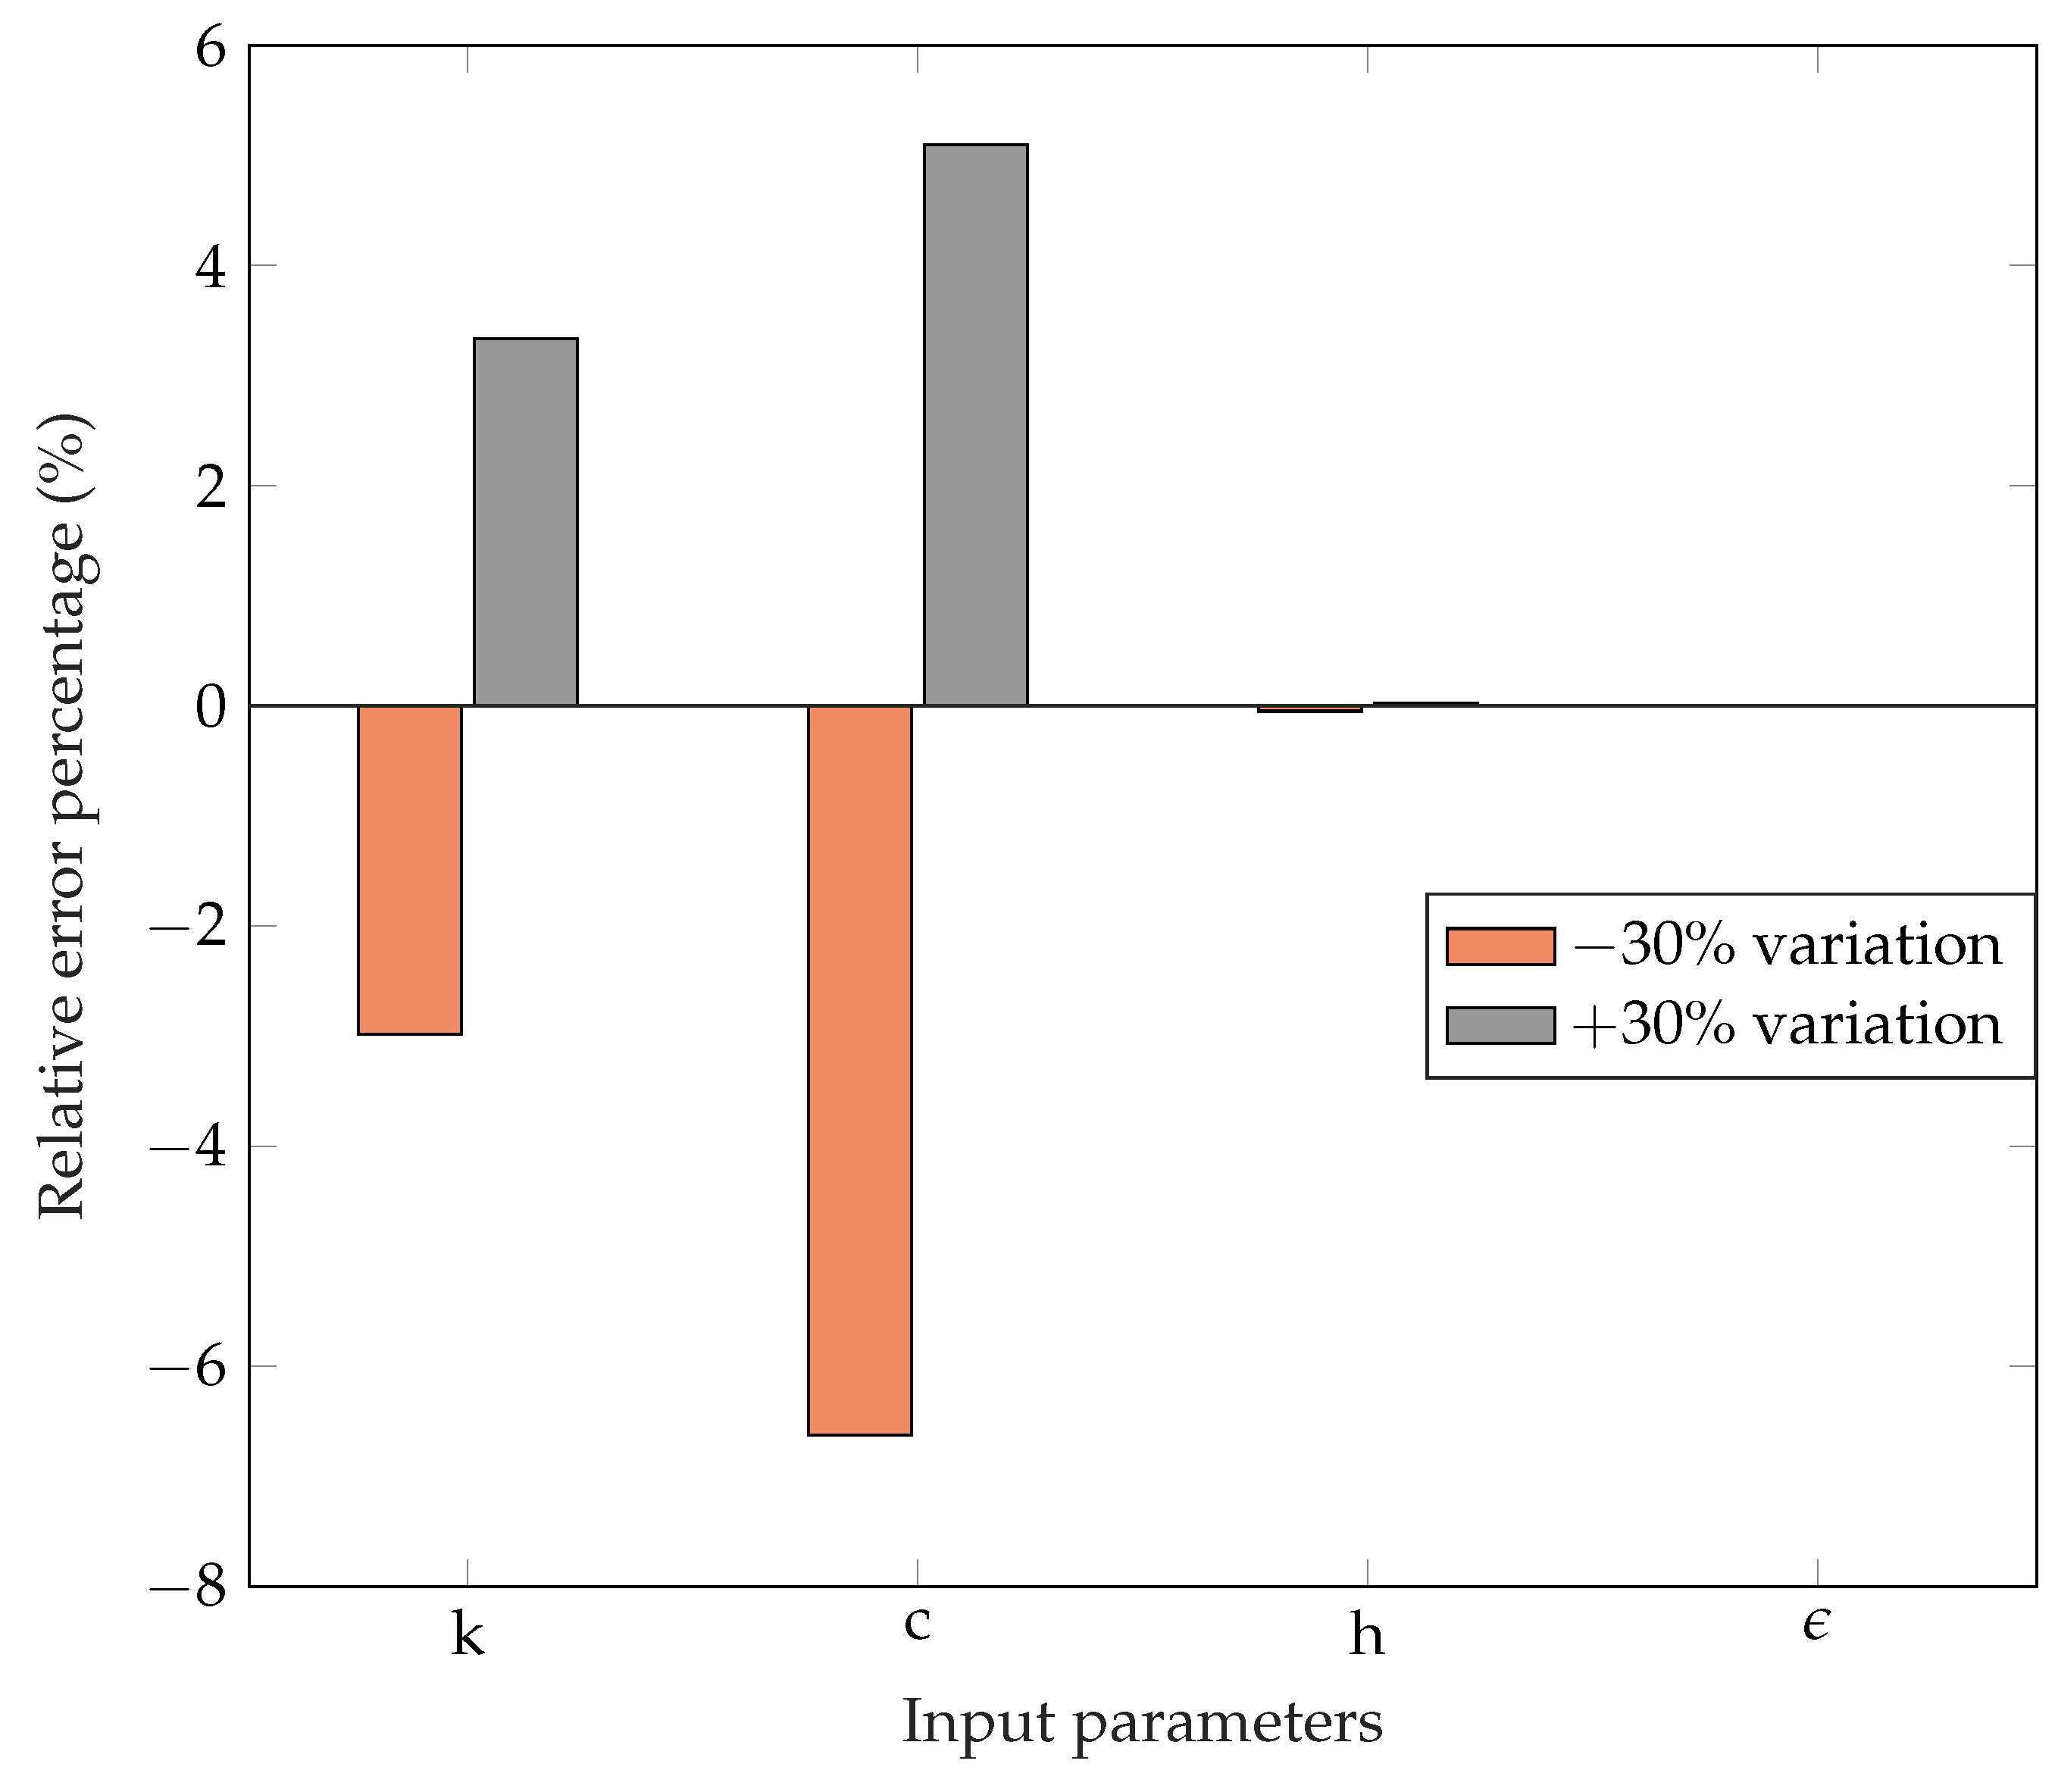
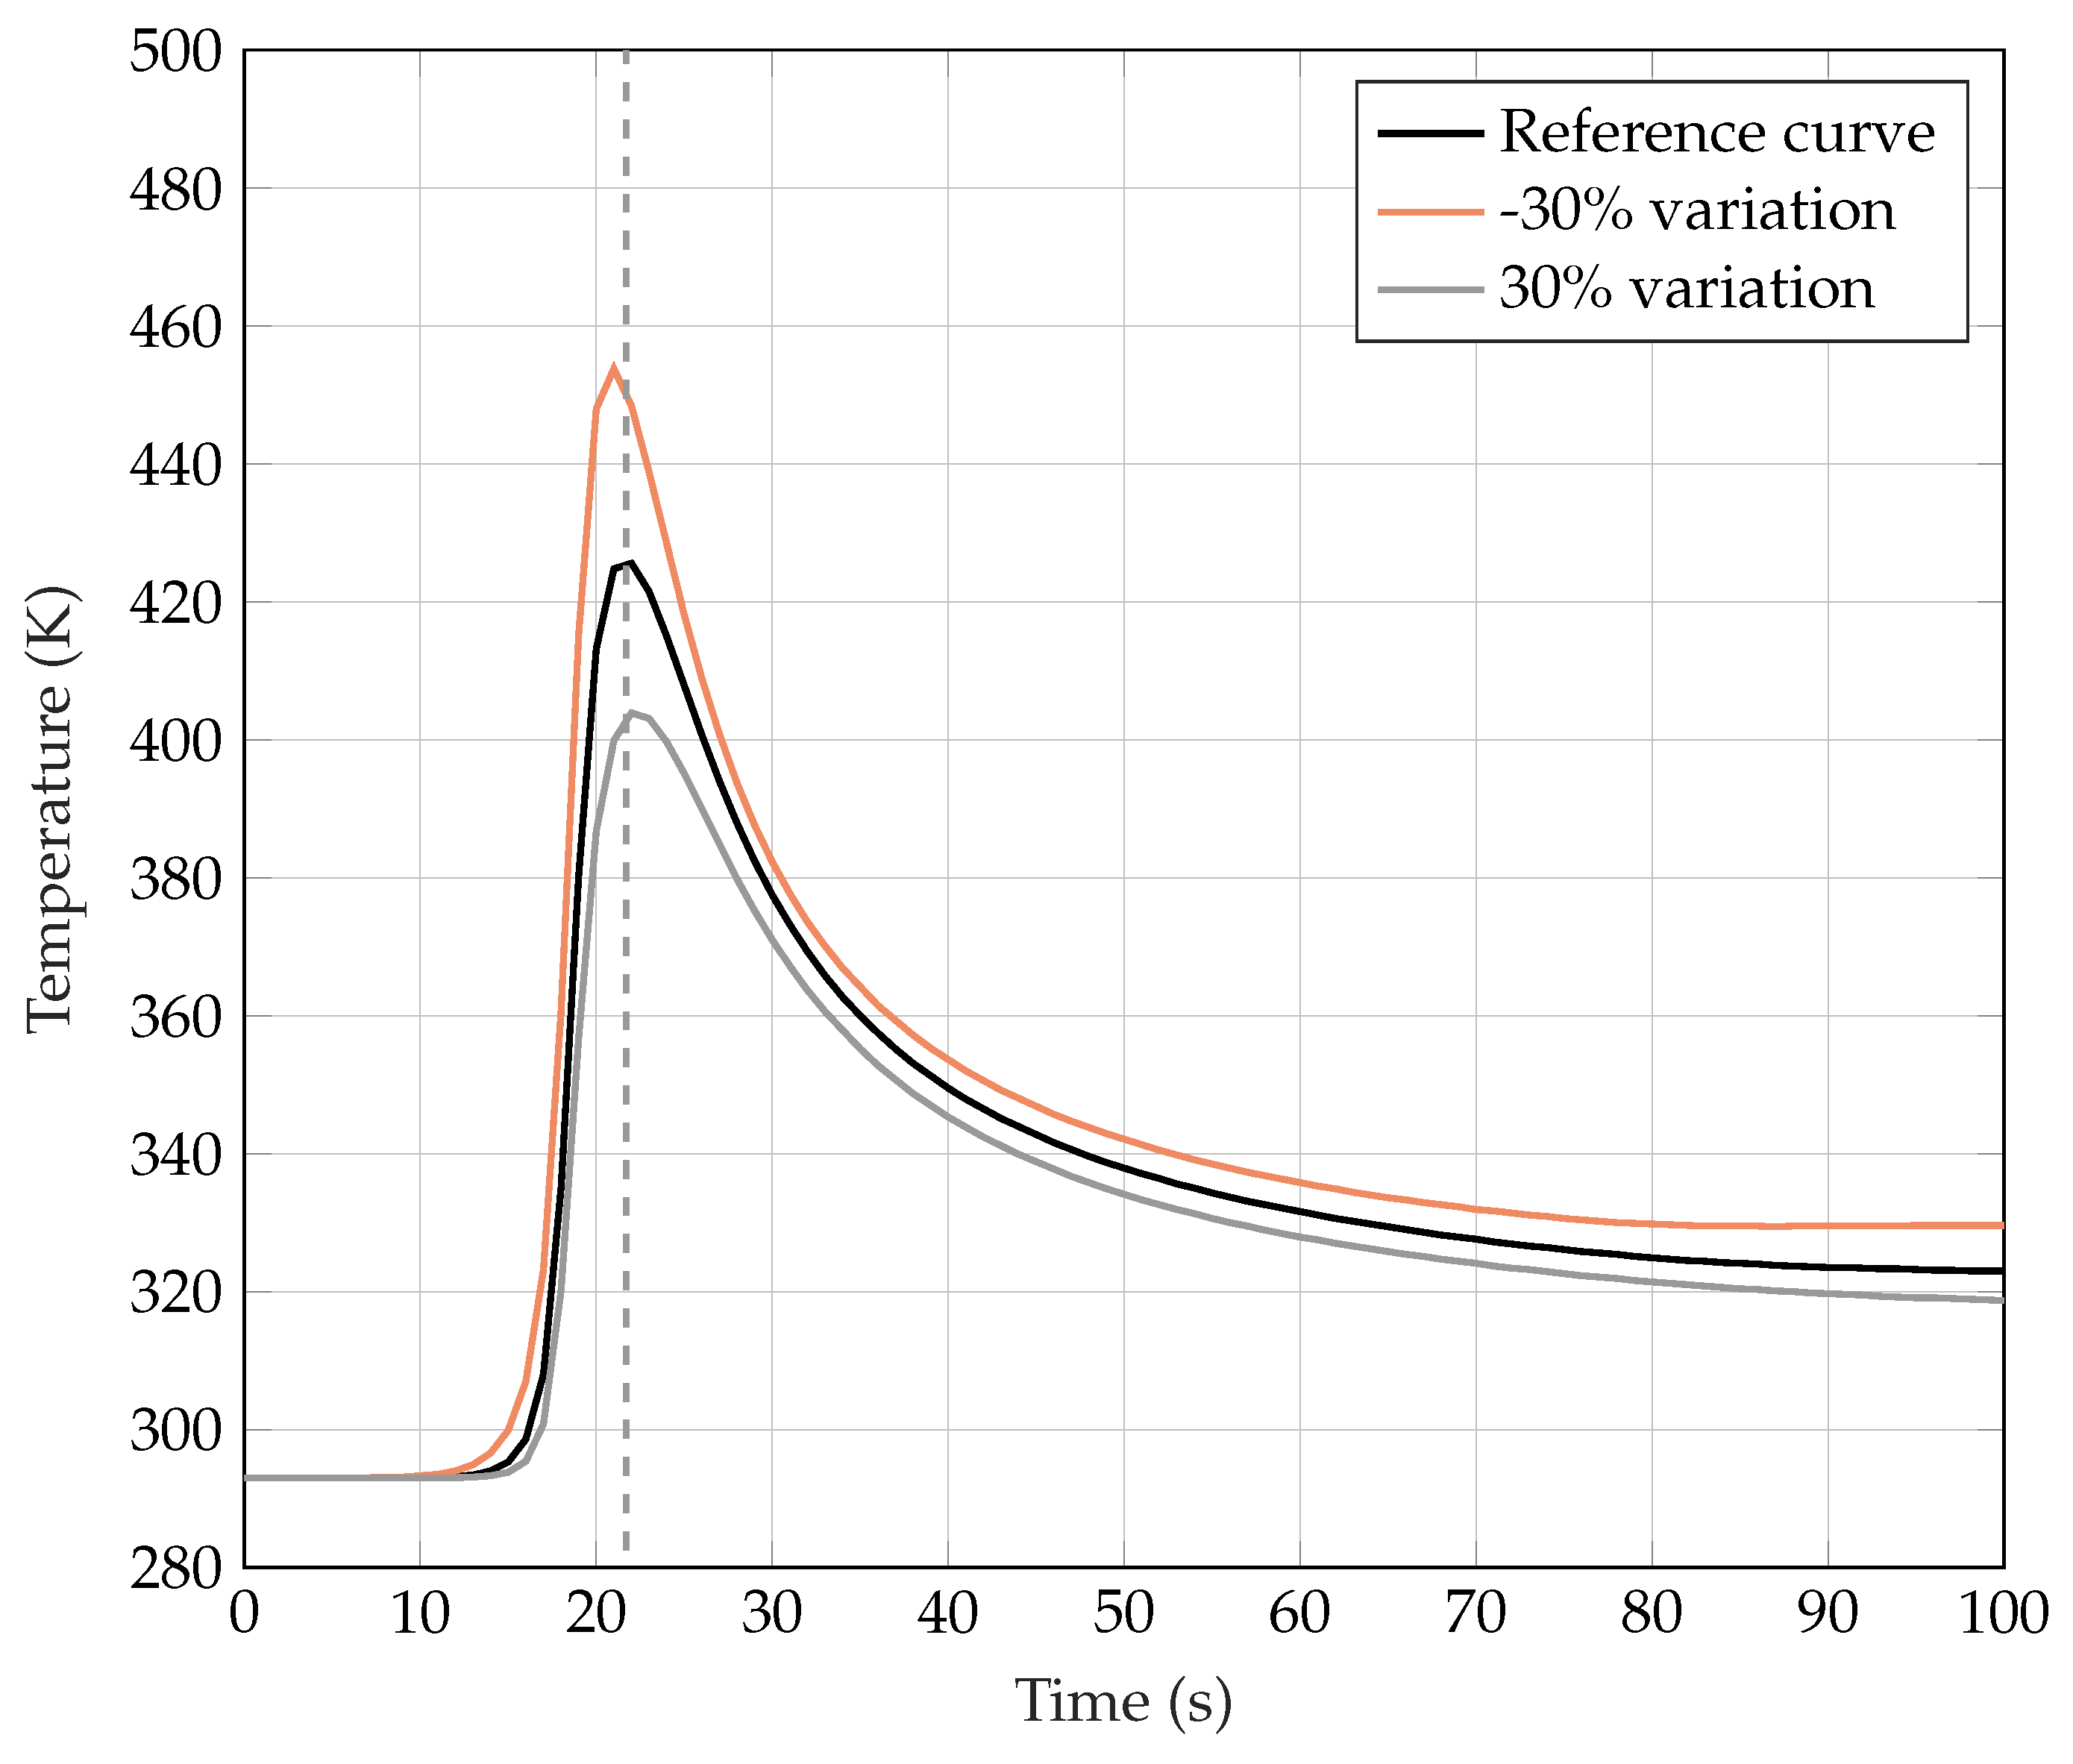
Concerning thermal conductivity, heat capacity, convection and emissivity, the results are shown in Figure 12. For these quantities, a variation of 30% had been taken as a reference since it turned out to be the maximum difference found by comparing different literature sources: [20,21,22].
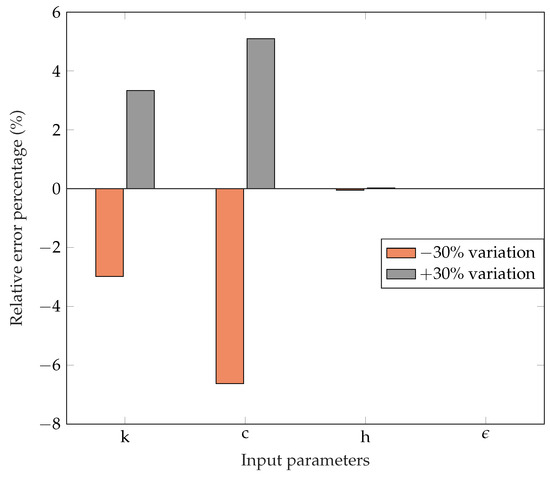
Figure 12.
Relative error percentage with respect to the maximum temperature of the reference curve.
The maximum temperature measured in the cooling curve of Figure 13 was chosen as the benchmark to assess the influence of the parameter under consideration. The error was defined as shown in Equation (13):
where is the maximum temperature calculated for the reference curve, while is the maximum temperature calculated on the input variate curve. Approximatively, the maximum temperatures are the ones highlighted from the dashed line in Figure 13; the image reports an example of how the cooling behavior changes with a variation in a generic input parameter. As can be seen from Figure 12, only thermal conductivity and thermal capacity influence the results. A variation of can produce an output variation on the temperature of up to about , while the influence of the other parameters is negligible in this range.
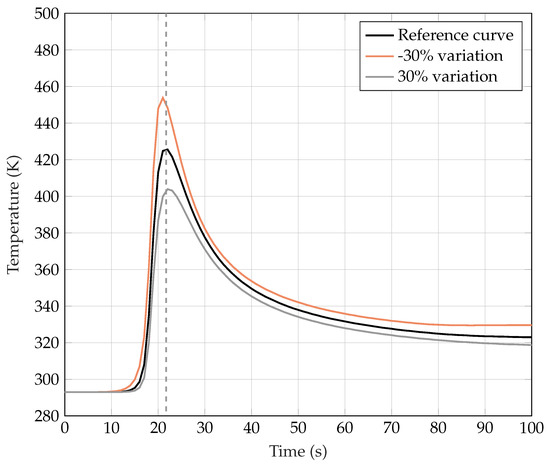
Figure 13.
Behavior of the curve Temperature vs. Time for a generic modification of the input parameter.
4.2. Results
Numerical Results
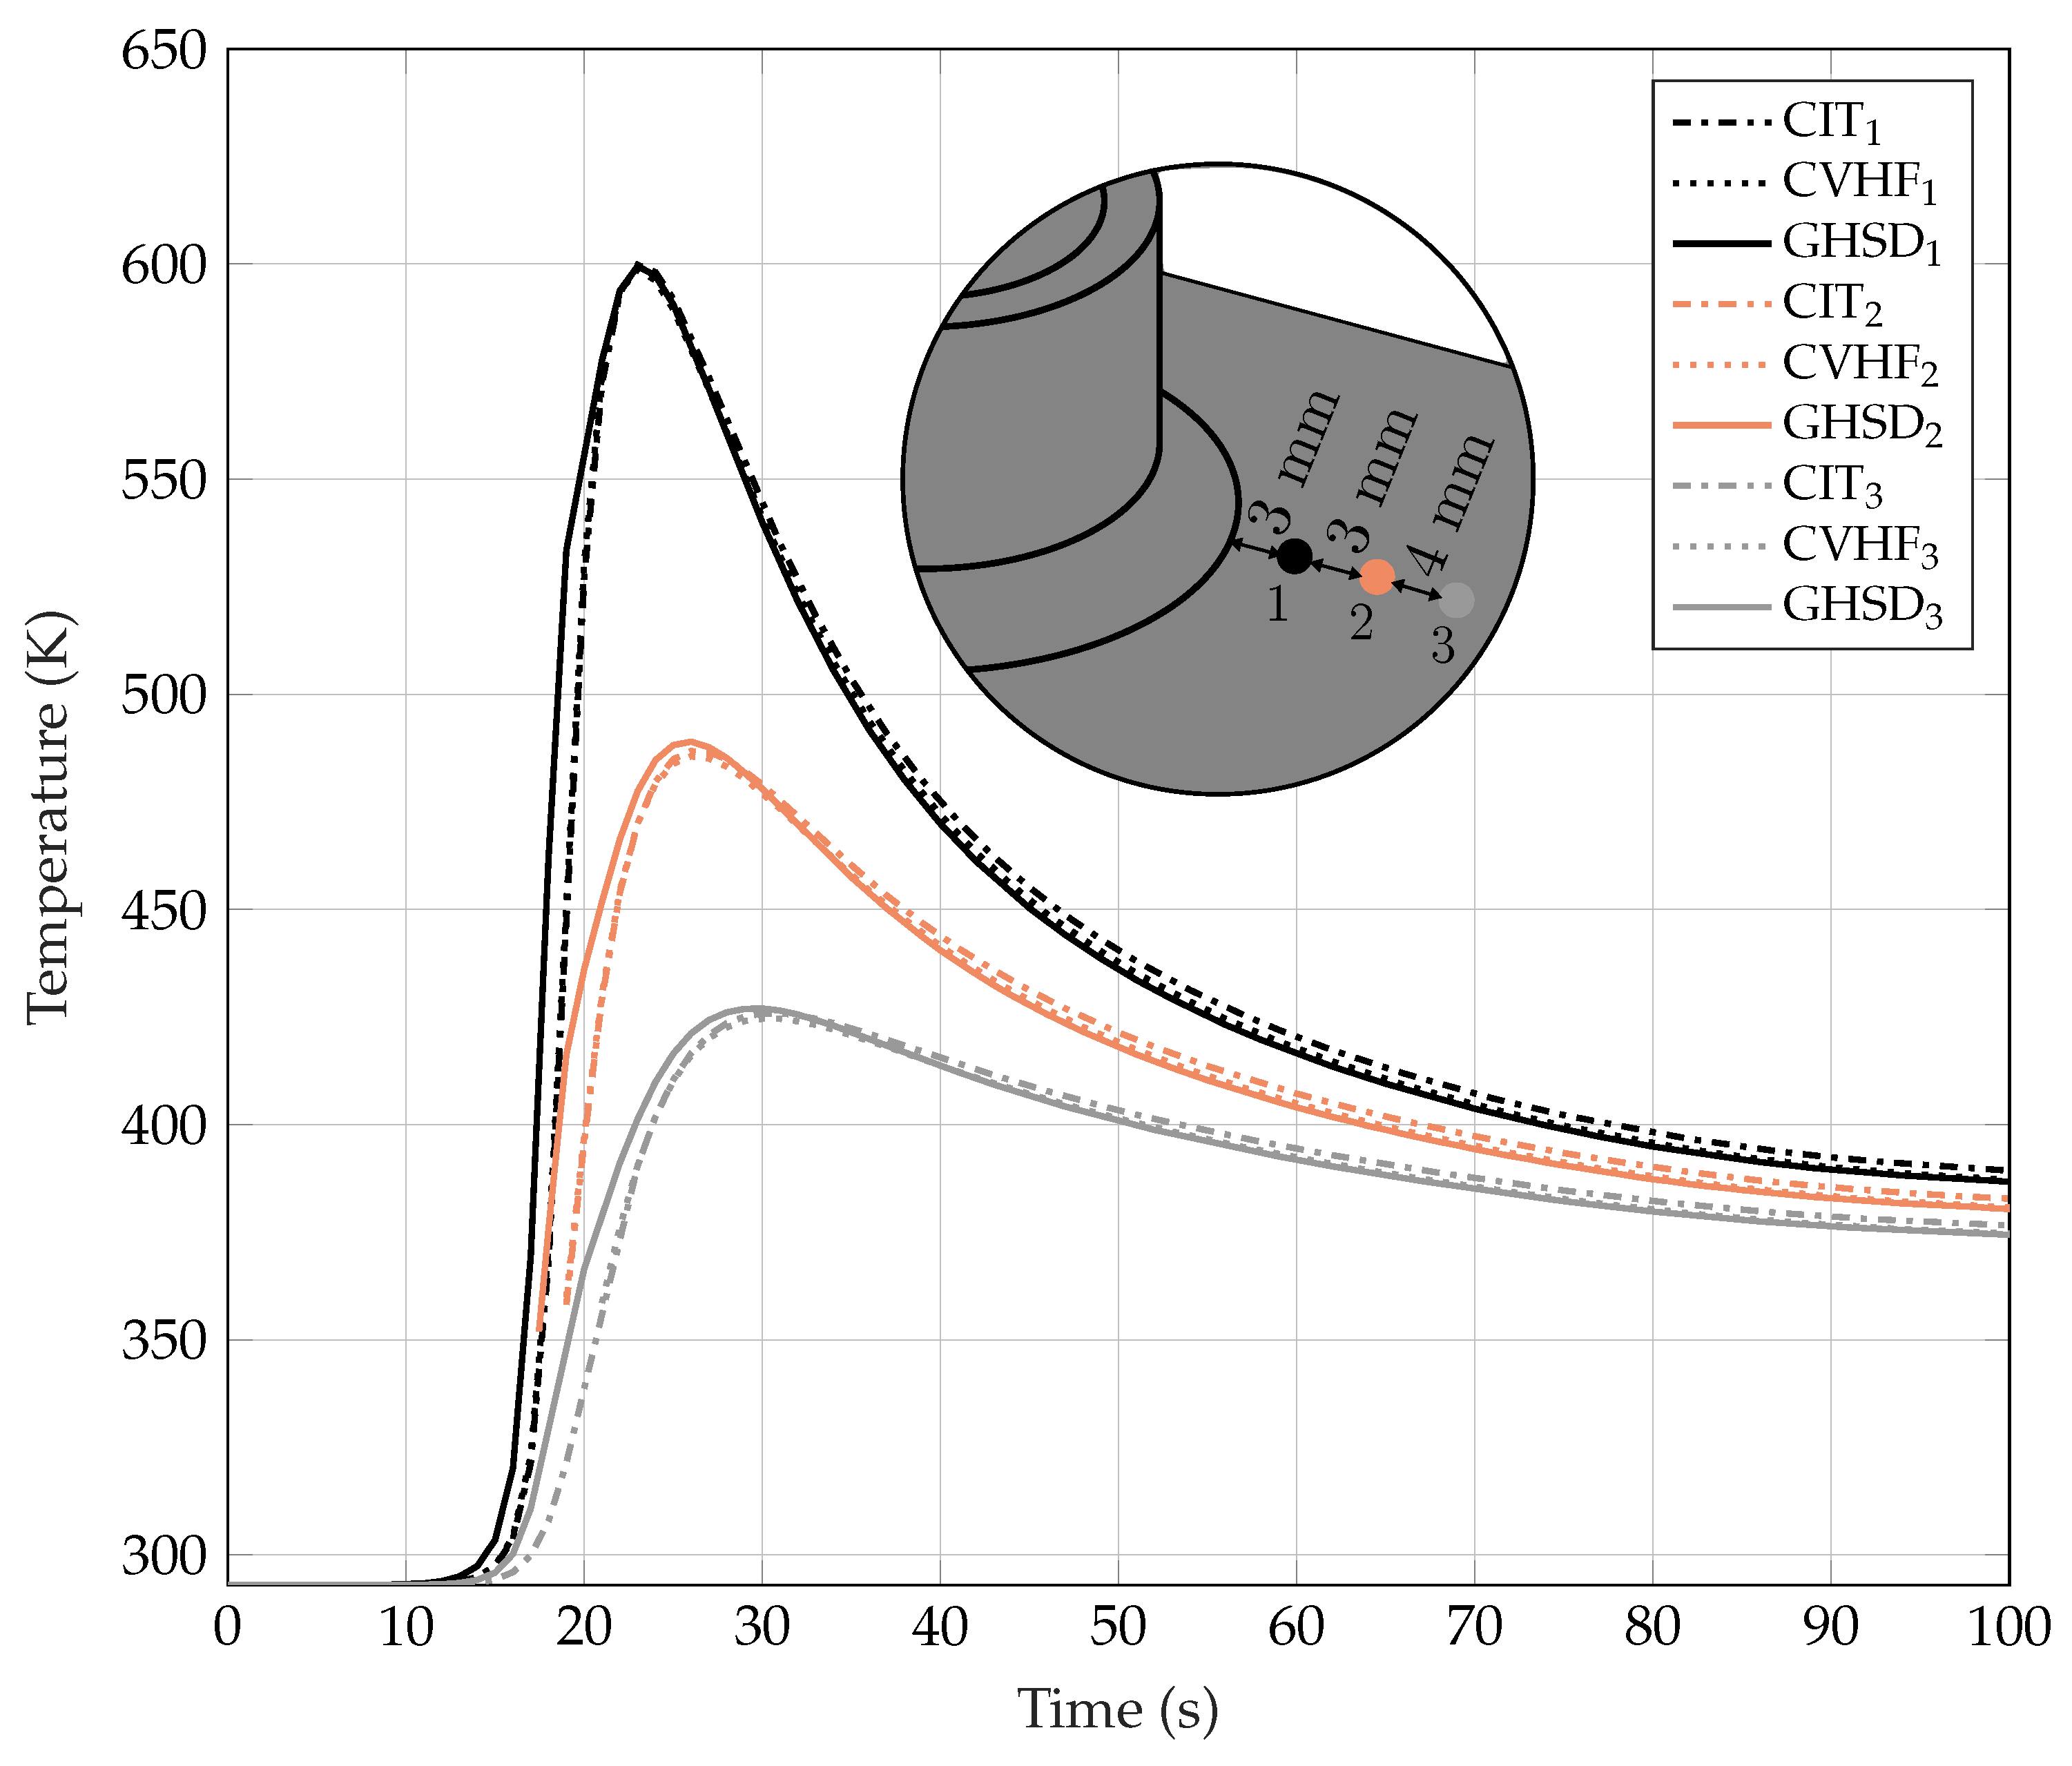
First of all, a comparison was done between the three numerical models, as explained in Section 3. The comparison is shown in Figure 14; the Goldak’s double-ellipsoid result (continuous lines in Figure 14) was taken as the reference curve, while the temperature over time was measured in three points on the surface of the plate.
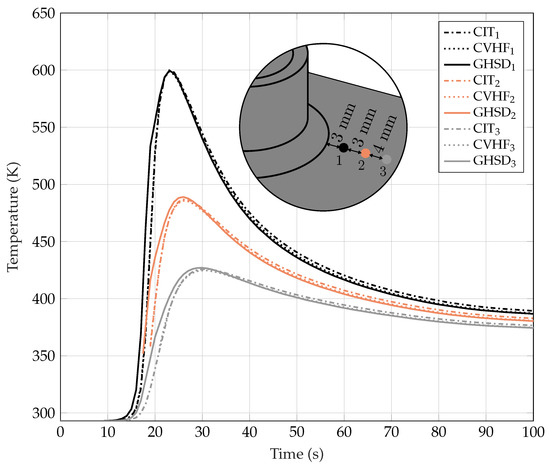
Figure 14.
Temperature vs. Time curve of the thermal models employed, specifically for three points on the surface of the plate.
The legend in Figure 14 refers to three points on the plate surface with the following distance from the weld toe: for the point 1, for the point 2, and for the point 3.
Starting from the Goldak’s numerical solution, the other methods were tuned in order to qualitatively have the same thermal behavior. The parameters that were changed were the initial temperature for the CIT and the parameter for the CVHF method. In particular, the setting parameters were varied in an attempt to reproduce the maximum temperature at point 1, and were obtained. Figure 14 shows that, near the weld seam, the same thermal behavior can be achieved with all the implemented methods. Some subtle difference can be observed inside the weld seam as already discussed in Section 3.5. For instance, with reference to the CIT method, it is assumed that the total heat input derives from the molten metal droplets, whereas other heat sources also play an important role (e.g., the electric arc of plasma has a temperature range from 3000 to 20,000 K, as reported in [32,33]); this leads to the slightly higher initial temperature that has to be set. Similar considerations apply to the CVHF, where only a few parameters were taken into account compared to GHSD. Obviously, it is very complicated to consider all the parameters that can influence the thermal behavior during welding; these numerical models can only take into account some of them. Another example is given by the diverse heat source distribution caused by a different shielding gas composition, as illustrated by [34].
4.3. Comparison with Experimental Temperature Measurements
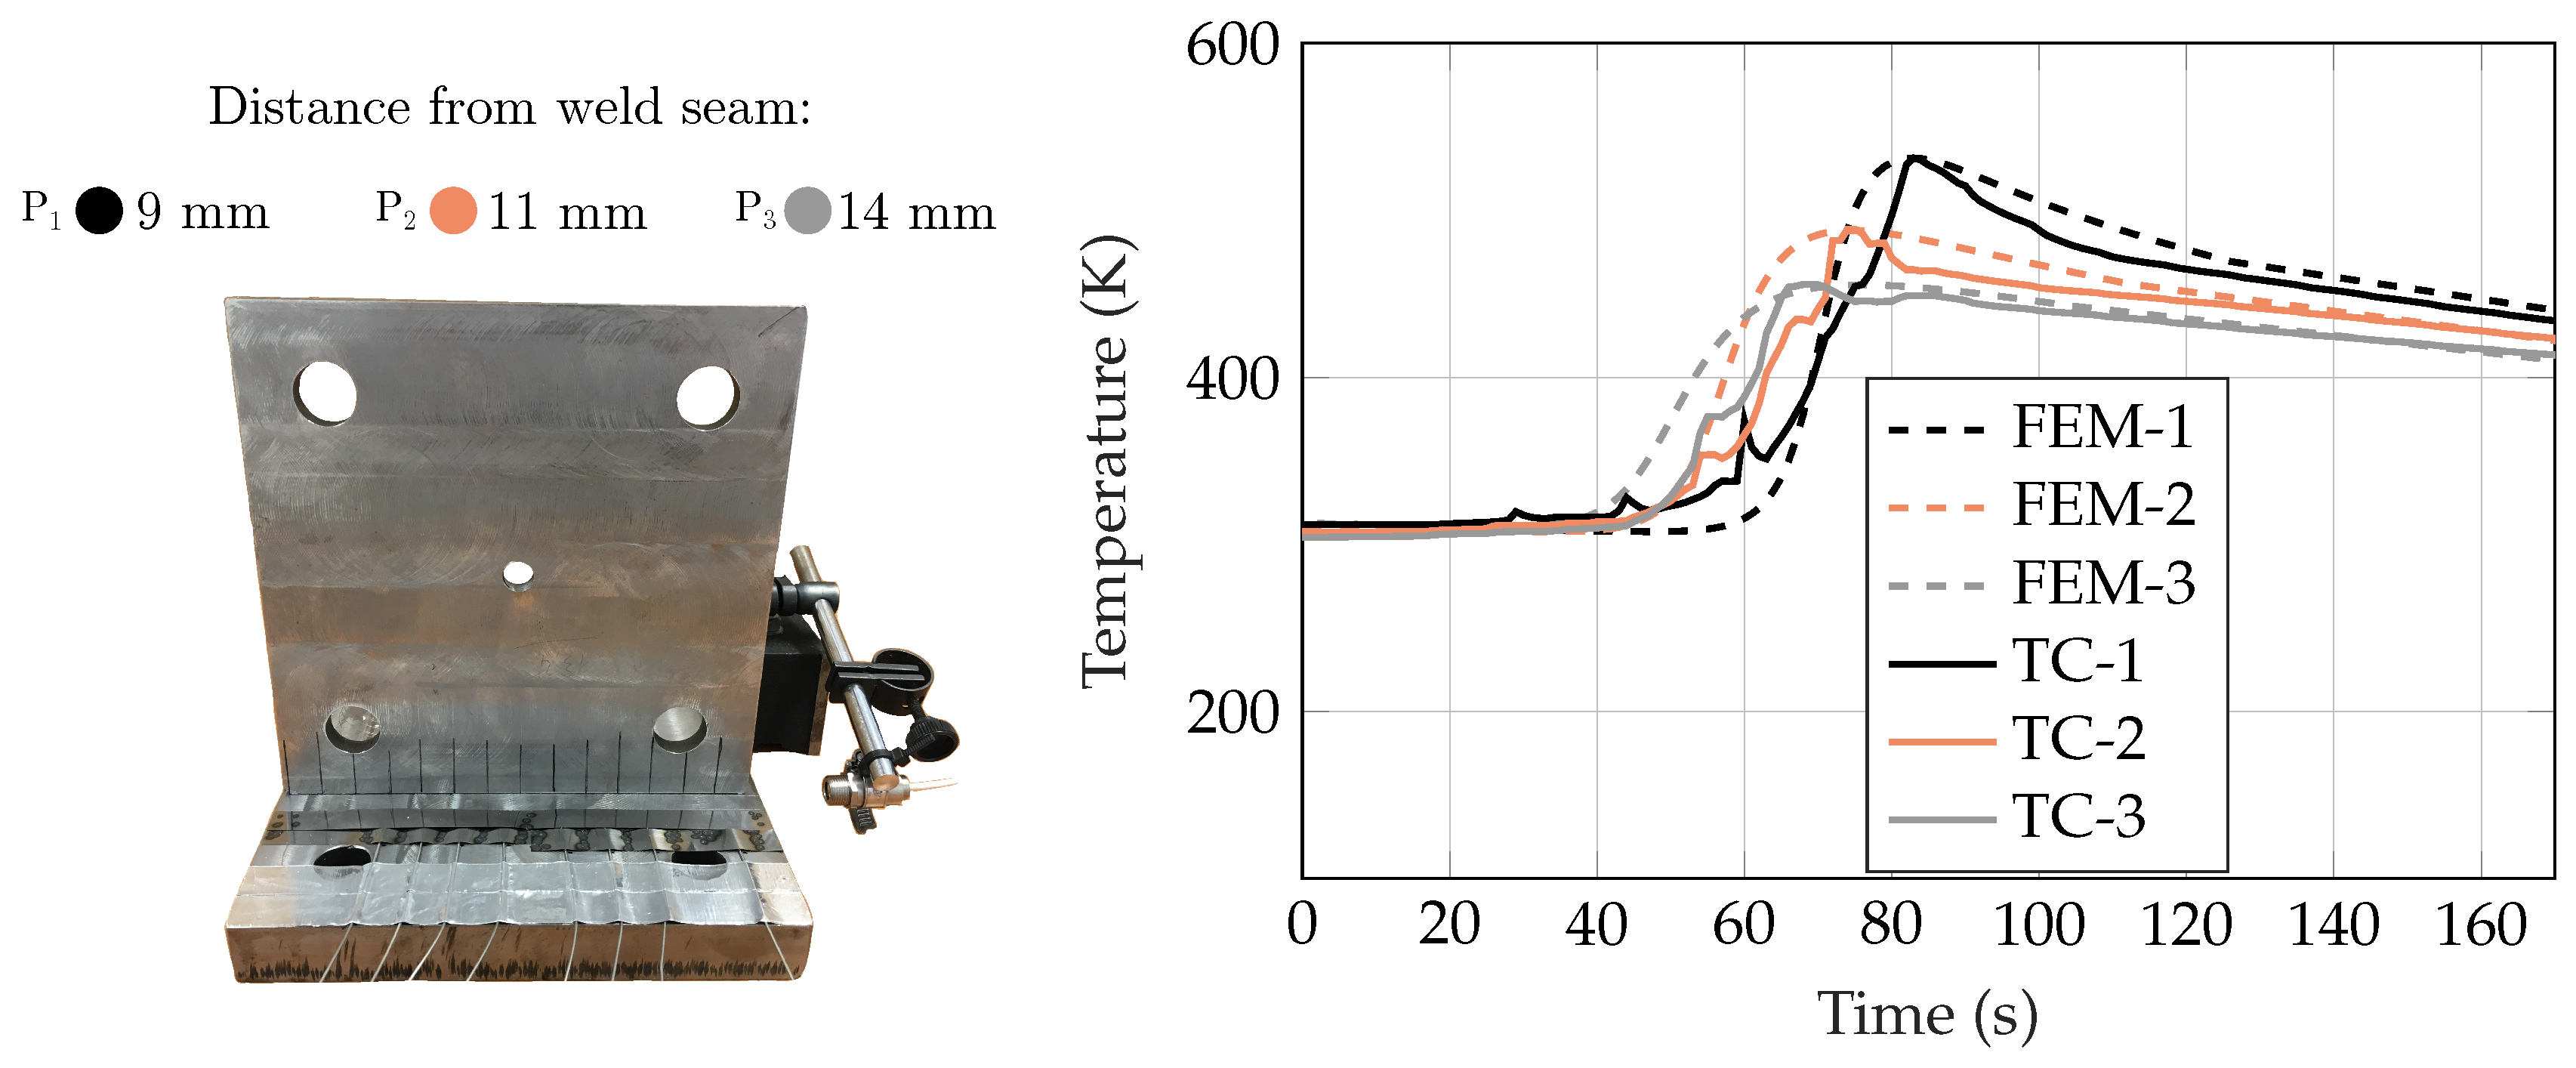
The CIT method was then used in an attempt to reproduce the experimental temperature measurements. The initial temperature was varied until a value of , while the number of elements to be activated was determined by the deposition velocity of the weld material. With reference to Figure 15, the calibration on the CIT method with respect to experimental measurements was performed at the point closest to the weld seam (i.e., point 1 at 9 mm). Figure 15 shows the experimental curves in a continuous line and those resulting from the simulation are shown as a dashed line.
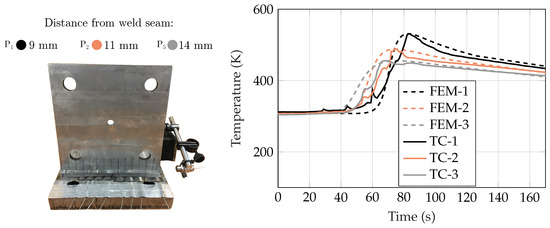
Figure 15.
Comparison between experimental and numerical results of temperature over time.
A fairly good agreement was observed between the experimental and simulated temperature; the observed maximum difference in temperature during the cooling phase is less than 50 . With reference to the heating-up phase, the measurements show the typical wave-form of manual welding; for this reason, greater temperature differences were sometimes obtained. However, the temperature gradient during the first phase was captured fairly well for all the curves.
5. Conclusions
In this study, the finite element method was employed to conduct a thermal numerical analysis for a welded T-joint. Three different methods for the simulation of thermal heat source were applied, i.e., constant initial temperature assigned to a given volume of elements, constant heat flux, and the Goldak’s double-ellipsoid model. The methods require a different number of parameters to be set for the analysis. First of all, a sensitivity analysis on several parameters showed that thermal conductivity and heat capacity have a noticeable effect, while the influence of the other parameters on the output is negligible. Thereafter, it was shown that even the most simple numerical model (CIT) can be used to reasonably reproduce the thermal history close to the weld; with a proper choice of the initial temperature, the results are very similar to those obtained by the most sophisticated Goldak’s double-ellipsoid model, whose accuracy has been discussed in different studies.
In general, the results show that a negligible discrepancy in the temperature history can be obtained using the different models if the governing parameters are properly set. Consequently, the CIT model was adopted as the main procedure to simulate the welding process.
The use of the CIT method reduces the number of parameters that have to be established, leading to a time-saving thermal study that describes a fairly similar thermal behavior as compared to more complex methods. It must be noted that the initial temperature described in this paper, as well as the other methods, only applies for the specific case analyzed in this work; different setting-parameters have to be determined for different welded joints.
Even if this study focused on the thermal solution of the welding process, it can be argued that the method can also be applied for the simulation of residual stresses.
Author Contributions
A.C. participated in the design of the experiment, performed the numerical analyses, carried out the experimental activity and wrote the paper; F.F. designed the experiment, supervised the numerical analysis and revised the paper; L.B. supervised the experimental and numerical analysis and revised the paper.
Conflicts of Interest
The authors declare no conflict of interest.
References
- Frija, M.; Hassine, T.; Fathallah, R.; Bouraoui, C.; Dogui, A. Finite element modelling of shot peening process: Prediction of the compressive residual stresses, the plastic deformations and the surface integrity. Mater. Sci. Eng. A 2006, 426, 173–180. [Google Scholar] [CrossRef]
- Macdonald, K.A. (Ed.) Fracture and Fatigue of Welded Joints and Structures; Woodhead Publishing: Sawston, Cambridge, UK, 2011; ISBN 9781845695132. [Google Scholar]
- Li, C.; Liu, Z.; Fang, X.; Guo, Y. Residual Stress in Metal Additive Manufacturing. Procedia CIRP 2018, 71, 348–353. [Google Scholar] [CrossRef]
- Bartolozzi, R.; Frendo, F. Stiffness and strength aspects in the design of automotive coil springs for McPherson front suspensions: A case study. Proc. Inst. Mech. Eng. Part D J. Automob. Eng. 2011, 225, 1377–1391. [Google Scholar] [CrossRef]
- Elber, W. The Significance of Fatigue Crack Closure. In Damage Tolerance in Aircraft Structures; ASTM International: Philadelphia, PA, USA, 1971; pp. 230–243. [Google Scholar] [CrossRef]
- Deng, D. FEM prediction of welding residual stress and distortion in carbon steel considering phase transformation effects. Mater. Des. 2009, 30, 359–366. [Google Scholar] [CrossRef]
- Kik, T.; Górka, J. Numerical Simulations of Laser and Hybrid S700MC T-Joint Welding. Materials 2019, 12, 516. [Google Scholar] [CrossRef] [PubMed]
- Asserin, O.; Loredo, A.; Petelet, M.; Iooss, B. Global sensitivity analysis in welding simulations – what are the material data you really need? Finite Elem. Anal. Des. 2011, 47, 1004–1016. [Google Scholar] [CrossRef]
- Sajek, A. Application of FEM simulation method in area of the dynamics of cooling AHSS steel with a complex hybrid welding process. Weld. World 2019, 63, 1065–1073. [Google Scholar] [CrossRef]
- Gery, D.; Long, H.; Maropoulos, P. Effects of welding speed, energy input and heat source distribution on temperature variations in butt joint welding. J. Mater. Process. Technol. 2005, 167, 393–401. [Google Scholar] [CrossRef]
- Goldak, J.; Chakravarti, A.; Bibby, M. A new finite element model for welding heat sources. Metall. Trans. B 1984, 15, 299–305. [Google Scholar] [CrossRef]
- Moravec, J.; Kik, T.; Novakova, I. Application of numerical simulations on X10CRWMOVNB9-2 steel multilayer welding. MM Sci. J. 2016, 2016, 1190–1193. [Google Scholar] [CrossRef]
- Zubairuddin, M.; Albert, S.K.; Mahadevan, S.; Vasudevan, M.; Chaudhari, V.; Suri, V.K. Experimental and finite element analysis of residual stress and distortion in GTA welding of modified 9Cr-1Mo steel. J. Mech. Sci. Technol. 2014, 28, 5095–5105. [Google Scholar] [CrossRef]
- Flint, T.; Francis, J.; Smith, M.; Balakrishnan, J. Extension of the double-ellipsoidal heat source model to narrow-groove and keyhole weld configurations. J. Mater. Process. Technol. 2017, 246, 123–135. [Google Scholar] [CrossRef]
- Cho, J.; Lee, B.; Moon, Y.; Tyne, C.V. Investigation of residual stress and post weld heat treatment of multi-pass welds by finite element method and experiments. J. Mater. Process. Technol. 2004, 155–156, 1690–1695. [Google Scholar] [CrossRef]
- Bhatti, A.A.; Barsoum, Z.; Murakawa, H.; Barsoum, I. Influence of thermo-mechanical material properties of different steel grades on welding residual stresses and angular distortion. Mater. Des. (1980–2015) 2015, 65, 878–889. [Google Scholar] [CrossRef]
- Frendo, F.; Bertini, L. Fatigue resistance of pipe-to-plate welded joint under in-phase and out-of-phase combined bending and torsion. Int. J. Fatigue 2015, 79, 46–53. [Google Scholar] [CrossRef]
- Bertini, L.; Cera, A.; Frendo, F. Experimental investigation of the fatigue resistance of pipe-to-plate welded connections under bending, torsion and mixed mode loading. Int. J. Fatigue 2014, 68, 178–185. [Google Scholar] [CrossRef]
- Bertini, L.; Frendo, F.; Marulo, G. Effects of plate stiffness on the fatigue resistance and failure location of pipe-to-plate welded joints under bending. Int. J. Fatigue 2016, 90, 78–86. [Google Scholar] [CrossRef]
- Zhu, J.; Khurshid, M.; Barsoum, Z. Accuracy of computational welding mechanics methods for estimation of angular distortion and residual stresses. Weld. World 2019. [Google Scholar] [CrossRef]
- Teng, T.L.; Chang, P.H.; Tseng, W.C. Effect of welding sequences on residual stresses. Comput. Struct. 2003, 81, 273–286. [Google Scholar] [CrossRef]
- Technical Office for Utilization of Steel. Data on Some Currently Used Steels (Données Physiques sur Quelques Aciers D’utilisation Courante); OTUA: Neuilly, France, 1975. [Google Scholar]
- Guen, E.L.; Carin, M.; Fabbro, R.; Coste, F.; Masson, P.L. 3D heat transfer model of hybrid laser Nd:Yag-MAG welding of S355 steel and experimental validation. Int. J. Heat Mass Transf. 2011, 54, 1313–1322. [Google Scholar] [CrossRef]
- Barsoum, Z.; Lundbäck, A. Simplified FE welding simulation of fillet welds—3D effects on the formation residual stresses. Eng. Fail. Anal. 2009, 16, 2281–2289. [Google Scholar] [CrossRef]
- Wikander, L.; Karlsson, L.; Nasstrom, M.; Webster, P. Finite element simulation and measurement of welding residual stresses. Model. Simul. Mater. Sci. Eng. 1994, 2, 845–864. [Google Scholar] [CrossRef]
- Frank, P.; Incropera, D.P.D. Introduction to Heat Transfer; John Wiley & Sons: Hoboken, NJ, USA, 1986. [Google Scholar]
- Parkitny, R.; Winczek, J. Analytical solution of temporary temperature field in half-infinite body caused by moving tilted volumetric heat source. Int. J. Heat Mass Transf. 2013, 60, 469–479. [Google Scholar] [CrossRef]
- Bayock, F.N.; Kah, P.; Layus, P.; Karkhin, V. Numerical and Experimental Investigation of the Heat Input Effect on the Mechanical Properties and Microstructure of Dissimilar Weld Joints of 690-MPa QT and TMCP Steel. Metals 2019, 9, 355. [Google Scholar] [CrossRef]
- Winczek, J.; Gawronska, E.; Gucwa, M.; Sczygiol, N. Theoretical and Experimental Investigation of Temperature and Phase Transformation During SAW Overlaying. Appl. Sci. 2019, 9, 1472. [Google Scholar] [CrossRef]
- Deng, D.; Murakawa, H.; Liang, W. Numerical and experimental investigations on welding residual stress in multi-pass butt-welded austenitic stainless steel pipe. Comput. Mater. Sci. 2008, 42, 234–244. [Google Scholar] [CrossRef]
- Sun, J.; Klassen, J.; Nitschke-Pagel, T.; Dilger, K. Effects of heat source geometric parameters and arc efficiency on welding temperature field, residual stress, and distortion in thin-plate full-penetration welds. Int. J. Adv. Manuf. Technol. 2018, 99, 497–515. [Google Scholar] [CrossRef]
- Cunat, P.J. The Welding of Stainless Steels. In Materials and Applications Series, Volume 3; Euro Inox: Luxembourg, 2007; ISBN 978-2-87997-180-3. [Google Scholar]
- Bowditch, W.A.B.K.E. Welding Technology Fundamentals; Goodheart-Willcox Co.: Tinley Park, IL, USA, 1997. [Google Scholar]
- Cai, X.; Dong, B.; Lin, S.; Murphy, A.B.; Fan, C.; Yang, C. Heat Source Characteristics of Ternary-Gas-Shielded Tandem Narrow-Gap GMAW. Materials 2019, 12, 1397. [Google Scholar] [CrossRef]
© 2019 by the authors. Licensee MDPI, Basel, Switzerland. This article is an open access article distributed under the terms and conditions of the Creative Commons Attribution (CC BY) license (http://creativecommons.org/licenses/by/4.0/).

