Effects of Welding Speed and Pulse Frequency on Surface Depression in Variable Polarity Gas Tungsten Arc Welding of Aluminum Alloy


Abstract
:1. Introduction
2. Materials and Methods
2.1. Experimental Procedure
2.2. Numerical Modelling of VP-GTAW Process
2.2.1. Physical Model Assumptions
2.2.2. Governing Equations
2.2.3. Boundary Conditions
2.2.4. Body Force
2.2.5. Numerical Model
3. Results and Discussion
3.1. Experimental Verification of the Numerical Model
3.2. Effect of Welding Speed
3.3. Effect of Pulse Frequency
4. Conclusions
Author Contributions
Funding
Conflicts of Interest
Nomenclature
| Ax, Ay, Az | fractional area opening to the flow |
| a, b, c | heat source parameters (mm) |
| Cp | specific heat capacity (J kg−1 K−1) |
| d | diameter of the channel of fused-coating head (mm) |
| D | diameter of the end-face of fused-coating head (mm) |
| F | volume of fluid function |
| I | arc current (A) |
| k | thermal conductivity of alloy (W m−1 K−1) |
| L | thickness of workpiece (mm) |
| h | gap between the fused-coating head and workpiece (mm) |
| hA | heat transfer coefficient between the liquid metal and workpiece |
| hsl | latent heat of fusion (J kg−1) |
| Parc | arc pressure (N/m2) |
| q | volumetric heat density of weld pool (w/m2) |
| Rc | radius of the surface curvature (mm) |
| rShear | arc drag force distribution parameter (mm) |
| T | temperature (K) |
| Tl | liquidus temperature (K) |
| Ts | solidus temperature (K) |
| Tev | vaporization temperature (K) |
| T∞ | ambient temperature (K) |
| u | velocity in x-direction (mm/s) |
| U | workpiece moving speed (mm/s) |
| v | velocity in y-direction (mm/s) |
| V | volume flow rate of liquid metal (mm3/s) |
| w | velocity in z-direction (mm/s) |
| x, y, z | |
| Greek symbols | |
| ρ | density (kg/m3) |
| γ | surface tension coefficient (N/m) |
| μ | dynamic viscosity of liquid metal (N·s/m2) |
| μ0 | magnetic permeability (H/m) |
| η | arc thermal efficiency |
| σr | arc pressure distribution parameter |
| ε | radiation emissivity |
| Subscripts | |
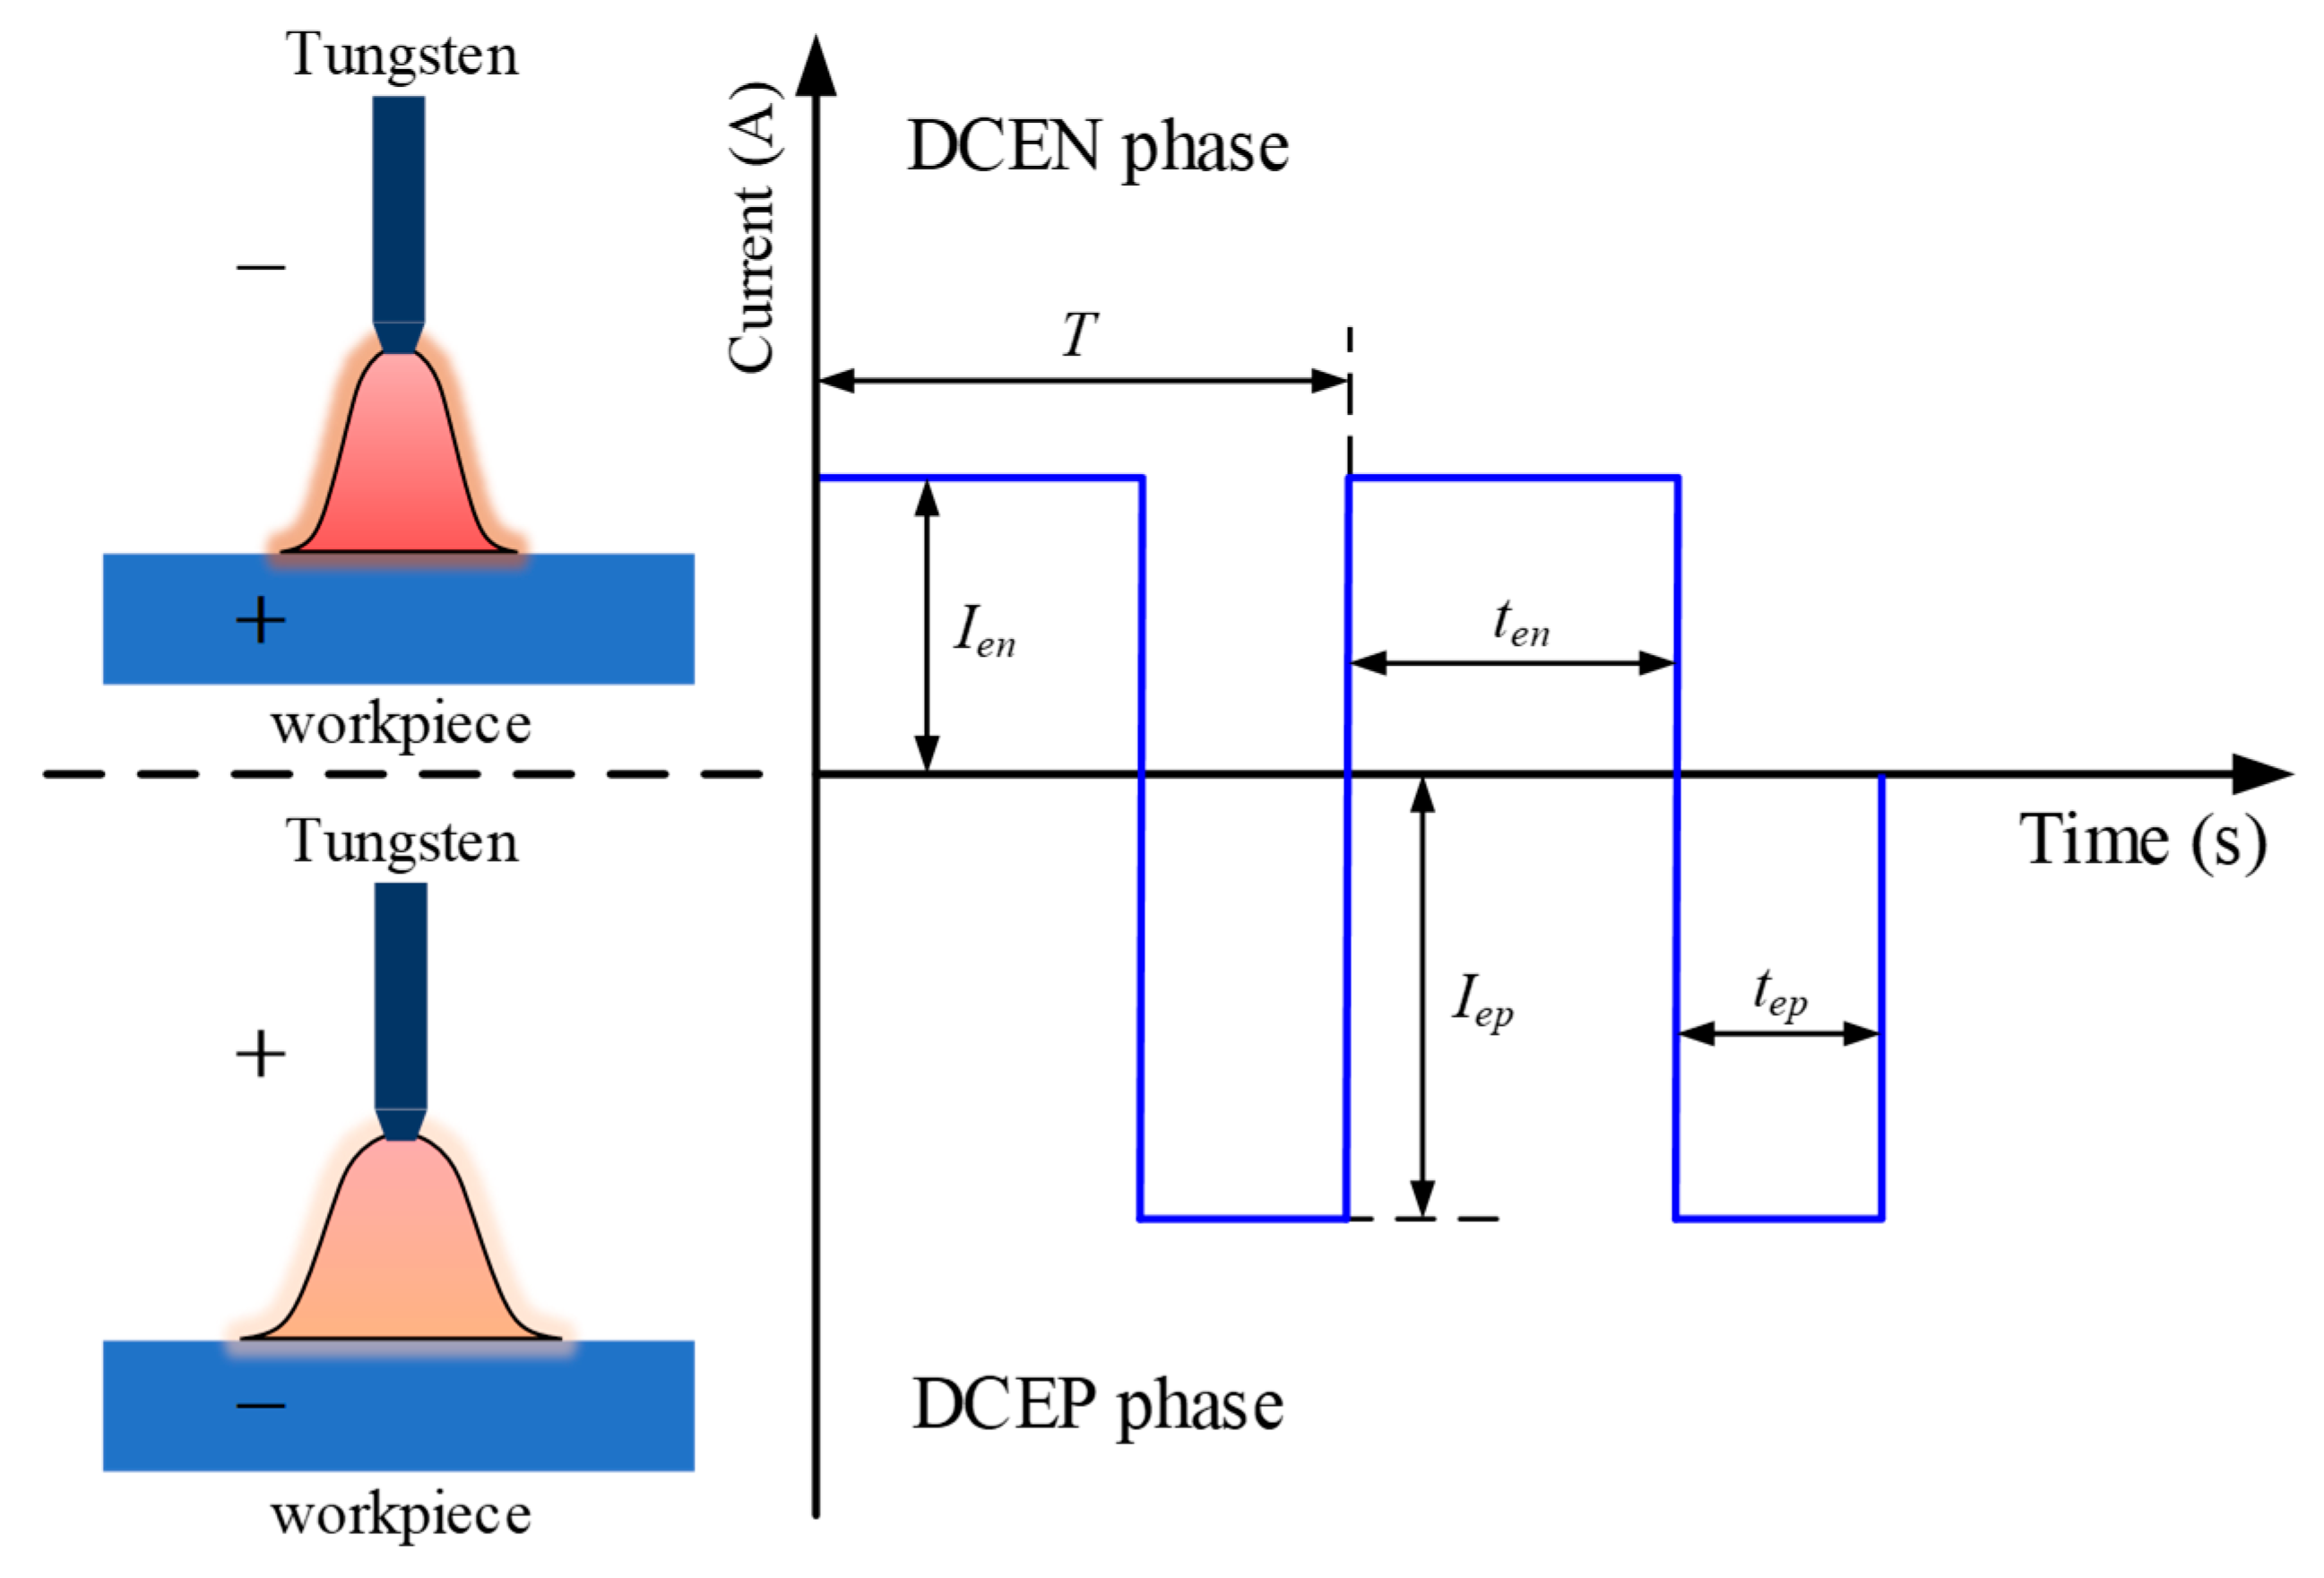
| en | DCEN phase |
| ep | DCEP phase |
| l | liquid phase |
| s | solid phase |
References
- Ostermann, F. Anwendungstechnologie Aluminium; Springer: Berlin/Heidelberg, Germany, 2014. [Google Scholar]
- Wang, L.L.; Wei, J.H.; Wang, Z.M. Numerical and experimental investigations of variable polarity gas tungsten arc welding. Int. J. Adv. Manuf. Technol. 2018, 95, 2421–2428. [Google Scholar] [CrossRef]
- Juang, S.C.; Tarng, Y.S. Process parameter selection for optimizing the weld pool geometry in the tungsten inert gas welding of stainless steel. J. Mater. Process. Technol. 2002, 122, 33–37. [Google Scholar] [CrossRef]
- Kumar, A.; Sundarrajan, S. Selection of Welding Process Parameters for the Optimum Butt-Joint Strength of an Aluminum Alloy. Mater. Manuf. Process. 2006, 21, 779–782. [Google Scholar] [CrossRef]
- Devakumaran, K.; Ghosh, P.K. Thermal Characteristics of Weld and HAZ during Pulse Current Gas Metal Arc Weld Bead Deposition on HSLA Steel Plate. Mater. Manuf. Process. 2010, 25, 616–630. [Google Scholar] [CrossRef]
- Trautmann, M.; Hertel, M.; Füssel, U. Numerical simulation of TIG weld pool dynamics using smoothed particle hydrodynamics. Int. J. Heat Mass Transf. 2017, 115, 842–853. [Google Scholar] [CrossRef]
- Pan, J.; Hu, S.; Yang, L.; Wang, D. Investigation of molten pool behavior and weld bead formation in VP-GTAW by numerical modelling. Mater. Des. 2016, 111, 600–607. [Google Scholar] [CrossRef]
- Chen, W.; Chin, B. Monitoring joint penetration using infrared sensing techniques. Weld. J. 1990, 69, 181–185. [Google Scholar]
- Vasudevan, M.; Chandrasekhar, N.; Maduraimuthu, V.; Bhaduri, A.K.; Raj, B. Real-Time Monitoring of Weld Pool during GTAW using Infra-Red Thermography and analysis of Infra-Red thermal images. Weld. World 2011, 55, 83–89. [Google Scholar] [CrossRef]
- Liang, G.; Yuan, S. Study on the temperature measurement of AZ31B magnesium alloy in gas tungsten arc welding. Mater. Lett. 2008, 62, 2282–2284. [Google Scholar] [CrossRef]
- Dutta, P.; Joshi, Y.; Janaswamy, R. Thermal modeling of gas tungsten arc welding process with nonaxisymmetric boundary conditions. Numer. Heat Tranf. A Appl. 1995, 27, 499–518. [Google Scholar] [CrossRef]
- Farzadi, A.; Serajzadeh, S.; Kokabi, A.H. Investigation of weld pool in aluminum alloys: Geometry and solidification microstructure. Int. J. Therm. Sci. 2010, 49, 809–819. [Google Scholar] [CrossRef]
- Farzadi, A.; Serajzadeh, S.; Kokabi, A.H. Prediction of solidification behaviour of weld pool through modelling of heat transfer and fluid flow during gas tungsten arc welding of commercial pure aluminium. Mater. Sci. Technol. 2008, 24, 1427–1432. [Google Scholar] [CrossRef]
- Faraji, A.H.; Goodarzi, M.; Seyedein, S.H.; Zamani, M.H. Experimental study and numerical modeling of arc and weld pool in stationary GTA welding of pure aluminum. Int. J. Adv. Manuf. Technol. 2014, 71, 2059–2071. [Google Scholar] [CrossRef]
- Pan, J.; Hu, S.; Yang, L.; Li, H. Simulation and analysis of heat transfer and fluid flow characteristics of variable polarity GTAW process based on a tungsten–arc-specimen coupled model. Int. J. Heat Mass Transf. 2016, 96, 346–352. [Google Scholar] [CrossRef]
- Meng, X.; Qin, G.; Zou, Z. Investigation of humping defect in high speed gas tungsten arc welding by numerical modelling. Mater. Des. 2016, 94, 69–78. [Google Scholar] [CrossRef]
- Campbell, S.W.; Galloway, A.M.; McPherson, N.A. Techno-economic evaluation of reducing shielding gas consumption in GMAW whilst maintaining weld quality. Int. J. Adv. Manuf. Technol. 2012, 63, 975–985. [Google Scholar] [CrossRef] [Green Version]
- Ley, F.H.; Campbell, S.W.; Galloway, A.M.; McPherson, N.A. Effect of shielding gas parameters on weld metal thermal properties in gas metal arc welding. Int. J. Adv. Manuf. Technol. 2015, 80, 1213–1221. [Google Scholar] [CrossRef] [Green Version]
- Hirt, C.W.; Nichols, B.D. Volume of fluid (VOF) method for the dynamics of free boundaries. J. Comput. Phys. 1981, 39, 201–225. [Google Scholar] [CrossRef]
- Brackbill, J.U.; Kothe, D.B.; Zemach, C. A continuum method for modeling surface tension. J. Comput. Phys. 1992, 100, 335–354. [Google Scholar] [CrossRef]
- Bibby, M.J.; Goldak, J.A.; Shing, G.Y. A Model for Predicting the Fusion and Heat-Affected Zone Sizes of Deep Penetration Welds. Can. Metall. Q. 1985, 24, 101–105. [Google Scholar] [CrossRef]
- Desai, R.S.; Bag, S. Influence of displacement constraints in thermomechanical analysis of laser micro-spot welding process. J. Manuf. Process. 2014, 16, 264–275. [Google Scholar] [CrossRef]
- Cho, D.W.; Lee, S.H.; Na, S.J. Characterization of welding arc and weld pool formation in vacuum gas hollow tungsten arc welding. J. Mater. Process. Technol. 2013, 213, 143–152. [Google Scholar] [CrossRef]
- Sreedhar, U. Static GTAW: Experimental and Numerical Investigations and Heat Flux Parameter Estimation. Ph.D. Thesis, Universit´e Montpellier-II, Montpellier, France, 2014. [Google Scholar]
- Cho, D.W.; Na, S.J.; Cho, M.H.; Lee, J.S. Simulations of weld pool dynamics in V-groove GTA and GMA welding. Weld. World 2013, 57, 223–233. [Google Scholar] [CrossRef]
- Kou, S.; Sun, D.K. Fluid flow and weld penetration in stationary arc welds. Metall. Mater. Trans. A 1985, 16, 203–213. [Google Scholar] [CrossRef]
- Christensen, N.; Davies, V.; Gjermundsen, K. The Distribution of Temperature in Arc Welding. Br. Weld. J. 1965, 12, 54–75. [Google Scholar]
- Azar, A.S.; Ås, S.K.; Akselsen, O.M. Determination of welding heat source parameters from actual bead shape. Comput. Mater. Sci. 2012, 54, 176–182. [Google Scholar] [CrossRef]


| Material | Cu | Mg | Mn | Si | Zn | Ti | Al |
|---|---|---|---|---|---|---|---|
| AA2024 | 4.52 | 1.4 | 0.61 | 0.16 | 0.08 | 0.05 | Bal. |
| Test Case | Adjustable Parameters | Other Fixed Parameters | |
|---|---|---|---|
| f (Hz) | u (mm/s) | ||
| T1 | 3 | 5 | Ien/Iep = 240/120 A Uen/Uep = 12.0/11.2 V σj, en/σj, en = 2.70/2.62 mm σq, en/σq, ep = 2.70/2.62 mm σp, en/σp, ep = 3.00/2.92 mm ηen/ηep = 0.8/0.5 |
| T2 | 3 | 6 | |
| T3 | 3 | 7 | |
| T4 | 1 | 8 | |
| T5 | 3 | 8 | |
| T6 | 5 | 8 | |
| T7 | 10 | 8 | |
| Properties | Value (Unit) |
|---|---|
| Density | f(T), Figure 3 (kg m−3) |
| Viscosity | f(T), Figure 3 (N s/m2) |
| Surface tension at liquidus temperature | f(T), Figure 3 (N m−1) |
| Thermal conductivity of metal | f(T), Figure 3 (W m−1 K−1) |
| Specific heat capacity | f(T), Figure 3 (J kg−1 K−1) |
| Solidus temperature | Ts = 811.15 (K) |
| Liquidus temperature | Tl = 905.15 (K) |
| Thermal expansion coefficient | ρT = 7.2 × 10⁻⁵ (1/K) |
| Emissivity | ε = 0.4 |
| Magnetic permeability | μ0 = 1.26 × 10⁻⁶ (H m−1) |
| Electrical conductivity | σe = 2.5 × 10⁷ (Ω−1 m−1) |
| Ambient temperature | 298 (K) |
| Latent heat of melting | L = 3.97 × 10⁵ (J kg−1) |
| Latent heat of vaporization | Lev = 1.08 × 10⁷ (J kg−1) |
| Convective heat transfer coefficient | hc = 100 (W m−2 K−1) |
| Vaporization temperature | Tev = 1163 (K) |
| Ambient temperature | T∞ = 298 (K) |
| Moving speeds of the torch | u = 5–8 (mm s−1) |
| Arc thermal efficiency | ηen = 0.8 |
| ηep = 0.5 |
| Parameters | Value |
|---|---|
| Length of front ellipsoidal (mm) | af = 2.7 |
| Length of rear ellipsoidal (mm) | ar = 6.3 |
| Width of heat source (mm) | 2b = 5.4 |
| Depth of heat source (mm) | c = 1.35 |
| Fraction of heat in front ellipsoidal | ff = 0.6 |
| Fraction of heat in rear ellipsoidal | fr = 1.4 |
© 2019 by the authors. Licensee MDPI, Basel, Switzerland. This article is an open access article distributed under the terms and conditions of the Creative Commons Attribution (CC BY) license (http://creativecommons.org/licenses/by/4.0/).
Share and Cite
Du, J.; Zhao, G.; Wei, Z. Effects of Welding Speed and Pulse Frequency on Surface Depression in Variable Polarity Gas Tungsten Arc Welding of Aluminum Alloy. Metals 2019, 9, 114. https://doi.org/10.3390/met9020114
Du J, Zhao G, Wei Z. Effects of Welding Speed and Pulse Frequency on Surface Depression in Variable Polarity Gas Tungsten Arc Welding of Aluminum Alloy. Metals. 2019; 9(2):114. https://doi.org/10.3390/met9020114
Chicago/Turabian StyleDu, Jun, Guangxi Zhao, and Zhengying Wei. 2019. "Effects of Welding Speed and Pulse Frequency on Surface Depression in Variable Polarity Gas Tungsten Arc Welding of Aluminum Alloy" Metals 9, no. 2: 114. https://doi.org/10.3390/met9020114
APA StyleDu, J., Zhao, G., & Wei, Z. (2019). Effects of Welding Speed and Pulse Frequency on Surface Depression in Variable Polarity Gas Tungsten Arc Welding of Aluminum Alloy. Metals, 9(2), 114. https://doi.org/10.3390/met9020114