Article

Effect of Artificial Aging, Delayed Aging, and Pre-Aging on Microstructure and Properties of 6082 Aluminum Alloy

1
Light Alloy Research Institute, Central South University, Changsha 410083, China
2
School of Materials Science and Engineering, Central South University, Changsha 410083, China
3
Suntown Technology Group Co., Ltd., Changsha 410200, China
4
Guangdong Fenglu Aluminum Industry Co., Ltd., Fushan 528100, China
*
Author to whom correspondence should be addressed.
Metals 2019, 9(2), 173; https://doi.org/10.3390/met9020173
Submission received: 14 January 2019 / Revised: 28 January 2019 / Accepted: 30 January 2019 / Published: 2 February 2019

Abstract

:
Three different aging treatments including single-aging, delayed-aging, and pre-aging were carried out on 6082 extruded profiles after solution heat treatment, then their hardness, tensile strength, and microstructure were tested. The experimental results reveal that the properties and microstructure changes during single-aging. Based on this, the negative effects of room temperature delay and the results of short-term pre-aging treatments used in the experiment to improve this phenomenon have been concluded.

1. Introduction

The demand of Al-Mg-Si alloys in rail transit is increasing because of their high strength-to-weight ratio, excellent formability, and good mechanical properties. The 6082 alloy which contents 0.9wt%Mg and 1.0wt%Si is widely used for body panel of high-speed trains and inter-city rail cars [1,2,3,4,5]. According to literature and reports, there have been a number of fabrication techniques and alloying methods to increase the mechanical properties of AA6082 alloys [6,7,8]. Since the aging treatment plays a critical role in controlling the final microstructure and mechanical properties of the alloy, it is very important to optimize the aging condition to obtain a relatively optimal organizational structure and enhance the mechanical properties. It is still widely studied that the precipitation of metastable nanoparticles from the matrix strengthens the alloy during artificial aging [9,10,11,12].
During the aging process, the precipitation sequence of Al-Mg-Si alloys can be described as: supersaturated solid solution (SSSS) → early precipitation stages (Guinier–Preston zones (G.P. zone)) → β″ phase → β′ phase → β phase (Mg2Si) [13,14]. In general, the clusters and G.P. zones are aggregates of solute atoms, and they are believed to be spherically-shaped. As a completely coherent phase with the matrix, they serve as nucleation and growth sites for the metastable precipitates—β″ phases during the subsequent aging process [15]. The β″ phases, considered as the main hardening phase, have a needle-like morphology, which is aligned along the <100>Al direction [16], as are the rod-shaped β′ phases. The equilibrium phase in this system is the β precipitates. A significant effort has been claimed from this precipitation sequence [17,18].
It is generally known that immediate aging after solution treatment provides higher mechanical properties [19,20,21]. However, during the delayed aging process, the mechanical properties of the alloy will decrease significantly no matter how long the alloy is held at room temperature (RT) [22]. This phenomenon can be called the delayed or floor aging effect [23]. A pre-aging treatment was studied to improve the delayed effect. The pre-aging treatment is to add a 175 °C/30 min heat preservation process before the delayed aging. This thermal process can ensure that the hardness and strength of alloy will not decrease drastically during the subsequent 20 h of RT retention [24,25].
The main goal of this paper was to study the effects of structure on properties of 6082 aluminum alloy under different heat treatment conditions by combining mechanical properties tests and various microstructural analysis methods. Besides, the characteristics of the precipitated phase evolution in the presence of the delayed effect and the positive effect of a short-term pre-aging on the subsequent natural aging were explored in this paper.

2. Experimental Procedure

The composition of the experimental 6082 alloy is shown in Table 1. The as-received extruded alloy with 5 mm thickness was cut into 15 mm × 15 mm × 5 mm bulk samples. The specimens were subjected to solution heat treatment at 545 °C for 50 min and then quenched in water at room temperature. The main aim of the solution treatment is to dissolve the Mg2Si phase. The following aging treatment systems were shown in Table 2. The terms natural aging (NA), artificial aging (AA) and pre-aging (PA) represent natural aging at room temperate, artificial aging at 175 °C, and pre-aging at 175 °C for 30 min, respectively.
A 401 MVD digital microhardness tester was used to measure the Vickers hardness at 500 g load for 15 s. For each sample, the average value of six indentations was taken as the final hardness. The typical conditions were selected for the following detection based on the hardness curve. The parameters of the tensile specimens are as follows: a = 5 mm, b = 12.5 mm, L0 = 45 mm, LC = 58 mm, r = 20 mm (the parameters a, b, L0, and LC are the thickness, the width of the parallel length, the original gage, and the length of the parallel of rectangular cross section specimens). They were vertically pulled at a speed of 2 mm/min, and the corresponding fracture morphology was observed with a secondary electron scan (SEM, EVO MA10, ZEISS, Jena, Germany). The grain structure was obtained by electron backscattered diffraction (EBSD, EVO MA10, ZEISS, Jena, Germany).
The specimens for transmission electron microscope (TEM, FEI-F20, FEI, Hillsboro, OR, USA) observation were prepared by electro-polishing with a mixed electrolytic solution of nitric acid and methyl alcohol (3:7), and used at −25 °C to −15 °C. TEM observation were observed along [001]Al zone axis.

3. Results and Discussion

3.1. Simple Artificial Aging Treatment System

3.1.1. Mechanical Properties

Figure 1 shows the hardness curve of AA specimens. The hardness was only 83.07 (± 3) HV after solution heat treatment. The maximum hardness of 132.32 HV appeared at 8 h. With prolonging the aging time, the hardness gradually decreased to 116.87 HV at 18 h and finally tended to a relatively stable platform. As the aging time increased to 96 h, the hardness further decreased to 102.23 HV. Therefore, it can be inferred from the hardness curve that the optimized single-stage aging system for the studied alloy is 175 °C/8 h.
Tensile strength experiments were taken for the typical specimens, and the results are shown in Figure 2. The elongation of specimens gradually decreased as the time extends. The elongation of the specimen at 175 °C for 8 h was 15.44% (±0.3%), which means the specimen has a proper toughness. From Figure 2, it can be concluded that the ultimate tensile strength (UTS) and the yield strength (YS) of the specimens at 8 h (397.4 MPa and 376.67 MPa, respectively) are the highest values. Obviously, the result of the strength curve is consistent with the hardness test result. That is, for the 6082 alloy, the peak-aging system is 175 °C/8 h.

3.1.2. Microstructure and Analysis

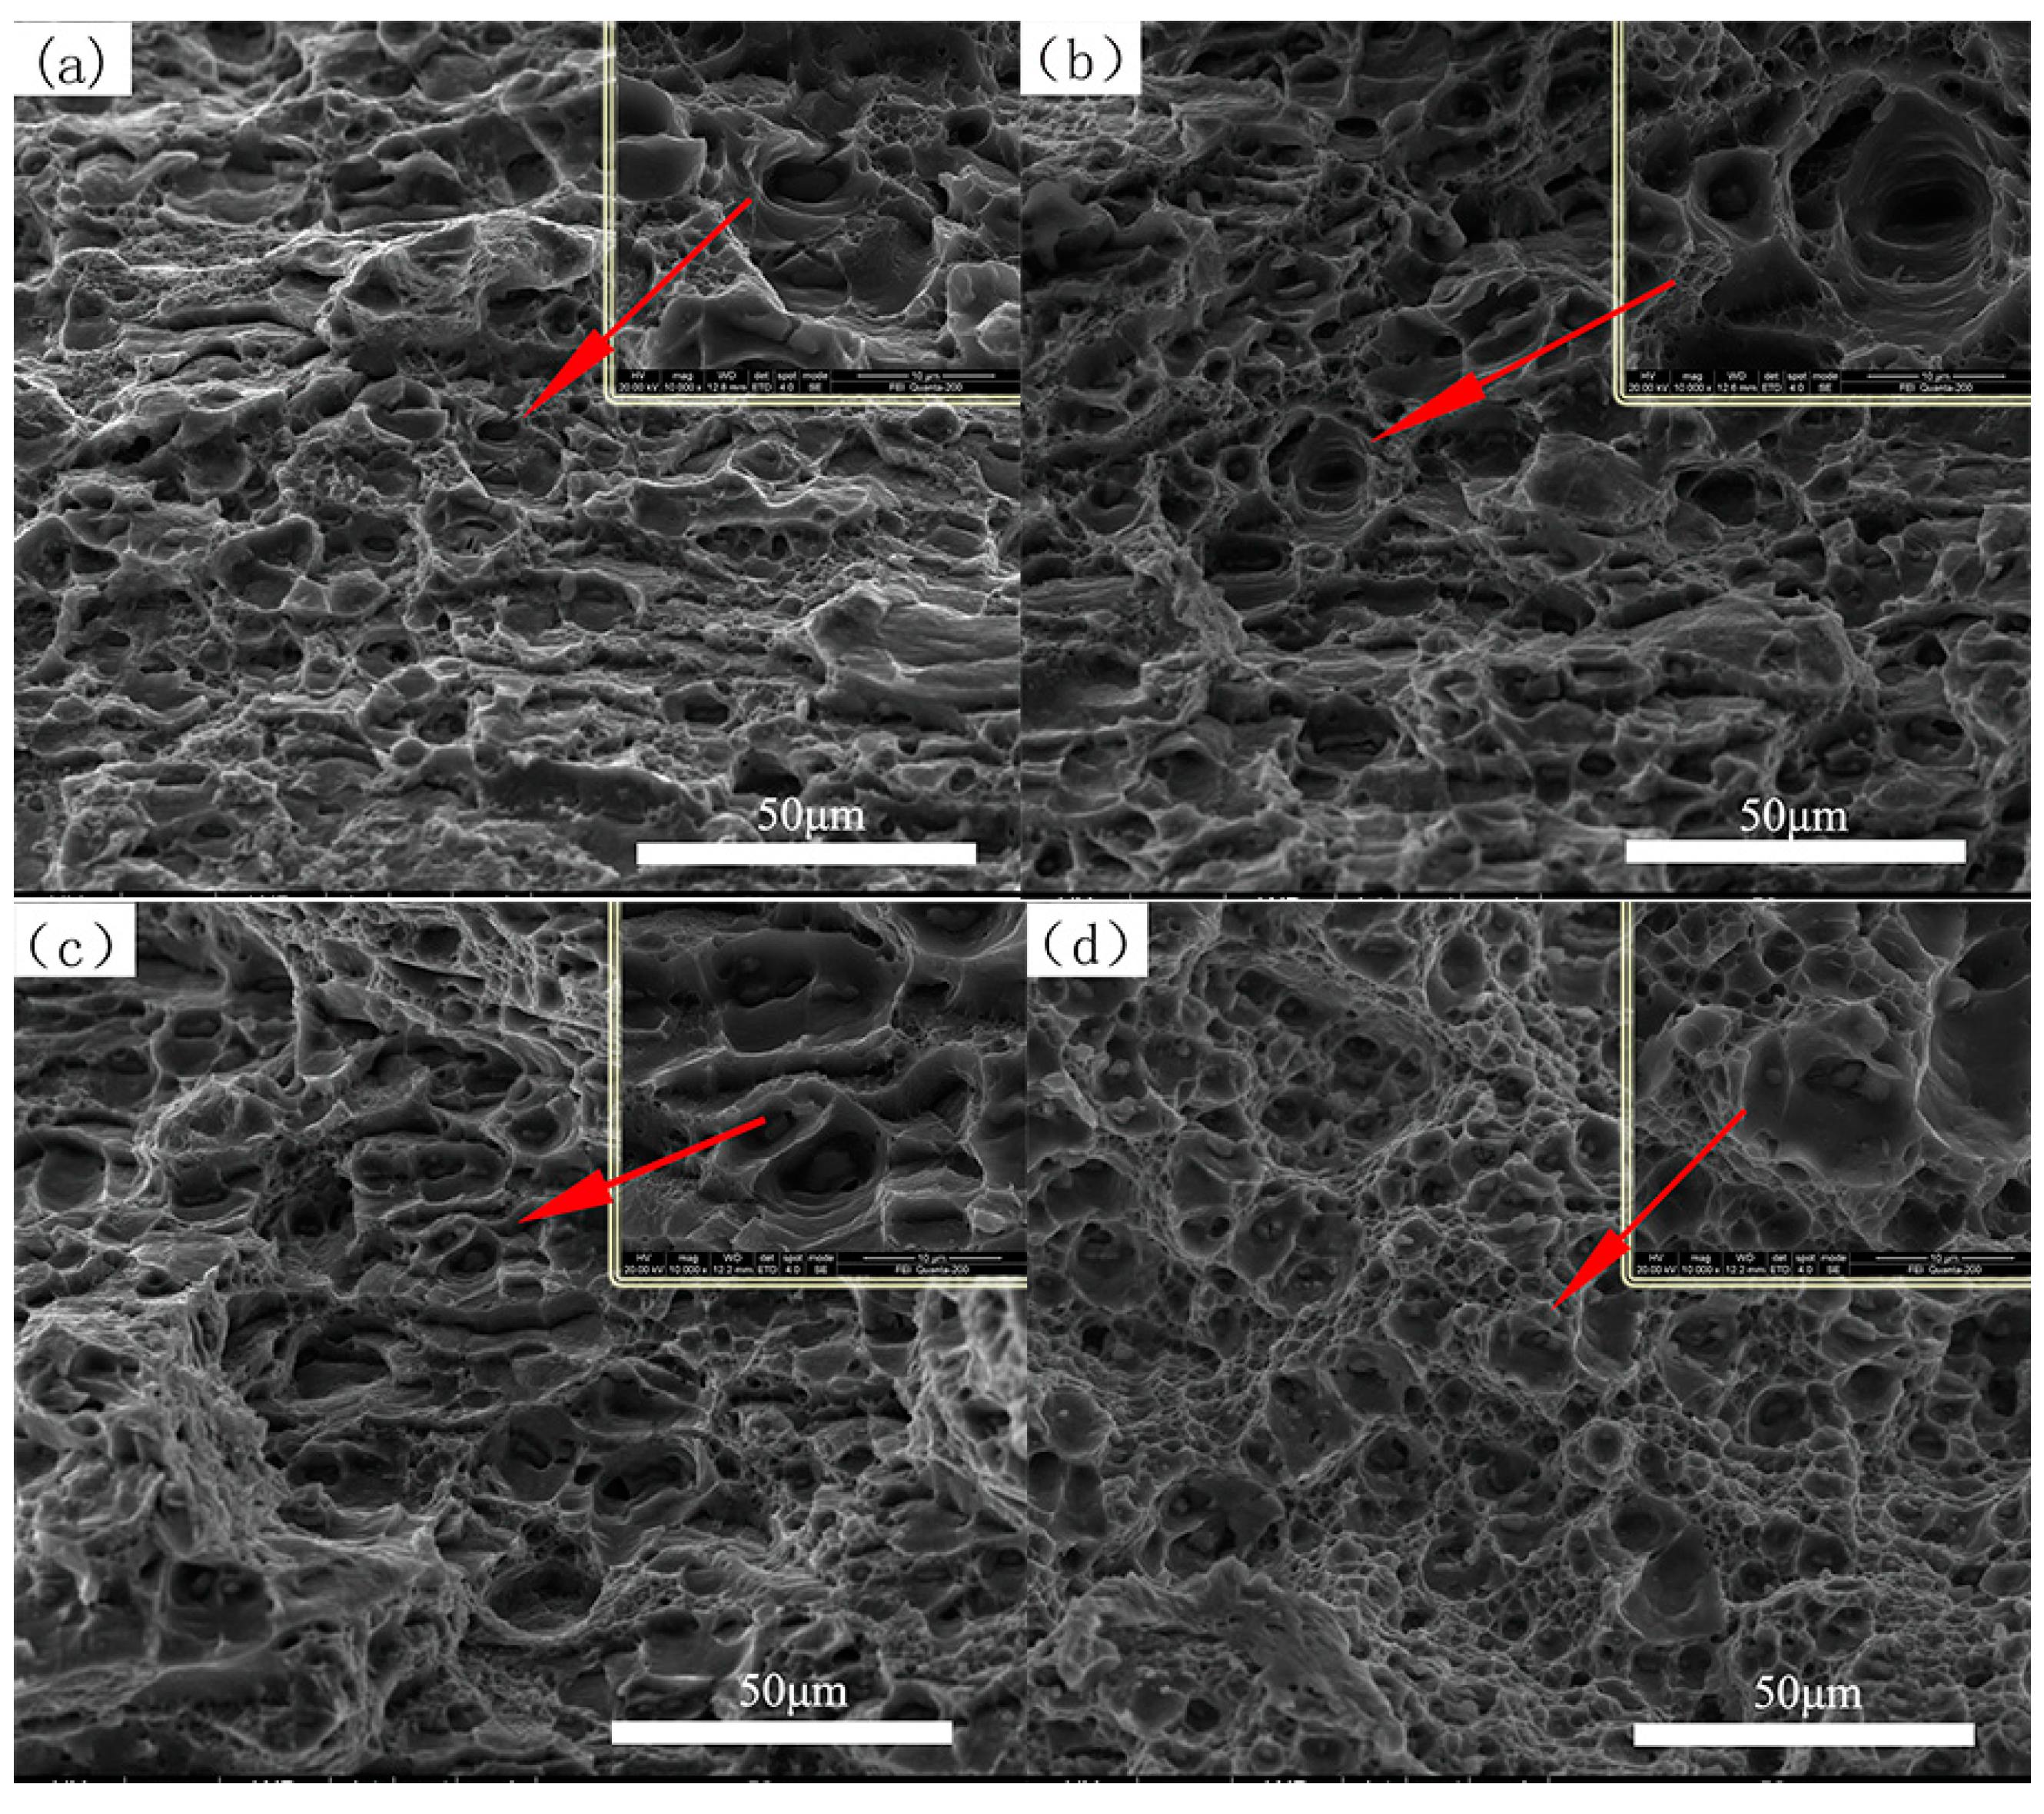
The typical SEM micrographs of fracture morphology of AA specimens after tension are shown in Figure 3. It can be observed that there are a large number of dimples on the fracture, which indicates the tensile fracture of the 6082 alloy is a ductile fracture. As seen from Figure 3a, the dimples are smaller and shallower than that in Figure 3b. In Figure 3c, the size and morphology of the dimples changed obviously, and oval dimples appear. A large number of small and shallow dimples appear in Figure 3d. It can be indicated that the ductility of the studied alloy decreases with the increase of the aging time at 175 °C, which is in correspondence with the elongation curve in Figure 2.
As shown in Figure 4a that there are two different phases distribute in the Al matrix after peak-aging. The corresponding energy dispersive spectrometer (EDS) analyses are in Figure 4c,d. The white irregular block phase A and the black granular particles B are identified as Al (Fe, Mn) Si and Mg2Si, respectively. Figure 4b shows the isometric crystal structure of peak-aging samples by EBSD analysis. The average grain size is approximately 11 μm. Most of them have an orientation following the direction of [101] while a few are following in [001] direction. Subsequent TEM observations and analyses of the precipitated phases were based on those [001] oriented grains. The Mg2Si phases are uniformly distributed in the alloy.
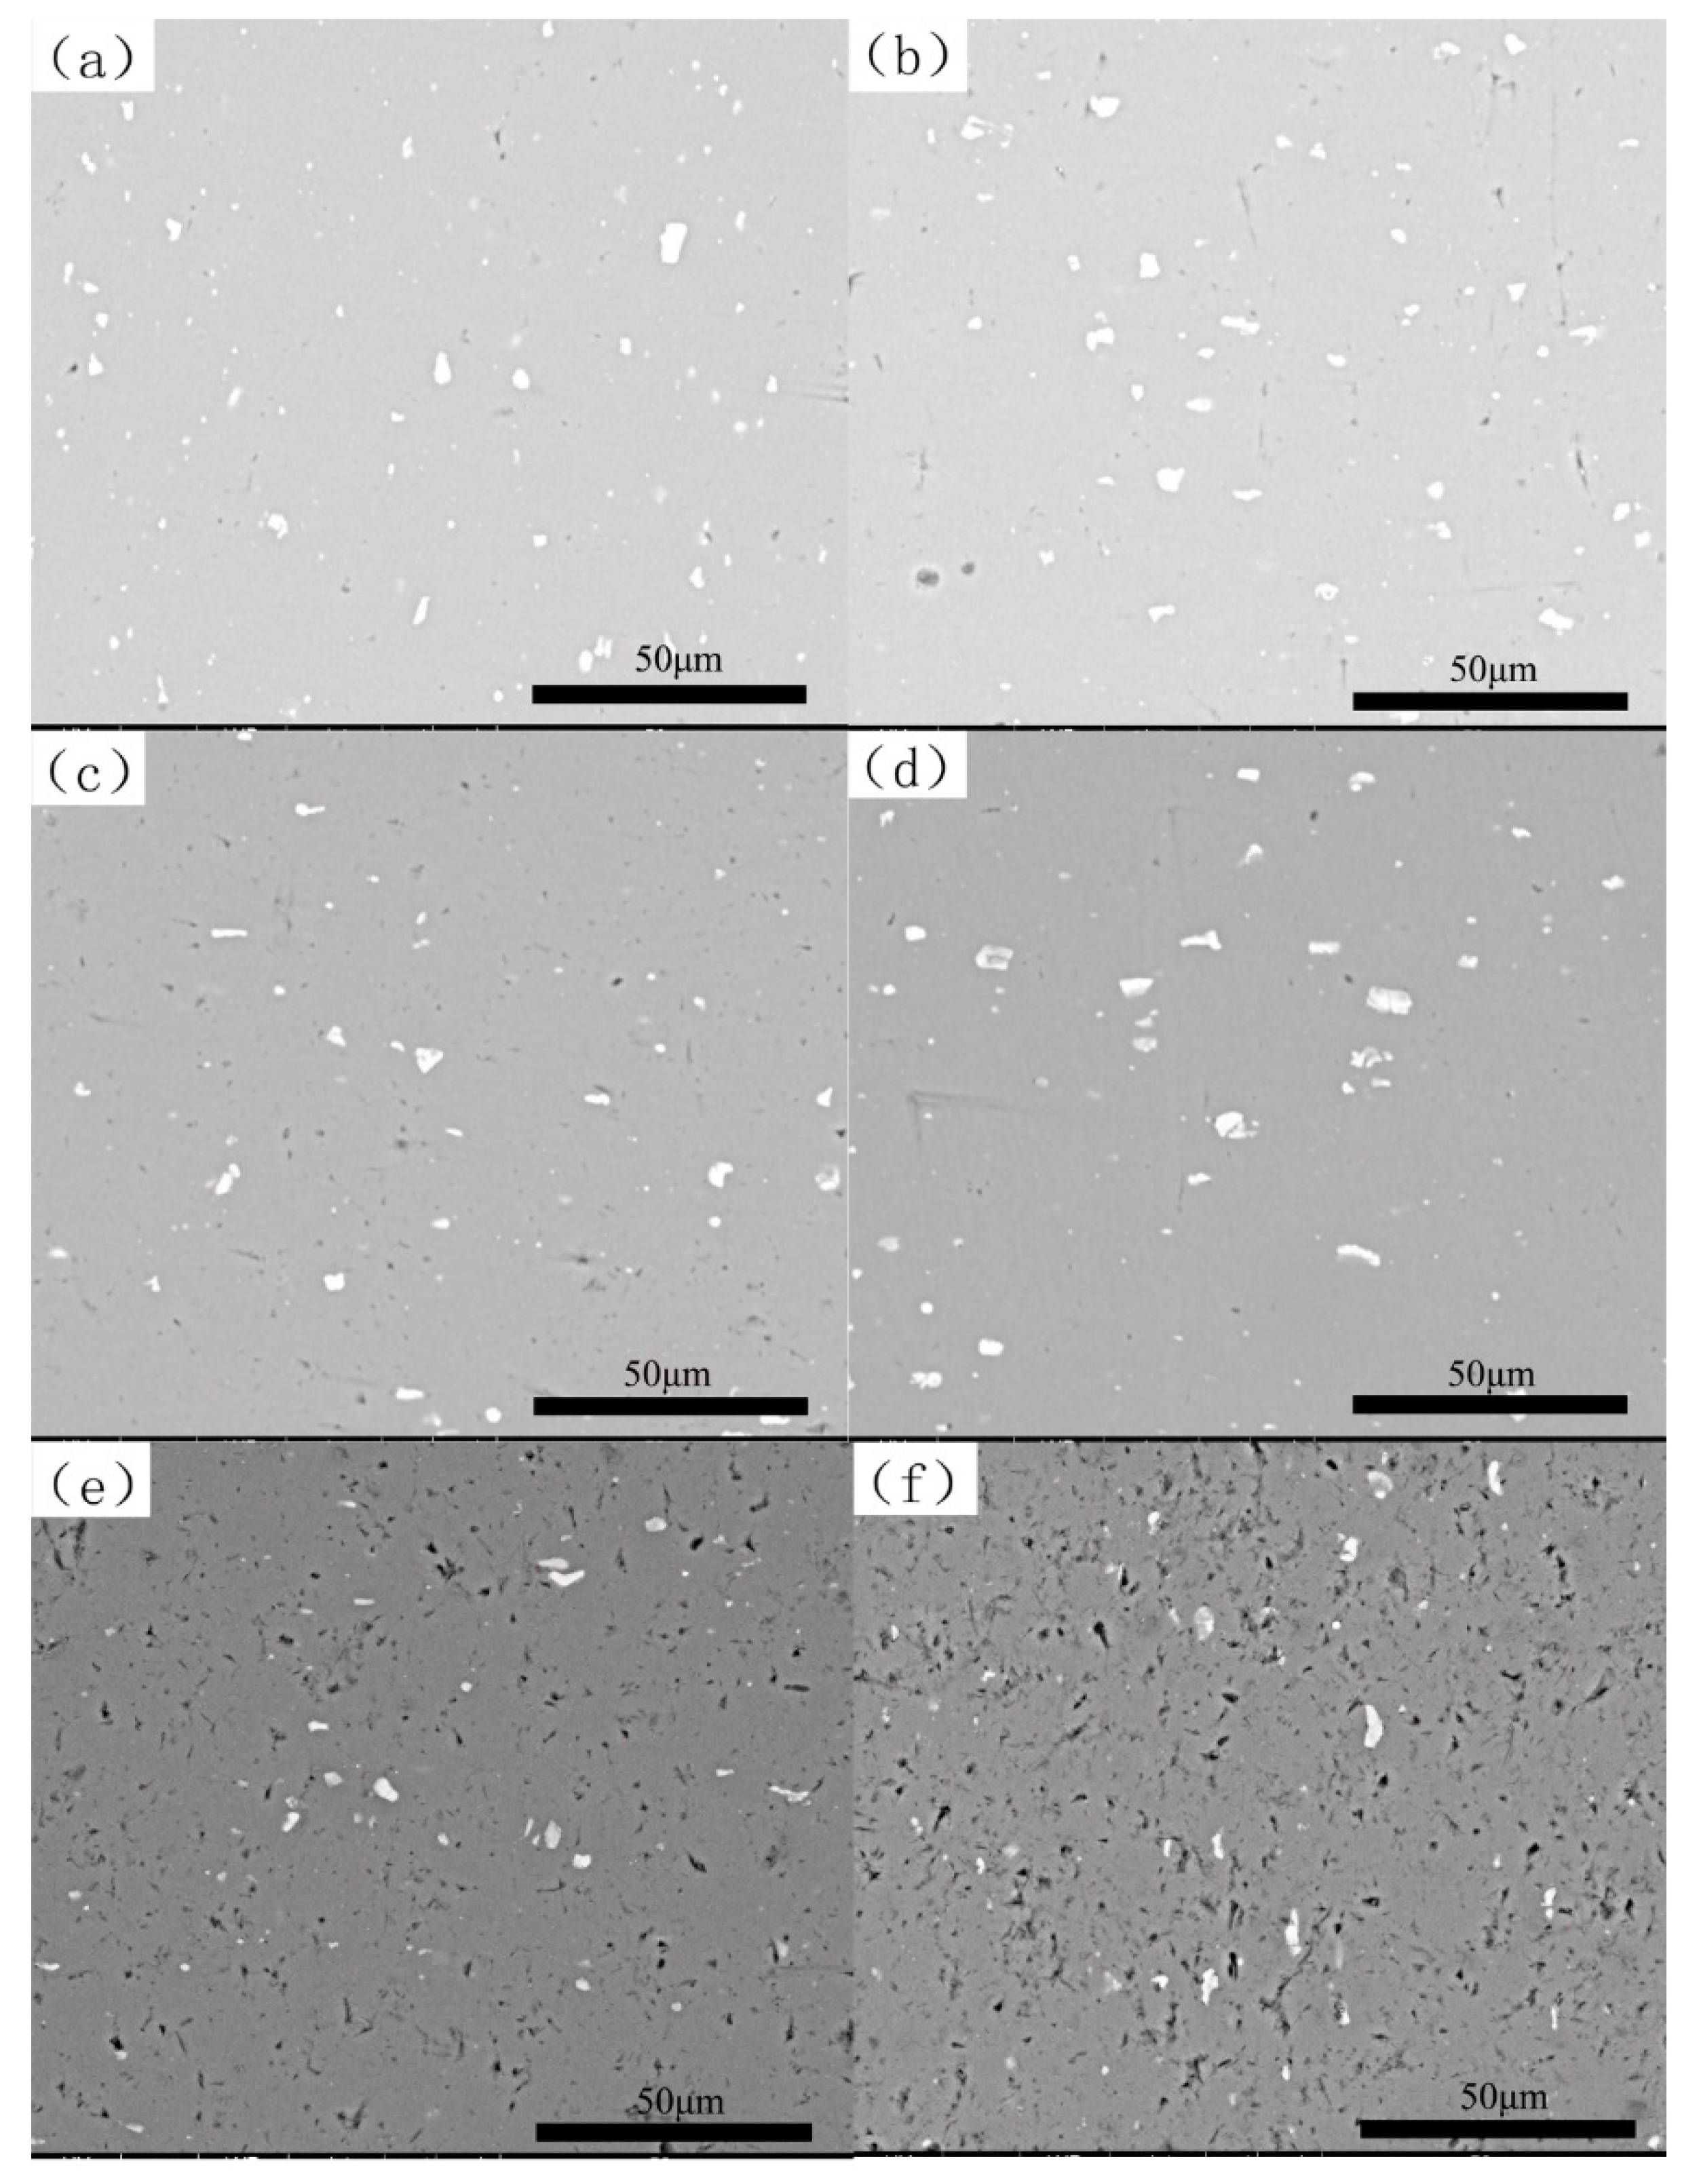
In Figure 5, it can be found that the aging time has little effect on morphology and distribution of Al (Fe, Mn) Si particles since they were distributed in the alloy in various morphologies. The amount of Mg2Si particle in 8 h-aging and 14 h-aging specimens are slightly higher than others (shown in Figure 5b,c). In the subsequent over-aging, those particles were dissolved into the matrix, resulting in a decrease in strength and hardness. When the aging time reaches to 72 h or more, there was a large number of molten holes on the substrate due to the over-burning. Therefore, the hardness in Figure 1 is drastically lowered again.
TEM bright field images and [001] selected area diffraction patterns (SADPs) obtained from materials after single-stage aging treatment are shown in Figure 6. In Figure 6a, when the alloy is heat-treated at 175 °C for 4 h, the G.P. zone in the alloy was still presented in the alloy. But in the region marked by the red circle in Figure 6a, a small number of needle-shaped β″ phase begin to appear. These primary β″ phases, with an average length of about 14.61 nm, were evenly distributed in the Al matrix along three <100>Al directions. And they showed clear coherency strain-filed in the [100]Al and [010]Al directions. Meanwhile, in the corresponding [001]Al SADP, there are weak “cross-needle” diffraction fringes appearing in the marked black circles, and these “cruciform” diffraction fringes have been identified from 12 variants of β″ precipitates in Yang’s researches [16].
In the bright field phase of Figure 6b, the β” precipitates are evenly distributed on the Al matrix. The number of β” precipitates increases, and they are larger than that in Figure 6a, which reaches 20.97 nm. The arrow A represents a “remote” β” precipitates, and the arrow B represents an “inserted” β” precipitate. Studies have shown that these two kinds of particles are the same precipitates with each shape on different crystal faces. In the corresponding [001]Al SADP spectrum, the “cross-shaped” diffraction patterns appear clearly and are arranged around the [110]Al diffraction locations and aligned along the <100>Al directions.
The precipitates on the Al matrix in Figure 6c continue to grow as the aging time increases. The precipitates become coarser and appears rod-shaped in morphology, and the average length reaches to 45.27 nm. At this point, the precipitates are dominated by the β’ phase, which causes the hardness of the alloy to drop to a plateau. The particles in Figure 6d are mainly flaky equilibrium β phases of 205.55 nm, and the zero-contrast line disappears substantially. It brings a sharp drop in the hardness of the alloy.
It was revealed from the experimental results that the aging time has a critical influence on the microstructure evolution and properties of 6082 alloys. The TEM observation proved that the precipitation order of the second phase of the 6082 alloy is SSSS → G.P. zone → β″ → β′ → β. In a dispersion–dispersed alloy, if the second phase particles are not deformed, they hinder dislocation slip. At this point, each dislocation leaves a dislocation loop as it passed through the particles. This ring acts on a source of reverse stress and dislocation, which increases the resistance of dislocation slip and increases the strength of the alloy rapidly. According to the Orowan mechanism, the critical shear stress for the continued movement of the dislocation line is [26]:
Δ τ G b / d = α f ^ ( 1 2 ) r 1
where α is a constant and f is the volume fraction of the particles. When the particle radius r or the particle spacing d decreases, the strengthening effect increases. When the particle size is constant, the larger the f, the better the strengthening effect. Dislocations leaves a dislocation loop once around the particle, making the particle spacing smaller and subsequent dislocations bypassing the particle more difficult. Eventually, the flow stress rapidly increased. Therefore, when the alloy is aged at 175 °C/8 h, the strengthening effect is optimal.

3.2. Delayed Aging and Pre-Aging

3.2.1. Mechanical Properties

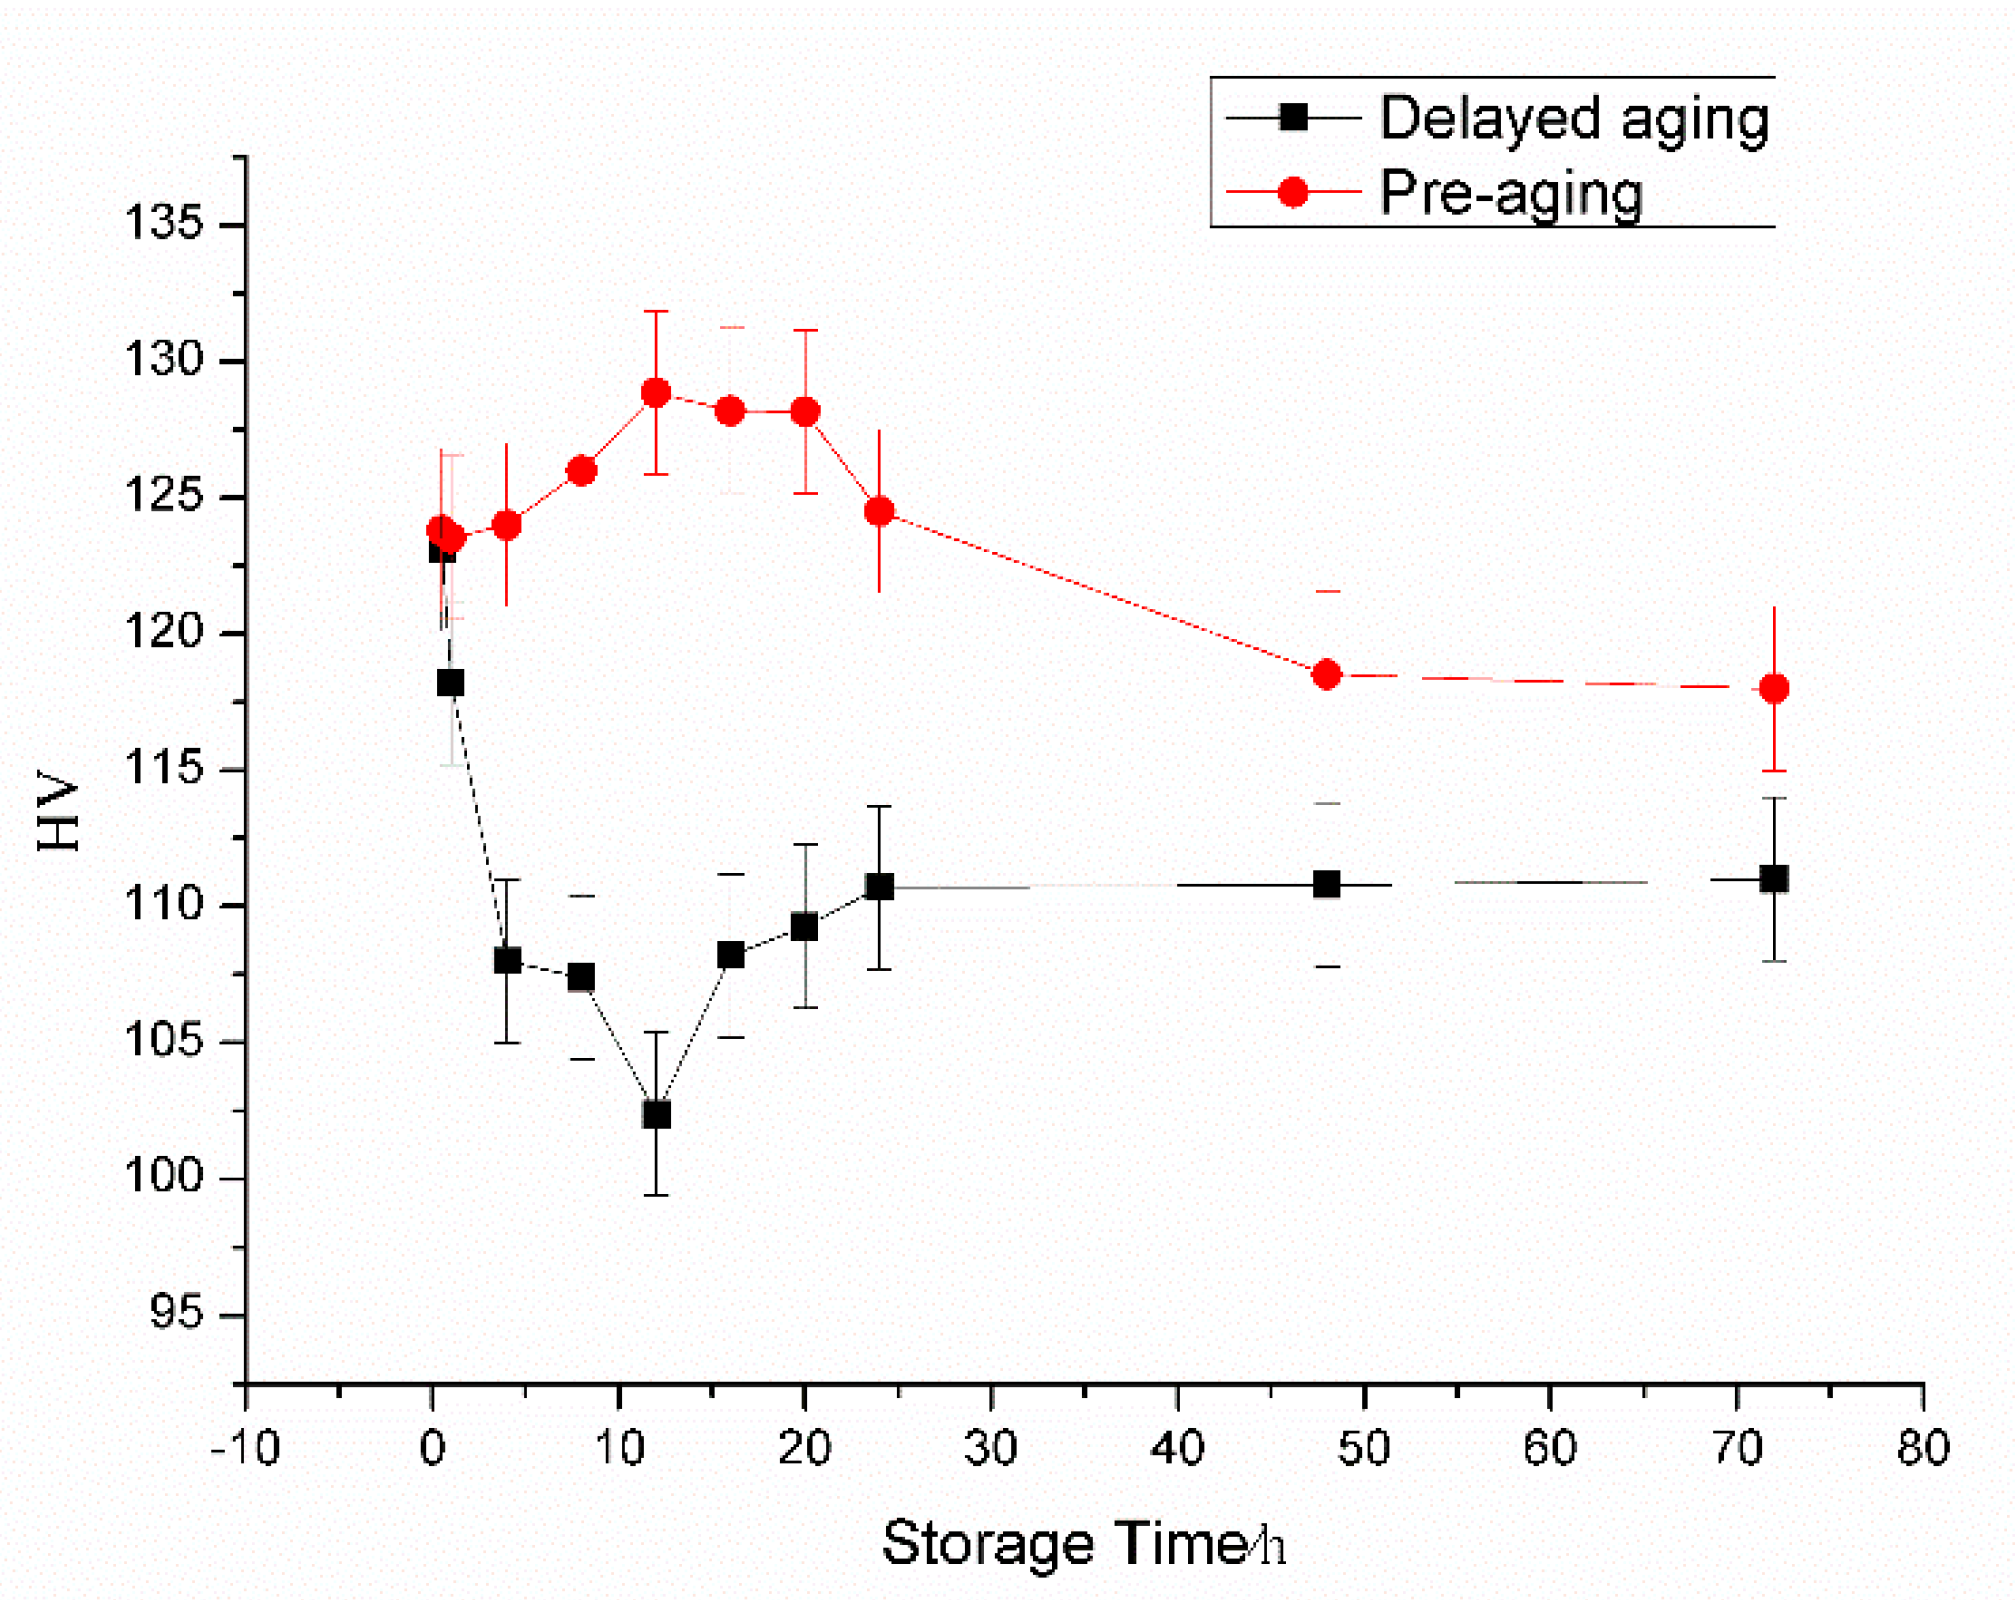
Figure 7 shows the Vickers hardness curve of N + A specimens and P + N + A specimens. Those two curves showed different variation trends with the increase of delay time. The hardness of N + A specimens held in RT for 12 h has the minimum value of 102.4 HV, while the hardness of P + N + A specimens has the maximum value of 128.86 HV.
Figure 8 shows the tensile test results of typical delayed aging and pre-aging samples. From Figure 8a,b, with these two heat treatment conditions, the exposure duration at RT has a little effect on their UTS and YS. However, both of UTS and the YS of P + N + A specimens are higher than that of N + A specimens. The maximum value of UTS of P + N + A specimens is 409 MPa and that of N + A specimens is 346.67 MPa, and the maximum value of YS is 377 MPa and 331.67 MPa respectively. From Figure 9c, it can be found that the elongation of N + A specimens only fluctuates in a small range with a difference of no more than 1.57% (±0.3%). But the elongation of P + N + A specimens shows different variation tendency: The longer the exposure duration at RT is, the lower the elongation is. Regardless of UTS, YS or elongation, the test values of P + N + A specimens are substantially higher than that of N + A samples, and it is the same for the hardness value. Therefore, the mechanical performance test results indicate that it has a negative effect of delayed aging treatment on the hardness of the studied alloy. However, the adopted pre-ageing treatment can play a great role in elimination the hardness drops of the alloy due to the floor aging effect.

3.2.2. Microstructure and Analysis

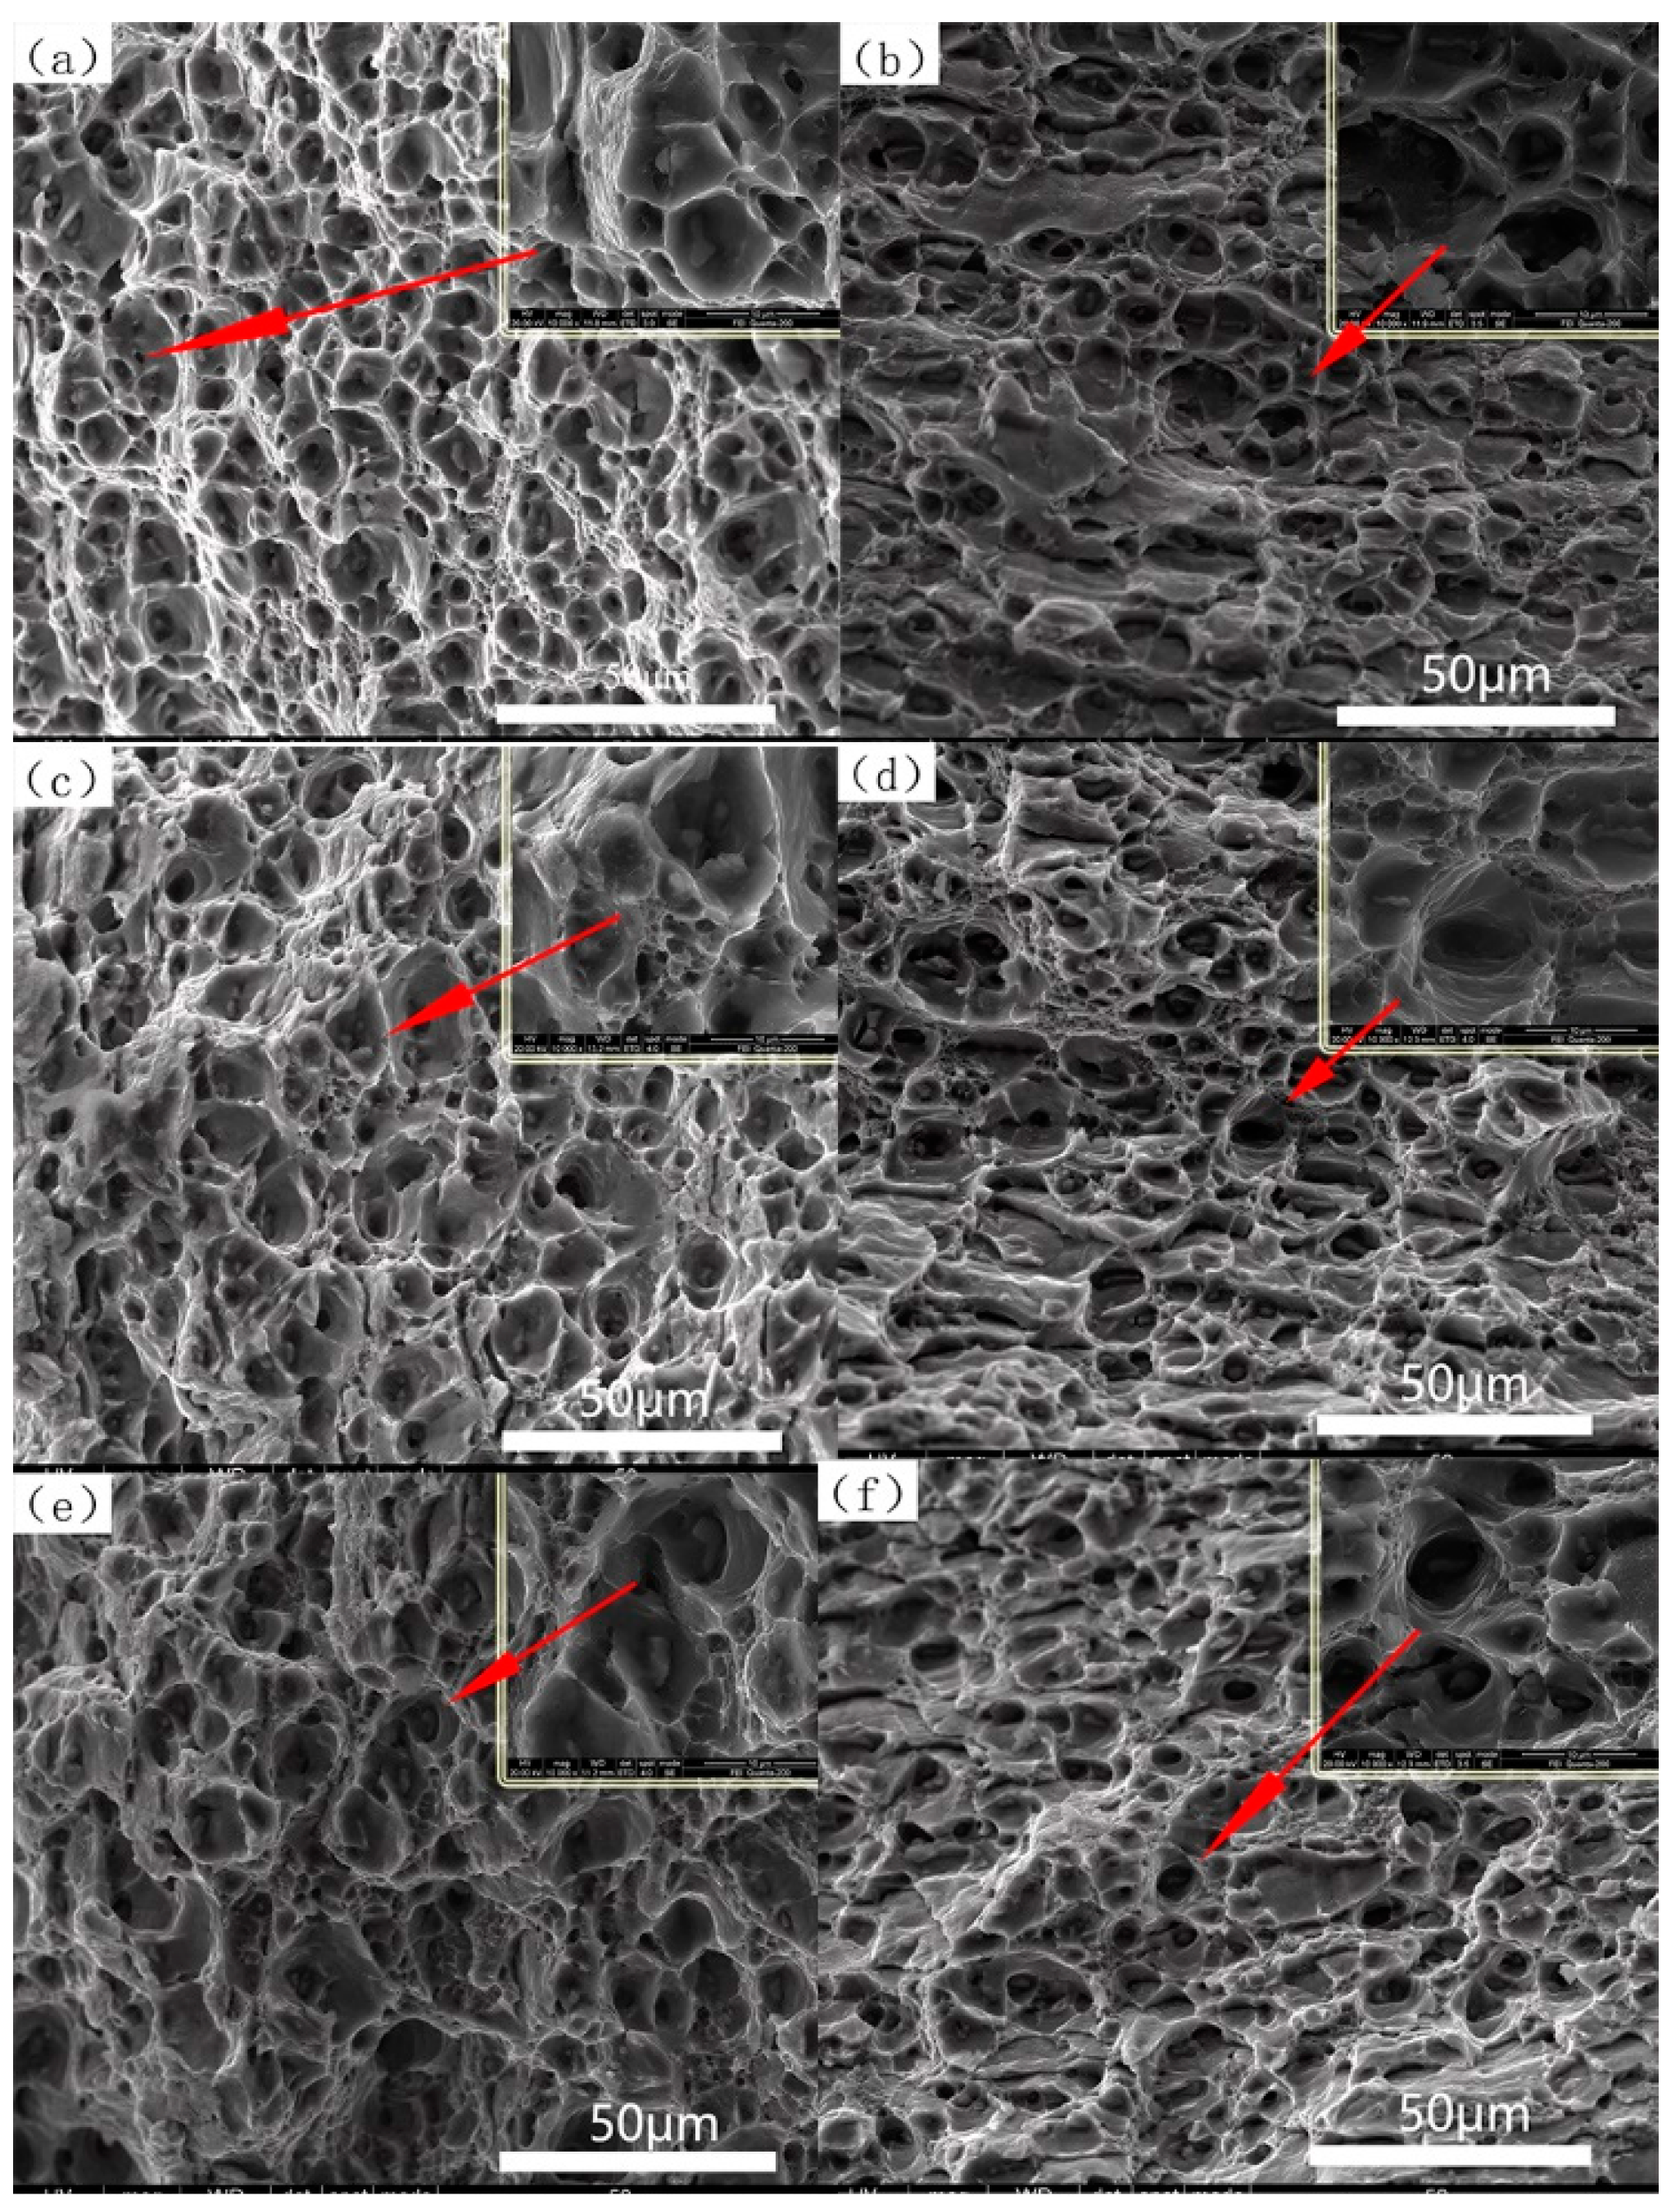
Figure 9 shows the SEM images of tensile fracture morphology of N + A and P + N + A specimens, respectively. They have more dimples than the fracture morphology of AA specimens. Besides the typical equiaxed dimples on the fracture surface, there are a small number of oval dimples. Comparing with Figure 9a,c,e and Figure 9b,d,f, respectively, the size of the dimples increases slightly with the increasing of the RT delay time. In addition, the size of dimples is smaller and more uniform than that of Figure 3. For pre-aged alloys, the tearing ridges between the dimples gradually increase. For the N + A specimens, Figure 10 shows the variation of two kinds of particles. The fine black particles can still be seen in Figure 10a, which are indicated by a red circle. The number of fine black particles is much less than that of Figure 5. When delayed at RT for 12 h, they can hardly be found. During this heat treatment process, when the delay time is less than 12 h, the degree of back-melting of the strengthening phase Mg2Si is continuously increasing. Accordingly, the hardness of the alloy continuously reduced to the minimum value. Subsequently, Mg2Si particles re-precipitate after final aging, making the hardness of the alloy increase. The change in precipitation of the particles in Figure 10 can explain the change in the curve in Figure 7 in one aspect.
For pre-aged samples shown in Figure 11, the distribution of fine black particles are different. The main strengthening precipitates have a larger size and a more dense distribution at a 12 h delay time. Subsequent precipitation of those particles gradually reduced, which can explain the tendency of the corresponding hardness curve in Figure 7. From Figure 12a,c,e, only a few metastable phases with short length appears in the matrix, and the “cross-needle” diffraction fringes can hardly be found in respective SADP patterns. Regardless of the length of the holding time at RT, the number of β″ particles in N + A specimens is much less than that in AA and P + N + A specimens. This is the main reason for the lower mechanical properties of N + A samples. During holding time at RT, the alloy began to be naturally aged, and the early clusters began to form [19].
From Figure 12d, it can be observed that there are more and smaller β″ particles than that of peak-aging shown in Figure 6b. This phenomenon illustrates that when the holding time is 12 h at RT, the pre-aging treatment can obtain a microstructure similar to that under peak-aging treatment. Thus, the improvement effect of this short-term aging process on the delayed effect is optimized. The change in system free energy caused by alloy nucleation during desolvation is:
Δ G = 4 3 π r 3 ( Δ G V + Δ G ε ) + 4 π r 2 σ
where Δ G V is the change of free energy when forming a unit volume of incipient crystal, Δ G ε is the strain energy generated when forming a unit volume of incipient crystal, and σ is the interface energy per unit area of the interface between the incipient crystal and the matrix.
The chemical free energy Δ G V represents the driving force for desolvation, and the size relates to temperature and composition. Under the two heat treatment conditions in Figure 12, the nucleation driving force of the N + A specimens is smaller than that of the P + N + A specimens. Due to the incubation period in the nucleation process of the G.P. zone and metastable phase of the alloy, the natural aging temperature is much lower than the tip temperature, so the incubation period is long, and the clusters formation is slow. The pre-aging temperature is close to the tip temperature and the incubation period is shorter. During the pre-aging process, the G.P. zone is almost completed. So, the nucleation points in the former are much less than that of the latter.

4. Conclusions

In this paper, the mechanical properties and microstructure of the extruded 6082 alloy after three different aging treatments were investigated. Based on the obtained results, the following conclusions can be drawn:
The aging precipitation process of 6082 aluminum alloy conforms to the de-dissolving sequence, and the optimal aging treatment is 175 °C/8 h. Under this condition, the alloy has the best mechanical properties, and the main strengthening particles are β” phase.
When the 6082 alloy was held at RT for a period of time between solution heat treatment and final aging, the delayed effect will be generated, resulting in a significant decrease of properties of the alloy after the final heat treatment. This phenomenon becomes most serious at a 12 h delay.
The pre-aging treatment of 175 °C/30 min after solution heat treatment can play a positive role in eliminating the delay effect. It can keep the alloy in a stable microstructure when held at RT for 24 h, so as to improve the final properties of the experimental alloy.

Author Contributions

X.H. and S.L. conceived and designed the experiments. X.H. performed and analyzed the experiments, prepared the figures and drafted the manuscript. Q.P. conceived the study. Q.P., S.L., K.L. and X.L. discussed the results and analysis, and helped writing the manuscript. Z.H. and H.L. contributed reagents and materials.

Funding

This work was supported by the Science and Technology Major Project of Hunan Province (2016GK1004) and Guangdong Province (2016B090931001).

Conflicts of Interest

The authors declare no conflict of interest.

References

  1. Burger, G.B.; Gupta, A.K.; Jeffrey, P.W.; Lloyd, D.J. Microstructural Control of Aluminum Sheet. Mater. Charact. 1995, 35, 23–39. [Google Scholar] [CrossRef]
  2. Ghosh, M.; Miroux, A.; Werkhoven, R.J.; Bolt, P.J.; Kestens, L.A.I. Warm Deep-Drawing and Post Drawing Analysis of Two Al-Mg-Si alloys. J. Mater. Process. Technol. 2014, 214, 756–766. [Google Scholar] [CrossRef]
  3. Hirsch, J.; Al-Samman, T. Superior light metals by texture engineering: Optimized aluminum and magnesium alloys for automotive applications. Acta Mater. 2013, 61, 818–843. [Google Scholar] [CrossRef]
  4. Olaf Engle, H., Jr. Texture control by thermomechanical processing of AA6xxx Al-Mg-Si sheet alloys for automotive applications—A review. Mater. Sci. Eng. A 2002, 336, 249–262. [Google Scholar] [CrossRef]
  5. Miller, W.S.; Zhuang, L.; Bottema, J.; Wittebrood, A.J.; de Smet, P.; Haszler, A.; Vieregge, A. Recent development in aluminium alloys for the automotive industry. Mater. Sci. Eng. 2000, 280, 37–49. [Google Scholar] [CrossRef] [Green Version]
  6. Reeb, A.; Merzkirch, M.; Schulze, V.; Weidenmann, K.A. Heat treatment during composite extruded spring steel wire reinforced EN AW-6082. J. Mater. Process. Technol. 2016, 229, 1–8. [Google Scholar] [CrossRef]
  7. Remøe, M.S.; Marthinsen, K.; Westermann, I.; Pedersen, K.; Røyset, J.; Marioar, C. The effect of alloying elements on the ductility of Al-Mg-Si alloys. Mater. Sci. Eng. A 2017, 693, 60–72. [Google Scholar] [CrossRef] [Green Version]
  8. Vlach, M.; Čížek, J.; Smola, B.; Melikhova, O.; Vlček, M.; Kodetová, V.; Kudrnová, H.; Hruška, P. Heat treatment and age hardening of Al-Si-Mg-Mn commercial alloy with addition of Sc and Zr. Mater. Charact. 2017, 129, 1–8. [Google Scholar] [CrossRef]
  9. Aginagalde, A.; Gomez, X.; Galdos, L.; García, C. Heat Treatment Selection and Forming Strategies for 6082 Aluminum Alloy. J. Eng. Mater. Technol. 2009, 131, 044501. [Google Scholar] [CrossRef]
  10. Fallah, V.; Korinek, A.; Ofori-Opoku, N.; Raeisinia, B.; Gallerneault, M.; Provatas, N.; Esmaeili, S. Atomic-scale pathway of early-stage precipitation in Al-Mg-Si alloys. Acta Mater. 2015, 82, 457–467. [Google Scholar] [CrossRef]
  11. Noseda Grau, V.; Cuniberti, A.; Tolleyb, A.; Riglos, V.C.; Stipcich, M. Solute clustering behavior between 293K and 373K in a 6082 Aluminum alloy. J. Alloy. Compd. 2016, 684, 481–487. [Google Scholar] [CrossRef]
  12. Werinos, M.; Antrekowitsch, H.; Ebner, T.; Prillhofer, R.; Uggowitzer, P.J.; Pogatscher, S. Hardening of Al-Mg-Si alloys: Effect of trace elements and prolonged natural aging. Mater. Des. 2016, 107, 257–268. [Google Scholar] [CrossRef]
  13. Lai, Y.X.; Jiang, B.C.; Liu, C.H.; Chen, Z.K.; Wu, C.L.; Chen, J.H. Low-alloy-correlated reversal of the precipitation sequence in Al-Mg-Si alloys. J. Alloy. Compd. 2017, 701, 94–98. [Google Scholar] [CrossRef]
  14. Yang, W.; Huang, L.; Zhang, R.; Wang, M.; Li, Z.; Jia, Y.; Lei, R.; Sheng, X. Electron microscopy studies of the age-hardening behaviors in 6005A alloy and microstructural characterizations of precipitates. J. Alloy. Compd. 2012, 514, 220–233. [Google Scholar] [CrossRef]
  15. Yang, W.; Wang, M.; Sheng, X.; Zhang, Q.; Huang, L. Precipitate characteristics and selected area diffraction patterns of the β′ and Q′ precipitates in Al-Mg-Si-Cu alloys. Philos. Mag. Lett. 2011, 91, 150–160. [Google Scholar] [CrossRef]
  16. Yang, W.; Wang, M.; Zhang, R.; Zhang, Q.; Sheng, X. The diffraction patterns from β″ precipitates in 12 orientations in Al-Mg-Si alloy. Scr. Mater. 2010, 62, 705–708. [Google Scholar] [CrossRef]
  17. Kuijpers, N.C.W.; Vermolen, F.J.; Vuik, C.; Koenis, P.T.G.; Nilsen, K.E.; van der Zwaag, S. The dependence of the β-AlFeSi to α-Al(FeMn)Si transformation kinetics in Al-Mg-Si alloys on the alloying elements. Mater. Sci. Eng. A 2005, 394, 9–19. [Google Scholar] [CrossRef]
  18. Werinos, M.; Antrekowitsch, H.; Ebner, T.; Prillhofer, R.; Curtin, W.A.; Uggowitzer, P.J.; Pogatscher, S. Design strategy for controlled natural aging in Al-Mg-Si alloys. Acta Mater. 2016, 118, 296–305. [Google Scholar] [CrossRef]
  19. Aruga, Y.; Kozuka, M.; Takaki, Y.; Sato, T. Formation and reversion of clusters during natural aging and subsequent artificial aging in an Al-Mg-Si alloy. Mater. Sci. Eng. A 2015, 631, 86–96. [Google Scholar] [CrossRef]
  20. Ding, L.; Jia, Z.; Zhang, Z.; Sanders, R.E.; Liua, Q.; Yang, G. The natural aging and precipitation hardening behaviour of Al-Mg-Si-Cu alloys with different Mg/Si ratios and Cu additions. Mater. Sci. Eng. A 2015, 627, 119–126. [Google Scholar] [CrossRef]
  21. Mrówka-Nowotnik, G.; Sieniawski, J. Influence of heat treatment on the microstructure and mechanical properties of 6005 and 6082 aluminium alloys. J. Mater. Process. Technol. 2005, 162–163, 367–372. [Google Scholar] [CrossRef]
  22. Marioara, C.D.; Andersen, S.J.; Jansen, J.; Zandbergen, H.W. The influence of temperature and storage time at RT on nucleation of the β″ phase in a 6082 Al-Mg-Si alloy. Acta Mater. 2003, 51, 789–796. [Google Scholar] [CrossRef]
  23. Liu, C.H.; Lai, Y.X.; Chen, J.H.; Tao, G.H.; Liu, L.M.; Ma, P.P.; Wu, C.L. Natural-aging-induced reversal of the precipitation pathways in an Al-Mg-Si alloy. Scr. Mater. 2016, 115, 150–154. [Google Scholar] [CrossRef]
  24. Zhong, H.; Rometsch, P.A.; Wu, X.; Cao, L.; Estrin, Y. Influence of pre-ageing on the stretch formability of Al-Mg-Si automotive sheet alloys. Mater. Sci. Eng. A 2017, 697, 79–85. [Google Scholar] [CrossRef]
  25. Zhong, H.; Rometsch, P.A.; Zhuc, Q.; Cao, L.; Estrin, Y. Effect of pre-ageing on dynamic strain ageing in Al-Mg-Si alloys. Mater. Sci. Eng. A 2017, 687, 323–331. [Google Scholar] [CrossRef]
  26. Wenner, S.; Nishimura, K.; Matsuda, K.; Matsuzaki, T.; Tomono, D.; Pratt, F.L.; Marioara, C.D.; Holmestad, R. Muon kinetics in heat treated Al (-Mg)(-Si) alloys. Acta Mater. 2013, 61, 6082–6092. [Google Scholar] [CrossRef]
Figure 1. Hardness curve of artificial aging (AA) specimens.
Metals 09 00173 g001
Figure 2. Tensile strength and elongation of AA specimens.
Metals 09 00173 g002
Figure 3. Fracture morphology of AA specimens. (a) 4 h/175 °C; (b) 8 h/175 °C; (c) 14 h/175 °C; (d) 24 h/175 °C.
Metals 09 00173 g003
Figure 4. Secondary electron scan (SEM) micrographs (a), electron backscattered diffraction (EBSD) image (b) and energy dispersive spectrometer (EDS) spectra analysis of peak aging alloys, (c) Phase A: irregular block; (d) Phase B: granular phase/graininess.
Metals 09 00173 g004
Figure 5. SEM micrographs of AA specimens. (a) 4 h; (b) 8 h; (c) 14 h; (d) 24 h; (e) 72 h; (f) 96 h.
Metals 09 00173 g005
Figure 6. Images with the corresponding selected area diffraction patterns (SADPs) of AA specimens: (a) 4 h; (b) 8 h; (c) 24 h; (d) 96 h.
Metals 09 00173 g006
Figure 7. Hardness curve of the alloys treated with two different aging.
Metals 09 00173 g007
Figure 8. Tensile mechanical properties of the alloys treated with two different aging: (a) ultimate tensile strength; (b) yield strength; (c) elongation.
Metals 09 00173 g008
Figure 9. Fracture morphology of the alloys treated with two different aging. (a,c,e) delayed aging specimens; (b,d,f) pre-aging specimens. (a,b) 1 h; (c,d) 12 h; (e,f) 24 h.
Metals 09 00173 g009
Figure 10. SEM micrographs of delayed aging specimens. (a) 1 h; (b) 8 h; (c) 12 h; (d) 20h; (e) 24 h; (f) 48 h.
Metals 09 00173 g010
Figure 11. SEM micrographs of the pre-aging specimens: (a) 1 h; (b) 12 h; (c) 24 h; (d) 48 h.
Metals 09 00173 g011
Figure 12. Images with the corresponding SADPs of N + A and P + N + A specimens. (a,c,d) N + A; (b,d,f) P + N + A; and stored in RT for (a,b) 1 h; (c,d) 12 h; (e,f) 48 h.
Metals 09 00173 g012
Table 1. Chemical composition of the experimental 6082 alloy.
ElementMgSiMnFeCrAl
wt %0.91.00.550.20.1297.23
Table 2. Aging processes after solution treatment. The artificial aging (AA), natural aging before AA (N + A), pre-aging before N + A (P + N + A) are single-stage aging, delayed aging, and pre-aging treatment, respectively.
Sample CategoryHeat Treatment Process
AAAA for hours (from 1 h to 96 h)
N + ANA for hours (from 30 mins to 48 h) and AA for 8 h
P + N + APre-aging, NA for hours (from 30 mins to 48 h) and AA for 8 h