Article

Influence of Size on the Fractal Dimension of Dislocation Microstructure

Department of Mechanical and Aerospace Engineering, University of California Los Angeles, Los Angeles, CA 90095, USA
*
Author to whom correspondence should be addressed.
Metals 2019, 9(4), 478; https://doi.org/10.3390/met9040478
Submission received: 29 March 2019 / Revised: 19 April 2019 / Accepted: 20 April 2019 / Published: 25 April 2019
(This article belongs to the Special Issue Dislocation Mechanics of Metal Plasticity and Fracturing)

Abstract

:
Three-dimensional (3D) discrete dislocation dynamics simulations are used to analyze the size effect on the fractal dimension of two-dimensional (2D) and 3D dislocation microstructure. 2D dislocation structures are analyzed first, and the calculated fractal dimension ( n 2 ) is found to be consistent with experimental results gleaned from transmission electron microscopy images. The value of n 2 is found to be close to unity for sizes smaller than 300 nm, and increases to a saturation value of ≈1.8 for sizes above approximately 10 microns. It is discovered that reducing the sample size leads to a decrease in the fractal dimension because of the decrease in the likelihood of forming strong tangles at small scales. Dislocation ensembles are found to exist in a more isolated way at the nano- and micro-scales. Fractal analysis is carried out on 3D dislocation structures and the 3D fractal dimension ( n 3 ) is determined. The analysis here shows that ( n 3 ) is significantly smaller than ( n 2 + 1 ) of 2D projected dislocations in all considered sizes.

1. Introduction

Dislocations are the main carriers of plastic deformation in crystals. Within the framework of crystal plasticity theory, dislocations are generally described by their density. Key mechanical properties were found to correlate with the concept of density, for example the Taylor hardening law, which states that the critical resolved shear stress is proportional to the square root of the dislocation density. To account for size effects on plastic deformation, further refinements have led to the distinction between geometrically necessary and statistically stored components. This distinction allows consideration of the role of dislocation accumulation in accommodating an imposed deformation gradient and the development of strain gradient plasticity theory. The spatial consideration of gradients in the dislocation density resulted in successful interpretation of the size effect in micro-bending and micro-torsion tests. Going beyond this mean-field description through the concept of dislocation density, the complex spatial features of the dislocation structure have also attracted considerable interest [1,2,3,4,5,6,7,8,9]. The formation of planar dislocation arrays is known to be a prelude to micro shear banding, while the entanglement of dislocations can lead to greater work-hardening, and the size of dislocation cells may be a reflection of creep strength [10,11,12]. Therefore, effective description of the dislocation structure is important for building the relationship between microstructure and the mechanical behavior. Some typically observed dislocation pattern morphology includes ladder, labyrinth, wall, and cell structures, which depend on the material, loading condition, and temperature, etc. Complete quantitative characterization of the dislocation structure is very difficult because the large number of parameters that may be necessary [13]. Investigation of the common features from a statistical perspective leads to a practical way to describe complicated dislocation structures in a simple way. An interesting finding is the fractal nature of dislocation structures [13,14,15,16] as a measure of structural complexity and spatial packing.
Fractals generally reflect statistical self-similarity. Specifically, spatial features look similar at any scale. This implies scale-free physics. In addition, geometrical structures have features at all length scales. One typical example to gain an intuitive idea is the measurement of the length of a coastline [17]. When one uses a very large ruler to measure the length, one obtains a smaller estimate of the length than using a fine ruler, which can capture more details on the smaller scale [18]. The measured length L is expressed by the number of scale (ruler) units N ( Δ x ) . Here, each unit has the length of the ruler size Δ x . A power law relation is observed between N and the ruler size Δ x as N Δ x n . The absolute value of the corresponding power law exponent is defined as a fractal dimension n. n can be non-integer values. This idea can be extended to two-dimensional (2D) and three-dimensional (3D) systems, by tuning the dimensionality of the ruler. For ordinary geometric shapes, the theoretical fractal dimension is equal to its topological dimension. For a fractal geometry, the fractal dimension exceeds its topological dimension. The fractal dimension quantifies the complexity as a ratio of the change in detail to the change in scale.
The plastic deformation of a material is a highly complex spatio-temporal phenomenon. The complexity of the underlying dynamics is mainly associated with the nonlinear evolution of collective dislocations. In the temporal scale, it is manifested as the emergence of strain burst and dislocation avalanches [8]. In the spatial scale, this leads to a non-uniform, non-isotropic, and non-random dislocation distributions [19]. Regular, periodic, or nearly periodic dislocation patterns, such as persistent slip bands with a well-defined pattern wavelength [13], are not fractal patterning. However, the widely observed dislocation cellular structure generally exhibits a clear fractal geometry, which implies scale invariance of the spatial arrangement of dislocations at a given deformation state. The fractal dimension measures the space-filling capacity and the complexity of a dislocation pattern [7]. As summarized in Table 1, the fractal dimension of cellular dislocation patterns depends on strain value [20] and stress level. During the initial stages of deformation, the dislocation structure evolves significantly before a relatively stable dislocation structure is formed. The fractal dimension gradually increases at first, and then reaches a relatively stable value with increasing strain [16,20]. When the strain is close to the onset of necking, the fractal dimension of the bulk dislocation structure starts to gradually drop, because the structure becomes progressively more ordered as fracture is approached [20]. This leads to the possibility of linking the variation of the fractal dimension of the dislocation structure with strain, which may contribute to the development of a constitutive law. When the external size of the material decreases to several microns, the fractal dimension also shows dependence on the sample size [16].
The fractal feature of the dislocation microstructure is generally studied based on the analysis of transmission electron microscopy (TEM) or scanning transmission electron microscopy (STEM) micrographs [13,16]. An analysis method based on box-counting will be described in detail in Section 2. Other alternative measurement methods are referred to in reference Zaiser et al. [13]. As we know, TEM or STEM images can be considered to be 2D projections of the actual 3D dislocation microstructure. Most of existing theoretical model used to describe the fractal feature of dislocations also mainly focuses on 2D problems, as summarized in Table 1. Then, an interesting question is whether the fractal behavior can be observed for the actual 3D dislocation microstructure? If yes, then a follow-up question would be how the external size influences the fractal behavior of 3D dislocation structure? Till now, reconstruction of the 3D dislocation microstructure through experimental data is still very difficult. Only recently, some efforts of visualizing 3D dislocation structure have been spent by using X-ray tomography [27], using the electron beam tomography method through tilting samples while maintaining proper diffraction condition [28,29,30], or using scanning electron microscope serial sectioning method [31]. However, the obtained 3D dislocation structure information is still limited and not used to check their fractal behavior yet. On the other hand, discrete dislocation dynamics (DDD) simulations represent a powerful tool to investigate the formation of dislocation structure by considering the short-range and long-range dislocation interactions and external load conditions [32,33,34]. 2D-DDD reproduces the fractal dislocation structures in multiple slip [15]. It is also found that self-similar dislocation patterns form without dislocation climb, but cellular structures with well-defined characteristic lengths are observed with dislocation climb [26]. To our knowledge, 3D-DDD is not used to investigate the fractal nature of dislocation structures yet due to the significant computational expense when simulating highly tangled dislocation cells. Therefore, it is not clear whether 3D dislocation structures self-organize into fractal features through junction formation, pile-ups, cross-slip events, etc.
Based on the considerations above, the current work aims to answer two questions. The first is whether a 3D dislocation structure exhibits well-defined fractal features. The second is how the sample size influences the fractal behavior of 2D projected dislocation structures and actual 3D space-filling tangles. In Section 2, the investigation method is described. Simulation results and discussions are given in Section 3, while Section 4 summarizes the results of the present investigation.

2. Investigation Method

The computational method of 3D-DDD is employed here as one component of the MoDELib (Mechanics of Defect Evolution Library) software system [35], described in detail in our previous papers [36,37]. In this 3D-DDD approach, curved dislocation lines are discretized into a succession of parametrized segments. Boundary conditions and image forces are considered by coupling with an FEM solution of an elasticity problem using the superposition principle [37]. 3D-DDD simulations of tension tests of Fe micropillars along the 001 direction at 320 K are carried out. Pillar diameter varied in the range 300–1500 nm, with the ratio of height and diameter be equal to 2. To tune the extent of deformation localization, we introduce irradiation defects, with defect density range of 10 21 3 × 10 22 m 3 . Irradiation defects themselves are not considered when discussing the fractal behavior of dislocation structures. More details on the simulation set-up and descriptions are given in [33,38,39,40].
The fractal behavior is investigated by the box-counting method [13,16]. The basic idea of box-counting method is that the space is discretized into a large amount of non-overlapping small grids. If the dislocation line passes through a specific grid “pixel”, it is marked as 1, otherwise, the pixel is marked as 0. For example, for the 2D case shown in Figure 1, the filled pixels are marked as 1, and white pixels are marked as 0. In previous work, such information is mainly obtained by post processing experimental images, which is limited by the image resolution. The calculation here is directly based on the information of dislocation segment positions, which allows for very high spatial resolution, and is also applicable to the 3D case. Please note that because we check the intersection of the dislocation line with the grid pixel, instead of only using the information of the ending points of dislocation segments, the calculation is not sensitive to the discretization of the dislocation lines. In addition, we verified with this method the fractal dimension of a perfect circular dislocation loop, and found its fractal dimension to be 1, which is the same as that of straight dislocation line. This implies that the dislocation curvature itself does not have influence on the calculation of the fractal dimension.
When analyzing the 2D dislocation structure, the 3D dislocation positions are projected along a specific direction ([010] direction is chosen here) to a 2D plane, to compare with the results of TEM images obtained experimentally. Here, we ignore the details of TEM imaging condition. For example, when the dot product of diffraction vector and the burgers vector is zero, the dislocations are invisible. In addition, the considered sizes are close to the allowable thickness of TEM samples, so it is reasonable to consider the projection of all the dislocation structures. The current projected 2D dislocation structure information should still be a very good approximation to the one that will be observed by TEM. After obtaining this information, the number of grids N ( Δ x ) those contain dislocations (grids marked as 1) is calculated as a function of the grid size Δ x . The fractal dimension can be calculated according to the slope of double-logarithmic plot of N ( Δ x ) vs. Δ x .

3. Results and Discussion

The simulation results are given in Figure 2 for 2D and 3D dislocation structures in deformed Fe pillars with different sizes, when the applied strain is 1.5%. In the following, we will first analyze the results corresponding to 2D case, and compare with the available experimental results to validate the effectiveness of our calculation and study the size effect.
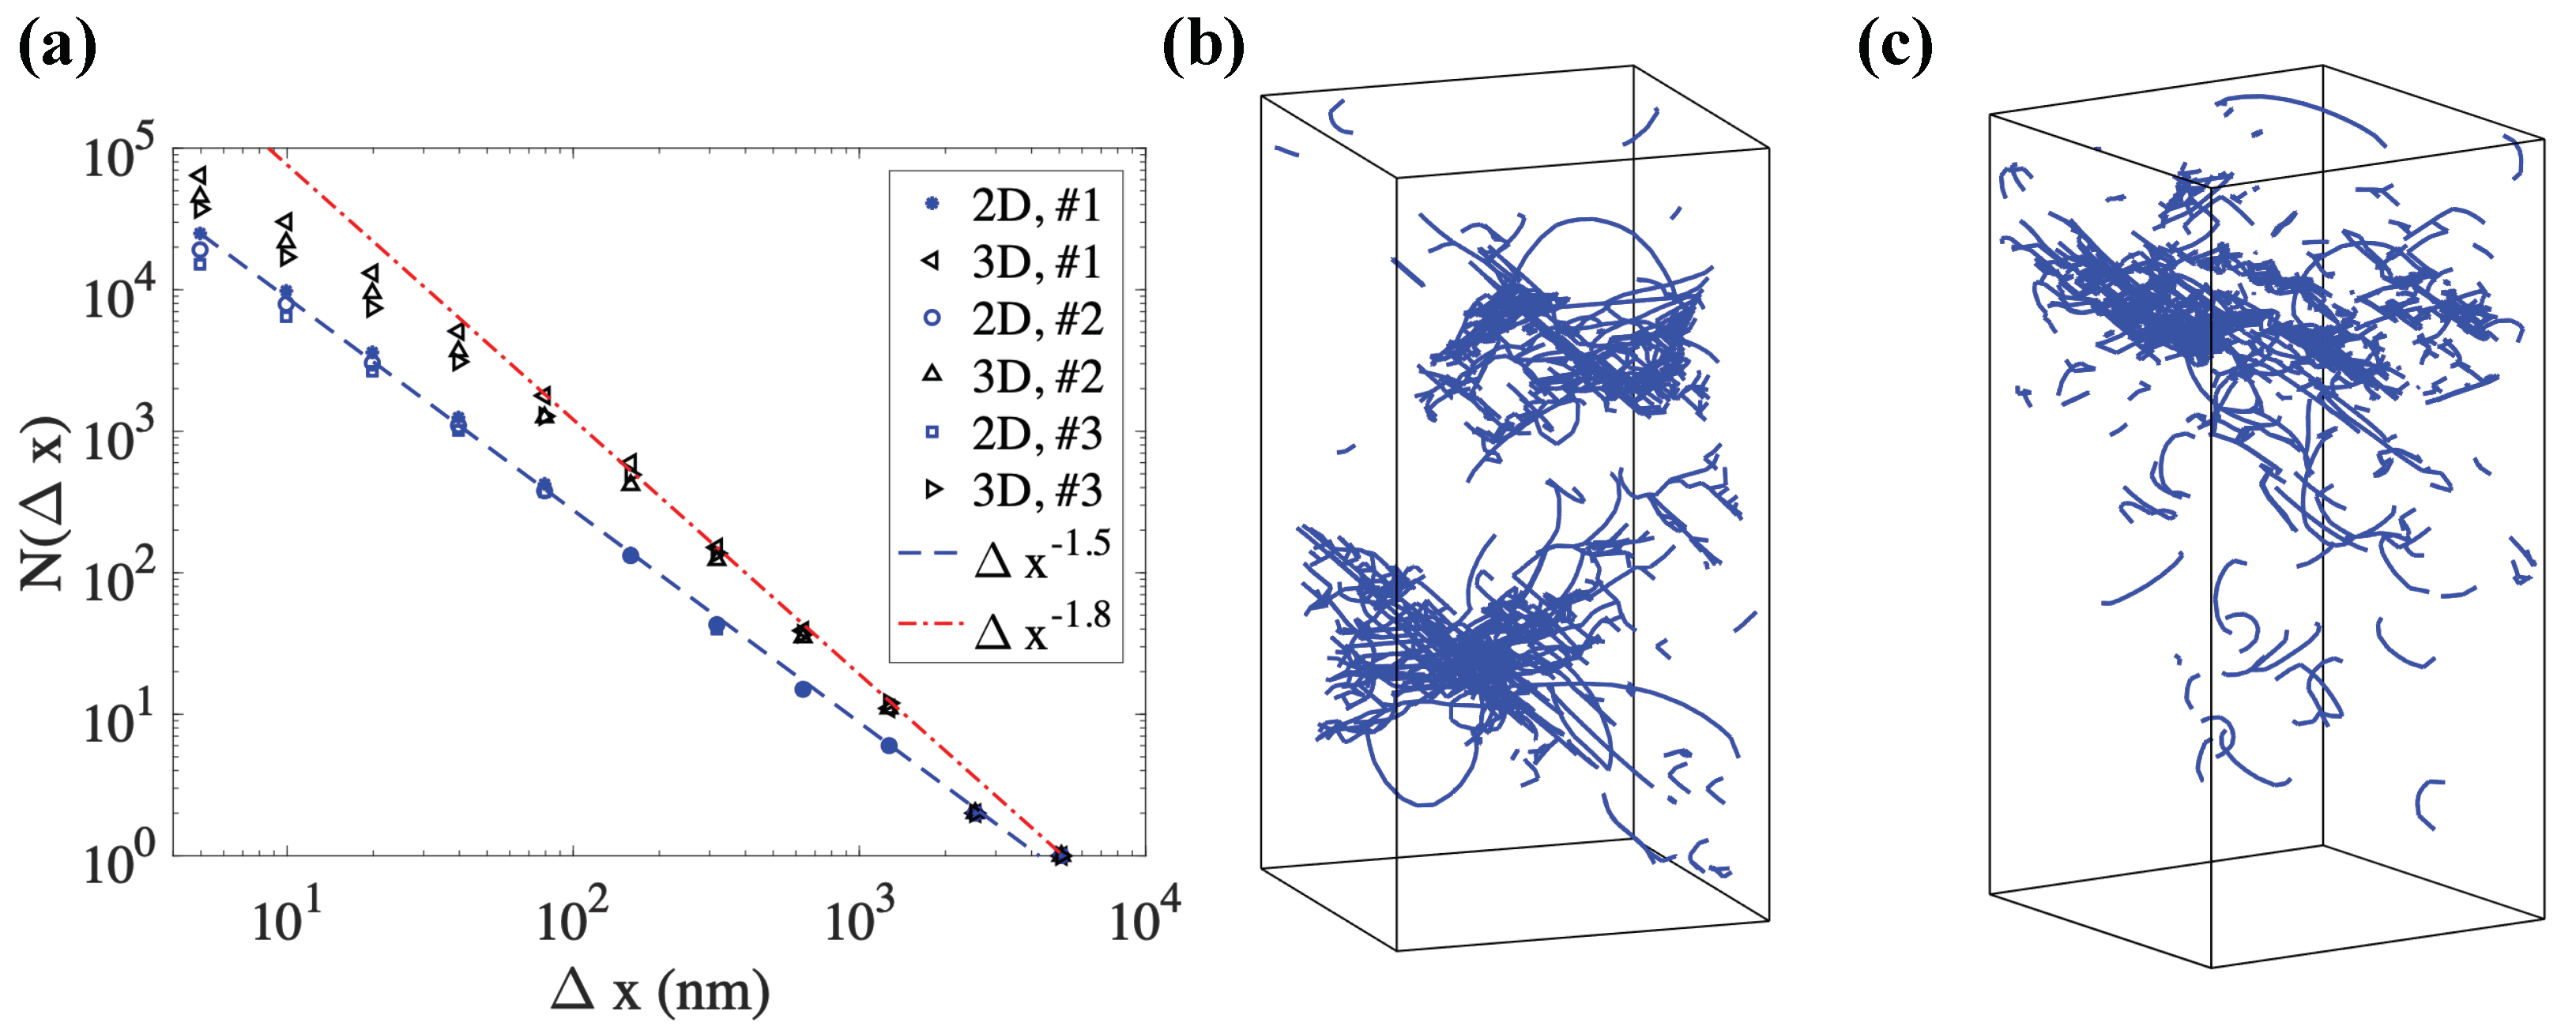
It is found that when the sample size is as large as 1.5 microns, very good linear behavior is observed in the double-logarithmic plot of N ( Δ x ) versus Δ x in Figure 2c for 2D box-counting data. A scaling regime with fractional slope of 1.5 extends over almost three orders of magnitude (blue dashed line in Figure 2c. This implies a fractal nature of the dislocation structure, and the corresponding fractal dimension is 1.5. The corresponding dislocation configuration is shown in Figure 2b. One can observe strong dislocation tangles, many small dislocation loops due to dislocation cross-slip and jog formation, and some truncated dislocation lines around the free surface. Previous studies mainly discussed the fractal behavior induced by the multiple dislocation cellular structures. In Figure 2b, even though there are no traditional multiple dislocation cells, the highly tangled dislocation structure exhibits a tree shape, which leads to its fractal behavior. This observation is similar to the experimental image shown in Figure 3 in [16]. To check the sensitivity of the fractal dimensions on the initial dislocation structure and the extent of deformation localization, two other cases are studied, as shown in Figure 3. The results in Figure 3a for #1 is the one shown in Figure 2c. Figure 3a clearly show that for large sample size, the fractal dimension is not sensitive to the initial dislocation structure.
Figure 2e,f shows the results for an Fe pillar with diameter 1 micron. Compared with Figure 2b, the extent of dislocation tangle is much weaker. The calculated fractal dimension also decreases to 1.2. With further reduction of the sample size, only isolated dislocation lines are observed, as shown in Figure 2h,k. This kind of low dislocation line content is widely observed during compression experiments of nanopillars [41]. This is a result of the ease of dislocation glide out of the crystal through the free surface in such small materials. From Figure 2i,l, even though the double-logarithmic plot of N ( Δ x ) versus Δ x still shows approximate linear behavior, the calculated exponent is close to unity. When the exponent is close to unity for a 2D image, dislocations are essentially isolated lines, and no fractal behavior exists anymore.
To further compare with the experimental results obtained from TEM images for similar sample sizes, we plot the calculated fractal dimension as a function of sample sizes obtaining from our simulations and recent experimental data in Figure 4. It can be seen that our calculation results agree very well with the experimental results. This clearly demonstrates that reducing the sample size leads to the decrease of the fractal dimension, and the fractal feature of dislocation structures disappears when the sample size is smaller than about 600 nm. The analysis above implies that only when some kind of tangled dislocation structures are observed, the fractal behavior is possible to exist.
Now we check whether a similar trend exits for 3D dislocation structures as they fill space. As shown in Figure 2c,f,i,l, the scaling regime identified for 3D dislocation structures is shorter than that for the 2D case for the considered sizes. Moreover, the absolute value of the slope for the double-logarithmic plot of N ( Δ x ) versus Δ x is smaller than 2. Generally, if the fractal dimension is n for 2D case, its corresponding fractal dimension is n + 1 for the 3D case, if the structure is extended along the projection direction. This is also widely used to extract the fractal dimension of dislocation structures from 2D results to 3D results [24]. This is true if one uses 2D-DDD, if the calculated fractal dimension is n, its 3D corresponding dimension is n + 1 , because each point in 2D-DDD correspond to an infinite long straight edge dislocation lines. However, the actual 3D dislocation structure is not the perfect elongation along the projection direction. Therefore, from Figure 2c,f,i,l, one observes that the fractal dimension of 3D dislocation structure is much smaller than one plus the fractal dimension for 2D case, and the fractal behavior in 3D is not as well-defined as the 2D case.
When the sample size is as large as 1.5 microns, most of the 3D box-counting data follows the scaling law with exponent 1.8 . Therefore, it is reasonable to say that the fractal dimension of 3D dislocation structure in 1.5 micron diameter pillar is 1.8. From Figure 2a and Figure 3b,c, the highly tangled dislocation configuration is similar to the feature of a tree (see Figure 2a) due to the formation of numerous junctions and jogs, and the occurrence of cross-slip. Therefore, it is natural to think of comparing the calculated fractal dimension with that of a tree. The fractal analysis of the 2D projected and 3D actual tree structure is recently investigated in [42] using box-counting method. The fractal dimension of the 2D projected tree in their studies ranges from 1.69 to 1.94, but the fractal dimension of the corresponding 3D tree ranges from 1.86 to 2.32. This is similar to our observation that the fractal dimension for 3D case is possible to be smaller than 2, and is much smaller than one plus the fractal dimension in 2D. Going back to dislocation configurations, the transition from 2D projected image to 3D dislocation structure is actually similar to the process of pulling up some tangled ropes on the ground. For two dislocation lines, if they do not intersect with each other in 3D, it is still possible to see that their 2D projected lines intersect. Due to 2D projection overlapping, some of the spatial correlations observed in 2D projection image may actually do not exist in 3D. Therefore, it is difficult to observe fractal dimension for 3D case is one plus that of 2D projected dislocations.
When the sample size decreases to be 1 micron, two power law scaling regimes are observed. For the small box size regime, the power law exponent is close to that of 2D dislocations, because the contribution of the isolated dislocation lines is independent of the observation dimensionality. For the large box size regime, the power law exponent is 1.7 , which is similar to the fractal dimension of the 1.5 micron diameter pillar. This is contributed by the tangled dislocation structures. For sample size equal to or smaller than 600 nm, most of the scaling regime of the data for 3D dislocation structure has the fractal slope similar to that of 2D projected dislocations. This is due to the lack of highly tangled dislocation structure. Dislocation lines mainly exist in an isolated way.

4. Conclusions

In the current work, the fractal features of dislocation structures in deformed Fe pillars are analyzed through three-dimensional DDD simulations using the box-counting method. It is found that the fractal feature can be well observed for 2D projected dislocation structures, as a result of tangle formation. The fractal dimension decreases with the decrease in the sample size, due to the smaller extent of dislocation entanglement. The results of the current simulations for 2D projected dislocation structures are consistent with experimental results obtained from TEM images. When the sample size is smaller than 300 nm, the fractal feature disappears due to the absence of tangled dislocations. Interestingly, 3D tangled dislocation structures are found to have fractal dimension of 1.7∼1.8, which is significantly smaller than expected from 2D analysis alone! This is explained by the fact that 2D projection overlapping leads to spurious dislocation intersections and correlation information that may not be physical. When the external size is smaller than 1000 nm, the fractal slope of 3D box-counting data is similar to that of 2D case, because the fractal dimension of an isolated line is independent of the observation dimensionality.
Further efforts are required to investigate the fractal nature of 3D dislocation structures using other kinds of statistical methods. The evolution of the fractal dimension as a function of strain and dislocation density and its relationship to pattern formation requires more intensive computer simulations to reveal these connections. This requires studies of deformed crystals with larger size and higher dislocation density. The effect of temperature and loading orientation on the fractal dimensions of dislocation structures is also interesting and deserves further studies, especially in BCC crystals where the temperature plays a more significant role.

Author Contributions

Y.C. and G.N. designed the research, discussed the results, and wrote the manuscripts. Y.C. performed the calculation. G.N. gave the constructive suggestions.

Funding

This research was funded by the National Science Foundation, Grant Numbers CMMI-1024353 and CMMI-1727740 at UCLA.

Acknowledgments

Appreciation is expressed to Ronald W. Armstrong and fellow guest editors for the kind invitation to contribute to the Special Issue on ”Dislocation Mechanics of Metal Plasticity and Fracturing”.

Conflicts of Interest

The authors declare no conflict of interest.

References

  1. Kratochvil, J. Dislocation pattern formation in metals. Rev. Phys. Appl. 1988, 23, 419–429. [Google Scholar] [CrossRef]
  2. Ghoniem, N.M.; Amodeo, R. Computer Simulaltion of Dislocation Pattern Formation; Trans Tech Publ.: Zurich, Switzerland, 1988; Volume 3. [Google Scholar]
  3. Sandfeld, S.; Zaiser, M. Pattern formation in a minimal model of continuum dislocation plasticity. Model. Simul. Mater. Sci. Eng. 2015, 23, 065005. [Google Scholar] [CrossRef] [Green Version]
  4. Groma, I.; Zaiser, M.; Ispánovity, P.D. Dislocation patterning in a two-dimensional continuum theory of dislocations. Phys. Rev. B 2016, 93, 214110. [Google Scholar] [CrossRef]
  5. Xia, S.; El-Azab, A. Computational modelling of mesoscale dislocation patterning and plastic deformation of single crystals. Model. Simul. Mater. Sci. Eng. 2015, 23, 055009. [Google Scholar] [CrossRef]
  6. Ngan, A.; Siu, K.; Leung, H.; Cheng, B. Dislocation patterning-meso-scale interactive behavior of dislocations studied through dislocation density-function dynamics. In Proceedings of the 2017 Materials Research Society (MRS) Spring Meeting & Exhibit, Phoenix, AZ, USA, 17–21 April 2017. [Google Scholar]
  7. Li, P.; Zhang, Z. Standing wave effect and fractal structure in dislocation evolution. Sci. Rep. 2017, 7, 4062. [Google Scholar] [CrossRef] [Green Version]
  8. Papanikolaou, S.; Cui, Y.; Ghoniem, N. Avalanches and plastic flow in crystal plasticity: An overview. Model. Simul. Mater. Sci. Eng. 2017, 26, 013001. [Google Scholar] [CrossRef]
  9. Cao, L.; Koslowski, M. Effect of microstructural uncertainty on the yield stress of nanocrystalline nickel. Acta Mater. 2013, 61, 1413–1420. [Google Scholar] [CrossRef]
  10. Lyu, D.; Li, S. A multiscale dislocation pattern dynamics: Towards an atomistic-informed crystal plasticity theory. J. Mech. Phys. Solids 2019, 122, 613–632. [Google Scholar] [CrossRef]
  11. Irastorza-Landa, A.; Van Swygenhoven, H.; Van Petegem, S.; Grilli, N.; Bollhalder, A.; Brandstetter, S.; Grolimund, D. Following dislocation patterning during fatigue. Acta Mater. 2016, 112, 184–193. [Google Scholar] [CrossRef] [Green Version]
  12. Armstrong, R.W. Size effects on material yield strength/deformation/fracturing properties. J. Mater. Res. 2019, 1–16. [Google Scholar] [CrossRef]
  13. Zaiser, M.; Bay, K.; Hähner, P. Fractal analysis of deformation-induced dislocation patterns. Acta Mater. 1999, 47, 2463–2476. [Google Scholar] [CrossRef]
  14. Hornbogen, E. Fractals in microstructure of metals. Int. Mater. Rev. 1989, 34, 277–296. [Google Scholar] [CrossRef]
  15. Groma, I.; Bakó, B. Dislocation patterning: From micro-to mesoscale description. Phys. Rev. Lett. 2000, 84, 1487. [Google Scholar] [CrossRef] [PubMed]
  16. Zhao, X.; Wu, J.; Chiu, Y.; Jones, I.; Gu, R.; Ngan, A. Critical dimension for the dislocation structure in deformed copper micropillars. Scr. Mater. 2019, 163, 137–141. [Google Scholar] [CrossRef]
  17. Mandelbrot, B. How long is the coast of Britain? Statistical self-similarity and fractional dimension. Science 1967, 156, 636–638. [Google Scholar] [CrossRef] [PubMed]
  18. Bak, P. How Nature Works: The Science of Self-Organized Criticality; Springer: Berlin/Heidelberg, Germany, 2013. [Google Scholar]
  19. Iliopoulos, A. Complex systems: Phenomenology, modeling, analysis. Int. J. Appl. Exp. Math. 2016, 1, 105. [Google Scholar] [CrossRef] [PubMed]
  20. Vinogradov, A.; Yasnikov, I.; Estrin, Y. Evolution of fractal structures in dislocation ensembles during plastic deformation. Phys. Rev. Lett. 2012, 108, 205504. [Google Scholar] [CrossRef]
  21. Hähner, P.; Bay, K.; Zaiser, M. Fractal dislocation patterning during plastic deformation. Phys. Rev. Lett. 1998, 81, 2470. [Google Scholar] [CrossRef]
  22. Hähner, P.; Zaiser, M. Dislocation dynamics and work hardening of fractal dislocation cell structures. Mater. Sci. Eng. A 1999, 272, 443–454. [Google Scholar] [CrossRef]
  23. Sevillano, J.G.; Arizcorreta, I.O.; Kubin, L. Intrinsic size effects in plasticity by dislocation glide. Mater. Sci. Eng. A 2001, 309, 393–405. [Google Scholar] [CrossRef]
  24. Koslowski, M.; LeSar, R.; Thomson, R. Dislocation structures and the deformation of materials. Phys. Rev. Lett. 2004, 93, 265503. [Google Scholar] [CrossRef]
  25. Chen, Y.S.; Choi, W.; Papanikolaou, S.; Sethna, J.P. Bending crystals: Emergence of fractal dislocation structures. Phys. Rev. Lett. 2010, 105, 105501. [Google Scholar] [CrossRef]
  26. Bakó, B.; Hoffelner, W. Cellular dislocation patterning during plastic deformation. Phys. Rev. B 2007, 76, 214108. [Google Scholar] [CrossRef]
  27. Ludwig, W.; Cloetens, P.; Härtwig, J.; Baruchel, J.; Hamelin, B.; Bastie, P. Three-dimensional imaging of crystal defects bytopo-tomography’. J. Appl. Crystall. 2001, 34, 602–607. [Google Scholar] [CrossRef]
  28. Tanaka, M.; Honda, M.; Mitsuhara, M.; Hata, S.; Kaneko, K.; Higashida, K. Three-dimensional observation of dislocations by electron tomography in a silicon crystal. Mater. Trans. 2008, 49, 1953–1956. [Google Scholar] [CrossRef]
  29. Liu, G.; Robertson, I. Three-dimensional visualization of dislocation-precipitate interactions in a Al–4Mg–0.3 Sc alloy using weak-beam dark-field electron tomography. J. Mater. Res. 2011, 26, 514–522. [Google Scholar] [CrossRef]
  30. Chen, C.C.; Zhu, C.; White, E.R.; Chiu, C.Y.; Scott, M.; Regan, B.; Marks, L.D.; Huang, Y.; Miao, J. Three-dimensional imaging of dislocations in a nanoparticle at atomic resolution. Nature 2013, 496, 74. [Google Scholar] [CrossRef]
  31. Yamasaki, S.; Mitsuhara, M.; Ikeda, K.; Hata, S.; Nakashima, H. 3D visualization of dislocation arrangement using scanning electron microscope serial sectioning method. Scr. Mater. 2015, 101, 80–83. [Google Scholar] [CrossRef] [Green Version]
  32. Madec, R.; Devincre, B.; Kubin, L. Simulation of dislocation patterns in multislip. Scr. Mater. 2002, 47, 689–695. [Google Scholar] [CrossRef] [Green Version]
  33. Cui, Y.; Po, G.; Ghoniem, N. Size-Tuned Plastic Flow Localization in Irradiated Materials at the Submicron Scale. Phys. Rev. Lett. 2018, 120, 215501. [Google Scholar] [CrossRef]
  34. Arsenlis, A.; Cai, W.; Tang, M.; Rhee, M.; Oppelstrup, T.; Hommes, G.; Pierce, T.G.; Bulatov, V.V. Enabling strain hardening simulations with dislocation dynamics. Model. Simul. Mater. Sci. Eng. 2007, 15, 553. [Google Scholar] [CrossRef]
  35. Po, G.; Ghoniem, N. Mechanics of Defect Evolution Library, MODEL. Available online: https://bitbucket.org/model/model/wiki/home (accessed on 29 March 2019).
  36. Ghoniem, N.M.; Tong, S.H.; Sun, L. Parametric dislocation dynamics: A thermodynamics-based approach to investigations of mesoscopic plastic deformation. Phys. Rev. B 2000, 61, 913. [Google Scholar] [CrossRef]
  37. Po, G.; Mohamed, M.S.; Crosby, T.; Erel, C.; El-Azab, A.; Ghoniem, N. Recent Progress in Discrete Dislocation Dynamics and Its Applications to Micro Plasticity. JOM 2014, 66, 2108–2120. [Google Scholar] [CrossRef]
  38. Cui, Y.; Po, G.; Ghoniem, N.M. A coupled dislocation dynamics-continuum barrier field model with application to irradiated materials. Int. J. Plast. 2018, 104, 54–67. [Google Scholar] [CrossRef]
  39. Cui, Y.; Po, G.; Ghoniem, N. Suppression of Localized Plastic Flow in Irradiated Materials. Scr. Mater. 2018, 154, 34–39. [Google Scholar] [CrossRef]
  40. Po, G.; Cui, Y.; Rivera, D.; Cereceda, D.; Swinburne, T.D.; Marian, J.; Ghoniem, N. A phenomenological dislocation mobility law for bcc metals. Acta Mater. 2016, 119, 123–135. [Google Scholar] [CrossRef] [Green Version]
  41. Uchic, M.D.; Dimiduk, D.M.; Florando, J.N.; Nix, W.D. Sample dimensions influence strength and crystal plasticity. Science 2004, 305, 986–989. [Google Scholar] [CrossRef]
  42. Schurch, R.; González, C.; Aguirre, P.; Zuniga, M.; Rowland, S.M.; Iddrissu, I. Calculating the fractal dimension from 3D images of electrical trees. In Proceedings of the 2017 International Symposium on High Voltage Engineering, Buenos Aires, Argentina, 28 August–1 September 2017. [Google Scholar]
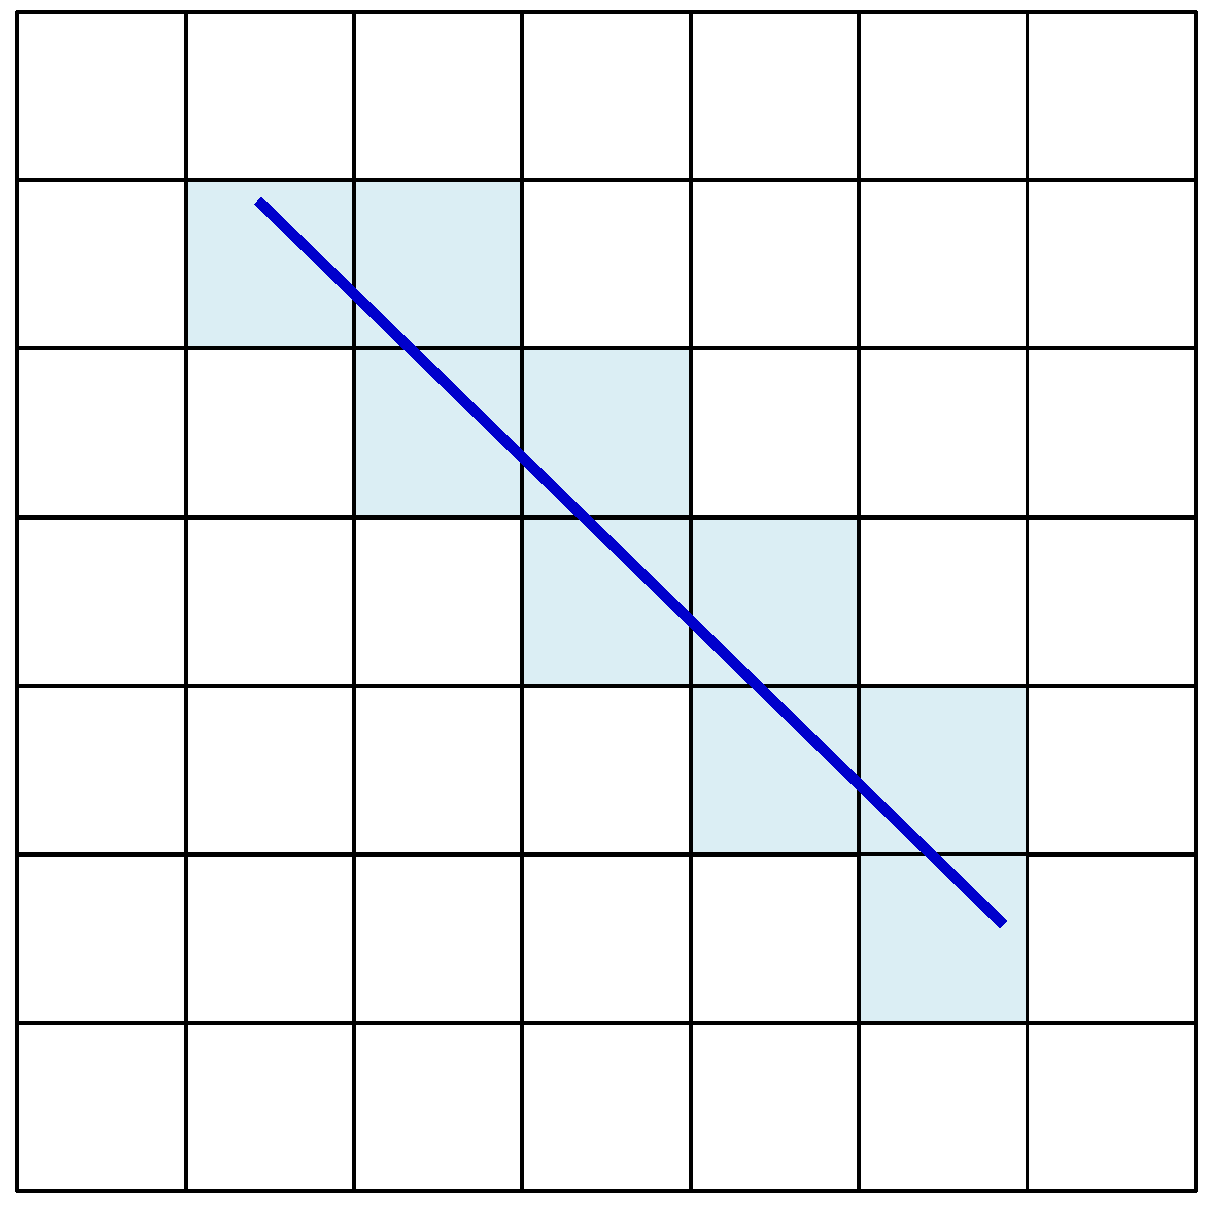
Figure 1. Schematic showing how to convert the dislocation line information into pixel image in binary format. The blue solid line is the dislocation line.
Metals 09 00478 g001
Figure 2. Effect of size and dimension on the fractal analysis of dislocation structure for irradiated Fe pillar with diameter (ac) 1500 nm (df)1000 nm, (gi) 600 nm, (jl) 300 nm.
Metals 09 00478 g002
Figure 3. (a) Insensitivity of the fractal dimension of dislocation structure in irradiated Fe pillar with diameter 1500 nm, (b) dislocation configuration # 2 , (c) dislocation configuration # 3 .
Metals 09 00478 g003
Figure 4. Size effect on the fractal dimension of dislocation microstructure. Experimental data are obtained from [16].
Metals 09 00478 g004
Table 1. Fractal dimension of dislocation cellular structures estimated through experiments or theoretical models.
Fractal Dimension nRemarksReference
1.64∼1.79TEM images of [100]-oriented Cu single crystal, n depends on stress.[13,21,22]
1.371∼1.695STEM images of [011]-oriented Cu, n depends on sizes and strain.[16]
1.332D dislocation glide through obstacles.[23]
0.9∼1.8Phase-field simulations, n initially increases with applied stress.[24]
1.5Using 2D continuum model for mesoscale plasticity.[25]
1.872D dislocation pattern simulation for FCC single crystals oriented
for multiple slip without climb under cyclic loading.
[26]