Abstract
In the process of complex engineering designs or optimizations, a large number of physical experiments or numerical simulations are required to evaluate certain performance qualities before a satisfactory result can be obtained. In both cases, constructing an approximate model is often necessary to provide a reliable response as an alternative to experiments or simulations. In this paper, three types of approximation models were developed and applied in a shape design of an aerofoil forging preform tool. Their modeling techniques are presented in detail. An optimal Latin hypercube technique was employed for the design of the experiment and sampling with the expected coverage of parameter space. Finite element (FE) simulations of multistep forging processes were implemented to acquire the objective function values for evaluating the forging performance. By a parametric study, the effects of design variables on objective responses and correlations were investigated for a clear insight into their functional nature. Comprehensive analyses and comparisons between different approximate models have been carried out. Finally, an optimization design of a preform tool was successfully achieved based on a particle swarm (PSO) algorithm combined with the proposed approximate model.
1. Introduction
The aeroengine blade is a product which is mainly formed by a hot forging process. It usually possesses a complicated shape, high dimensional accuracy, and superior mechanical performance. Considering the difficulty of blade forging technology, a multistage hot forging process is necessary to make the workpiece gradually approach a desired shape. An appropriate preform design often plays a key role in the forging of aerofoil blades. For a period of time, much attention has been paid to the shape-design of preform or correlative tools in forging optimizations. Substantial progress has been made in the area of multi-objective optimization for preform design through combinations with optimal theories or mathematical programming methods.
Sensitivity analysis as a gradient-based optimization algorithm has been widely used in many engineering fields. In this approach, a sensitivity function about the derivative of the optimal objective with respect to the shape variables should be established first and then calculated through finite element (FE) simulations. The key technique of a continuous sensitivity analysis integrated with the FE method was given in detail by Zabaras and his colleagues. They optimized some forging preforms based on different optimal objectives such as minimizing barreling in the upset of a cylinder [1], controlling grain size, improving the microstructure in the forming process [2], and so on. Compared with continuous sensitivity analysis, a discrete sensitivity analysis is easily applied to actual engineering problems because it does not need to be deeply coupled with numerical simulation code. Using a discrete sensitivity analysis, Gao [3] optimized the initial billet shape of a turbine disk in their consideration of improving microstructure as well as sufficient die-filling and saved material. Zhao [4] established a multi-objective function to optimize preform tools with decreased forging load and improved deformation uniformity. Generally speaking, a sensitivity analysis can get certain positive effects in the area of preform design and optimization. But it is quite difficult to establish a sensitivity function and integrate it with the FE simulation, which limits practical application to a certain degree.
Another possible shape optimization approach for preform design is the topology shape optimization, such as evolutionary structural optimization (ESO). In ESO, the shape of the forging preform is represented by discrete elements. During the iterative process, these elements are added or removed from an initial preform model based on a certain criterion. Then, the preform shape gradually evolves according to this criterion and tends to satisfy some engineering requirements. In recent years, some positive studies have been implemented in the forging of design and optimization based on the topological optimization method by the author [5,6,7]. A breakthrough in terms of the 3D forging optimization is also achieved [8]. At present, the topological optimization method is one of the rare ways to solve the 3D preform optimization problem to produce complicated shapes. However, it is uncertain whether the optimized results are global optimization solutions. The algorithmic rationality and reliability also need to be proved by further studies.
Genetic algorithm (GA), one of the global probabilistic search algorithms, is growing rapidly and has also been widely used in many engineering optimizations. Because of no coupling required between the numerical simulation and the optimization algorithm, the manipulation of the optimization process can be simplified significantly. Roy [9] earlier incorporated a genetic algorithm into the optimal design of a multi-stage forming process. Chung [10] optimized an extruded tool shape using a genetic algorithm. In order to solve the early convergence and inefficiency existing in the standard genetic algorithm, many updated GA-based algorithms have been introduced by improving the original evolutionary rules [11,12]. Guan [13] optimized the H-shape preforming die while pursuing a small grain size and a homogeneous grain distribution of forgings based on the micro-genetic algorithm. Knust [14] suggested an evolutionary algorithm to optimize a preform shape in consideration of the mass distribution and the shape complexity of preform. However, the biggest obstacle for further development of a genetic algorithm is still the lack of efficiency due to frequently executed numerical simulations for objective function evaluation during the optimization process.
In order to reduce the sampling quantities required for using of probabilistic selection algorithms, combined with the mathematical statistics and the numerical analysis, a metamodel (also named surrogate model) technique has been increasingly applied in the optimization iteration for quickly accessing the response of objective function. Trained by the limited sample data, a metamodel can be constructed to predict output objectives, substituting for a time-consuming simulation as long as it has enough approximation accuracy, which could sharply improve the optimization efficiency. At present, the main surrogate models used in shape optimization of forging preform or tool are based on response surface methodology [15,16], the Kriging model [17,18], or neural network [19,20]. Relevant introductions for algorithms can be referred to in the article [21]. However, any surrogate model is only an approximate replacement for the original system function. No matter which model is used, there must be errors between the predicted value and the real value. In consideration of the complexity of engineering problems, comprehensive analyses and comparisons between different surrogate models are very important for actual engineering optimization.
This study mainly focuses on the approximate accuracy when different surrogate models face a multi-objective engineering design optimization with complex nonlinearity. The optimization problem is first formulated as a mathematical modeling. Then, an optimal Latin hypercube sampling (LHS) technique is employed for the sampling plan, which provides uniform coverage of the design domain. A parameter study is implemented and is helpful for uncovering the implicit relationship between design variables and objective functions. Three typical surrogate models are developed to be utilized for predicting the objective responses. Error analyses are carried out to evaluate the reliability of these models in detail. Finally, according to the proposed surrogate model combined with a particle swarm algorithm, a design optimization of an aerofoil preform tool is implemented. The optimal result proves the validation of developed model.
2. Optimization Objectives and Design Variables
2.1. Optimization Objectives
A basic requirement for preform tool design is to ensure a successful preparation for preform which enables sufficient die-filling in the final forging process. So, the die-filling status as a constraint condition was considered to validate the design result:
where is the unfilled section area, is the desired section area, and a is the fault tolerance, 0.001, in this study.
Increasing deformation uniformity of a forged component is very significant for the achievement of a satisfactory microstructure status with improved mechanical properties. So, one of the objectives for preform optimization is the forging deformation uniformity. It can be described by:
where is standard deviation of the effective strain, is the effective strain of element i, is the average effective strain for all elements, and n is the number of elements. A smaller means overall increased deformation uniformity.
Due to severe plastic deformation, forging cracks often cause scrapped parts, especially in the forging of aerofoil blades. Reducing the probability of crack emergence is crucial for the improvement of forging quality and reliability. In the present study, the damage behavior of deformed materials was evaluated according to a Cockcroft and Latham ductile fracture criterion [22] described by:
where is the local cumulative damage value of element i, is the cumulative plastic stain, is the effective strain of element i, is the maximum principal stress of element i, and is the effective stress of element i. The average of 1% of the elements with the highest damage value as the second objective was employed to evaluate the damage degree of deformed material. This objective function can be obtained as follow:
The shape complexity of preform has significant effects on its preparation. To a close plane figure, shape complexity value C can be expressed by the ratio between the perimeter and the area of the preform profile:
where S is the area of the preform profile and L is the perimeter of the preform shape. In general, the smaller the C value is, the simpler the preform shape will be. Using this C value, the shape complexity of each preform design can be evaluated.
C = L/S
2.2. Design Variables
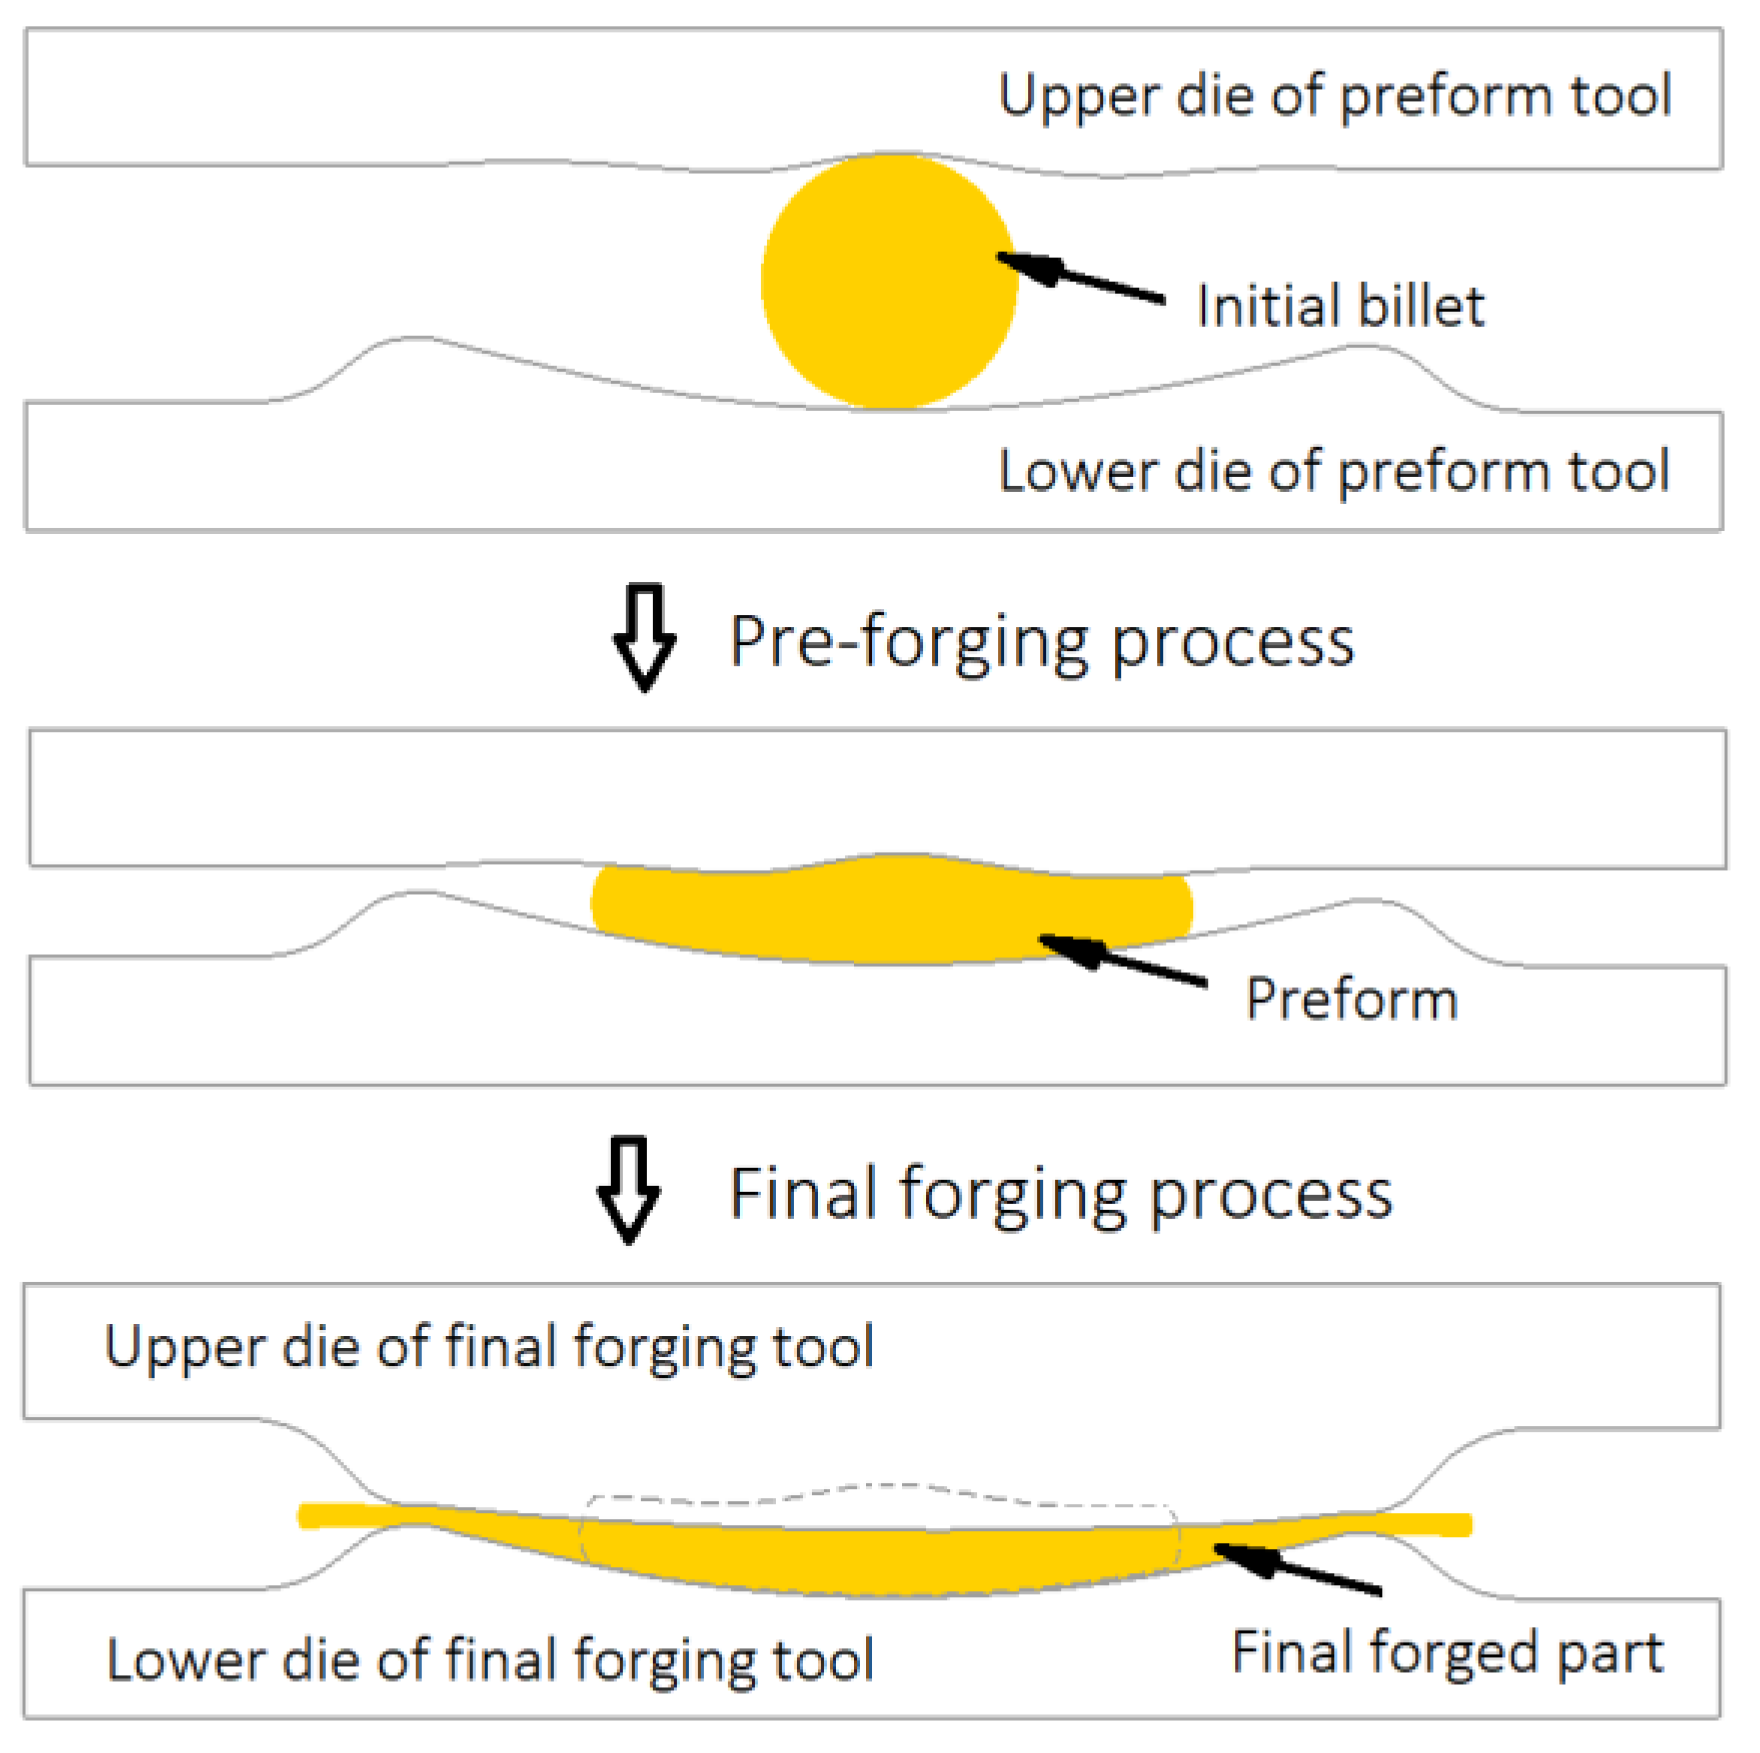
A standard forging process of aerofoil blades is illustrated in Figure 1. Concerning the formability and quality of forgings, two forging steps are necessary for relieving cumulative deformations.
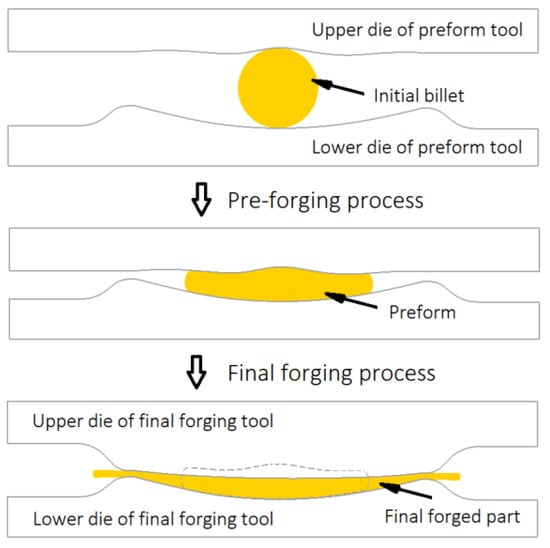
Figure 1.
Standard process flow of forging of aerofoil section.
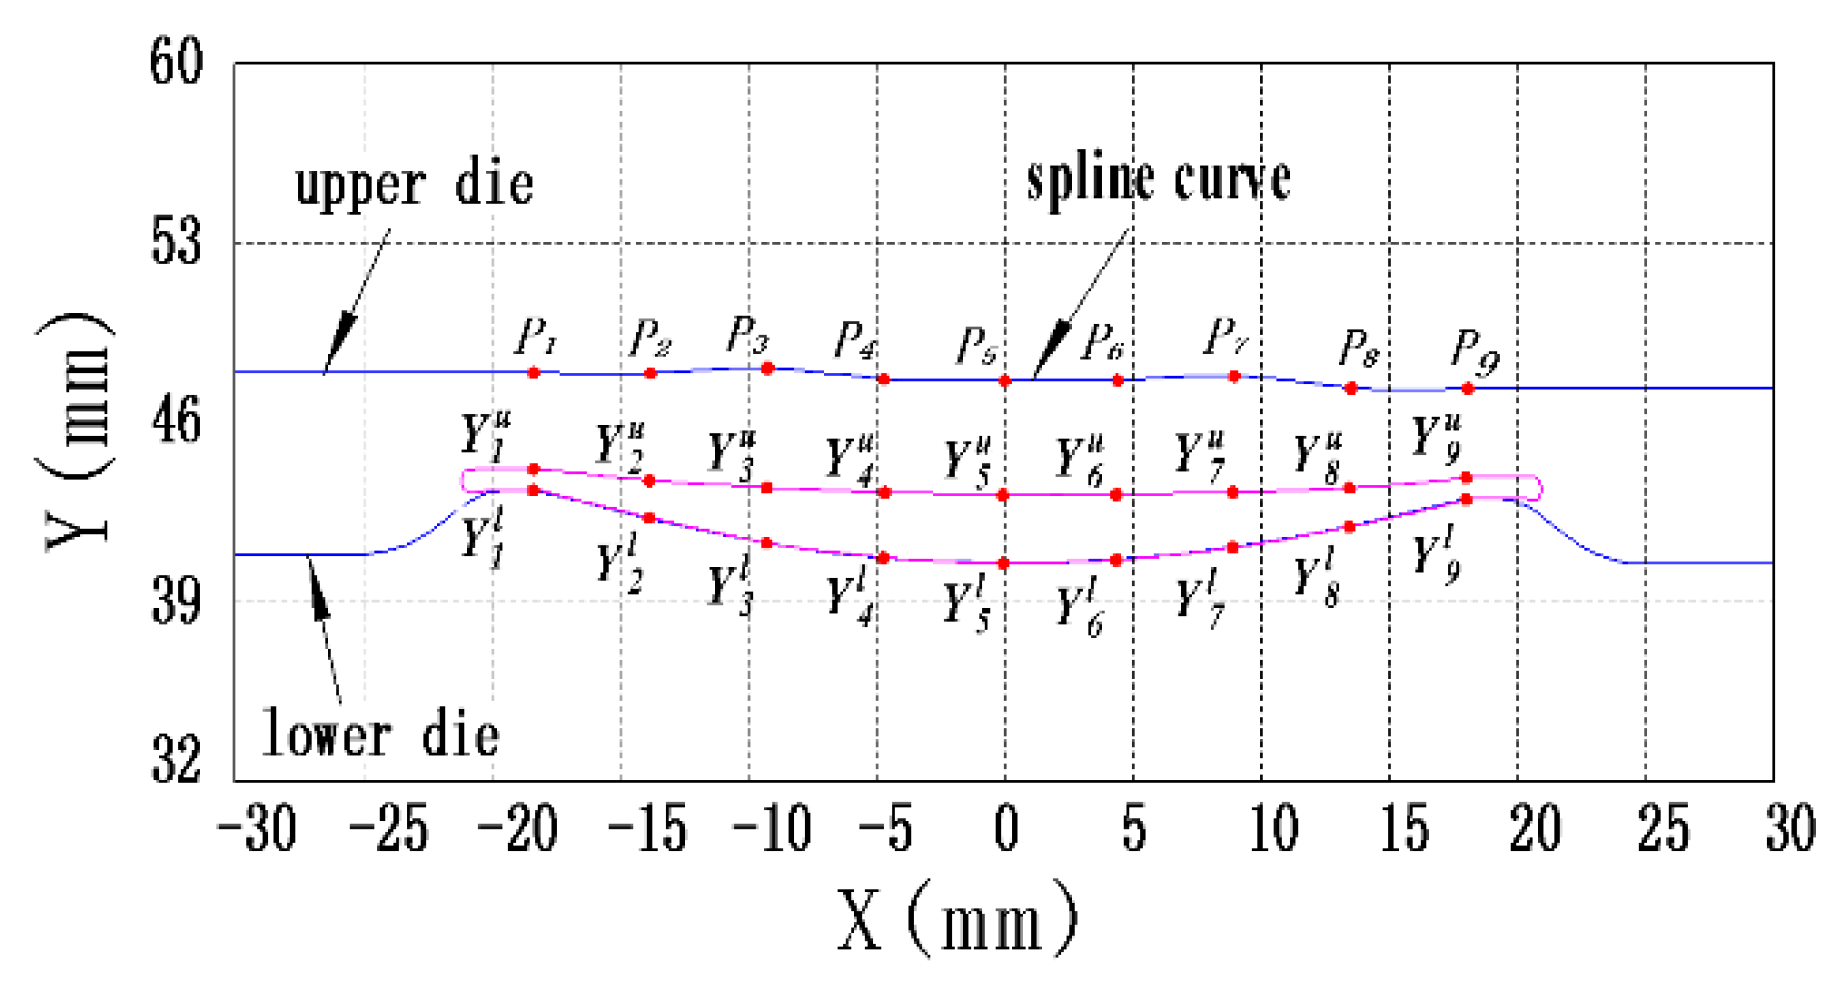
Considering the forging stability during the final forging process, the lower die shape of the preform tool was designed to be the same as the final forging tool. The upper die of the preform tool to be optimized is described by a spline curve shown in Figure 2. Nine data points Pj are denoted as design variables to define this spline curve. For decreasing the number of variables, X-axis coordinates of each data point are set as constants. In view of practical engineering, the engineering strain expressed as Equation (6) is confined between 0.2 and 0.4 in the deformed preform. Then, Y-axis coordinates of every data point can be confirmed, which gives the optimization range of each variable.
where is Y-axis coordinate of Pj to be optimized, is the corresponding Y-axis coordinate on upper surface of desired part, is the corresponding Y-axis coordinate on lower surface of desired part, and j is the serial number of data points.
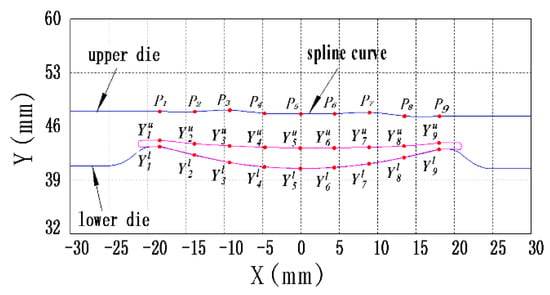
Figure 2.
Design variables for defining upper die of preform tool.
On condition of the plane strain assumption, the initial billet shape was characterized by a circular section with a total area of 105–115% of the desired forging section area for sufficient die-filling. The radius of the circular section r, taken as one of variables, could be optimized within a certain range.
As mentioned above, the shape optimization of preform tool can be formulated as follows:
3. FE Simulation
The Deform-2D commercial software (v11.3, Scientific Forming Technologies Corporation, Columbus, OH, USA) was utilized for the forging process simulations and the evaluations of objective function. The workpiece material treated as the rigid-viscoplastic model was Inconel718, a constitutive model which can be referred in the literature [23], while all forging tools were assumed as rigid. The spline curve interpolated by the data points Pj was updated during each optimal iteration, and then transformed into the FE geometry of preform tool. For decreasing the error of FE computation, a total of 5000 quadrilateral elements and a consistent meshing style, including remeshing treatment, with 20 rows and 250 columns were strictly applied to the preform model in FE simulation. The initial forging temperature of preform is 1020 °C and the die temperature is 250 °C. A shear friction type was employed for the friction calculation. The friction factor was set to 0.3. A heat transfer coefficient between workpiece and dies is defined to be 11 KW/m2/°C A convection coefficient between workpiece and environment is defined to be 0.02 N/sec/mm/°C. The upper die velocity was 200 mm/s and the low die was stationary in the forging simulation. The FE model for the forging process is illustrated in Figure 1.
4. Parameter Study
An Optimal Latin Hypercube Sampling (OLHS) technique [24] was proposed for the design of the experiment, which can make samples spread as evenly as possible within the space of variable combination. In general, the samples at least are necessary for fully covering this space. However, more samples are often needed for highly nonlinear problems. This m is the number of design variables (factors). With consideration of 10 factors (design variables) in this study, 66 samples with their corresponding objective values obtained by FE simulations were determined by using the OLHS method, and another one was created at random for supplement. All 67 initial sample data are shown in Table 1.

Table 1.
Initial sample data.
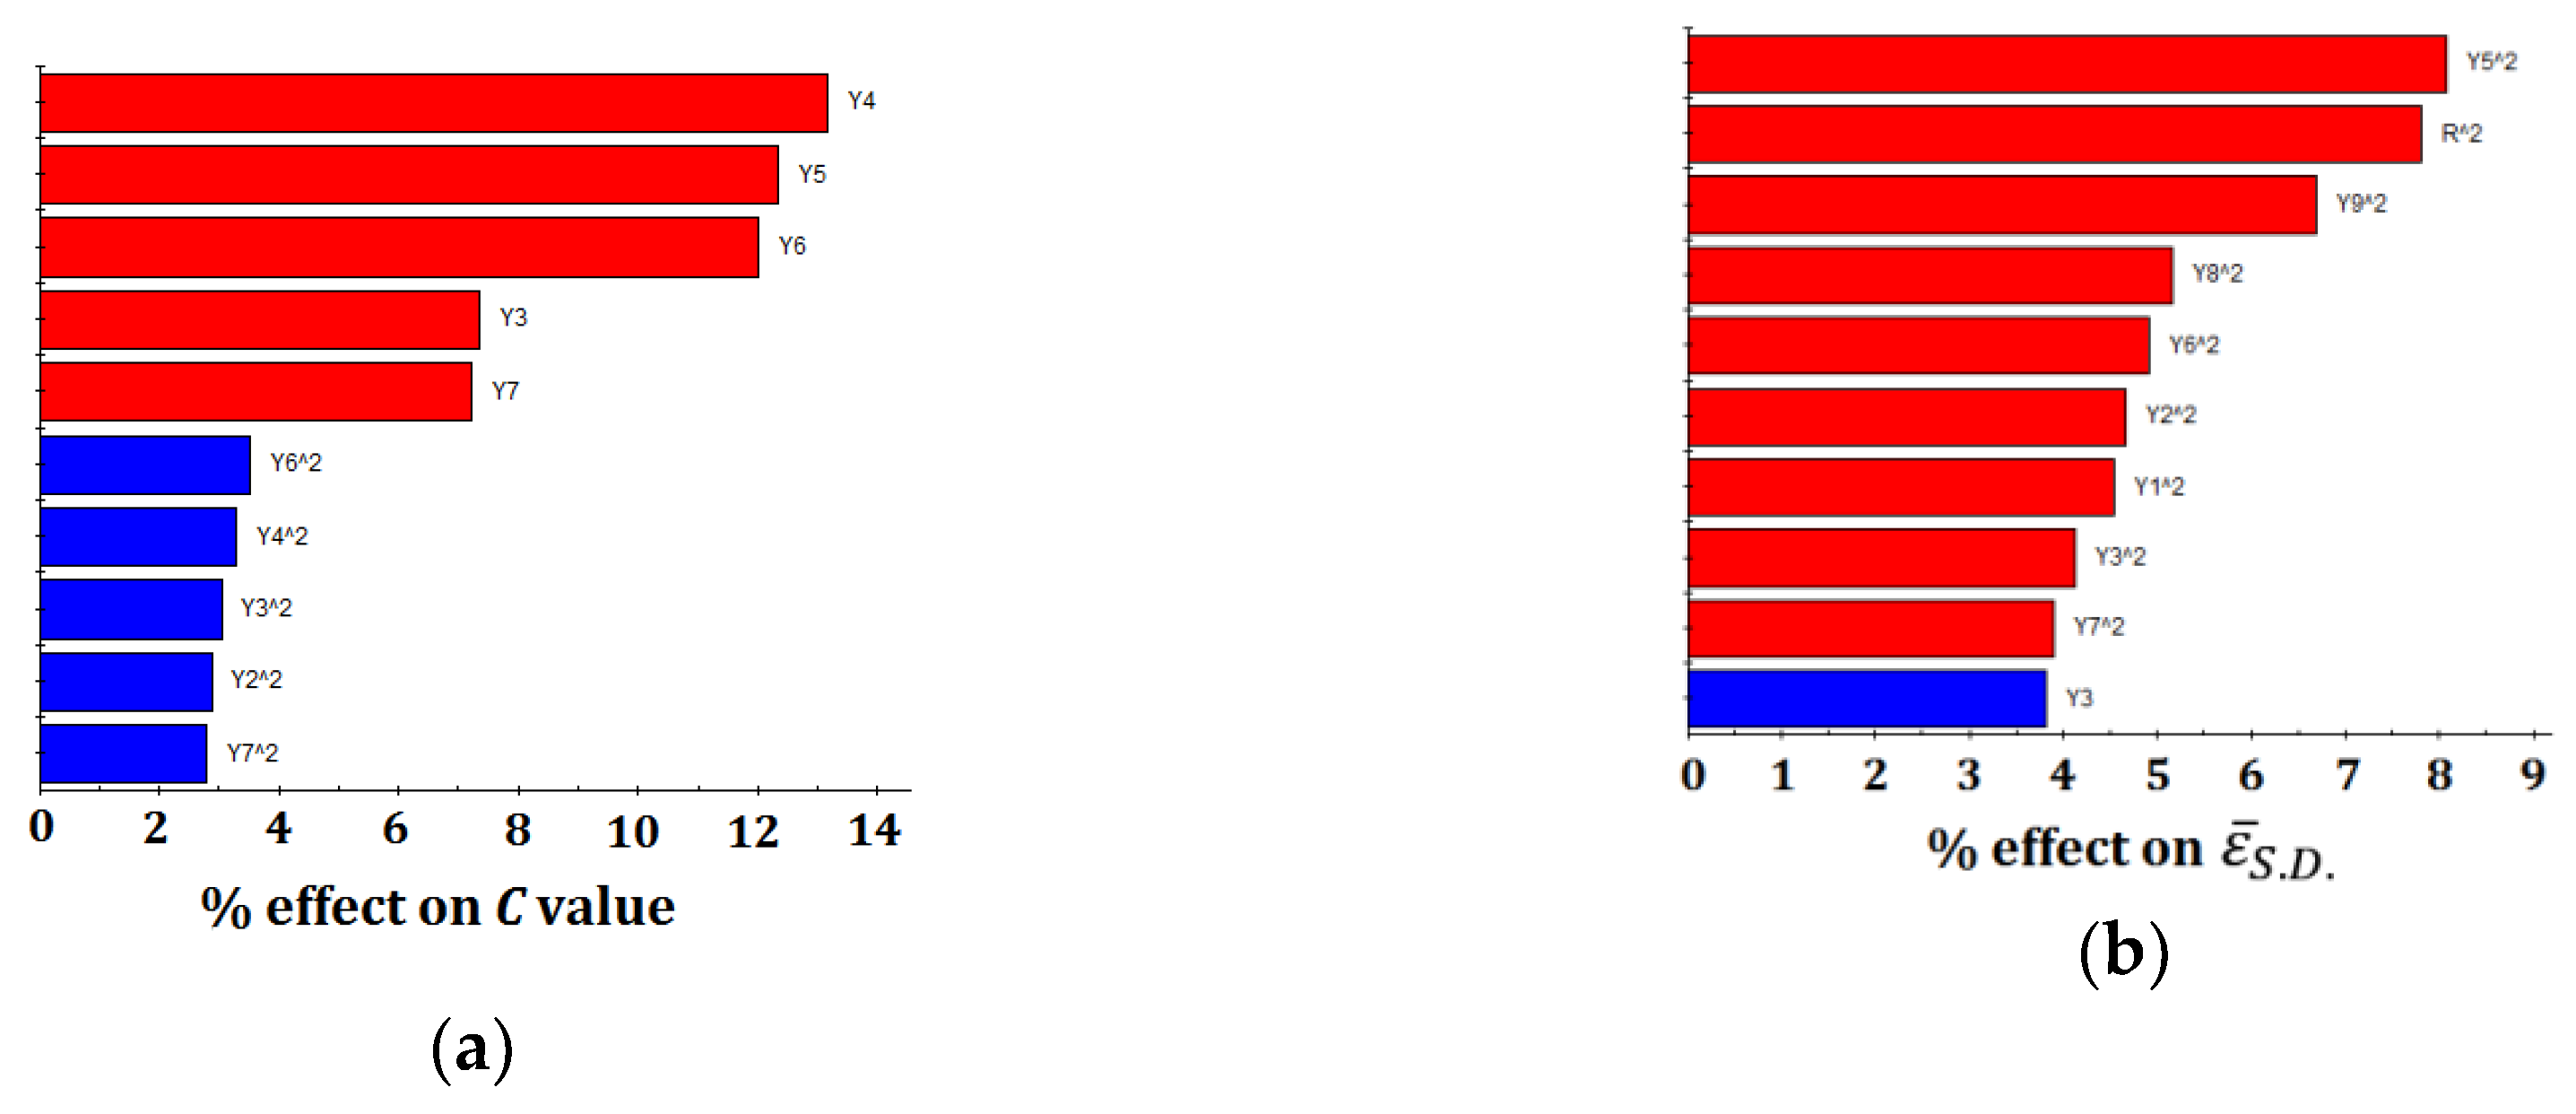
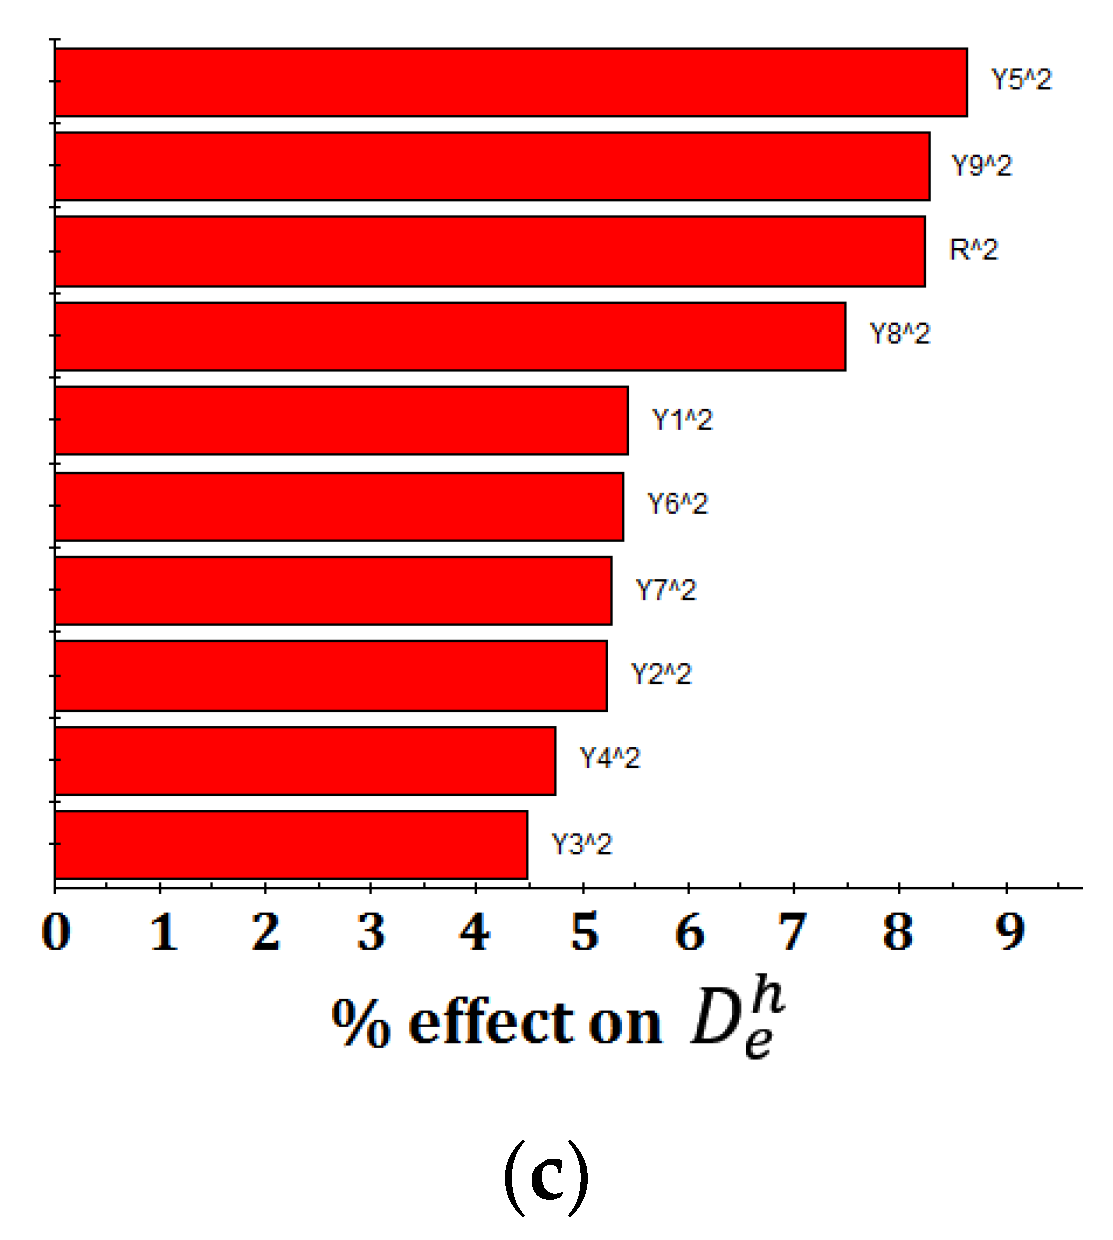
Figure 3 reveals the relative effect and degree of a factor on an objective response based on a data set’s regression analysis. In this figure, the factors are listed in order of the largest effect to the smallest effect. The blue bars indicate positive effects on responses, while the red bars indicate negative effects. The ranking of effects is determined by ordering the scaled and normalized coefficients of a standard least-square second-order polynomial fit to the component’s data. This plot can be used to identify the factors with significant effects on the responses. As can be seen in the figure, the main factors influencing the C value are Y4, Y5, and Y6 with their negative degrees of 13.1%, 12.3%, and 12%, respectively. While quadratic components of Y5, r, and Y9 are the larger factors influencing on and with all negative degrees lower than 9%. Overall, no single factor can dominate any objective function. Response relationships between variables and objective functions appear to the complexity, which obviously increases the difficulty of optimum searching.
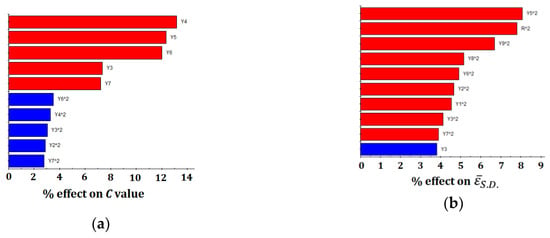
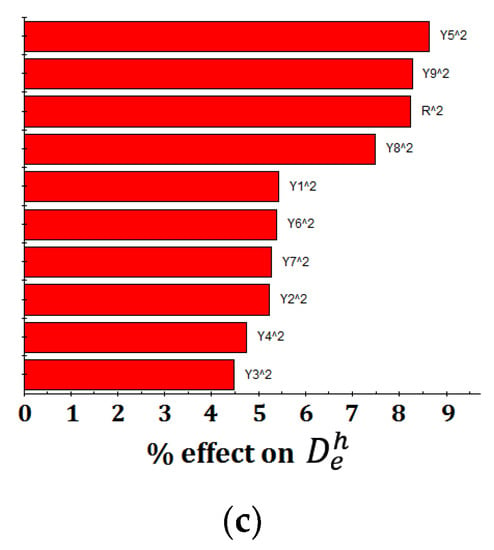
Figure 3.
Relative effects and degree of the main factors on different objective response. (a) Relative effects on C value. (b) Relative effects on . (c) Relative effects on .
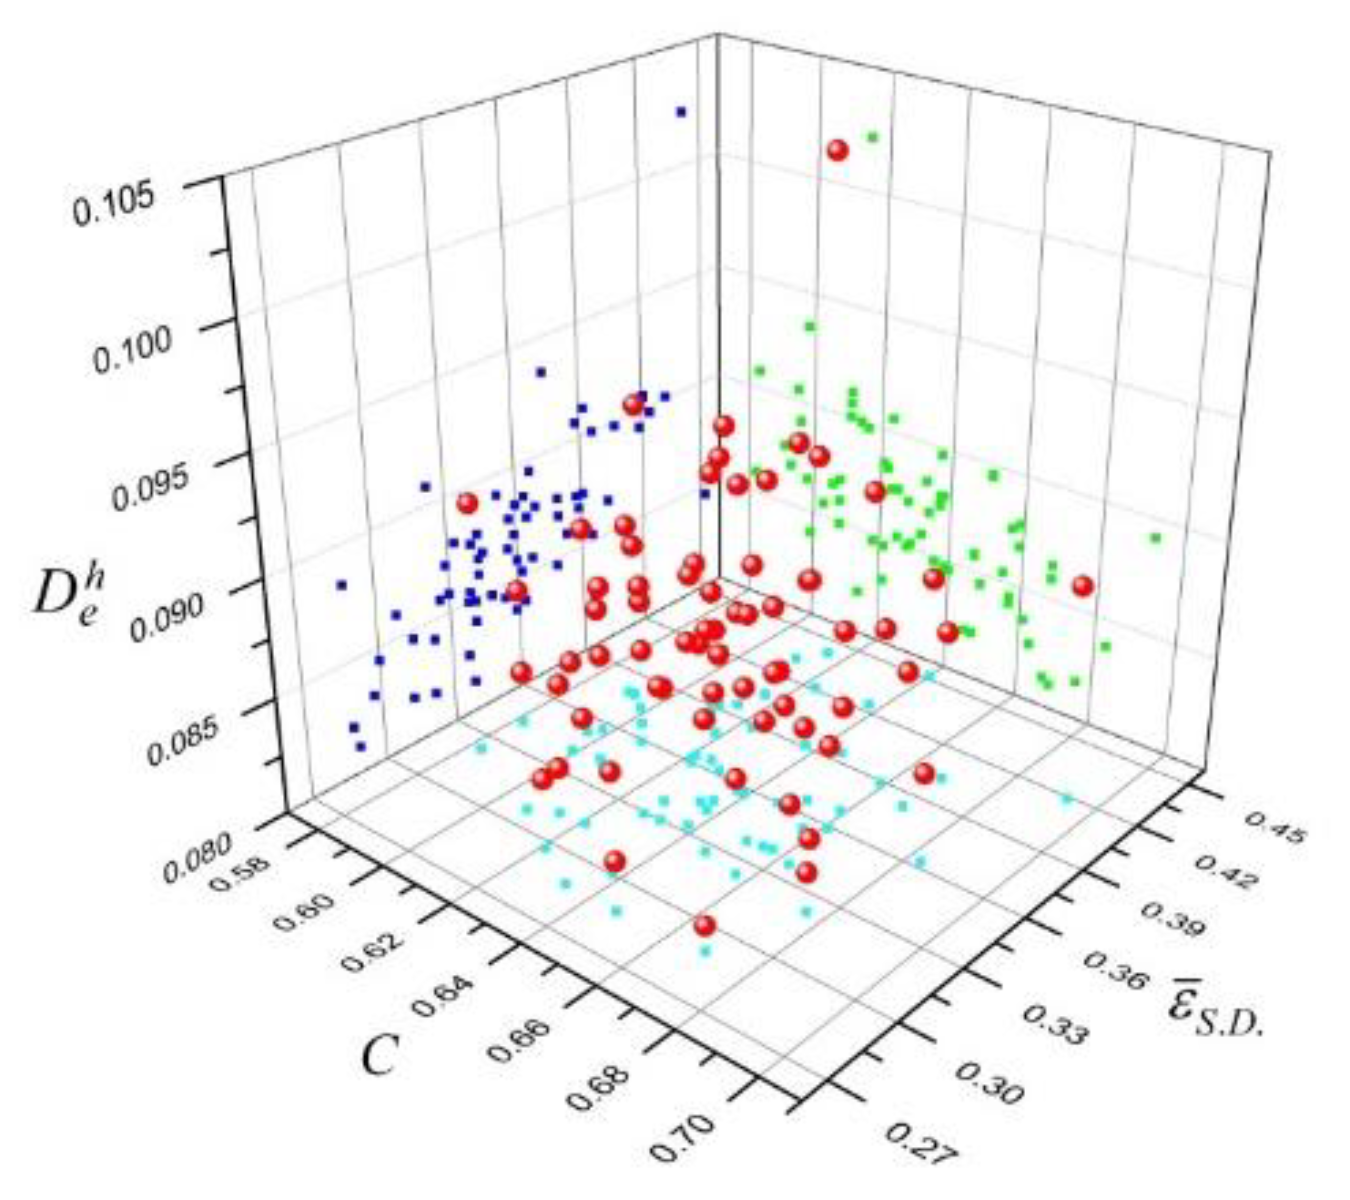
Figure 4 gives the distributions of initial sample data in the multi-objective space. As can be seen, the scattered red balls represent the spatial positions of each sample data in a coordinate system where three objective functions are chosen as the coordinate axes. The three groups of colored points are their vertical positions on different projection planes. In the projection plane of C and , the projection points get an almost even distribution status over the whole region, which indicates that there is no obvious correlation between C and . However, projection points in other projection planes are concentrated mostly on one half of the region. This implies an implicit correlation existed between some parameters. The Spearman rank correlation coefficient expressed as Equation (7) is often used to evaluate a correlation degree between two objective functions. The value of with 1 or −1 means a perfect monotonic positive correlation or negative correlation, respectively. However, no correlation exists when is equal to zero. As a result, there are certain correlations with coefficient of −0.4 between C and , and 0.49 between and . This means the forging performances can be optimized with improved deformation uniformity (lower ) which can decrease the probability of crack emergence (lower ) at the same time.
where Q is the number of sample, Zk and Sk are the rank numbers of the kth objective value respectively, and are the mean values of the Zk and Sk respectively.
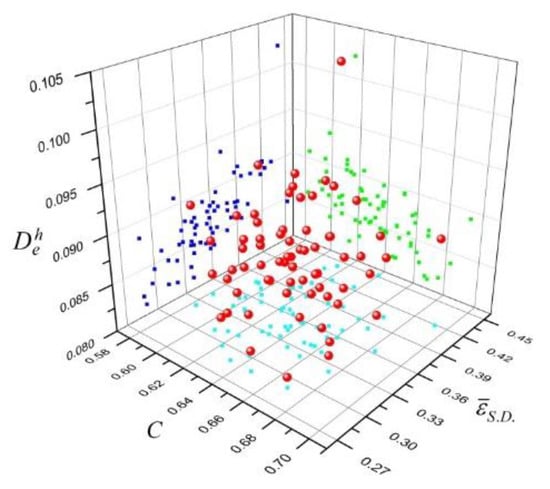
Figure 4.
Sample distributions in the space of multi-objectives.
In addition, most of the samples locate the center of the parametric region. However, there are a few samples near the border, often the searching domain for the best solution, which poses a challenge in developing a reliable surrogate model for accurate predictions in this area.
5. Surrogate Models
For an optimization problem with ten variables, computational costs make it impractical to rely exclusively on high-fidelity simulations for the purpose of objective function evaluation. Therefore, an approximation model is essential for substituting an FE program to reduce the calculation costs during the optimization iteration. At present, response surface methodology, the Kriging model, and the radial basis function model are the main surrogate models applied in the metal forging area.
5.1. Response Surface Model (RSM)
A least-squares second-order polynomial fit is developed for analysis of the complex relationship between design variables and objective responses. Based on the initial sample data, a full second-order polynomial regression model including all two-way interactions is employed and expressed in Equation (8)
where is the objective response, , , , and are undetermined constant coefficients, and denote the independent design variables, and m is the number of design variables.
If is the model fitting error, the objective from sample data (y) can be expressed by:
Combined with Equations (8) and (9) can be transformed to matrix form as shown by:
where Q is the number of samples and k is equal to (65 in this study). For simplicity, Equation (10) can be further expressed as:
Because of Q > k + 1, the coefficient matrix of can be solved by the least squares regression which minimizes the residual sum of squares (RSS) between the sample data and approximated responses. Thus,
The deviations can be written as:
Then, the RSS becomes:
The derivation of RSS with respect of can be obtained as follow:
Then, the coefficient matrix of can be obtained by solving the equation as follow:
Coefficient tables of the regression model for all three objectives by an initial 67 sets of sample data are listed in Table 2, which contains all quadratic terms and all second-order cross terms.

Table 2.
Coefficients for response surface model (RSM) model based on initial sample data.
5.2. Radial Basis Function (RBF) Model
An RBF surrogate model can be expressed as follows:
where is the output response of any input vector (X), Q is the number of sample data, is the weight coefficient ascribed to the pth hidden output, is the deviation compensation, and is the pth RBF expressed as follows:
Here, is the Euclidian distance given by . K is a shape function variable and 1.59 obtained by optimization. is the center of the basis function and taken to be the corresponding given sample.
Clearly, the unknown coefficient and need to be solved. The Q linear Equations can be obtained by introduction of the Q sample:
Introducing the notation:
Equation (19) can be rewritten in the matrix form as:
where w = (w1,…,wQ+1)T, and F = (f1,…,fQ,0)T. Then, the expansion coefficient matrix can be given by:
Obviously, an added constant wQ+1 constrains the sum of the weighted coefficients to zero, which can be described as:
For the initialization of RBF model, least 2m + 1 sample data were required to be evaluated, where m is the number of design variables. However, as many samples as possible can contribute to enhancing the surrogate accuracy of an RBF model. An initial 67 sets of sample data were utilized for training the proposed RBF model. According to the computational method of the weighted coefficient, the results of respective expansion coefficients for three different objectives are shown in Table 3. Note that the values with the serial number 68 are the added constants.

Table 3.
Regression expansion coefficients of radial basis function (RBF) model.
5.3. Kriging Model
The Kriging model postulates a combination of a ‘global’ linear regression model plus a ‘localized’ deviation:
where is the unknown function of interest, , similar to RSM function, is a polynomial regression model with respect to x, which provides a ‘global’ model of the design space. is the realization of a stochastic process with mean zero, variance σ2, and nonzero covariance, which represents a ‘localized’ deviation to the ‘global’ model. The covariance matrix of Z(x) that dictates the local deviations is:
where B is the correlation matrix, and is the correlation function between any two of the Q sample points x and v. B is a [Q × Q] symmetric, positive definite matrix with ones along the diagonal. The correlation function is user-specified and a Gaussian correlation function is adopted in this study:
where m denotes the dimension of input (the number of design variables), and are the unknown correlation parameters used to fit the model. Obviously, the Kriging model specification boils down to estimating the parameter , the process variance σ2, and the correlation parameter . One can compare actual responses with model predictions for these experimental points used, then the unknown parameters and the Kriging model could be obtained by mathematical derivation. Once the best is confirmed, the predicted estimate at an untried location can be given by:
In this study, is simplified to be a constant term when is taken as a constant that is filled with ones. Y is the column vector of length Q that contains the sample values of the response. is the vector of correlation values between the untried location x0 and the sample data points:
The constant is estimated using the equation:
The estimate of the variance is:
The maximum likelihood estimate (MLE) for “best” are obtained by solving the following equation over :
where both and B are determined by . The “best” Kriging model is found by solving the m-dimensional unconstrained nonlinear optimization problem given by Equation (30). An iterative optimization process is invoked to find the MLEs for searching the “best” . The maximum iterations to fit the Kriging model are set to 3000.
Based on the initial 67 sets of sample data, the , coefficients for normalized inputs are calculated and listed in Table 4. The associated MLE values for three different objectives are also given at the same time.

Table 4.
, coefficients and associated maximum likelihood estimates (MLEs) for three objectives.
6. Model Estimations and Comparisons
In this study, calculations of average error (ERRave) in Equation (31), maximum error (ERRmax) in Equation (32), root mean square error (ERRrms) in Equation (33), and R-Square (R2) in Equation (34) have been employed to validate the model performances. These indicators have been normalized by the range of the actual values for each response, which allows the level of different responses with different magnitudes to be compared between different surrogate models.
where is the predicted value by a surrogate model, is the corresponding true value from numerical simulation, is the mean value of all true values, ymax and ymin are the maximum and minimum value among these true values, respectively. Lower values are desired for ERRave, ERRmax, and ERRrms. No deviation exists between any true value and its corresponding prediction when the ERRave, ERRmax, and ERRrms equal to zero. For the R-Square, a higher value is desired and the maximum value with one means no deviation between any true value and its corresponding prediction.
The fitting goodness to initial training sample data is very significant to evaluate the quality of a surrogate model. A reliable surrogate model should approximate close to these data. Table 5 lists the fitting performances of three different surrogate models at initial training sample points. As can be seen, all three surrogate models present excellent fitting accuracies. The RBF model fully interpolating all training samples represents a perfect fitting performance.

Table 5.
Fitting error analyses of different surrogate models based on the sample points. Abbreviations: average error (ERRave), maximum error (ERRmax), root mean square error (ERRrms).
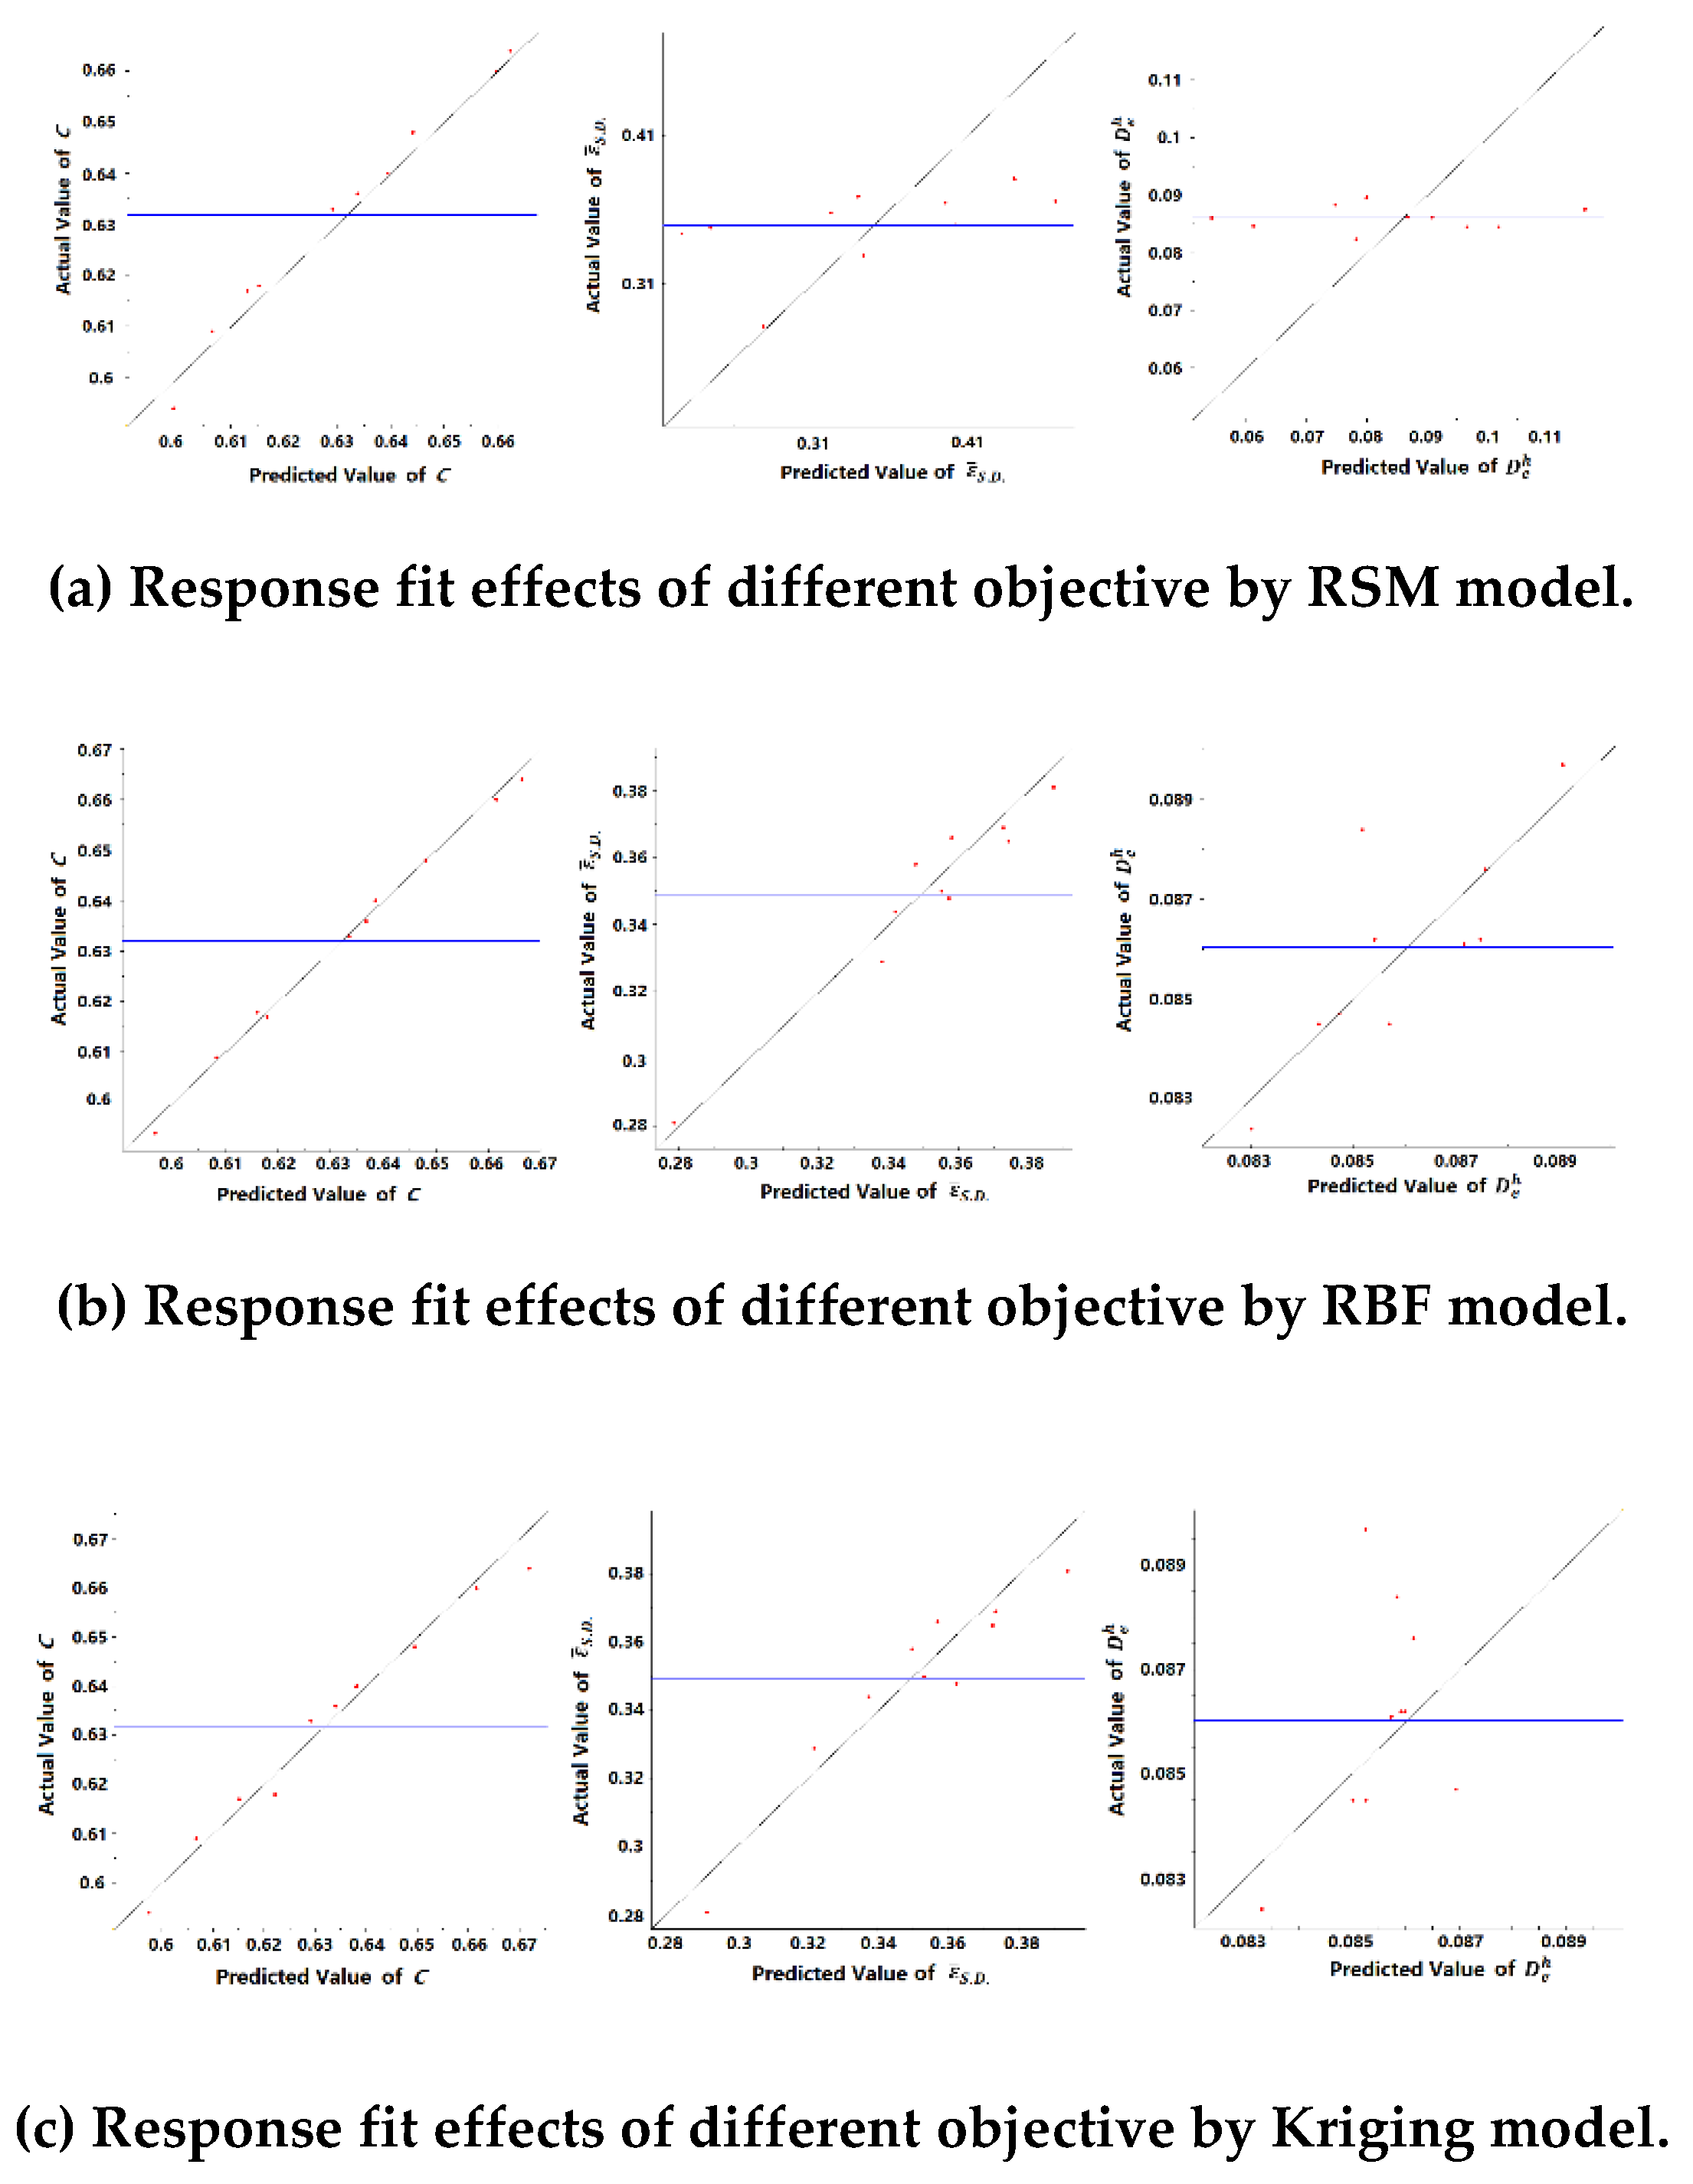
To further estimate the predictive capability of the developed surrogate models, an additional 10 sets of input data are created at random in the design domain for cross validation, as shown in Table 6. Response fit plots (Figure 5) show true values versus predicted values for each response of all developed approximation models. The blue horizontal line gives the mean response value predicted by surrogate models. The diagonal line in the plot represents a perfect fit. From these figures, all three models provide good fit accuracies to the response of the C value because the checkpoints are very close to the diagonal line. However, the approximation qualities of other responses differ from different models. The predictions of the response are relatively poor-quality in all three models.

Table 6.
Input data created at random for cross validation.
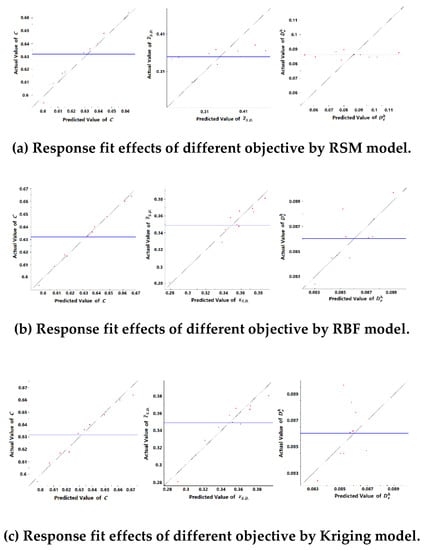
Figure 5.
Error analysis approximations of different response by developed surrogate models.
Specific fitting errors of different surrogate models based on the additional points have been listed in Table 7. As can be seen, the R-Square values in response to C are mostly close to 1.0 in all models, which confirms that good fitting qualities have been achieved by all models. It further proves the objective of C can be characterized easily by a second-order polynomial. However, R-Square values of response and are zero by the RSM model. Especially for response , both ERRave and ERRrms are larger than one. That means the average predicted errors have far exceeded the range of the actual values, and the predictions turn out to be a complete failure. The objective function of takes on the characteristics of complex nonlinearity.

Table 7.
Fitting error analyses of different surrogate models based on the additional points.
However, the RBF and Kriging models possess relatively good fitting precisions in response to because of both R-Square values larger than 0.9. By comparison, predictive qualities of decline from both the Kriging and the RBF models. In Table 7, the fitting errors of R-Square value are 0.611 and 0.341, respectively. As a whole, the RBF model is better than the Kriging model in predictions of all the objectives. In order to increase the fitting accuracy, both the initial training sample and additional points for cross validation are employed to retrain the RBF model for the following optimization process.
7. The Shape Optimization of an Aerofoil Preform Tool
7.1. Particle Swarm Optimization Algorithm
Particle swarm optimization (PSO) [25,26] is a population-based global search procedure where individuals (called particles) continuously change positions within the search area. The state of a particle is the value for all design variables in an optimization problem and its velocity in the design space, and each move produces a new generation. In each iteration, the particle is moved using two values: its own best position and the global best position by all particles among all the generations. Compared with GA-based algorithms, there are no complex genetic procedures required, which significantly improves the efficiency of the optimum searching by using a PSO algorithm. The detailed introduction for a PSO algorithm can be referred to the literature [27]. Table 8 lists the parameters of the PSO algorithm used in this study.

Table 8.
Parameters used for the particle swarm optimization (PSO) algorithm in this study.
7.2. Design of Fitness Function
One important step for multi-objective optimization is to define the fitness function which decides the searching direction for an optimized solution. In this study, a zero-mean normalized process is employed for the conversion of objective function value. Each value will be converted into the number of the standard deviation away from the mean. The mean and the standard deviation can be estimated from the samples. This normalized approach is very suited in cases where there are unknowns about the value range of objective function in advance. As a result, a fitness function is suggested based on a weighted treatment of the normalized multi-objective function and a penalization of the solution according to its constraint violation, which is defined as Equation (35). A PSO algorithm could help the search towards more promising regions in the design space, and to seek to decrease the fitness value of continually.
where is the normalized value of of individual i, is the normalized value of of individual i, is the penalty term of individual i, and and are the weighting factors and assigned to 1 in this study. , , and are respectively defined as:
where and are the standard deviation of effective strain and the average of 1% elements with highest damage value of individual i during the evolutionary process; , , , and are the mean values and the standard deviation of respective and column in the sampling data, which are 0.358, 0.0361, 0.0866, and 0.00316 by calculation; and is the die-filling status of individual i, as defined in Equation (1).
7.3. Optimization Result
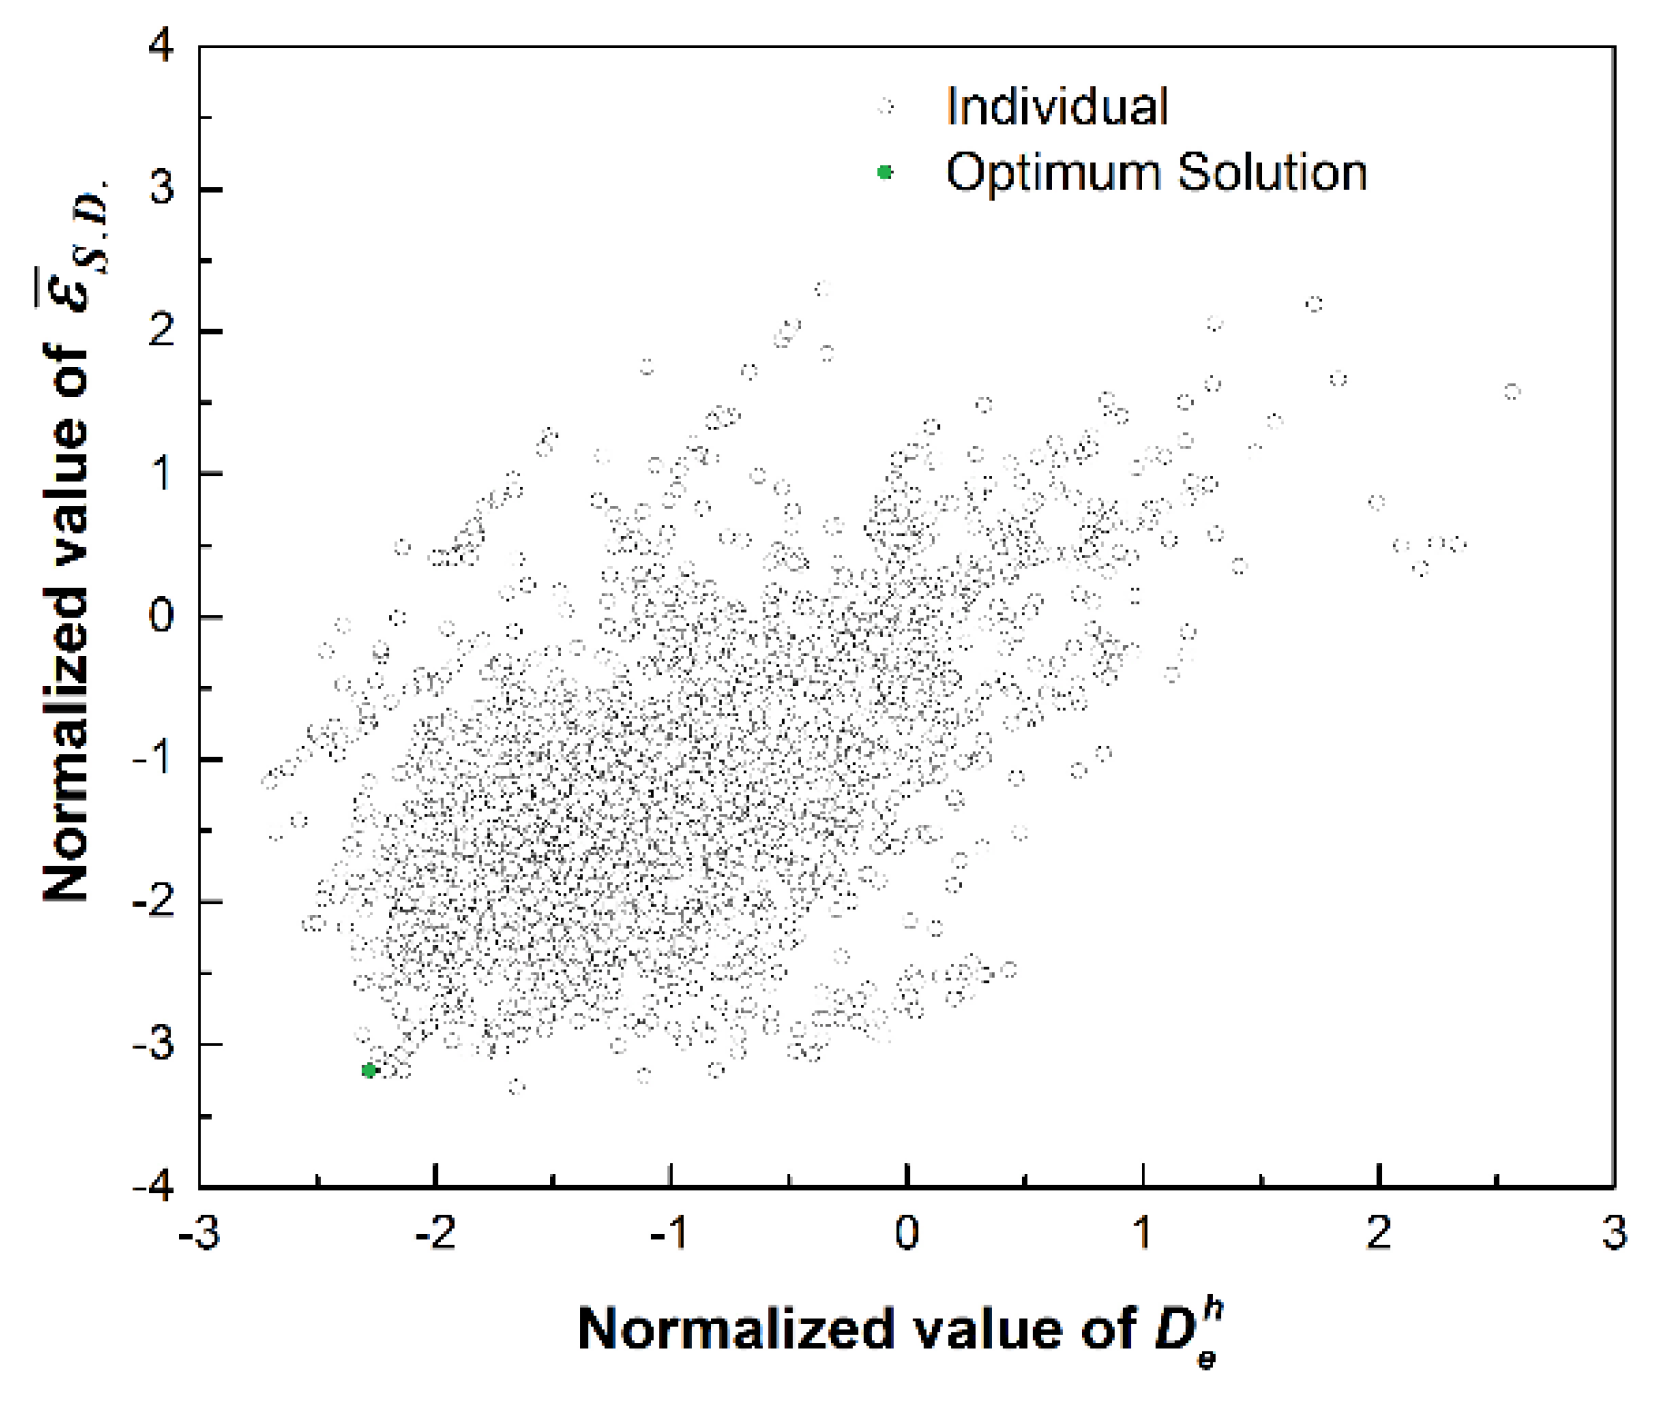
Figure 6 shows the distributions of solutions for a total of 10,000 individuals. It can be seen that almost all solutions cluster together near the diagonal line, which further proves the positive linear correlation between objective values and . The distinctive green point represents the optimum solution in all individuals according to the minimum of fitness function.
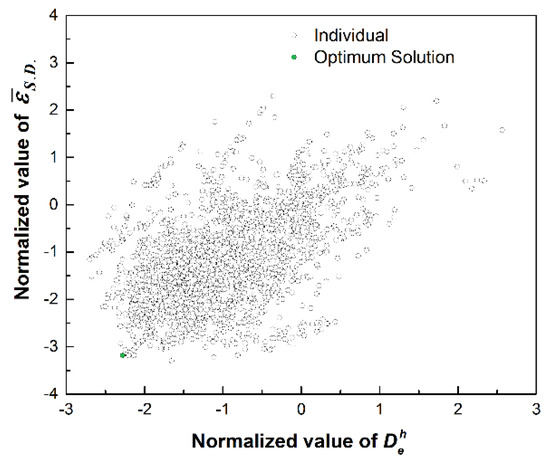
Figure 6.
Distributions of all solutions.
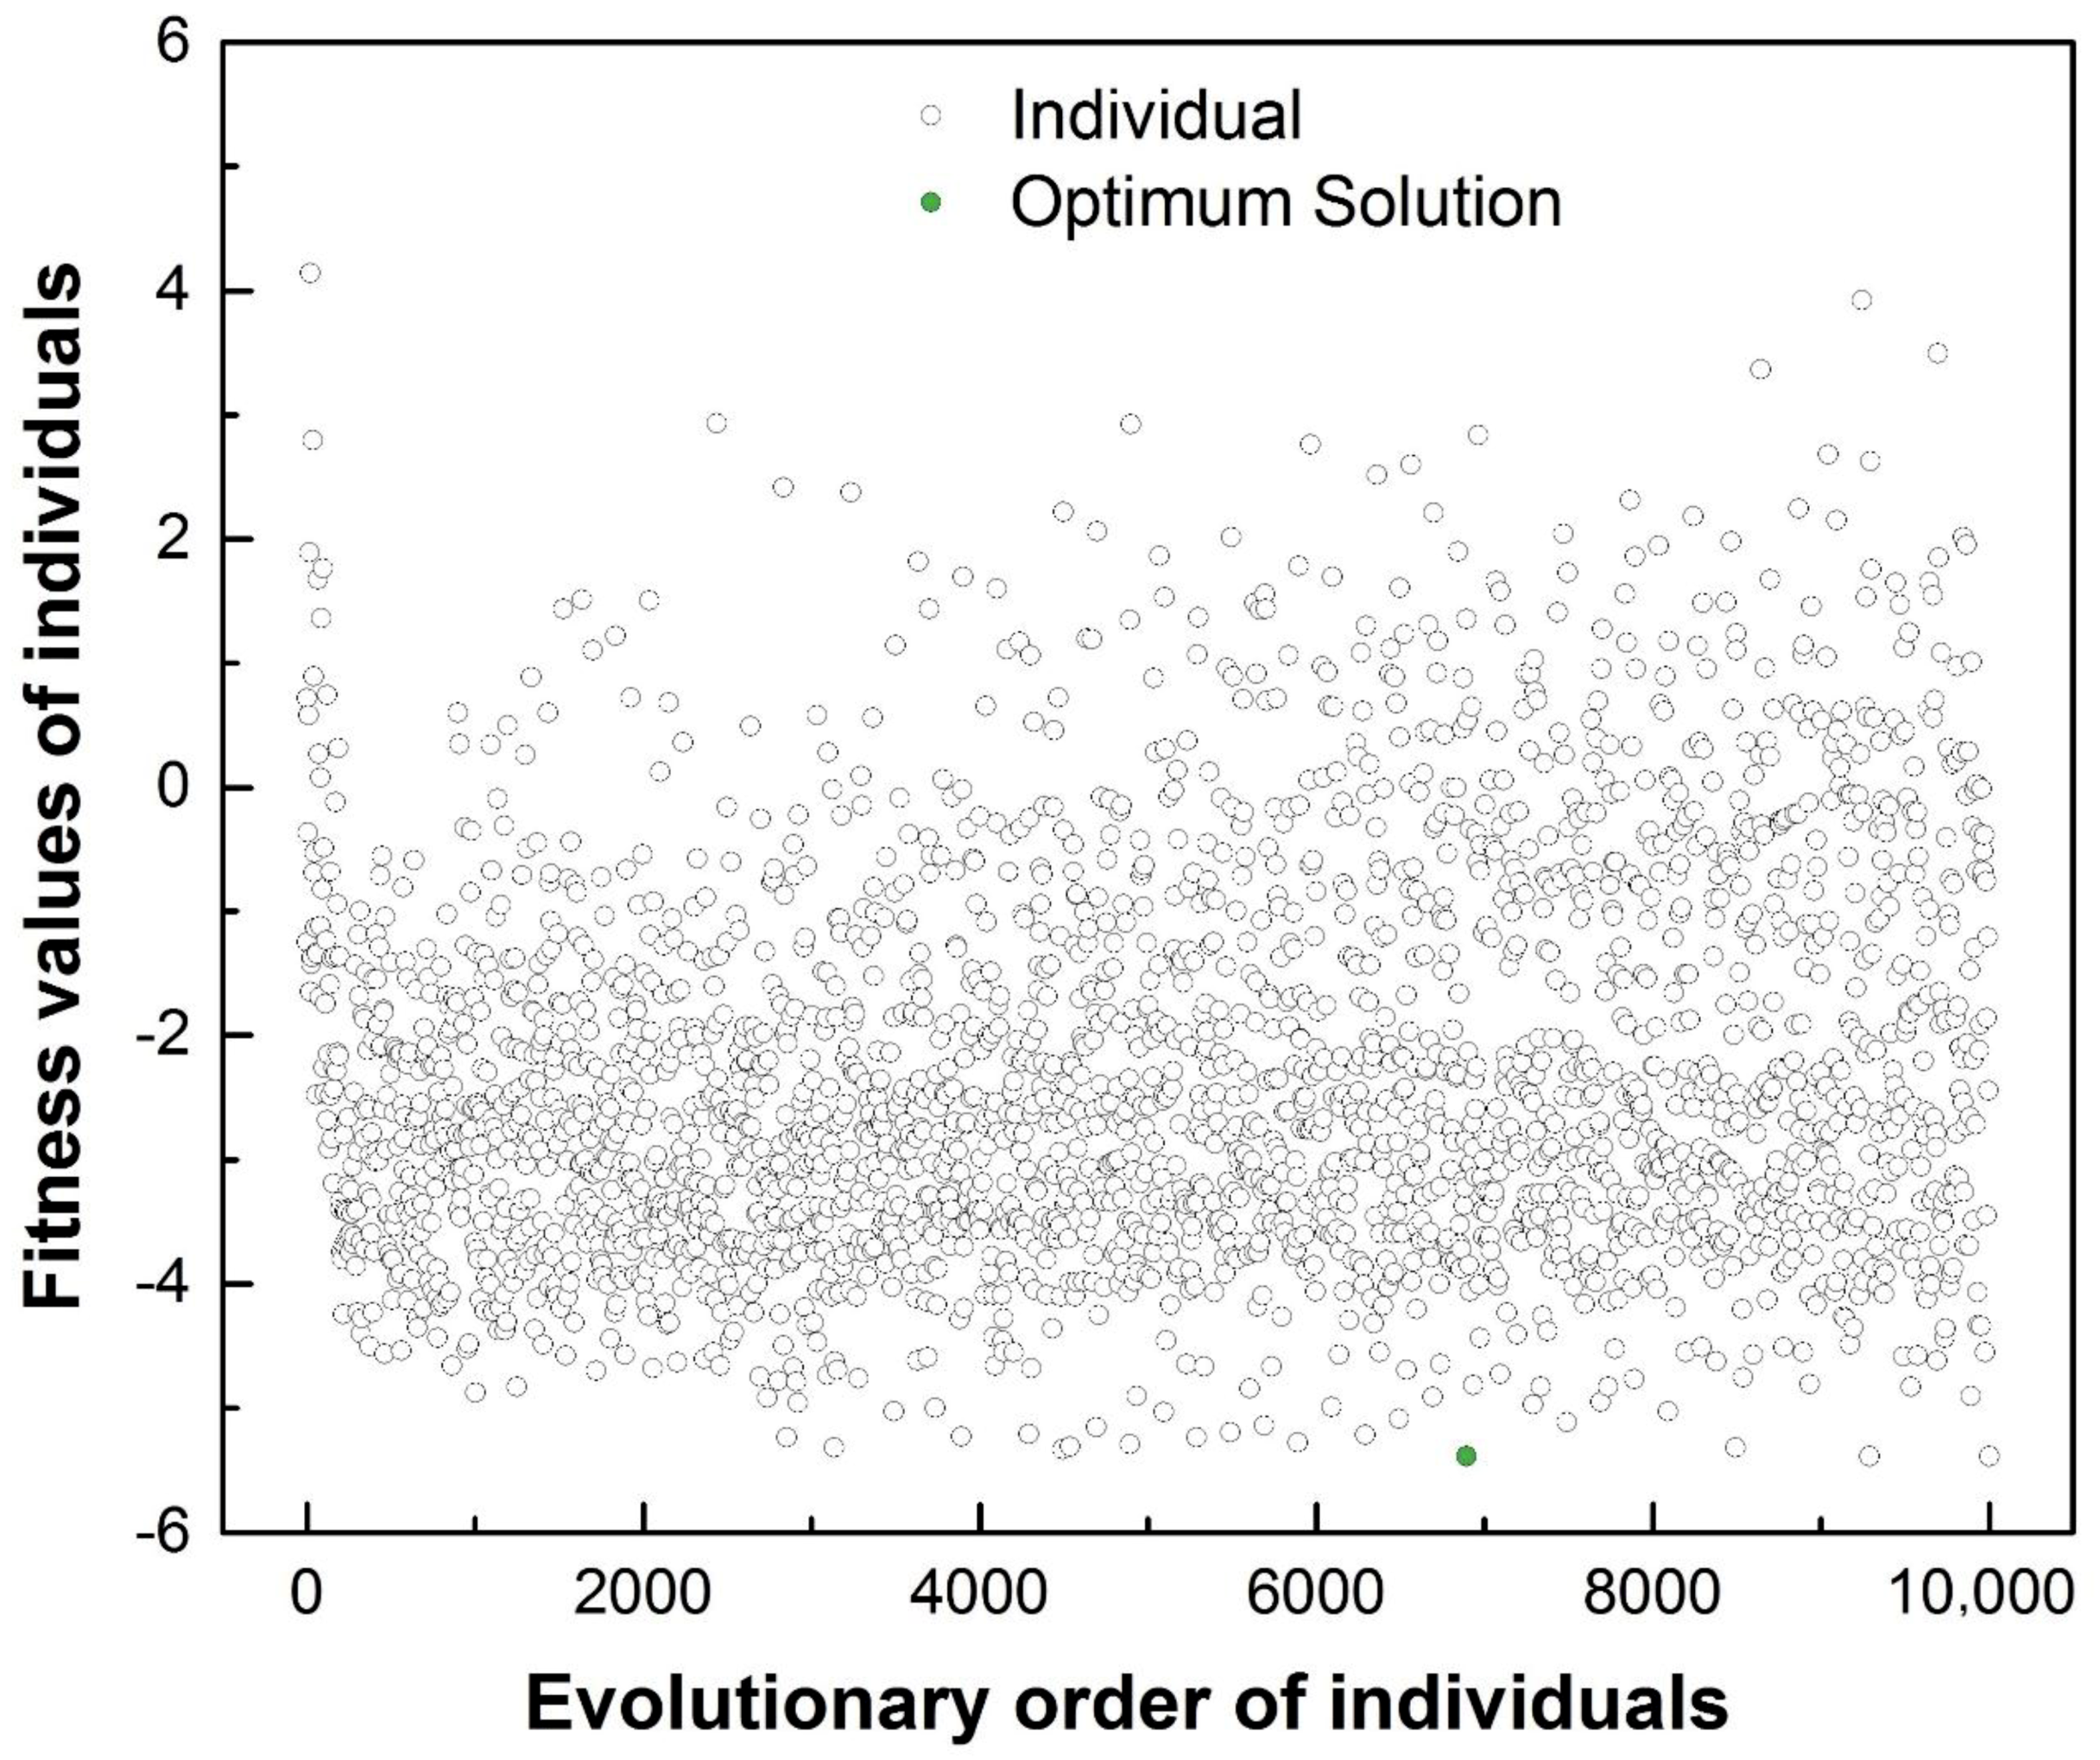
Figure 7 shows the fitness value distributions in the individual evolutionary process. It can be seen that most fitness values are from −2 to −4 and close to the optimum value, which reveals a high searching efficiency. After about 3,000 evolutions, the minimum of fitness value declines gently and tends to be constant. The searching process expresses good stability and convergence, and finally presents an optimum fitness value of −5.388 marked by the green point. Compared with the minimum fitness value of −3.641 in sample data (with serial number of 28 in Table 1), the optimal result improves considerably. The objective values and the associated design variables corresponding to the optimum solution predicted by the RBF model are listed as follow:
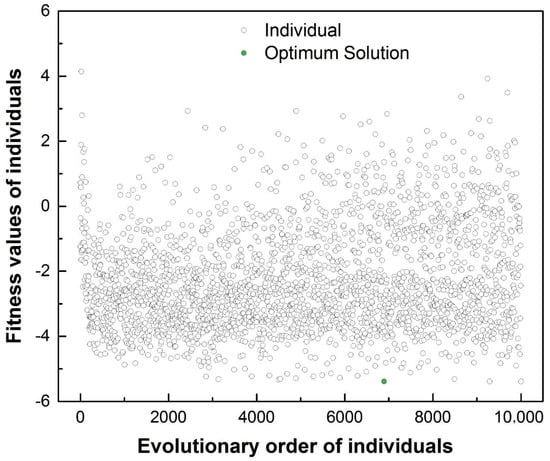
Figure 7.
Fitness value distributions with evolutionary process.
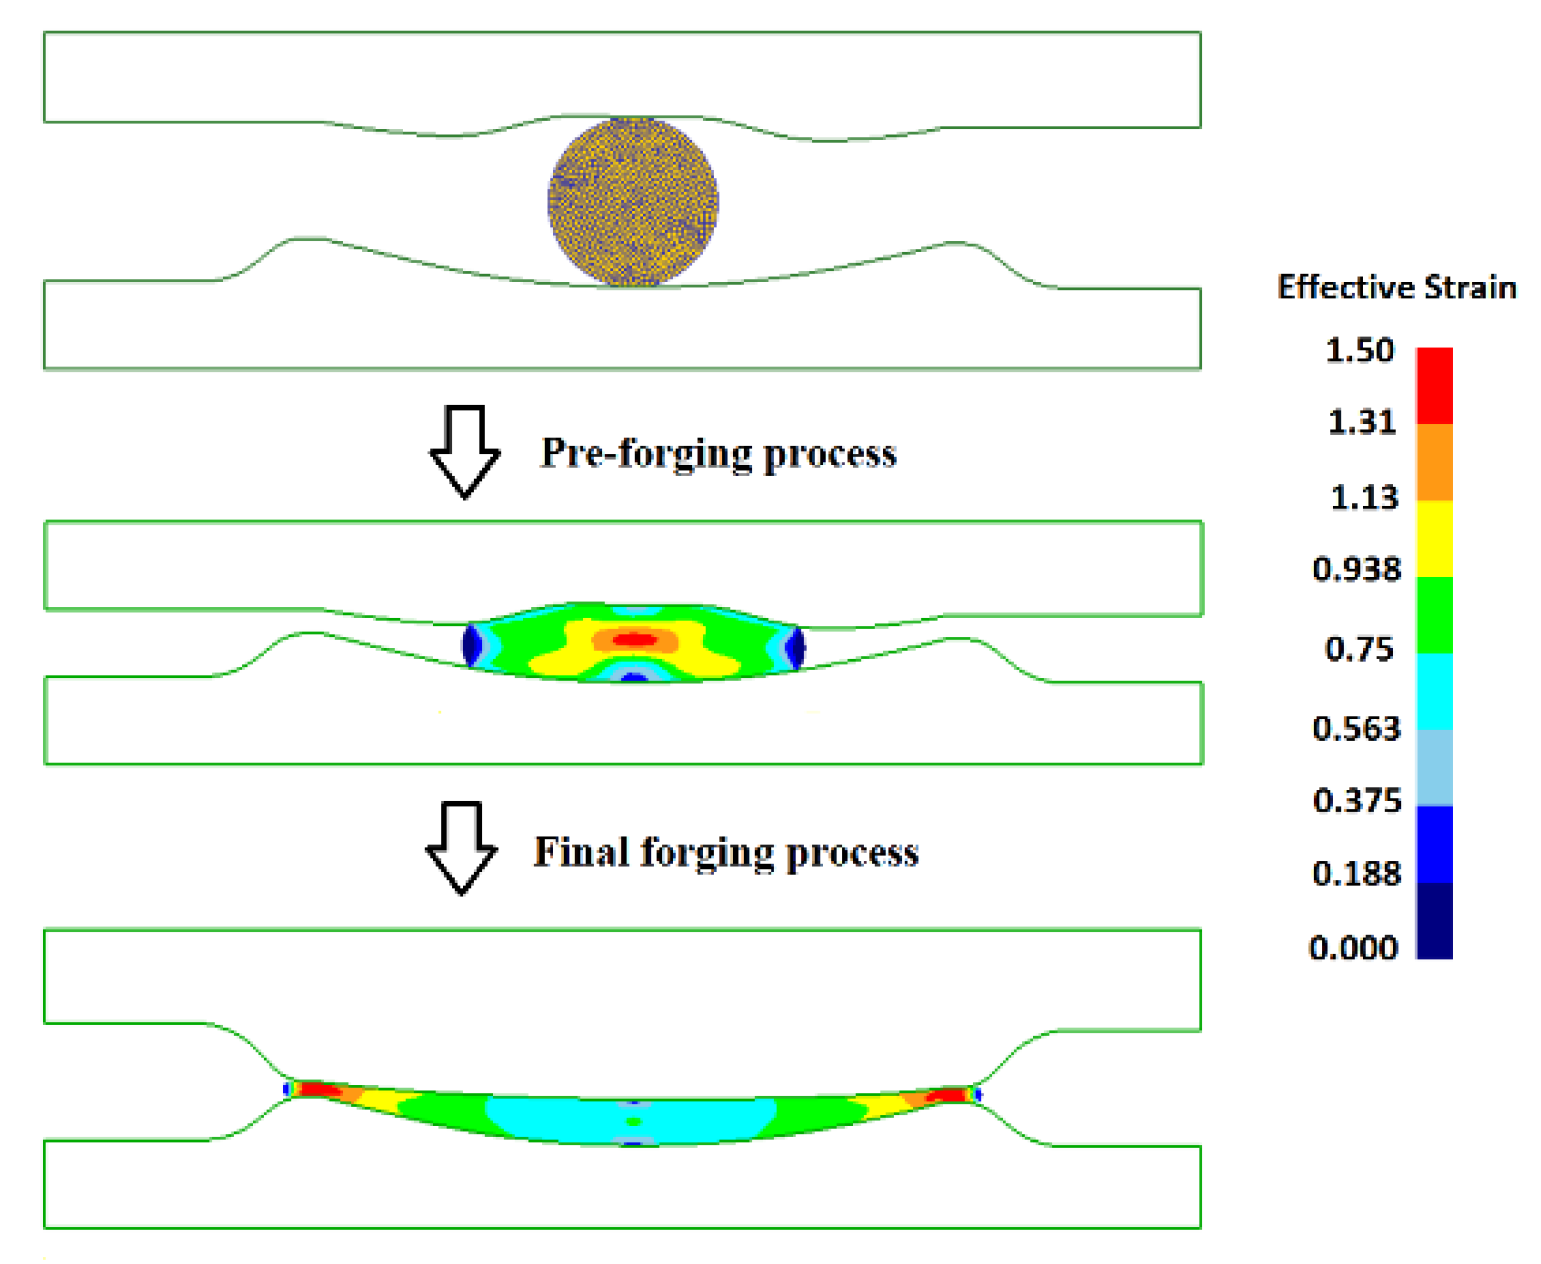
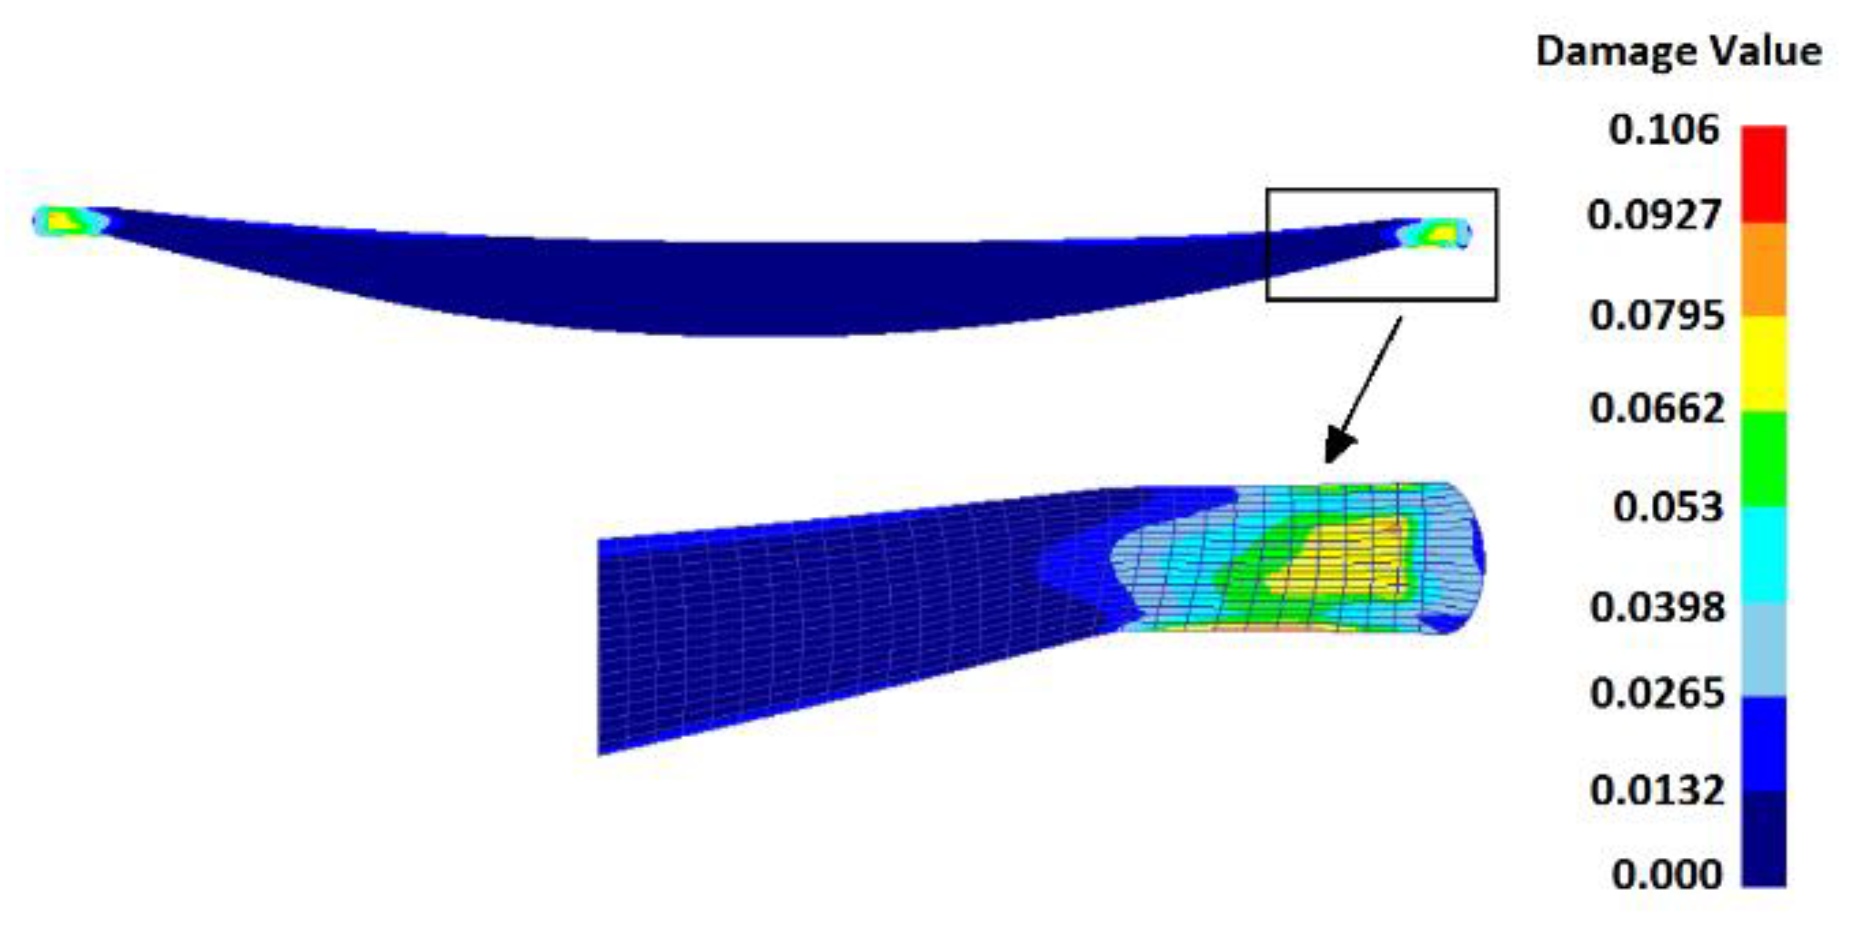
According to the predicted solution, a new upper die profile of preform tool can be redesigned. Then, FE simulations with the optimal billet and preform tool for the pre-forging process and the final forging process have been implemented to validate the optimization result as shown in Figure 8 and Figure 9. It can be seen that the preform shape is relatively simple and nearly symmetrical. The corresponding C value is 0.577 which is quite approximate to the prediction (0.587), which no doubt is in favor of the preparation of the preform. As a whole, the deformation is relatively large in the pre-forging stage for pursuing a better pre-distribution of material.
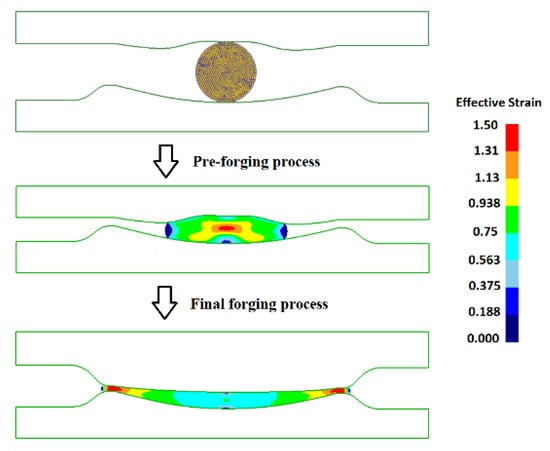
Figure 8.
Validation of optimized result via finite element (FE) simulations of the pre-forging and final forging process.
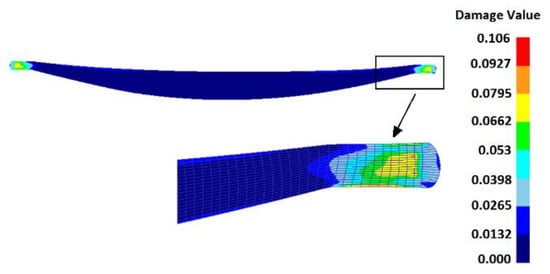
Figure 9.
Damage value distribution of optimized preform in the final forging process.
However, in the final forging process, the local high strain and overall deformation degree have both declined comparatively. This will contribute to enhancing forming qualities and reducing forging defects. In Figure 9, the high damage values totally concentrate on the two sides near the flash area where high effective strains exist. The values of and are 0.249 and 0.0827 from the result of FE simulations which also approximate the predictions (0.238 and 0.0797). In addition, a sufficient die-filling status and the uniform simplified flash have been achieved at the same time. Note that the optimized billet size (r = 4.936) is near the lower limit in the range of r value, which indicates that the billet with reasonably reduced material contributes to the improvement of material flow and forming properties.
8. Conclusions
In this paper, the RSM, RBF, and Kriging surrogate models were developed to substitute the FE simulation process for predicting the objective responses efficiently. A comparison of the three surrogate models were implemented for the evaluation of fitting accuracy based on a shape design and optimization of an aerofoil forging preform tool. According to a parametric study, the complex correlations between design variables and objective functions were clarified to a certain degree. Quantitative analyses in detail manifest that although achieving the excellent fitting qualities at the training points in all surrogate models, the predictive performance differed in different models when responding to the general points in the variable space. The response of C can be well characterized by a simple second-order polynomial, and all suggested surrogate models provided better fitting effects. To the moderately complex objective function of , the RBF and Kriging models still presented good fitting performance compared to the RSM model which totally lost its predictive ability. As for the response of with high nonlinearity, more training samples are necessary for improving the predictive precision and reliability to all existing models. In this case, the RBF model was slightly superior to the Kriging model in prediction of the .
An optimum design of preform tool was determined by the PSO algorithm which assisted the proposed RBF model, and which has the ability to significantly improve forging qualities. The optimized preform tool was validated by the FE simulation. The forging performances derived were proved to be very close to the predictions from the optimization scheme. The result also shows that the suggested RBF model has a preferable surrogate accuracy, and could be efficiently applied to handle complex engineering optimizations.
Author Contributions
Data curation, L.Y.; Formal analysis, P.G. and F.S.; Funding acquisition, H.Y.; Investigation, Y.S. and L.Y.; Methodology, Y.S. and P.G.; Project administration, Y.S.; Software, H.Y. and D.F.; Supervision, Y.S.; Validation, F.S.; Writing—original draft, P.G.
Funding
This study was funded by the National Natural Science Foundation of China (51701086) and the Doctoral Sustentation Fund by Jiangsu University of Science and Technology (1062921503).
Acknowledgments
This work was supported by the National Natural Science Foundation of China (Grant No.51701086) and the Doctoral Sustentation Fund by Jiangsu University of Science and Technology (1062921503).
Conflicts of Interest
The authors declare that they have no conflict of interest.
References
- Zabaras, N.; Ganapathysubramanian, S.; Li, Q. A continuum sensitivity method for the design of multi-stage metal forming processes. Int. J. Mech. Sci. 2003, 45, 325–358. [Google Scholar] [CrossRef]
- Ganapathysubramanian, S.; Zabaras, N. Deformation process design for control of microstructure in the presence of dynamic recrystallization and grain growth mechanisms. Int. J. Solids Struct. 2004, 41, 2011–2037. [Google Scholar] [CrossRef]
- Gao, Z.Y.; Grandhi, R.V. Sensitivity analysis and shape optimization for preform design in thermo-mechanical coupled analysis. Int. J. Numer. Methods Eng. 1999, 45, 1349–1373. [Google Scholar] [CrossRef]
- Zhao, X.; Zhao, G.; Wang, G.; Wang, T. Sensitivity Analysis Based Multiple Objective Preform Die Shape Optimal Design in Metal Forging. J. Mater. Sci. Technol. 2006, 22, 273–278. [Google Scholar] [CrossRef]
- Guo, P.Y.; Lu, B.; Shao, Y. Optimal Design for Preform of Blade Forging by Topological Algorithm Combined with Numerical Simulation and Physical Experiment. Rare Met. Mat. Eng. 2017, 46, 461–467. [Google Scholar]
- Shao, Y.; Lu, B.; Ou, H.; Ren, F.; Chen, J. Evolutionary forging preform design optimization using strain-based criterion. Int. J. Adv. Manuf. Technol. 2014, 71, 69–80. [Google Scholar] [CrossRef]
- Shao, Y.; Lu, B.; Ou, H.; Chen, J. A new approach of preform design for forging of 3D blade based on evolutionary structural optimization. Struct. Multidisc. Optim. 2015, 51, 199–211. [Google Scholar] [CrossRef]
- Shao, Y.; Lu, B.; Xu, D.K.; Chen, J.; Ou, H.; Long, H.; Guo, P.Y. Topology-based preform design optimization for blade forging. Int. J. Adv. Manuf. Technol. 2016, 86, 1593–1605. [Google Scholar] [CrossRef]
- Roy, S.; Ghosh, S.; Shivpuri, R. A new approach to optimal design of multi-stage metal forming processes with micro genetic algorithms. Int. J. Mach. Tools Manuf. 1997, 37, 29–44. [Google Scholar] [CrossRef]
- Chung, J.S.; Hwang, S.M. Application of a genetic algorithm to the optimal design of the die shape in extrusion. J. Mater. Process. Technol. 1997, 72, 69–77. [Google Scholar] [CrossRef]
- António, C.A.C.; Dourado, N.M. Metal-forming process optimisation by inverse evolutionary search. J. Mater. Process. Technol. 2002, 121, 403–413. [Google Scholar] [CrossRef]
- Castro, C.F.; António, C.A.C.; Sousa, L.C. Optimisation of shape and process parameters in metal forging using genetic algorithms. J. Mater. Process. Technol. 2004, 146, 356–364. [Google Scholar] [CrossRef]
- Guan, J.; Wang, G.C.; Guo, T.; Song, L.B.; Zhao, G.Q. The microstructure optimization of H-shape forgings based on preforming die design. Mater. Sci. Eng. A 2009, 499, 304–308. [Google Scholar] [CrossRef]
- Knust, J.; Podszus, F.; Stonis, M.; Behrens, B.A.; Overmeyer, L.; Ullmann, G. Preform optimization for hot forging processes using genetic algorithms. Int. J. Adv. Manuf. Technol. 2017, 89, 1623–1634. [Google Scholar] [CrossRef]
- Alimirzaloo, V.; Sadeghi, M.H.; Biglari, F.R. Optimization of the forging of aerofoil blade using the finite element method and fuzzy-Pareto based genetic algorithm. J. Mech. Sci. Technol. 2012, 26, 1801–1810. [Google Scholar] [CrossRef]
- Torabi, S.H.R.; Alibabaei, S.; Bonab, B.B.; Sadeghi, M.H.; Faraji, G. Design and optimization of turbine blade preform forging using RSM and NSGA II. J. Intell. Manuf. 2017, 28, 1409–1419. [Google Scholar] [CrossRef]
- Meng, F.; Labergere, C.; Lafon, P.; Daniel, L. Multi-objective optimization of gear forging process based on adaptive surrogate meta-models. AIP Conf. 2013, 1532, 637–643. [Google Scholar] [CrossRef]
- Bonte, M.H.; Fourment, L.; Do, T.; Boogaard, A.H.; Tink, J. Optimization of forging processes using Finite Element simulations. Struct. Multidiscip. Optim. 2010, 42, 797–810. [Google Scholar] [CrossRef]
- Kitayama, S.; Jirasak, S.; Arakawa, M.; Yamazaki, K. Sequential approximate multi-objective optimization using radial basis function network. Struct. Multidiscip. Optim. 2013, 48, 501–515. [Google Scholar] [CrossRef]
- Sedighi, M.; Hadi, M. Preform optimization for reduction of forging force using a combination of neural network and genetic algorithm. Proc. Inst. Mech. Eng. Part. B-J. Eng. Manuf. 2010, 224, 1717–1724. [Google Scholar] [CrossRef]
- Simpson, T.W.; Poplinski, J.D.; Koch, P.N.; Allen, J.K. Metamodels for Computer-based Engineering Design: Survey and recommendations. Eng. Comput. 2001, 17, 129–150. [Google Scholar] [CrossRef]
- Oh, S.I.; Chen, C.C.; Kobayashi, S. Ductile Fracture in Axisymmetric Extrusion and Drawing—Part 2: Workability in Extrusion and Drawing. J. Eng. Ind. 1979, 101, 36–44. [Google Scholar] [CrossRef]
- Lu, B.; Ou, H.; Cui, Z.S. Shape optimisation of preform design for precision close-die forging. Struct. Multidisc Optim. 2011, 44, 785–796. [Google Scholar] [CrossRef]
- Jin, R.; Chen, W.; Sudjianto, A. An efficient algorithm for constructing optimal design of computer experiments. J. Stat. Plan. Inference 2005, 134, 268–287. [Google Scholar] [CrossRef]
- Kennedy, J.; Eberhart, R. Particle swarm optimization. Neural Netw. 1995, 1944, 1942–1948. [Google Scholar] [CrossRef]
- Shi, Y.; Eberhart, R. A modified particle swarm optimizer. In Proceedings of the 1998 IEEE International Conference on Evolutionary Computation Proceedings, IEEE World Congress on Computational Intelligence (Cat. No.98TH8360), Anchorage, AK, USA, 4–9 May 1998; pp. 69–73. [Google Scholar] [CrossRef]
- Wang, D.S.; Tan, D.P.; Liu, L. Particle swarm optimization algorithm: an overview. Soft Comput. 2018, 22, 387–408. [Google Scholar] [CrossRef]
© 2019 by the authors. Licensee MDPI, Basel, Switzerland. This article is an open access article distributed under the terms and conditions of the Creative Commons Attribution (CC BY) license (http://creativecommons.org/licenses/by/4.0/).

