Abstract
The quality of the resistance spot weld is predicted qualitatively using information from the weld’s external apparent image. The predicting tool used for weld qualities was a convolution neural network (CNN) algorithm with excellent performance in pattern recognition. A heat trace image of the weld surface was used as information on the external apparent image of welds. The materials used in the experiment were advanced high strength steel (AHSS) with 980 MPa strength, and uncoated cold-rolled (CR) steel sheets and galvannealed (GA) steel sheets were used. The quantitatively predicted weld quality information contained tensile shear strength, nugget diameter, fracture mode of welds, and expulsion occurrence. The predicted performance of the verification step of the model determined through the learning process was as follows; the predicted error rate for tensile shear strength and nugget diameter were 2.2% and 2.6%, respectively. And the predicted accuracy on fracture mode and expulsion occurrence was 100%.
1. Introduction
The ability to predict or evaluate the quality of resistance spot welding (RSW) in real-time using nondestructive methods is key to the automation of automotive assembly processes. The tensile shear strength (TSS) of the weld, nugget diameter, button size after the peel test, and failure mode (interfacial fracture or pull-out fracture) have generally been used as evaluation items of the conventional resistance spot welding. However, since the quality evaluation method requires time and manpower, many studies have been conducted to predict the quality nondestructively. Several research results predicted quality using the process variable setting conditions. Hao et al. [1] studied statistical models on nugget diameter, weld strength, and expulsion according to process variable conditions using multiple linear regression analysis. Muhammad et al. [2] proposed the models to predict the growth of nugget diameter and heat-affected zone (HAZ), which consisted of welding current, welding time and hold time as variables using the surface response analysis method in RSW of mild steel. Darwish et al. [3] studied the prediction model of TSS, which consisted of welding current, electrode force, welding time, and material thickness as variables using surface response analysis method in aluminum resistance spot welding. Choi et al. [4] studied the optimal welding conditions with electrode force and welding current as variables using the response surface analysis method and demonstrated that the minimum nugget diameter of 4 guaranteed the minimum button fracture in RSW of 980 MPa third-generation AHSS. Studies on the quality prediction of resistance point welds using numerical analysis have been reported as follows. Nied et al. [5] reported that the simulated results were very excellent when the finite element modeling of RSW process included heat transfer-electrical behavior-mechanical balance equations and temperature-dependent material properties. The results of the study on the quality evaluation of resistance spot welds using nondestructive detection technology were also reported. Denisov et al. [6] measured the nugget diameter using the 2D ultrasonic arrays technique (PAUT). However, this method has shown the disadvantage of requiring expensive ultrasonic equipment or added processes. Predictive models by statistical regressive methods had limitations inaccurate quality predictions because the condition of the electrode surface in continuous welding did not reflect changes in weld quality due to contamination.
Studies of predicting the weld quality using measured waveforms of welding process variables (current, voltage, dynamic resistance, displacement, etc.) have been reported. Johnson et al. showed that the weld quality was different due to variations in electrode displacement [7]. Dickinson et al. [8] studied the mechanism for controlling expulsion occurrence conditions using a dynamic resistance monitoring system that can continuously monitor voltage, current, resistance, and power during RSW. Brown et al. [9] tried to applicate data of standardized dynamic resistance waveform, welding current waveform and electrode diameter to the artificial neural network to predict the nugget diameter, which is closely related to weld strength. Dilthey et al. [10] reported a neural network, in which changes in welding parameters, test materials, and electrode wear are considered, that can perform very well in evaluating the quality of spot welds. Wan et al. [11] proposed a weld quality monitoring approach based on dynamic resistance signal to predict the nugget size and failure load for the resistance spot welding of titanium alloy. Xing et al. [12] proposed a scheme of online quality monitoring of RSW using the random forest (RF) classification featuring with dynamic resistance signals. Also Hwang et al. [13] reported that the predicted error rate was within 5% using adaptive resonance theory (ART) artificial neural network (pattern recognition). The input parameters used were welding current, the voltage between electrodes and welding power waveforms and the output parameters used were TSS and the nugget diameter.
Some studies on the quality evaluation of welds through image analysis have also been reported. Ruisz et al. [14] reported quality evaluation of resistance spot weld based on computer vision algorithm. Simončič et al. [15] predicted the resistance spot weld strength from electrode tip displacement/velocity by image processing.
On the other hand, light-weighting of the automotive body to improve fuel efficiency has been rapidly taking place around the world. As a result, the application of third-generation AHSS steel is expanding. The optimal welding conditions of these GPa-grade steels have a very narrow range compared to conventional AHSS steels, and the interfacial fracture occurs frequently in the weld fracture mode. Also, differences in weld quality may occur under the same welding conditions. Therefore, it is urgent to predict the quality of the welds in RSW of these third-generation AHSS steel.
In RSW, the shape of the weld ultimately has an important effect on the weld quality, no matter what welding equipment is used. In RSW, a heat trace is produced around the weld surface due to a high current input. The heat traces are formed in round shapes and colors. The greater the heat input and the greater the melt, the greater the range of the heat trace and the deeper the indentation depth. In other words, the increase in weld current and weld time will result in an increase in the weld and HAZ, while increasing the size of the same time.
The purpose of this study is to suggest how to predict the weld quality of GPa-grade steel, where the quality of welds (TSS, nugget diameter, and fracture mode) varies significantly despite slight changes in the process setting conditions. For this purpose, a heat trace image of the surface appearance of welds was used as a determinant factor of weld quality after welding of RSW of a two-layer 980 MPa steel. These images are slightly different between zinc-coated steel and uncoated steel in the case of GPa-grade steel with the same strength. In this study, these heat trace images were used as an input variable, and the qualities of the weld (TSS, nugget diameter, and fracture mode of the weld (interfacial or button)) were predicted through the convolution natural network (CNN) algorithm using uncoated cold-rolled (CR) and galvannealed (GA) steel sheets. The prediction performance of qualities was investigated in the learning process and verification process with different experimental data sets.
2. Experiments and Learning Methods
2.1. Materials and Welding Conditions
The materials used were GA steel sheet and CR steel sheet with the tensile strength of 980 MPa (21% elongation). The thickness of the material is 1.2 mm for both sheets. The test specimen was prepared by ISO 10447:2015 specifications. The length and width of specimen used were 100 mm and 30 mm, respectively with the overlap of 30 mm as shown in Figure 1. The chemical composition and mechanical properties of the materials used are shown in Table 1. The welding equipment used in the experiment is a medium frequency direct current (MFDC) welder.
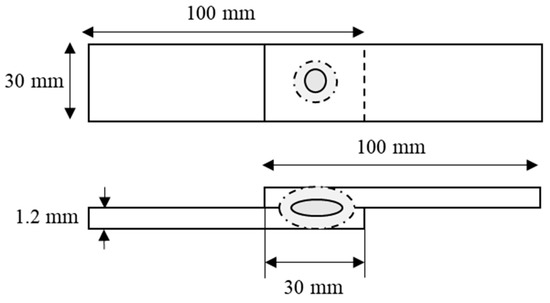
Figure 1.
Geometry of welding specimen.

Table 1.
The chemical composition and mechanical properties of 980 MPa-grade GA, CR steel.
Dome type electrode with an electrode face diameter of 6 mm is applied, whose detailed dimensions are shown in Figure 2.
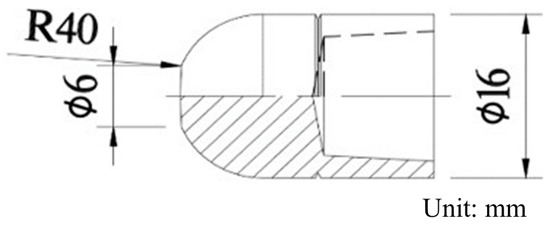
Figure 2.
Schematic diagram of electrode.
The process setting conditions of RSW for CNN learning are shown in Table 2. Welding parameters mentioned in Table 2 are determined through the weld lobe for same base material and joint geometry used in this study. To reduce test errors, 10-iteration welding was conducted for each welding condition. Five of ten welded specimen were used to measure TSS, while the other five were used to measure the nugget diameter. Weld current was set to three levels of 4.0, 5.5, and 7.0 kA. Weld time was also set to three levels of 250, 333, and 417 ms. The electrode force was fixed at 300 kgf.
Table 2.
Welding conditions of training data set.
2.2. Weld Surface Appearance Image Processing
Figure 3 is a conceptual diagram of the surface appearance of the weld. Though not expressed in Figure 3, the photographing was carried out within an enclosed space where no outside light could enter. Illumination was used for the same exposure to the surface of the weld. The distance between the illuminating and the surface of the weld was 2 m and illuminated with an angle of 30° from vertical. The color of the light was white. The amount of light is 1600 lm. The distance between the surface of the weld and the camera was 120 mm vertically. The pixel size of the image taken was 128 × 128. The original image taken was a color image, but in this study, it was converted to a gray image and used as a quality prediction video input data. The data values of each pixel of the converted gray image were normalized as values between [0, 1] with the minimum value of 0 and the maximum value of 1. The mapped image between 0 and 1 and those image processing process is shown as Figure 4.
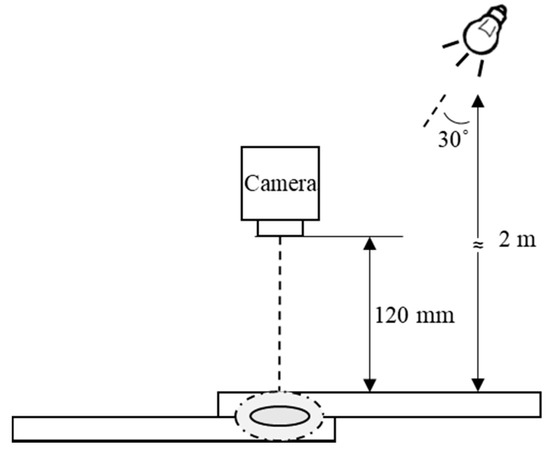
Figure 3.
Condition of image data capture.
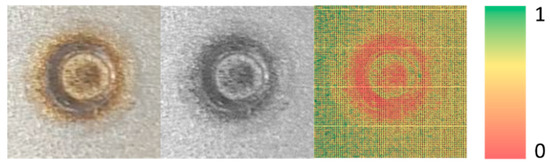
Figure 4.
Image data conversion process.
2.3. Convolution Neural Network Algorithm for Prediction of Weld Quality
In this study, CNN was used to predict the quality of RSW. CNN is one of the deep learning algorithms that showed excellent performance in image recognition. In the general in-depth neural network, the meaning of successive lines and shapes of images is occasionally ignored when analyzing images. Each pixel datum affects all nodes. Input data of the general in-depth neural network have been flattened with simple one-dimensional vector data, and have been learned. So, limitations in the prediction accuracy have been shown. However, the convolution layer uses a kernel of a specified size in the shape of the image data. Image is reconstructed by extracting characteristic variables from areas as large as kernel sizes. So, the successive lines or characteristic data influences the results. As a result, the convolution neural network shows the prediction performance with higher accuracy in image recognition. Figure 5 shows the structure of CNN applied in this study. A total of 90 heat trace images were taken for each parameter of welding in two types of steel. The pixel size of each image was 16,384 pixels (128 × 128). After converting to Gray image, all pixel data were normalized as values between 0 and 1. Mapped image data was used as input data. A total of four CNN models for predicting the weld qualities were obtained using the input mapped data. Each model predicts the TSS, nugget diameter, fracture mode, and expulsion occurrence, which are criteria for determining the quality of RSW. Therefore, each model has different weights and biases.
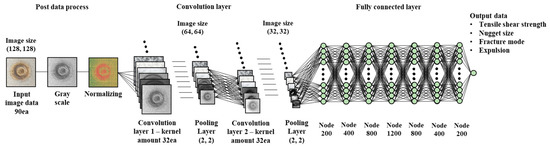
Figure 5.
Convolution neural network algorithm for weldability prediction.
Two layers were used as the hidden layer of CNN for predicting the TSS and the nugget diameter. Also, two layers were used as pooling layer. One layer with 200 nodes was used as the hidden layer of CNN for predicting the fracture shape and the expulsion occurrence. The method of slope used (optimizer) used Adam. The rectified linear unit (ReLU) function was used as an activation function for predicting the TSS and the nugget diameter. The sigmoid function was used as an activation function for predicting the fracture shape and the expulsion occurrence. The reason for using the sigmoid function is that it is more accurate than the ReLU when predicting the results by classifying the results of the prediction by 0 and 1, such as fracture shape and expulsion occurrence. The function of the ReLU and its differential values are shown in Equations (1) and (2), respectively.
The ReLU function has zero slope value when the output value is negative and one when the output value is positive. Even if the neural network layer is thick, the differential value is 1 when the output value is positive, so the parameter renewal of each node is made during an error backpropagation procedure. In this process, the characteristics of input data greatly affect parameter updates. Thus, the ReLU function contributes to increasing the accuracy of the neural network model. The exact parameter values of the applied CNN algorithm are specified in Table 3.
Table 3.
Convolution neural network algorithm for weldability prediction.
The learning process of neural networks is the process of finding the optimum values of weights and bias values using the training dataset. Repeated learning was conducted to find parameters (weights and bias values) with minimum error values between the actual and calculated results using the error calculation, as shown in Equation (3).
where yk is the desired output tk is the target output.
3. Results and Discussion
3.1. Result of Welding Experiments for Surface Heat Trace
Figure 6 represents the heat trace images of the weld surface under several welding conditions. It has been found that the more current and time the welds have, the greater the heat marks on the surface of the specimen. The dilation of the heat trace means an increase in the TSS and the nugget diameter. The GA sheet showed heat traces smaller than CR sheet. Figure 7 is the converted gray images of welds in CR sheet used in the test. According to Figure 7, the image of the heat trace at the same welding current and time was not the same. In addition to welding conditions, many factors affect welding, so each image is very slightly different. In particular, the last image of Figure 7 was shown as a dimmer heat trace, with no apparent circumference of the heat trace circles than the other four.
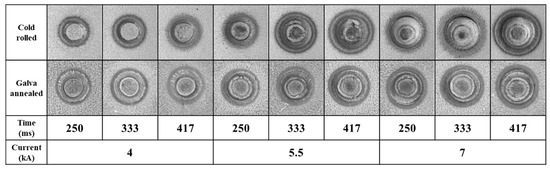
Figure 6.
Reference welds part images of all parameter.
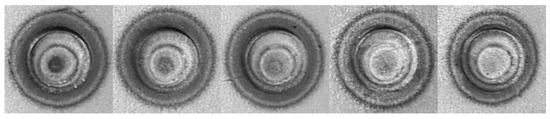
Figure 7.
Various gray images of welds in CR steel sheet under the welding time of 417 ms and welding current of 7 kA.
3.2. Comparison of Welding Quality Results and Predicted Values According to Welding Conditions
The actual measured values and the predicted values by CNN on the TSSs, the nugget diameters, the fracture shapes, and the expulsion occurrence at all welding conditions were shown in Table 4. In the fracture mode, the button fracture was marked as 1 and the interfacial fracture as 0. In the case of CR steel sheet, the expulsion was occurred at the welding current of 7 kA, regardless of the welding time. The TSS was shown a maximum of 19.2 kN and the nugget diameter was enlarged to 6.3 mm. In the case of GA, no expulsions were occurred at welding current 7 kA and interfacial fractures have occurred under all conditions. The TSS was shown up to 19.4 kN and the nugget diameter was enlarged up to 6.1 mm.
Table 4.
Results of spot weldability for each parameter.
3.3. Neural Network Learning Using CNN
Figure 8 is a graph that compares the measured and predicted TSSs at all welding conditions of the learning process. The prediction accuracy of the TSSs used for learning process was 98.6% and the coefficient of determination was 0.9943. Figure 9 is a graph to compare between the measured and the predicted nugget diameters at all welding conditions of the learning process. The prediction accuracy of the nugget diameters used for learning process was 98.8% and the coefficient of determination was 0.9857.
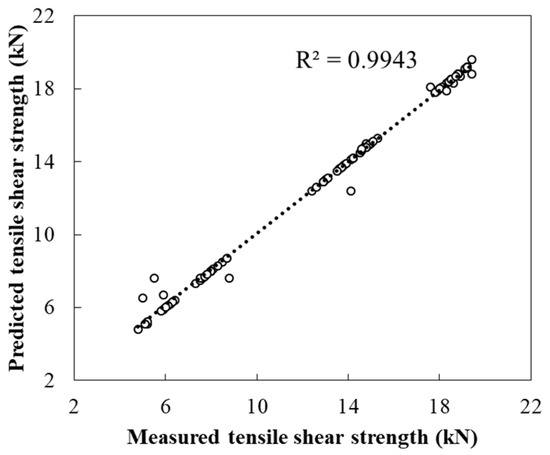
Figure 8.
Correlation between predicted and measured values of tensile shear strength.
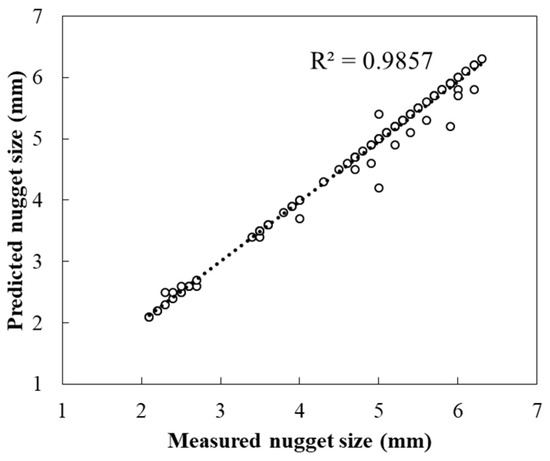
Figure 9.
Correlation between predicted and measured values of nugget diameter.
Figure 10 shows the predicted results of the fracture shapes and expulsions. In the fracture mode prediction, value 0 means the interfacial fracture, and 1 means the button fracture. In the expulsion occurrence prediction, 0 means no expulsion occurrence, and 1 means expulsion occurrence. As a result, both the prediction accuracies of the fracture shape and the expulsion occurrence were 100% at all welding conditions. In Figure 10, all the data on the graph is concentrated on 0 and 1, and it is seen as only one point.
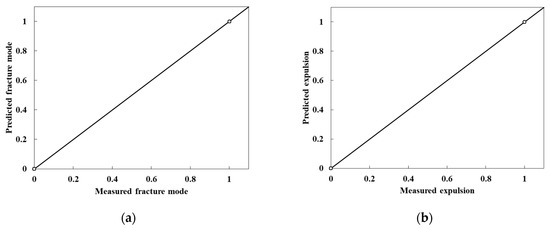
Figure 10.
Correlation between predicted and measured values of (a) fracture mode and (b) expulsion.
Figure 11 is a graph that is grouped by steel from the predicted results of Figure 8 and Figure 9. The predicted accuracy of TSS of CR steel was 99.5% and the coefficient of determination was 0.9978. The predicted accuracy of the nugget diameter was 98.9% and the coefficient of determination was 0.9732. The predicted accuracy of TSS of GA steel was 97.7% and the coefficient of determination was 0.9923. The predicted accuracy of the nugget diameter was 98.7% and the coefficient of determination is 0.9908. Comparing the predicted accuracy of TSS and the nugget diameter by steel type, CR steel was shown slightly higher accuracy than GA steel. This is thought to be because the heat traces vary depending on whether the surface is plated or not. In the surface heat trace images of the CR steel of Figure 6 above, the surface colors among the indented zone, shoulder zone, and HAZ were bounded and widely spread. It is thought that the difference between these colors may have affected the accuracy of the prediction. In the case of GA steel of Figure 6, the surface colors were slightly dim than CR steel. So, the prediction accuracies of GA steel were shown slightly lower than CR steel. It meant that input data were different depending on the surface heat trace image of different material types.
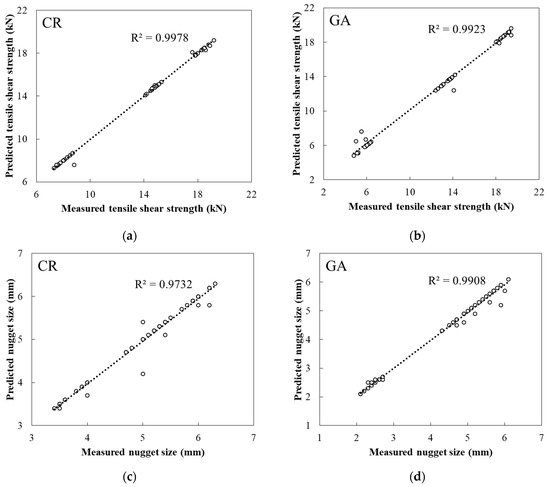
Figure 11.
Comparison between predicted and measured values for (a) tensile shear strength of CR and (b) GA steel sheets, (c) nugget size of CR, and (d) GA steel sheets.
3.4. Verification of Predictive CNN Models
The setting conditions of RSW for CNN verification are shown in Table 5. A total of 4 welding conditions were selected and the verification experiment was repeated five times at same one condition. For these four verification test conditions, welding current and welding time were selected, except for the welding conditions used in the learning.
Table 5.
Welding conditions of verification data.
Table 6 shows the measured and predicted results using the CNN model produced during the learning process in the 20 verification conditions of. The maximum prediction error was 1 kN for TSS and the error of nugget diameter was max 0.5 mm. Fracture shape and expulsion occurrence were correctly predicted in all verification tests.
Table 6.
Results of verification test.
Figure 12 is a graph comparing the predicted and measured values of TSS and nugget diameter in the verification test results. The predicted accuracy of TSS was 97.8% and the coefficient of determination was 0.9463. For nugget diameter, the average accuracy of the forecast was 97.4% and the coefficient of determination was 0.888. The predicted results of the verification tests demonstrated that CNN quality prediction is highly accurately predicted using surface heat trace images of welds in RSW.
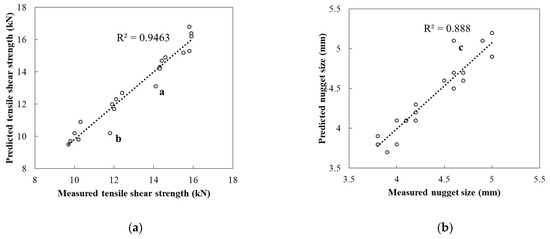
Figure 12.
Correlation between predicted and measured values of (a) tensile shear strength and (b) nugget diameter.
Figure 13 shows a surface heat trace image of welds with lower prediction accuracy in verification tests. In Figure 13a–f, data with large errors between measured and predicted values are shown. For Figure 13a,b, the measured value was measured at 11.8 kN, while the predicted value was 10.2 kN with a 13.6% error rate. Comparing with the other surface heat trace images at the same condition, the abnormal heat trace shape stains at shoulder zone was shown, differencing from the heat trace shape of the normal circular shape. For Figure 13c,d, the measured value of TSS was 15.8 kN, the predicted value was 16.8 kN, and the error was 6.3%. Comparing with the other surface heat trace images of the same condition, the bigger black circle at the center of the indented zone was shown. In the case of Figure 13e,f, the measured value of nugget diameter was 4.6 mm while the predicted value was 5.1 mm and the error rate was 10.9%. Comparing with the other surface heat trace images of the same condition, due to the lack of focus in the photographing process, the entire weld area was blurred with a little clear boundary. The state of the image may have been viewed differently because the state of the light in the learning and the state of the light in the verification process did not match exactly. This study tried to predict qualities of welds using the surface heat trace images in RSW. By using this prediction technique, it is possible to predict the quality of the resistance spot weld in the production line. It also enables monitor the weld quality and reduces the defect rate. However, the surface heat trace images depend on heat transfer conditions, contamination of electrodes, the slope of electrodes, misalignment, etc. Therefore, it is very important to obtain an image under the same photographing condition to make accurate prediction. Prediction of weld quality when the image condition is bad or inaccurate as mentioned above will be discussed in future studies. Also, in this study, the weld quality is predicted by applying CNN to base material and welding conditions under specific conditions. If the type, thickness of base material and welding conditions are different, it is expected that accurate welding quality can be predicted by optimizing the weight between nodes through additional learning.
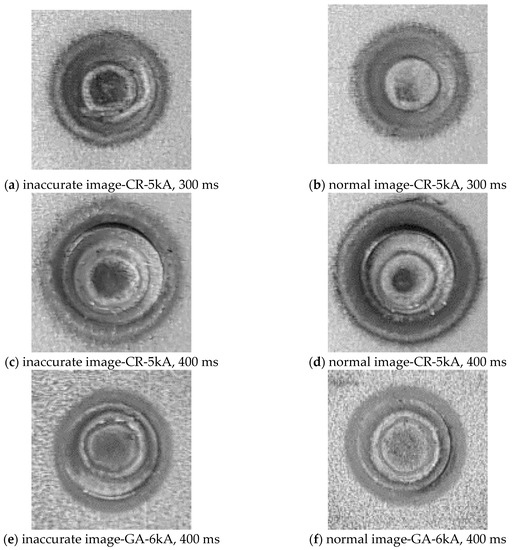
Figure 13.
Images with inaccurate predicted values.
4. Conclusions
Using the surface heat trace image of weld in the resistance spot welding of 980 MPa-grade GA steel and CR steel as an input variable of convolution neural network, tensile shear strength, nugget diameter, fracture shape, and expulsion occurrence were predicted, and the following conclusions were obtained.
- (1)
- In the learning process, the coefficient of determination of tensile shear strength is 0.9943 and the coefficient of determination of nugget diameter is 0.9857. In the verification process, the predicted average error rate of tensile shear strength and nugget diameter are 3.2% and 2.6%, respectively, and the fracture shape and expulsion occurrence are accurately predicted. It has been demonstrated that accurate quality predictions can be made using the image of the welds in resistance spot welding.
- (2)
- Even if the surface treatment of steel is different, it has been proven that good weld quality can be predicted.
- (3)
- In the process of photographing a surface heat trace image, if disturbances that affect the image, such as the focus or lighting of the camera, occur, a large error in the prediction of quality can occur.
Author Contributions
Conceptualization, M.K.; Investigation, S.-G.C. and I.H.; Methodology, I.H., B.K., and M.K.; Supervision, M.K.; Writing—original draft, S.-G.C.; Writing—review & editing, Y.-M.K. and M.K.
Funding
This work was supported by the World Class 300 Project (R & D) (S2482274, Development of flexible production platform technology for smart factory of multi-vehicle car body) of the SMBA (Korea).
Acknowledgments
The authors would like to acknowledge the support provided by the SMBA (Korea).
Conflicts of Interest
The authors declare no conflicts of interest.
References
- Hao, M.; Osman, K.A.; Boomer, D.R.; Newton, C.J. Developments in characterization of resistance spot welding of aluminum. Weld. J. 1996, 75, 1–8. [Google Scholar]
- Muhammad, N.; Manurung, Y.H.P.; Hafidzi, M.; Abas, S.K.; Tham, G.; Haruman, E. Optimization and modeling of spot welding parameters with simultaneous multiple response consideration using multi-objective Taguchi method and RSM. J. Mech. Sci. Tech. 2012, 26, 2365–2370. [Google Scholar] [CrossRef]
- Darwish, S.M.; Al-Dekhial, S.D. The response surface approach to spot welding commercial aluminum sheets. Mater. Manuf. Process. 1998, 13, 189–202. [Google Scholar] [CrossRef]
- Choi, S.G.; Hwang, I.; Kang, M.; Hyun, S.; Kim, Y.-M. Optimization of welding parameters in resistance spot welding of 980 MPa grade GA steel sheet using multi-response surface methodology. J. Welding Joining (in Korean) 2018, 36, 63–69. [Google Scholar] [CrossRef]
- Nied, H.A. The finite element modeling of the resistance spot welding process. Weld. J. 1984, 285, 123–132. [Google Scholar]
- Denisov, A.A.; Shakarji, C.M.; Lawford, B.B.; Maev, R.G.; Paille, J.M. Spot weld analysis with 2D ultrasonic arrays. J. Res. Natl. Inst. Stand. Technol. 2004, 109, 233–244. [Google Scholar] [CrossRef] [PubMed]
- Johnson, K.I.; Needham, D.J.C. New design of resistance spot welding machine for quality control. Weld. J. 1972, 51, 122–131. [Google Scholar]
- Dickinson, D.W.; Franklin, J.E.; Stanya, A. Characterization of spot welding behavior by dynamic electrical parameter monitoring. Weld. J. 1980, 254, 170–176. [Google Scholar]
- Brown, J.D.; Rodd, M.G.; Williams, N.T. Application of artificial intelligence techniques to resistance spot welding. Ironmak. Steelmak. 1998, 25, 199–204. [Google Scholar]
- Dilthey, U.; Dickersbach, J. Application of neural networks for quality evaluation for resistance spot welds. ISIJ Int. 1999, 39, 1061–1066. [Google Scholar] [CrossRef][Green Version]
- Wan, X.; Wang, Y.; Zhao, D. Quality monitoring based on dynamic resistance and principal component analysis in small scale resistance spot welding process. Int. J. Adv. Manuf. Technol. 2016, 86, 3443–3451. [Google Scholar] [CrossRef]
- Xing, B.; Xiao, Y.; Ain, Q.H.; Cui, H. Quality assessment of resistance spot welding process based on dynamic resistance signal and random forest based. Int. J. Adv. Manuf. Technol. 2018, 94, 327–339. [Google Scholar] [CrossRef]
- Hwang, I.; Yun, H.; Yoon, J.; Kang, M.; Kim, Y.-M. Prediction of resistance spot weld quality of 780 MPa grade steel using adaptive resonance theory artificial neural networks. Metals 2018, 8, 453. [Google Scholar] [CrossRef]
- Ruisz, J.; Biber, J.; Loipetsberger, M. Quality evaluation in resistance spot welding by analysing the weld fingerprint on metal bands by computer vision. Int. J. Adv. Manuf. Technol. 2007, 33, 952–960. [Google Scholar] [CrossRef]
- Simončič, S.; Podržaj, P. Resistance spot weld strength estimation based on electrode tip displacement/velocity curve obtained by image processing. Sci. Technol. Weld. Joi. 2014, 19, 468–475. [Google Scholar] [CrossRef]


© 2019 by the authors. Licensee MDPI, Basel, Switzerland. This article is an open access article distributed under the terms and conditions of the Creative Commons Attribution (CC BY) license (http://creativecommons.org/licenses/by/4.0/).