1. Introduction
Heating is the main energy demand in cold climate regions, and with a growing global population and number of urban cities, the number of heated areas is also increasing. With the building sector accounting for approximately 40% of the total energy consumption in the European Union [
1], out of which two-thirds is used for space heating [
2], energy efficiency in buildings is and continues to be an important issue. According to the Swedish Energy Agency, in 2014, the total final energy use for heating and hot water in households was about 82 TWh [
3]. Current goals for the reduction of energy use in Sweden is 20% by 2020 and 50% by the year 2050, both in comparison to the reference year 1995 [
3].
In Sweden, single-family houses have a large share of the total heat demand, slightly more than 40% [
1]. Furthermore, operational energy cost is higher for single-family houses in comparison with multi-family houses as well as premises [
4]. There are many types of heating systems for single-family houses that can be classified based on different parameters such as energy sources, heat carrying medium as well as the heat transmitting process. The focus in this study is hydronic systems. Hydronic heating systems are one of the most energy efficient heating system technologies that uses water in order to distribute heat to the indoor space. The most commercial types of hydronic heating systems are hydronic floor heating and radiators.
Floor heating systems operate with low-temperature energy sources thus having the most advantages over other heating systems. Therefore, it is feasible to integrate the floor heating system with any thermal renewable energy system such as solar-assisted or geothermal heat pump and low-temperature district heating system [
5]. Robust control, feet warming, and uniform temperature distribution are other advantages of floor heating [
6]. Besides providing a pleasant feeling when walking on a heated floor, a warm floor is a dry floor and reduces any chances for growth of mites and other allergenic organisms. People with allergies often prefer radiant heat, because it does not distribute allergens like forced air systems [
7,
8,
9]. However, a floor heating system’s performance is highly dependent on the building construction type as well as flooring conditions. The heat emitted by the floor heating system is transmitted in both direction (i.e., into the room and toward the ground), which means there is a risk of considerable heat loss with a poor underground insulation layer. This leads to higher investment costs of system in the case of renovation and higher initial costs for new buildings.
Furthermore, the flooring’s thermal inertia has a direct impact on the indoor climate condition and energy system performance. Flooring material with higher thermal storage capacitance causes a relatively long response time to a sudden climate change condition. This means with quick outdoor temperature drops, this type of flooring material can help to keep an even indoor temperature, but when the outdoor temperature quickly rises, there is a risk of overheating, since the heating system is slow to adapt. Alternatively, by considering a flooring material with lower thermal storage capacitance, such as laminate, the heating system should be quicker to adapt to changing conditions [
10]. Moreover, it is common to place radiators underneath windows to reduce the heat loss due to the downdraughts from cold windows’ surface which make it also a local heating system in comparison with a floor heating system that is a widespread heating distribution system.
In summary, by introducing low-temperature and highly efficient radiator systems, the supply temperature for both system is almost the same [
11]. However, there are some contradictory results from previous studies on the annual heating demand for radiator and floor heating systems in buildings. Therefore, the main aim of this study is to compare the annual heating demand for a single family house built to either the Swedish building regulation (BBR) or passive house criteria, and coupled with radiators or floor heating as heat distribution system. A further aim is to investigate the effect of flooring material on the annual supply heating demand of the buildings.
2. Hydronic Heating System
The hydronic heating system can be assessed by considering different aspects including total heat supply, thermal comfort, investment, and operation and maintenance costs. In this section, an overview of previous studies on radiators and floor heating systems is briefly provided.
2.1. Radiators
Radiator heating systems can be found as sectional cast-iron columns, large-tube units, flat panel types, and fabricated steel sectional types. In this study, panel radiators were considered as the radiator heating system, since these type of radiators are one of the most popular radiator types in residential buildings [
12]. The energy performance of radiators has been studied widely, but they are mostly connected to the effect of different types of energy carriers on the building’s energy performance as well as the radiator configuration and supply temperature assessment.
Brembilla et al. [
13] studied a transient model of a hydronic panel radiator. The panel radiator was modelled numerically, and the outcomes were compared with the experimental results. In the study, the effect of the transition period in the system modeling on the energy performance evaluation was assessed. In the study, a transition system modeling was compared with the lumped steady-state model. The results showed that the lumped steady-state model caused an overestimation on emitted heat. Jangsten et al. [
12] assessed the supply and return temperature from radiators in Sweden through a statistical assessment. The average supply and return temperatures were found to be 64 °C and 42 °C, respectively, with a design outdoor temperature (DOT) of −16 °C. Although the radiator systems’ design temperatures were different due to the climate conditions as well as the national energy policy in each country, they also varied throughout the year. The design supply temperature was also very important in terms of total energy consumption which should be evaluated in further studies. In Sweden, district heating systems are the most common hot water generation system which is used for both domestic hot water and water heating system application. The highest design temperatures for the common district heating system in Sweden is about 90/70 °C and 80/60 °C for supply and return temperature, respectively [
14]. However, due to the revision of Swedish building codes, the radiator design supply temperature is restricted and must be lower than 55 °C for most cases but no more than 60 °C in special cases [
15]. Therefore, radiator systems are usually designed for lower supply and return temperatures such as 60/45 °C, 60/40 °C, and 55/45 °C in Sweden [
16]. This leads to having two types of radiator systems in existing buildings: “low” and “high” temperature systems [
17]. Low temperature radiators were studied by Sarbu and Sebarchievici [
9] for an office located at the Polytechnic University of Timisoara in Romania, where the indoor and outdoor air design temperatures were 22 °C and −15 °C, and the supply and return temperatures for the radiator heating system measured were 45 °C and 35 °C, respectively.
A literature review was conducted by Karmann et al. [
18] in order to assess if radiator systems provide better, equal or lower thermal comfort than all-air systems. Karmann et al. [
18] concluded that a limited number of studies are available and, therefore, a solid answer cannot be given. Nevertheless, there is suggestive evidence that radiant systems may provide equal or better comfort than all-air systems.
2.2. Floor Heating
Floor heating systems are a type of radiant panel heating system which is widely used for cold climates such as Sweden. Radiant panel heating systems supply heat directly to the floor, wall or ceiling by means of air, water or electric elements. There are different types of hydronic floor heating systems which are categorized based on their assembly configuration [
19]. The most common type of floor heating assembly configuration is a slab on grade, where radiant tubing is embedded in a screed. The tubing is typically attached to metal mesh with plastic ties. Other types of floor heating assemblies with their estimated assembly
R-Value is given in the
Table 1.
Over the last two decades, several studies have been performed to assess floor heating’s energy performance; however, floor heating systems are still under development.
Weitzmann et al. [
20] assessed the effect of building foundation and floor construction on a floor heating system’s performance using a 2D simulation model of heat losses and temperature in a slab on the ground. The results showed that the foundation and floor type had a considerable effect on heat losses to the ground when a floor heating system was used [
20]. Sattari and Farhanieh [
21] studied the effect of many configuration parameters including the effect of floor cover material, cover thickness, pipe diameters, number of pipes, and other dimension effects for a room. The results showed that the pipe diameters and pipe type had lower effects, but the thickness and type of floor cover had considerable effects on the system’s thermal performance. Karlsson [
22,
23] assessed the supply temperature and self-regulation effect by considering a numerical model in a floor heating system in a single-family house located in Sweden. The effect of floor construction was also assessed. In this study, an optimal supply temperature for a floor heating system was calculated using a predictive control method. The optimization target function was minimizing the energy use, the restriction parameter was thermal comfort, and the supply temperature was considered as the optimized variable. The results for the reference room showed that the optimized supply temperature was relatively steady over time [
22,
23].
In a research project performed by Rahimi and Sabernaeemi [
24], three types of heat transfer mechanisms in a room with a floor heating system were evaluated to assess the contribution of free convection, radiation, and conduction heat transfer from a floor heating system to the room air and other surfaces including the ground. It concluded that the radiation was the substantial mechanism in the heat transferred from the warm surface of the floor to the other surfaces of the enclosure using a floor heating system, whereas 75–80% of this heat loss was provided by the radiation mechanism from the heated floor surface [
24].
2.3. Radiator and Floor Heating System Comparison
There are a few comparative studies on indoor temperature distribution and system cost evaluation for radiator and floor heating systems. However, there are no aligned outcomes in terms of total heat supply for a single-family house with radiators or floor heating. Livonen [
25] showed for a multi-family house building, floor heating has 15–25% higher heat supply compared to low-temperature modern radiator systems. However, there is no other information about the considered building construction type in this study. Persson [
26], in a literature review performed based on several studies conducted between 1970 and 2000, indicated that Swedish single-family houses with floor heating consume more energy than corresponding houses with radiator systems. None of the studies considered the building regulation standards for the proposed case studies. Sarbu and Sebarchievici [
5] concluded that floor heating systems had a lower heat supply than radiator heating systems. They showed in a numerical study that in a well-insulated building, the total heat supply of the radiator heating system was up to 10% greater than the floor heating system. Sarbu et al. [
9], in a separate experimental and numerical study, compared the system coefficient of performance (COP) when a radiator or floor heating system is chosen as the primary heating system in an office building. The results showed that the COP did not change considerably when either radiator or floor heating was used; however, a floor heating system was recommended over the radiator system if the heating systems were coupled to the heat pump due to the fact of its lower supply temperature [
9].
Farooq et al. [
27] performed an assessment of the energy analysis in a building integrated with radiators or floor heating as a heating system in terms of thermal comfort and energy efficiency. The results showed that the heating demand in the building with radiators was 7.5% higher in comparison to a floor heating system.
Khorasanizadeh et al. [
28] performed a numerical study for a two-dimensional enclosure with floor heating, and the obtained results showed that the temperature distribution in an enclosed zone with a floor heating system was more uniform than a centralized heating system such as radiators which create better thermal comfort. Khorasanizadeh et al. [
28] also compared the total heat flux in a floor heating system and a centralized heating system, and it was concluded that a floor heating system will reduce the heat load power. The results also showed that there was better thermal comfort conditions in terms of flow pattern and temperature distribution by using floor heating.
Myhern and Holmberg [
29,
30] conducted a numerical study to compare a traditional two-panel radiator with a ventilated radiator. The results showed the energy savings potential with a ventilated radiator in comparison with a traditional two-panel radiator. The thermal comfort aspect in a room was also assessed for an office building in Sweden. In this study, the flow pattern, air speed movement, and temperature distribution were studied for a commercial heating system including medium- and high-temperature radiator, floor heating, and wall heating systems. The results showed that the location of emitters and the design of ventilation systems are very important. It also concluded that low-temperature heating systems may improve the system performance, but it may cause some local thermal discomfort [
29,
30].
Olson [
8,
31] assessed the energy performance of floor heating and radiators for residential, office, and industrial buildings for three different types of climate conditions—Stockholm, Brussels, and Venice—where the focus was on the amount of heat emission losses, and the energy demand of each case was evaluated. The results showed that the primary energy demand for the floor heating was lower than the radiator system [
8,
31]. Karabay et al. [
7] studied floor heating configuration parameters such as pipe diameter, pipe length, thickness, pipe material, mass flowrate, and supply temperature. A floor heating system’s performance was compared with wall heating in terms of temperature distribution, and the results showed that wall heating is recommended over floor heating. In a recent study, Ma et al. [
32] compared a radiator heating system, as a traditional heating system, and a solar ground heat-pump-integrated floor heating system in an experimental study. The results showed that a floor heating system can save energy by 18.9% compared to traditional radiators.
In an experimental study [
9], the supply and return temperatures for a floor heating system were measured as 42 °C and 36 °C, respectively, when the design outdoor temperature was assumed as −15 °C [
9]. In another study performed by Khorasanizadeh [
28], the supply water temperature for rigid floors is recommended as 45–50 °C based on the design outdoor temperature; while, in suspended floors, this temperature is 55–60 °C. It should be noted that in conventional hydronic hot temperature radiators, the inlet water temperature is 70–80 °C, although this temperature for low-temperature, highly efficient hydronic radiators is reduced to 45°C to 50 °C, the same level as the floor heating supply temperature demand [
28]. A surface temperature of 23–24 °C on the floor is usually enough to obtain a comfortable 18–20 °C indoor temperature [
5,
9].
3. Analyzed Building
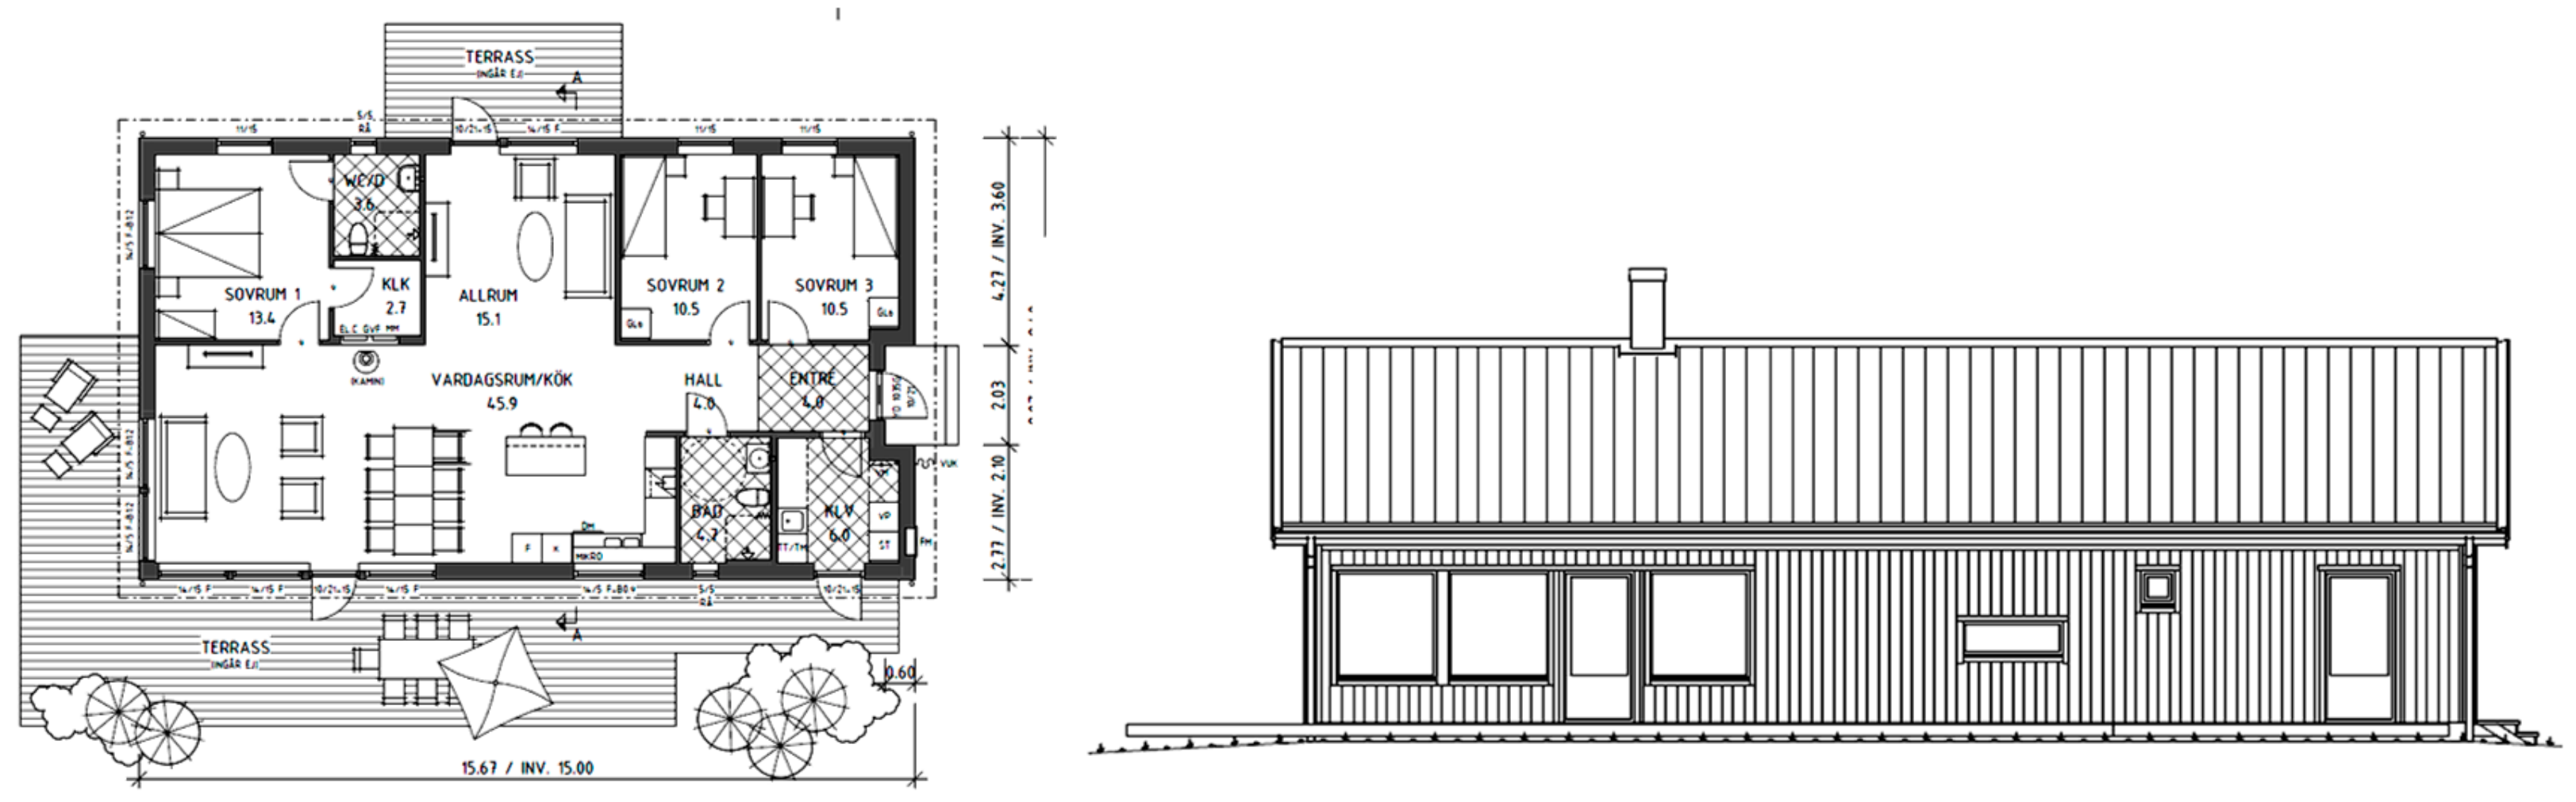
The analysis was based on a typical single-family house designed based on 2015 Swedish building codes and passive house criteria.
Figure 1 shows the ground floor plan and front elevation of the house. The modeled buildings were assumed to be heated with district heat with similar supply temperatures at 45 °C for both the radiator and floor heating systems.
Table 2 shows key architectural details, and
Table 3 shows the thermal characteristics of the modeled buildings.
Two different building construction types based on BBR-2015 and passive building restrictions were considered in this study. In order to consider the relevant building compartments’ thermal properties for passive building conditions, the
U-values were assumed to be similar to an existing certified passive house in Sweden as shown in
Table 3.
Table 4 shows the construction materials excluding the flooring which were considered for the BBR and passive code building models.
The effect of thermal bridges was also considered in both BBR and passive building models. The corresponded total heat transfer coefficient for the linear thermal bridge for the BBR and passive building models were 0.0947 and 0.0344 W/m·K, respectively, using VIP-Energy and implemented into TRNSYS. The VIP-Energy allows detailed analysis of the thermal bridges of buildings. The program has a comprehensive materials and components catalogue and estimates solar radiation available to a building using the Hay–Davies–Klucher–Reindl model [
33]. Mathematical descriptions of other key models used in the VIP-Energy program are described by Jóhannesson [
34] and Nylund [
35]. The corresponding
U-value regarding the thermal bridges losses for different parts of the BBR building were considered as external wall–external wall conjunction: 0.08 W/m·K, external wall–internal wall conjunction: 0.03 W/m·K, windows perimeter: 0.03 W/m·K, roof-external wall conjunction: 0.09 W/m·K, and external wall–slab on ground: 0.14 W/m·K.
The corresponding U-values regarding the thermal bridges losses for the passive building were considered as external wall-external wall conjunction: 0.06 W/m·K, external wall-internal wall conjunction: 0.01 W/m·K, windows perimeter: 0.016 W/m·K, roof-external wall conjunction: 0.056 W/m·K, and external wall-slab on ground: 0.064 W/m·K.
Figure 2 demonstrates the layout of the external wall-external wall conjunction details which were considered to calculate the corresponding thermal bridges building model.
Table 5 provides a list of the studied flooring materials and the corresponding thermal properties as well as the typical and assumed thickness.
The effect of carpet over the flooring materials in both the BBR and passive building models with either a radiator or floor heating system was studied via a sensitivity analysis. In this sensitivity analysis, three types of carpet (carpet 1 to 3) with a corresponding U-value equal to 1.835, 2.381, 3.125 (W/m2K) was defined based on the most common types of carpets available on the market.
The standard values for different parts of the building in BBR-2015 are given in
Table 6.
4. Methods
The analysis in this study was divided into a main analysis and a sensitivity analysis. In the main analysis, the annual supply heat was assessed for both radiator and floor heating systems in BBR and passive buildings, correspondingly. Therefore, the main analysis contained four different models using TRNSYS. TRNSYS is a transient hourly based time-step and multi-zone dynamic energy simulation program and is increasingly used by researchers for analysis of the energy balance of buildings. The program has been validated by an international project proposed by IEA Annex 43/Task 34 [
39]. The reference case, which was developed based on a BBR building heated by a radiator system (previously described in
Section 3), was used to compare the obtained results from the TRNSYS model with the given information from the building owner. Monthly space heating demand for the reference case was compared for validating the developed model and the result is given in
Figure 3. The supplied heating for domestic hot water was assumed to be 24% of the total heating demand [
40], and it was excluded from the total delivered heating energy to the real case for this purpose. The results showed good agreement except for December which can be caused by unoccupancy due to the fact of vacation. The calculated total annual heating demand was 4% more using the TRNSYS model.
4.1. Ground Slab Details
In all studied cases, the ground was modeled as “slab on grade”, called SOG. The SOG was divided based on the distance from the building vertical boarders (
Figure 4). Since the studied building’s length was 15.67 m, the floor area in the reference model was divided into two sections including 43 m
2 as SOG0–1 m and 81.4 m
2 as SOG1–6 m.
The radiator design capacity calculated using Equation (1) based on the ASHRAE method outlined in the 2004 ASHRAE Handbook—HVAC Systems and Equipment [
41].
The performance of the unit can be described as a power function of the difference between the air in the room and the heating medium in the radiator.
where
ts is the average temperature of the heating medium,
ta is the indoor temperature,
c is a constant determined by testing the unit, and
n depends on the type of device. Convector radiator
n is assumed to be 1.5. Since the manufacturers do not release the correction factor c for their products, this parameter needs to calculate based on the design values for the radiator.
where
and
AUST are surface temperature and area-weighted average temperature of uncontrolled surfaces in room.
Based on the radiator types, the approximate distribution between radiation and convection for various heaters is different. In this study and as the reference condition, the single panel radiator with 33% radiation and 67% convection is assumed as the reference condition. Two more radiator types with 15% and 10% radiation are studied as a part of the sensitivity analyses.
In the sensitivity analysis, different types of flooring material were considered instead of the laminate that was chosen in the main analysis. Moreover, as a part of the sensitivity analyses, the effect of the floor heating assembly was studied as well. Based on the estimated assembly
U-value, five types of assembly configurations besides the slab on grade were selected and implemented in both the passive and BBR building models. The implemented floor heating assembly configurations including the assumed
U-value are listed in the
Table 7.
4.2. Time Constant
The DOT is needed to calculate the capacity of the heating system and depends on the time constant of the building. The building time constant was calculated for both the BBR and passive building conditions based on the following equation:
where,
C is the heat capacity of the building materials and
m is the mass. The effect of thermal bridges were considered in the
UA value summation. The
Qvent contains the ventilation (
Qloss−vent) and infiltration (
Qleak) losses. The
Qloss−vent and
Qleak were calculated using following equations.
where
is the ventilation ratio that was 0.351 L/s.m
2 for both cases, but
, which is the air permeability, was 0.6 L/s.m
2 at 50 Pa for the BBR building, while this value for the passive buildings was assumed to be 0.2 L/s.m
2 at 50 Pa. The ventilation heat recovery factor (
) was assumed 0.8 just in the passive building case. The building time constants for the BBR-2015 and passive buildings were calculated as 1 day and 2 days, respectively. Then, based on the Swedish climatic data, the design outdoor temperature for Växjö was −14.4 °C and −13.3 °C for 1 day and 2 days, respectively. Therefore, 15 February and 13 January were chosen as the design day based on the daily average temperature corresponding to the obtained 1 day and 2 days design outdoor temperatures.
4.3. Energy Balance
The annual energy demands for the buildings were calculated hour by hour using the dynamic simulation program TRNSYS. The daily variation and monthly mean values for outdoor air temperature, daily global radiation as well as sunshine hours for the generated and imported 2013 weather file for Växjö are shown in
Figure 5, and the key climate data for energy balance analysis is summarized in
Table 8.
The main values and assumptions for the energy balance calculations are listed in
Table 9. The calculations were based on the hourly time step in all simulation tools. The ground temperature for all developed models was considered to be 10 °C. The internal heat gains for all models consisted of occupancy, lighting system, electrical devices, and hot water circulation. The indoor heating set-point temperatures were 21 °C for both radiator and floor heating system modeling.
5. Results
The results are categorized into two sections including main analysis and sensitivity analysis. In order to validate the model, a reference model developed based on given information on the studied building and the results were compared in terms of supply heating demand. The studied building is connected to the district heating system. The main analysis consisted of the supply heating demand as well as the floor heat transmission losses for all studied cases. Finally, the sensitivity analysis was performed in terms of assessing the changes in the supply heating demand due to the various studied parameters.
5.1. Main Analysis
The heating demand variation for all studied cases on the corresponding design day (15 February for the BBR building and 13 January for the passive building) were assessed (
Figure 6,
Figure 7,
Figure 8 and
Figure 9). As shown in
Figure 6 and
Figure 8 for the BBR and passive building, respectively, the heating demand during the design day in the case of floor heating was higher than the radiator-heated building. The daily heating demand for the BBR building using radiators and floor heating was 57.7 kWh and 70.2 kWh, respectively, while the total daily heating demand using radiator and floor heating for the passive building was 48.4 kWh and 68.6 kWh, correspondingly.
Figure 7 shows that the floor transmission heat losses in the floor heating integrated system on the design day was more than the radiator-heated building. In the passive building, the number of hours with no heating demand was higher in the case of floor heating. However, during the rest of the day, the corresponding supply heating demand in the floor heating system was higher than the radiator system.
Figure 9 shows that the floor transmission heat losse islower for the radiators in passive building.
The effect of using either floor heating or radiators on the daily variation in supply heating demand for both the BBR and passive building was assessed and is presented in
Figure 10 and
Figure 11. The results show that in both the BBR and passive buildings integrated with the floor heating system, there was a higher heating demand. The maximum supply heating demand in the floor heating system in the passive building did not change; however, this value slightly reduced for the radiator heating system in comparison with the BBR building condition.
If the floor heating system is used in a well-insulated building with an energy demand that is lower than the minimum energy that can be provided, the system may turn on and off and thereby provide uneven heating supply.
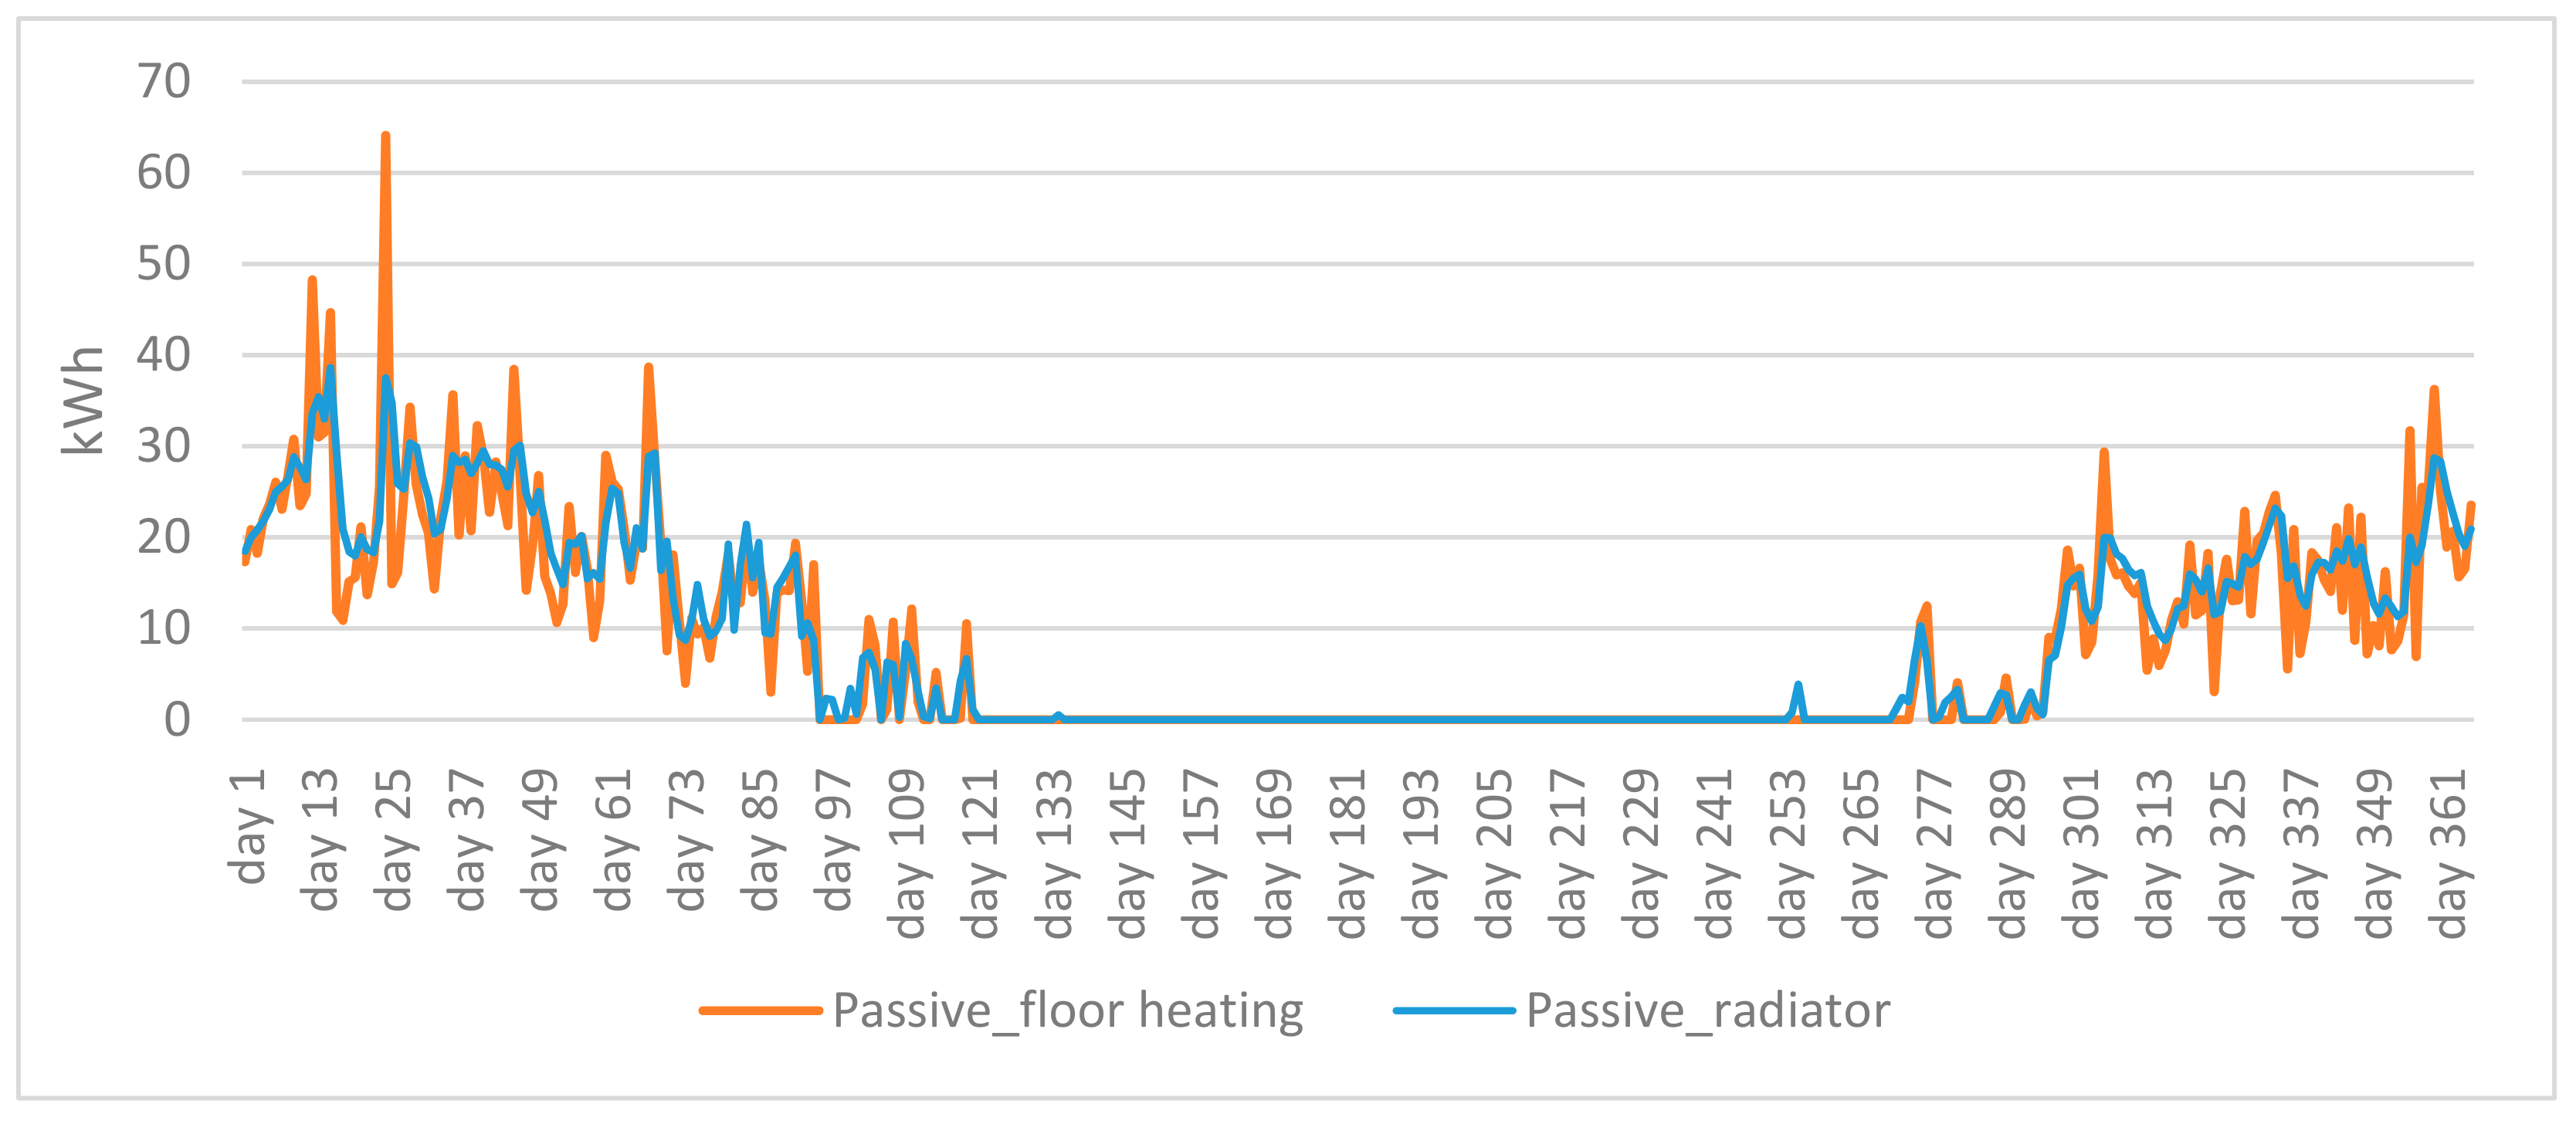
However, the total annual supply heating demand for the floor heating system was higher in comparison with the radiator heating system. The total annual supply heating demand for the studied BBR buildings in the reference model was 57 kWh/m2 and 64 kWh/m2 for the radiator and floor heating systems, respectively, while this amount for the passive building was 24 kWh/m2 and 44 kWh/m2 for the radiator and floor heating systems, correspondingly.
The floor transmission heat loss in the BBR building was 32 kWh/m2 and 35 kWh/m2 for the radiator and floor heating systems, correspondingly. This parameter in the passive building was not affected by considering the heating distribution system, as it calculated 29 kWh/m2 and 30 kWh/m2 for the radiator and floor heating systems, respectively. The results showed that in both types of building conditions, the floor heating system caused higher floor transmission heat losses in comparison with the radiator heating system.
The supply heating demand variation based on the outdoor temperature was calculated based on the design day heating profile for both the BBR and passive buildings integrated with radiator and floor heating systems. As shown in
Figure 12, the heating demand for floor heating was influenced more by outdoor temperature in comparison with radiator heating. In both the BBR and passive buildings, which were equipped with floor heating systems, the maximum heating demand increased by 100% when the outdoor temperature decreased by 10 degrees, while, in the same building, for the radiator heating systems, the maximum heating demand only changed by 43% when the outdoor temperature dropped by 10 degrees.
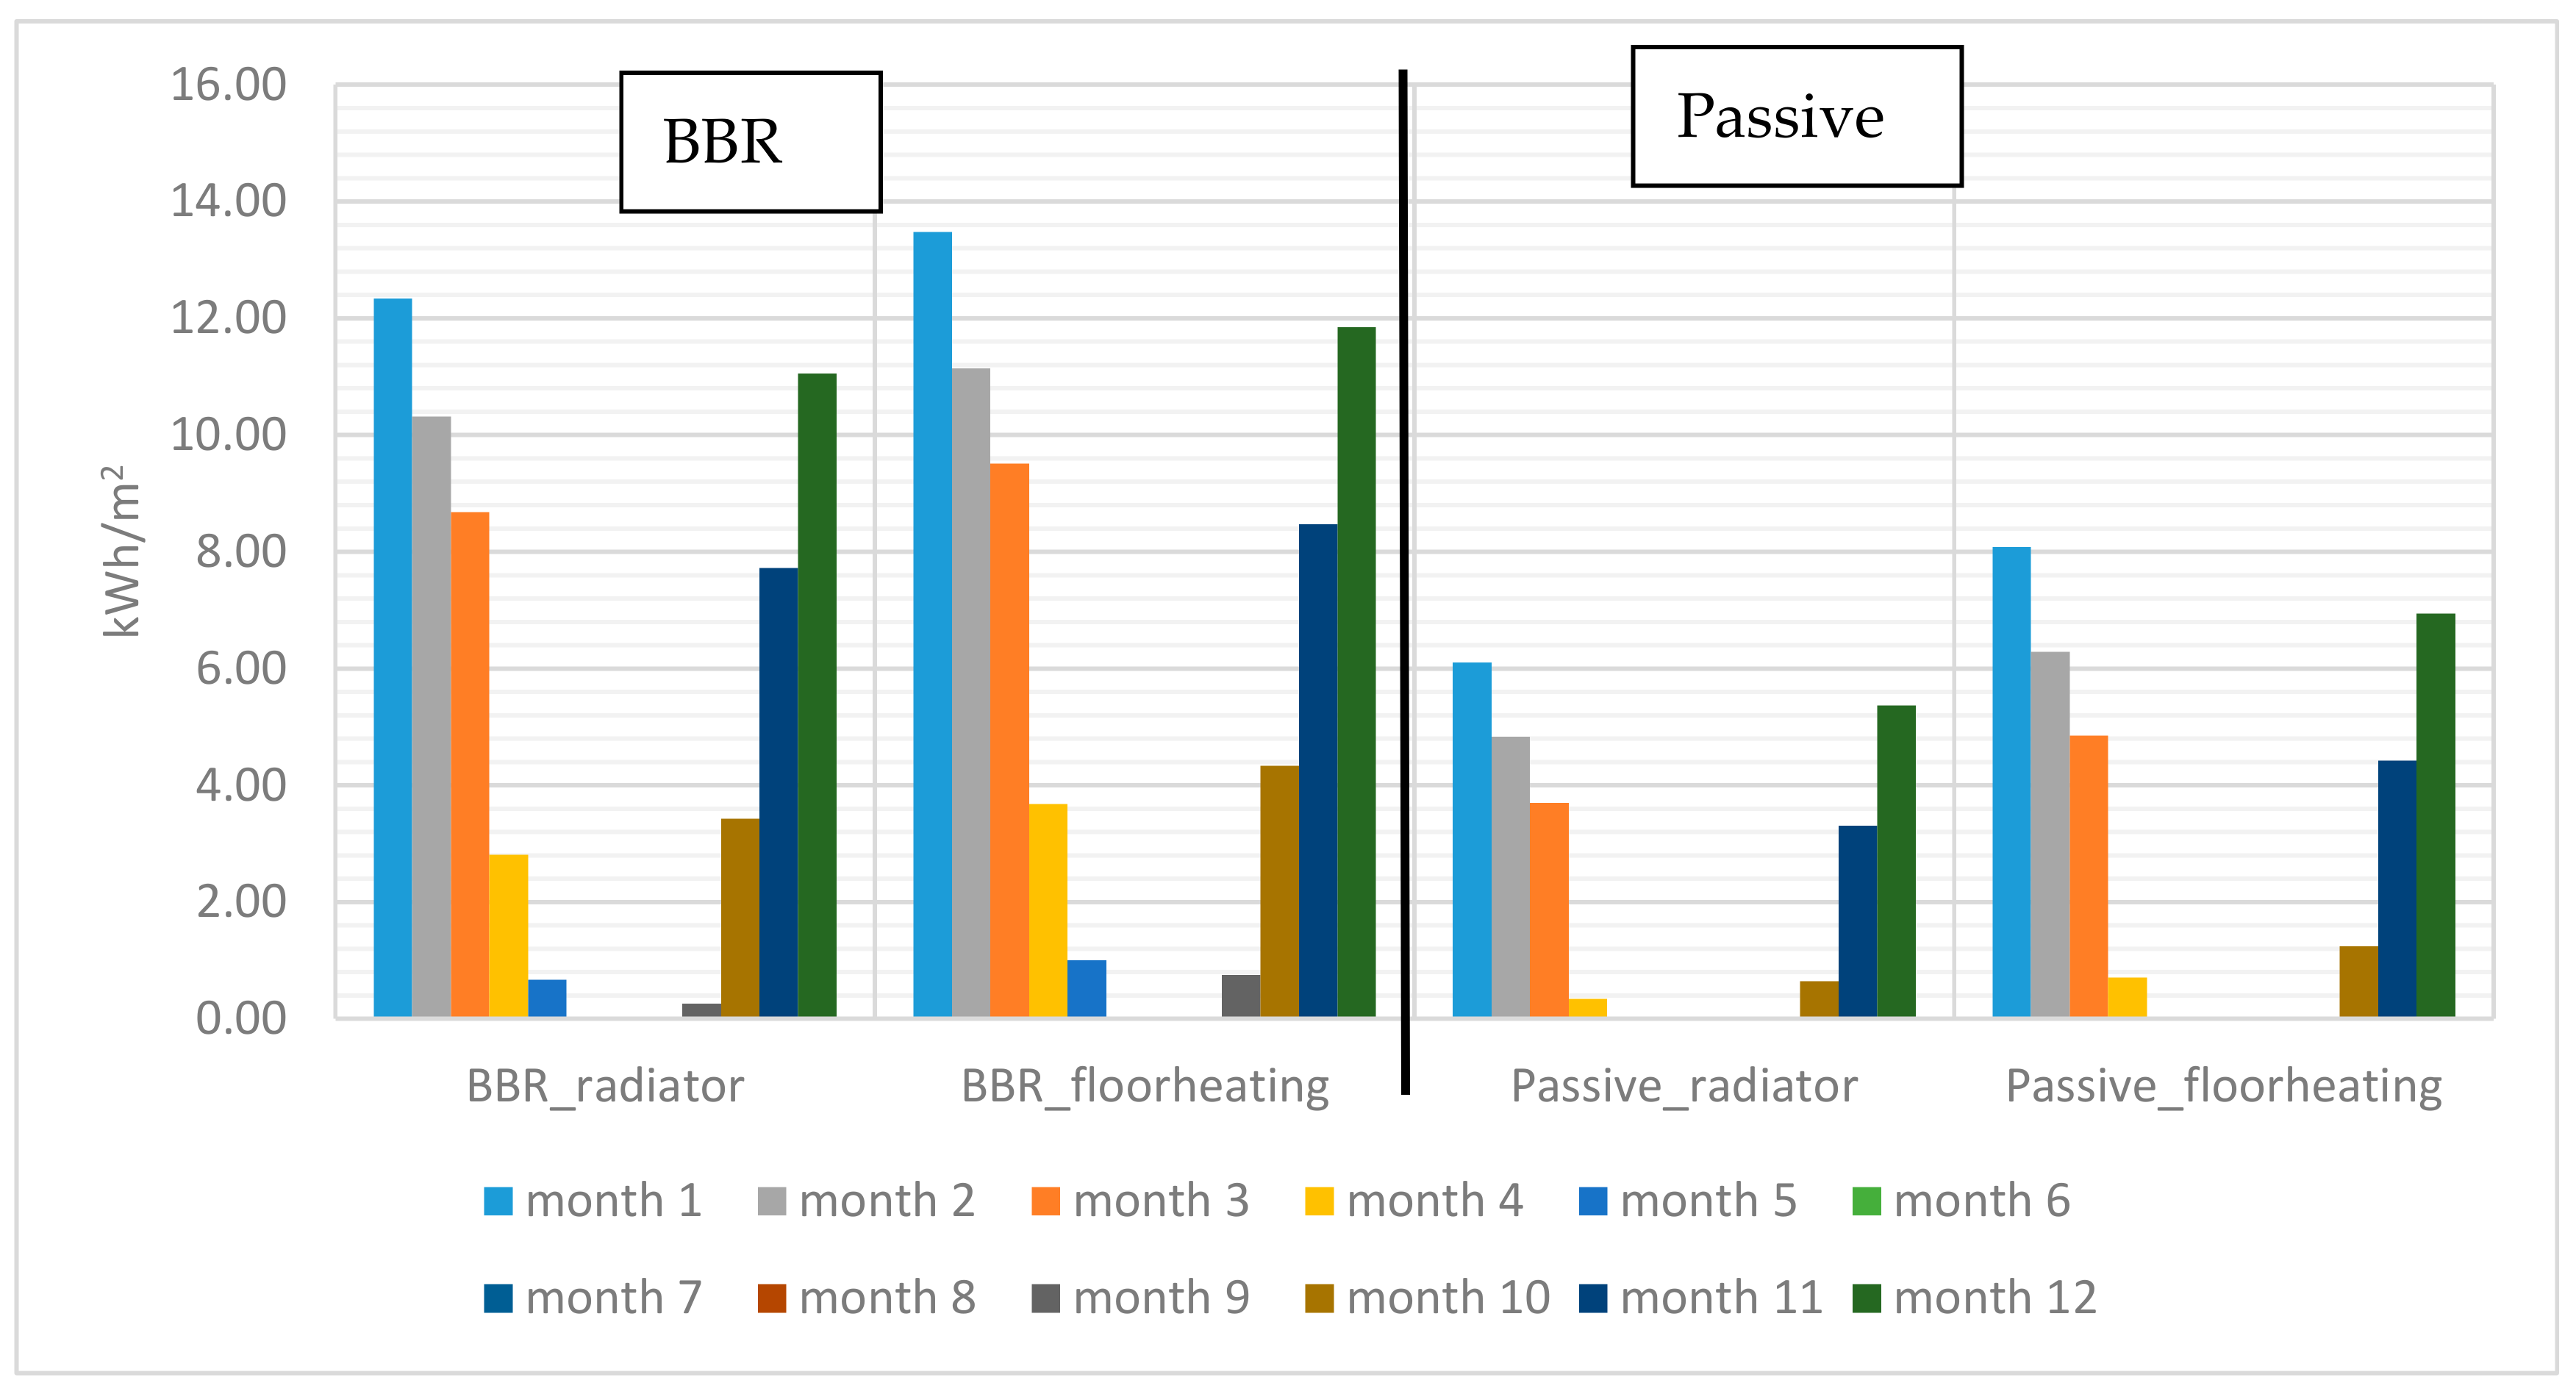
The monthly heating demand and floor transmission heat losses for all reference models were studied, and the results were compared and are presented in
Figure 13 and
Figure 14. The results showed that during winter, using the floor heating system had more considerable impact on both monthly heating demand and floor transmission heat losses in comparison with the radiator heating system for either BBR or passive buildings. This effect was not considerable during the autumn and spring in each studied type of building.
5.2. Sensitivity Analysis
A sensitivity analysis performed to assess the effect of flooring on the annual supply heating demand for both BBR and passive buildings. In this study, 14 common types of flooring material were assessed and divided into four groups based on their corresponding
U-value.
Table 10 shows the corresponding
U-value for each group.
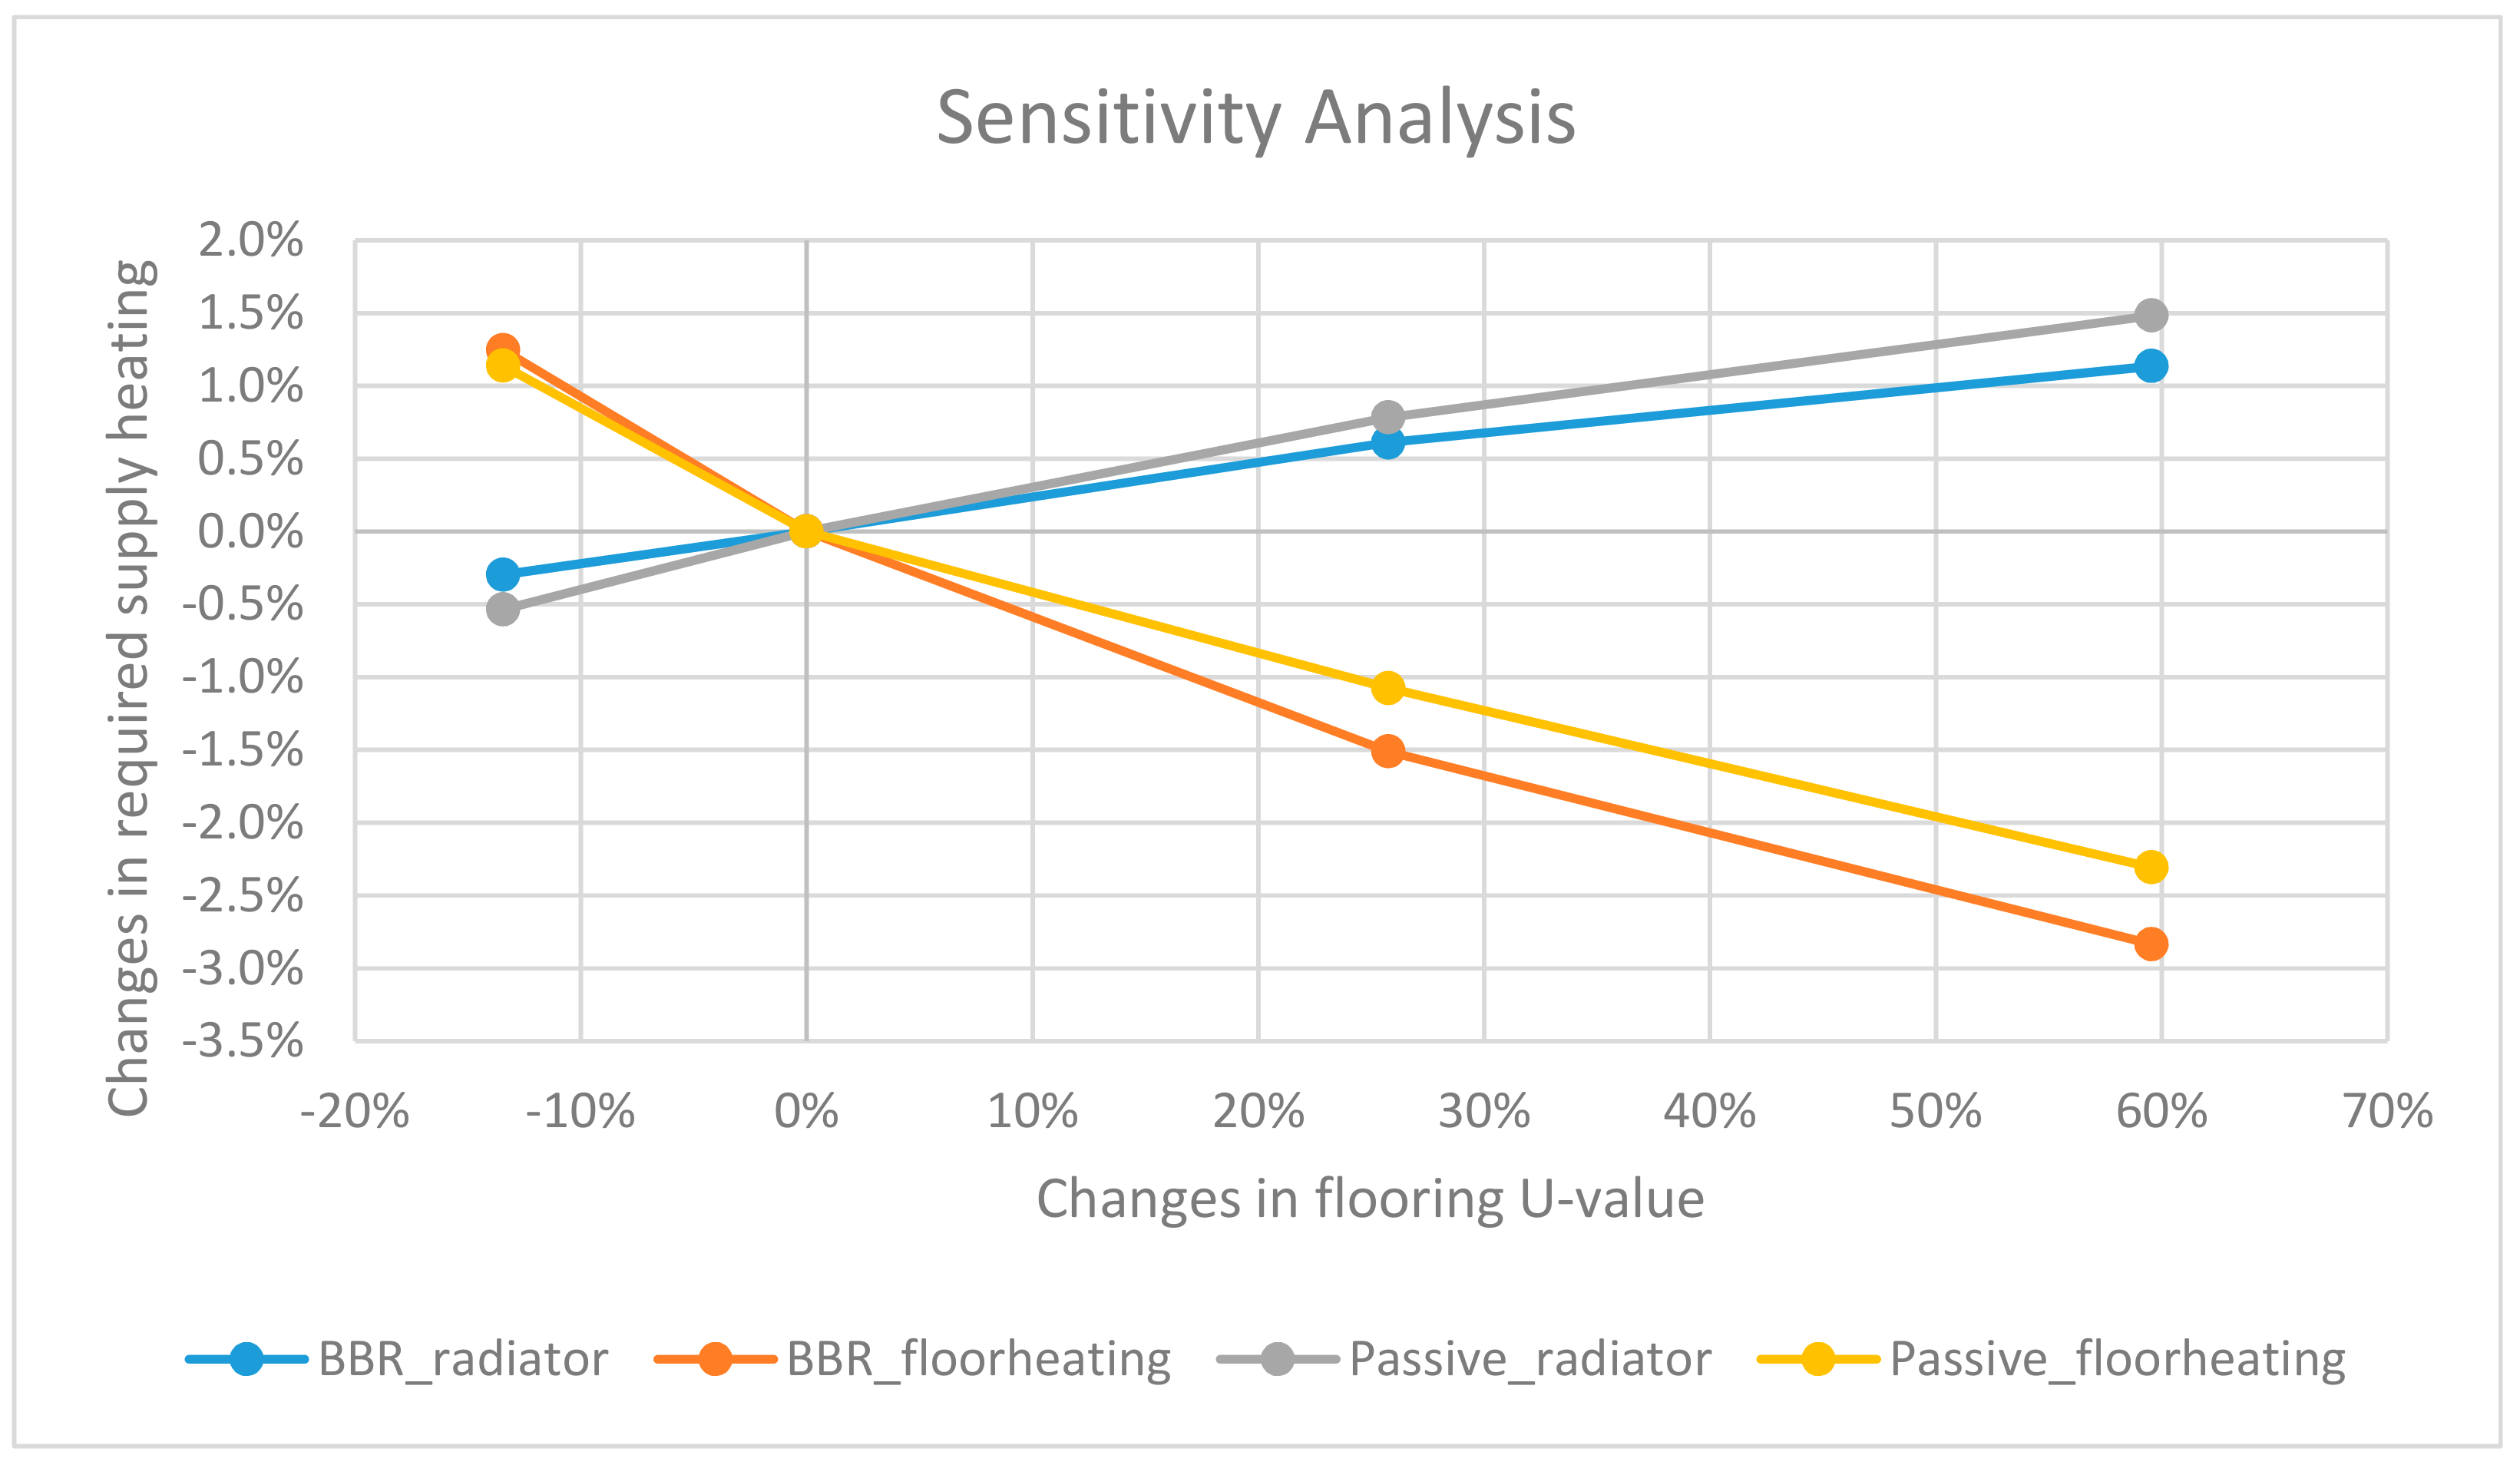
Figure 15 shows the corresponding changes in the supply heating demand by changing the flooring
U-value. The results showed that the supply heating demand was less affected by the flooring
U-value in both the BBR and passive buildings heated by the radiator system. It also showed that by choosing a flooring material with a higher
U-value, the supply heating demand in floor heating systems decreased; however, it had a negative impact on the radiator system in both the BBR and passive buildings. The supply heating demand reduced by up to 3% when the total floor
U-value increased by 60%; however, the supply heating demand increased by a maximum of 1.5% in the case of the use of a flooring material with a 60% higher
U-value in comparison with the chosen reference condition (i.e., laminate).
Figure 16 shows that the flooring
U-value had a larger impact on the transmission heat losses to the ground in both BBR and passive buildings with floor heating systems in comparison with the radiator heating system conditions. Choosing a flooring material with a higher
U-value causes a lower thermal resistance between the floor heating piping system and the indoor space compared to the thermal resistance between floor heating piping system and the ground. Therefore, the heat flux from the floor heating system to the indoor space will be higher than the transmission heat flux to the ground. This causes a lower supply heating demand and transmission heat losses to the ground in the case of using a flooring with high
U-value material.
The supply heating demand and transmission heat loss to the ground also assessed for a carpet on the top of the flooring material. The results showed that carpet, with any U-value, reduced the transmission heat loss in both the BBR and passive buildings where the radiator was chosen as the heating system. However, it increased the transmission heat losses when the floor heating system was used in both the BBR and passive buildings. The effect of using carpet in the annual supply heating demand for both BBR and passive buildings by considering radiators as the heating system was negligible and less than 1% for all studied cases. However, it had a considerable effect on the supply heating demand for both the BBR and passive buildings with floor heating systems. Using carpet can increase the supply heating demand by between 3% to 16% depending on the corresponding carpet as well as the flooring U-values.
Eventually, the effect of different floor heating assembly configurations was studied using a sensitivity analysis. The changes in the supply heating demand was studied for a range of typical floor heating configurations
U-values (refer to
Table 7), and the result is presented in
Figure 17. The results showed that different floor heating assemblies contributed to a maximum 4% change in the supply heating demand. It also affected the transmission heat losses to the ground by 3% when the corresponding
U-value increased by almost 40% in comparison with the reference condition. Slab on grade was considered as the reference floor heating assembly in this study.
Overall, the results showed that the heating demand in a building integrated with a radiator heating system was lower in comparison with floor heating systems. This result confirms the outcomes reported by researchers such as Oleson et al. [
31], Qureshi et al. [
27], and Sarbu et al. [
5], while it contradicts other results presented by Harrysson [
25]. Many parameters may lead to such a different outcome. The sensitivity of the heating demand to the share of each heat transfer method included in the building energy balance is one of the most important parameters. Rahimi and Sabernaeemi [
24] studied the effect of heat transfer mechanisms on heating demand and the obtained results showed that the radiative heat transfer mechanisms had a considerable effect on simulated total energy use in a building. Another parameter with a great impact on the results was the building’s characteristics. However, in the former studies, with different outcomes, there is no clear information about the type of studied building and, therefore, it cannot be compared with the obtained results in this study.
6. Conclusions
Radiator and floor heating systems are known as the most commercial hydronic heating systems which are widely used in residential buildings and specifically in northern cold climate conditions. Radiators have a small warming area and can therefore react faster than, for example, floor heating systems. However, especially in kitchens where the wall surfaces are limited due to the presence of shelves and cabinets, floor heating can be practical. Cold floor surfaces that conduct heat well, such as clinker and stone, obtain a more comfortable surface feel through floor heating.
In this study, the effect of building energy efficiency level, construction type, including flooring material, on the supply heating demand and transmission heat losses were studied for both radiator and floor heating systems. The results showed that the radiator-integrated building had a lower supply heating demand in comparison with the floor heating integrated building. However, the type of building standard that was applied for the construction of the building was very decisive.
The results also showed that refurbishment in a BBR building with a radiator heating system based on the passive criteria led to a 58% annual energy savings, while this amount for a BBR building with a floor heating system was approximately 49%. The floor transmission heat losses are reduced by 8% and 11% for radiators and floor heating, respectively, for refurbishment from the BBR to the passive criteria energy level.
A detailed sensitivity analyses showed that the flooring material did not have a significant influence on the supply heating demand as well as on the transmission heat losses in the case of using radiators for both the BBR and passive criteria energy level. The supply heating demand was reduced up to 3% when the flooring U-value was improved by 60%. The different types of floor heating configurations also caused a maximum of 4% change in the supply heating demand for both BBR and passive buildings. A structural radiant subfloor with aluminum and grooves had the lowest supply heating demand compared to the other studied floor heating system assembly configurations.
In this study, we assumed that the radiator and floor heating systems were connected to a district heating system. In further studies different types of heat pumps, combined heat and power (CHP) production units, and district heating system will need to be considered for a comparative techno-enviro-economic assessment for all possible energy supply alternatives.
Since radiators are relatively small in area, the water needs to be relatively hot in order to heat an entire room; the radiated heat will also mostly be located around the radiator. This should not be the case for underfloor heating. Since the entire floor is heated, there is considerable contact between the heated floor and the air which should allow for lower water temperatures in the system and more dispersed heat in the entire room. Therefore, the effect of supply temperature as well as heating system operation time schedule was not studied in this paper and it is suggested to be considered in further studies. Using phase change material as a commercial type of thermal energy storage system may have a significant impact on floor heating’s thermal performance which could be of interest for further studies as well.


