
The Effects of the Visual Environment on K-12 Student Achievement


Abstract
:1. Introduction
2. Materials and Methods
2.1. Research Design
Participants
2.2. Measurement Procedure and Data Acquisition
2.2.1. Occupied Measurements
2.2.2. Unoccupied Measurements
2.3. Visual Environment Measures
2.3.1. Daylight Metrics and Simulation Methodology
2.3.2. Electric Lighting Metrics
- Maximum Average Electric Illuminance Level (calculated in the winter unoccupied measurements using the methodology included in the IES handbook 10th Edition) [29].
- Time-Weighted Illuminance level based on the illuminance meters placed in the light fixtures. All but six classrooms used fluorescent fixtures with either on/off or 3-level switching options. The remaining six classrooms still used fluorescent but with set-dimming levels. This allowed for the maximum average illuminance to be reduced based on the way teachers used theirs lights during the six days of occupied measurements. In that sense, Time-Weighted Illuminance would provide a more accurate representation of the electric lighting experienced by students.
- Correlated Color Temperature was considered as a variable of interest based on the findings of previous studies. However, there was little to no variance in the fluorescent lamps used in the measured classrooms, with the CCT ranging from 3000 K to 3500 K. This was a result of each school district having a specific fluorescent lamp product that they used for every school building within their district. Although variations could be observed based on the impact of daylighting for different window distances, that would involve expensive and obstructive sensing requirements that were considered to be out of scope for this study.
2.3.3. View Metrics
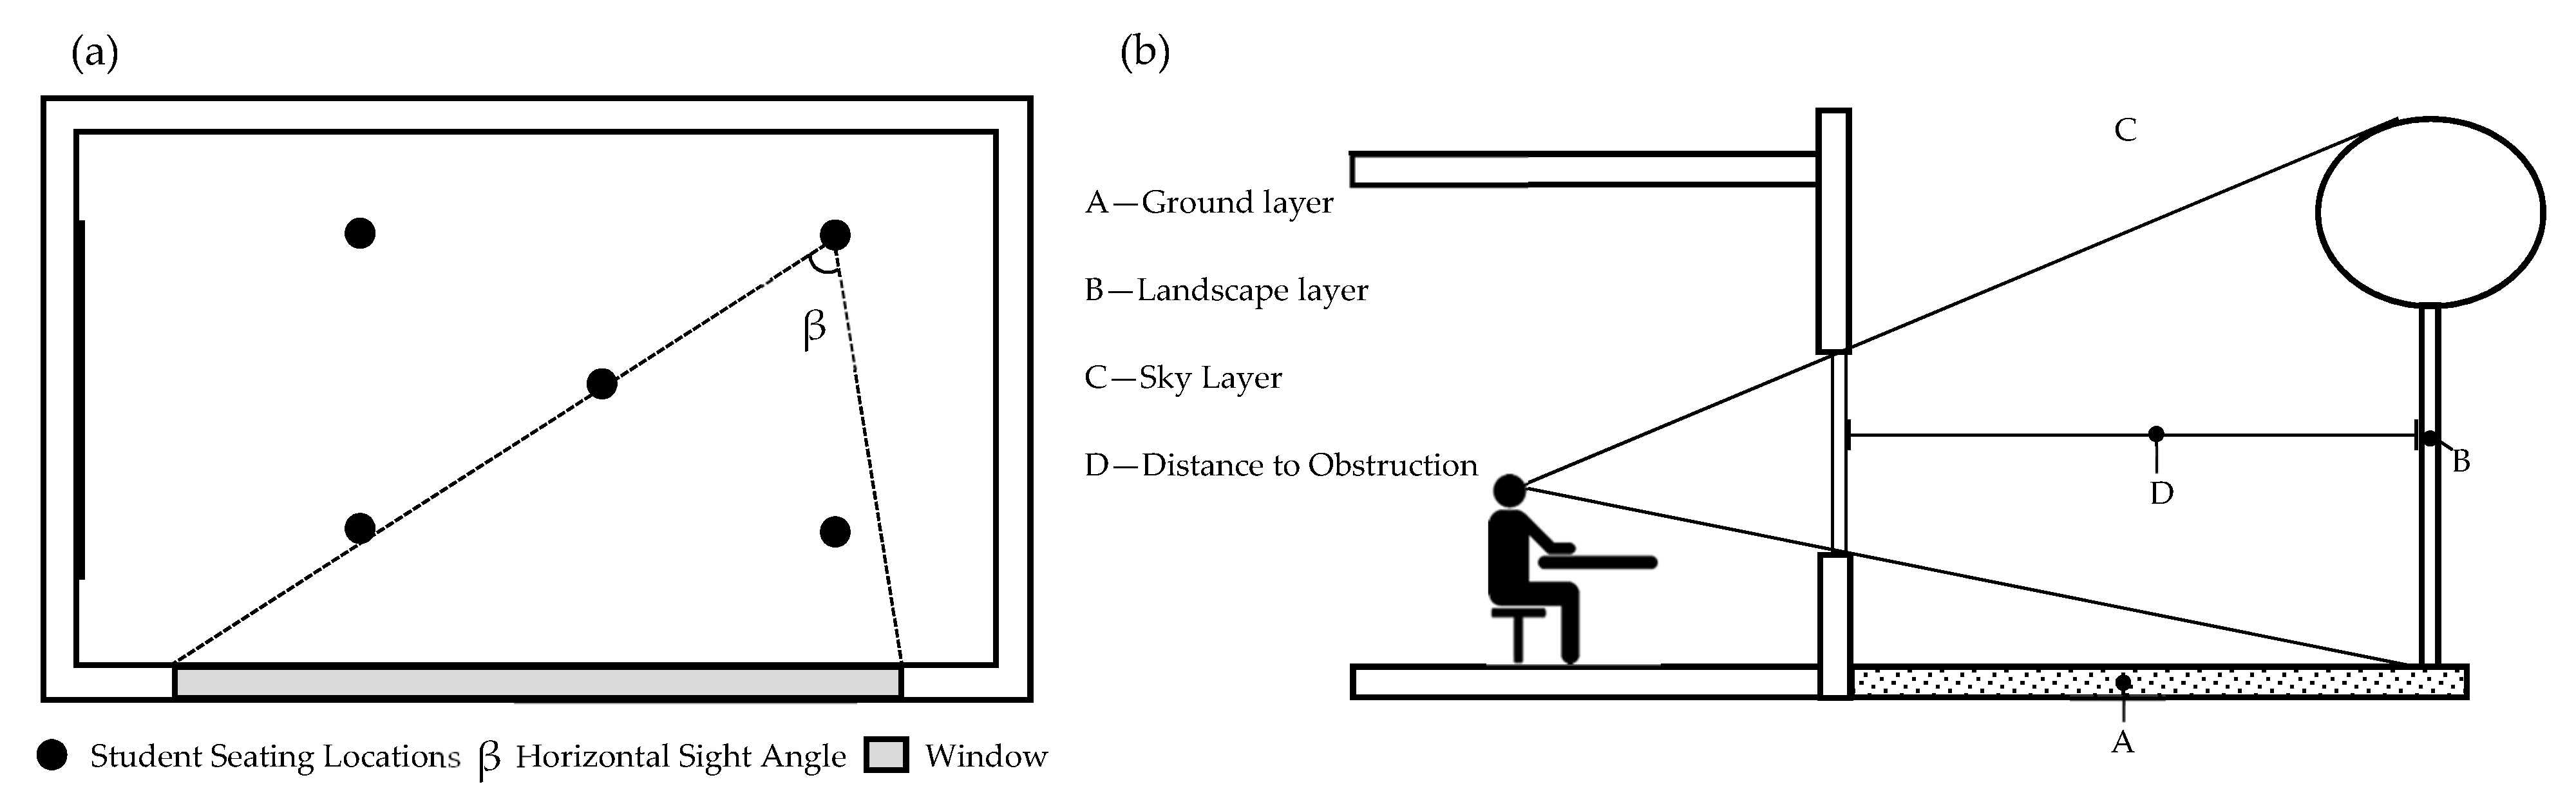
- Horizontal Sight Angle defines the amount of available outside view within a space by its visible width. The reference point used for this calculation is the farthest seating point within the utilized space. For this study, the farthest point from the student seating area to the primary window was used.
- Outside Distance of View defines the extent of outside visual information available within a specific room. More specifically, it is defined in EN17037 as the “distance from the inner surface of view opening to opposite major obstructions located in front of the opening” [37]. An obstruction is defined as “anything outside a building which prevents the direct view of part of the sky” [37]. The Outside Distance of the View is measured from the exterior surface of the view opening (window) to the nearest obstruction outside.
- The Number of View Layers metric reflects the quality and diversity of visible content and is defined by EN 17037 based on the assumption that there are “three distinct layers comprising a view: a layer of sky, a layer of landscape and a layer of ground” [37]. The landscape layer can be any landscape/urban/natural objects in view, or, in lack of them, the horizon line. Number of view layers seen is to be calculated from at least 75% of the utilized area within the studied room. Number of layers was evaluated using the photos taken from the farthest corner of the student seating location.
2.4. Dependent Measures and Controls
3. Results
3.1. Descriptive Statistics
3.2. Model Discussion
3.3. Student Achievement Models
4. Discussion, Limitations, and Future Work
5. Conclusions
Author Contributions
Funding
Institutional Review Board Statement
Informed Consent Statement
Data Availability Statement
Acknowledgments
Conflicts of Interest
References
- Butler, D.L.; Biner, P.M. Effects of Setting on Window Preferences and Factors Associated with Those Preferences. Environ. Behav. 1989, 21, 17–31. [Google Scholar] [CrossRef]
- Ulrich, R.E. View through a window may influence recovery. Am. Assoc. Adv. Sci. 1984, 224, 420–421. [Google Scholar] [CrossRef] [Green Version]
- Aries, M.B.; Veitch, J.A.; Newsham, G.R. Windows, View, and office characteristics predict physical and psychological discomfort. J. Environ. Psychol. 2010, 30, 533–541. [Google Scholar] [CrossRef]
- Heschong Mahone Group. Windows and Classrooms: A Study of Student Performance and the Indoor Environment; California Energy Commission: Sacramento, CA, USA, 2003.
- Durán-Narucki, V. School building condition, school attendance, and academic achievement in New York City public schools; A mediation model. J. Environ. Psychol. 2008, 28, 278–286. [Google Scholar] [CrossRef]
- Konstantzos, I.; Sadeghi, S.A.; Kim, M.; Xiong, J.; Tzempelikos, A. The effect of lighting environment on task performance in buildings–A review. Energy Build. 2020, 226, 110394. [Google Scholar] [CrossRef]
- Mott, M.S.; Robinson, D.H.; Walden, A.; Burnette, J.; Rutherford, A.S. Illuminating the Effects of Dynamic Lighting on Student Learning. SAGE Open 2012, 2, 1–9. [Google Scholar] [CrossRef]
- Bowers, J.; Burkett, C. Physical environment influences related to student achievement, health, attendance, and behavior. CEFP J. Counc. Educ. Facil. Plan. J. 1988, 26, 33–34. [Google Scholar]
- Phillips, R.W. Educational Facility Age and the Academic Achievement and Attendance of Upper Elementary School Students. Unpublished Ph.D. Thesis, University of Georgia Athens, Athens, GA, USA, 1997. [Google Scholar]
- Plumley, J.P. The Impact of School Building Age on the Academic Achievement of Pupils from Selected Schools in the State of Georgia. Unpublished Ph.D. Thesis, University of Georgia Athens, Athens, GA, USA, 1978. [Google Scholar]
- Chan, T.C. The Impact of School Building Age on the Achievement of Eighth-Grade Pupils from the Public Schools in the state of Georgia. Unpublished Ph.D. Thesis, University of Georgia Athens, Athens, GA, USA, 1979. [Google Scholar]
- Cuttle, K. People and Windows in Workplaces. In Proceedings of the Conference on People and Physical Environment Research, Wellington, New Zealand, 8–11 June 1983; pp. 203–212. [Google Scholar]
- Boubekri, M.; Hull, R.B.; Boyer, L.L. Impact of Window Size and Sunlight Penetration on Office Workers’ Mood and Satisfaction. Environ. Behav. 1991, 23, 474–493. [Google Scholar] [CrossRef]
- Tennessen, C.M.; Cimprich, B. Views to nature: Effects on attention. J. Environ. Psychol. 1995, 15, 77–85. [Google Scholar] [CrossRef]
- Tuaycharoen, N.; Tregenza, P. View and discomfort glare from windows. Light. Res. Technol. 2007, 39, 185–200. [Google Scholar] [CrossRef]
- Boyce, P.R.; Veitch, J.; Newsham, G.R.; Jones, C.C.; Heerwagen, J.; Myer, M.; Hunter, C.M. Lighting quality and office work: Two field simulation experiments. Light. Res. Technol. 2006, 38, 191–223. [Google Scholar] [CrossRef] [Green Version]
- Veitch, J.; Newsham, G.; Boyce, P.; Jones, C. Lighting appraisal, well-being, and performance in open-plan offices: A linked mechanisms approach. Light. Res. Technol. 2008, 40, 133–151. [Google Scholar] [CrossRef] [Green Version]
- Nicklas, M.H.; Bailey, G.B. Analysis of the Performance of Students in Daylit Schools; Unpublished Manuscript of Innovative Design: Raleigh, NC, USA, 1995. [Google Scholar]
- Pierson, C.; Wienold, J.; Bodart, M. Review of Factors Influencing Discomfort Glare Perception from Daylight. LEUKOS 2017, 14, 111–148. [Google Scholar] [CrossRef]
- Grangaard, E.M. Color and Light Effects on Learning. (Report No. PS 023 272). Education Resources Information Center Report; 1995. Available online: https://eric.ed.gov/?id=ED382381 (accessed on 7 October 2020).
- Wohlfarth, H. Color and Light Effects on Students’ Achievement Behavior, and Physiology; Alberta Education: Edmonton, AB, Canada, 1986. [Google Scholar]
- London, W. Full-spectrum classroom light and sickness in pupils. Lancet 1987, 330, 1205–1206. [Google Scholar] [CrossRef]
- Hathaway, W.E.; Hargreaves, J.A.; Thompson, G.W.; Novitsky, D. A Study into the Effects of Light on Children of Elementary School Age a Case of Daylight Robbery, Policy and Planning Branch, Planning, and Information Services Division; Alberta Education: Edmonton, AB, Canada, 1992. [Google Scholar]
- McColl, S.; Veitch, J. Full-spectrum fluorescent lighting: A review of its effects on physiology and health. Psychol. Med. 2001, 31, 949–964. [Google Scholar] [CrossRef]
- Berman, S.; Navvab, M.; Martin, M.; Sheedy, J.; Tithof, W. A comparison of traditional and high colour temperature lighting on the near acuity of elementary school children. Light. Res. Technol. 2006, 38, 41–49. [Google Scholar] [CrossRef]
- Sleegers, P.; Moolenaar, N.; Galetzka, M.; Pruyn, A.T.; Sarroukh, B.; Van Der Zande, B. Lighting affects students’ concentration positively: Findings from three Dutch studies. Light. Res. Technol. 2012, 45, 159–175. [Google Scholar] [CrossRef] [Green Version]
- Keis, O.; Helbig, H.; Streb, J.; Hille, K. Influence of blue-enriched classroom lighting on students’ cognitive performance. Trends Neurosci. Educ. 2014, 3, 86–92. [Google Scholar] [CrossRef]
- Samani, S.A.; Samani, S.A. The Impact of Indoor Lighting on Students Learning Performance in Learning Environments: A knowledge internalization perspective. Int. J. Bus. Soc. Sci. 2012, 3, 127–136. [Google Scholar]
- DiLaura, D.L.; Houser, K.W.; Mistrick, R.G.; Steffy, G.R. The Lighting Handbook: Reference and Application; Illuminating Engineering Society: New York, NY, USA, 2011. [Google Scholar]
- Shaikh, F. 4 Common Posture’s Dimension to Keep in Mind before Designing Furniture for Children up to 5 to 16 Years. Available online: https://gharpedia.com/blog/4-common-postures-dimension-to-keep-in-mind-before-designing-furniture-for-children-up-to-5-to-16-years/ (accessed on 14 October 2020).
- Rogers, Z. 1.0 Introduction—SPOT Pro v.5–5.0. SPOT Manual. Available online: https://www.manula.com/manuals/zrogers/spot-pro-v-5/1/en/topic/1-0-introduction (accessed on 7 October 2020).
- Illuminating Engineering Society. Approved Method: IES Spatial Daylight Autonomy (sDA) and Annual Sunlight Exposure (ASE); Illuminating Engineering Society: New York, NY, USA, 2012. [Google Scholar]
- Huang, J. About WBT Weather Data. White Box Technologies Weather Data for Energy Calculations. Available online: http://weather.whiteboxtechnologies.com/aboutdata (accessed on 15 March 2018).
- Tregenza, P. Uncertainty in daylight calculations. Light. Res. Technol. 2016, 49, 1–16. [Google Scholar] [CrossRef]
- Sadeghi, R. Study of Building Surrounding Luminous Environment Using High Dynamic Range Image-Based Lighting Model. Unpublished Ph.D. Thesis, Pennsylvania State University, State College, PA, USA, 2017. [Google Scholar]
- Illuminating Engineering Society. Recommended Practice for Daylighting Buildings; Illuminating Engineering Society: New York, NY, USA, 2013. [Google Scholar]
- Technical Committee CEN/TC 169. Daylight of Buildings; European Committee for Standardization: Brussels, Belgium, 2018. [Google Scholar]
- Bulmer, M.G. Principles of Statistics; Dover Publications Inc.: Dover, UK, 1979. [Google Scholar]
- Constantino, R. Print environments between high and low socioeconomic status communities. Teach. Libr. 2005, 32, 22–25. [Google Scholar]
- Milne, A.; Plourde, L.A. Factors of a Low-SES Household: What Aids Academic Achievement. J. Instr. Psychol. 2006, 33, 183–193. [Google Scholar]
- United States Environmental Protection Agency. Healthy Schools: Environmental Factors, Children’s Health and Performance, and Sustainable Building Practices. Available online: https://cfpub.epa.gov/ncer_abstracts/index.cfm/fuseaction/recipients.display/rfa_id/568/records_per_page/ALL (accessed on 7 October 2020).


| Recommendation Level | Horizontal Sight Angle | Outside Distance of the View | Number of View Layers |
|---|---|---|---|
| Below Minimum | <14° | <6.0 m | No layers |
| Minimum | ≥14° | ≥6.0 m | Landscape layer/one layer |
| Medium | ≥28° | ≥20.0 m | Landscape layer plus one other layer/two layers |
| High | ≥50° | ≥50.0 m | All layers are included in same view opening/three layers |
| Variables | N | Mean | Standard. Deviation | Minimum | Maximum |
|---|---|---|---|---|---|
| Math Achievement (Percentile Rank) | 178 | 56.74 | 14.76 | 18.33 | 95.98 |
| Reading Achievement (Percentile Rank) | 180 | 55.88 | 13.60 | 17.26 | 87.30 |
| % Free and Reduced Lunch Recipients | 216 | 37.31 | 29.88 | 0.00 | 100.00 |
| % Special Education Students | 216 | 13.67 | 8.99 | 0.00 | 41.67 |
| % Gifted Learners | 216 | 13.62 | 13.73 | 0.00 | 76.09 |
| Maximum Average Illuminance (lux) | 216 | 779.69 | 163.97 | 252.21 | 1159.82 |
| Time-Weighted Illuminance (lux) | 216 | 460.15 | 181.08 | 62.14 | 995.10 |
| Spatial Daylight Autonomy (sDA) | 211 | 0.06 | 0.10 | 0 | 0.65 |
| Annual Sunlight Exposure (ASE) | 211 | 0.10 | 0.16 | 0 | 0.82 |
| Uniform Daylight Illuminance (UDI) | 211 | 0.25 | 0.23 | 0 | 0.97 |
| Horizontal Sight Angle | 216 | 42.33 | 34.65 | 0 | 125.28 |
| Number of View Layers | 216 | 2.02 | 1.15 | 0 | 3 |
| Reading Model | B | SE | β | R2 | 95% CI |
|---|---|---|---|---|---|
| Intercept | 61.56 | 0.536 | |||
| % Free and Reduced Lunch Recipients | −0.05 | 0.03 | −0.10 | [−0.24, 0.04] | |
| % Gifted Learners | 0.60 | 0.06 | 0.61 ** | [0.48, 0.73] | |
| % Special Education Learners | −0.27 | 0.09 | −0.18 ** | [−0.29, −0.07] | |
| Grade 5 | −4.23 | 2.05 | −0.15 * | [−0.28, −0.01] | |
| Grade 8 | −3.55 | 3.20 | −0.09 | [−0.26, 0.07] | |
| Grade 11 | −13.02 | 3.16 | −0.37 ** | [−0.55, −0.20] | |
| Time-weighted Illuminance (ETW) | −0.01 | 0.01 | −0.09 | [−0.23, 0.05] | |
| Annual Sunlight Exposure (ASE) | 5.29 | 4.52 | 0.06 | [−0.04, 0.17] | |
| View vs. No View | 0.76 | 0.36 | 0.11 * | [0.01, 0.21] | |
| Two View Layers vs. Three View Layers | 0.05 | 1.28 | 0.00 | [−0.14,0.14] | |
| Horizontal Sight Angle (HSA) | 0.06 | 0.02 | 0.16 ** | [0.04, 0.28] | |
| HSA x % Free lunch | −0.002 | 0.0007 | −0.42 ** | [−0.64, −0.21] |
| Math Model | B | SE | β | R2 | 95% CI |
|---|---|---|---|---|---|
| Intercept | 68.80 | 0.626 | |||
| % Free and Reduced Lunch Recipients | −0.23 | 0.04 | −0.46 ** | [−0.60, −0.32] | |
| % Gifted Learners | 0.31 | 0.15 | 0.29 * | [0.02, 0.55] | |
| % Special Education Learners | −0.32 | 0.08 | −0.19 ** | [−0.29, −0.09] | |
| Grade 5 | −2.48 | 2.05 | −0.08 | [−0.21, 0.05] | |
| Grade 8 | −4.13 | 2.36 | −0.10 | [−0.21, 0.01] | |
| Grade 11 | −3.31 | 2.65 | −0.09 | [−0.22, 0.05] | |
| Time-weighted Illuminance (ETW) | −0.01 | 0.01 | −0.09 | [−0.21, 0.04] | |
| Annual Sunlight Exposure (ASE) | −0.01 | 3.95 | 0.00 | [−0.08, 0.08] | |
| View vs. No View | 0.11 | 0.48 | 0.01 | [−0.11, 0.14] | |
| Two View Layers vs. Three View Layers | −1.83 | 1.43 | −0.09 | [−0.24, 0.05] | |
| Horizontal Sight Angle (HSA) | −0.03 | 0.03 | −0.07 | [−0.21, 0.07] | |
| Etw x % Gifted Learners | 0.00 | 0.00 | 0.24 | [−0.01, 0.49] |
Publisher’s Note: MDPI stays neutral with regard to jurisdictional claims in published maps and institutional affiliations. |
© 2021 by the authors. Licensee MDPI, Basel, Switzerland. This article is an open access article distributed under the terms and conditions of the Creative Commons Attribution (CC BY) license (https://creativecommons.org/licenses/by/4.0/).
Share and Cite
Kuhlenengel, M.; Konstantzos, I.; Waters, C.E. The Effects of the Visual Environment on K-12 Student Achievement. Buildings 2021, 11, 498. https://doi.org/10.3390/buildings11110498
Kuhlenengel M, Konstantzos I, Waters CE. The Effects of the Visual Environment on K-12 Student Achievement. Buildings. 2021; 11(11):498. https://doi.org/10.3390/buildings11110498
Chicago/Turabian StyleKuhlenengel, Michael, Iason Konstantzos, and Clarence E. Waters. 2021. "The Effects of the Visual Environment on K-12 Student Achievement" Buildings 11, no. 11: 498. https://doi.org/10.3390/buildings11110498