
Unlocking the Residential Retrofitting Potential in a Three-Degree World: A Holistic Approach to Passive Design in Hot Climates


Abstract
:1. Introduction
- (1)
- Can significant energy savings be achieved with traditional retrofit techniques? Is there a need for the introduction of more novel alternatives?
- (2)
- Which of the packages are more successful in the current conditions?
Objectives and Paper Structure
- (1)
- Translating the SBC requirements into an ideal building model and/or a performance benchmark for a comparative assessment of the selected baseline model and the optimised scenarios.
- (2)
- Test a range of retrofit strategies addressing key performance requirements and energy savings measures against SBC benchmarks.
- (3)
- Formulate further optimisation arrangements based on potential alternatives that combine the favoured tested individual strategies.
2. Background Review
2.1. Case Study Country Profile: Kingdom of Saudi Arabia
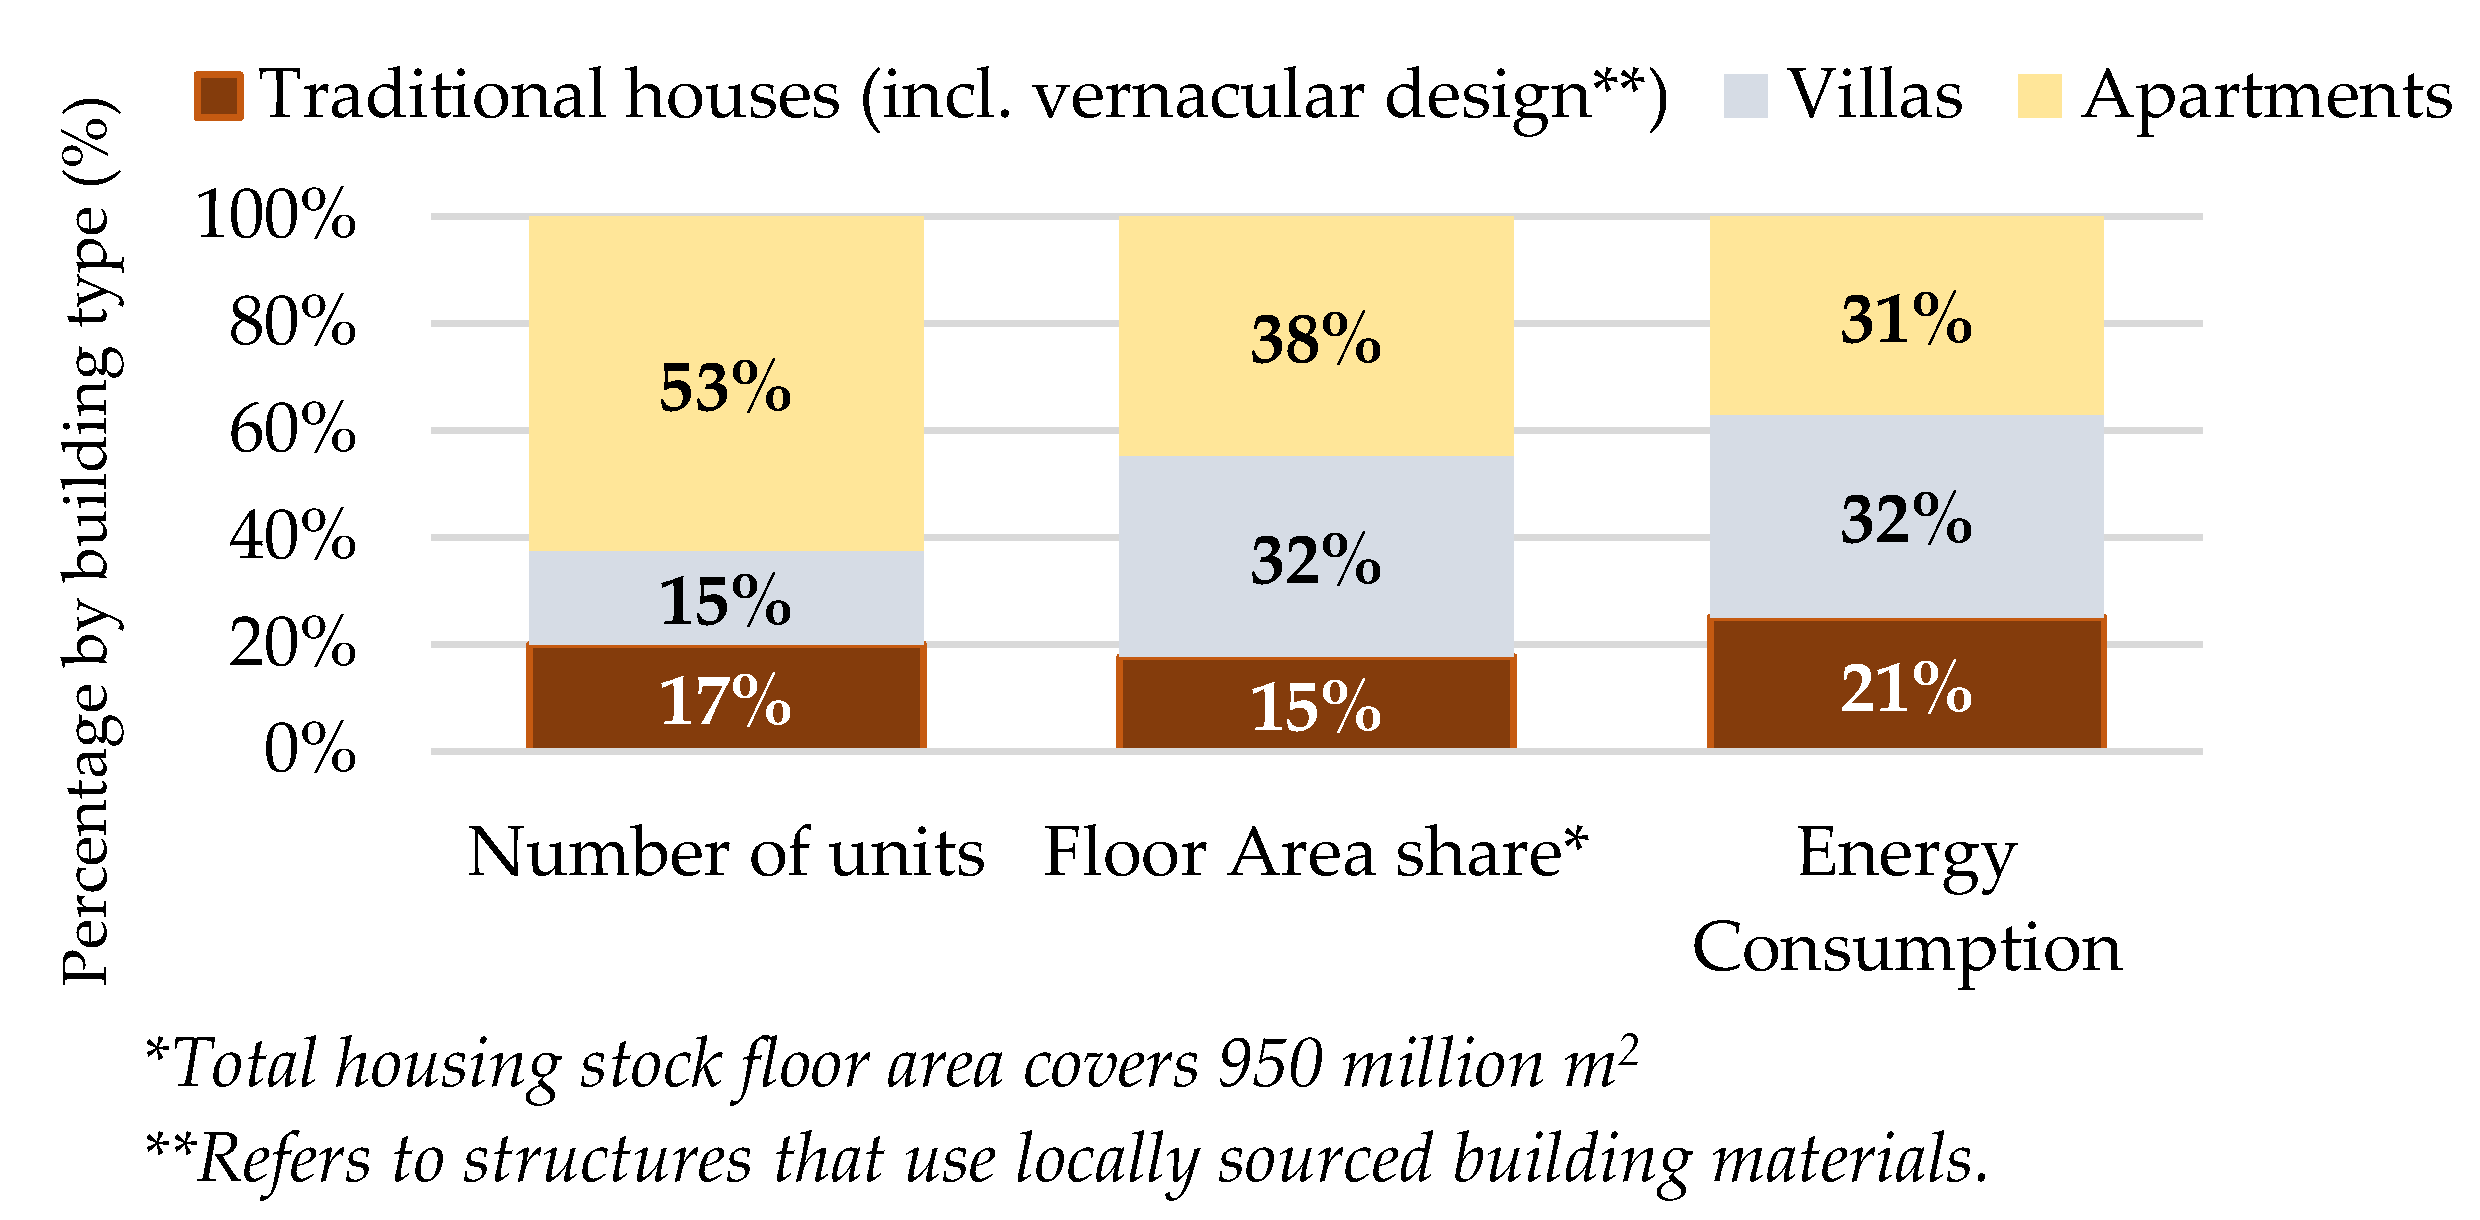
2.2. The Current and Future Role of the Built Environment Sector
- The high portion of non-thermally insulated housing stock (nearly 70%).
- The low electricity bill (<100 SR/month for 65% of consumers) disincentivises conscious consumption.
- Lack of public awareness led to a low general tendency to purchase high-efficiency devices and/or the replacement of existing less efficient devices.
- There is a weak supervision protocol for the assessment and maintenance of these products.
2.3. Engineering Design Solutions
2.3.1. Region of Study
2.3.2. Type of Housing Stock
2.3.3. Age of Model
2.3.4. Design Target
2.3.5. SBC Regulations
2.3.6. Local Research: Passive Design Strategies and Precedents
2.3.7. Wall and Floor Systems
2.3.8. Roof Systems
2.3.9. Fenestration and Shading Systems
- Canopies on top of windows (e.g., overhangs, fins, egg-crates, louvres).
- Planting shades instead of steel shades.
- Sun reflective design techniques.
- Increasing glazing thickness (with air/argon-filled cavity).
- Highly air-tight windows.
2.3.10. Landscaping Design
2.3.11. Additional Features and Considerations
3. Research Methodology
3.1. Identification of Selected Methodology Frameworks
3.2. Energy Modelling: Formulation of Test Scenarios
3.2.1. Energy Modelling: Identifying Restrictions
3.2.2. Energy Modelling: Defining Input Parameters
3.2.3. Energy Modelling: Design Procedures and Performance Indicators
3.2.4. Shading Design Strategies
3.2.5. Fenestration Design Optimisation: Heat Gain Reduction Versus Daylight
- Reflectance and transmittance values are extracted from IES-VE packages.
- No surrounding obstructions for ground floor (Gf) windows and the overhangs were considered for first floor (f1) windows.
- Only 75% of each floor (see Table 3) is accounted for, and also, assuming that half of the gross floor area is subjected daylighting in each direction.
3.2.6. Green Design and Modelling
3.2.7. Photovoltaic Solutions
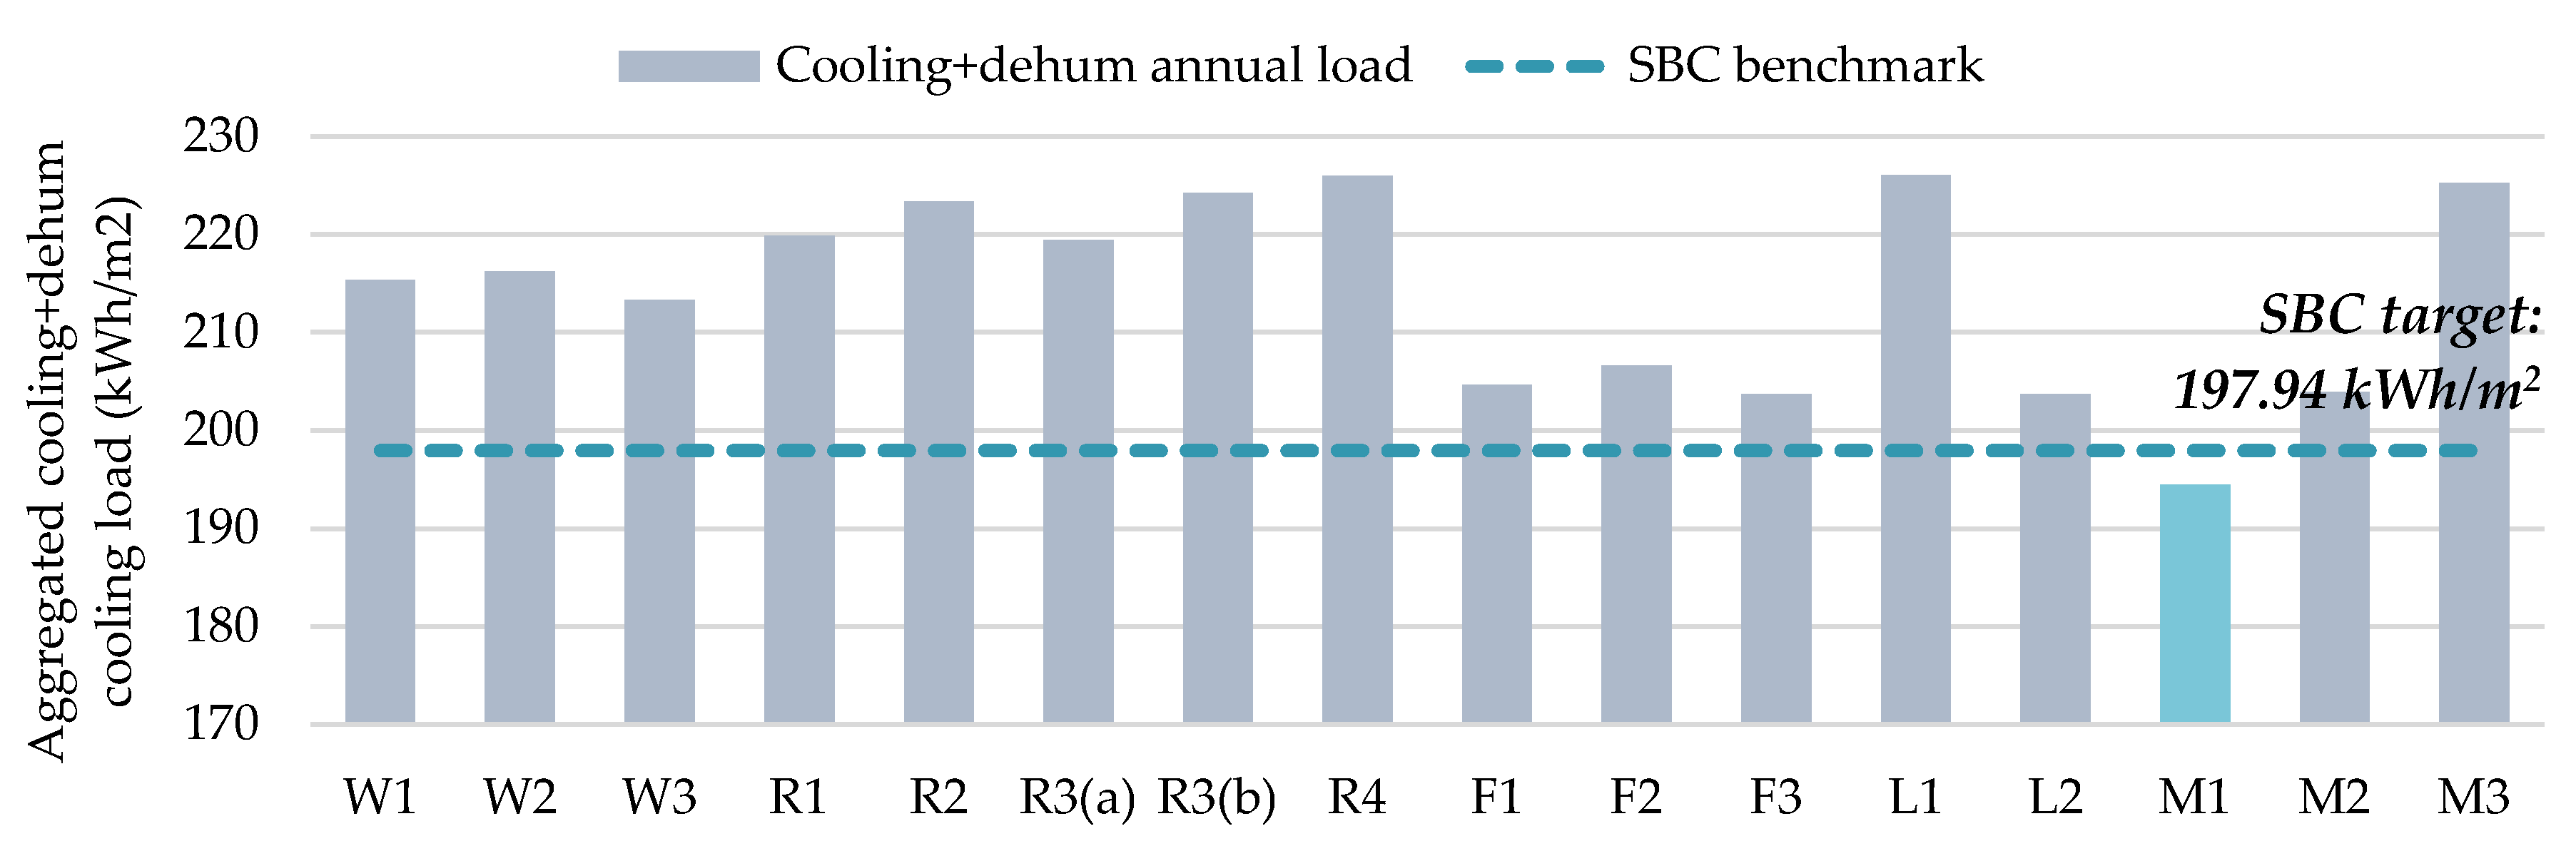
3.2.8. Energy Modelling: Performance Benchmarking
4. Key Findings and Discussions
4.1. Baseline Model Assessment
4.2. Upgraded Model Assessment
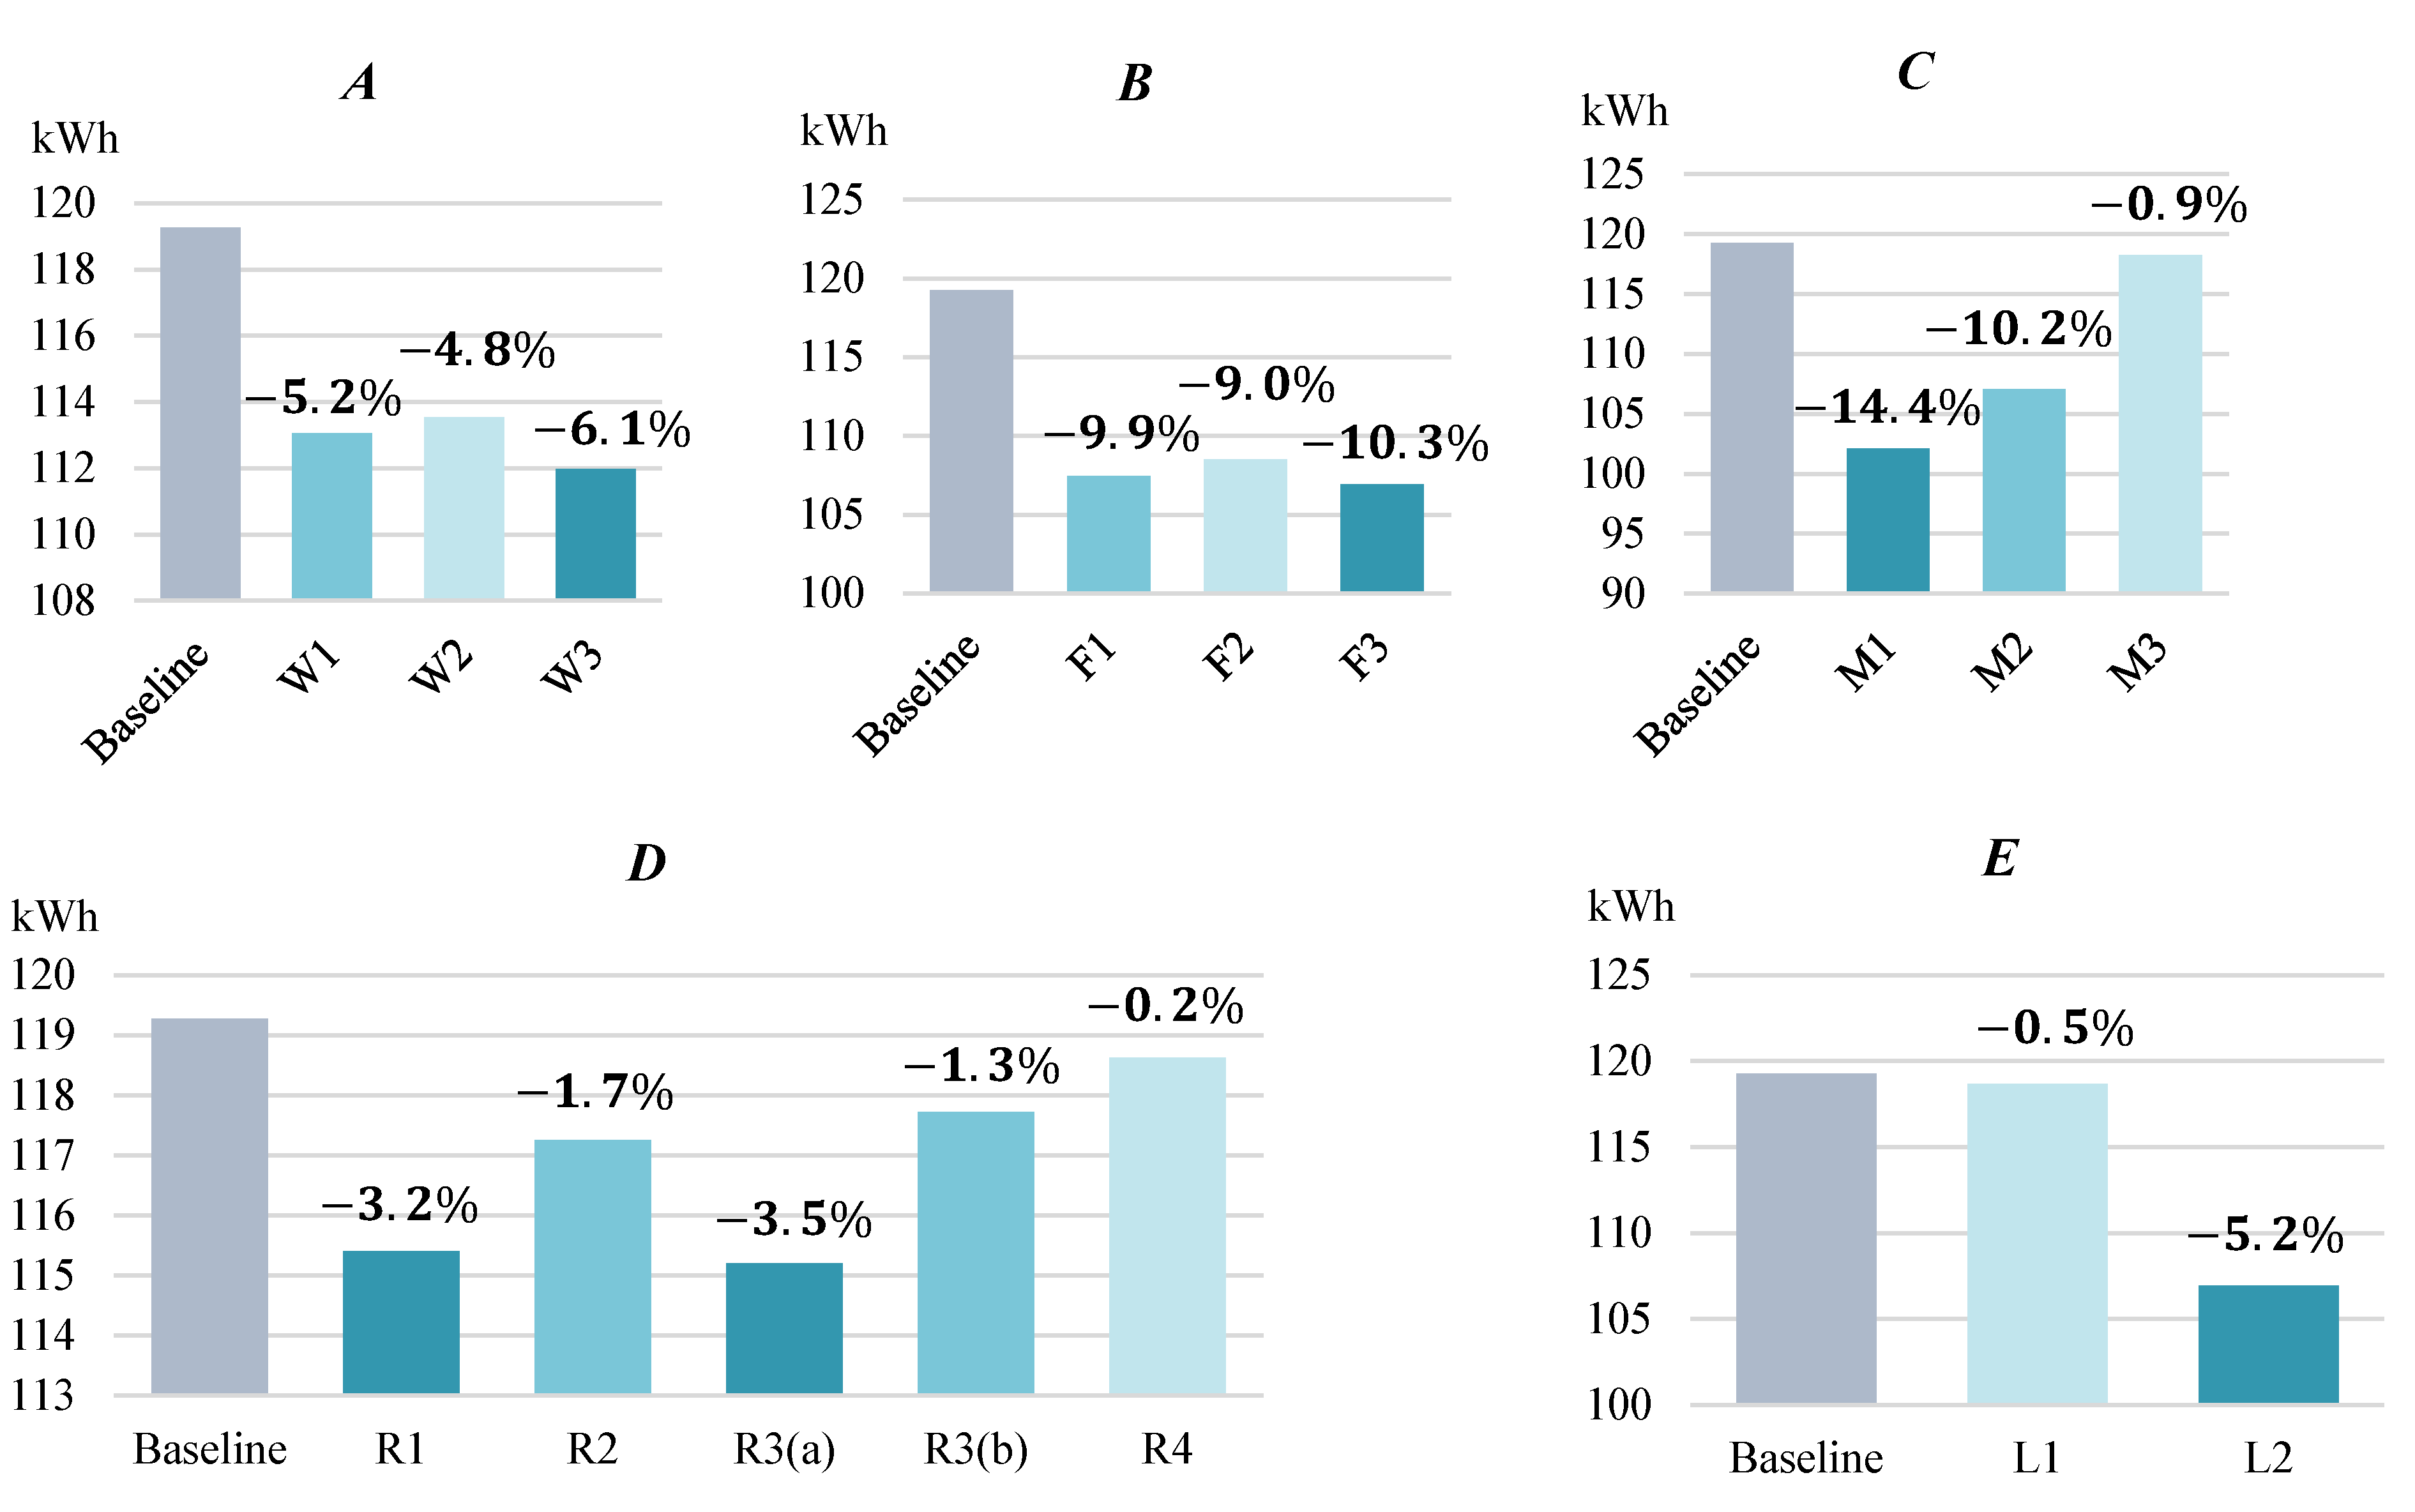
4.3. Single-Strategy Energy Performance
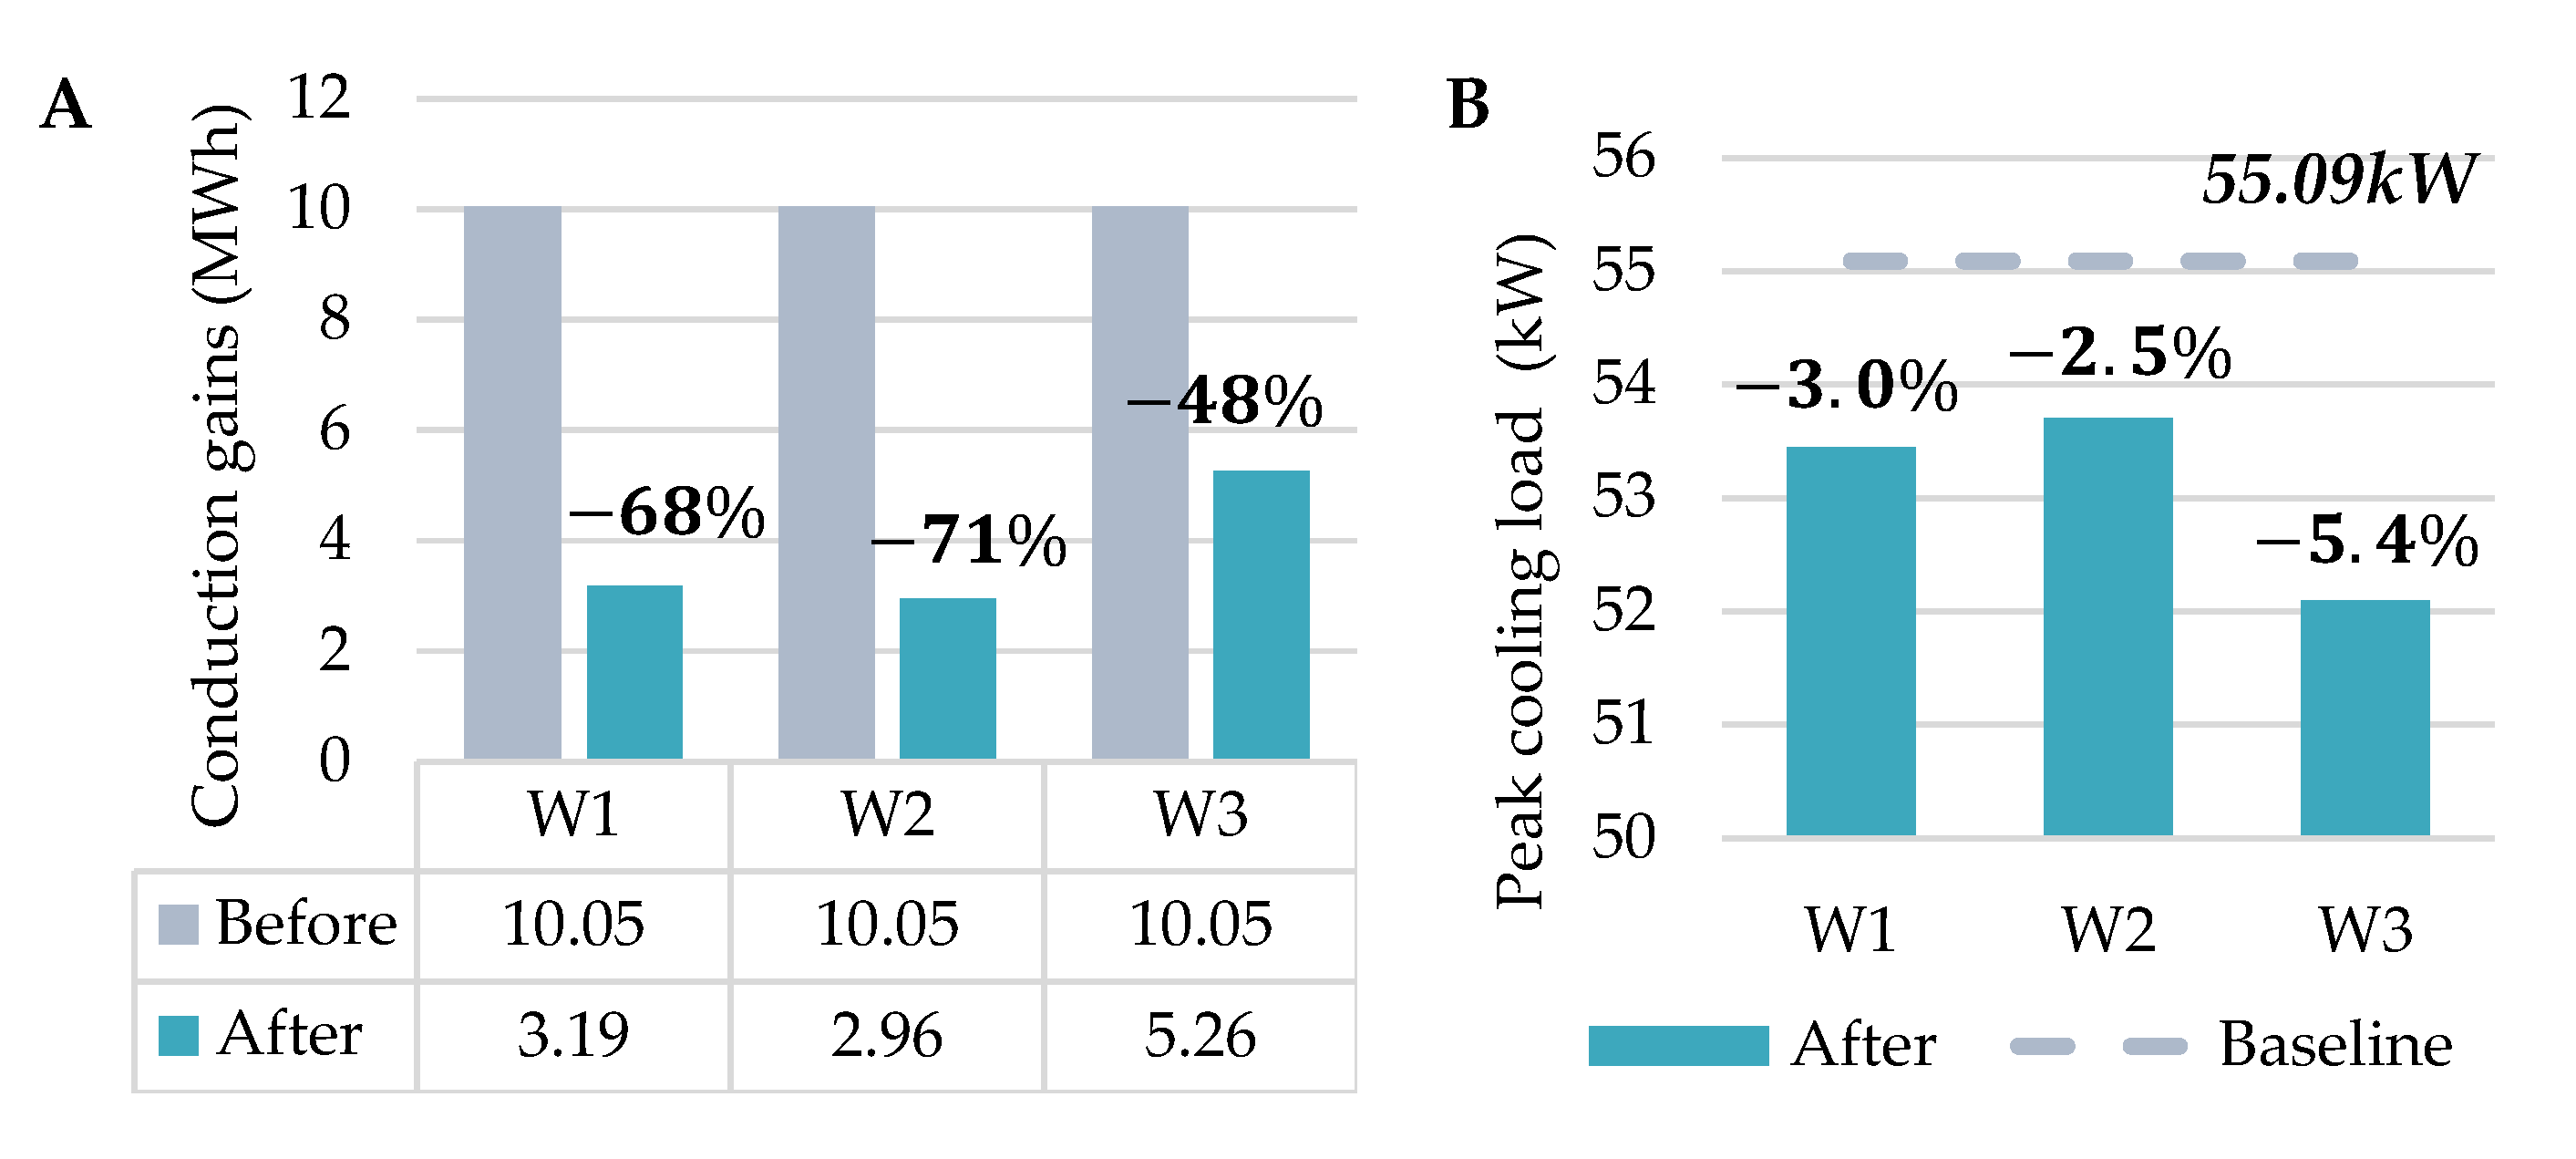
4.3.1. External Walls: W1
4.3.2. Fenestration: F1 versus F3
4.3.3. Roof: R1 versus R3(a)
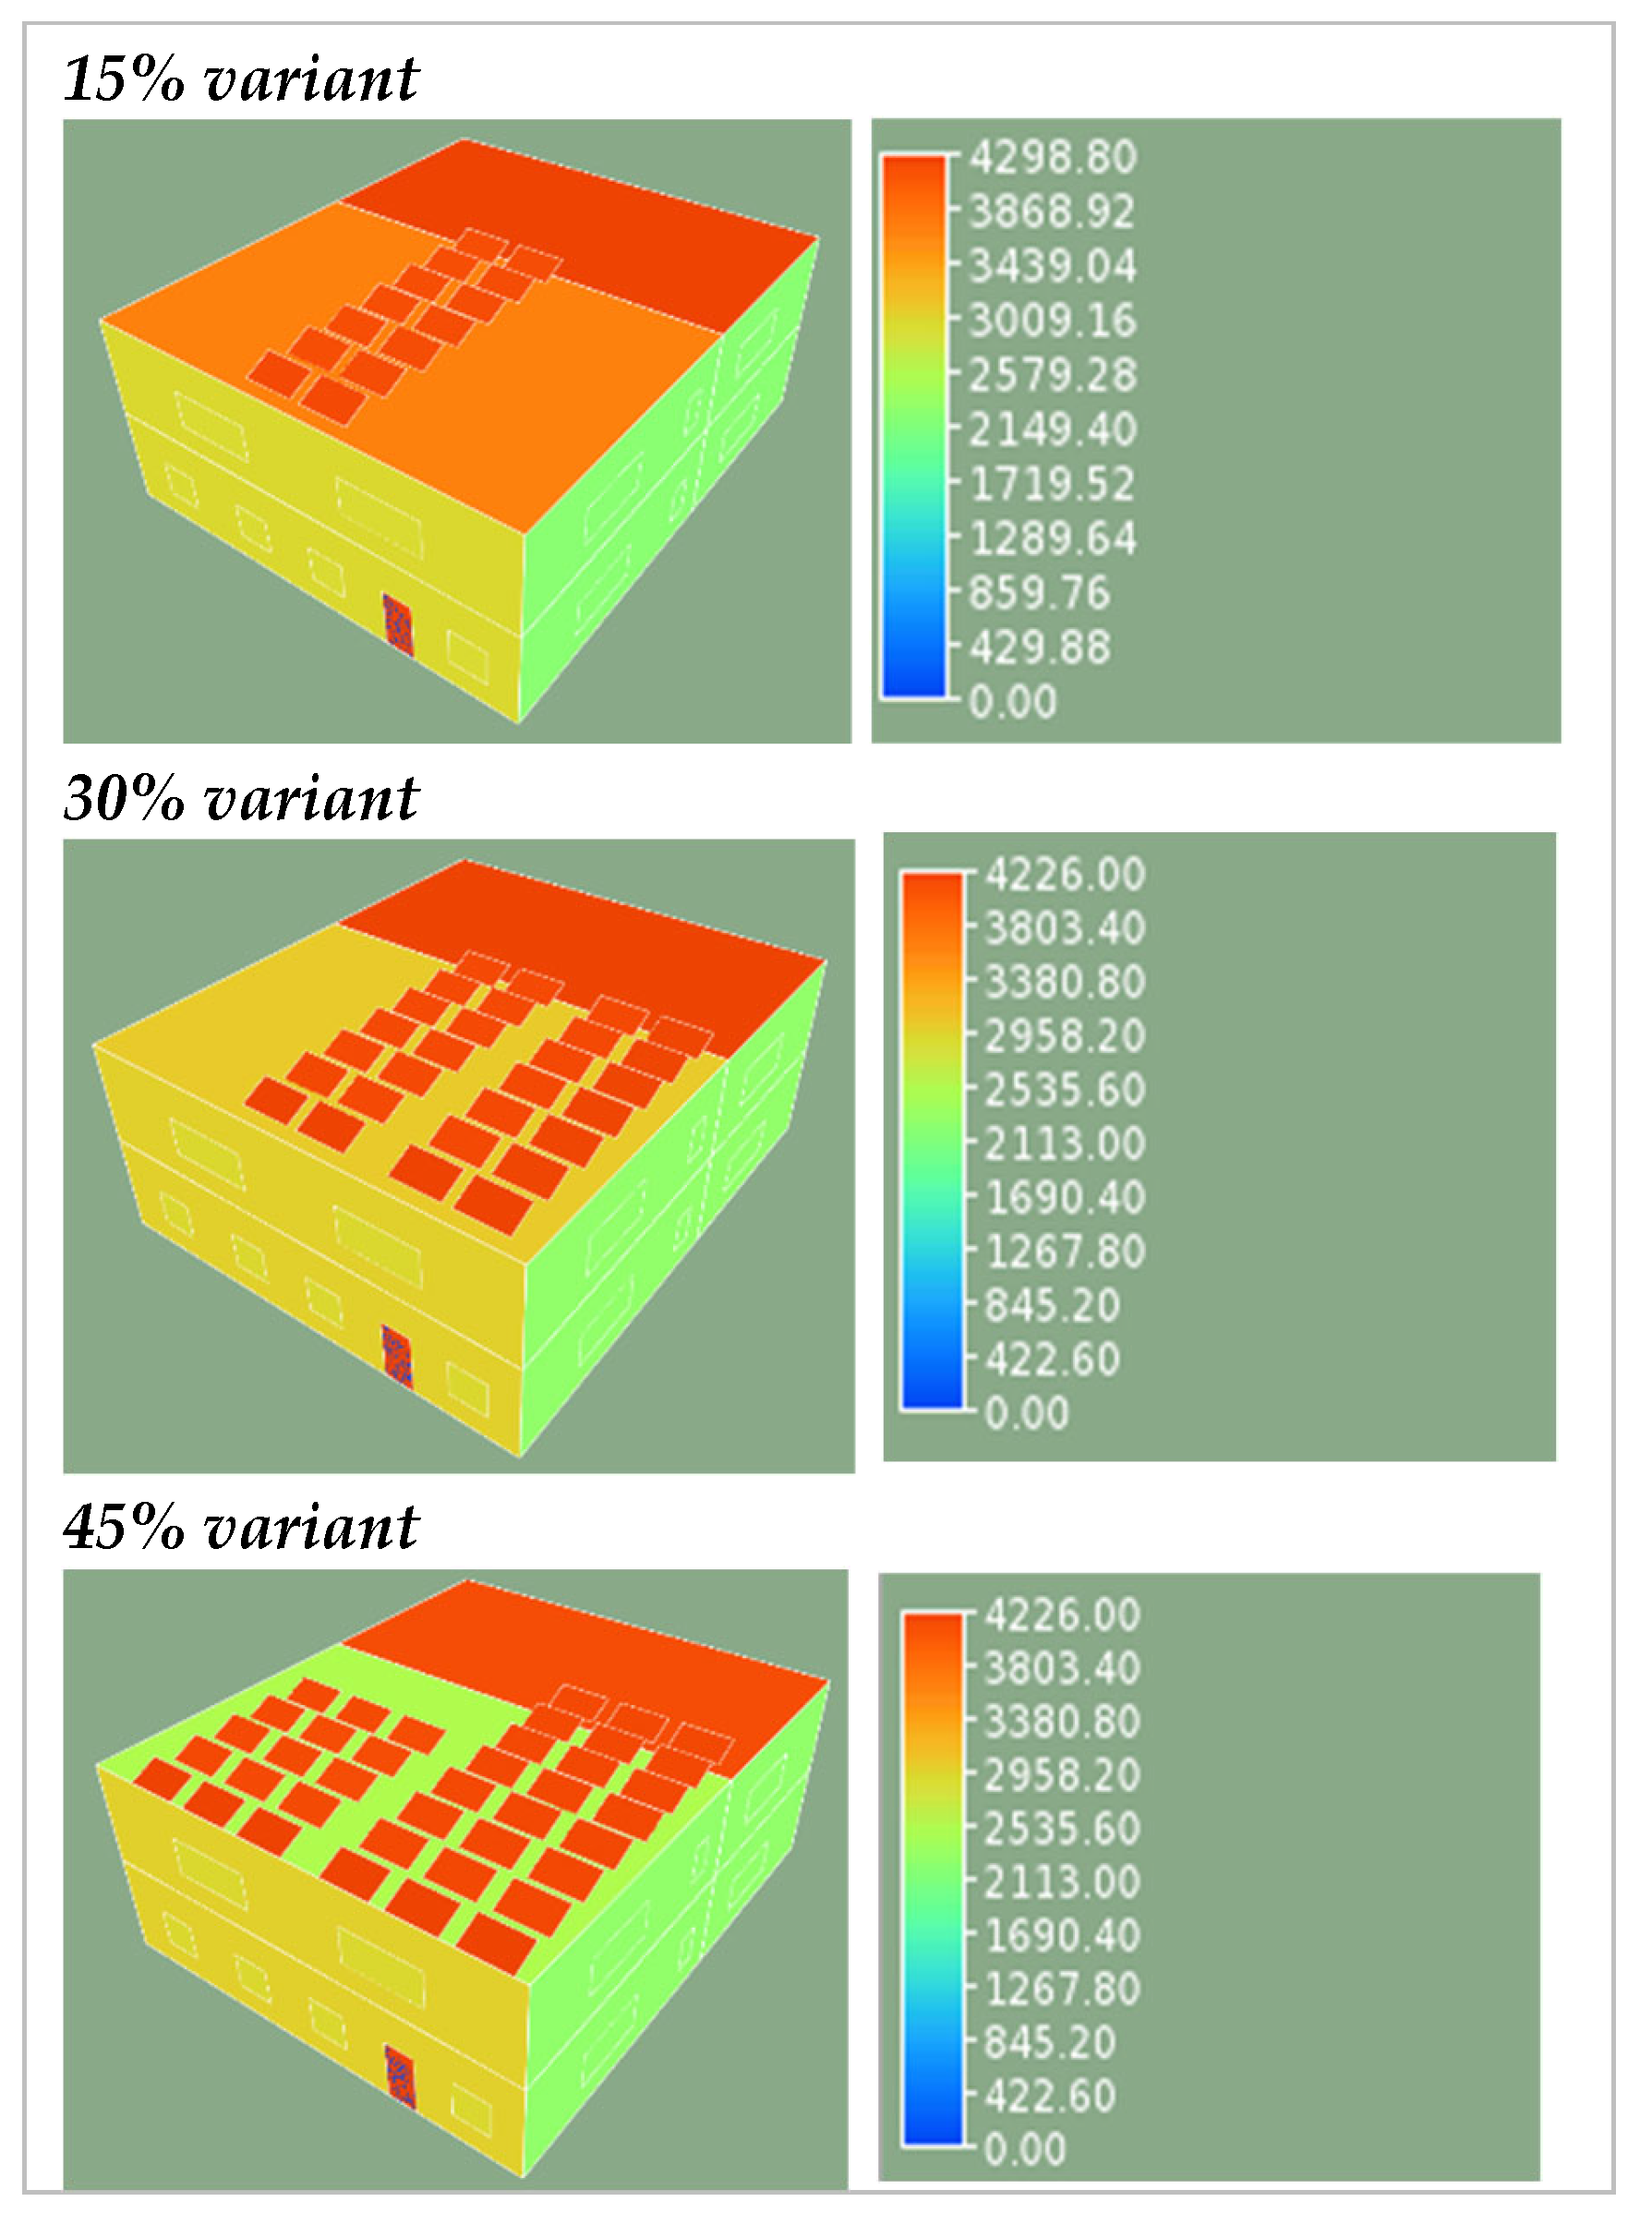
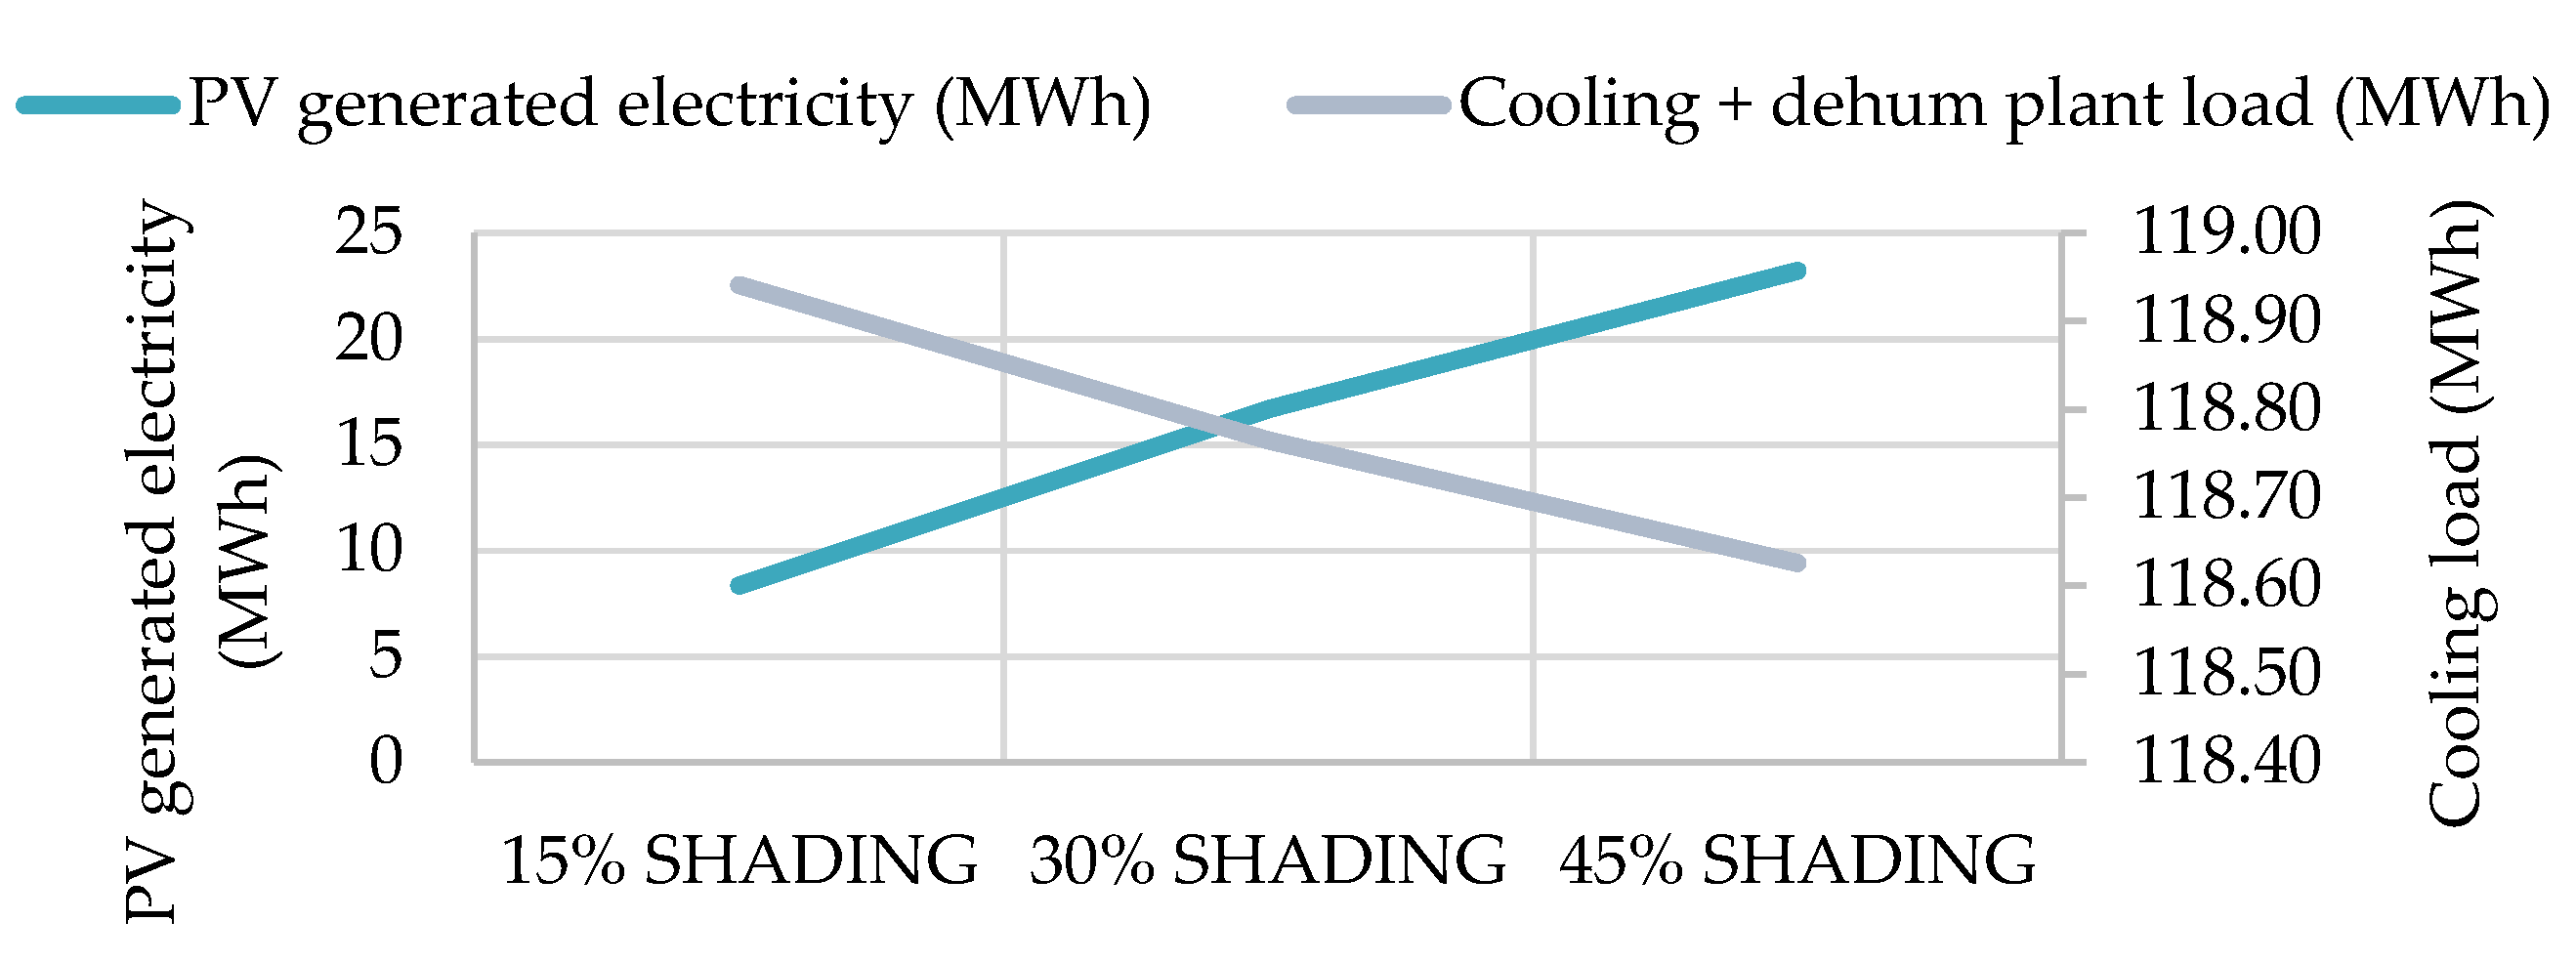
4.3.4. Microgeneration: Shading Versus Generation (M1)
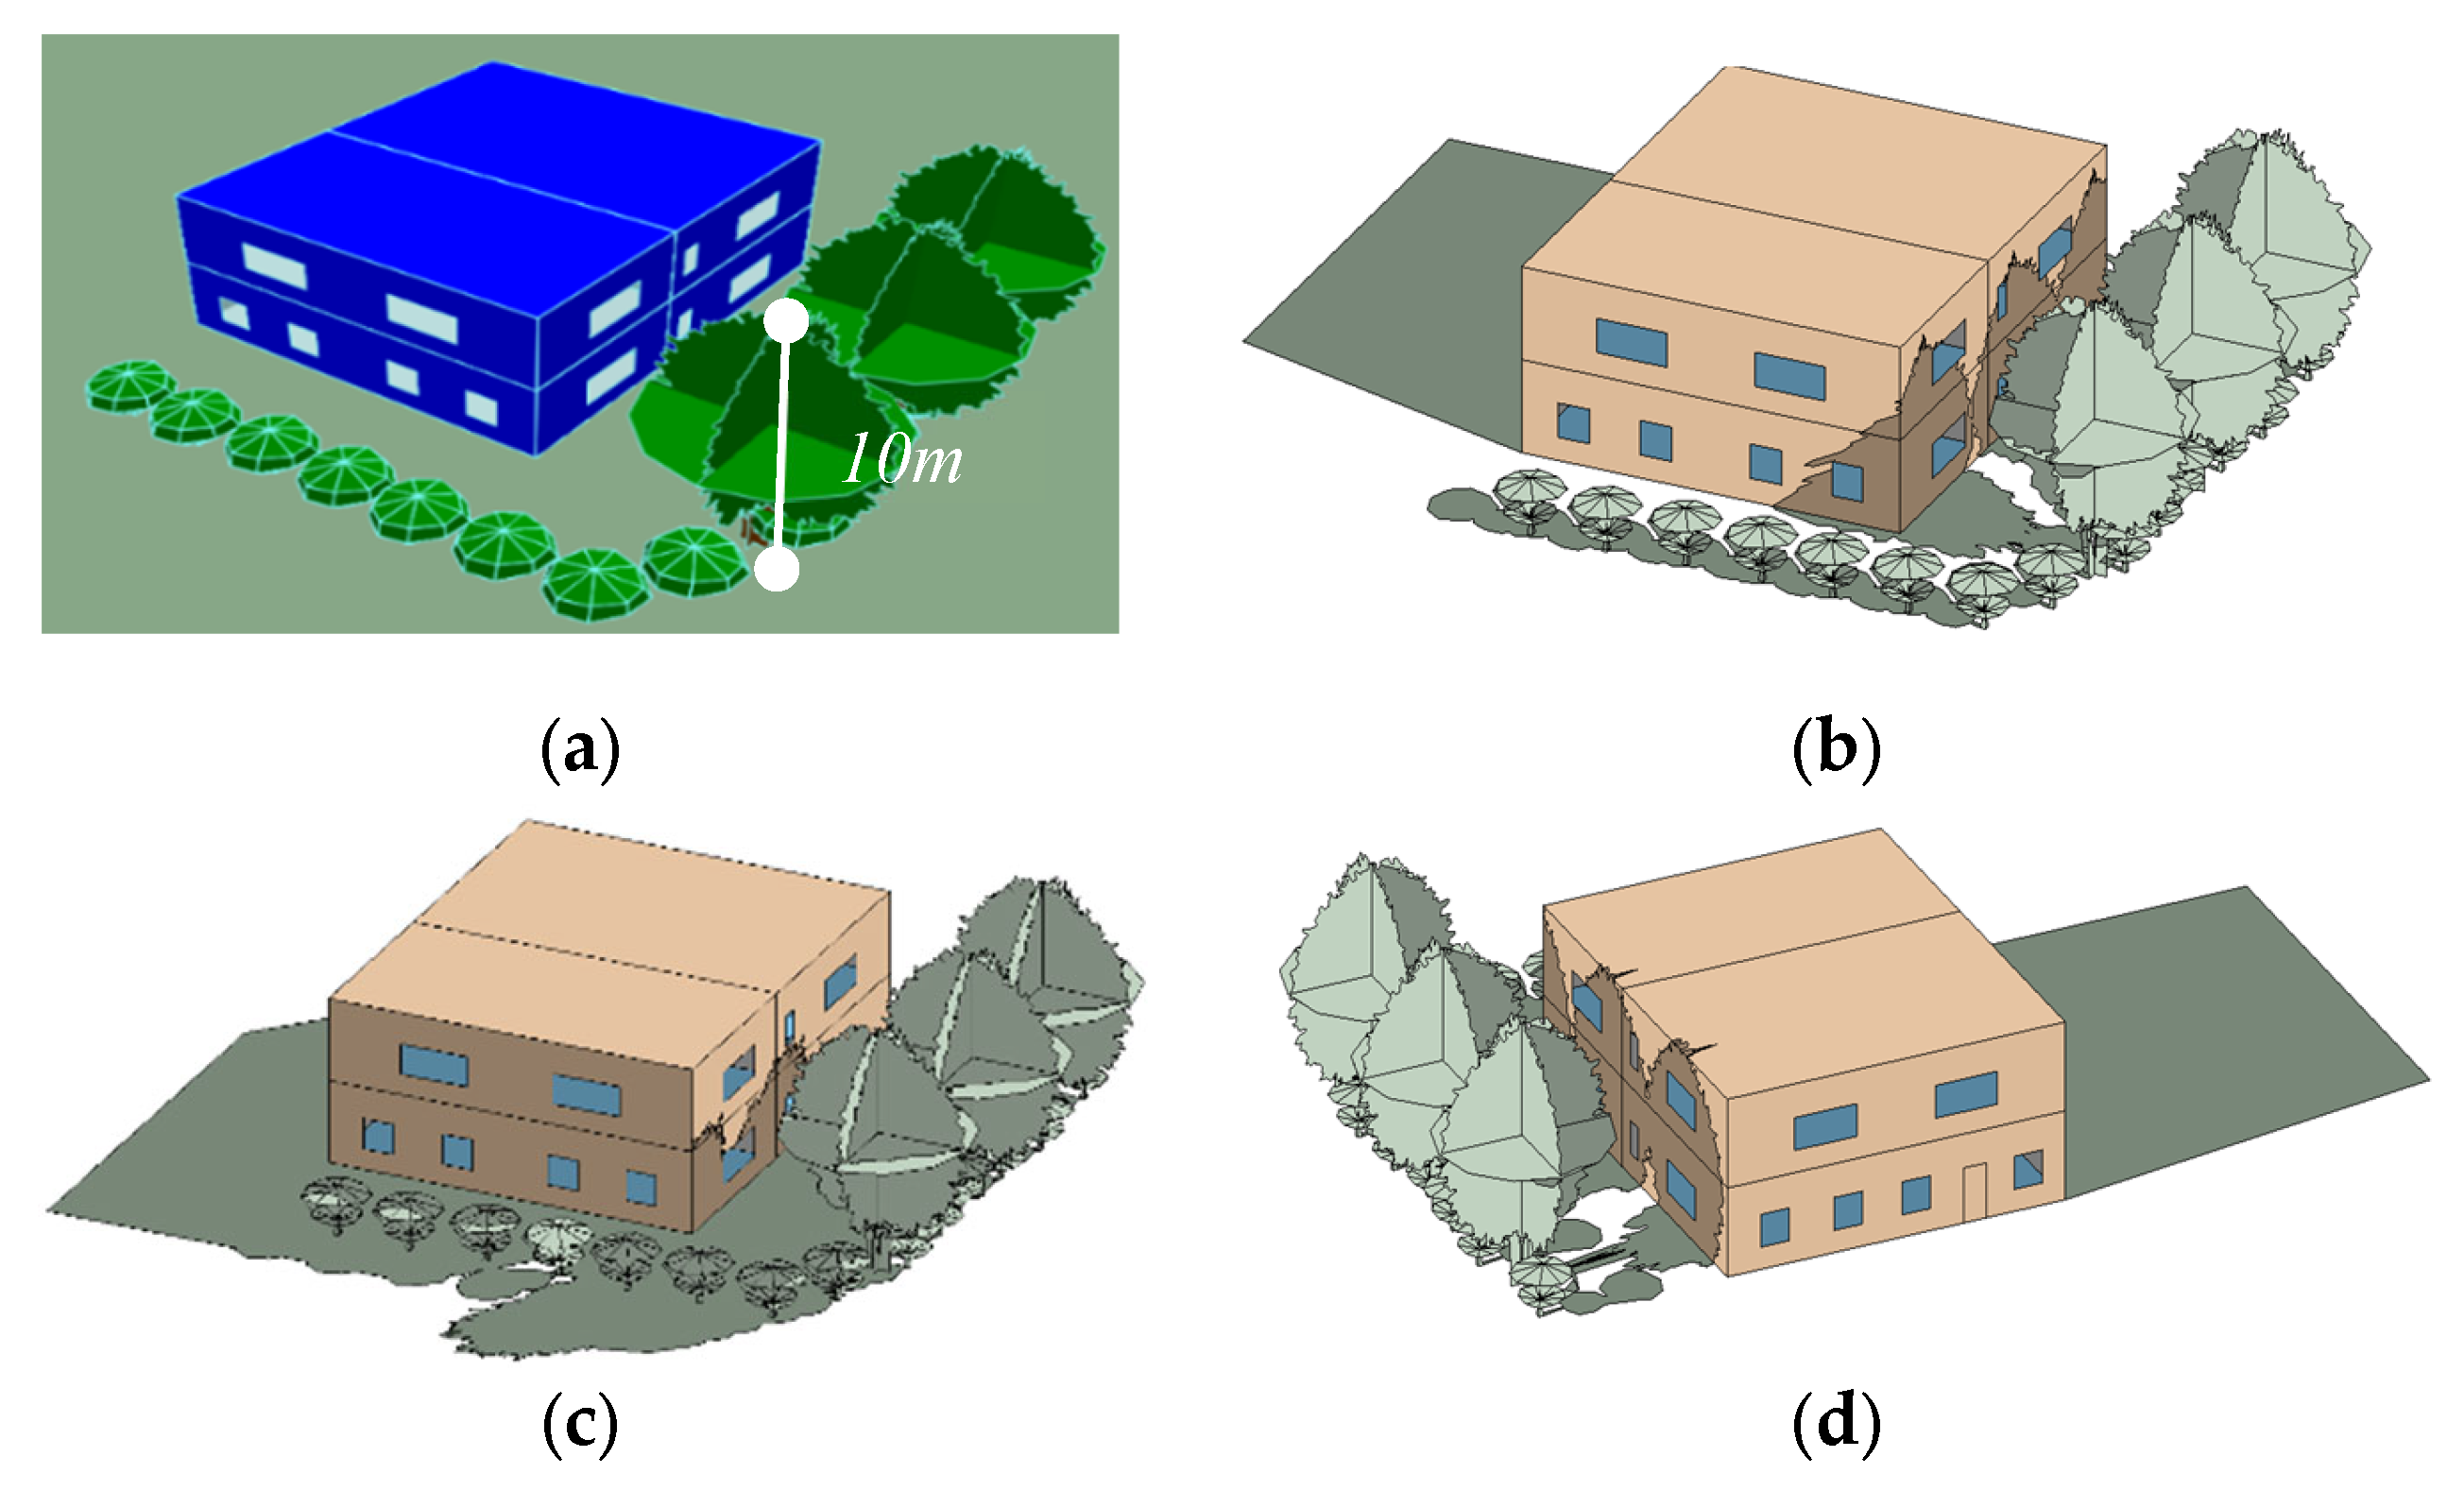
4.3.5. Landscaping: L1
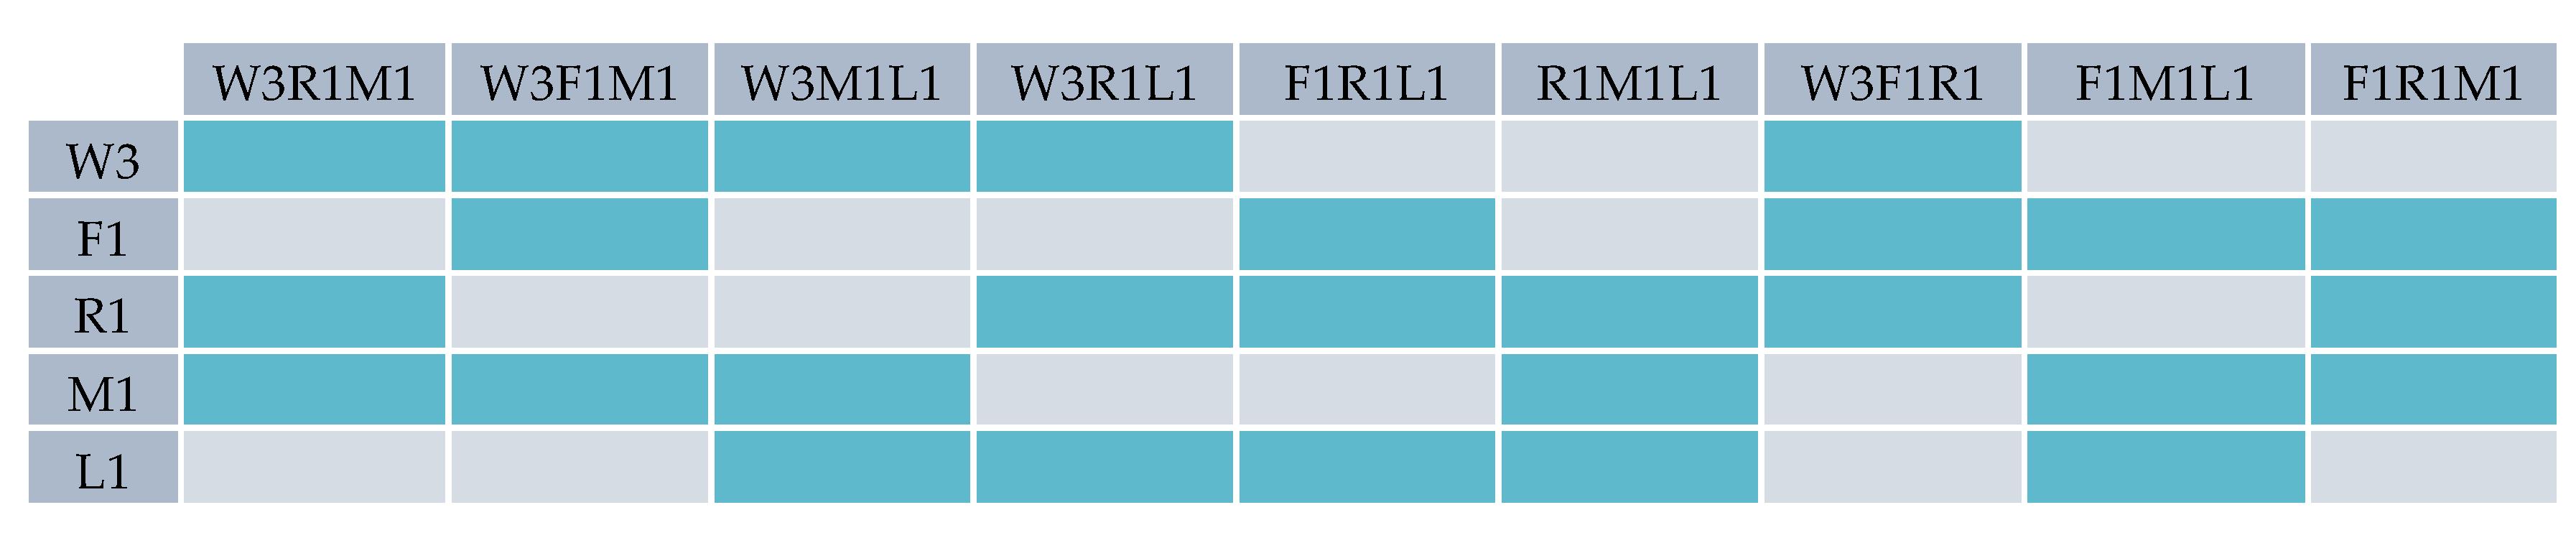
4.3.6. Section Overview: The Selection and Formulation of the Retrofit Packages
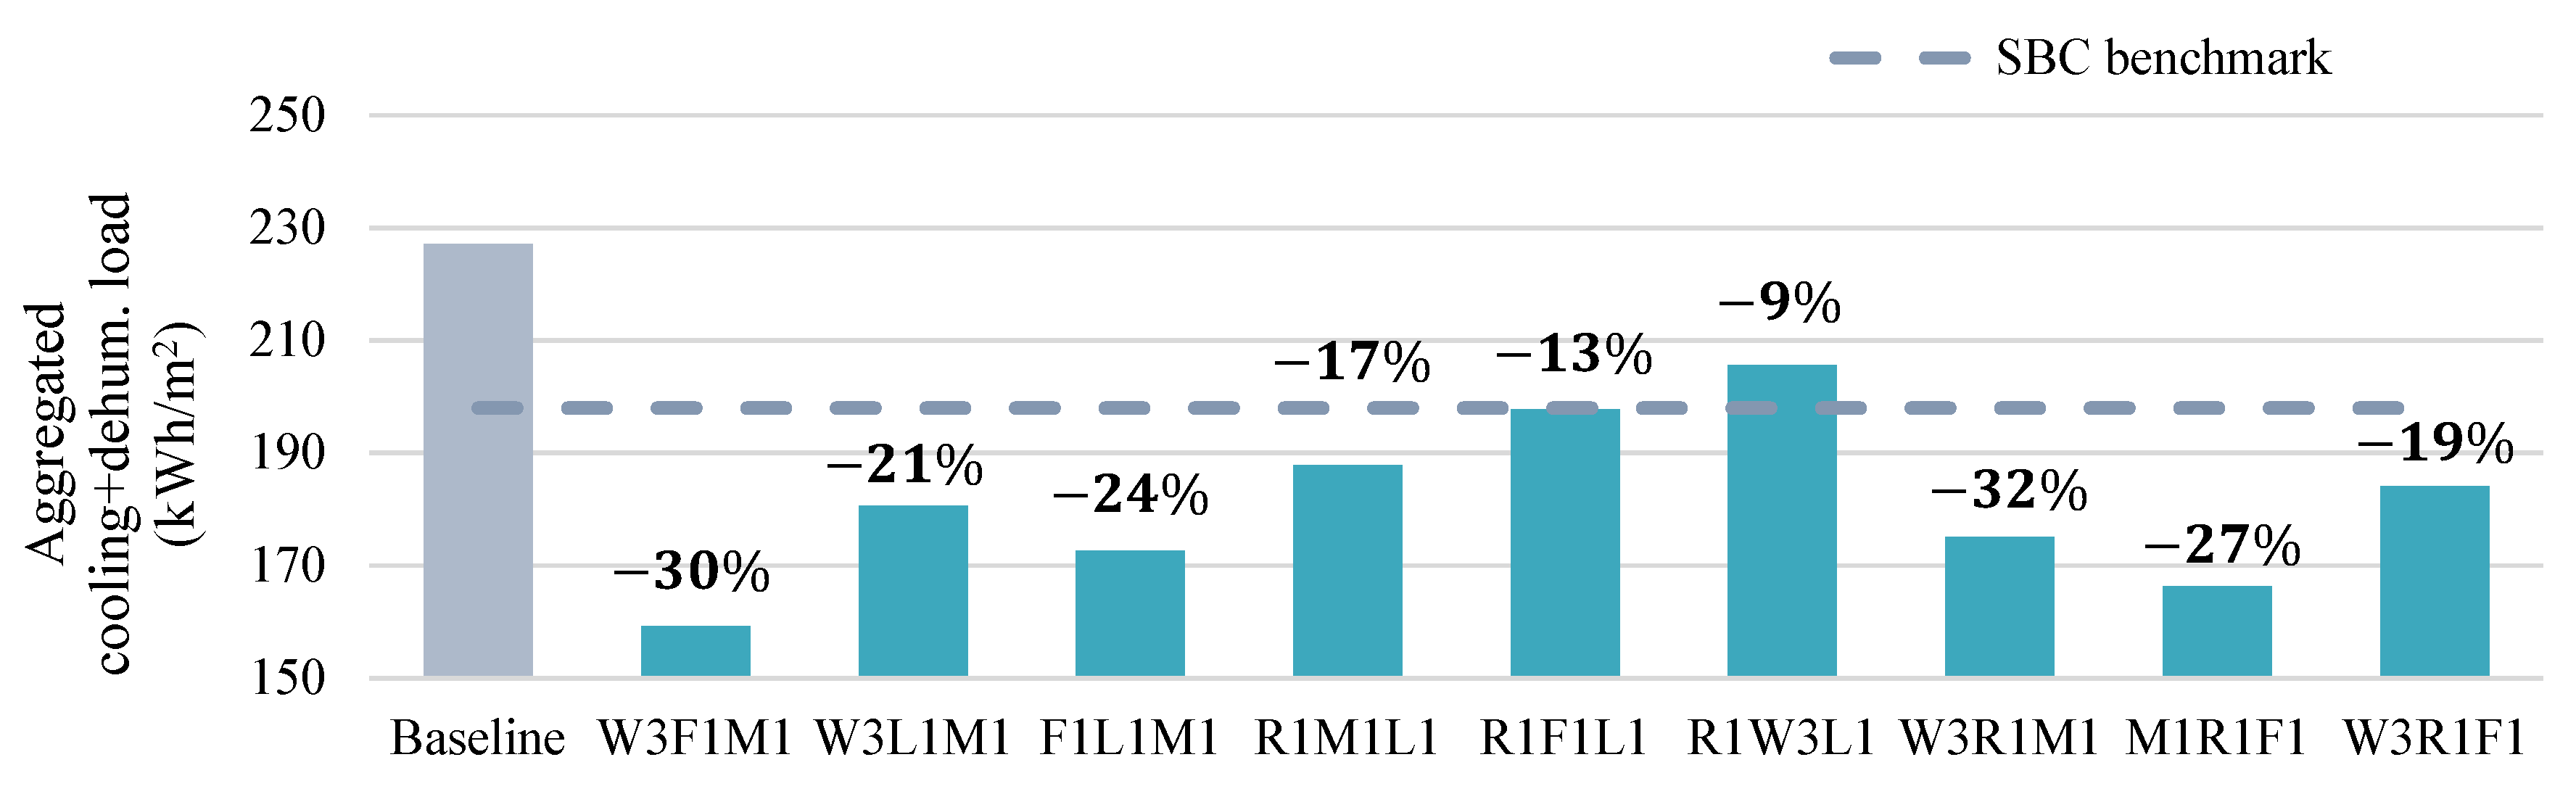
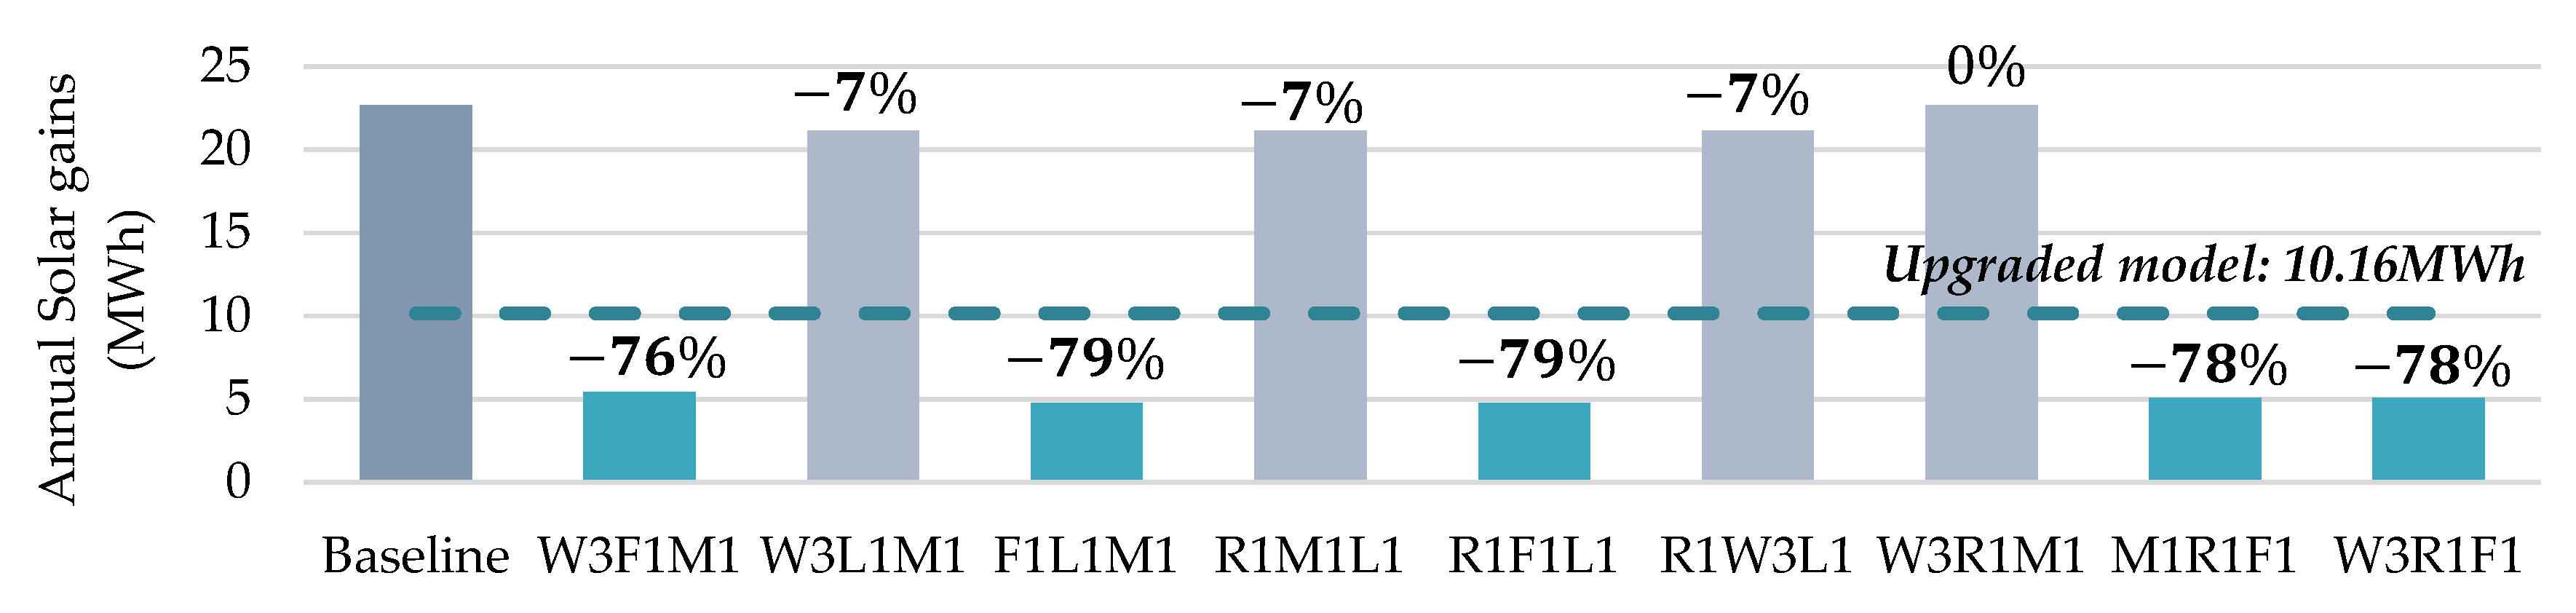
4.4. Energy Performance of Retrofit Packages
5. Conclusions and Further Recommendations
5.1. Conclusive Statement
5.2. Research Limitations and Further Recommendations
Author Contributions
Funding
Institutional Review Board Statement
Informed Consent Statement
Data Availability Statement
Conflicts of Interest
Appendix A. Supporting Data

| Opaque Elements | Residential Conditioned | Residential Unconditioned | |||
|---|---|---|---|---|---|
| Assembly | Insulation | Assembly | Insulation | ||
| Max U-Value W/m2 °C | Min R-Value m2 °C/W | Max U-Value W/m2 °C | Min R-Value m2·°C/W | ||
| Roofs | Insulation Entirely Above Deck (Continuous Insulation) | U-0.202 | R-5.0 C.I. | U-0.4 | R-2.5 C.I. |
| Wall | Above-Grade Mass (Continuous Insulation) | U-0.342 | R-2.92 C.I. | U-0.453 | R-2.2 C.I. |
| Below-Grade | C-0.678 | R-1.3 C.I. | C-6.473 | NR | |
| Floors | Mass | U-0.496 | R-1.5 C.I. | U-0.78 | R-0.7 C.I. |
| Steel-Joist | U-0.296 | R-3.3 | U-0.296 | R-3.3 | |
| Other | U-0.188 | R-5.3 | U-0.288 | R-3.3 | |
| Slab-on-Grade Floors | F-0.90 | R-2.6 | F-1.263 | NR | |
| Doors For 60 cm | All Assemblies | U-2.839 | U-2.839 | ||
| Fenestration | Assembly | Assembly | Assembly | Assembly |
|---|---|---|---|---|
| Max U-Value W/m2 °C | Maximum SHGC | Max U-Value W/m2 °C | Maximum SHGC | |
| Vertical Glazing, 25% of Wall All Assemblies | U-2.668 | SHGC-0.25 | U-3.695 | NR |
| Skylight with Curb, Glass, % of Roof 0–3% All Types | U-4.259 | SHGC-0.35 | U-10.22 | SHGC-0.35 |
| Building Air Tightness | (ACH50) 4.0 | NR | ||
Appendix B. Additional Methodology Considerations
| 157.50 | 1.63 | 310 | 33.25 | 90–450 |
| Shading factors | 15% | 30% | 45% | |
| 23.63 | 0.25 | 70.88 | ||
| No. of panels | 14 | 28 | 41 | |
| 4.34 | 68 | 12.71 | ||
| 3.26 | 6.51 | 9.53 | ||
| Series × parallel | 2 × 7 | 2 × 14 | 13 × 3 | |
| Actual no. of panels | 14 | 28 | 39 | |
| 22.78 | 45.55 | 63.45 | ||
| Covered ratio without spacing between panels | 14% | 29% | 40% | |
References
- Renewable Energy Policy Network for the 21st Century (REN21). Renewables 2019 Global Status Report; REN21 Secretariat: Paris, France, 2019. [Google Scholar]
- United Nations Environmental Programme (UNEP). Building and Climate Change: A Summary for Decision-Makers; UNEP DTIE Sustainable Consumption & Production Branch: Paris, France, 2009. [Google Scholar]
- United Nations Department of Economic and Social Affairs. 68% of the World Population Projected to Live in Urban Areas by 2050, Says UN, 16 May 2018. Available online: https://www.un.org/development/desa/en/news/population/2018-revision-of-world-urbanization-prospects.html (accessed on 9 June 2020).
- World Economic Forum. How the Middle East is Suffering on the Front Lines of Climate Change. Available online: https://www.weforum.org/agenda/2019/04/middle-east-front-lines-climate-change-mena/ (accessed on 5 April 2020).
- Reiche, D. Energy Policies of Gulf Cooperation Council (GCC) countries—Possibilities and limitations of ecological modernization in rentier states. Energy Policy 2010, 38, 2395–2403. [Google Scholar] [CrossRef] [Green Version]
- Almasoud, A.; Gandayh, H.M. Future of solar energy in Saudi Arabia. J. King Saud Univ. Eng. Sci. 2015, 27, 153–157. [Google Scholar] [CrossRef] [Green Version]
- Krarti, M.; Dubey, K.; Howarth, N. Evaluation of building energy efficiency investment options for the Kingdom of Saudi Arabia. Energy 2017, 134, 595–610. [Google Scholar] [CrossRef]
- Krarti, M.; Aldubyan, M.; Williams, E. Residential building stock model for evaluating energy retrofit programs in Saudi Arabia. Energy 2020, 195, 116980. [Google Scholar] [CrossRef]
- Alrashed, F.; Asif, M. Saudi Building Industry’s Views on Sustainability in Buildings: Questionnaire Survey. Energy Procedia 2014, 62, 382–390. [Google Scholar] [CrossRef] [Green Version]
- Almazroui, M.; Islam, M.N.; Jones, P.; Athar, H.; Rahman, M.A. Recent climate change in the Arabian Peninsula: Seasonal rainfall and temperature climatology of Saudi Arabia for 1979–2009. Atmos. Res. 2012, 111, 29–45. [Google Scholar] [CrossRef]
- Saudi Building Code National Committee (SBCNC). Saudi Energy Code (SBC 601-602). 2018. Available online: https://www.sbc.gov.sa/En/Pages/default.aspx (accessed on 1 July 2020).
- Mujeebu, M.A.; Alshamrani, O.S. Prospects of energy conservation and management in buildings—The Saudi Arabian scenario versus global trends. Renew. Sustain. Energy Rev. 2016, 58, 1647–1663. [Google Scholar] [CrossRef]
- Santander Trade. Analyze Market Trends, Saudi Arabia: General Presentation. Available online: https://santandertrade.com/en/portal/analyse-markets/saudi-arabia/general-presentation (accessed on 4 July 2020).
- United Nations Framework Convention on Climate Change (UNFCCC). The Intended Nationally Determined Contribution of the Kingdom of Saudi Arabia under the UNFCCC. 2015. Available online: https://www4.unfccc.int/sites/ndcstaging/PublishedDocuments/Saudi%20Arabia%20First/KSA-INDCs%20English.pdf (accessed on 10 July 2020).
- McKinsey Global Institute (MGI). Saudi Arabia Beyond Oil: The Investment and Productivity Transformation; McKinsey & Company: Riyadh, Saudi Arabia, 2015. [Google Scholar]
- Saudi Embassy. Saudi Arabia and Political, Economic & Social Development; Saudi Embassy: Riyadh, Saudi Arabia, 2017. [Google Scholar]
- Climate Transparency. Brown to Green: The G20 Transition to a Low-Carbon Economy (Saudi Arabia); Climate Transparency: Berlin, Germany; Humboldt-Viadrina Governance Platform: Berlin, Germany, 2018. [Google Scholar]
- Santander Trade. Analyze Market Trends, Reaching the Consumer: Saudi Arabia. 2020. Available online: https://santandertrade.com/en/portal/analyse-markets/saudi-arabia/reaching-the-consumers (accessed on 7 July 2020).
- Alaidroos, A.; Krarti, M. Optimal design of residential building envelope systems in the Kingdom of Saudi Arabia. Energy Build. 2015, 86, 104–117. [Google Scholar] [CrossRef]
- Aldossary, N.A.; Rezgui, Y.; Kwan, A. Consensus-based low carbon domestic design framework for sustainable homes. Renew. Sustain. Energy Rev. 2015, 51, 417–432. [Google Scholar] [CrossRef]
- Abdelrahman, M.A.; Ahmed, A. Cost-effective use of thermal insulation in hot climates. Build. Environ. J. 1991, 26, 189–194. [Google Scholar] [CrossRef]
- Saleh, M. Impact of solar insulation location on buildings in hot dry climates. Solar Wind Technol. 1990, 7, 393–406. [Google Scholar] [CrossRef]
- Al-Sanea, S.A.; Zedan, M. Improving thermal performance of building walls by optimizing insulation layer distribution and thickness for same thermal mass. Appl. Energy 2011, 88, 3113–3124. [Google Scholar] [CrossRef]
- Al-Naimi, I. The Potential for Energy Conservation in Residential Buildings in Dammam Region, Saudi Arabia. Ph.D. Thesis, University of Newcastle upon Tyne, Newcastle upon Tyne, UK, 1989; pp. 330–340. [Google Scholar]
- Suehrcke, H.; Peterson, E.L.; Selby, N. Effect of roof solar reflectance on the building heat gain in a hot climate. Energy Build. 2008, 40, 2224–2235. [Google Scholar] [CrossRef]
- Al-Sanea, S.A. Thermal performance of building roof elements. Build. Environ. 2002, 37, 665–675. [Google Scholar] [CrossRef]
- Al-Turki, A.; Zaki, G. Energy saving through intermittent evaporative roof cooling. Energy Build. 1991, 17, 35–42. [Google Scholar] [CrossRef]
- Dabaieh, M.; Wanas, O.; Hegazy, M.A.; Johansson, E. Reducing cooling demands in a hot dry climate: A simulation study for non-insulated passive cool roof thermal performance in residential buildings. Energy Build. 2015, 89, 142–152. [Google Scholar] [CrossRef] [Green Version]
- Becherini, F.; Lucchi, E.; Gandini, A.; Barrasa, M.C.; Troi, A.; Roberti, F.; Sachini, M.; Di Tuccio, M.C.; Arrieta, L.G.; Pockelé, L.; et al. Characterization and thermal performance evaluation of infrared reflective coatings compatible with historic buildings. Build. Environ. 2018, 134, 35–46. [Google Scholar] [CrossRef]
- Akbari, H.; Levinson, R.; Miller, W.A.; Berdahl, P. Cool Colored Roofs to Save Energy and Improve Air Quality. In Proceedings of the International Conference, Passive and Low Energy Cooling for the Built Environment, Santorini, Greece, 19–21 May 2005; pp. 89–100. [Google Scholar]
- Hosseini, M.; Akbari, H. Heating energy penalties of cool roofs: The effect of snow accumulation on roofs. Adv. Build. Energy Res. 2014, 8, 1–13. [Google Scholar] [CrossRef]
- Levinson, R.; Berdahl, P.; Asefawberhe, A.; Akbari, H. Effects of soiling and cleaning on the reflectance and solar heat gain of a light-colored roofing membrane. Atmos. Environ. 2005, 39, 7807–7824. [Google Scholar] [CrossRef]
- Alexandri, E.; Jones, P. Temperature decreases in an urban canyon due to green walls and green roofs in diverse climates. Build. Environ. 2008, 43, 480–493. [Google Scholar] [CrossRef]
- Tinker, J.A.; Al-Buijan, K. Thermal Performance of Fenestration Systems in the Hot Climate of Saudi Arabia. In Proceedings of the AHRAE: Thermal Performance of the Exterior Envelopes of Buildings VII, Clearwater Beach, FL, USA, 6–10 December 1998; pp. 311–318. [Google Scholar]
- Aldossary, N.A.; Rezgui, Y.; Kwan, A. Domestic energy consumption patterns in a hot and humid climate: A multiple-case study analysis. Appl. Energy 2014, 114, 353–365. [Google Scholar] [CrossRef]
- Omer, A.M. Renewable building energy systems and passive human comfort solutions. Renew. Sustain. Energy Rev. 2008, 12, 1562–1587. [Google Scholar] [CrossRef]
- Bajwa, M.M. The role of integrated landscape design in energy conservation in detached dwellings in the Arabian Gulf region. Renew. Energy 1995, 6, 139–150. [Google Scholar] [CrossRef]
- Alyami, S.H.; Rezgui, Y.; Kwan, A. Developing sustainable building assessment scheme for Saudi Arabia: Delphi consultation approach. Renew. Sustain. Energy Rev. 2013, 27, 43–54. [Google Scholar] [CrossRef]
- Al-Homoud, M.S. Computer-aided building energy analysis techniques. Build. Environ. 2001, 36, 421–433. [Google Scholar] [CrossRef]
- Al-Homoud, M.S. A Systematic Approach for the Thermal Design Optimization of Building Envelopes. J. Build. Phys. 2005, 29, 95–119. [Google Scholar] [CrossRef]
- Shameri, M.A.; Alghoul, M.A.; Elayeb, O.; Zain, M.F.M.; Alrubaih, M.S.; Amir, H.; Sopian, K. Daylighting characteristics of existing double-skin façade office buildings. Energy Build. J. 2013, 59, 279–286. [Google Scholar] [CrossRef]
- IESVE. Available online: https://www.iesve.com/software (accessed on 29 July 2020).
- Meteoblue. Climate Riyadh. 2014. Available online: https://www.meteoblue.com/en/weather/historyclimate/climatemodelled/riyadh_saudi-arabia_108410 (accessed on 1 August 2020).
- NASA. POWER Data Access Viewer. Available online: https://power.larc.nasa.gov/data-access-viewer/ (accessed on 31 July 2020).
- Iaccarino, A. Climate at an Architectural Scale: Applying Riyadh’s Climatic Extremes to Its Built Environment (8 October Workshop). 2013. Available online: https://alexandraiaccarino.wordpress.com/2013/10/08/climate-at-an-architectural-scale-applying-riyadhs-climatic-extremes-to-its-built-environment-oct-8-workshop/ (accessed on 12 August 2020).
- Marsh, A. Interactive 2D Sun-Path. 2020. Available online: https://drajmarsh.bitbucket.io/sunpath2d.html (accessed on 6 August 2020).
- Robinson, A.; Selkowitz, S. Tips for Daylighting with Windows; Ernest Orando Lawrence Berkeley National Laboratory: Berkeley, CA, USA, 2013. [Google Scholar]
- Ibrahim, N.N.L.; Hayman, S. Daylight Design Rules of Thumb. In Proceedings of the Conference on Sustainable Building South East Asia, Kuala Lumpur, Malaysia, 11–13 April 2005. [Google Scholar]
- National Association of Rooflight Manufacturers (NARM). An Introduction to Natural Daylight Design in Domestic Properties (NARM Technical Document NTD12); NARM Secretariat: Caernarfon, UK, 2018. [Google Scholar]
- Royal Commission for Riyadh City. Riyadh Plants. 2015. Available online: https://rp.arriyadhenv.gov.sa/?lang=en (accessed on 8 August 2020).
- Khan, H.S.; Asif, M. Impact of Green Roof and Orientation on the Energy Performance of Buildings: A Case Study from Saudi Arabia. Sustainability 2017, 9, 640. [Google Scholar] [CrossRef] [Green Version]
- Khabaz, A. Construction and design requirements of green buildings’ roofs in Saudi Arabia depending on thermal conductivity principle. Constr. Build. Mater. 2018, 186, 1119–1131. [Google Scholar] [CrossRef]
- Solar, G. GSM 300W/305W/310W/315W/320W. Available online: http://g-solar.eu/gsm-300-320w/ (accessed on 3 August 2020).
- Zeversolar. TL2000. Available online: https://www.zeversolar.com/products/product-detail/product/detail/en-eversol-tl2000/ (accessed on 3 August 2020).
- Song, J.-H.; An, Y.-S.; Kim, S.-G.; Lee, S.-J.; Yoon, J.-H.; Choung, Y.-K. Power output analysis of transparent thin-film module in building integrated photovoltaic system (BIPV). Energy Build. 2008, 40, 2067–2075. [Google Scholar] [CrossRef]
- Chen, M.; Zhang, W.; Xie, L.; Ni, Z.; Wei, Q.; Wang, W.; Tian, H. Experimental and numerical evaluation of the crystalline silicon PV window under the climatic conditions in southwest China. Energy 2019, 183, 584–598. [Google Scholar] [CrossRef]
- American Society of Heating, Refrigerating and Air-Conditioning Engineers (ASHRAE). ANSI/ASHRAE/IES Standard 90.2-2018: Energy Efficient Design of Low-Rise Residential Buildings; ASHRAE: Peachtree Corners, GA, USA, 2018. [Google Scholar]


| Country | Saudi Arabia |
|---|---|
| Geographical footprint | Approximate coordinates of 16–32° N, 34–55° E, Approximate area 2,252,500 km2 |
| Natural resources [12] | Hydrocarbons: Ranks 5th in proven reserves of oil and natural gas globally at a combined estimate of 204.5 trillion cubic feet (2016) |
| Renewables: High solar resource (3245 daylight hours of solar radiation at over 2200 kWh/m2) and attractive wind resource in the Eastern provinces (e.g., a mean annual wind speed of 6.7 m/s at 50 m above ground in Yanbu) | |
| Case study city | Riyadh City |
| Location | Coordinates: 24.714° N, 46.675° E |
| Overview | Semi-to Hyper Arid, with Exceptionally Low Rainfall and High Evapotranspiration | |
|---|---|---|
| Zonal breakdown | Zone 1 | Subtropical, Mediterranean subzone, mountainous subtype |
| Zone 2 | Hot and dry with a maritime desert subzone | |
| Zone 3 | Hot and dry with maritime subzone | |
| Zone 4 | Cold and dry with a desert subzone | |
| Zone 5 | Hot and dry with a desert subzone | |
| Zone 6 | Al-Rub Al-Khali is not inhabited and has no weather data | |
| Floor Dimensions (L × W) | Number of Floors | Building Height | Gross Floor Area | Gross Wall Area | Window-to-Wall Ratio (WWR) | Building Capacity | Operations Parameters |
|---|---|---|---|---|---|---|---|
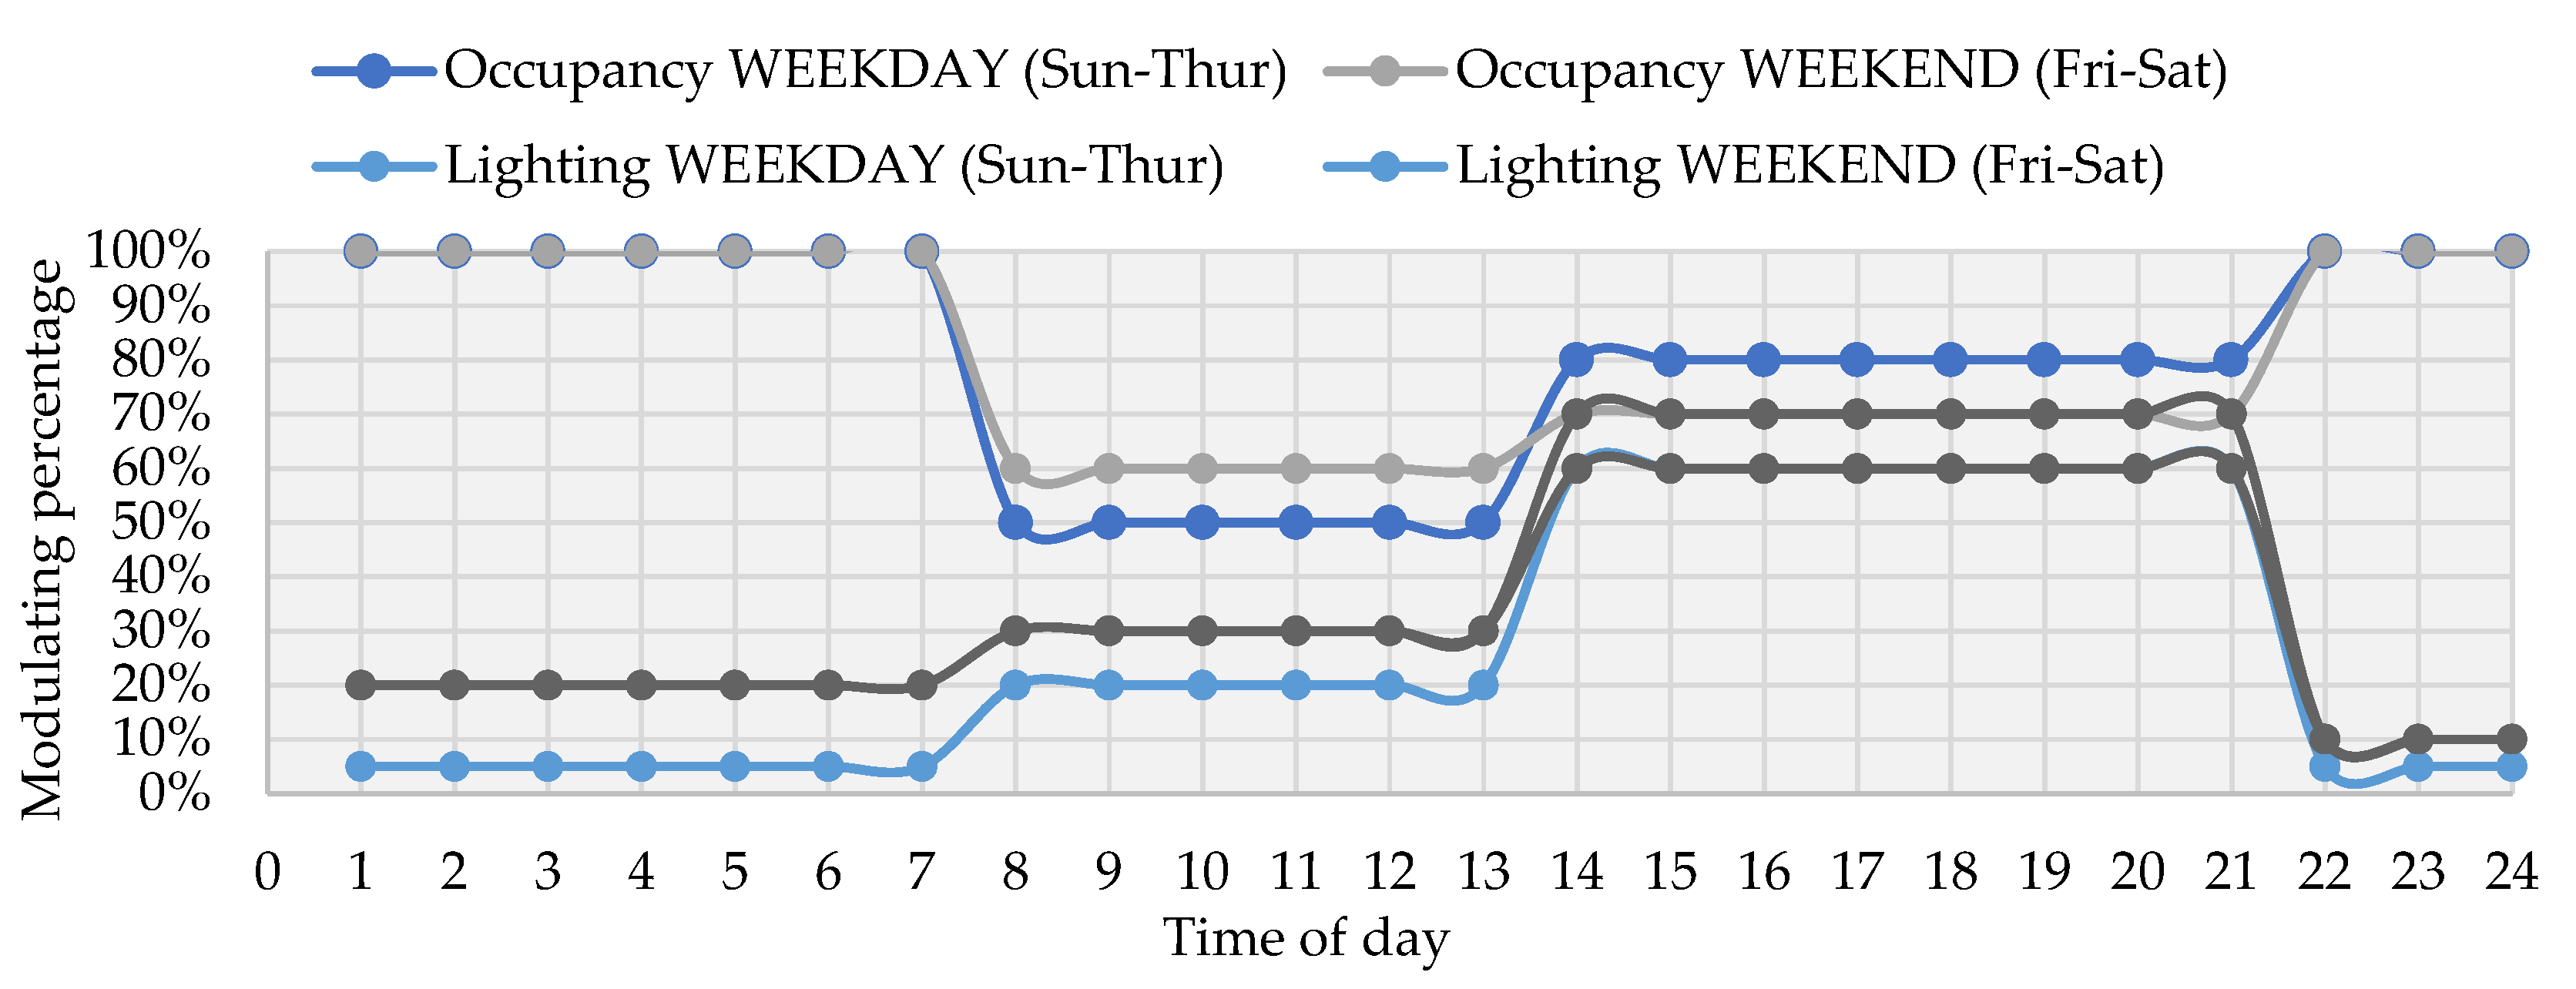
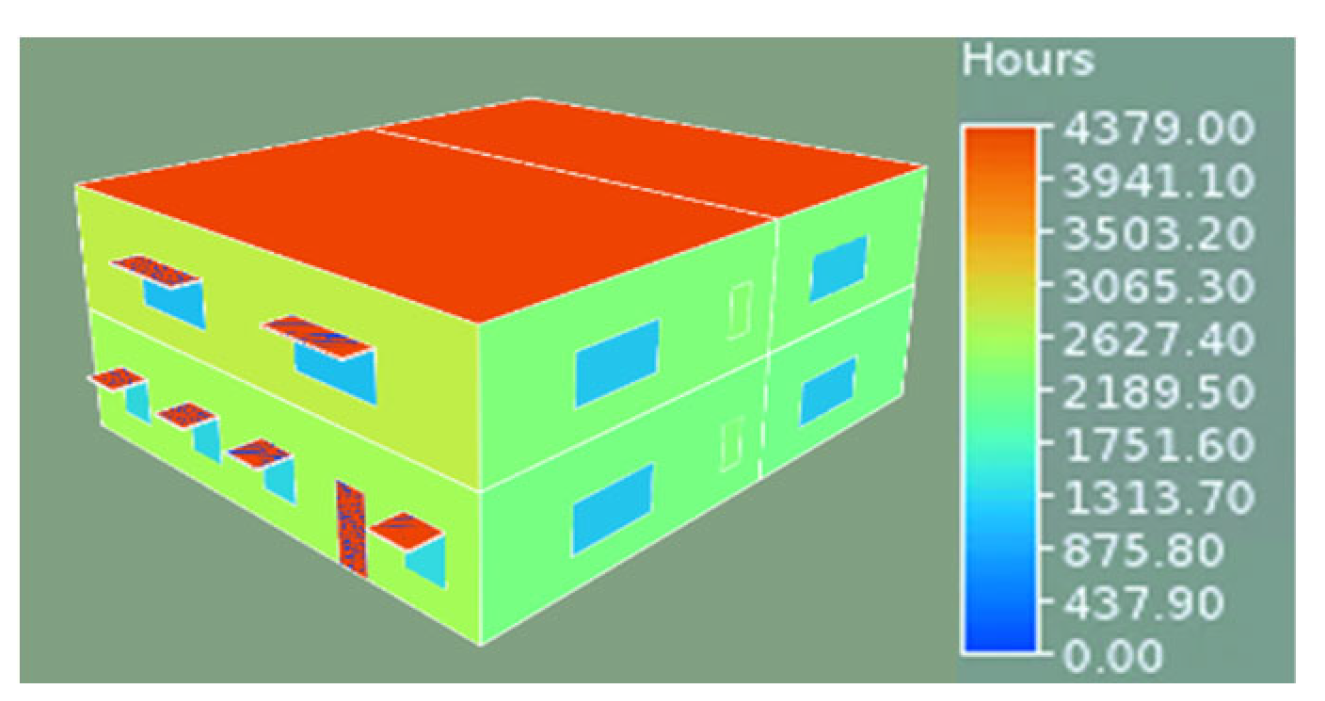
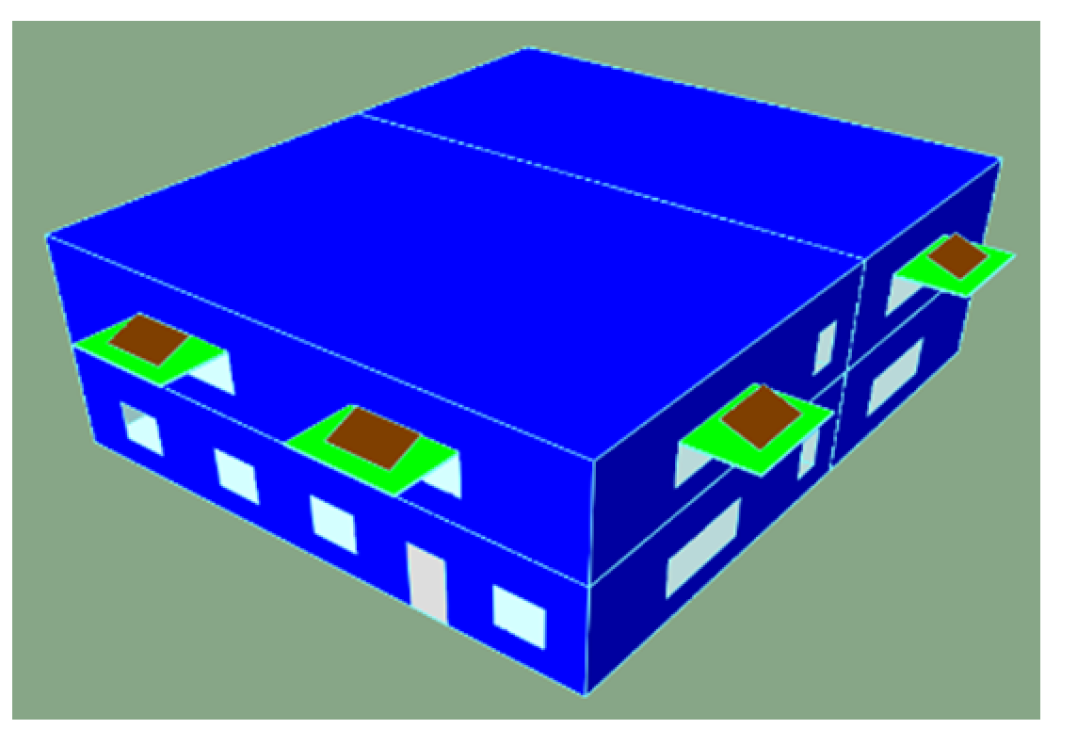
| 15 m × 17.5 m | 2 | 7 m | 525 m2 | 455 m2 | 13% | 6 occupants | Check Figure 4 |
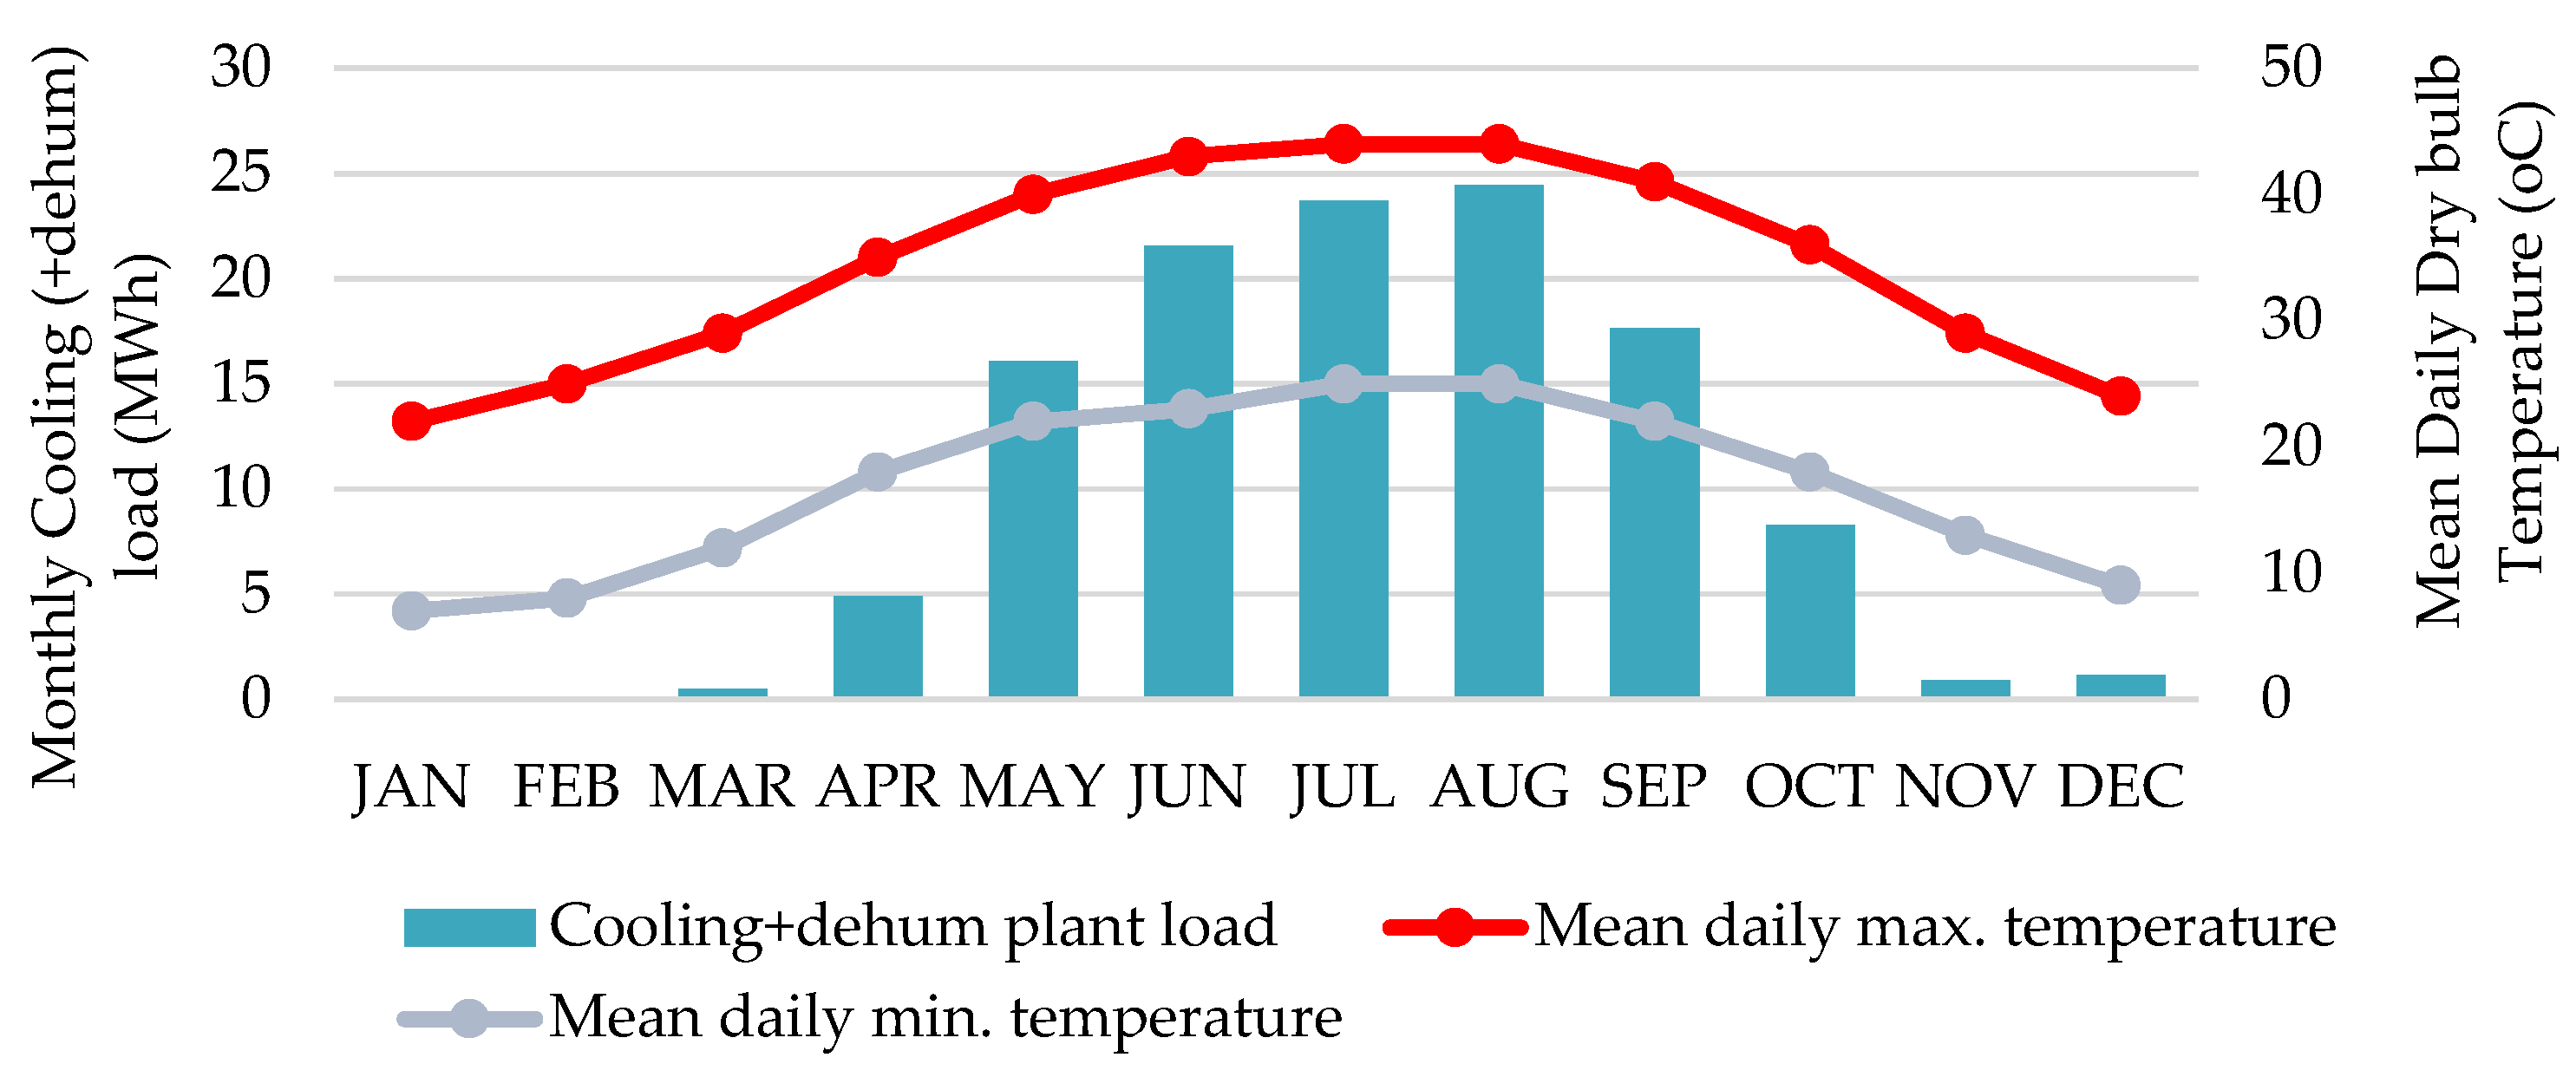
| Lighting Power | Equipment Power | Domestic Hot Water Requirement | Temperature Setpoint | HVAC System | Energy Efficiency Ratio (EER) | Typical Operation of Conditioning Plants |
|---|---|---|---|---|---|---|
| 4 W/m2 (~600 L×) | 3.5 W/m2 | 11.4 L/person/day | 22 °C (heating), 25 °C (cooling) | Split DX | 7.5 (low) | 24 h/day |
| Element & Composition | Thermal Performance | |
|---|---|---|
| Actual | SBC | |
| Walls (20 mm plaster-150 mm hollow concrete block-20 mm plaster) | U-value: 0.5450 W/m2K | U-value: 0.340 W/m2K |
| Roof (10 mm built-up roofing-200 mm concrete roof slab-13 mm plaster) | U-value: 0.5821 W/m2K | U-value: 0.202 W/m2K |
| Glazing (clear single pane, wooden frame) | U-value: 3.8701 W/m2K | U-value: 2.670 W/m2K |
| SHGC: 0.5470 | SHGC: 0.25 | |
| Floor (ceramic tiles-100 mm concrete slab on grade) | U-value: 0.6085 W/m2K | U-value: 0.900 W/m2K |
| Door (oakwood) | U-value: 1.3783 W/m2K | U-value: 2.840 W/m2K |
| CODE | VARIANTS | SPECIFICATIONS | JUSTIFICATION |
|---|---|---|---|
| W1 | External insulation | Add a 100 mm-thick polyurethane board to all the exterior sides of the walls. | These variants are investigating whether the cool wall model and higher building envelope airtightness can reduce or eliminate the reliance on wall insulation. |
| W2 | Internal insulation + reflective coating | Add a 50 mm-thick insulation board to all the interior sides of walls and paint a coating with an albedo of 0.6 (from an assumed 0.4 for baseline). | |
| W3 | Airtight envelope + reflective coating | Impact of lowering infiltration down to 0.5 ach and a reflective coating of 0.6. | |
| R1 | Reflective roof | A roof coating with an albedo of 0.6. | The presented roof strategies were selected as they were reported less frequently, especially in local literature. |
| R2 * | Flying roof | Placing a 40 mm thin concrete shading south- facing platform at a 15° tilt to cover 50% of the flat roof area. | |
| R3 * | Green roof | See Section 3.2.6 for specifications. | |
| R4 | Shaded roof | Measures the shading effect of rooftop PV integration (M1) on solar gains. | |
| F1 | Double-glazing system | Increasing the glazing thickness by using two panes with reflective low-E surfaces and an argon-filled cavity. | Comparing the individual potential of reflective surfaces, glazing thickness, and external shading devices to derive the case’s optimum solution. |
| F2 | Triple-glazing | Uses three clear panes and an air cavity. | |
| F3 * | F1 + Overhang | Test 1 m overhang projections with the double-glazing system from F1. | |
| L1 * | Green courtyard | Change surrounding surfaces from hard concrete to a green surface. | These were proposed to investigate the influence of surface materials properties on cooling load reduction |
| L2 * | Green shading | Cover F3 with a green surface. | |
| M1 * | Rooftop PV system | PV south-facing array that covers 15–45% of the accessible roof surface area. | The balance between its roof shading impact and generation potential was studied. |
| M2 * | PV shading device | F3 + PV panels integrated on top of the shading device’s surface (tilted and flat). | Very few reports were found on the potential of other PV solutions besides rooftop systems in local literature. |
| M3 * | PV windows | Semi-transparent PV cells integrated as part of the south-facing windows. |
| Window Type | 1 | 2 | 3 |
|---|---|---|---|
| Dimensions | 2.75 m × 1.25 m | 1.25 m × 1.25 m | 0.75 m × 1.25 m |
| Orientation | West (270°)/East (90°)/South (180°) | South (180°) | East (90°)/West (180°) |
| Target shading period (peak conditions) | West: Equinox (21 Mar/Sep), afternoon | ||
| East: Equinox (21 Mar/Sep), morning | |||
| South: Summer solstice (21 Jun), midday | |||
| F1 | F2 | F3 | ||||
|---|---|---|---|---|---|---|
| Gf | f1 | Gf | f1 | Gf | f1 | |
| 0.34 | 0.34 | 0.78 | 0.78 | 0.34 | 0.34 | |
| 41.88 | 29.38 | 41.88 | 29.38 | 41.88 | 29.38 | |
| 90 | 90 | 90 | 90 | 51.34 | 51.34 | |
| 0.32 | 0.32 | 0.07 | 0.07 | 0.32 | 0.32 | |
| Element | Technical Specifications |
|---|---|
| Vegetation cover | Shrubs at 0.1 m high; Surface solar absorptance of 0.7; Green colour reflectivity of 0.29; Has an R-value of 1.610 m2K/W |
| Growing medium | A 200 mm thick layer; Has moisture content of 40% and thermal conductivity of 1.580 W/m·K; A minimum 3 inch (76.2 mm) layer to avoid root damage; Vegetation and the soil layer were modelled as a one |
| Filter | Assumed to be 30 mm thin; Often plastic and modular |
| Insulation (Variant R3(a)) | A 50 mm polystyrene layer; Conflicting views were found regarding its necessity. Supporting argument states that it acts as an additional protective barrier against condensation and physical damage |
| Waterproofing | 10 mm thin; Thermal conductivity of 0.033 W/m·K |
| Roof deck | The existing roof specification were kept constant |
| Parameter | Criteria | Selection |
|---|---|---|
| Model | − | G Solar (GSM310) |
| Size | − | 0.992 m 1.640 m |
| Cell technology | Maximum power output (module efficiency, ) | Mono-Si310 ; 19.05%, (@STC *) |
| Electrical parameters | IV performance | 33.25 V, 9.33 A 40.63 V, 9.85 A** |
| Operating environment | Efficiency temperature coefficient () | −0.393 (@NOCT ***) |
| Reputation & warranty | Long 25-year life and low power degradation rate | Manufactured and designed by G solar. |
| Parameter | Inverter Model | Inverter Efficiency | Warranty | ||
|---|---|---|---|---|---|
| Description | Single-phase Eversol TL2000 | 97% | 15 years | 11 A | 90–450 V |
| FOR 640 mm × 1240 mm PANEL | ||||
|---|---|---|---|---|
| GLAZING PARAMETERS | ||||
| Layer | STPV layer | Air gap | Clear pane | |
| Thickness | 4 mm | 9 mm | 5 mm | |
| Solar transmittance at normal incidence | 0.224 | − | 0.811 | |
| Visible transmittance at normal incidence | 0.225 | − | 0.887 | |
| Thermal conductivity | 0.0415 | − | 0.0133 | |
| SEMI-TRANSPARENT PV WINDOW (STPV) SYSTEM PARAMETERS | ||||
| 13% | 6.986 A | 85.6 V | 6.221 A | 68.3 V |
| ELEMENT | CONDUCTION GAINS | Differences (Reference to Baseline) | |
|---|---|---|---|
| Baseline (MWh) | Upgrade (MWh) | ||
| Roof | 8.85 | 5.33 | −40% |
| Exposed floor | 7.59 | 7.59 | − |
| External walls | 10.04 | 6.70 | −33% |
| Fenestration | 5.10 | 3.96 | −22% |
| Door | 0.14 | 0.14 | − |
| Code | F1/F3 | F2 |
|---|---|---|
| U-Value (W/m2K) | 2.651 | 1.876 |
| SHGC (-) | 1.185 | 0.618 |
| Thickness (mm) | 24 mm (pane: 6 mm × 2/cavity: 12 mm) | 42 m (pane: 6 mm × 3/cavities: 12 mm × 2) |
| F1 | F2 | F3 | ||||
|---|---|---|---|---|---|---|
| Gf | f1 | Gf | f1 | Gf | f1 | |
| 2.18% | 1.53% | 4.50% | 3.16% | 1.24% | 0.87% | |
| Target Element (Code) | Reviewed Description | Percentage Reduction |
|---|---|---|
| External walls (W3) | Envelope airtightness of 0.5 ach and reflective wall coating with an albedo 0.6. | −6.1% |
| Fenestration (F1) | Double-glazing system with reflective low-E surface and an argon-filled cavity. | −9.9% |
| Roof (R1) | Reflective roof coating with an albedo of 0.6. | −3.2% |
| Microgeneration (M1) | South-facing rooftop PV array that covers 30% of the accessible roof area. | −14.4% |
| Landscaping (L1) | Green courtyard with three wide-canopied tall trees covering the Western wall and a collection of shrubs surrounding the North-western side. | −0.5% |
Publisher’s Note: MDPI stays neutral with regard to jurisdictional claims in published maps and institutional affiliations. |
© 2021 by the authors. Licensee MDPI, Basel, Switzerland. This article is an open access article distributed under the terms and conditions of the Creative Commons Attribution (CC BY) license (https://creativecommons.org/licenses/by/4.0/).
Share and Cite
Aldabesh, A.; Soufi, J.; Omer, S.; Haredy, A. Unlocking the Residential Retrofitting Potential in a Three-Degree World: A Holistic Approach to Passive Design in Hot Climates. Buildings 2021, 11, 228. https://doi.org/10.3390/buildings11060228
Aldabesh A, Soufi J, Omer S, Haredy A. Unlocking the Residential Retrofitting Potential in a Three-Degree World: A Holistic Approach to Passive Design in Hot Climates. Buildings. 2021; 11(6):228. https://doi.org/10.3390/buildings11060228
Chicago/Turabian StyleAldabesh, Abdulmajeed, Jassmen Soufi, Siddig Omer, and Abdullah Haredy. 2021. "Unlocking the Residential Retrofitting Potential in a Three-Degree World: A Holistic Approach to Passive Design in Hot Climates" Buildings 11, no. 6: 228. https://doi.org/10.3390/buildings11060228